Cambridge IGCSE Sciences - Co-ordinated (Double) 0654 — 2022 Oct/Nov Paper 6 · Variant 3
0654/63/O/N/22 · 6 questions · 60 marks · ≈68 min
The question paper and its mark scheme, free to read here and free to download. This is Cambridge’s own paper, exactly as it was sat.
Question paper20 pages




Mark scheme9 pages
Answers below. Sit the paper first if you are practising.
Questions as text
Q1 · A student investigates the nutrient content of beans and carrots
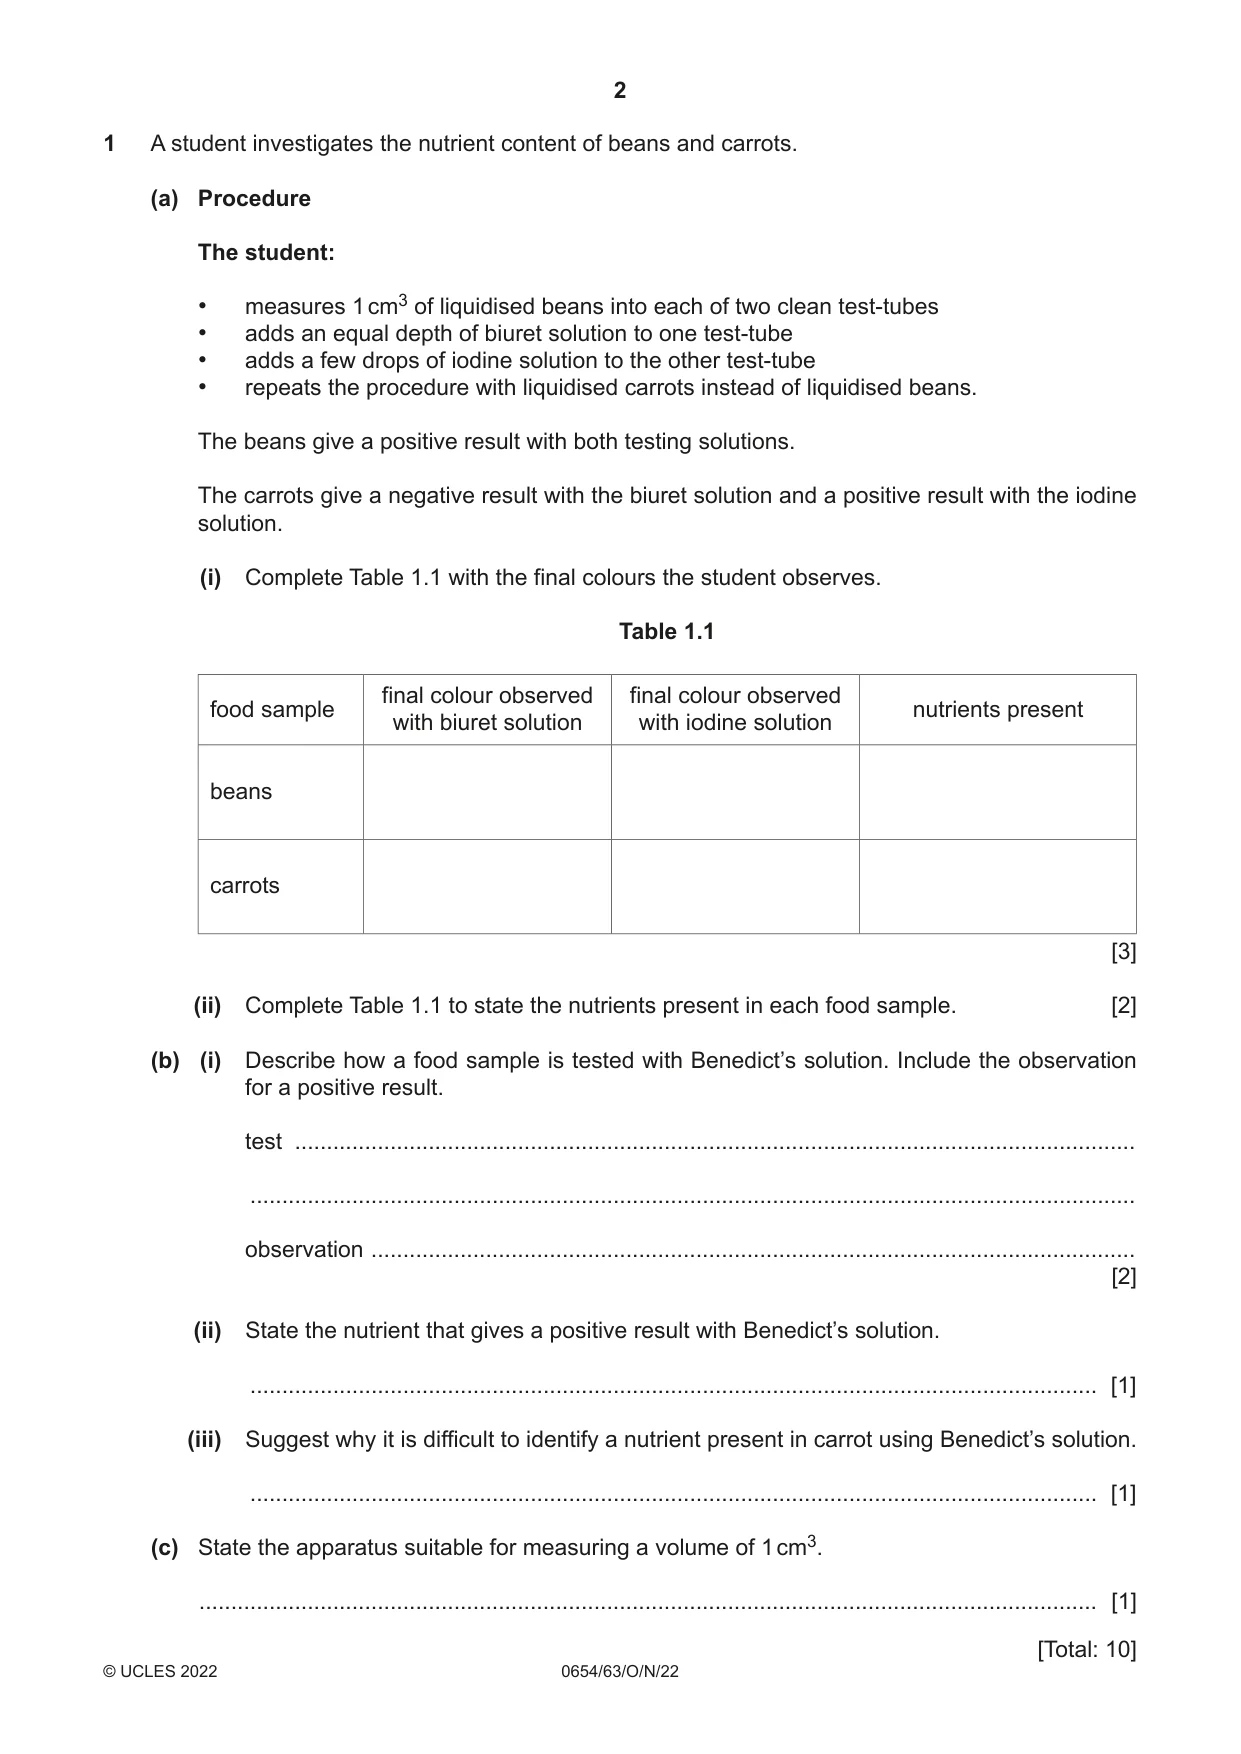
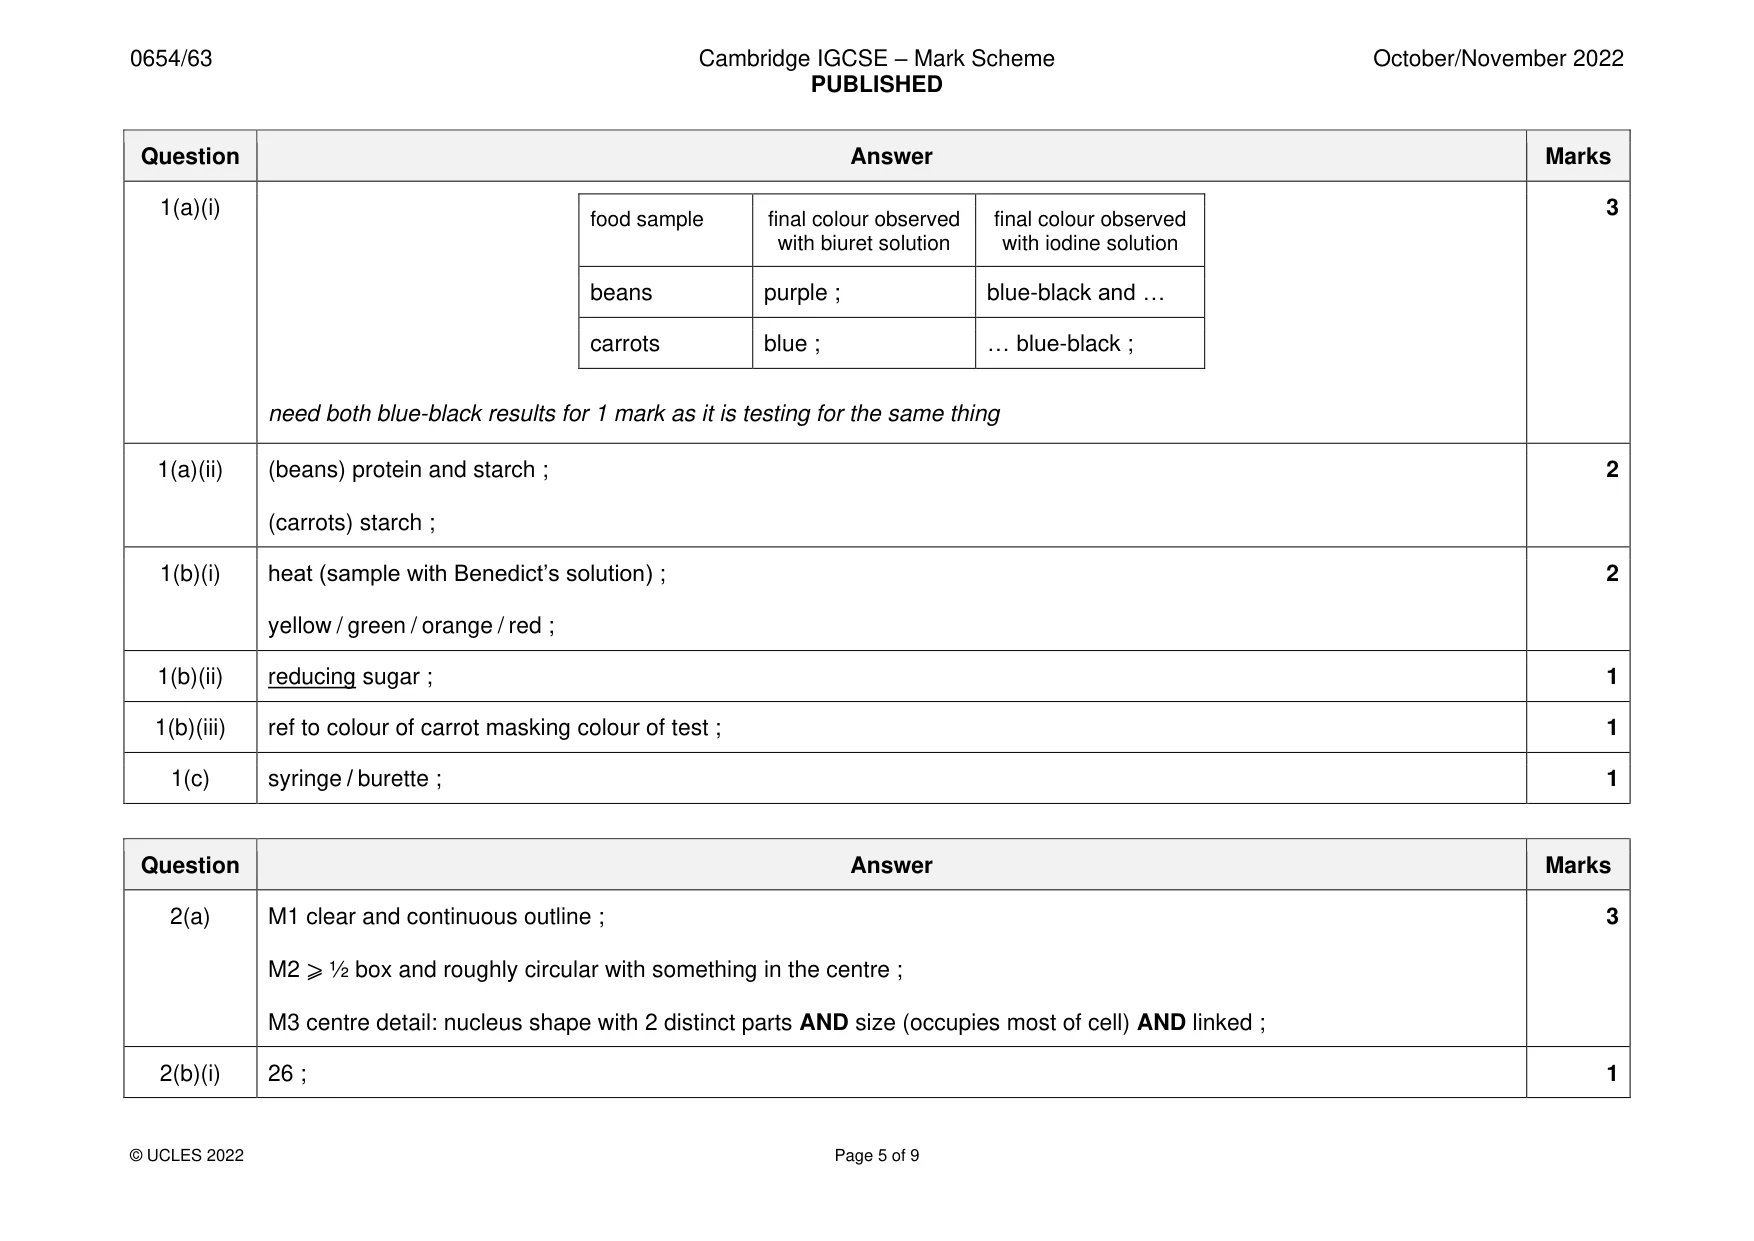
1 A student investigates the nutrient content of beans and carrots. (a) Procedure The student: • measures 1 cm3 of liquidised beans into each of two clean test-tubes • adds an equal depth of biuret solution to one test-tube • adds a few drops of iodine solution to the other test-tube • repeats the procedure with liquidised carrots instead of liquidised beans. The beans give a positive result with both testing solutions. The carrots give a negative result with the biuret solution and a positive result with the iodine solution. (i) Complete Table 1.1 with the final colours the student observes. Table 1.1 final colour observed final colour observed food sample nutrients present with biuret solution with iodine solution beans carrots [3] (ii) Complete Table 1.1 to state the nutrients present in each food sample. [2] (b) (i) Describe how a food sample is tested with Benedict’s solution. Include the observation for a positive result. test .................................................................................................................................... ........................................................................................................................................... observation ........................................................................................................................ [2] (ii) State the nutrient that gives a positive result with Benedict’s solution. ..................................................................................................................................... [1] (iii) Suggest why it is difficult to identify a nutrient present in carrot using Benedict’s solution. ..................................................................................................................................... [1] (c) State the apparatus suitable for measuring a volume of 1 cm3. ............................................................................................................................................. [1]
Mark scheme: Question Answer Marks 1(a)(i) 3 food sample final colour observed final colour observed with biuret solution with iodine solution beans purple ; blue-black and … carrots blue ; … blue-black ; need both blue-black results for 1 mark as it is testing for the same thing 1(a)(ii) (beans) protein and starch ; 2 (carrots) starch ; 1(b)(i) heat (sample with Benedict’s solution) ; 2 yellow / green / orange / red ; 1(b)(ii) reducing sugar ; 1 1(b)(iii) ref to colour of carrot masking colour of test ; 1 1(c) syringe / burette ; 1
Q2 · A photomicrograph of some blood cells
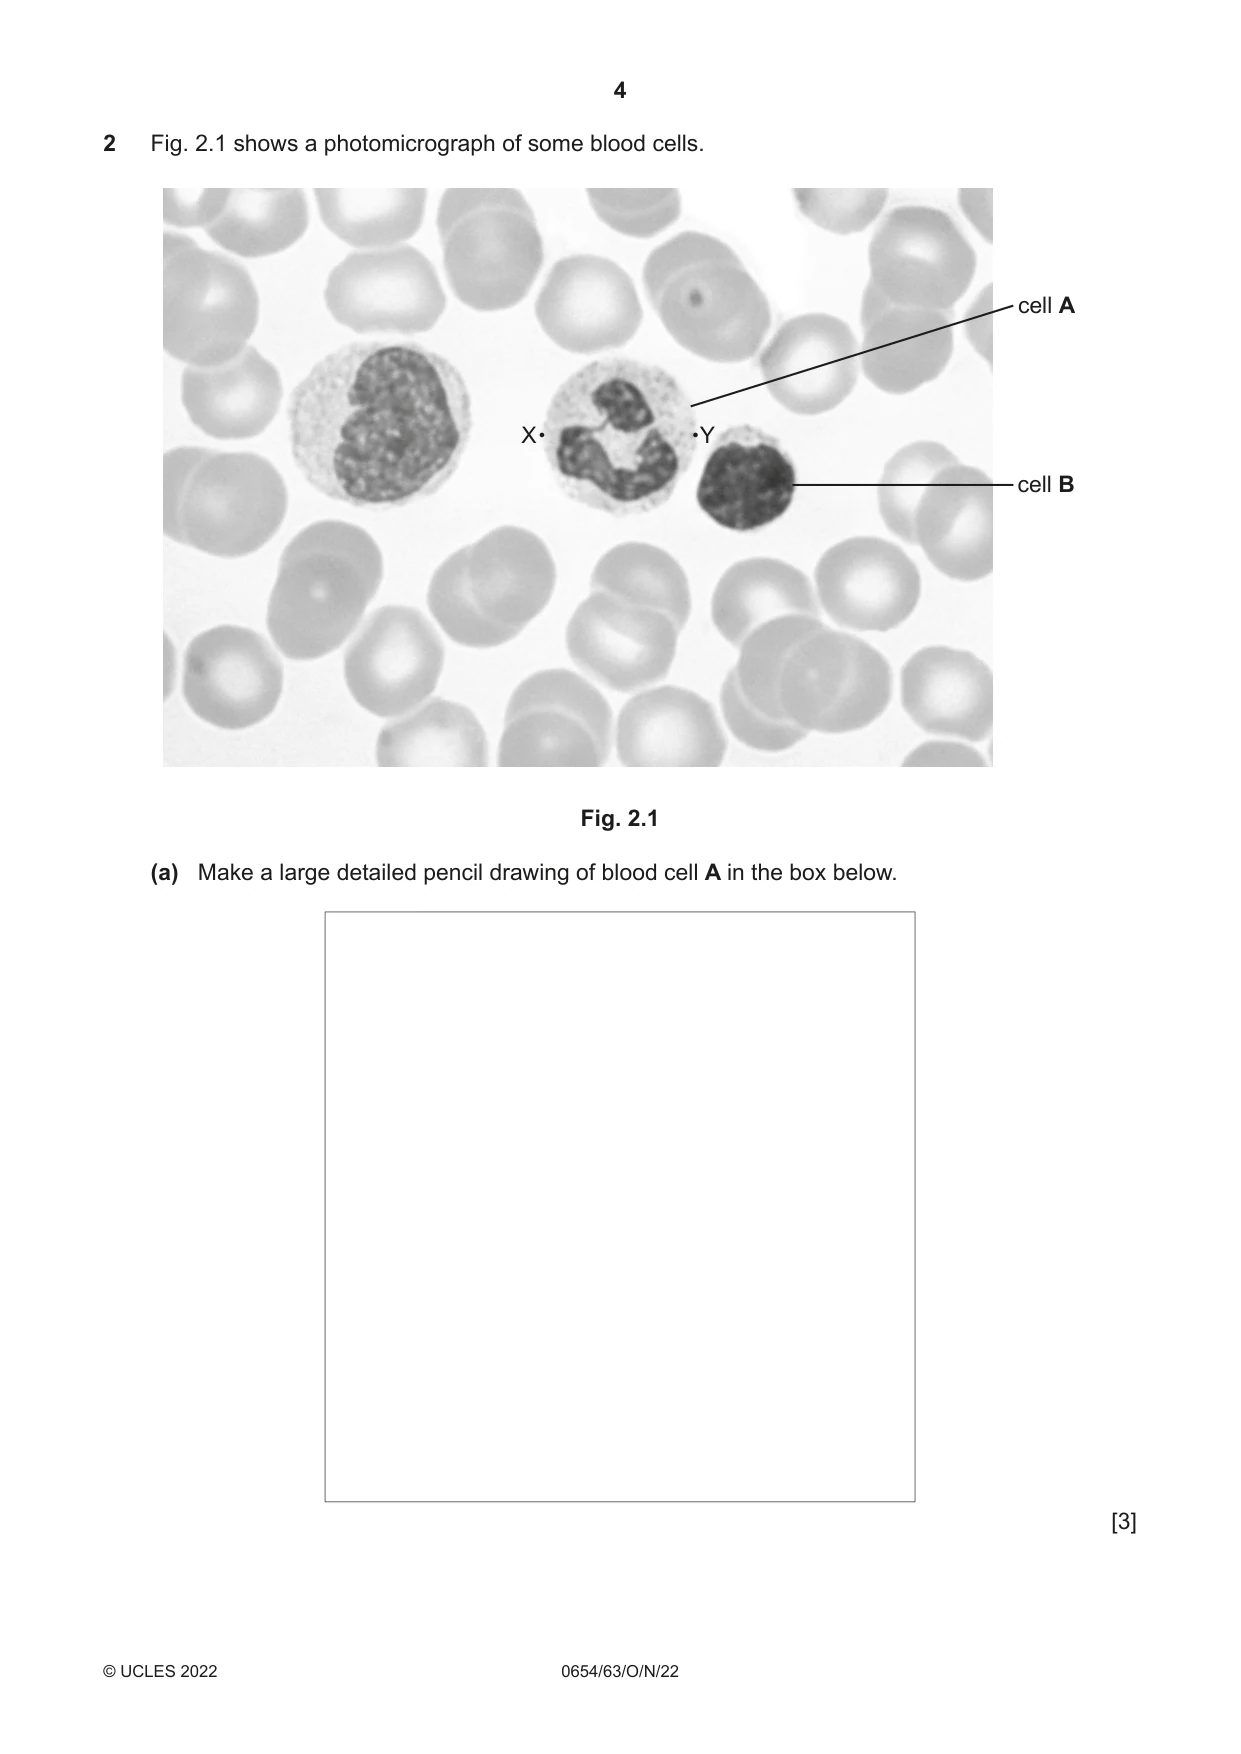
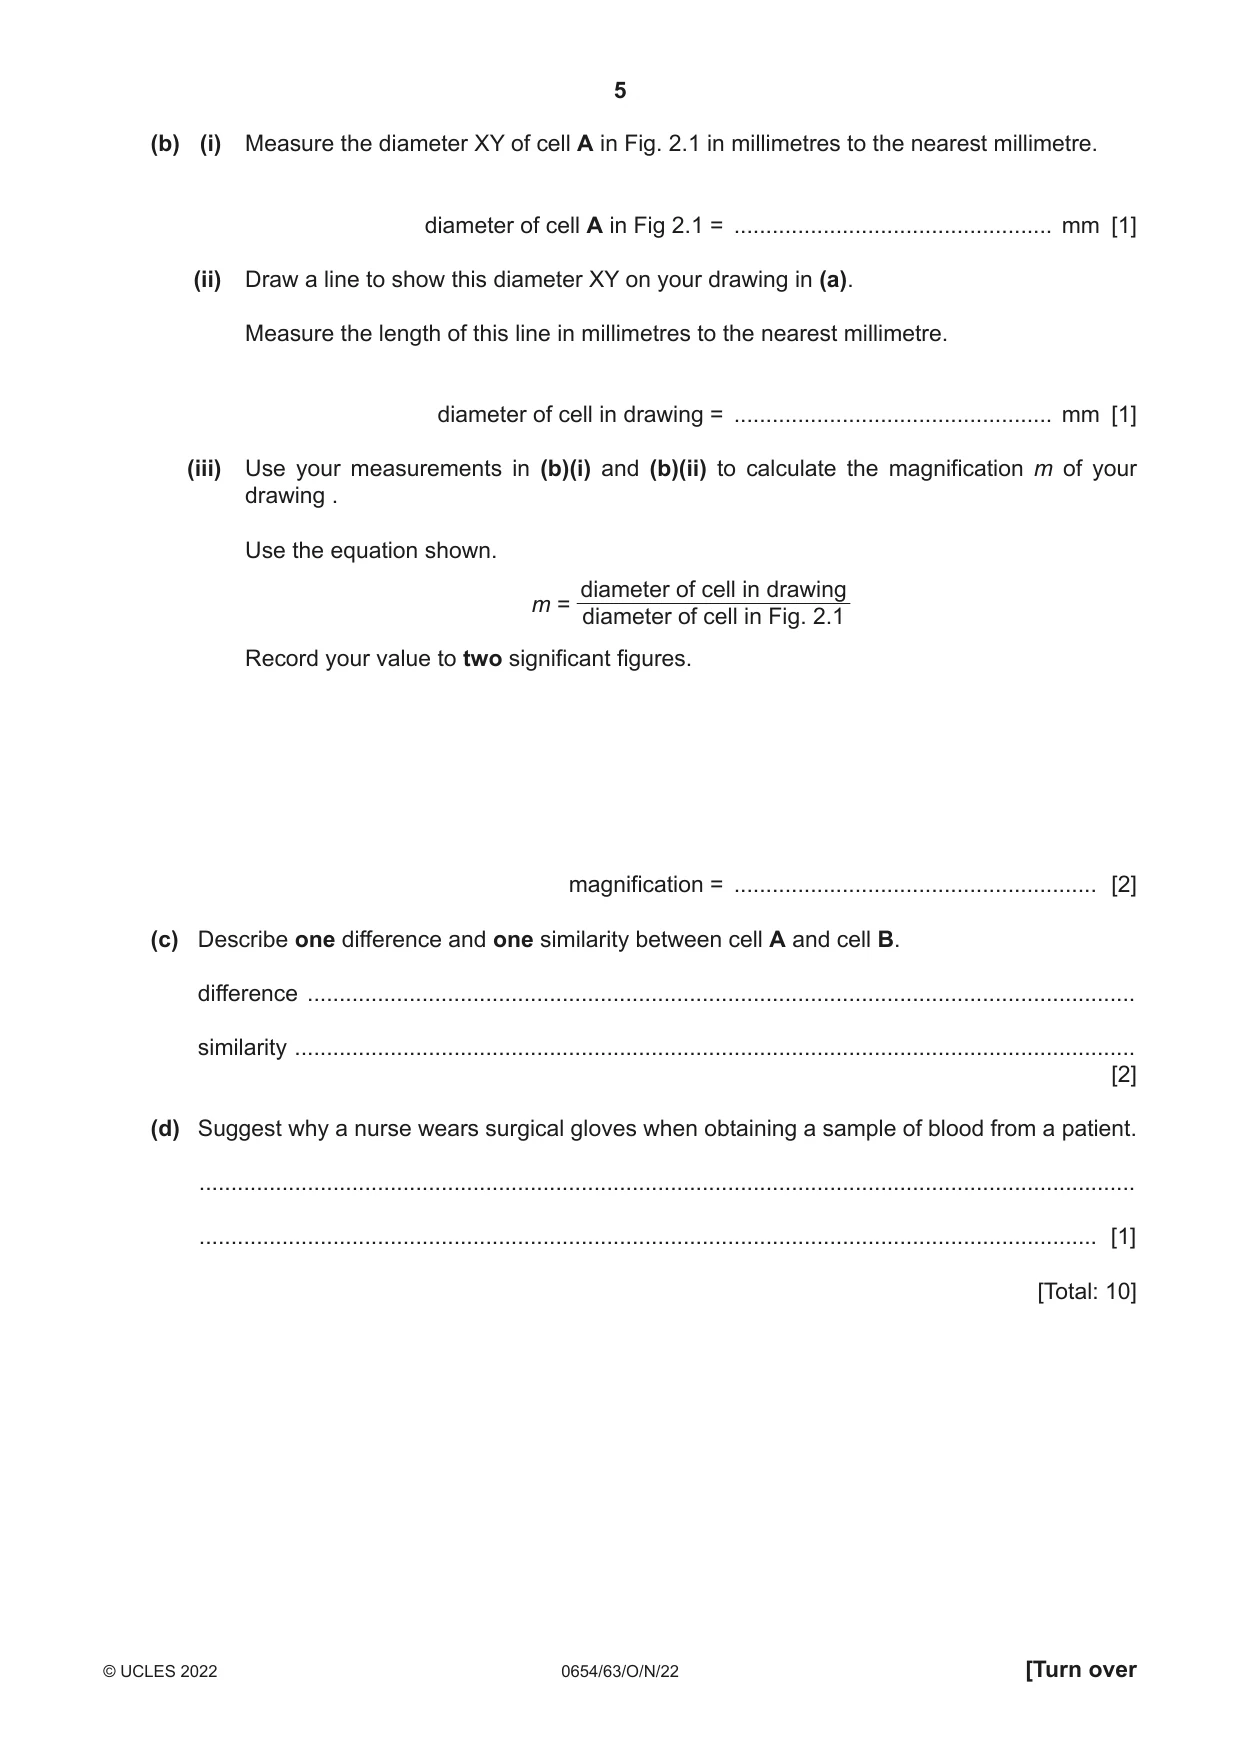
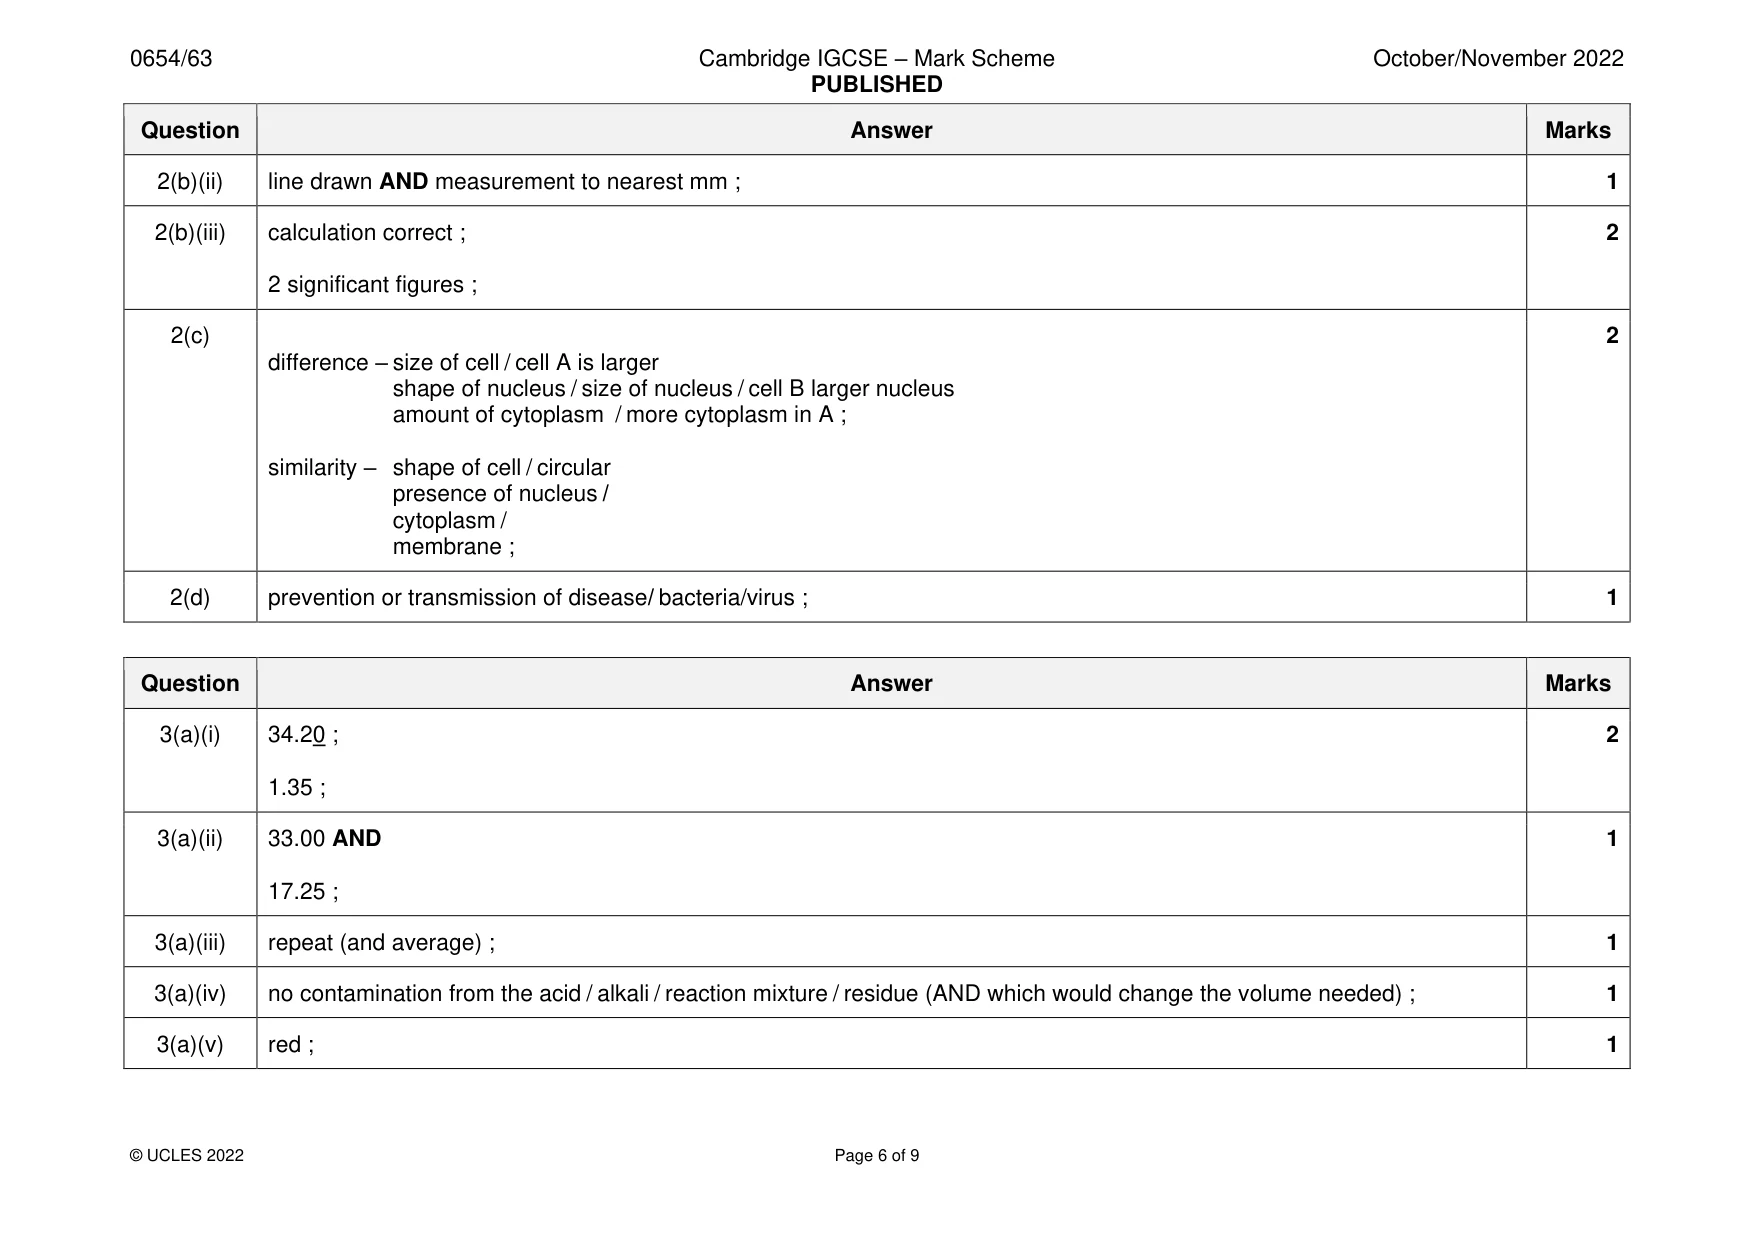
2 Fig. 2.1 shows a photomicrograph of some blood cells. cell A X Y cell B Fig. 2.1 (a) Make a large detailed pencil drawing of blood cell A in the box below. [3] (b) (i) Measure the diameter XY of cell A in Fig. 2.1 in millimetres to the nearest millimetre. diameter of cell A in Fig 2.1 = .................................................. mm [1] (ii) Draw a line to show this diameter XY on your drawing in (a). Measure the length of this line in millimetres to the nearest millimetre. diameter of cell in drawing = .................................................. mm [1] (iii) Use your measurements in (b)(i) and (b)(ii) to calculate the magnification m of your drawing . Use the equation shown. diameter of cell in drawing m = diameter of cell in Fig. 2.1 Record your value to two significant figures. magnification = ......................................................... [2] (c) Describe one difference and one similarity between cell A and cell B. difference .................................................................................................................................. similarity .................................................................................................................................... [2] (d) Suggest why a nurse wears surgical gloves when obtaining a sample of blood from a patient. ................................................................................................................................................... ............................................................................................................................................. [1] [Total: 10]
Mark scheme: 2(a) M1 clear and continuous outline ; 3 M2 ⩾ ½ box and roughly circular with something in the centre ; M3 centre detail: nucleus shape with 2 distinct parts AND size (occupies most of cell) AND linked ; 2(b)(i) 26 ; 1 2(b)(ii) line drawn AND measurement to nearest mm ; 1 2(b)(iii) calculation correct ; 2 2 significant figures ; 2(c) 2 difference – size of cell / cell A is larger shape of nucleus / size of nucleus / cell B larger nucleus amount of cytoplasm / more cytoplasm in A ; similarity – shape of cell / circular presence of nucleus / cytoplasm / membrane ; 2(d) prevention or transmission of disease/ bacteria/virus ; 1
Q3 · A student investigates the reaction between dilute hydrochloric acid, HCl, and aqueous…
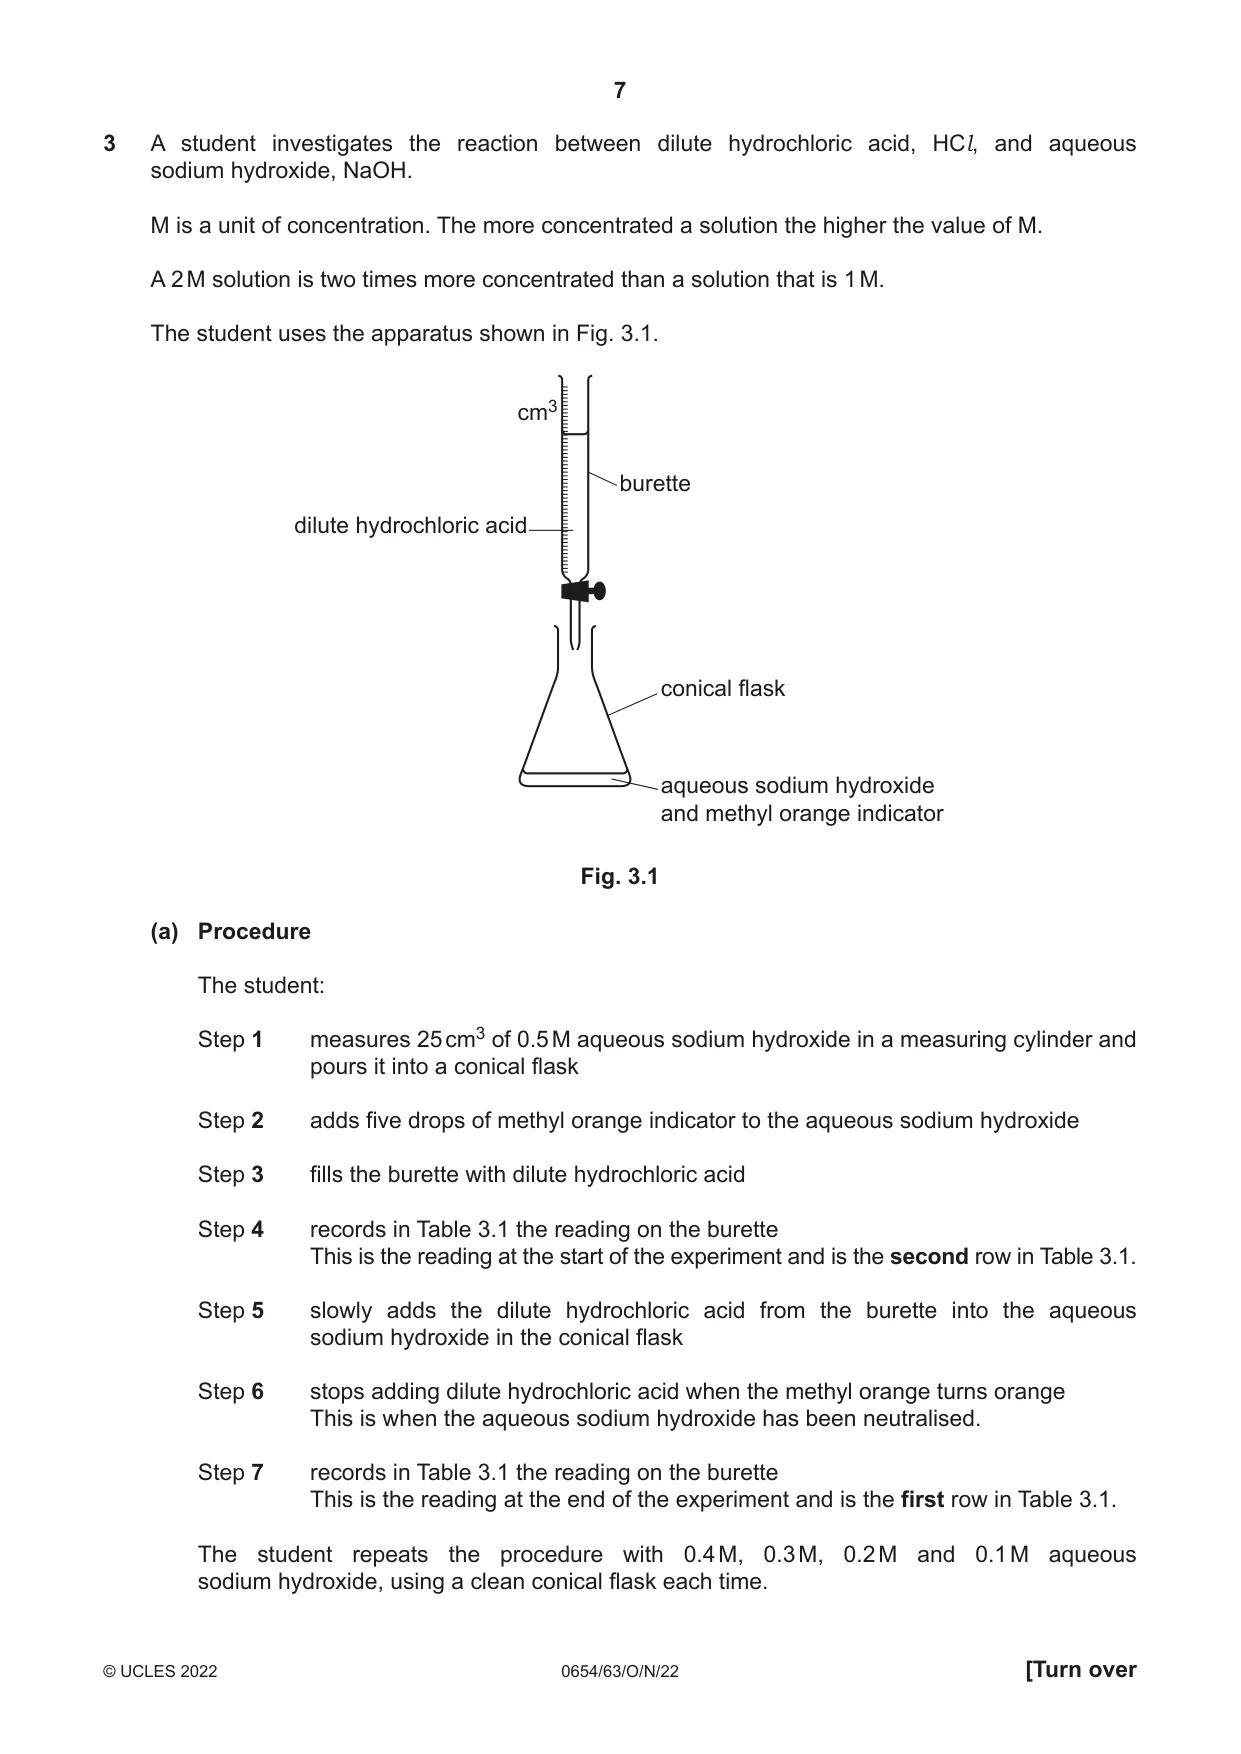
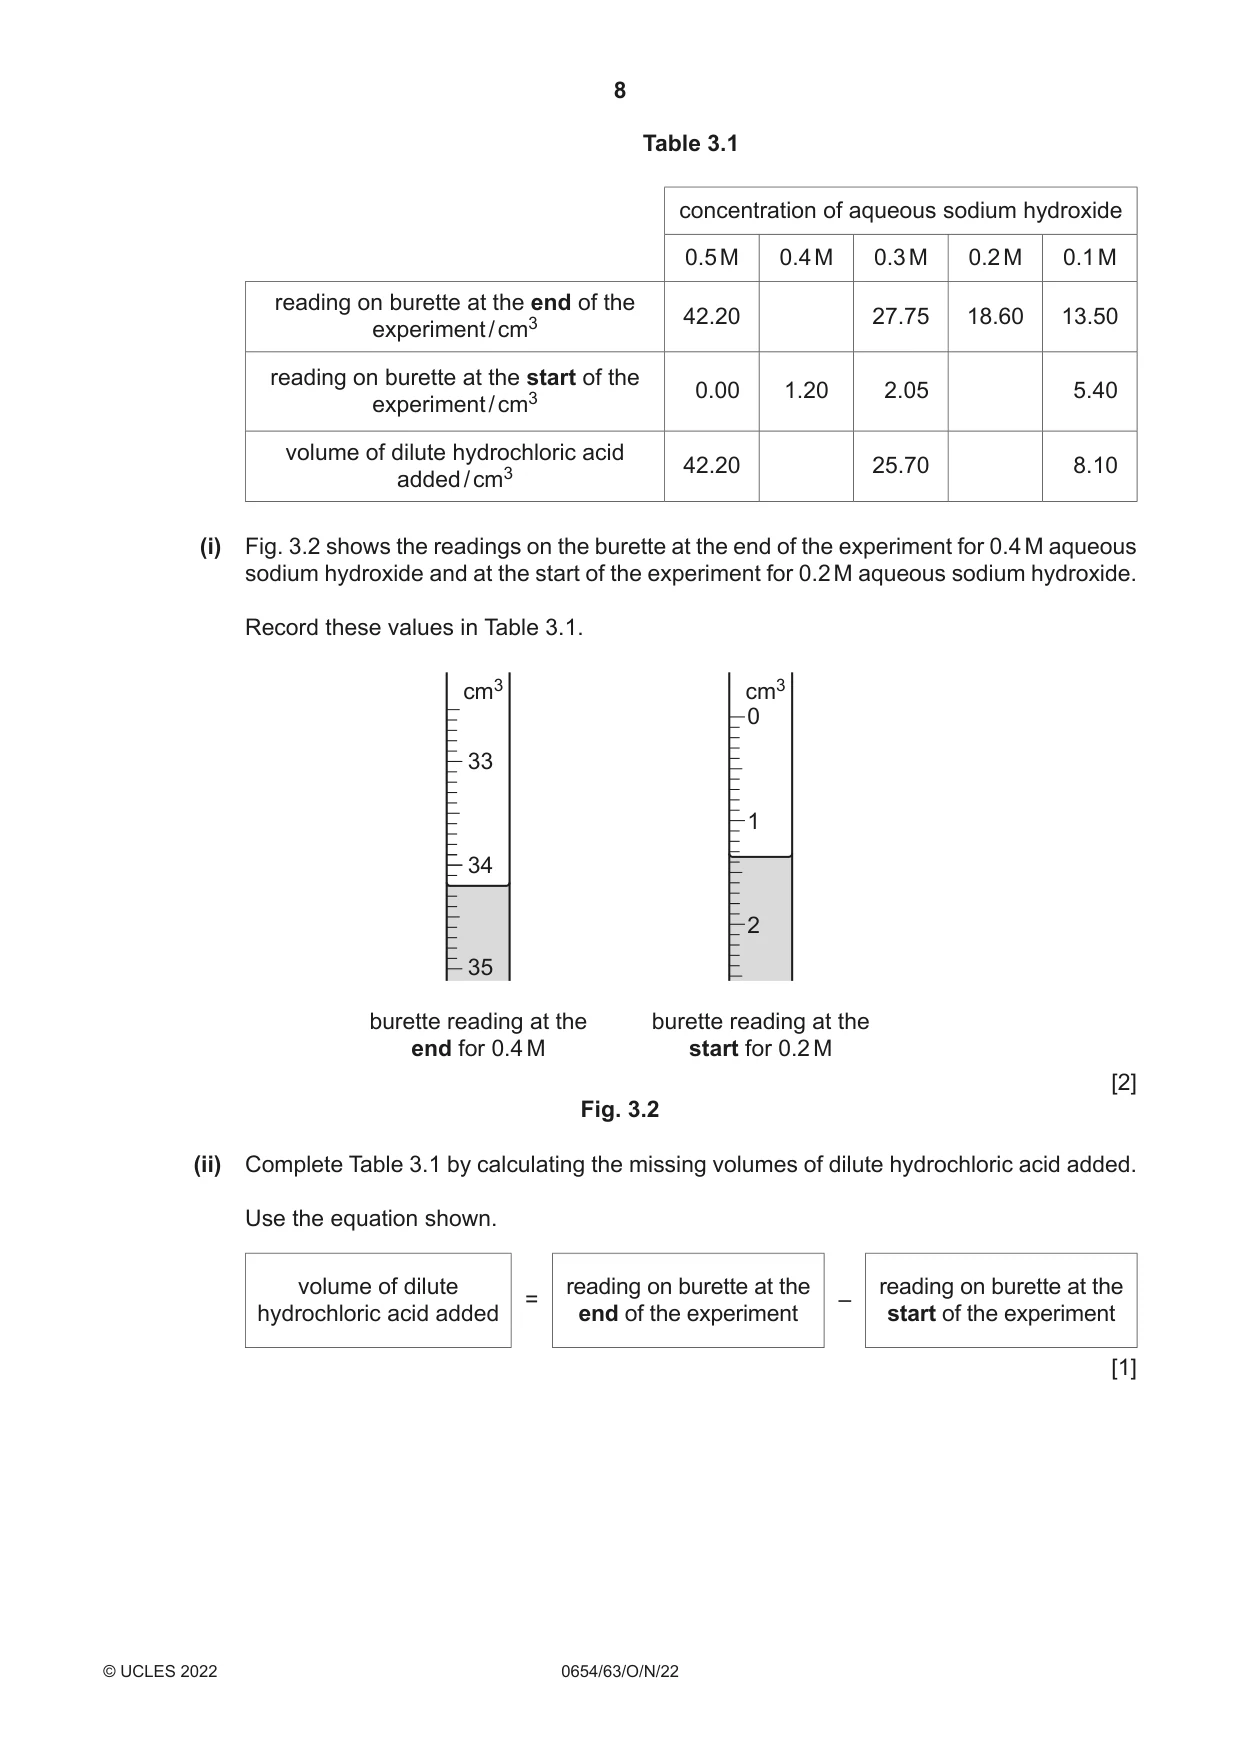
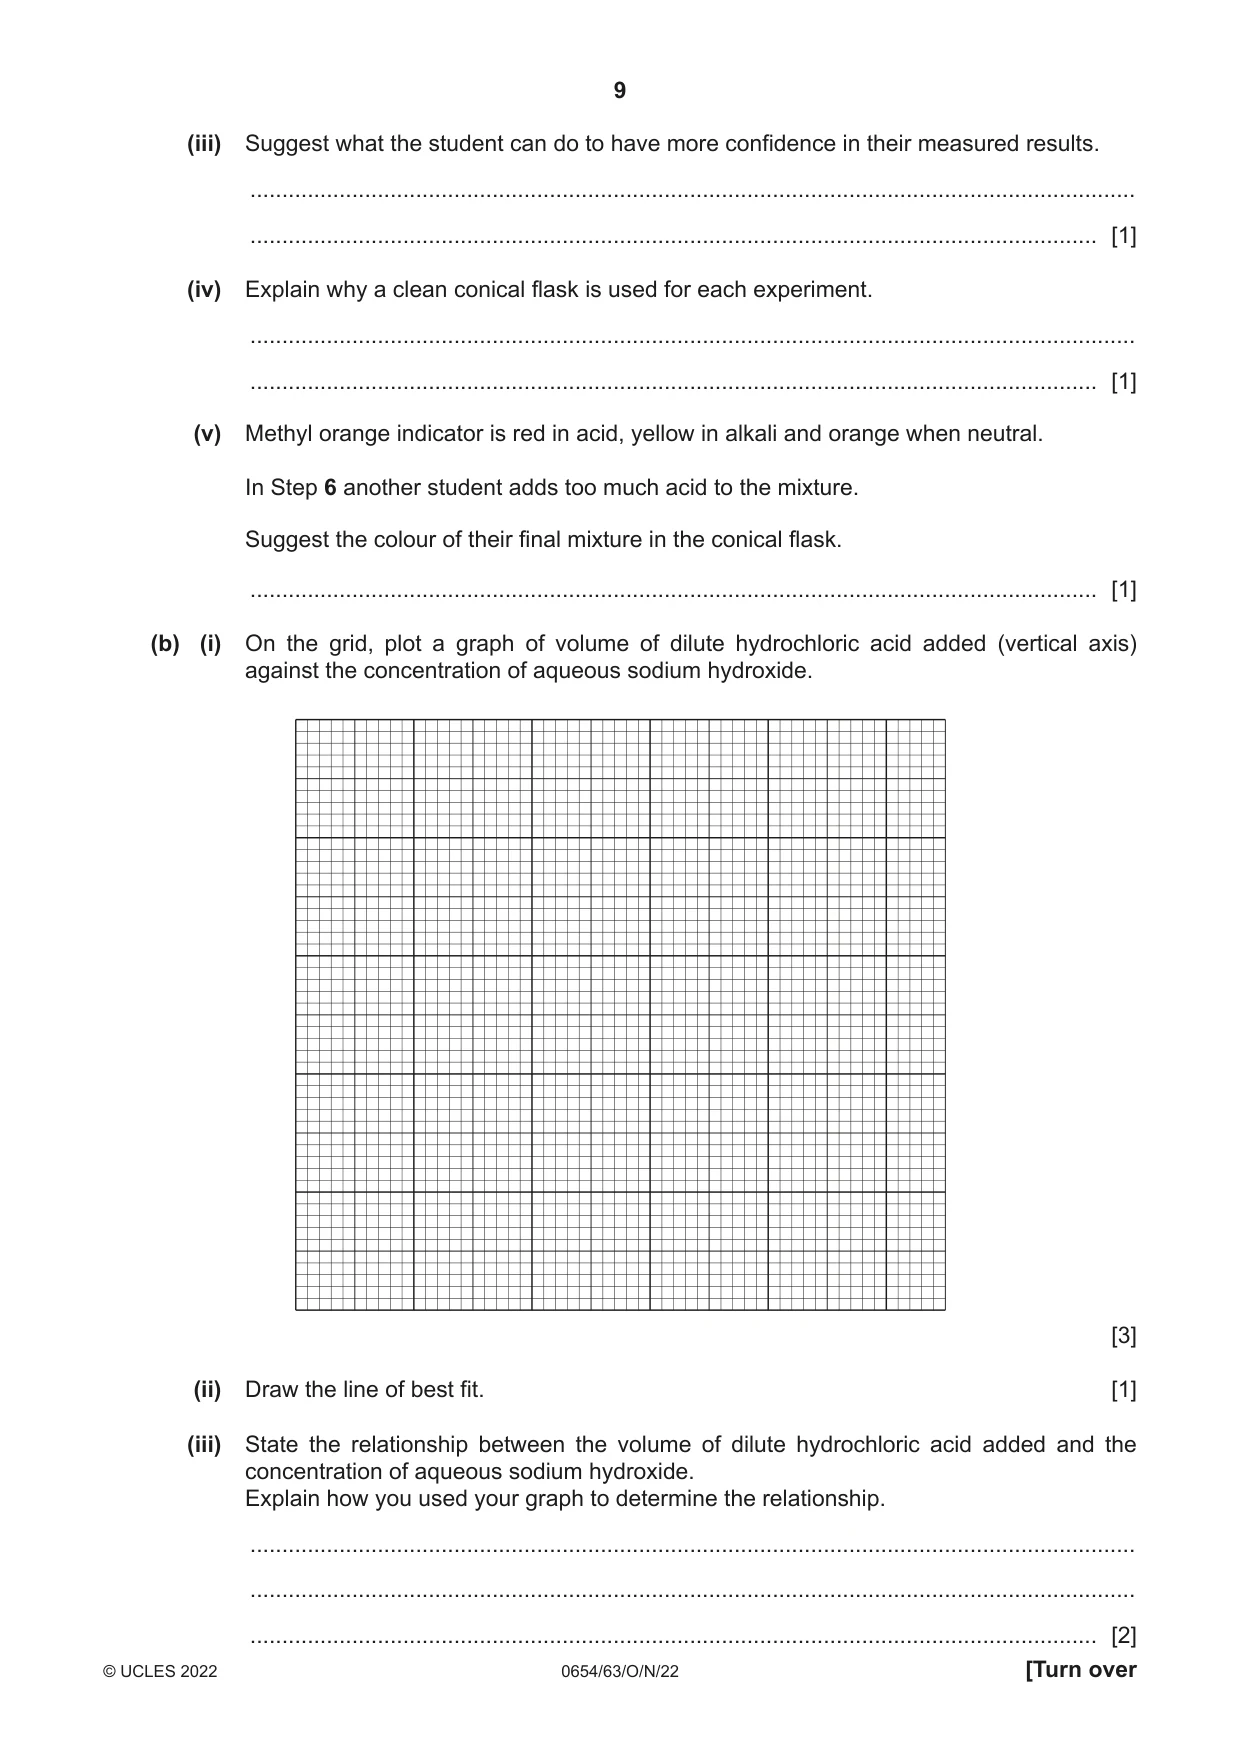
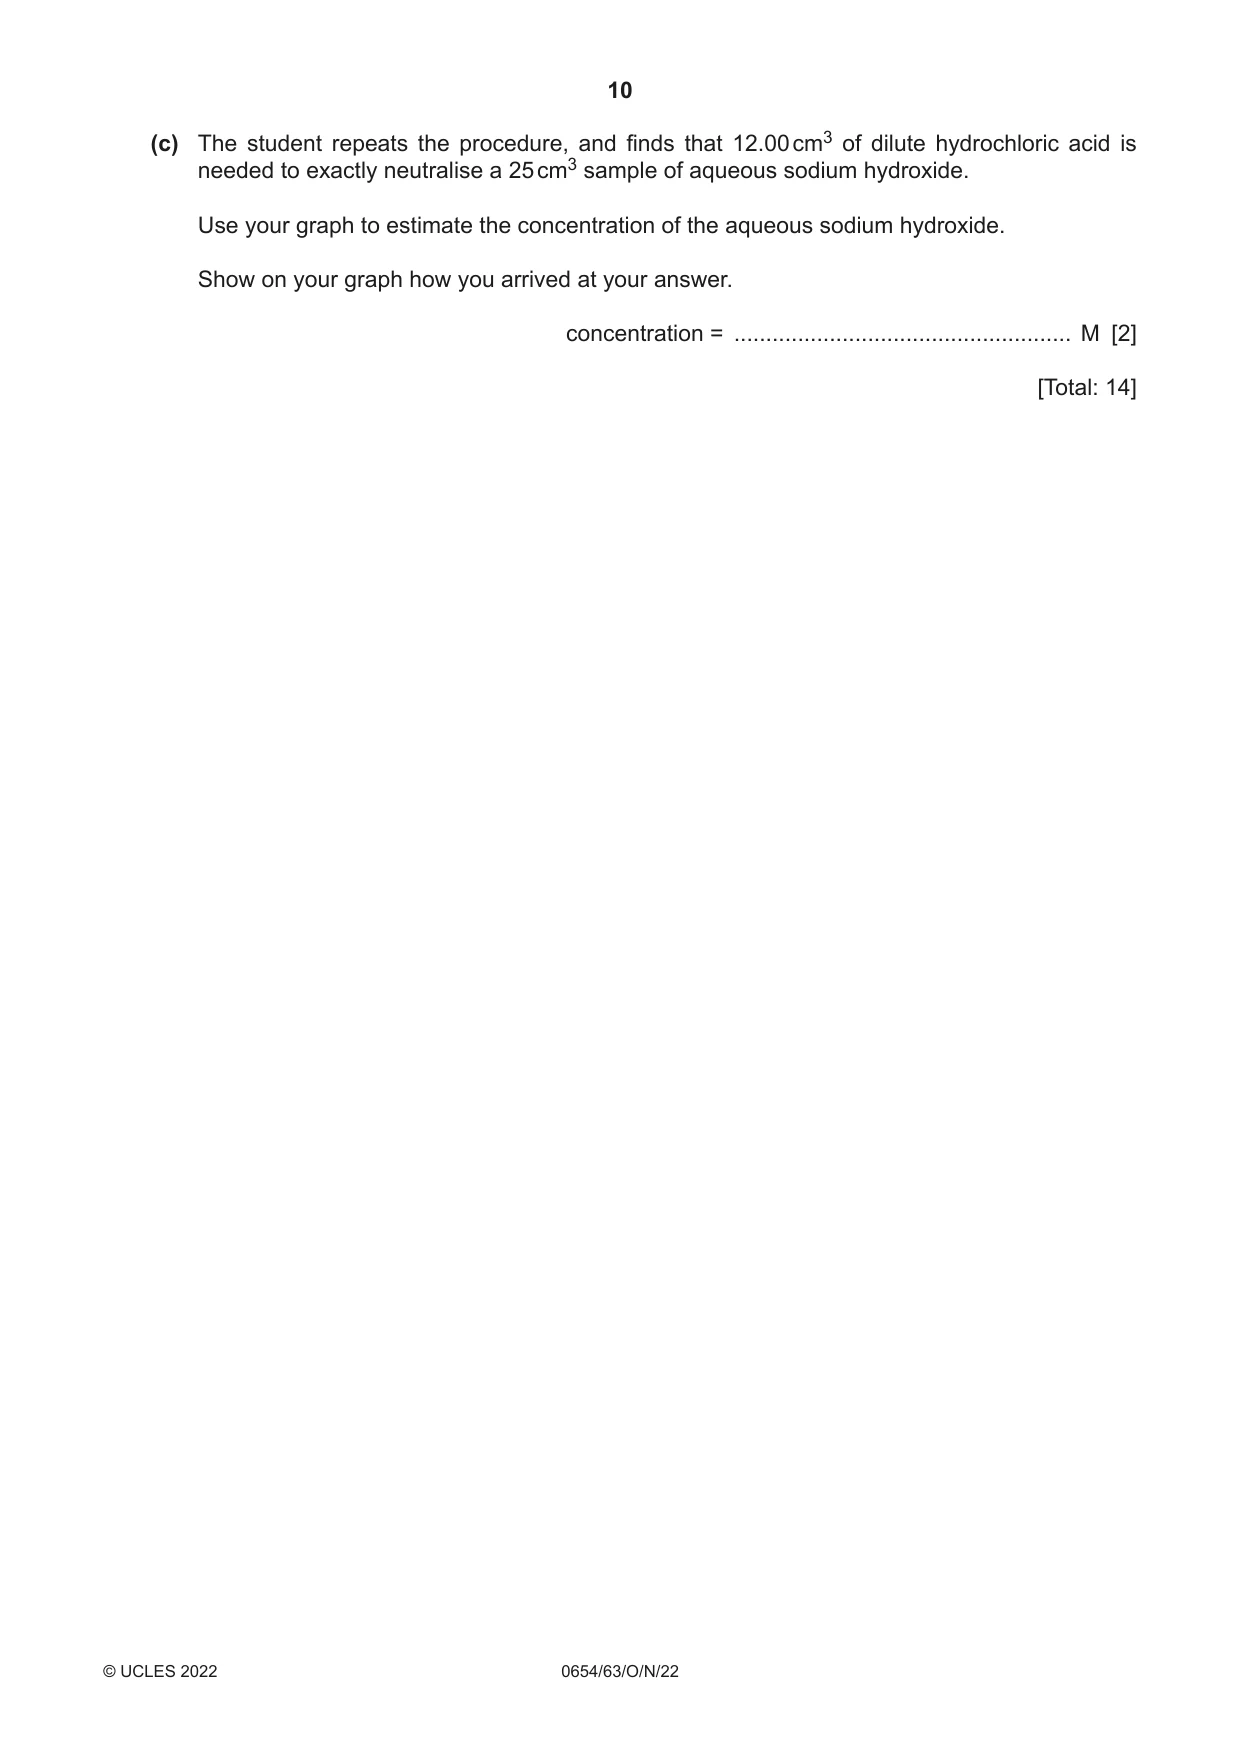
3 A student investigates the reaction between dilute hydrochloric acid, HCl, and aqueous sodium hydroxide, NaOH. M is a unit of concentration. The more concentrated a solution the higher the value of M. A 2 M solution is two times more concentrated than a solution that is 1 M. The student uses the apparatus shown in Fig. 3.1. cm3 burette dilute hydrochloric acid conical flask aqueous sodium hydroxide and methyl orange indicator Fig. 3.1 (a) Procedure The student: Step 1 measures 25 cm3 of 0.5 M aqueous sodium hydroxide in a measuring cylinder and pours it into a conical flask Step 2 adds five drops of methyl orange indicator to the aqueous sodium hydroxide Step 3 fills the burette with dilute hydrochloric acid Step 4 records in Table 3.1 the reading on the burette This is the reading at the start of the experiment and is the second row in Table 3.1. Step 5 slowly adds the dilute hydrochloric acid from the burette into the aqueous sodium hydroxide in the conical flask Step 6 stops adding dilute hydrochloric acid when the methyl orange turns orange This is when the aqueous sodium hydroxide has been neutralised. Step 7 records in Table 3.1 the reading on the burette This is the reading at the end of the experiment and is the first row in Table 3.1. The student repeats the procedure with 0.4 M, 0.3 M, 0.2 M and 0.1 M aqueous sodium hydroxide, using a clean conical flask each time. Table 3.1 concentration of aqueous sodium hydroxide 0.5 M 0.4 M 0.3 M 0.2 M 0.1 M reading on burette at the end of the 42.20 27.75 18.60 13.50 experiment / cm3 reading on burette at the start of the 0.00 1.20 2.05 5.40 experiment / cm3 volume of dilute hydrochloric acid 42.20 25.70 8.10 added / cm3 (i) Fig. 3.2 shows the readings on the burette at the end of the experiment for 0.4 M aqueous sodium hydroxide and at the start of the experiment for 0.2 M aqueous sodium hydroxide. Record these values in Table 3.1. cm3 cm3 0 33 1 34 2 35 burette reading at the burette reading at the end for 0.4 M start for 0.2 M [2] Fig. 3.2 (ii) Complete Table 3.1 by calculating the missing volumes of dilute hydrochloric acid added. Use the equation shown. volume of dilute reading on burette at the reading on burette at the = – hydrochloric acid added end of the experiment start of the experiment [1] (iii) Suggest what the student can do to have more confidence in their measured results. ........................................................................................................................................... ..................................................................................................................................... [1] (iv) Explain why a clean conical flask is used for each experiment. ........................................................................................................................................... ..................................................................................................................................... [1] (v) Methyl orange indicator is red in acid, yellow in alkali and orange when neutral. In Step 6 another student adds too much acid to the mixture. Suggest the colour of their final mixture in the conical flask. ..................................................................................................................................... [1] (b) (i) On the grid, plot a graph of volume of dilute hydrochloric acid added (vertical axis) against the concentration of aqueous sodium hydroxide. [3] (ii) Draw the line of best fit. [1] (iii) State the relationship between the volume of dilute hydrochloric acid added and the concentration of aqueous sodium hydroxide. Explain how you used your graph to determine the relationship. ........................................................................................................................................... ........................................................................................................................................... ..................................................................................................................................... [2] (c) The student repeats the procedure, and finds that 12.00 cm3 of dilute hydrochloric acid is needed to exactly neutralise a 25 cm3 sample of aqueous sodium hydroxide. Use your graph to estimate the concentration of the aqueous sodium hydroxide. Show on your graph how you arrived at your answer. concentration = ..................................................... M [2] [Total: 14]
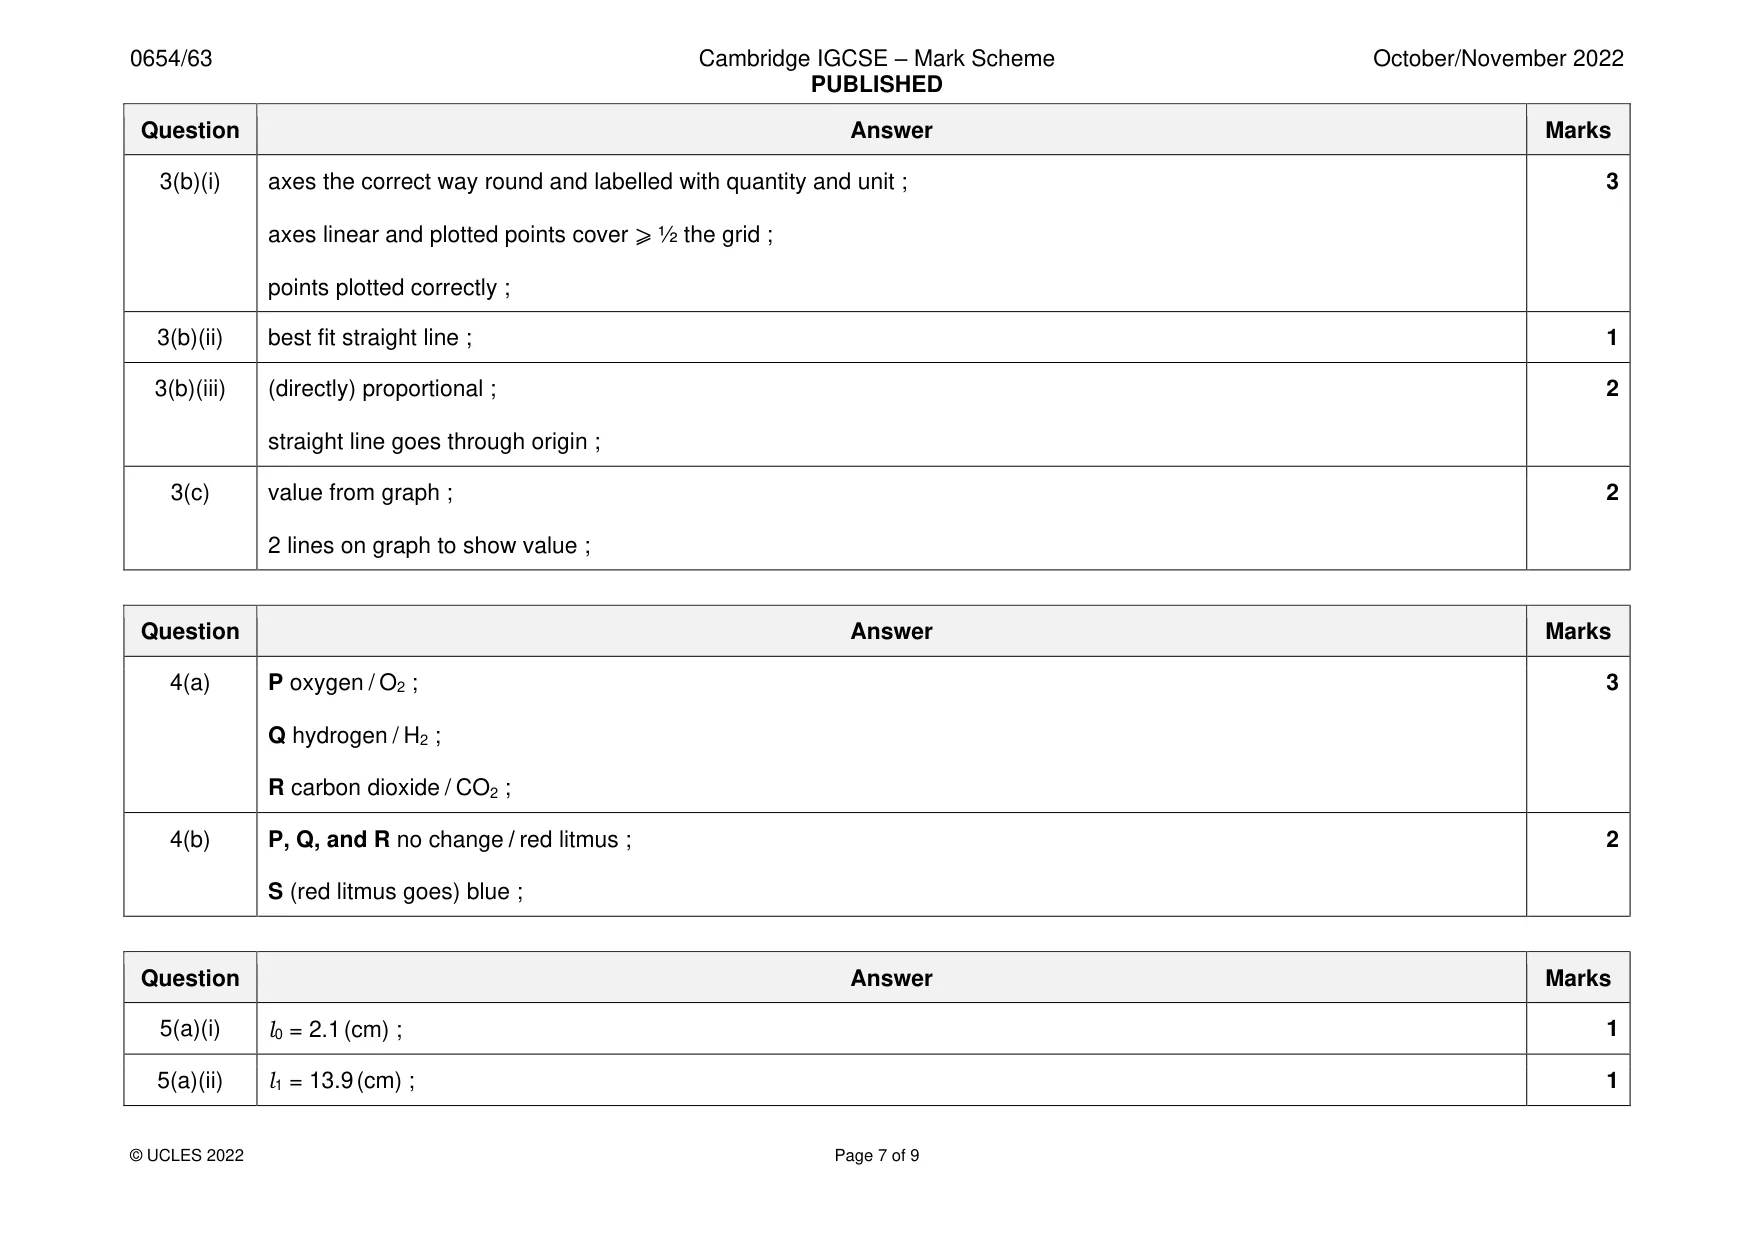
Mark scheme: 3(a)(i) 34.20 ; 2 1.35 ; 3(a)(ii) 33.00 AND 1 17.25 ; 3(a)(iii) repeat (and average) ; 1 3(a)(iv) no contamination from the acid / alkali / reaction mixture / residue (AND which would change the volume needed) ; 1 3(a)(v) red ; 1 3(b)(i) axes the correct way round and labelled with quantity and unit ; 3 axes linear and plotted points cover ⩾ ½ the grid ; points plotted correctly ; 3(b)(ii) best fit straight line ; 1 3(b)(iii) (directly) proportional ; 2 straight line goes through origin ; 3(c) value from graph ; 2 2 lines on graph to show value ;
Q4 · A student identifies four gases P, Q, R and S
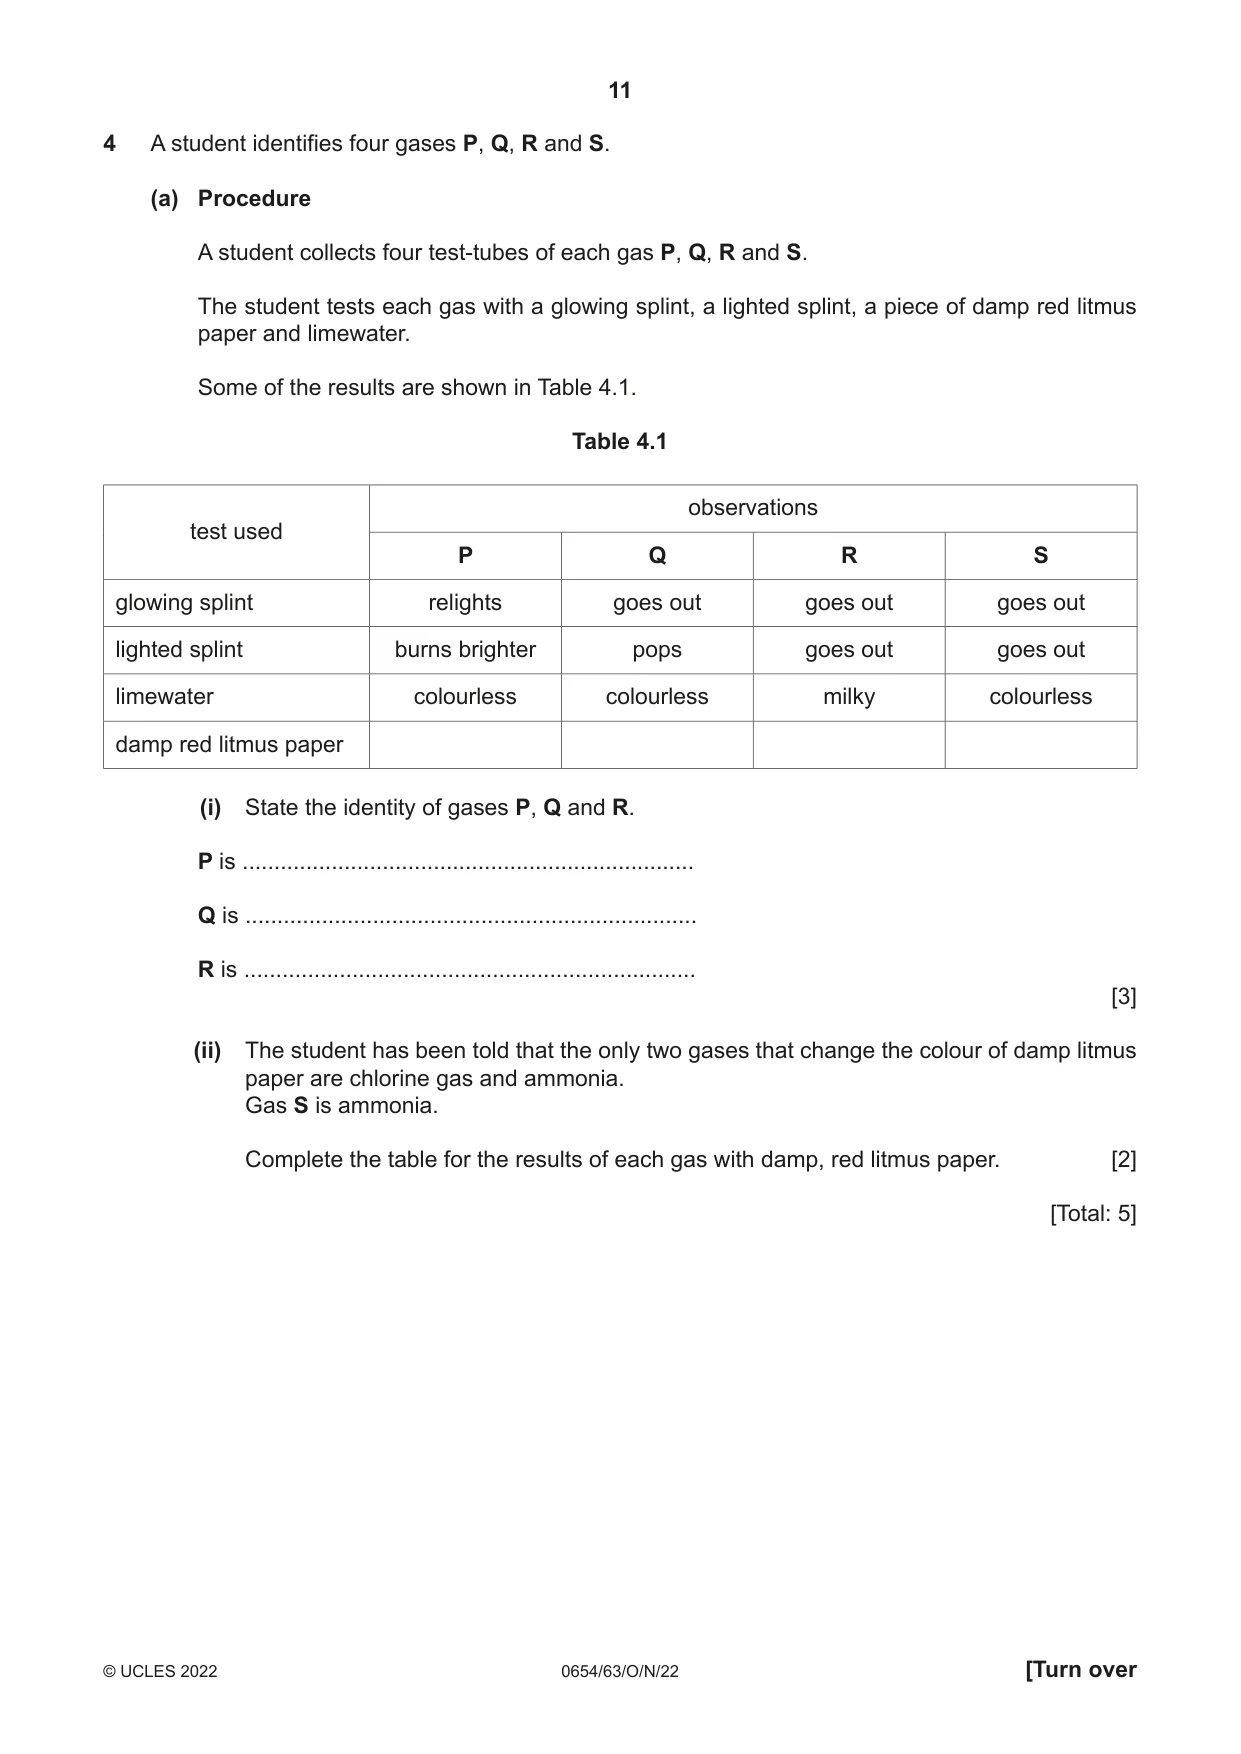
4 A student identifies four gases P, Q, R and S. (a) Procedure A student collects four test-tubes of each gas P, Q, R and S. The student tests each gas with a glowing splint, a lighted splint, a piece of damp red litmus paper and limewater. Some of the results are shown in Table 4.1. Table 4.1 observations test used P Q R S glowing splint relights goes out goes out goes out lighted splint burns brighter pops goes out goes out limewater colourless colourless milky colourless damp red litmus paper (i) State the identity of gases P, Q and R. P is ....................................................................... Q is ....................................................................... R is ....................................................................... [3] (ii) The student has been told that the only two gases that change the colour of damp litmus paper are chlorine gas and ammonia. Gas S is ammonia. Complete the table for the results of each gas with damp, red litmus paper. [2] [Total: 5]
Mark scheme: 4(a) P oxygen / O2 ; 3 Q hydrogen / H2 ; R carbon dioxide / CO2 ; 4(b) P, Q, and R no change / red litmus ; 2 S (red litmus goes) blue ;
Q5 · A student measures the spring constant k of a spring by two different methods
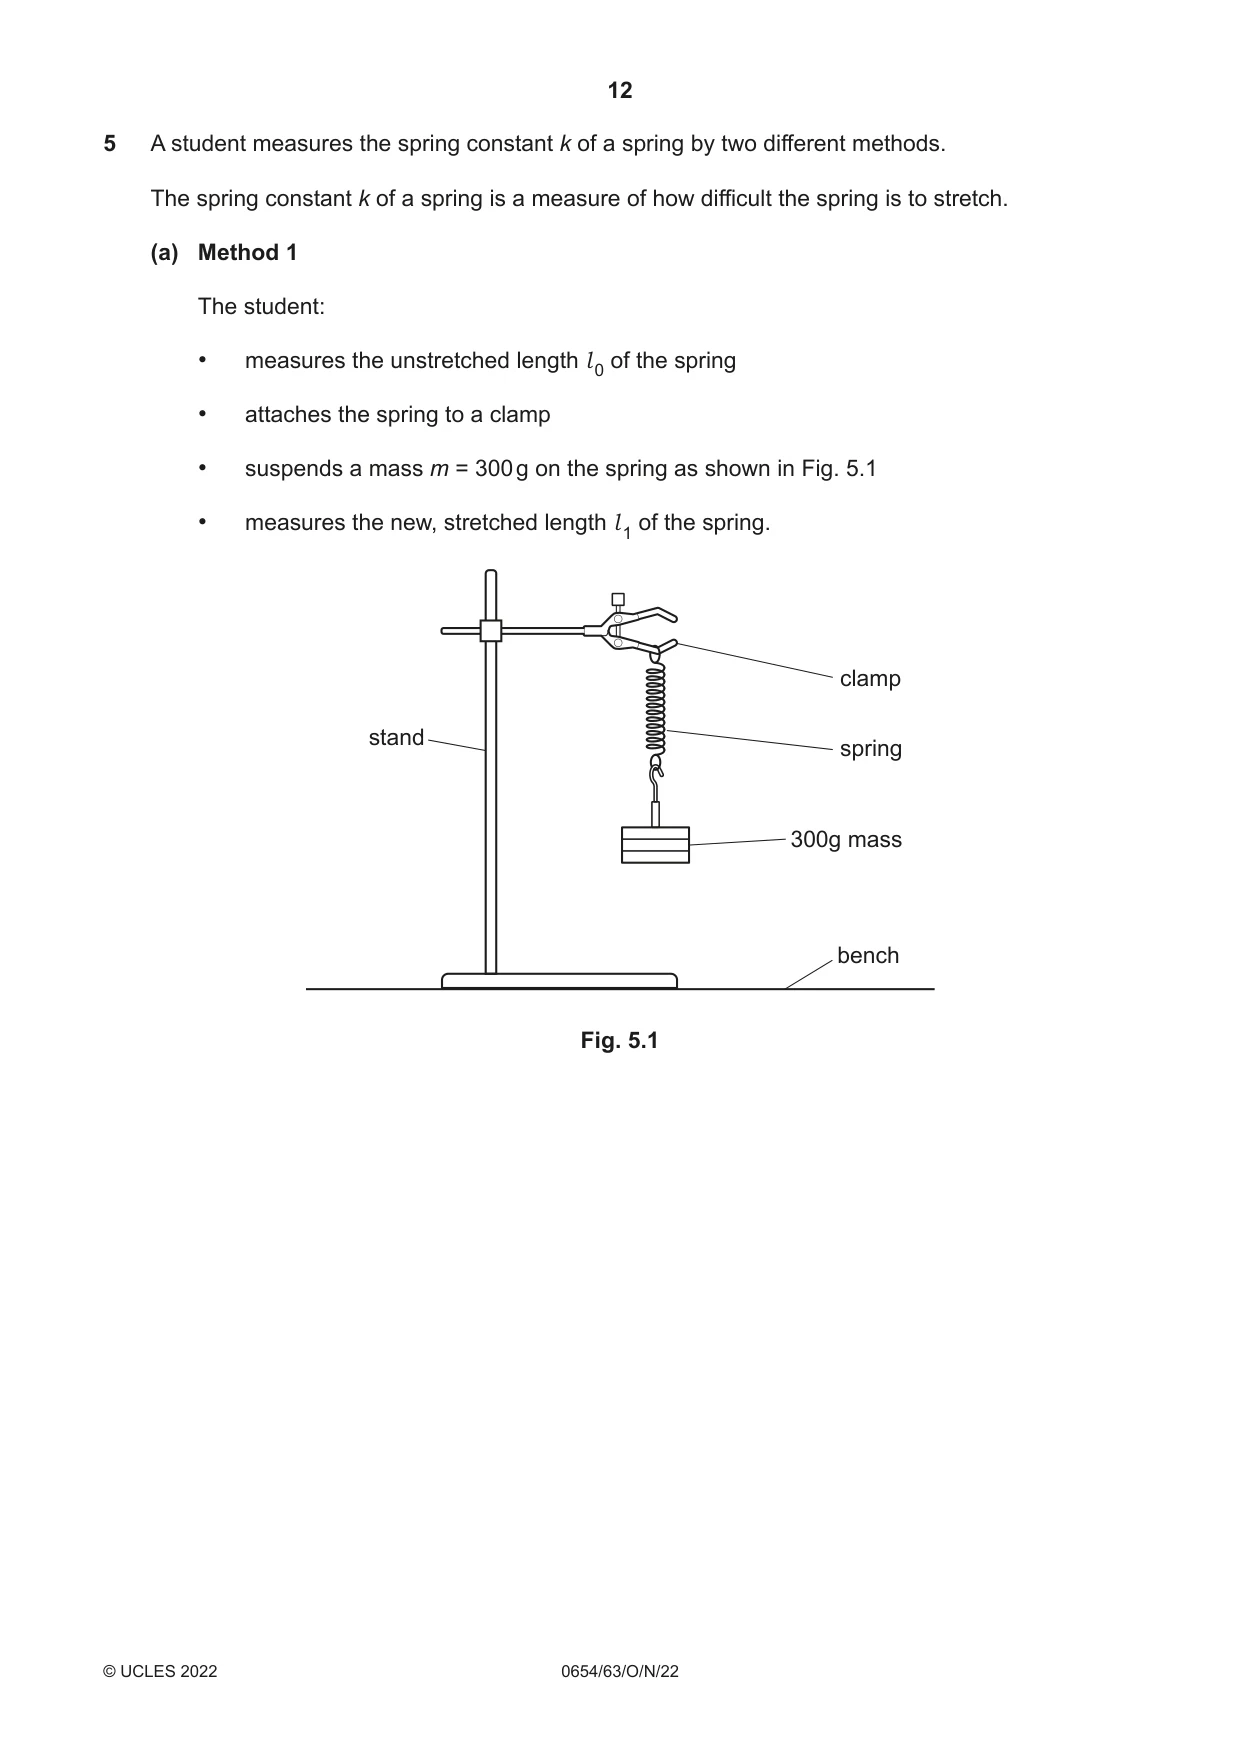
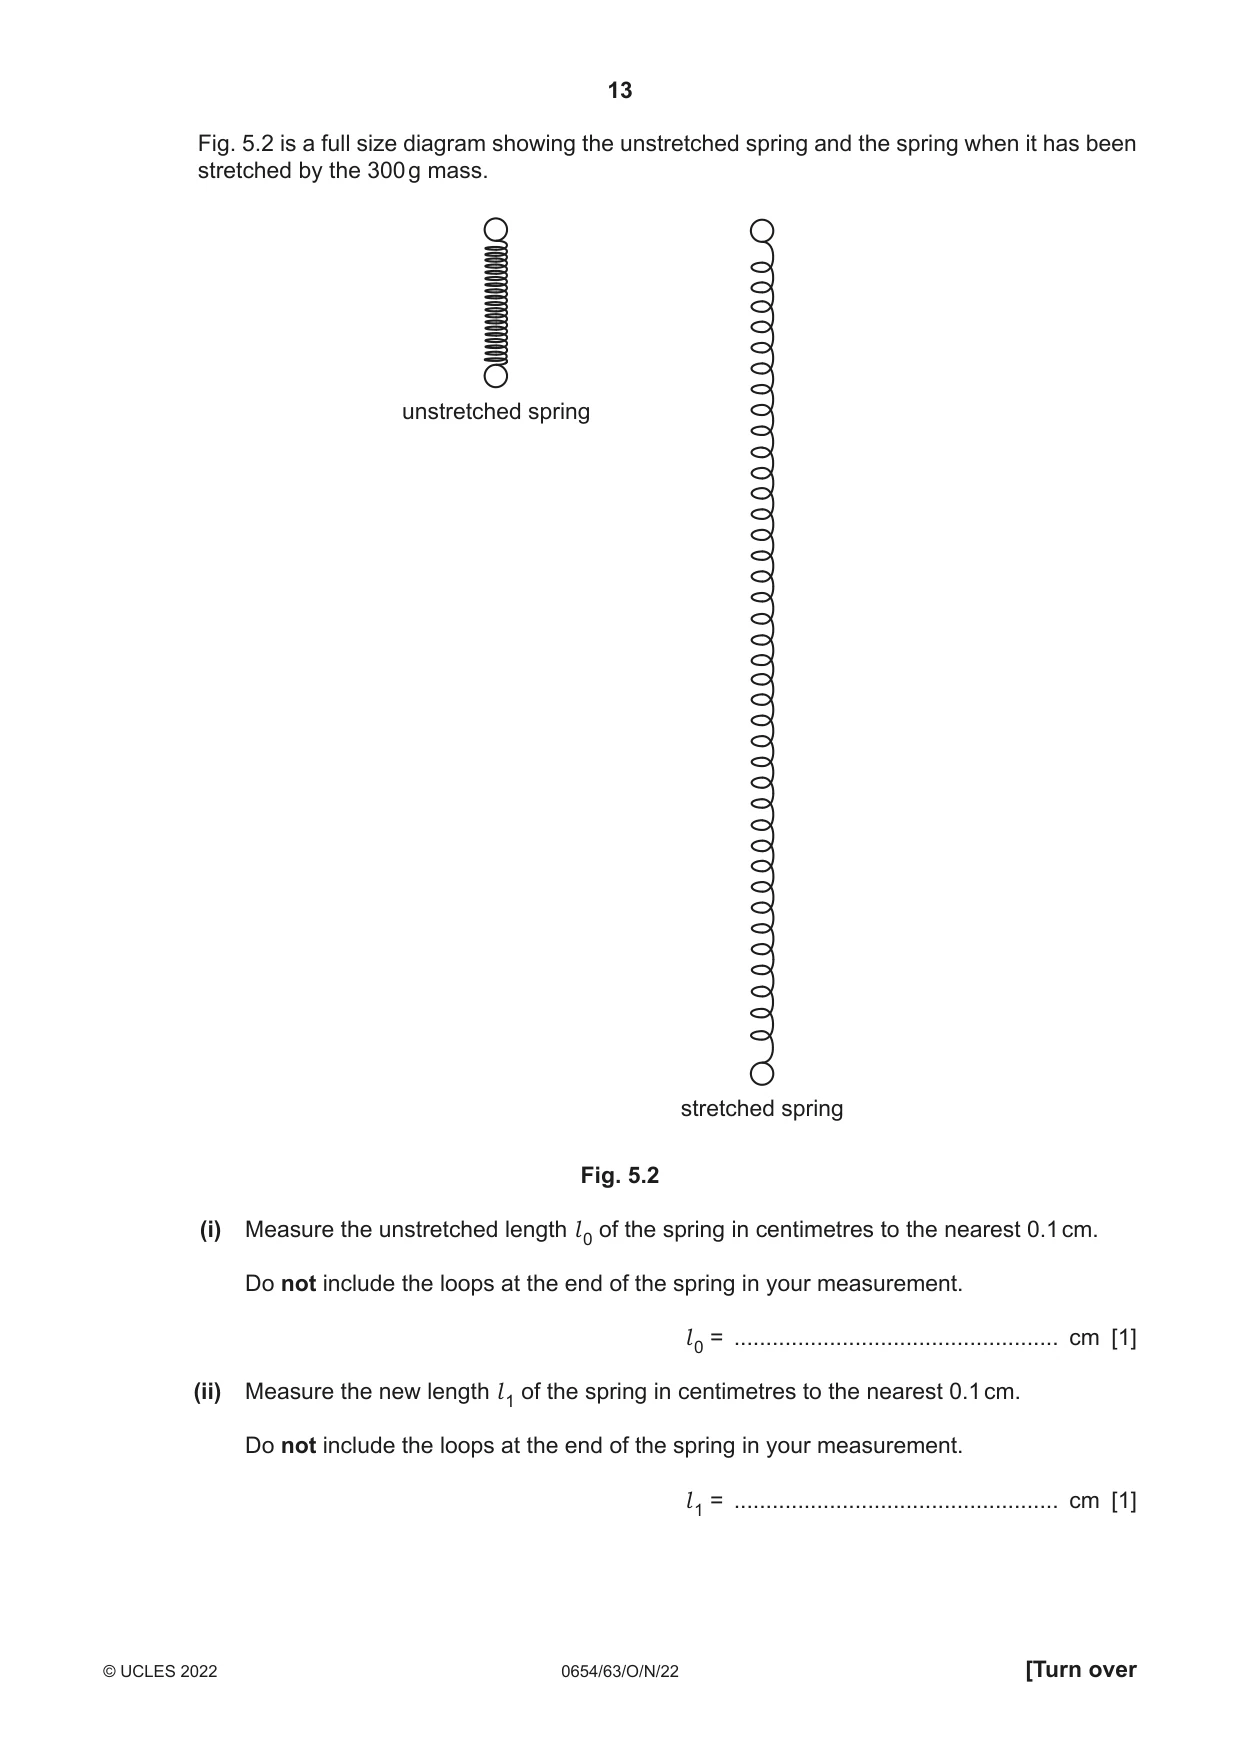
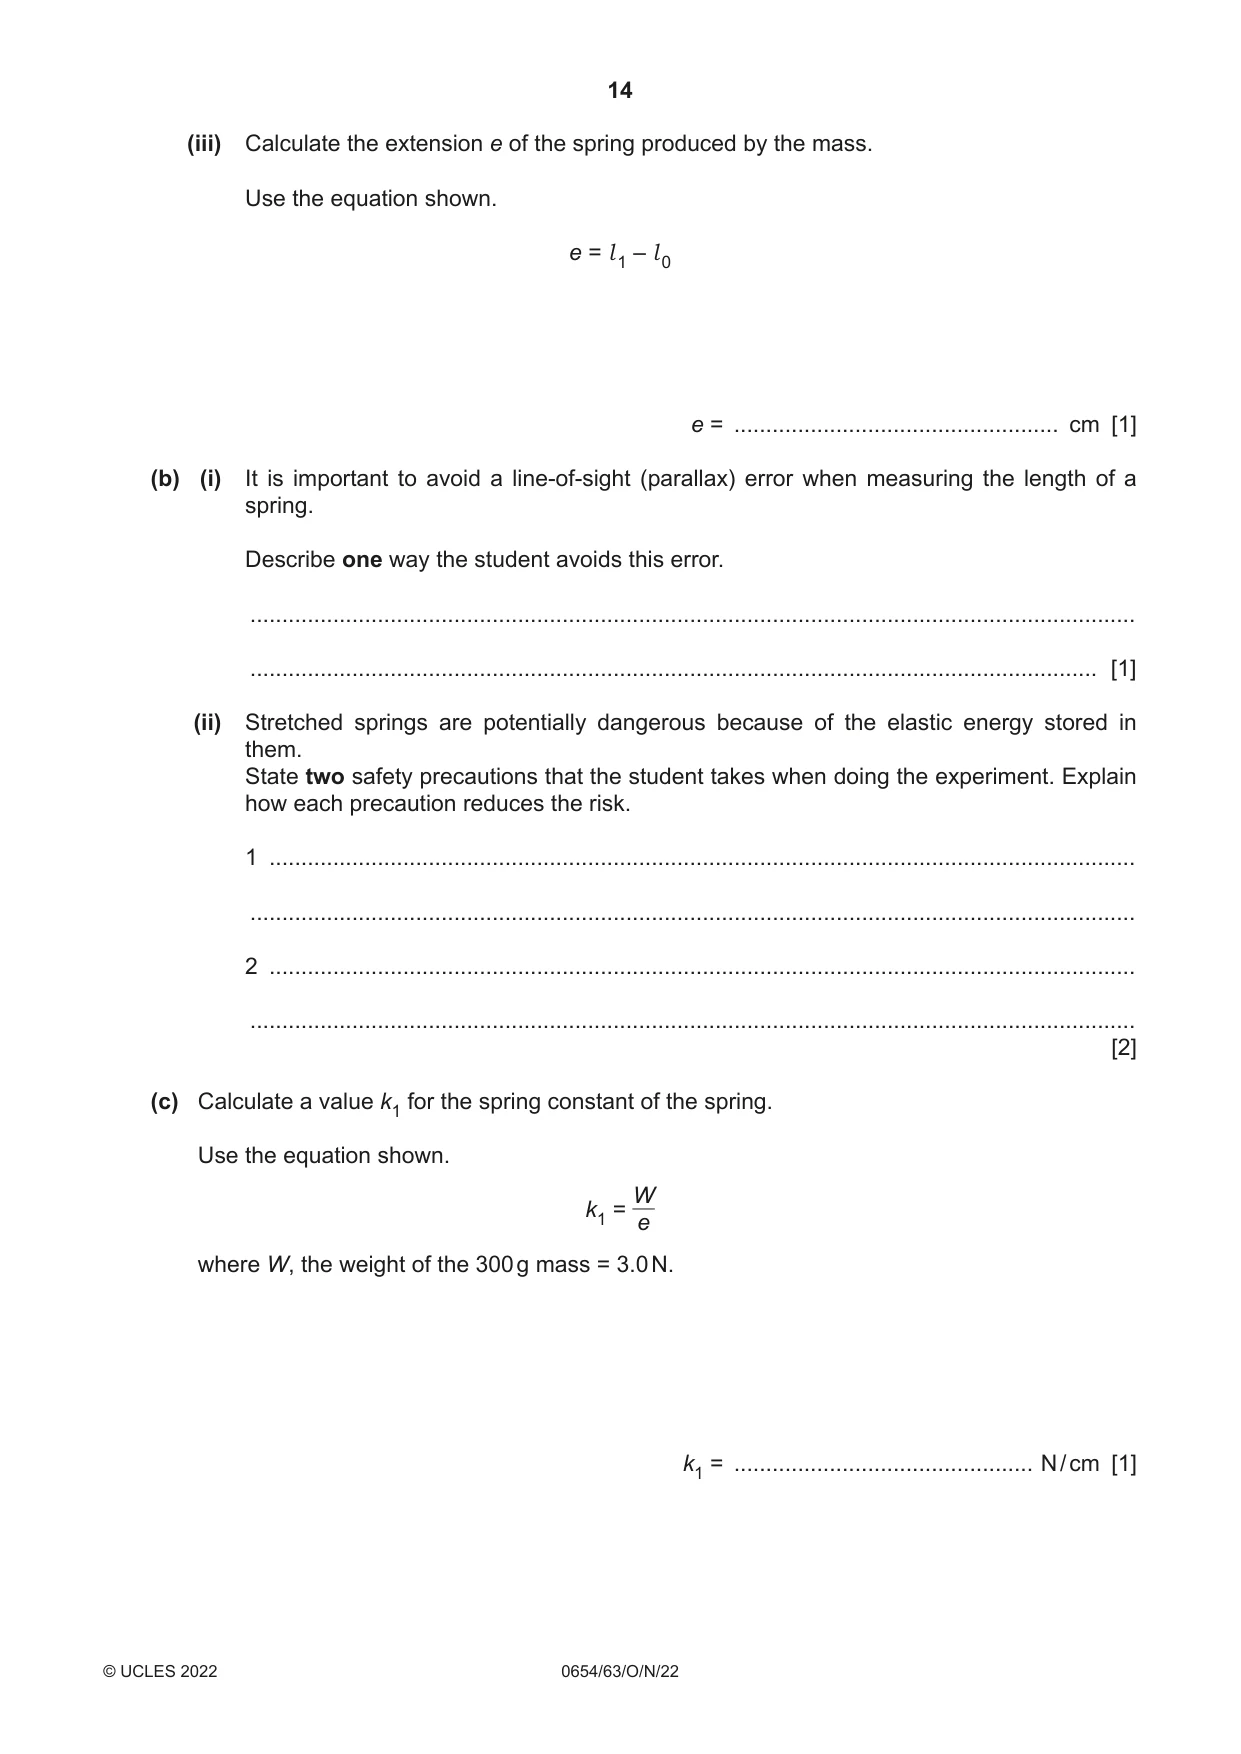
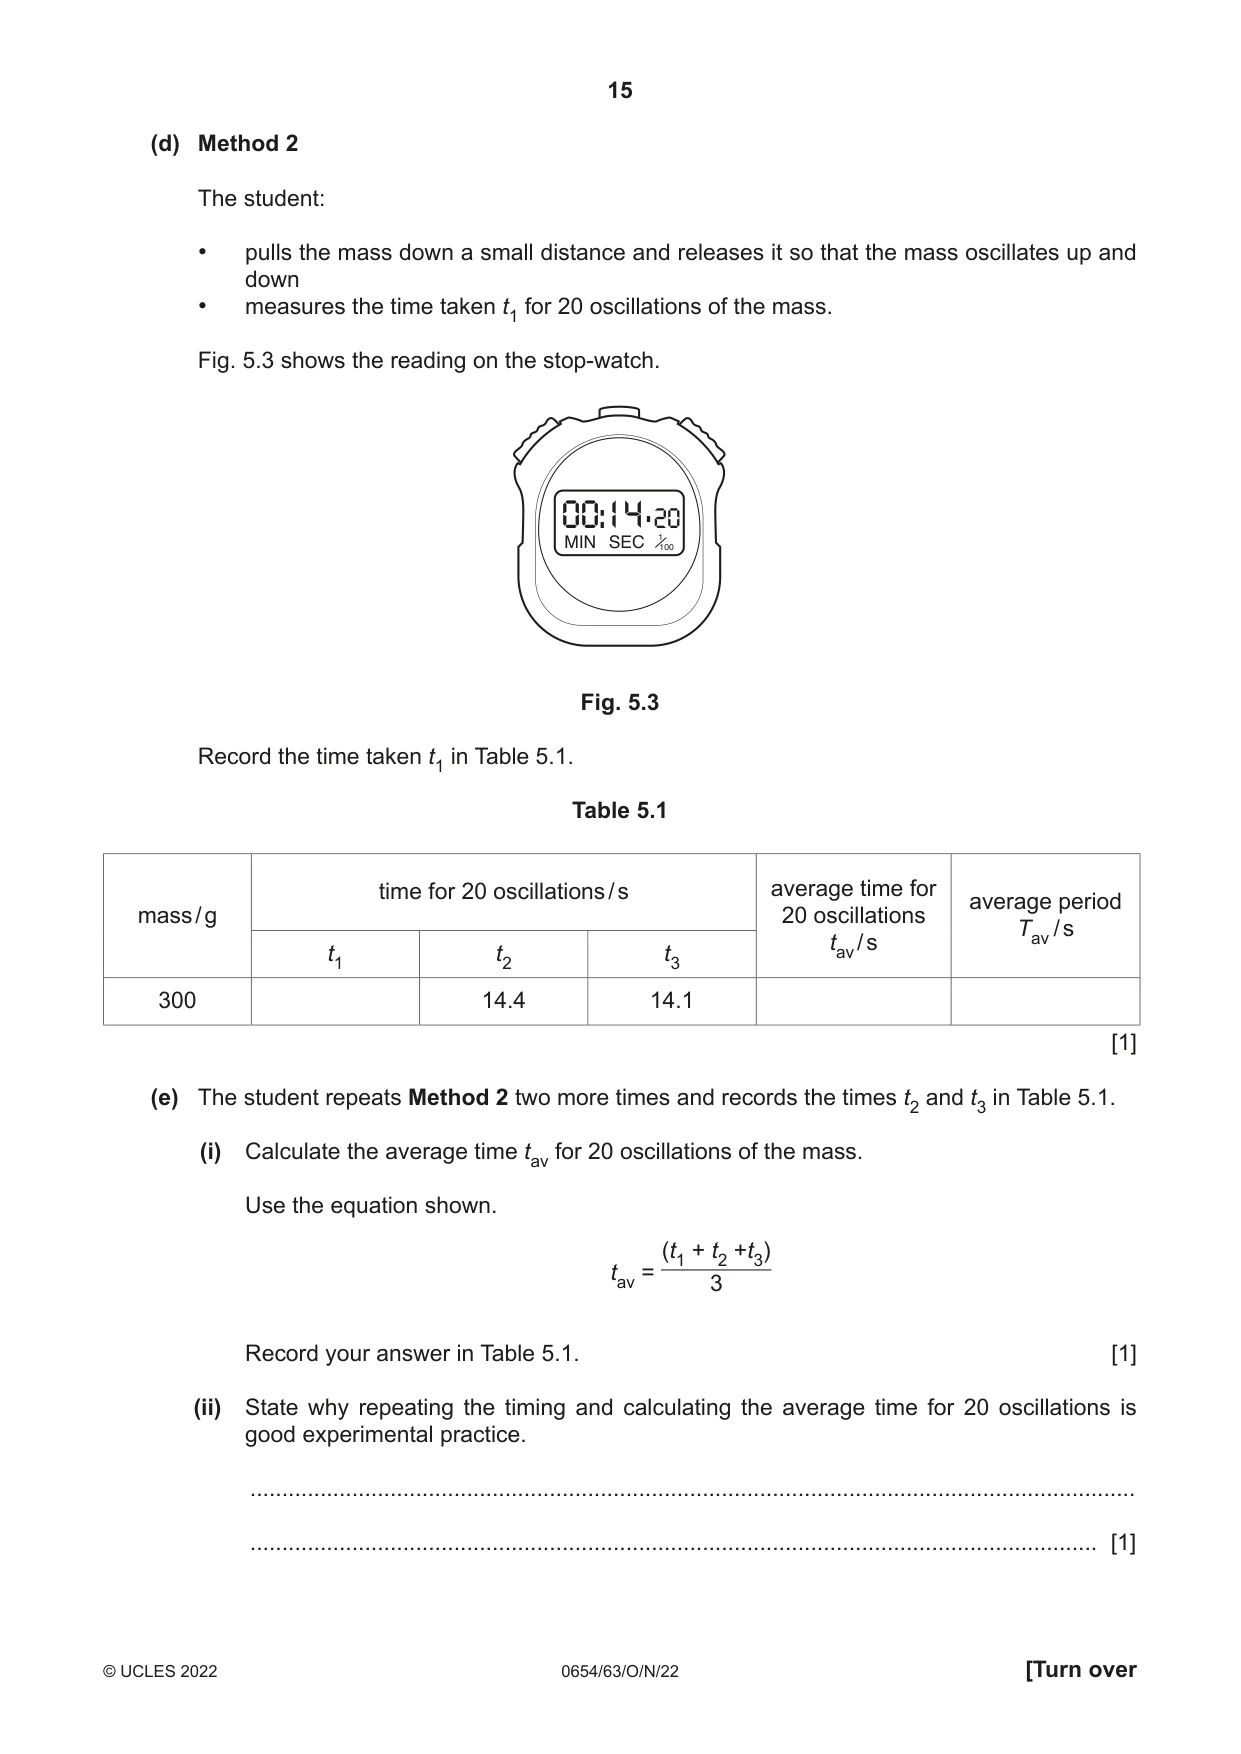
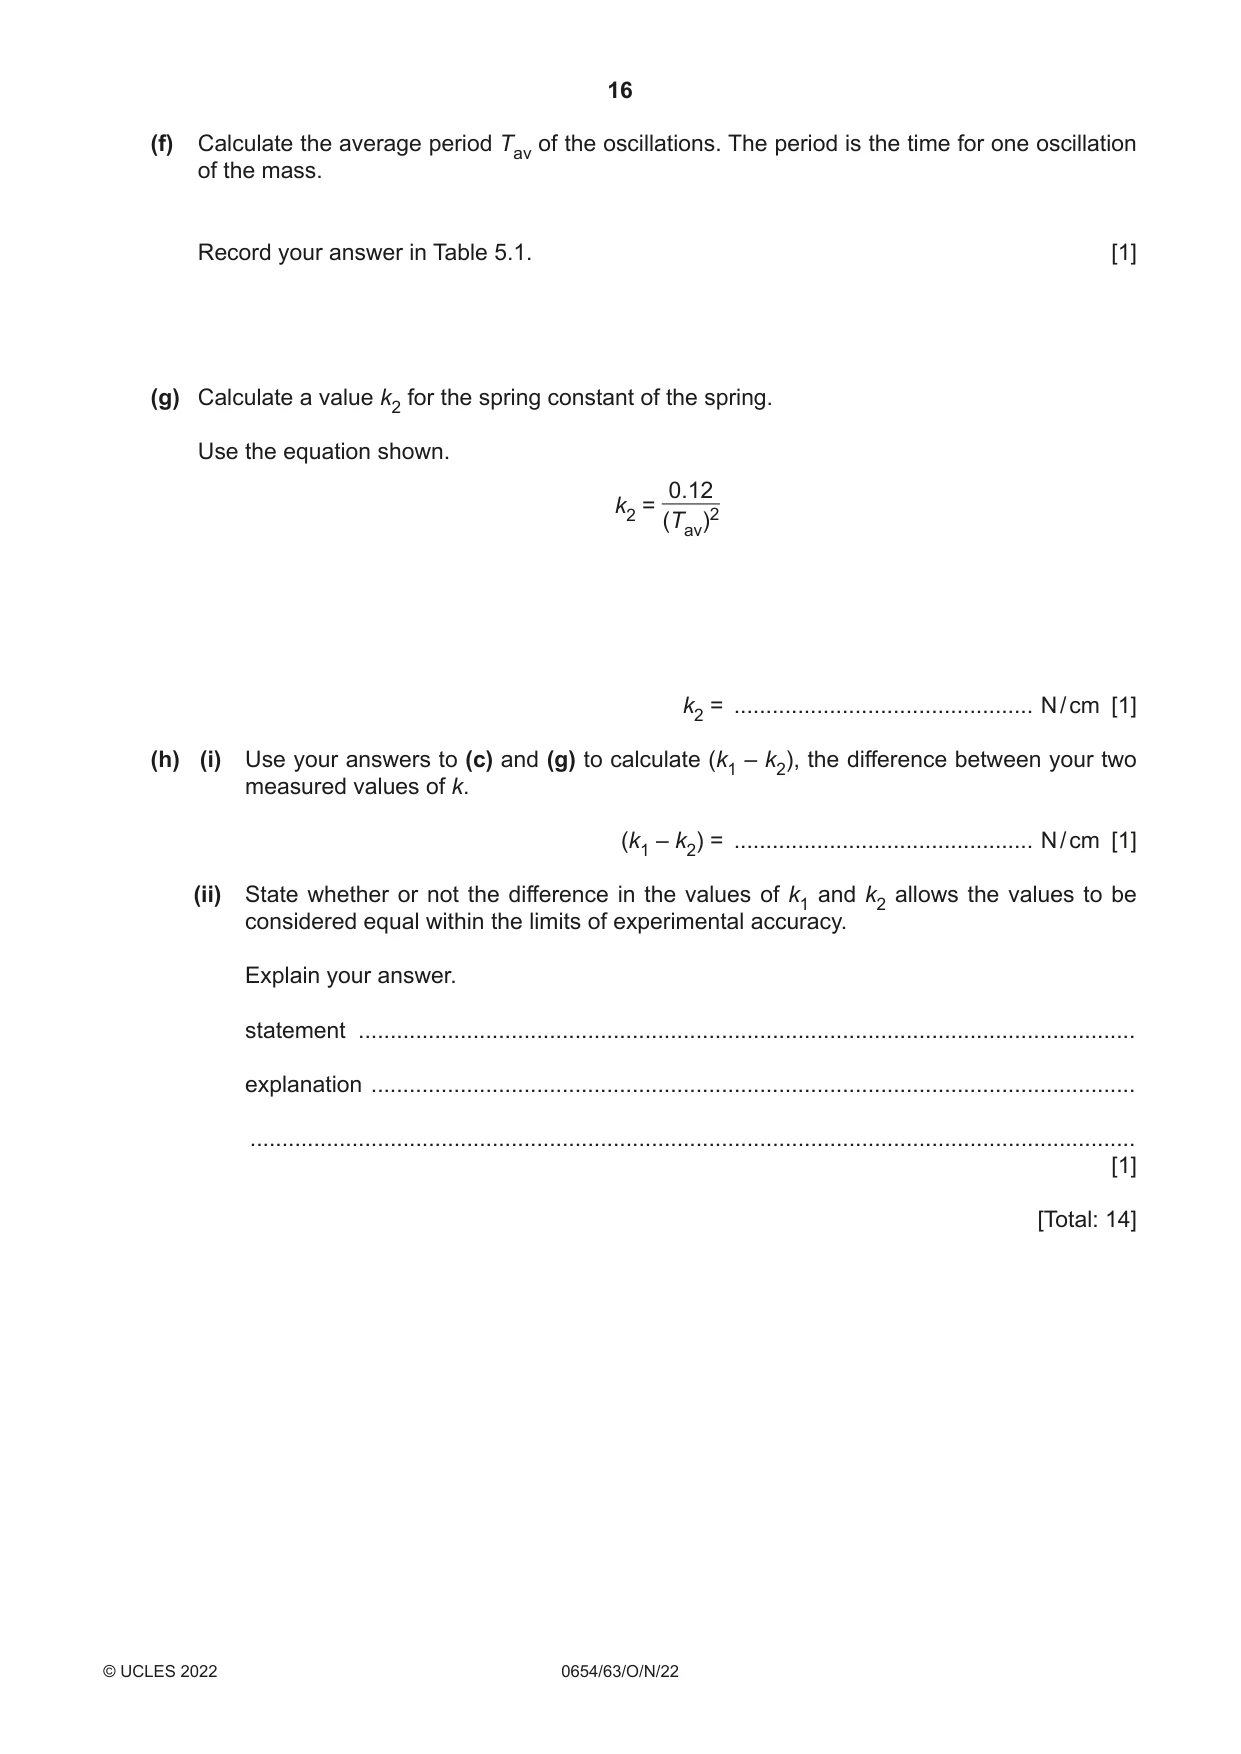
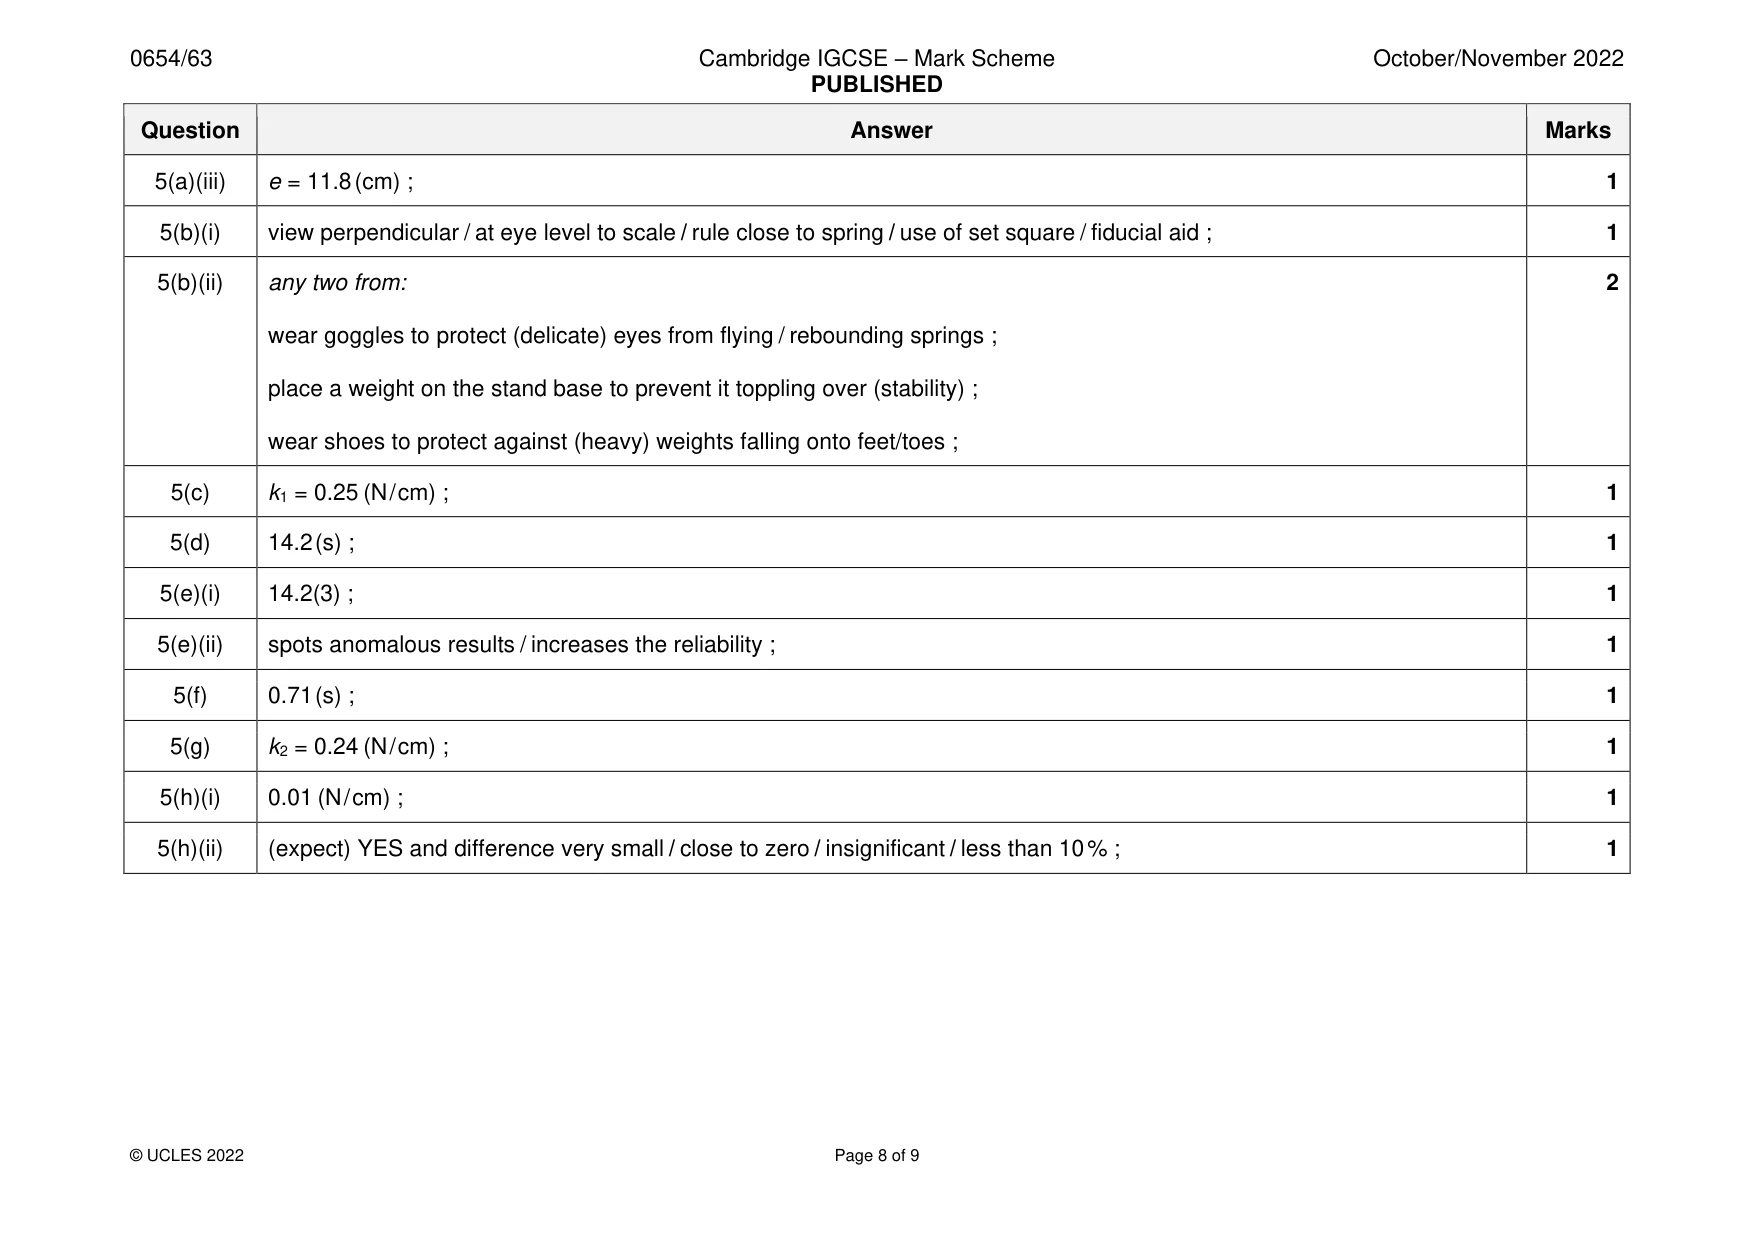
5 A student measures the spring constant k of a spring by two different methods. The spring constant k of a spring is a measure of how difficult the spring is to stretch. (a) Method 1 The student: • measures the unstretched length l 0 of the spring • attaches the spring to a clamp • suspends a mass m = 300 g on the spring as shown in Fig. 5.1 • measures the new, stretched length l 1 of the spring. clamp stand spring 300g mass bench Fig. 5.1 Fig. 5.2 is a full size diagram showing the unstretched spring and the spring when it has been stretched by the 300 g mass. unstretched spring stretched spring Fig. 5.2 (i) Measure the unstretched length l 0 of the spring in centimetres to the nearest 0.1 cm. Do not include the loops at the end of the spring in your measurement. l 0 = ................................................... cm [1] (ii) Measure the new length l 1 of the spring in centimetres to the nearest 0.1 cm. Do not include the loops at the end of the spring in your measurement. l 1 = ................................................... cm [1] (iii) Calculate the extension e of the spring produced by the mass. Use the equation shown. e = l 1 – l 0 e = ................................................... cm [1] (b) (i) It is important to avoid a line-of-sight (parallax) error when measuring the length of a spring. Describe one way the student avoids this error. ........................................................................................................................................... ..................................................................................................................................... [1] (ii) Stretched springs are potentially dangerous because of the elastic energy stored in them. State two safety precautions that the student takes when doing the experiment. Explain how each precaution reduces the risk. 1 ........................................................................................................................................ ........................................................................................................................................... 2 ........................................................................................................................................ ........................................................................................................................................... [2] (c) Calculate a value k1 for the spring constant of the spring. Use the equation shown. W k1 = e where W, the weight of the 300 g mass = 3.0 N. k1 = ............................................... N / cm [1]
Mark scheme: 5(a)(i) l0 = 2.1 (cm) ; 1 5(a)(ii) l1 = 13.9 (cm) ; 1 5(a)(iii) e = 11.8 (cm) ; 1 5(b)(i) view perpendicular / at eye level to scale / rule close to spring / use of set square / fiducial aid ; 1 5(b)(ii) any two from: 2 wear goggles to protect (delicate) eyes from flying / rebounding springs ; place a weight on the stand base to prevent it toppling over (stability) ; wear shoes to protect against (heavy) weights falling onto feet/toes ; 5(c) k1 = 0.25 (N / cm) ; 1 5(d) 14.2 (s) ; 1 5(e)(i) 14.2(3) ; 1 5(e)(ii) spots anomalous results / increases the reliability ; 1 5(f) 0.71 (s) ; 1 5(g) k2 = 0.24 (N / cm) ; 1 5(h)(i) 0.01 (N / cm) ; 1 5(h)(ii) (expect) YES and difference very small / close to zero / insignificant / less than 10 % ; 1
Q6 · A ball is dropped from rest at a height H above the ground
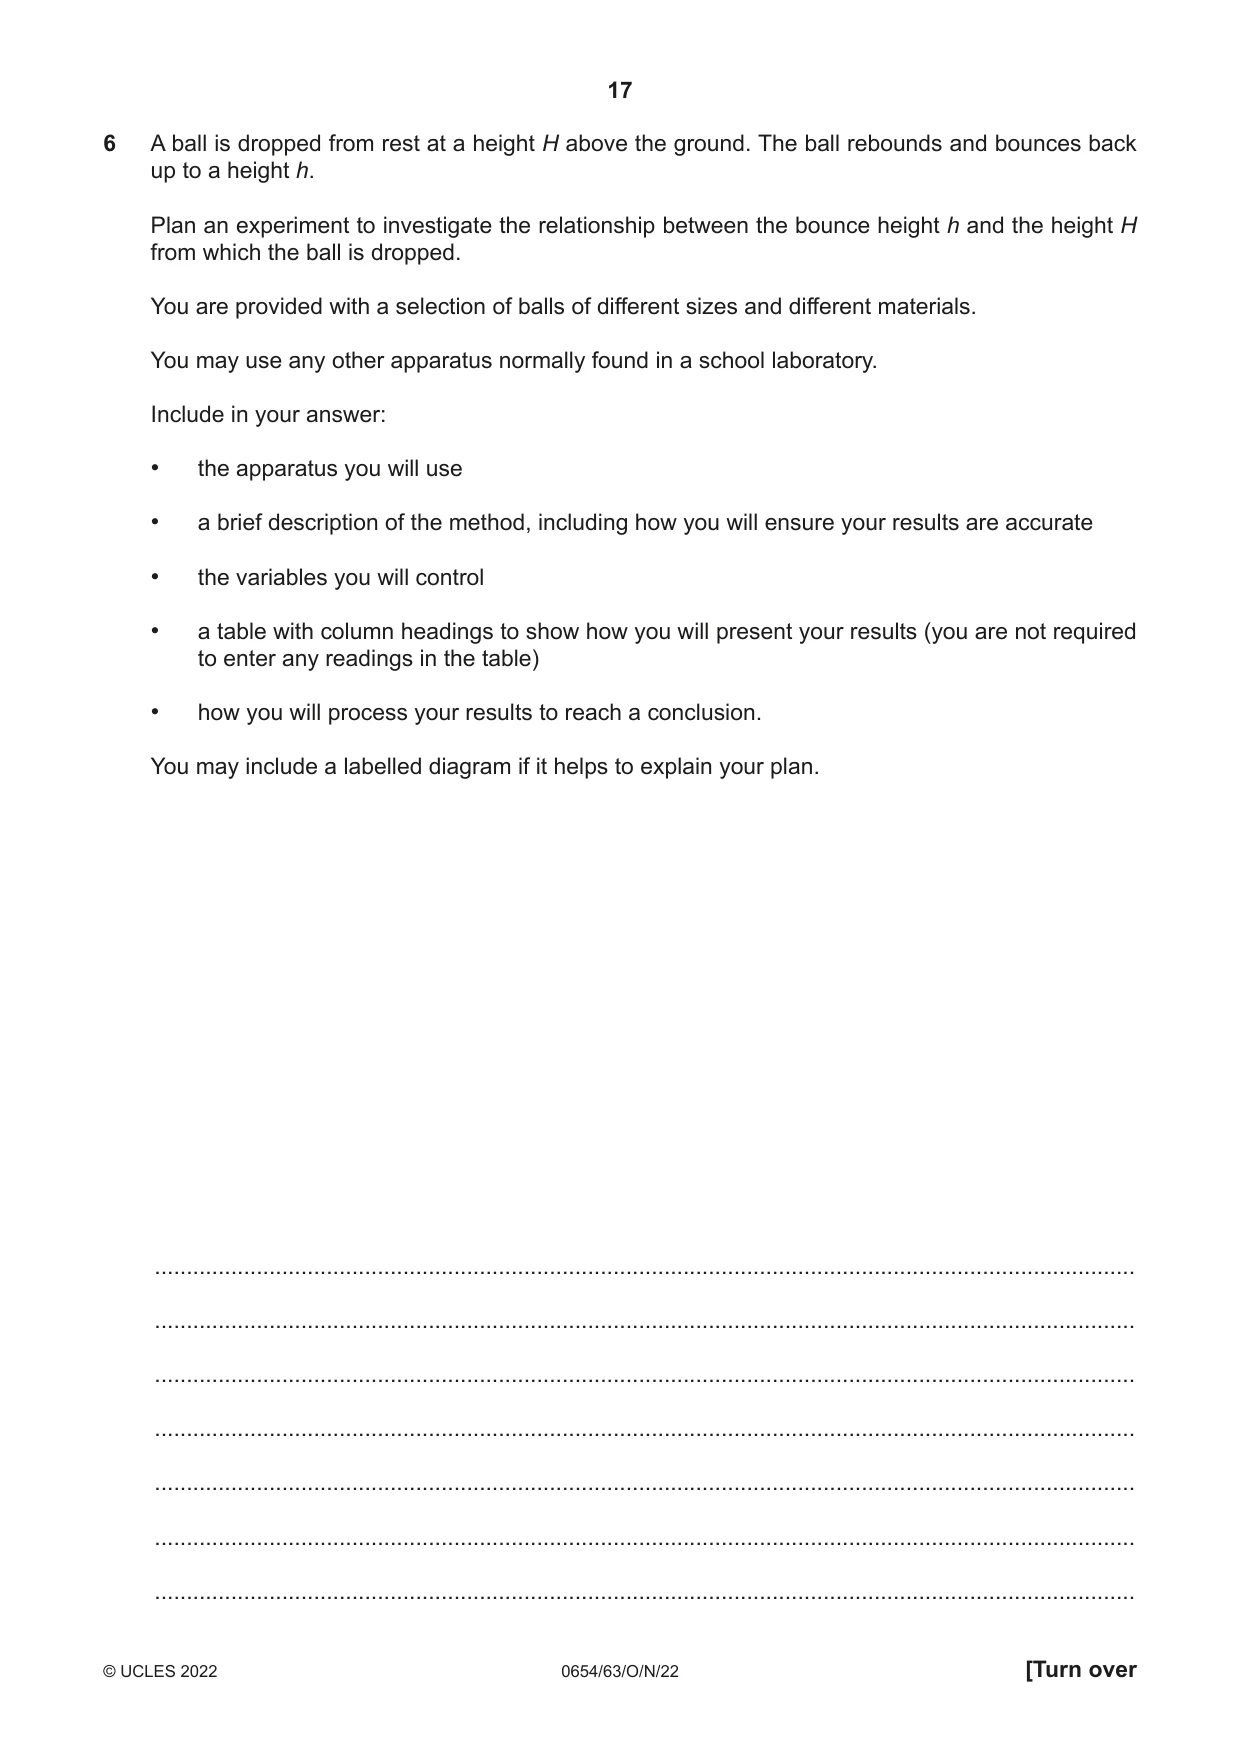
6 A ball is dropped from rest at a height H above the ground. The ball rebounds and bounces back up to a height h. Plan an experiment to investigate the relationship between the bounce height h and the height H from which the ball is dropped. You are provided with a selection of balls of different sizes and different materials. You may use any other apparatus normally found in a school laboratory. Include in your answer: • the apparatus you will use • a brief description of the method, including how you will ensure your results are accurate • the variables you will control • a table with column headings to show how you will present your results (you are not required to enter any readings in the table) • how you will process your results to reach a conclusion. You may include a labelled diagram if it helps to explain your plan. .......................................................................................................................................................... .......................................................................................................................................................... .......................................................................................................................................................... .......................................................................................................................................................... .......................................................................................................................................................... .......................................................................................................................................................... .......................................................................................................................................................... .......................................................................................................................................................... .......................................................................................................................................................... .......................................................................................................................................................... .......................................................................................................................................................... .......................................................................................................................................................... .......................................................................................................................................................... .......................................................................................................................................................... .......................................................................................................................................................... .......................................................................................................................................................... .......................................................................................................................................................... .......................................................................................................................................................... .......................................................................................................................................................... .......................................................................................................................................................... .......................................................................................................................................................... .......................................................................................................................................................... .......................................................................................................................................................... .......................................................................................................................................................... .......................................................................................................................................................... .......................................................................................................................................................... .......................................................................................................................................................... .......................................................................................................................................................... .......................................................................................................................................................... .......................................................................................................................................................... .......................................................................................................................................................... .......................................................................................................................................................... .......................................................................................................................................................... ..........................................................................................................................................................
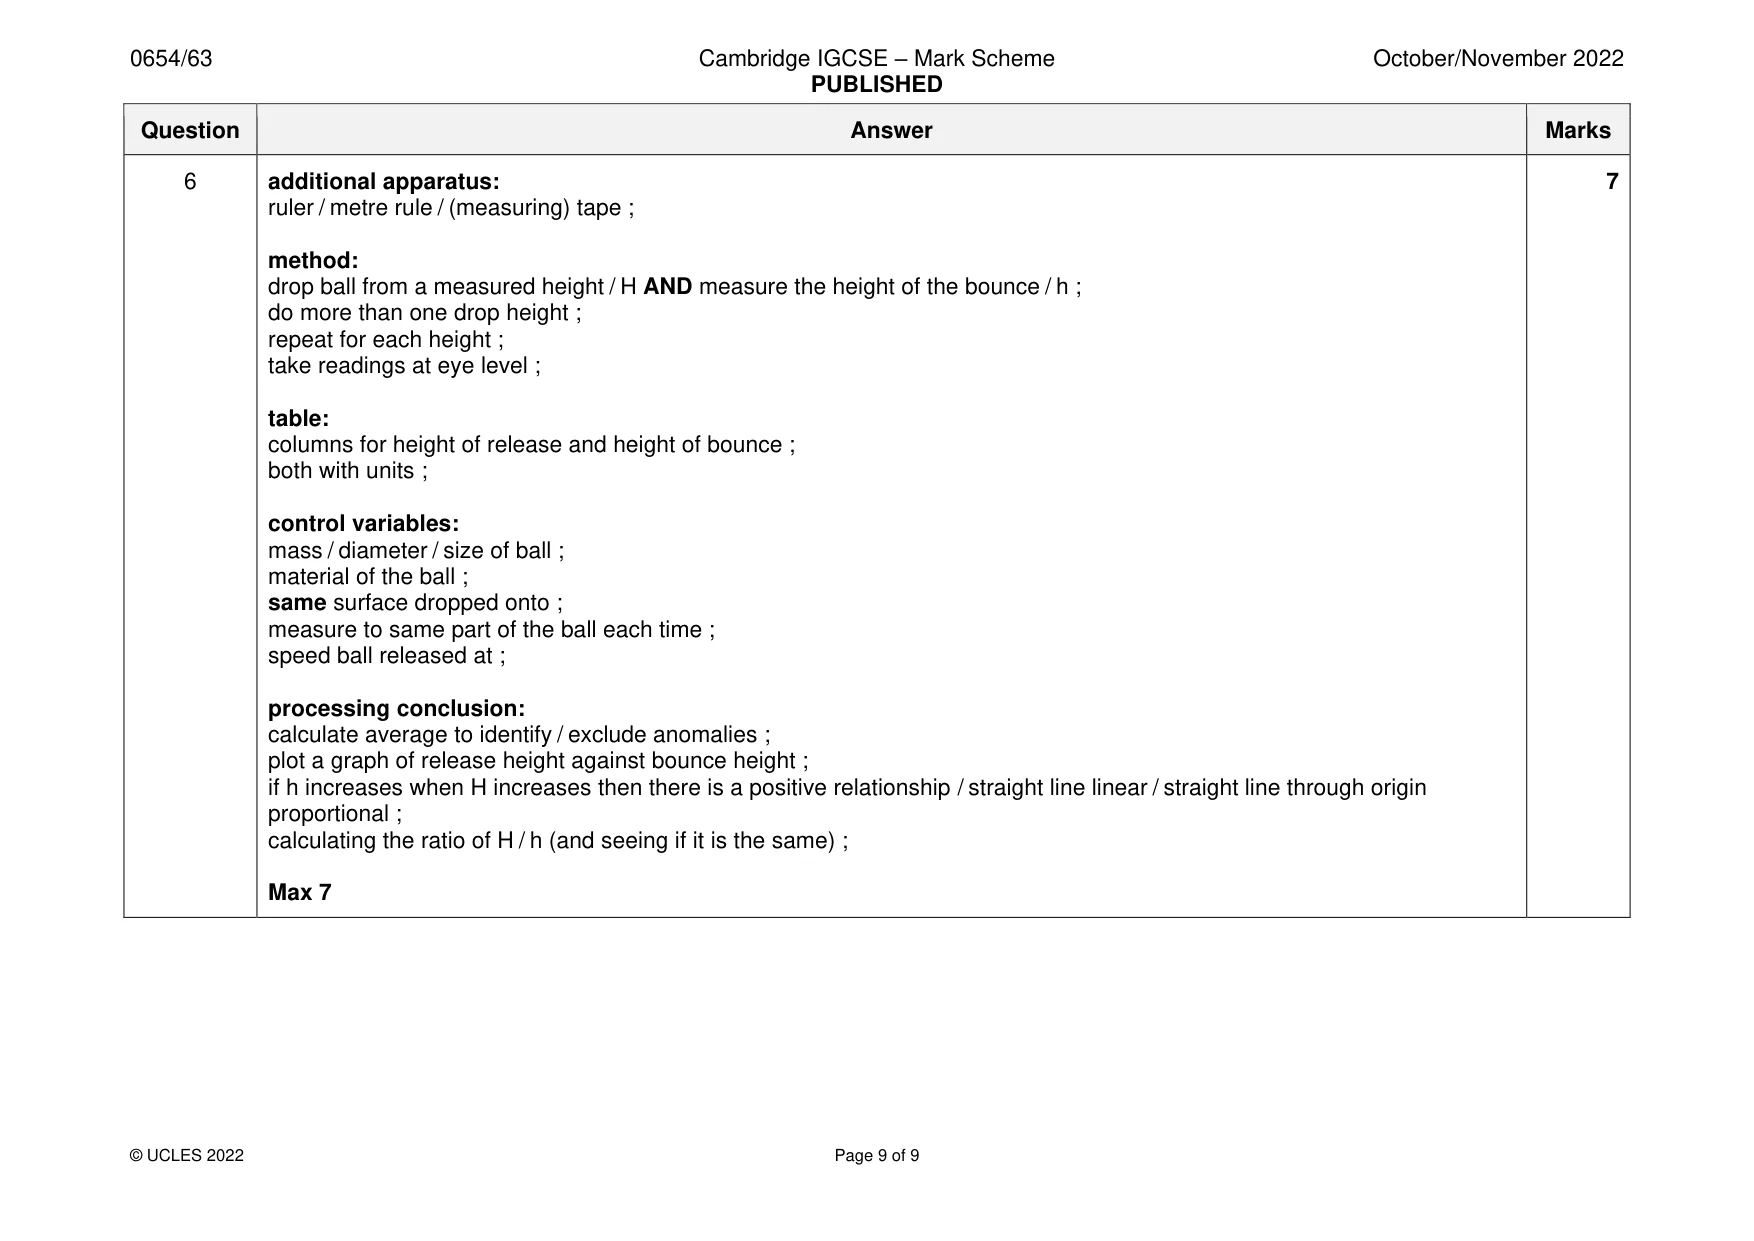
Mark scheme: Question Answer Marks 6 additional apparatus: 7 ruler / metre rule / (measuring) tape ; method: drop ball from a measured height / H AND measure the height of the bounce / h ; do more than one drop height ; repeat for each height ; take readings at eye level ; table: columns for height of release and height of bounce ; both with units ; control variables: mass / diameter / size of ball ; material of the ball ; same surface dropped onto ; measure to same part of the ball each time ; speed ball released at ; processing conclusion: calculate average to identify / exclude anomalies ; plot a graph of release height against bounce height ; if h increases when H increases then there is a positive relationship / straight line linear / straight line through origin proportional ; calculating the ratio of H / h (and seeing if it is the same) ; Max 7
More questions on Physical quantities and measurement techniques
What was in this paper
The subtopics covered by these 6 questions, and how many questions each got. Open one in a new tab to see every Cambridge question on it.
What you needed in this session
Cambridge’s own grade thresholds for 2022 Oct/Nov, Paper 6 · Variant 3. A higher threshold means an easier paper — the bar moves with how the cohort did.