Cambridge IGCSE Sciences - Co-ordinated (Double) 0654 — 2021 Oct/Nov Paper 6 · Variant 2
0654/62/O/N/21 · 7 questions · 60 marks · ≈68 min
The question paper and its mark scheme, free to read here and free to download. This is Cambridge’s own paper, exactly as it was sat.
Question paper20 pages


Mark scheme11 pages
Answers below. Sit the paper first if you are practising.
Questions as text
Q1 · A student investigates how germinating bean seeds respond to gravity
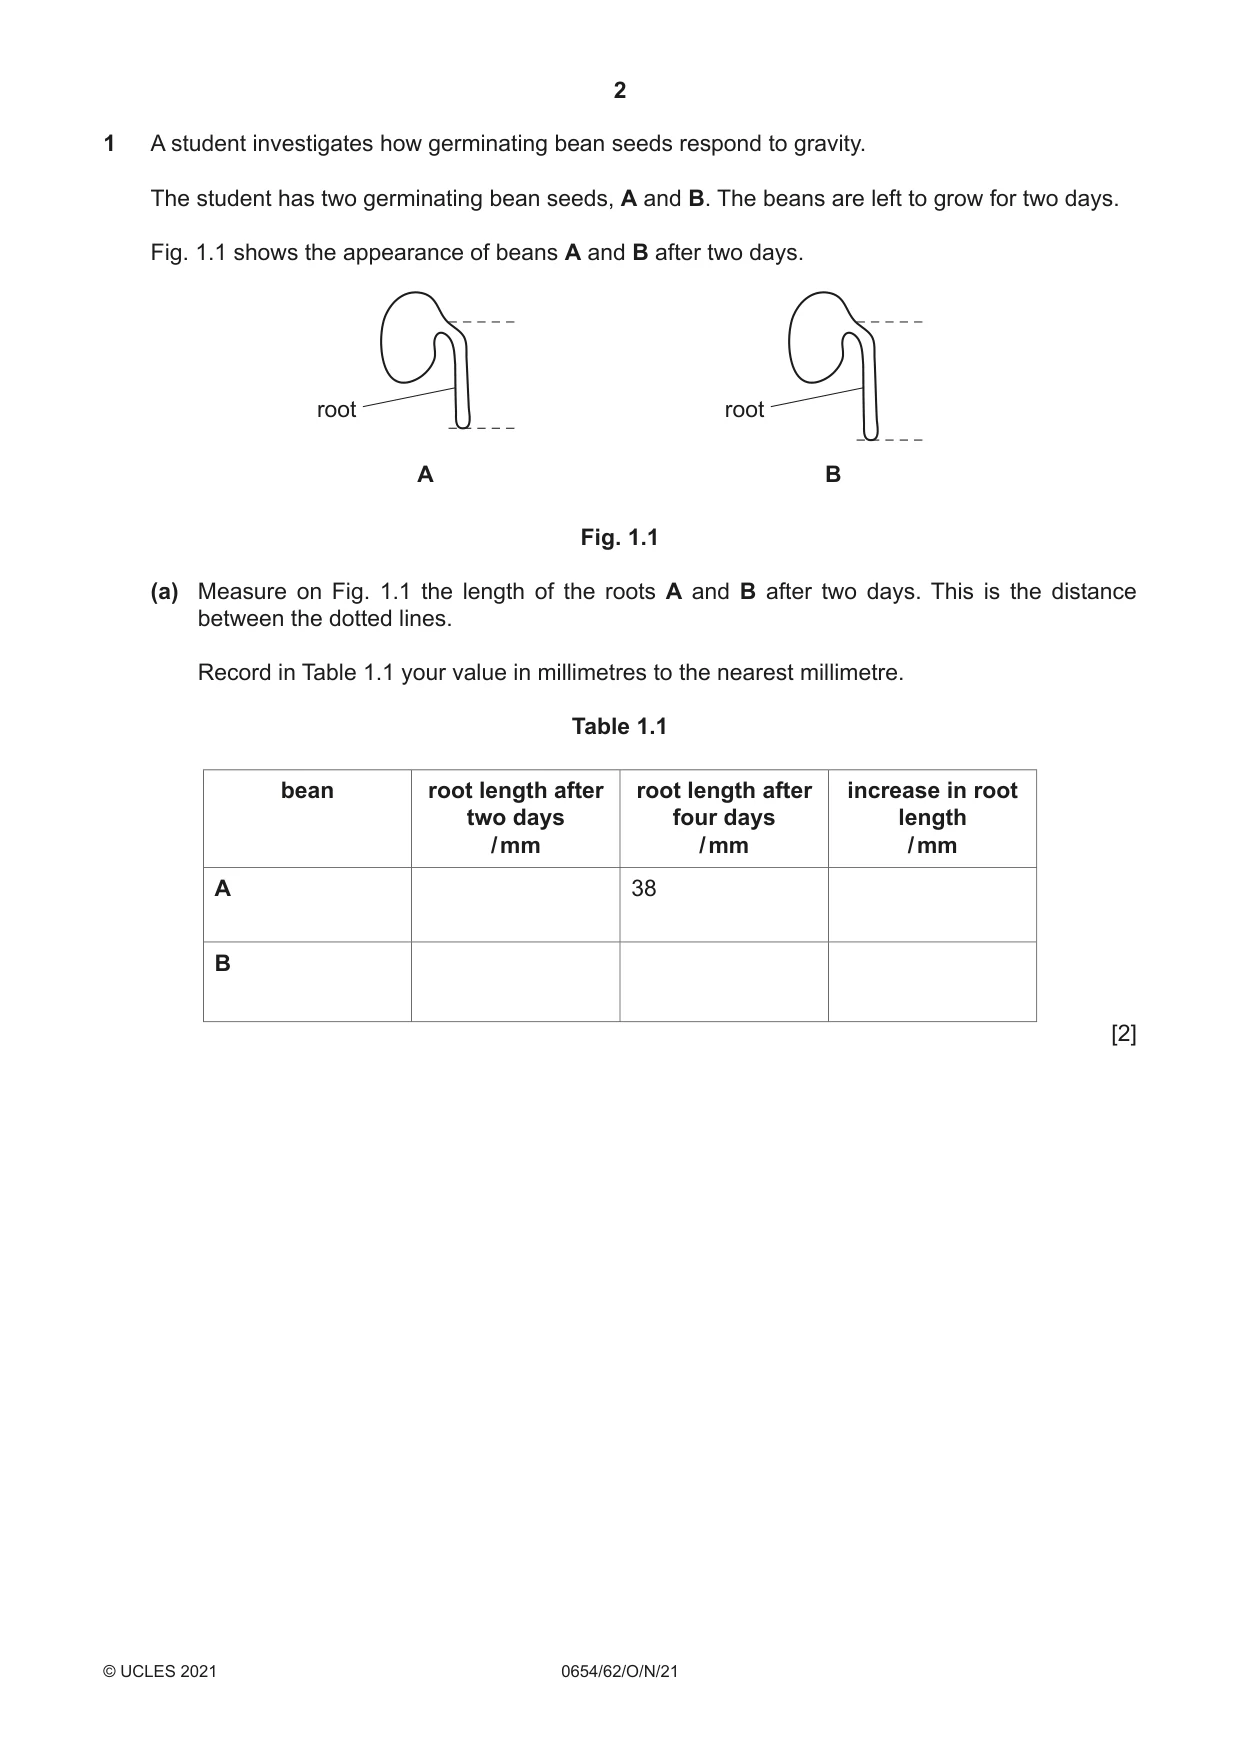
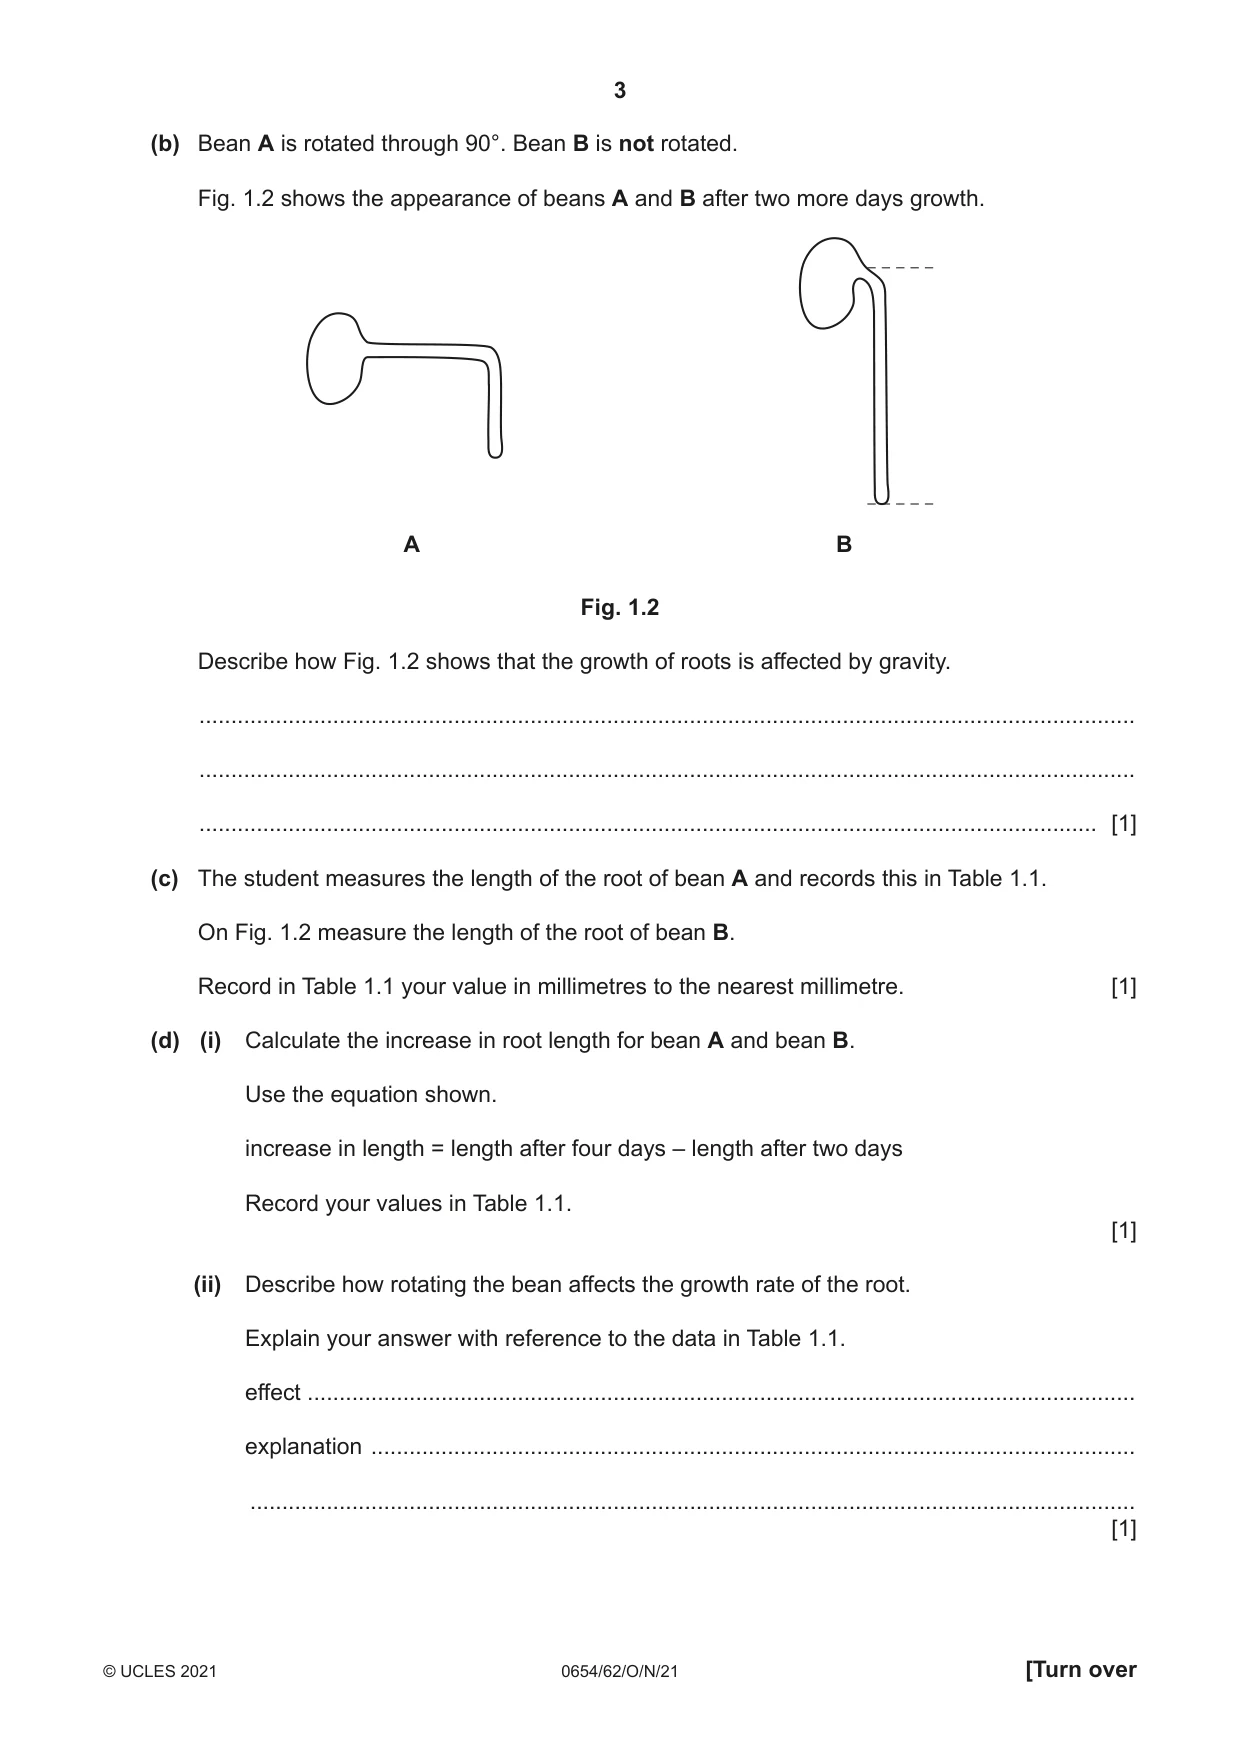
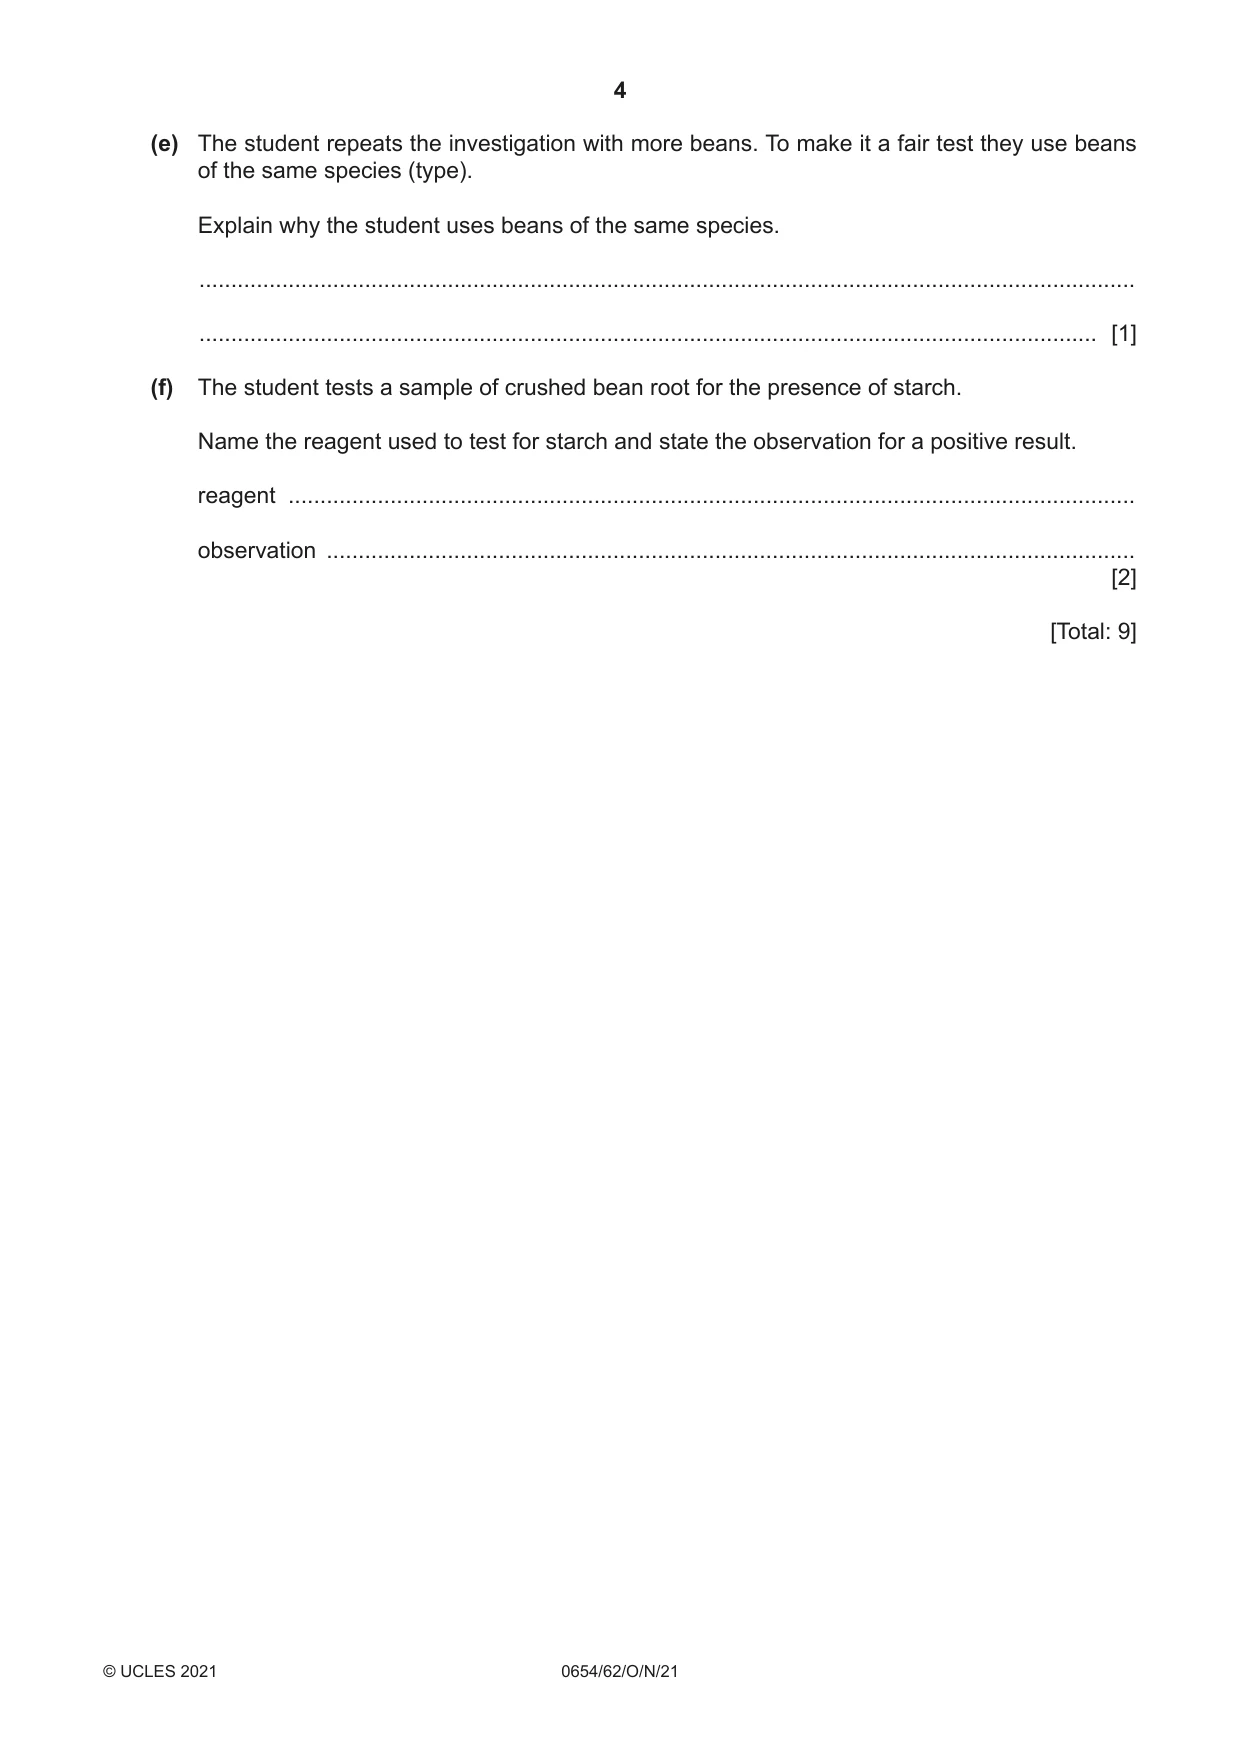
1 A student investigates how germinating bean seeds respond to gravity. The student has two germinating bean seeds, A and B. The beans are left to grow for two days. Fig. 1.1 shows the appearance of beans A and B after two days. root root A B Fig. 1.1 (a) Measure on Fig. 1.1 the length of the roots A and B after two days. This is the distance between the dotted lines. Record in Table 1.1 your value in millimetres to the nearest millimetre. Table 1.1 bean root length after root length after increase in root two days four days length / mm / mm / mm A 38 B [2] (b) Bean A is rotated through 90°. Bean B is not rotated. Fig. 1.2 shows the appearance of beans A and B after two more days growth. A B Fig. 1.2 Describe how Fig. 1.2 shows that the growth of roots is affected by gravity. ................................................................................................................................................... ................................................................................................................................................... ............................................................................................................................................. [1] (c) The student measures the length of the root of bean A and records this in Table 1.1. On Fig. 1.2 measure the length of the root of bean B. Record in Table 1.1 your value in millimetres to the nearest millimetre. [1] (d) (i) Calculate the increase in root length for bean A and bean B. Use the equation shown. increase in length = length after four days – length after two days Record your values in Table 1.1. [1] (ii) Describe how rotating the bean affects the growth rate of the root. Explain your answer with reference to the data in Table 1.1. effect .................................................................................................................................. explanation ........................................................................................................................ ........................................................................................................................................... [1] (e) The student repeats the investigation with more beans. To make it a fair test they use beans of the same species (type). Explain why the student uses beans of the same species. ................................................................................................................................................... ............................................................................................................................................. [1] (f) The student tests a sample of crushed bean root for the presence of starch. Name the reagent used to test for starch and state the observation for a positive result. reagent ..................................................................................................................................... observation ............................................................................................................................... [2] [Total: 9]
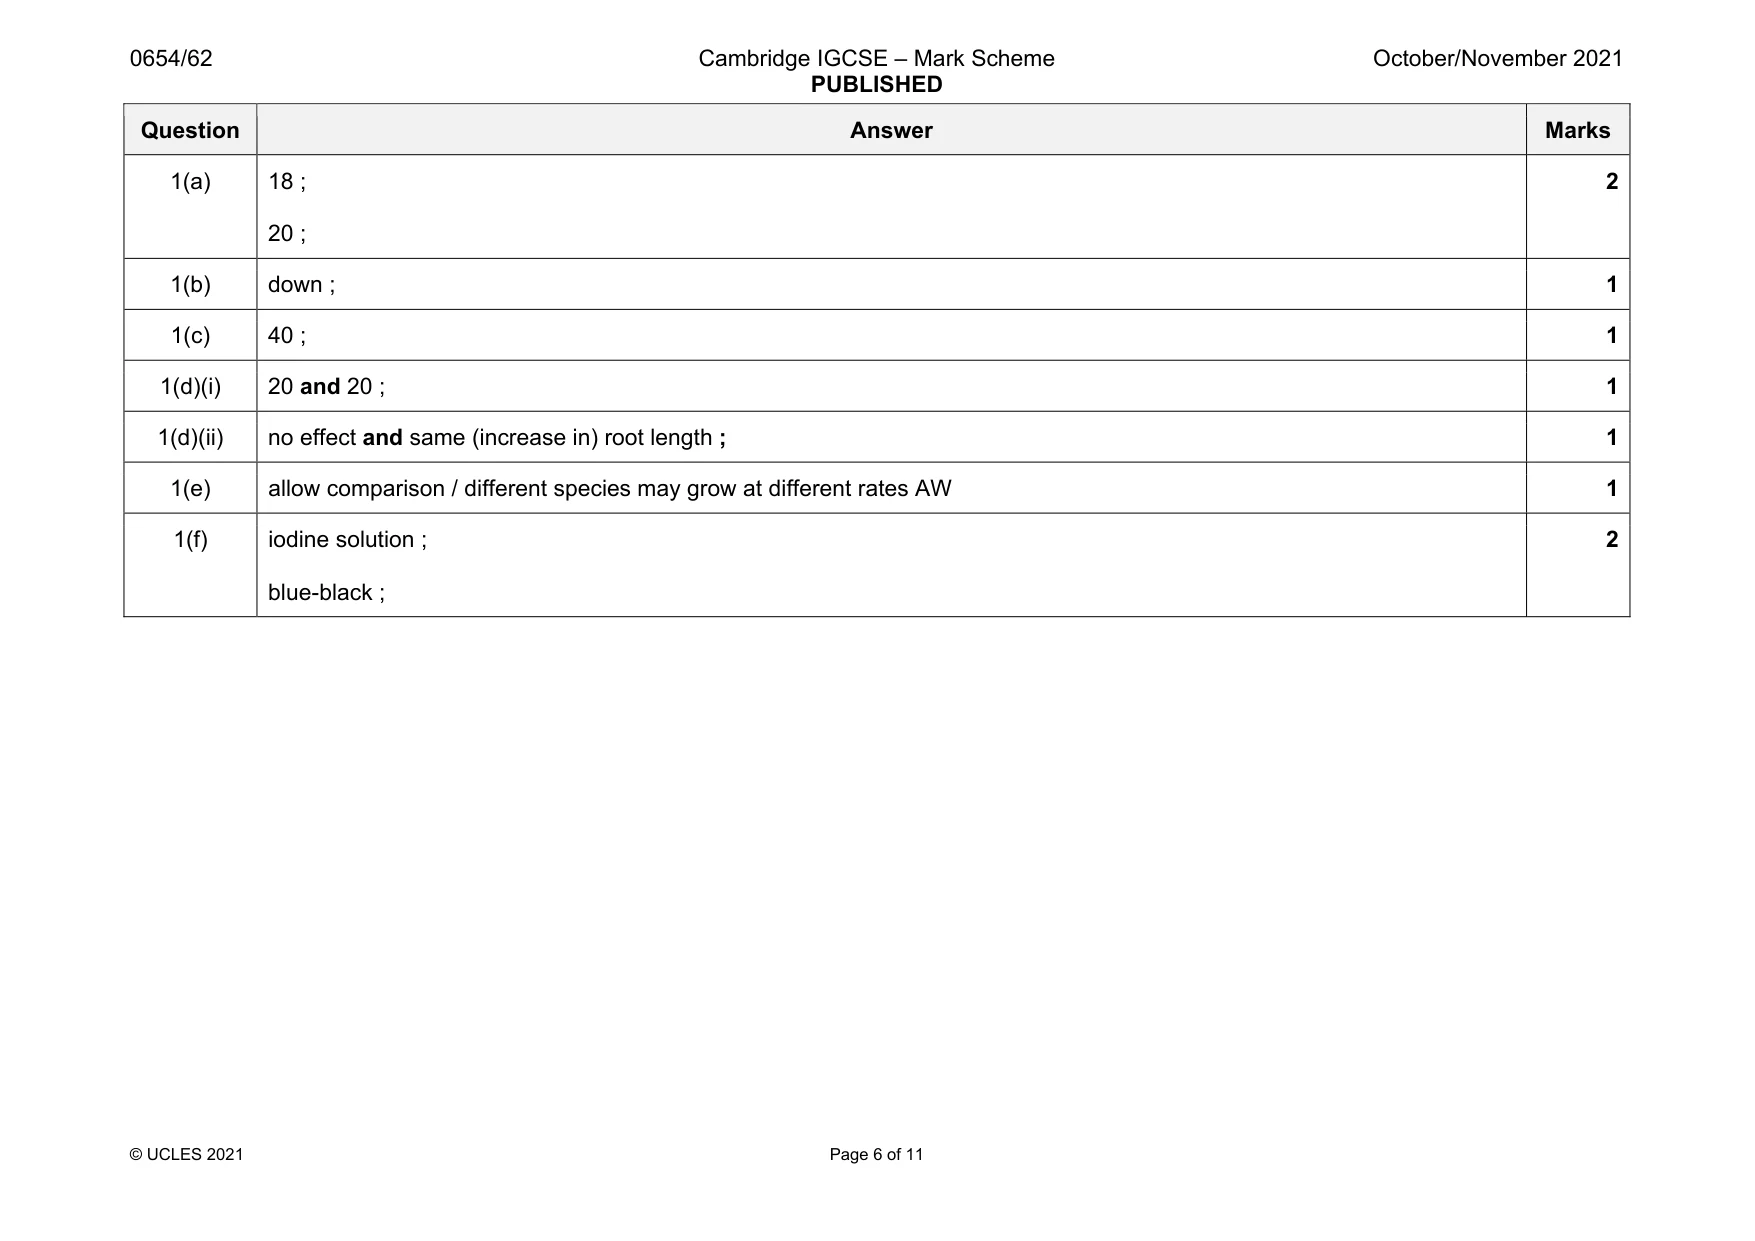
Mark scheme: 1(a) 18 ; 20 ; 2 1(b) down ; 1 1(c) 40 ; 1 1(d)(i) 20 and 20 ; 1 1(d)(ii) no effect and same (increase in) root length ; 1 1(e) allow comparison / different species may grow at different rates AW 1 1(f) iodine solution ; blue-black ; 2
Q2 · A student investigates the heart rate of Daphnia
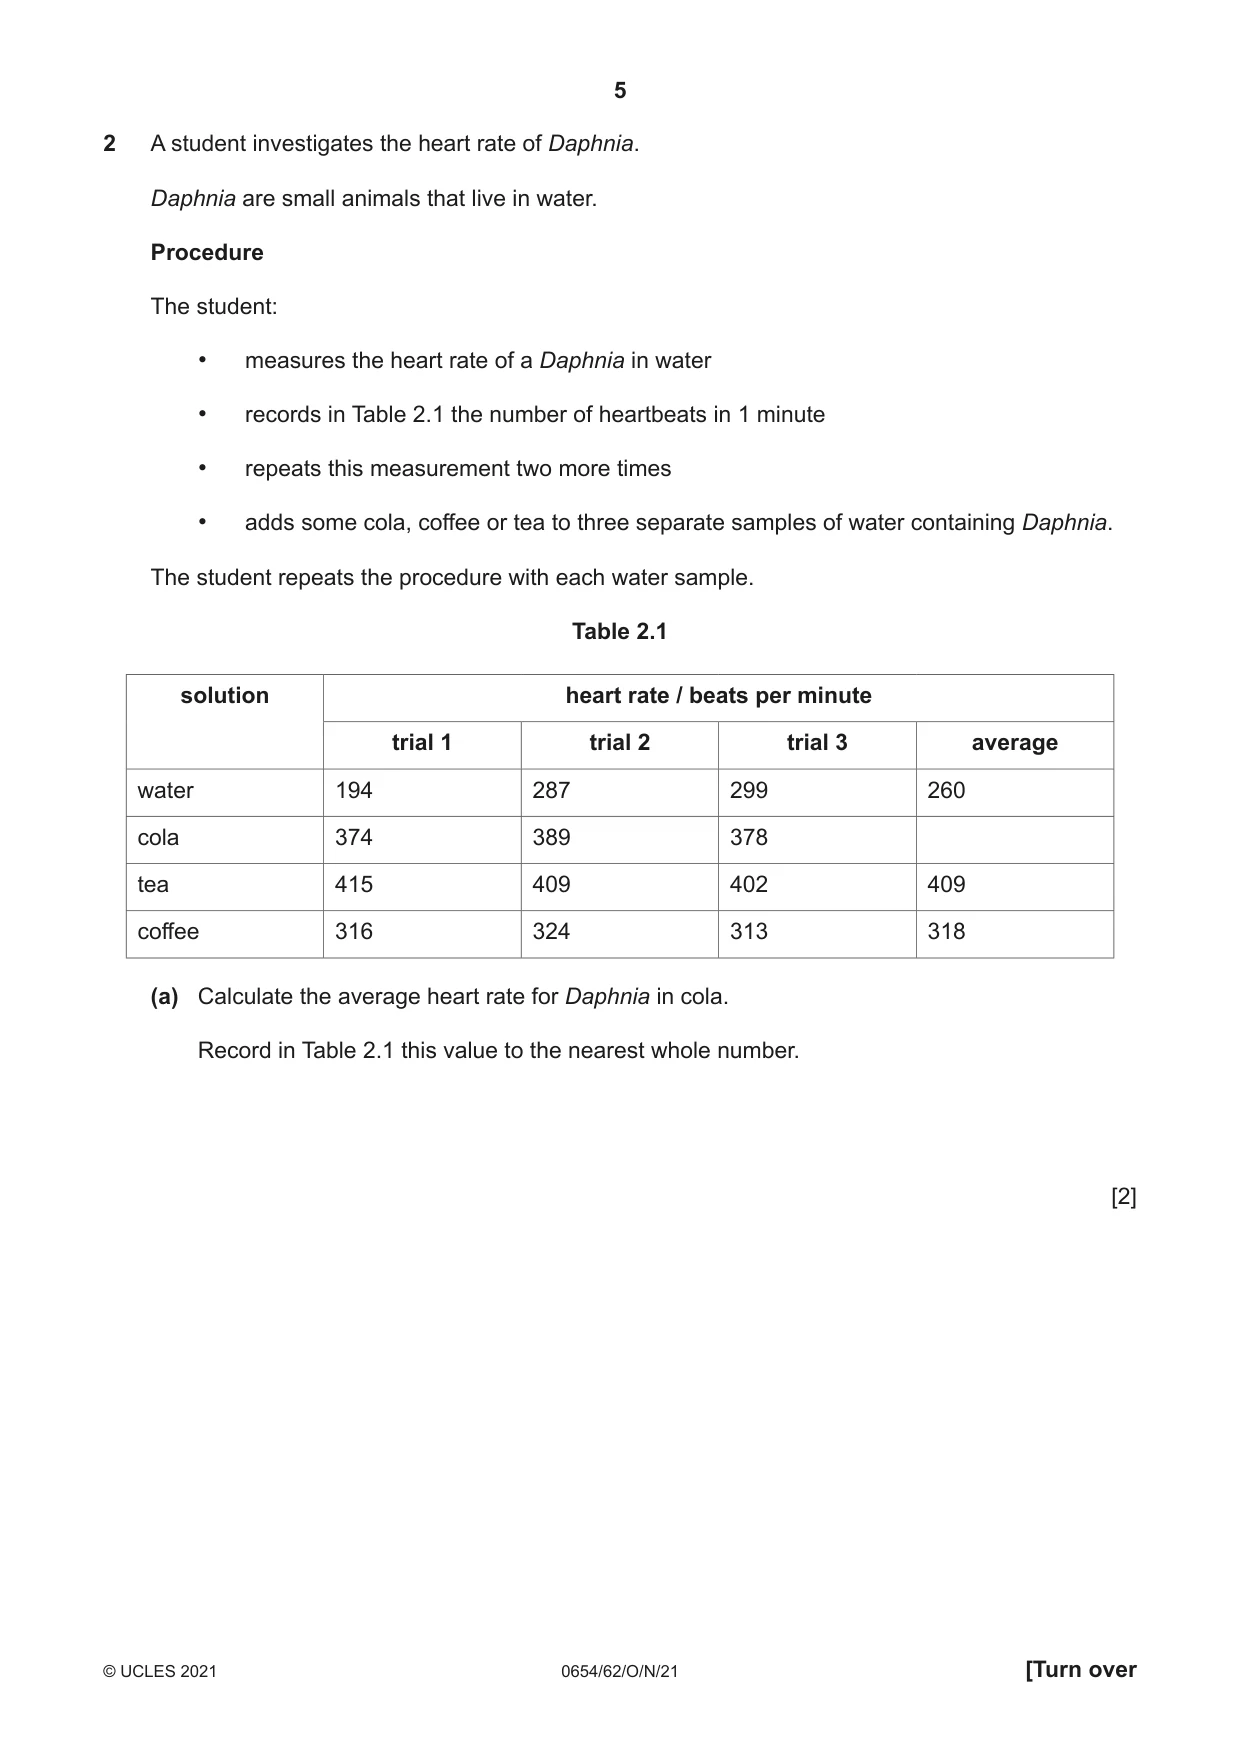
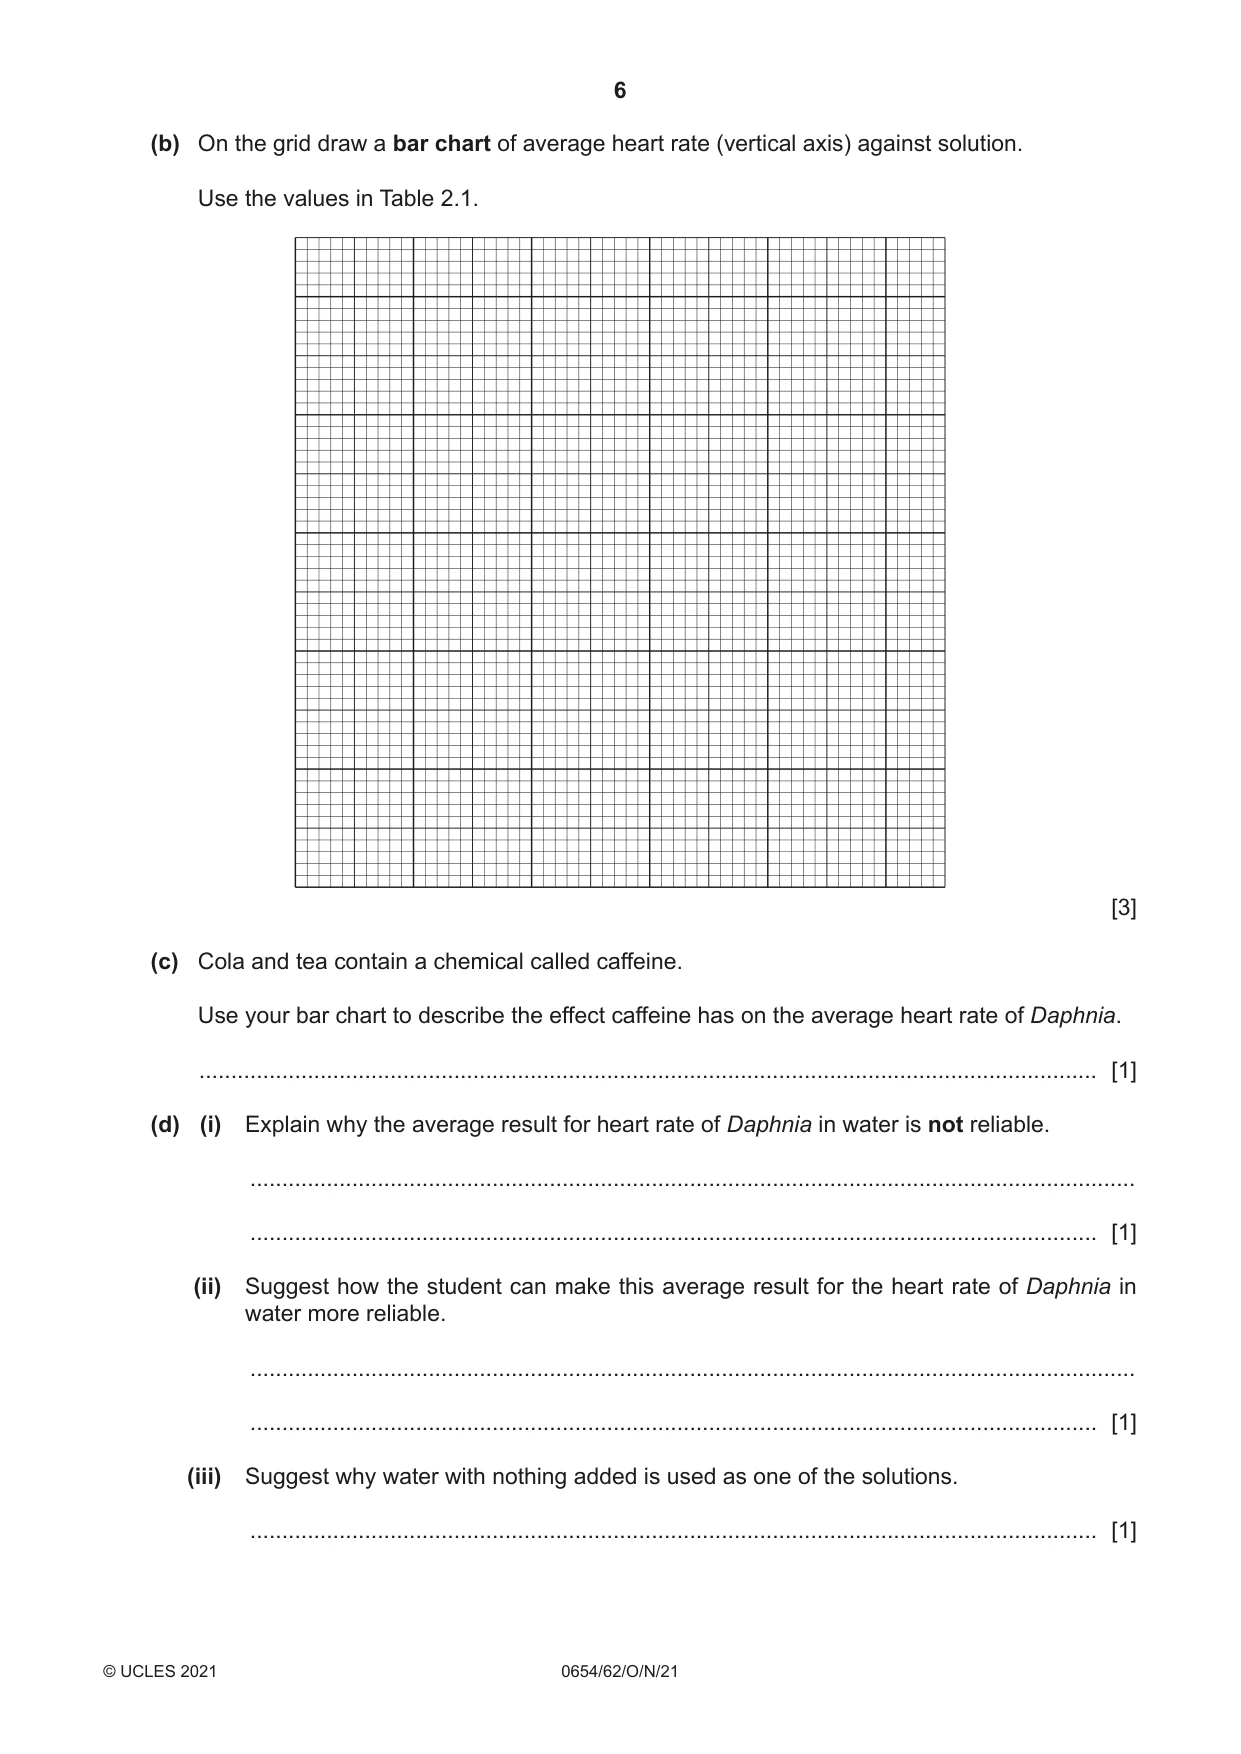
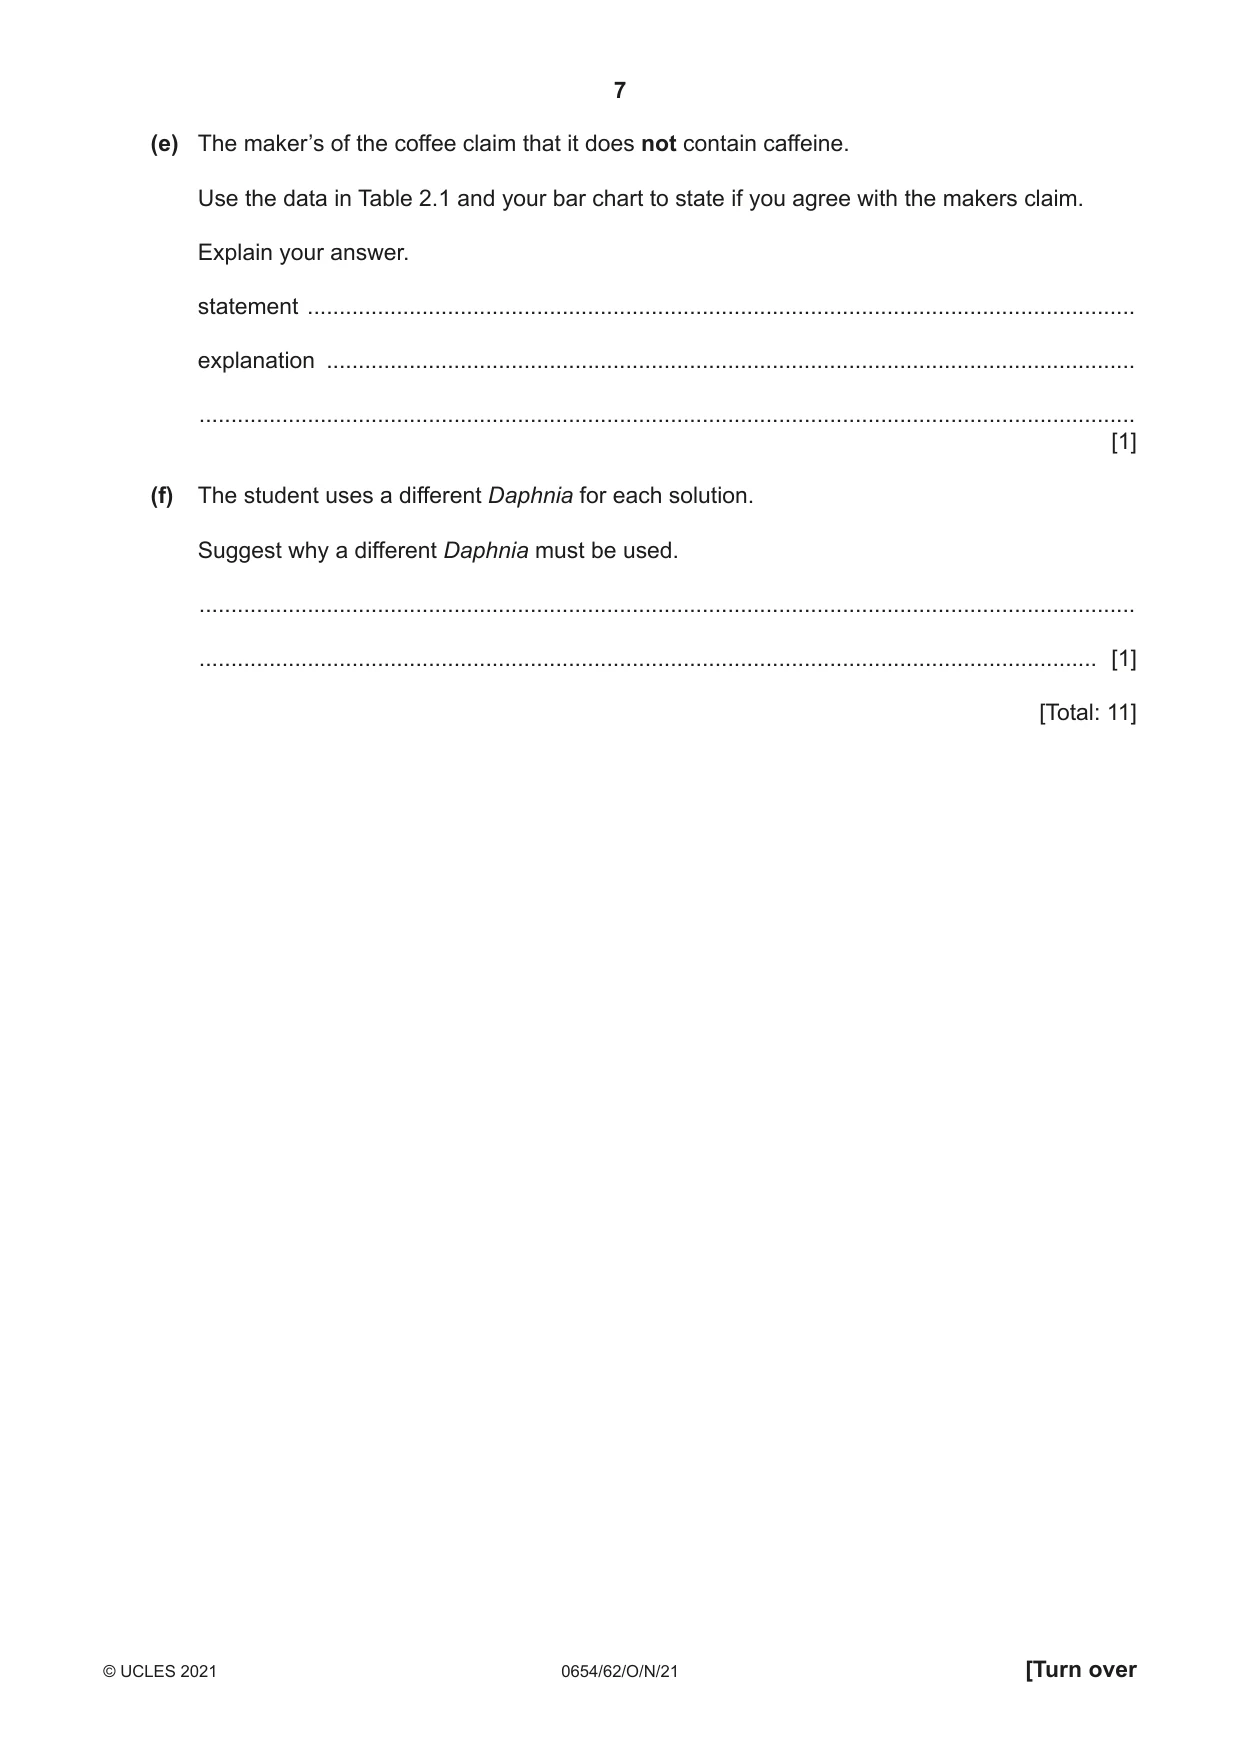
2 A student investigates the heart rate of Daphnia. Daphnia are small animals that live in water. Procedure The student: • measures the heart rate of a Daphnia in water • records in Table 2.1 the number of heartbeats in 1 minute • repeats this measurement two more times • adds some cola, coffee or tea to three separate samples of water containing Daphnia. The student repeats the procedure with each water sample. Table 2.1 solution heart rate / beats per minute trial 1 trial 2 trial 3 average water 194 287 299 260 cola 374 389 378 tea 415 409 402 409 coffee 316 324 313 318 (a) Calculate the average heart rate for Daphnia in cola. Record in Table 2.1 this value to the nearest whole number. [2] (b) On the grid draw a bar chart of average heart rate (vertical axis) against solution. Use the values in Table 2.1. [3] (c) Cola and tea contain a chemical called caffeine. Use your bar chart to describe the effect caffeine has on the average heart rate of Daphnia. ............................................................................................................................................. [1] (d) (i) Explain why the average result for heart rate of Daphnia in water is not reliable. ........................................................................................................................................... ..................................................................................................................................... [1] (ii) Suggest how the student can make this average result for the heart rate of Daphnia in water more reliable. ........................................................................................................................................... ..................................................................................................................................... [1] (iii) Suggest why water with nothing added is used as one of the solutions. ..................................................................................................................................... [1] (e) The maker’s of the coffee claim that it does not contain caffeine. Use the data in Table 2.1 and your bar chart to state if you agree with the makers claim. Explain your answer. statement .................................................................................................................................. explanation ............................................................................................................................... ................................................................................................................................................... [1] (f) The student uses a different Daphnia for each solution. Suggest why a different Daphnia must be used. ................................................................................................................................................... ............................................................................................................................................. [1] [Total: 11]
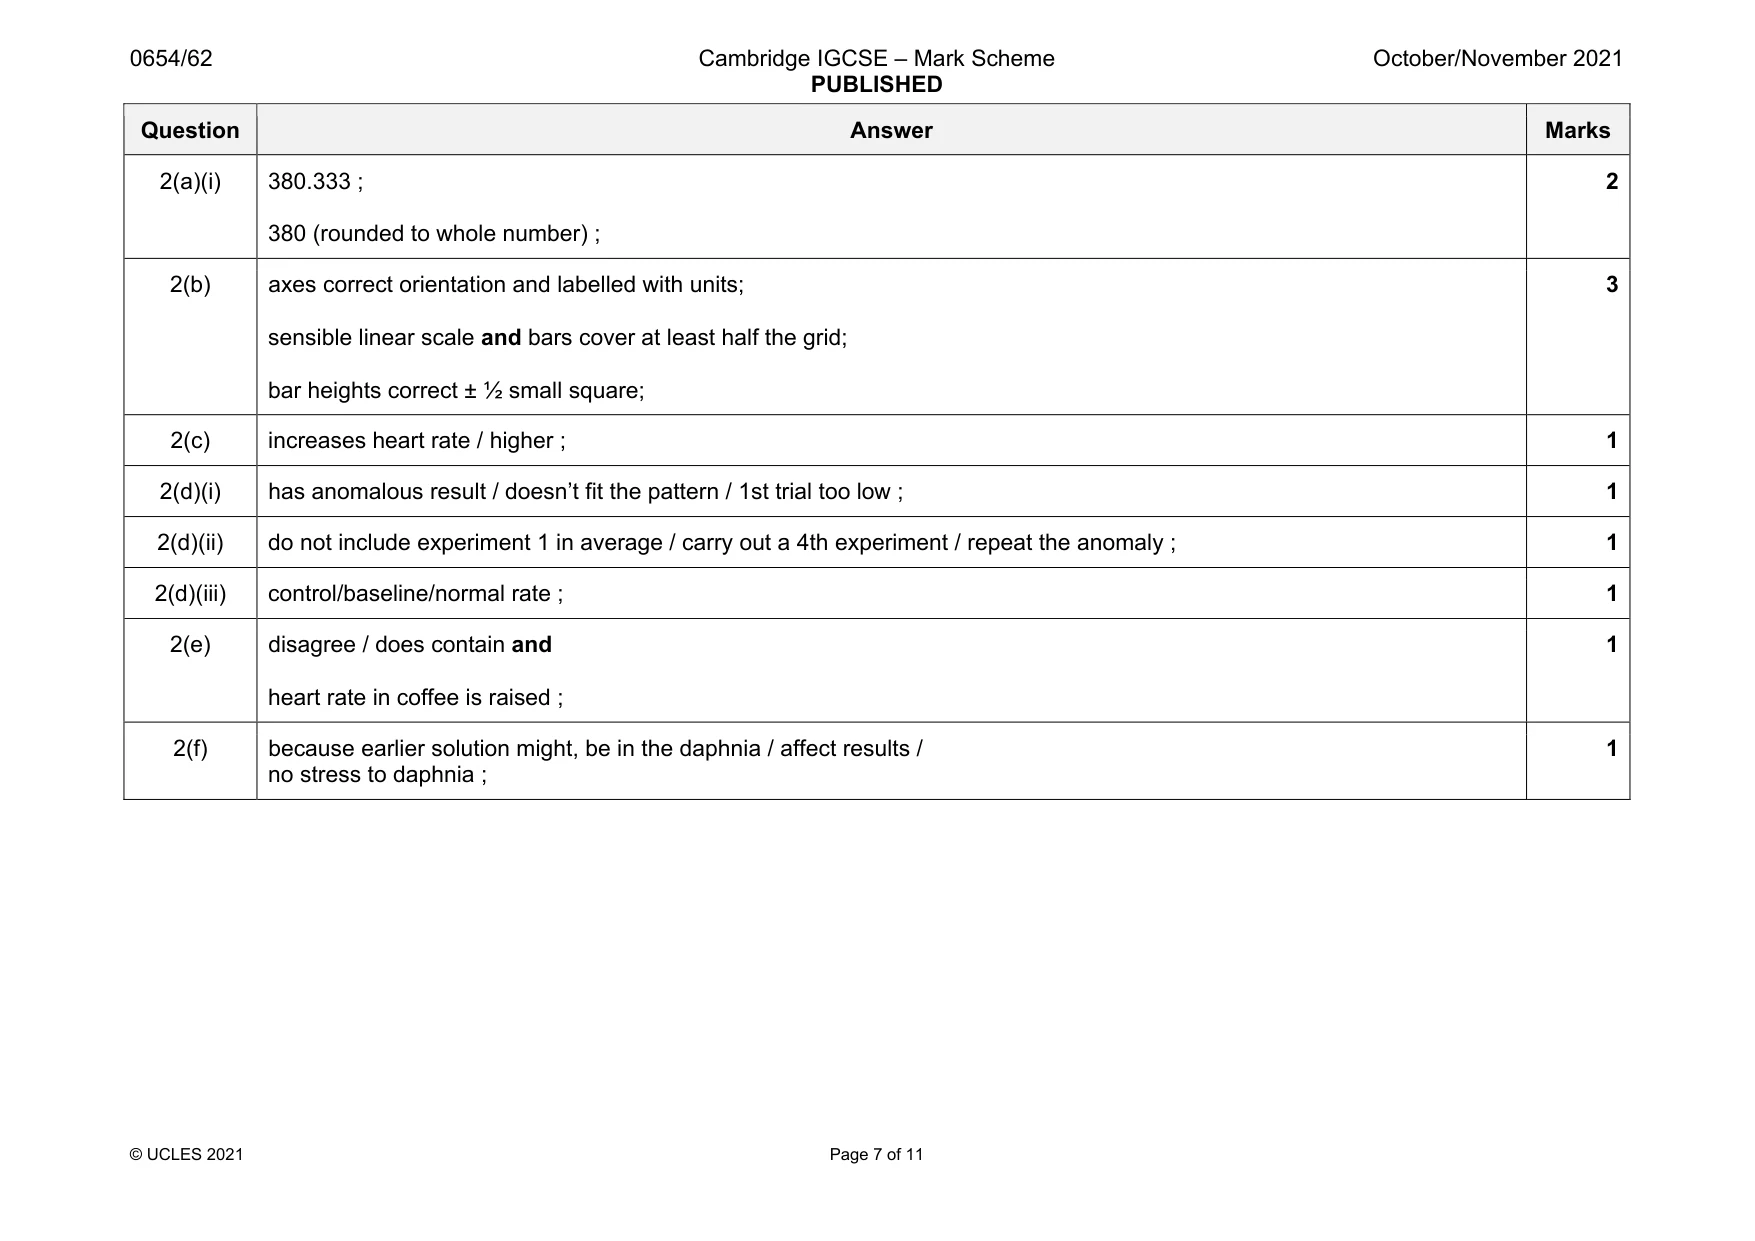
Mark scheme: 2(a)(i) 380.333 ; 380 (rounded to whole number) ; 2 2(b) axes correct orientation and labelled with units; sensible linear scale and bars cover at least half the grid; bar heights correct ± ½ small square; 3 2(c) increases heart rate / higher ; 1 2(d)(i) has anomalous result / doesn’t fit the pattern / 1st trial too low ; 1 2(d)(ii) do not include experiment 1 in average / carry out a 4th experiment / repeat the anomaly ; 1 2(d)(iii) control/baseline/normal rate ; 1 2(e) disagree / does contain and heart rate in coffee is raised ; 1 2(f) because earlier solution might, be in the daphnia / affect results / no stress to daphnia ; 1
Q3 · Carbon dioxide gas can be made from marble chips and dilute hydrochloric acid
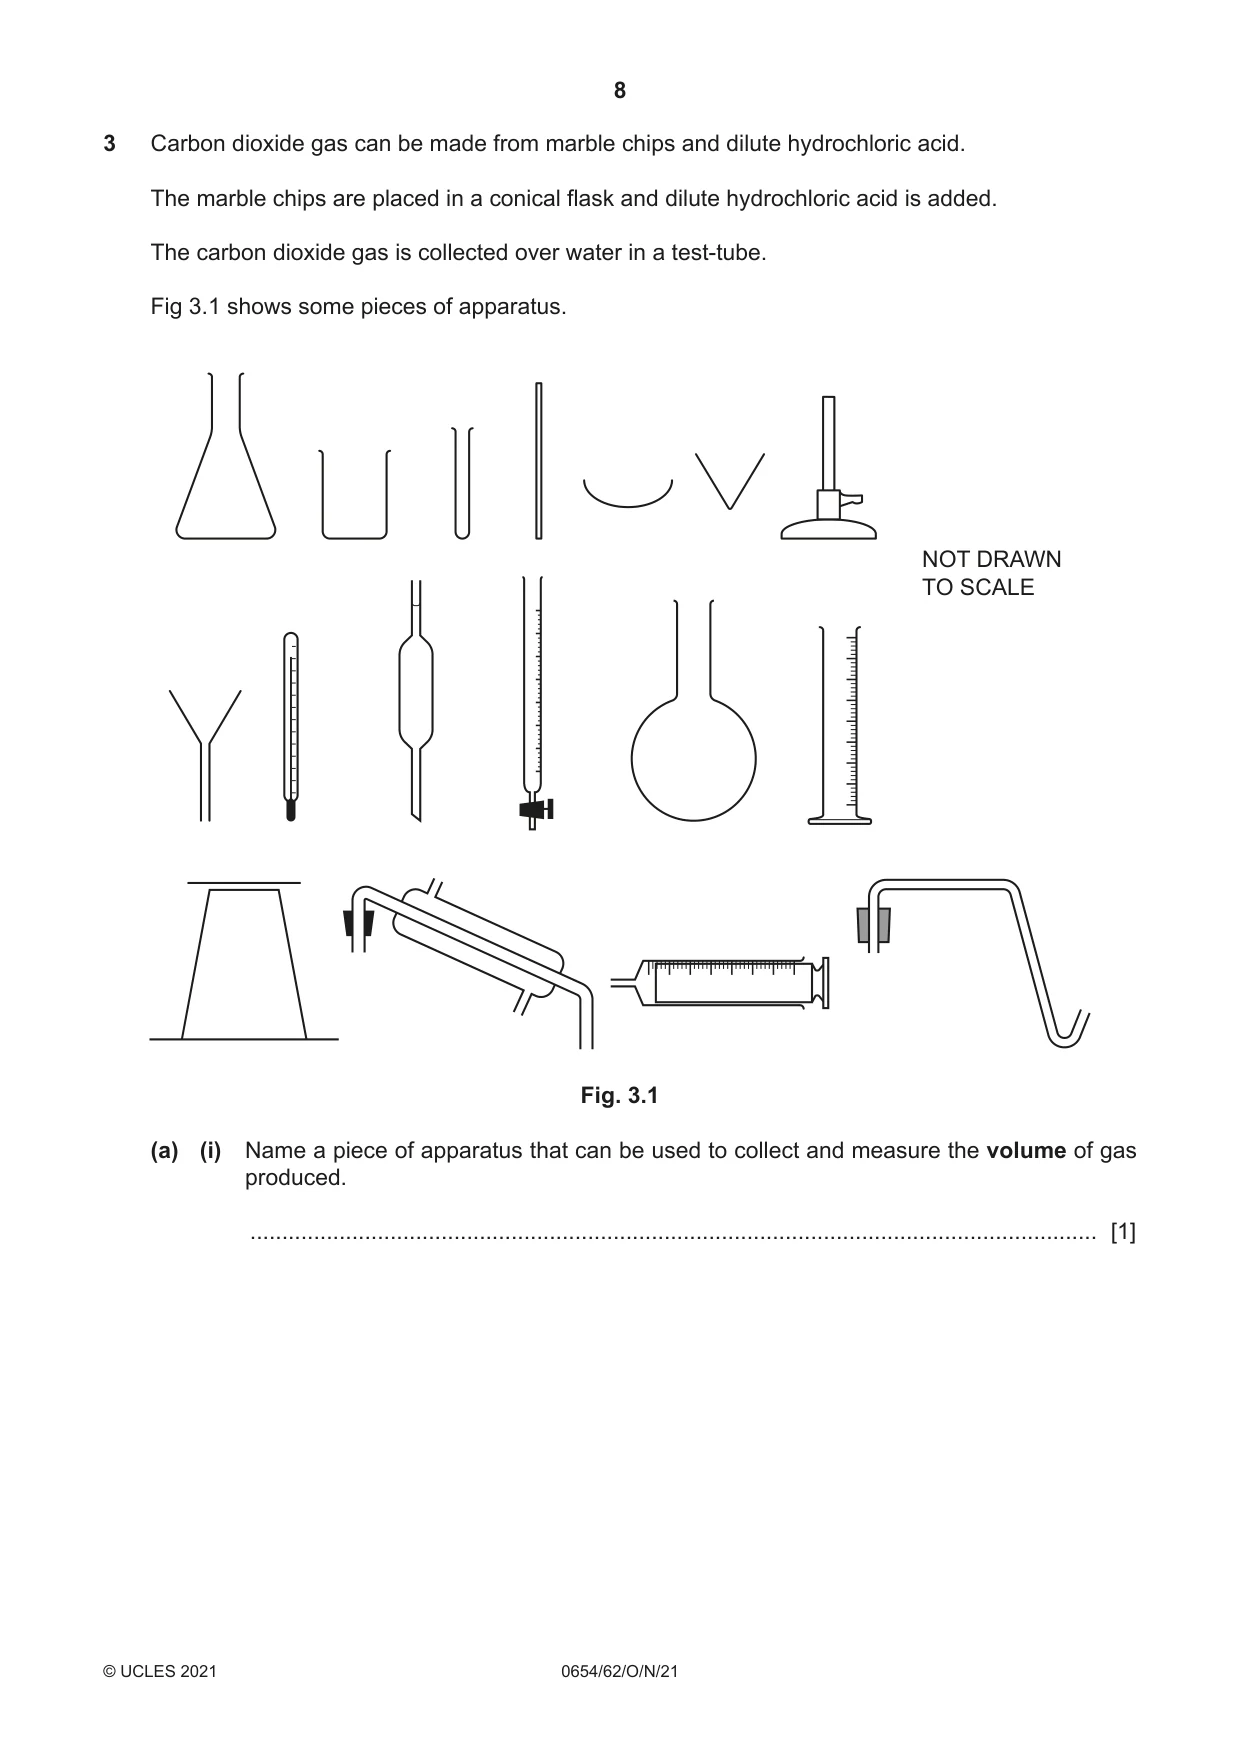
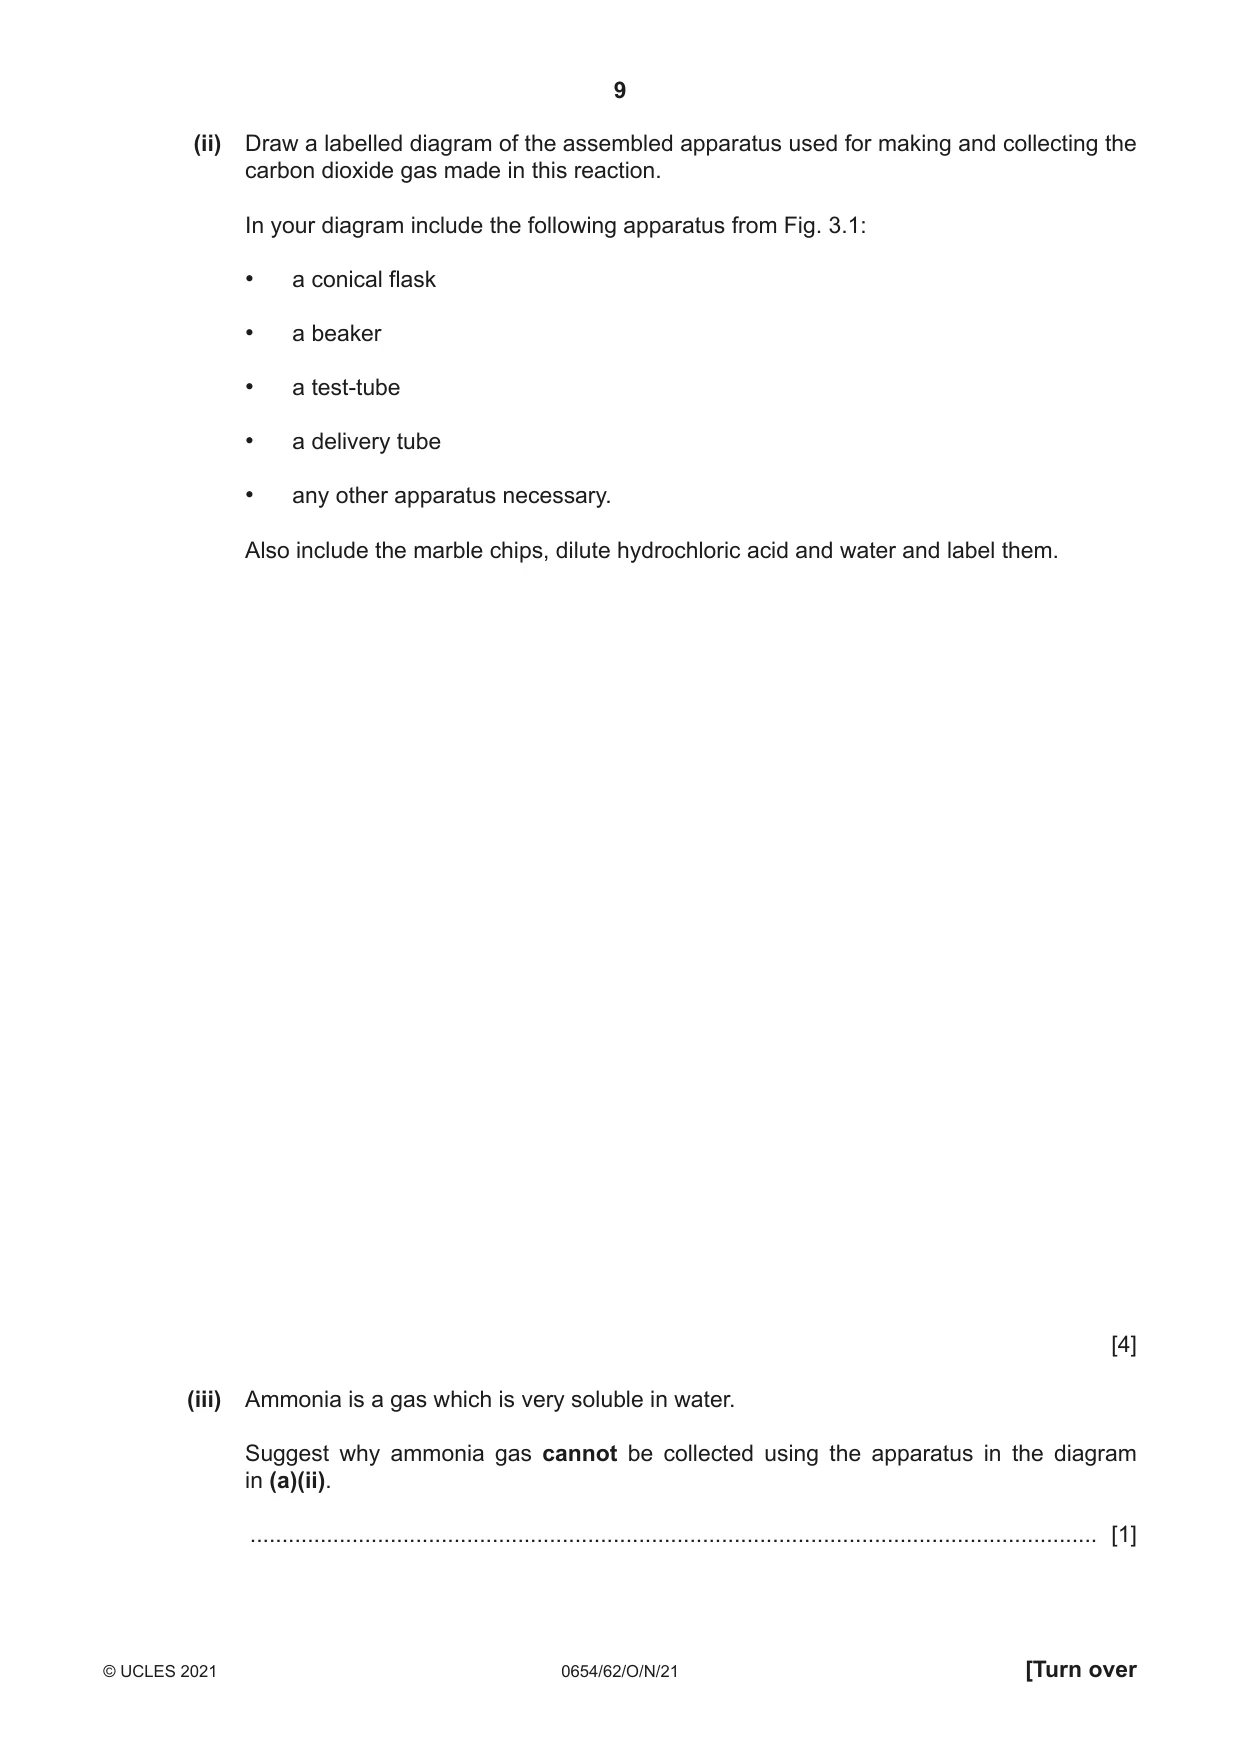
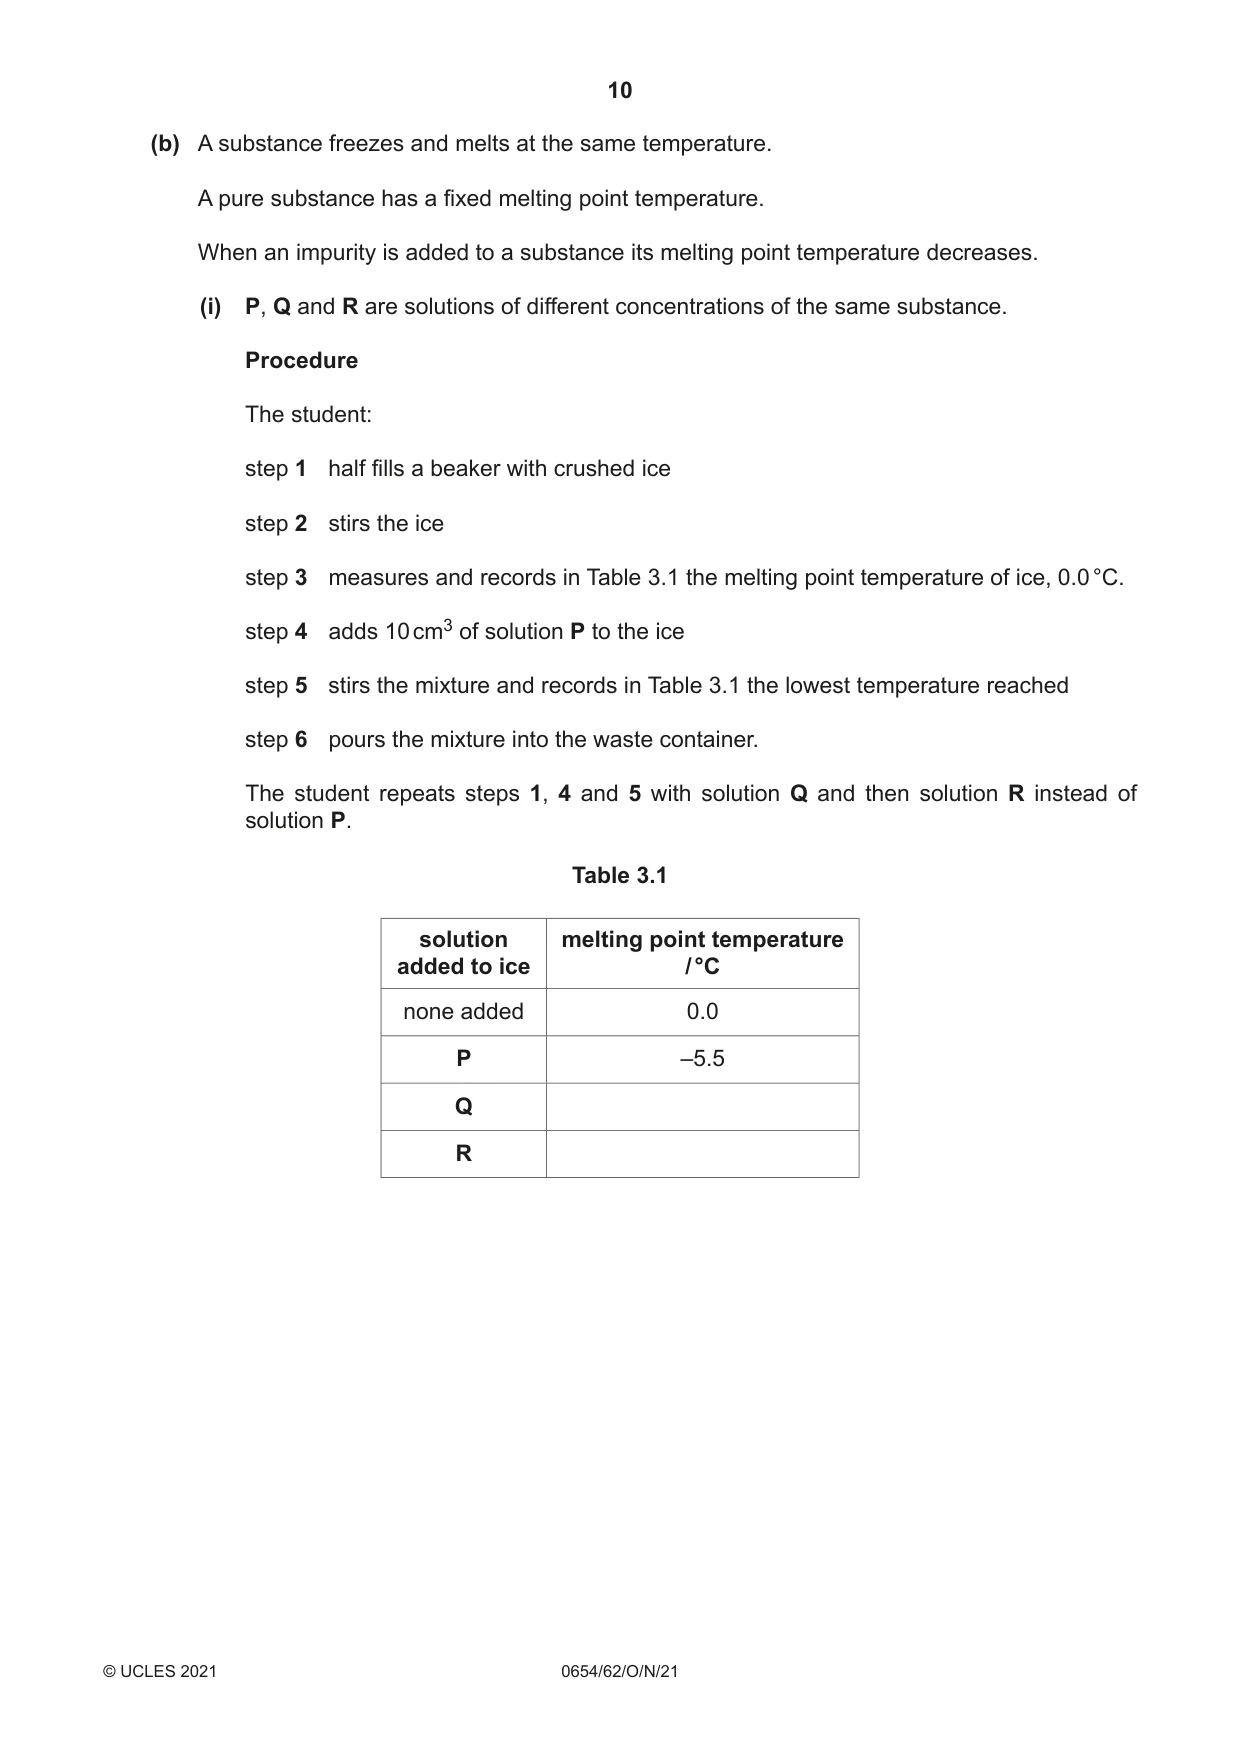
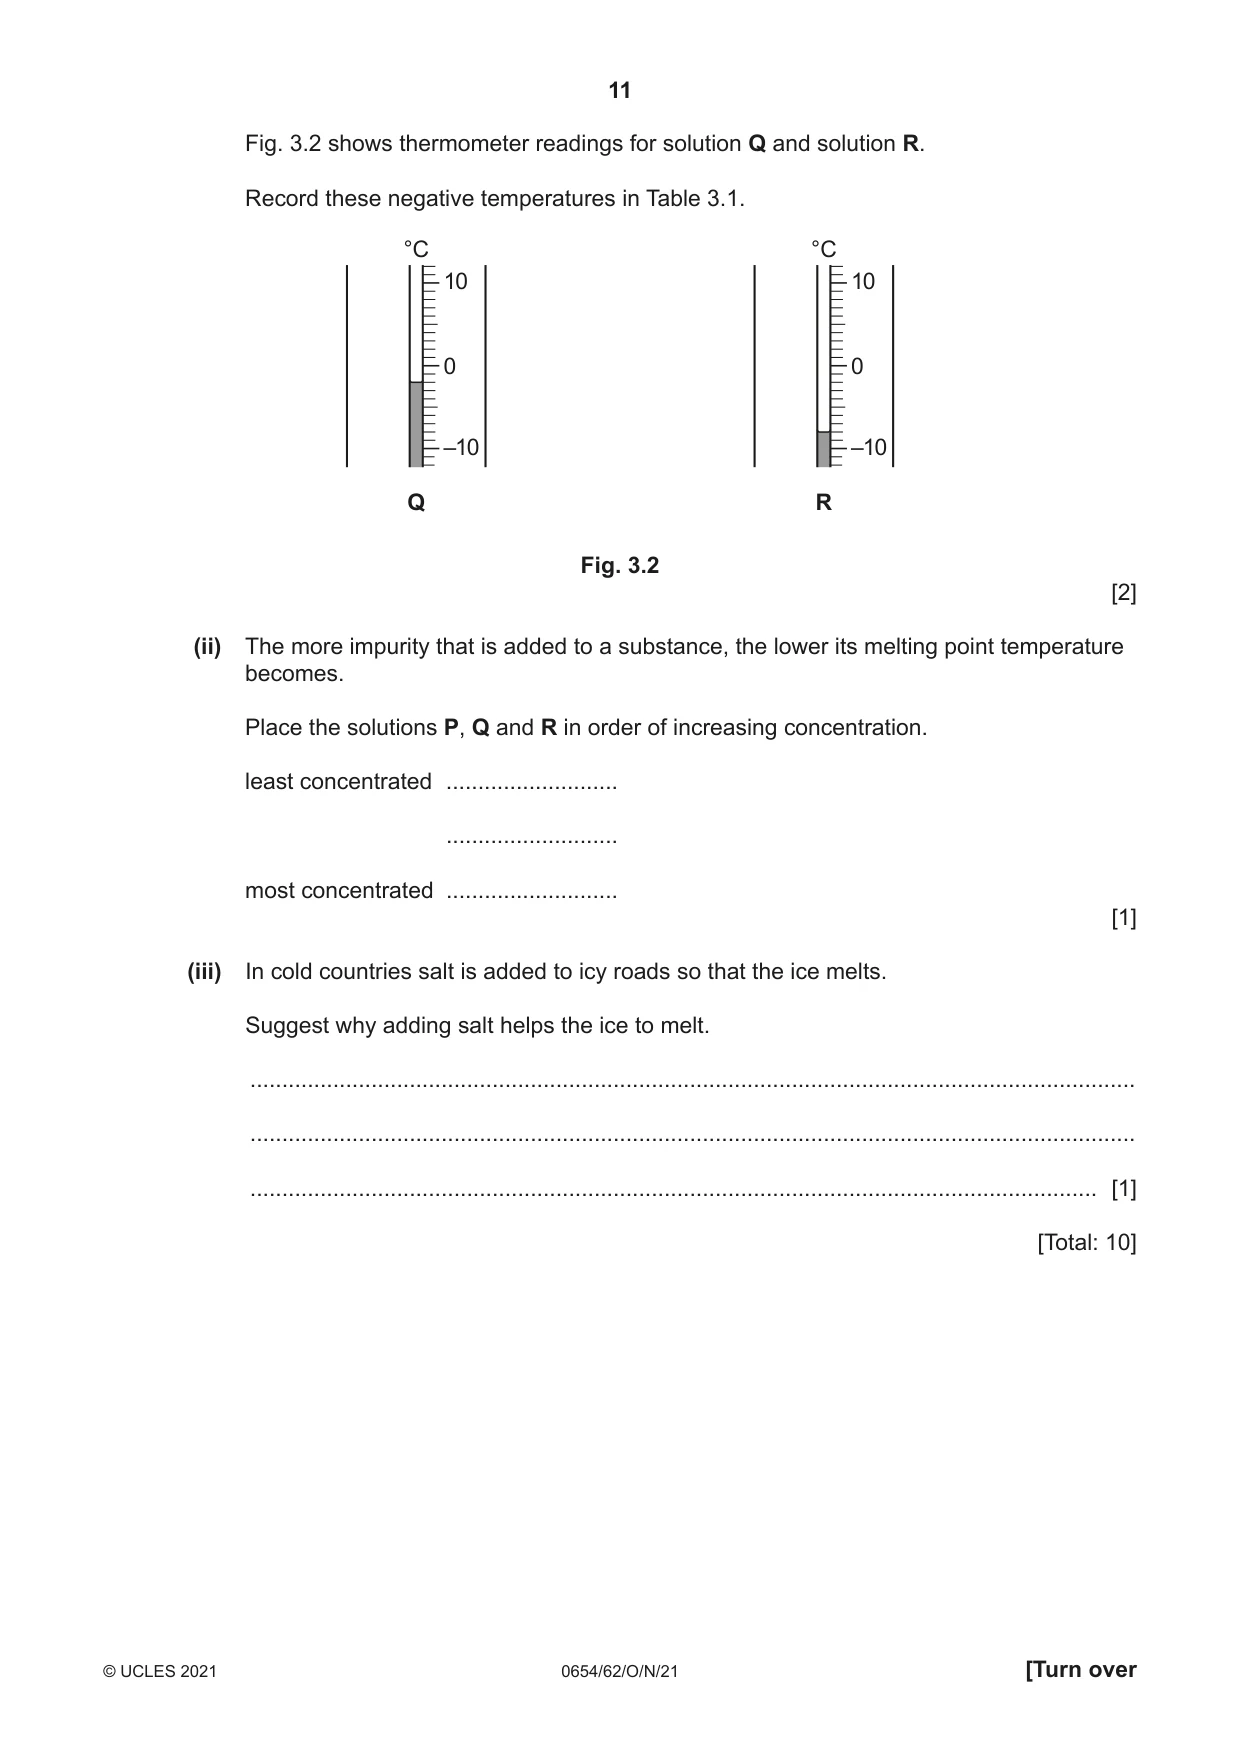
3 Carbon dioxide gas can be made from marble chips and dilute hydrochloric acid. The marble chips are placed in a conical flask and dilute hydrochloric acid is added. The carbon dioxide gas is collected over water in a test-tube. Fig 3.1 shows some pieces of apparatus. NOT DRAWN TO SCALE Fig. 3.1 (a) (i) Name a piece of apparatus that can be used to collect and measure the volume of gas produced. ..................................................................................................................................... [1] (ii) Draw a labelled diagram of the assembled apparatus used for making and collecting the carbon dioxide gas made in this reaction. In your diagram include the following apparatus from Fig. 3.1: • a conical flask • a beaker • a test-tube • a delivery tube • any other apparatus necessary. Also include the marble chips, dilute hydrochloric acid and water and label them. [4] (iii) Ammonia is a gas which is very soluble in water. Suggest why ammonia gas cannot be collected using the apparatus in the diagram in (a)(ii). ..................................................................................................................................... [1] (b) A substance freezes and melts at the same temperature. A pure substance has a fixed melting point temperature. When an impurity is added to a substance its melting point temperature decreases. (i) P, Q and R are solutions of different concentrations of the same substance. Procedure The student: step 1 half fills a beaker with crushed ice step 2 stirs the ice step 3 measures and records in Table 3.1 the melting point temperature of ice, 0.0 °C. step 4 adds 10 cm3 of solution P to the ice step 5 stirs the mixture and records in Table 3.1 the lowest temperature reached step 6 pours the mixture into the waste container. The student repeats steps 1, 4 and 5 with solution Q and then solution R instead of solution P. Table 3.1 solution melting point temperature added to ice / °C none added 0.0 P –5.5 Q R Fig. 3.2 shows thermometer readings for solution Q and solution R. Record these negative temperatures in Table 3.1. °C °C 10 10 0 0 –10 –10 Q R Fig. 3.2 [2] (ii) The more impurity that is added to a substance, the lower its melting point temperature becomes. Place the solutions P, Q and R in order of increasing concentration. least concentrated ........................... ........................... most concentrated ........................... [1] (iii) In cold countries salt is added to icy roads so that the ice melts. Suggest why adding salt helps the ice to melt. ........................................................................................................................................... ........................................................................................................................................... ..................................................................................................................................... [1] [Total: 10]
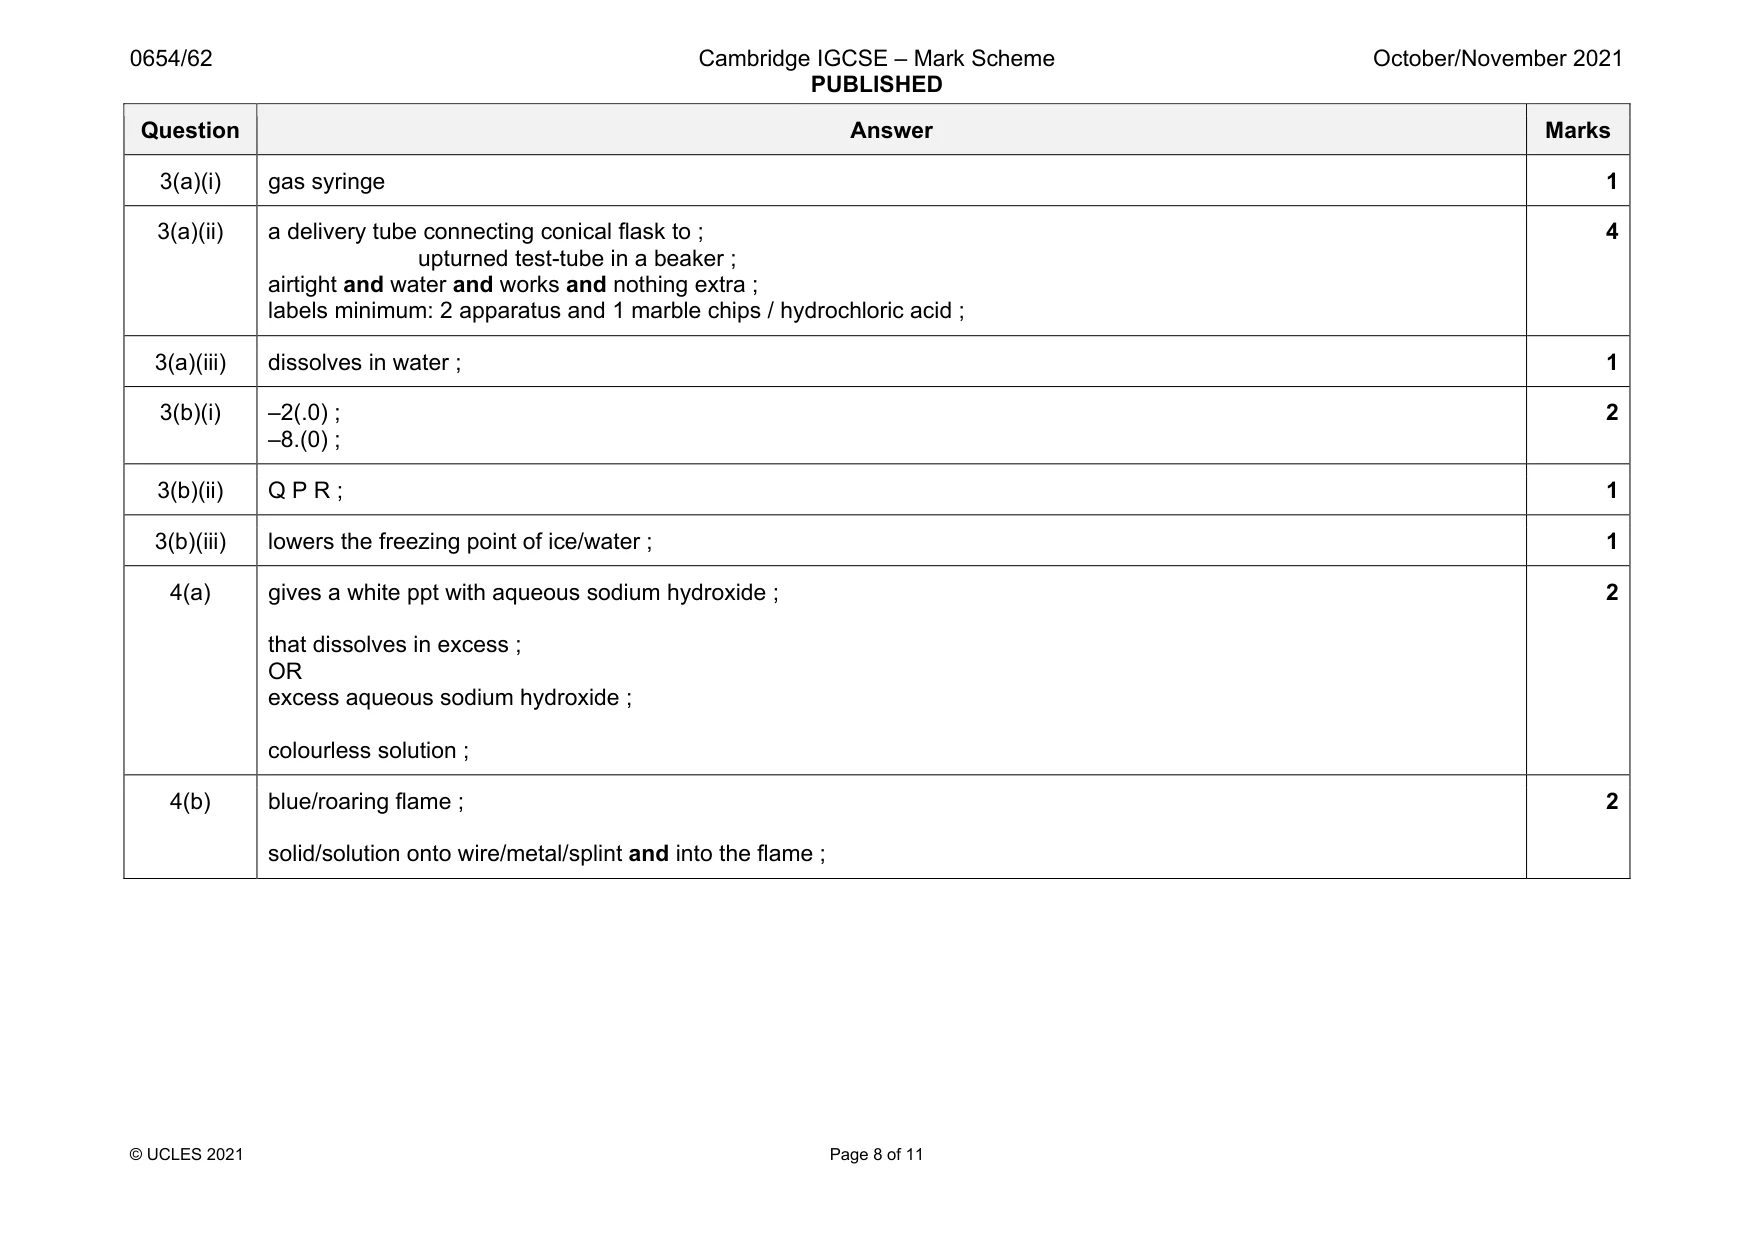
Mark scheme: 3(a)(i) gas syringe 1 3(a)(ii) a delivery tube connecting conical flask to ; upturned test-tube in a beaker ; airtight and water and works and nothing extra ; labels minimum: 2 apparatus and 1 marble chips / hydrochloric acid ; 4 3(a)(iii) dissolves in water ; 1 3(b)(i) –2(.0) ; –8.(0) ; 2 3(b)(ii) Q P R ; 1 3(b)(iii) lowers the freezing point of ice/water ; 1 2
Q4 · Solutions of the cations X2+(aq), Y2+(aq), and Z2+(aq), are each tested with aqueous…
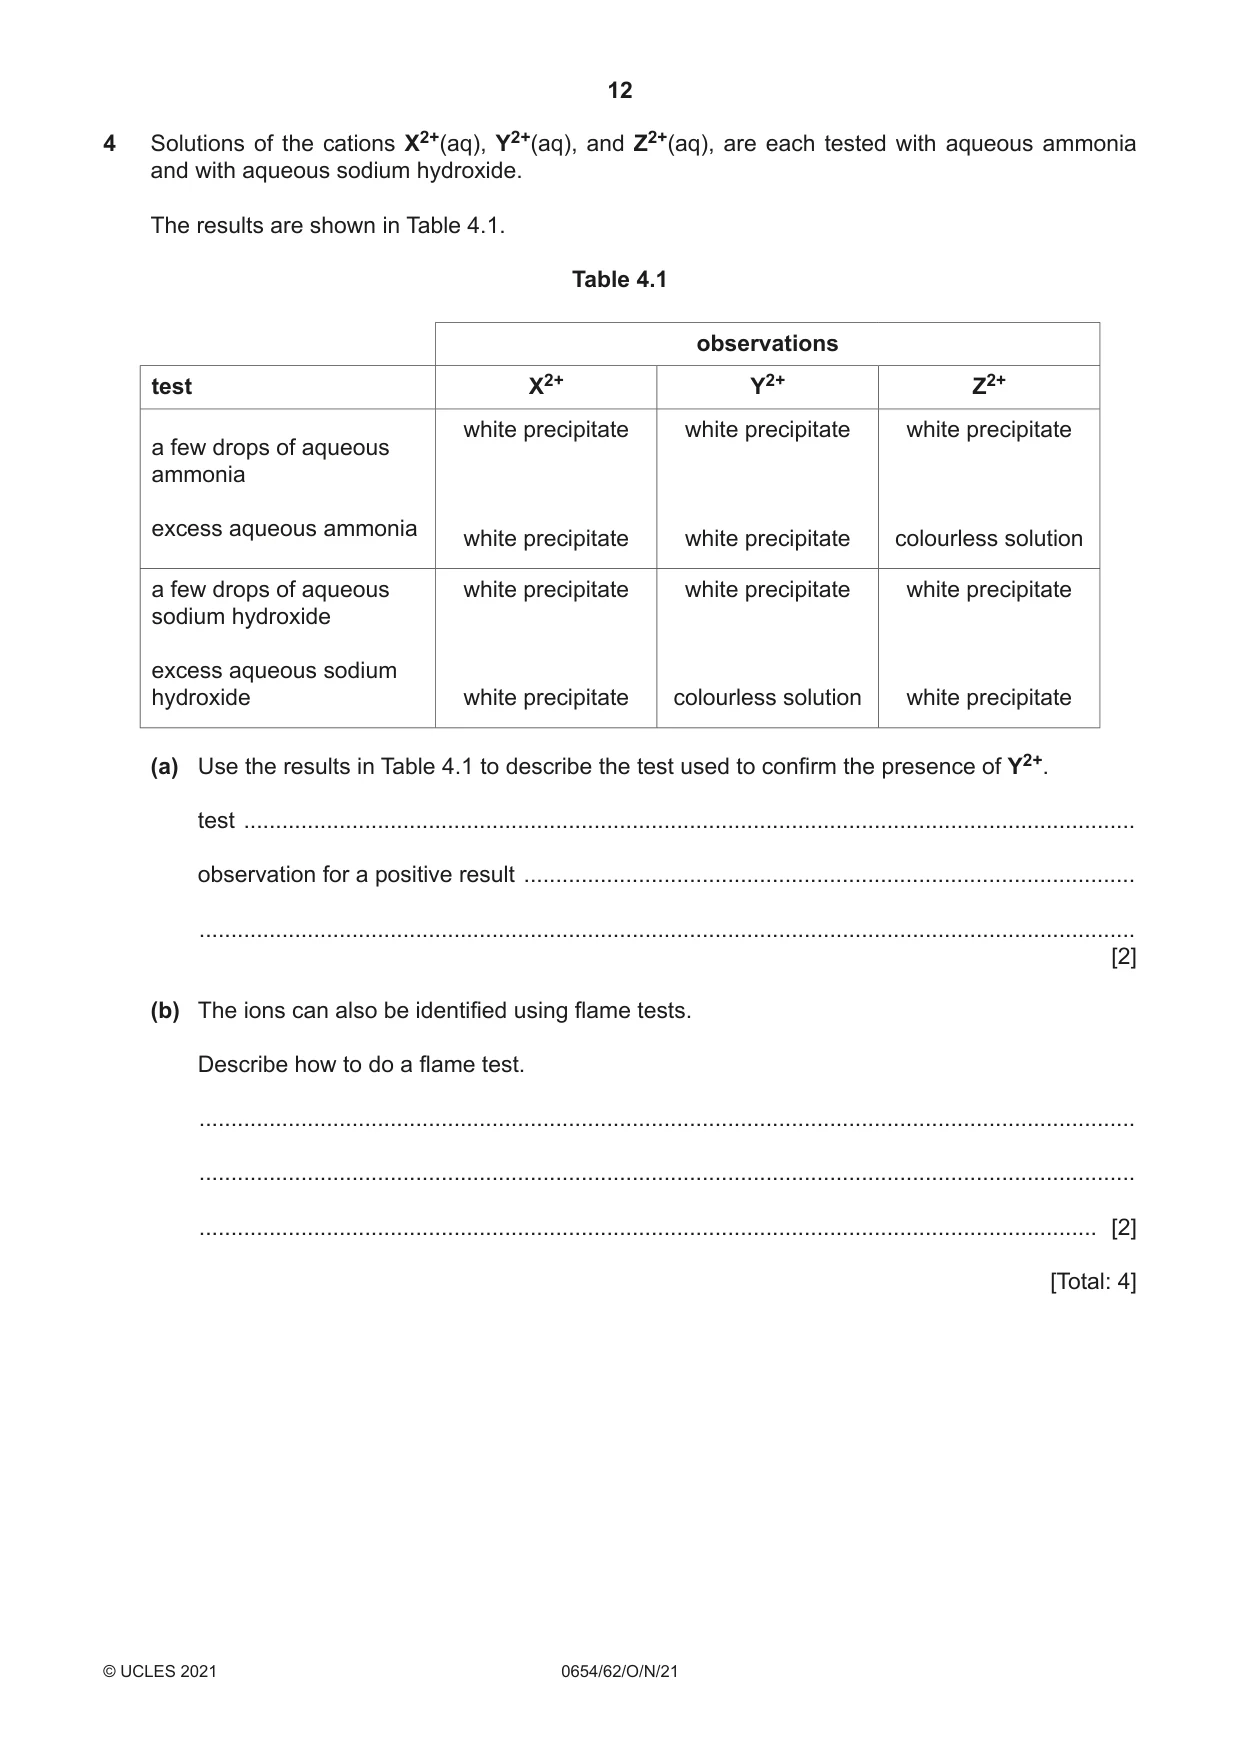
4 Solutions of the cations X2+(aq), Y2+(aq), and Z2+(aq), are each tested with aqueous ammonia and with aqueous sodium hydroxide. The results are shown in Table 4.1. Table 4.1 observations test X2+ Y2+ Z2+ white precipitate white precipitate white precipitate a few drops of aqueous ammonia excess aqueous ammonia white precipitate white precipitate colourless solution a few drops of aqueous white precipitate white precipitate white precipitate sodium hydroxide excess aqueous sodium hydroxide white precipitate colourless solution white precipitate (a) Use the results in Table 4.1 to describe the test used to confirm the presence of Y2+. test ............................................................................................................................................ observation for a positive result ................................................................................................ ................................................................................................................................................... [2] (b) The ions can also be identified using flame tests. Describe how to do a flame test. ................................................................................................................................................... ................................................................................................................................................... ............................................................................................................................................. [2] [Total: 4]
Mark scheme: 4(a) gives a white ppt with aqueous sodium hydroxide ; that dissolves in excess ; OR excess aqueous sodium hydroxide ; colourless solution ; 4(b) blue/roaring flame ; solid/solution onto wire/metal/splint and into the flame ; 2
Q5 · A hard candy (sweet) contains soluble colourings
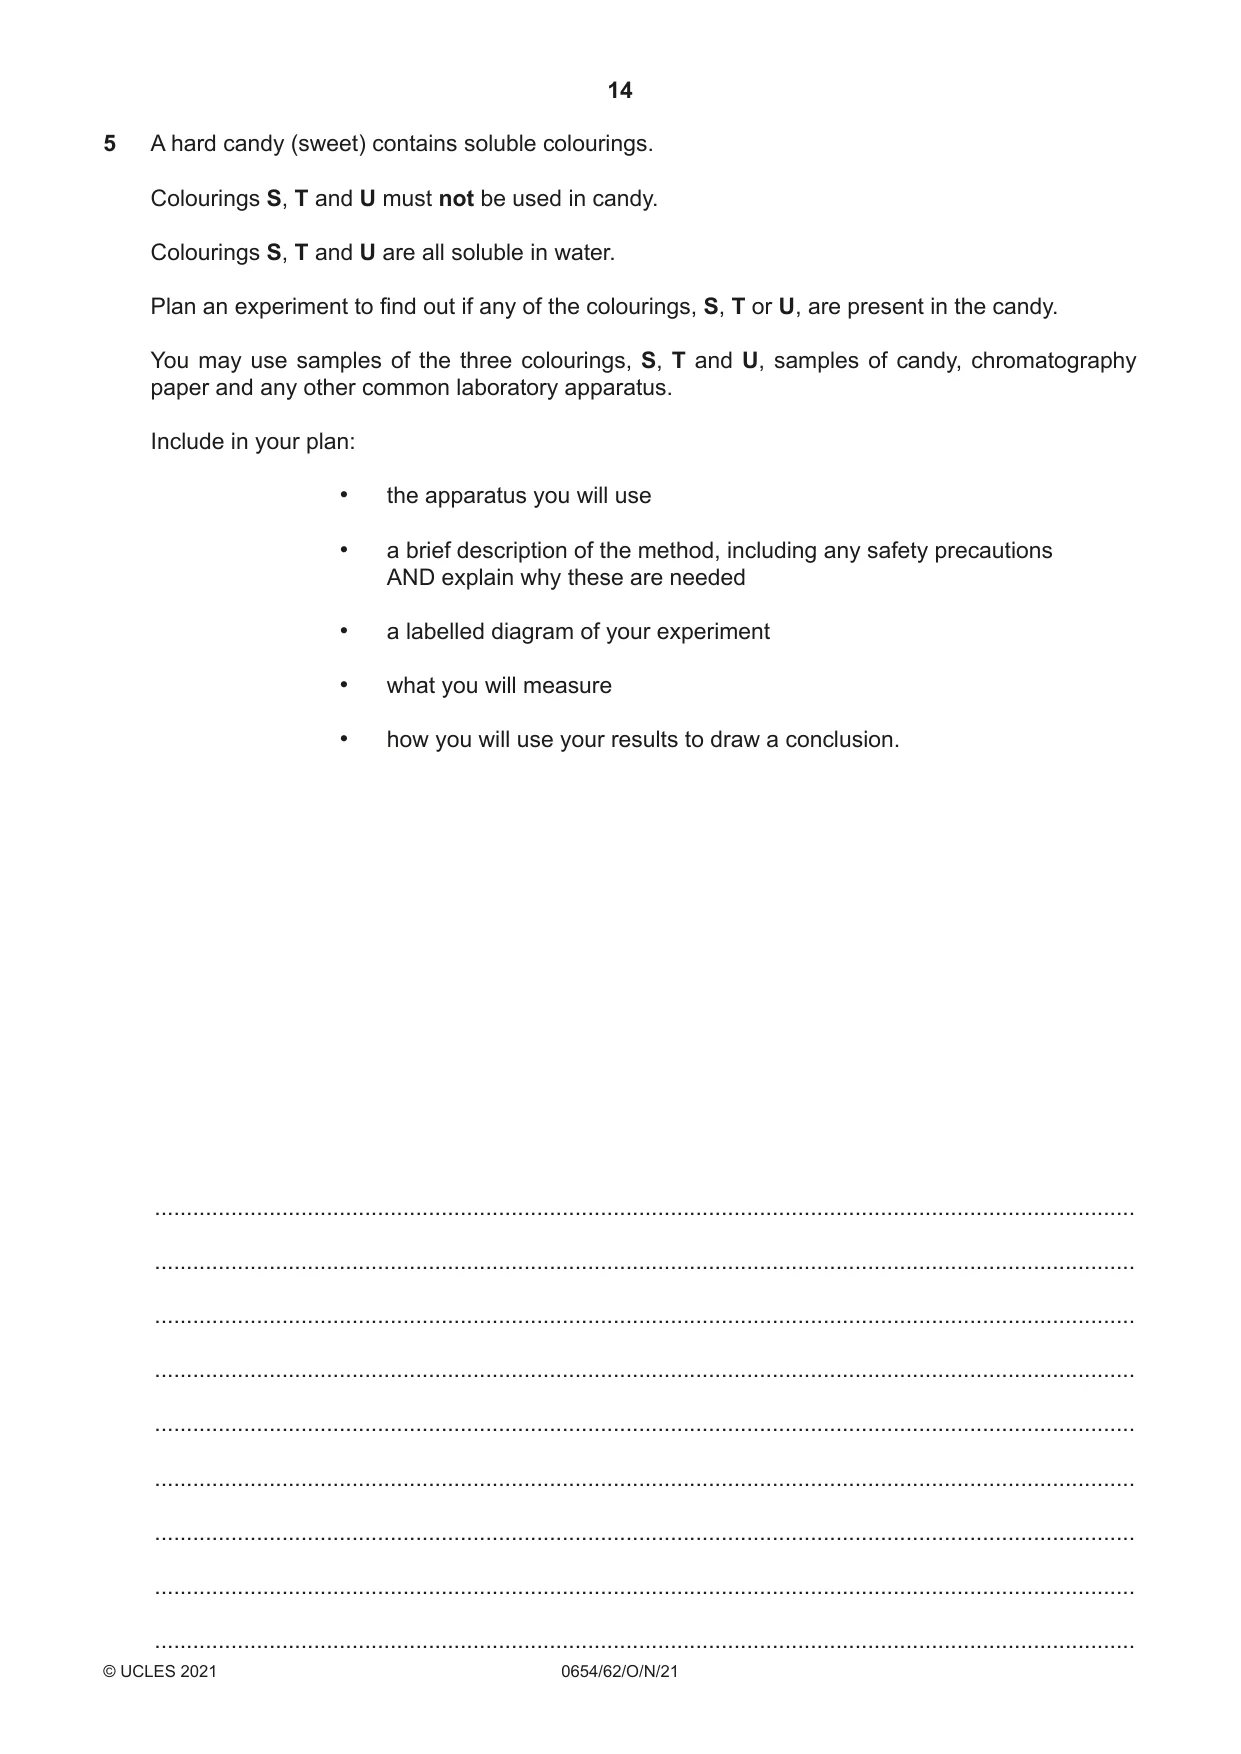
5 A hard candy (sweet) contains soluble colourings. Colourings S, T and U must not be used in candy. Colourings S, T and U are all soluble in water. Plan an experiment to find out if any of the colourings, S, T or U, are present in the candy. You may use samples of the three colourings, S, T and U, samples of candy, chromatography paper and any other common laboratory apparatus. Include in your plan: • the apparatus you will use • a brief description of the method, including any safety precautions AND explain why these are needed • a labelled diagram of your experiment • what you will measure • how you will use your results to draw a conclusion. .......................................................................................................................................................... .......................................................................................................................................................... .......................................................................................................................................................... .......................................................................................................................................................... .......................................................................................................................................................... .......................................................................................................................................................... .......................................................................................................................................................... .......................................................................................................................................................... .......................................................................................................................................................... .......................................................................................................................................................... .......................................................................................................................................................... .......................................................................................................................................................... .......................................................................................................................................................... .......................................................................................................................................................... .................................................................................................................................................... [7]
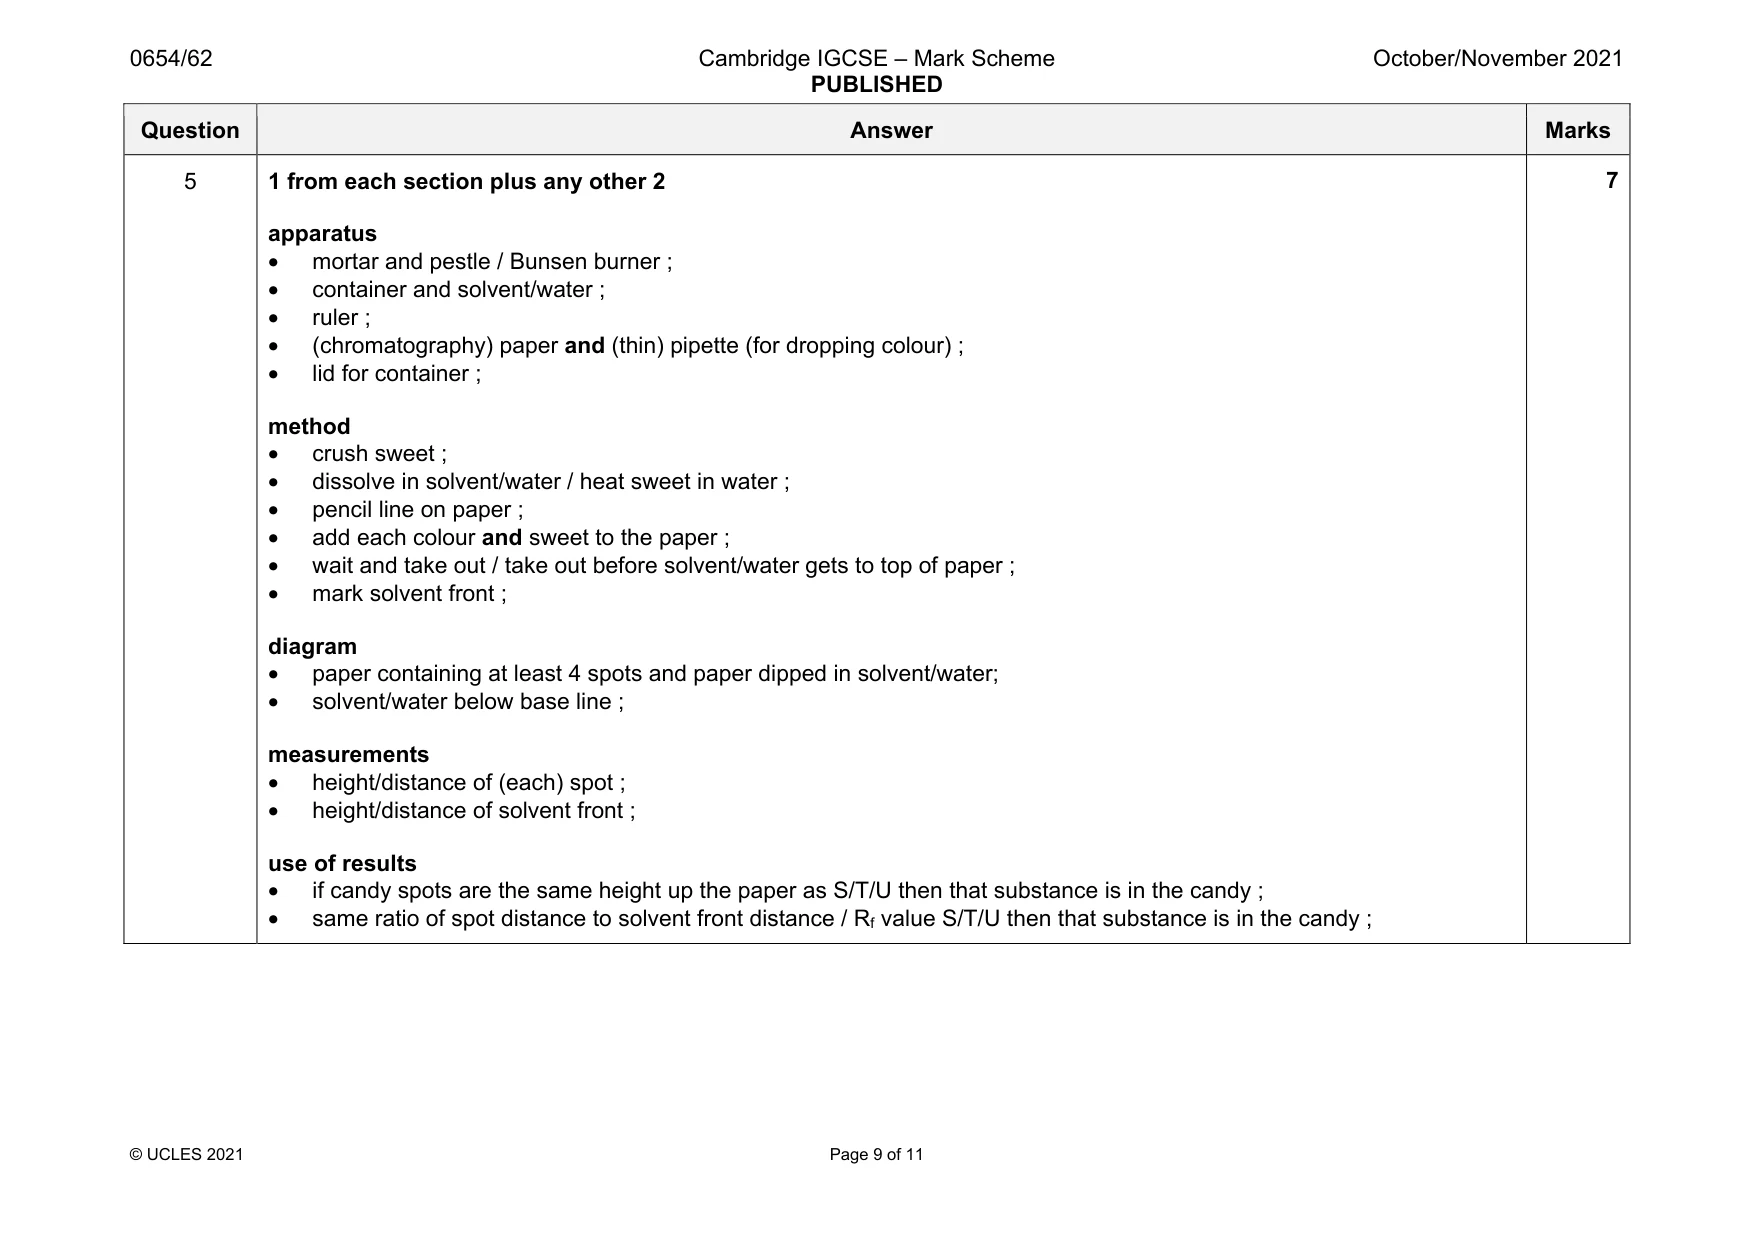
Mark scheme: 5 1 from each section plus any other 2 apparatus • mortar and pestle / Bunsen burner ; • container and solvent/water ; • ruler ; • (chromatography) paper and (thin) pipette (for dropping colour) ; • lid for container ; method • crush sweet ; • dissolve in solvent/water / heat sweet in water ; • pencil line on paper ; • add each colour and sweet to the paper ; • wait and take out / take out before solvent/water gets to top of paper ; • mark solvent front ; diagram • paper containing at least 4 spots and paper dipped in solvent/water; • solvent/water below base line ; measurements • height/distance of (each) spot ; • height/distance of solvent front ; use of results • if candy spots are the same height up the paper as S/T/U then that substance is in the candy ; • same ratio of spot distance to solvent front distance / Rf value S/T/U then that substance is in the candy ;
Q6 · A student investigates the rate of cooling of hot water in a beaker
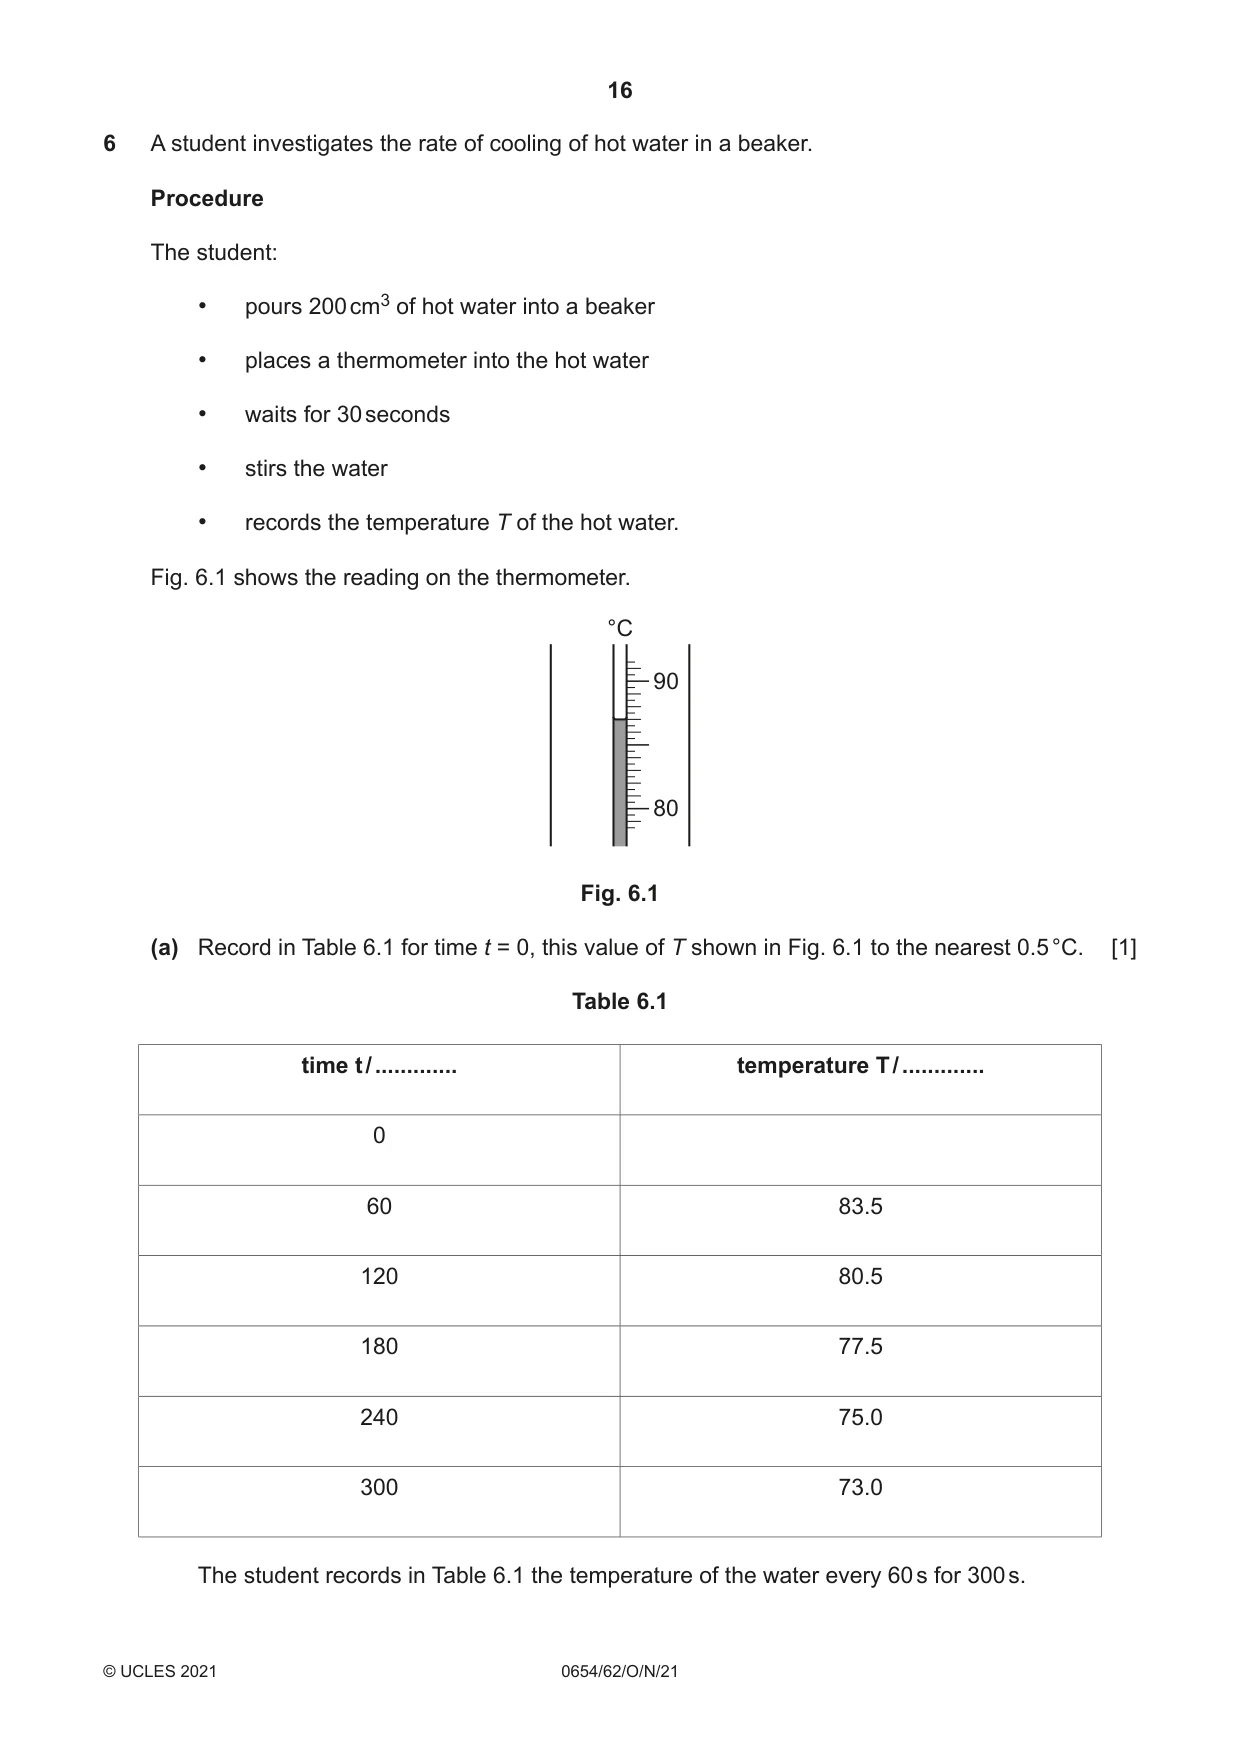
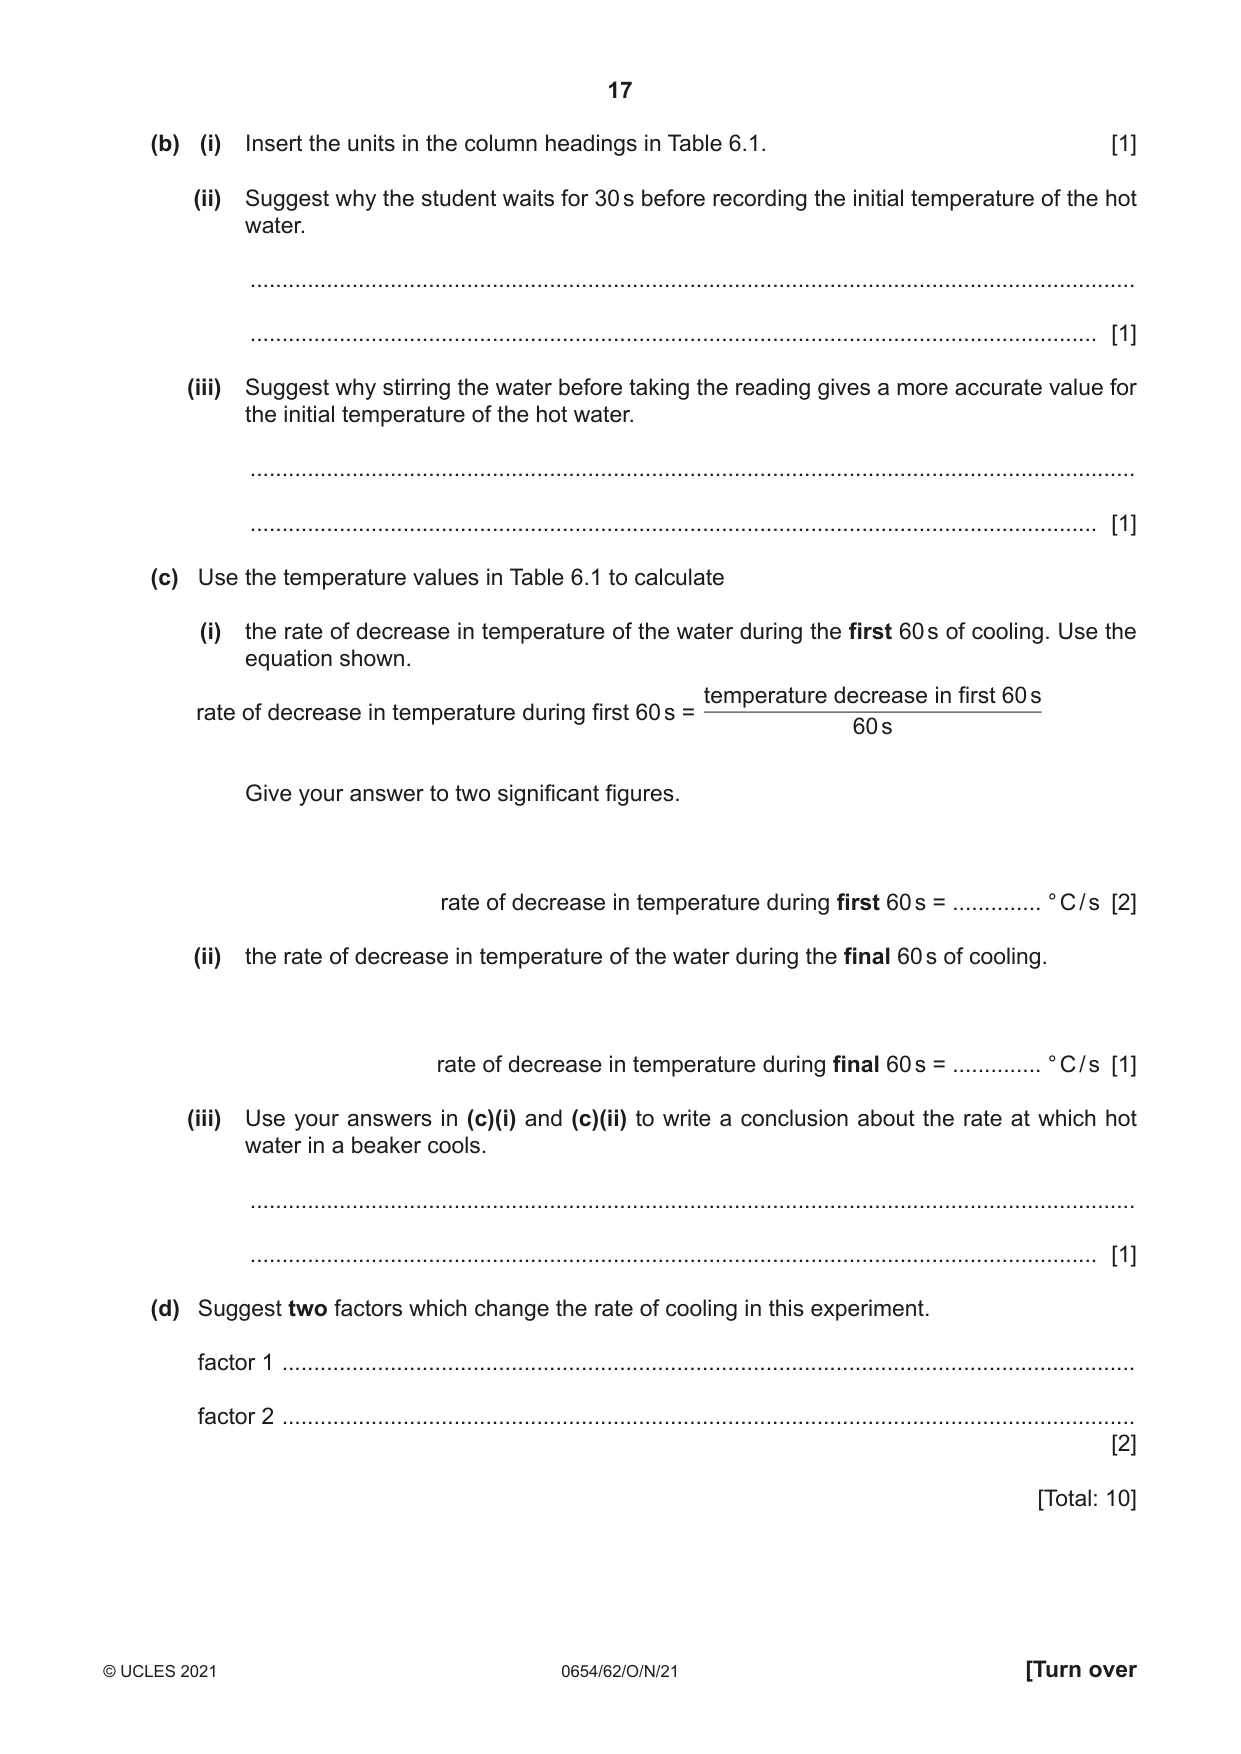
6 A student investigates the rate of cooling of hot water in a beaker. Procedure The student: • pours 200 cm3 of hot water into a beaker • places a thermometer into the hot water • waits for 30 seconds • stirs the water • records the temperature T of the hot water. Fig. 6.1 shows the reading on the thermometer. °C 90 80 Fig. 6.1 (a) Record in Table 6.1 for time t = 0, this value of T shown in Fig. 6.1 to the nearest 0.5 °C. [1] Table 6.1 time t / ............. temperature T / ............. 0 60 83.5 120 80.5 180 77.5 240 75.0 300 73.0 The student records in Table 6.1 the temperature of the water every 60 s for 300 s. (b) (i) Insert the units in the column headings in Table 6.1. [1] (ii) Suggest why the student waits for 30 s before recording the initial temperature of the hot water. ........................................................................................................................................... ..................................................................................................................................... [1] (iii) Suggest why stirring the water before taking the reading gives a more accurate value for the initial temperature of the hot water. ........................................................................................................................................... ..................................................................................................................................... [1] (c) Use the temperature values in Table 6.1 to calculate (i) the rate of decrease in temperature of the water during the first 60 s of cooling. Use the equation shown. temperature decrease in first 60 s rate of decrease in temperature during first 60 s = 60 s Give your answer to two significant figures. rate of decrease in temperature during first 60 s = .............. ° C / s [2] (ii) the rate of decrease in temperature of the water during the final 60 s of cooling. rate of decrease in temperature during final 60 s = .............. ° C / s [1] (iii) Use your answers in (c)(i) and (c)(ii) to write a conclusion about the rate at which hot water in a beaker cools. ........................................................................................................................................... ..................................................................................................................................... [1] (d) Suggest two factors which change the rate of cooling in this experiment. factor 1 ...................................................................................................................................... factor 2 ...................................................................................................................................... [2] [Total: 10]
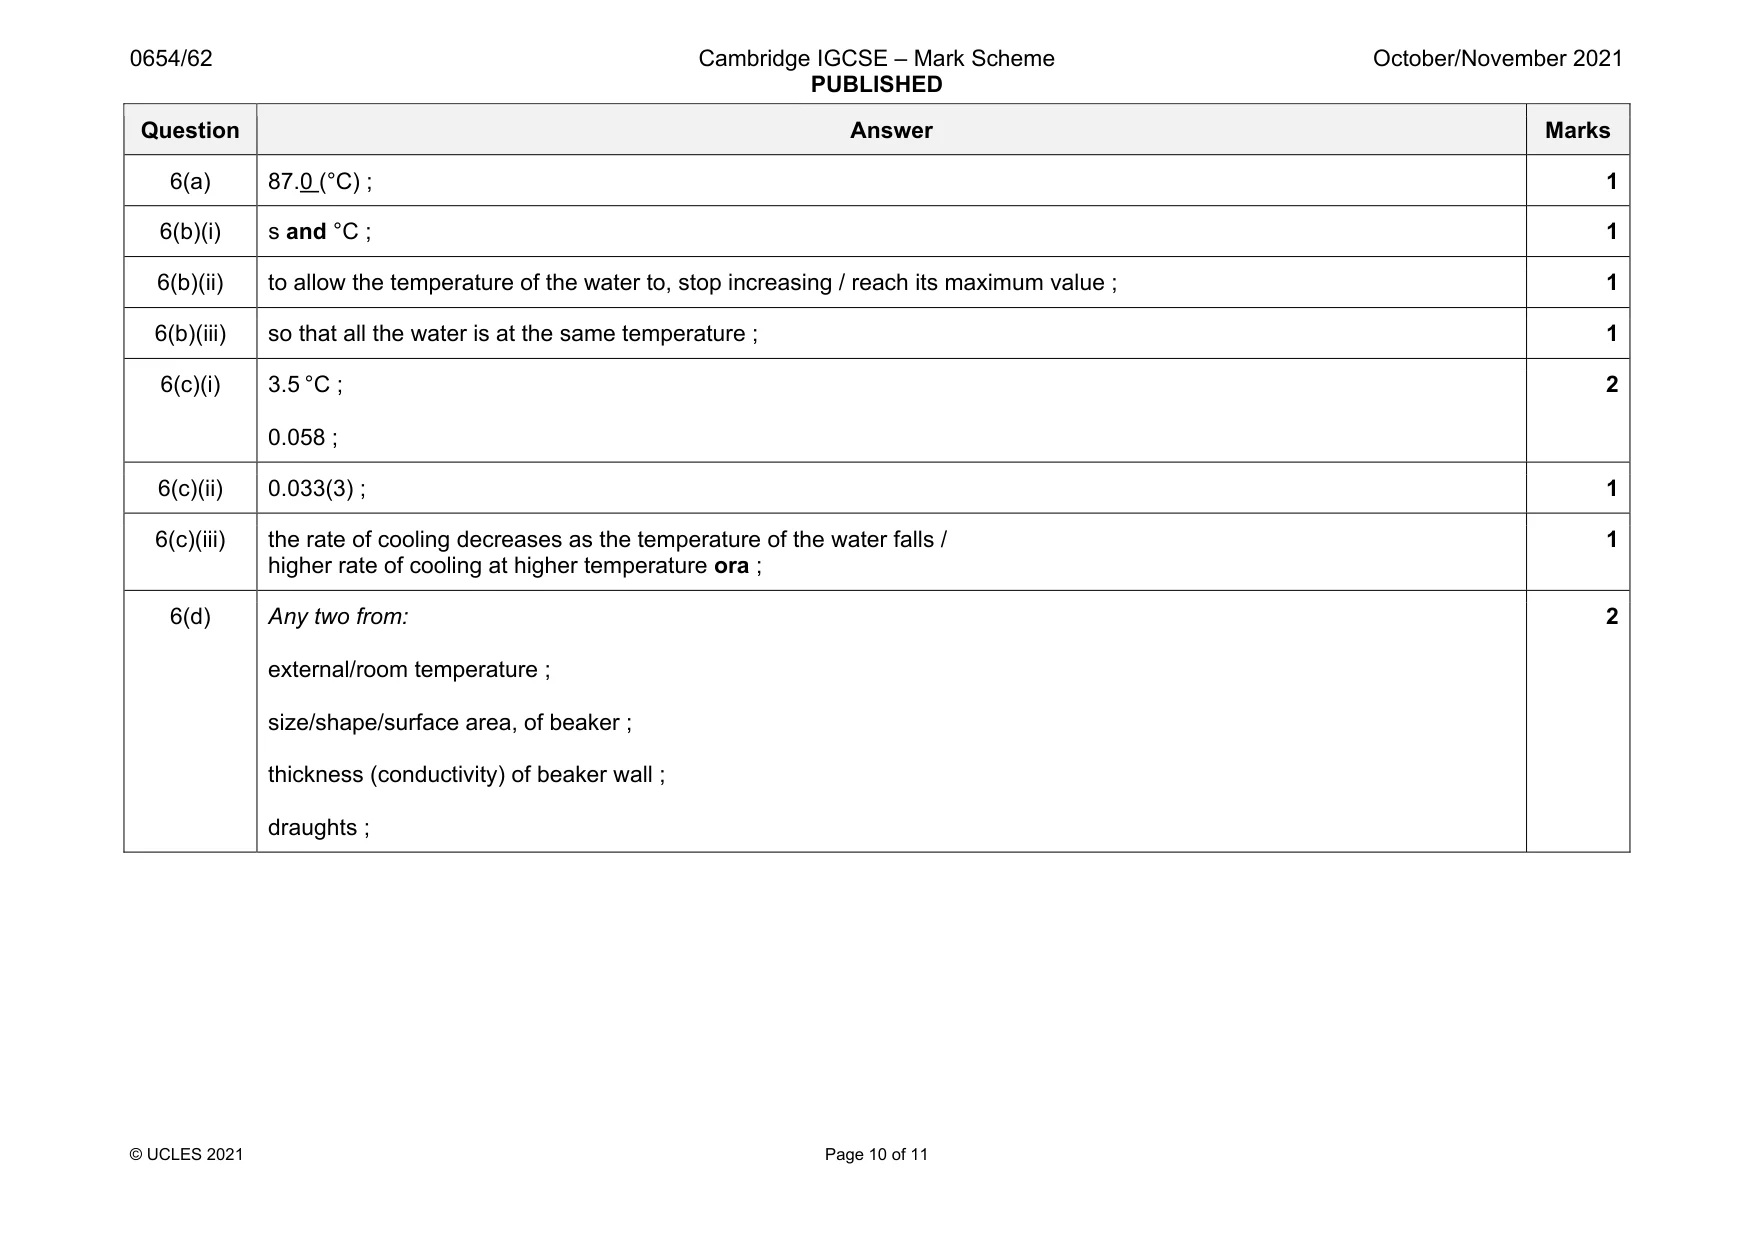
Mark scheme: 6(a) 87.0 (°C) ; 1 6(b)(i) s and °C ; 1 6(b)(ii) to allow the temperature of the water to, stop increasing / reach its maximum value ; 1 6(b)(iii) so that all the water is at the same temperature ; 1 6(c)(i) 3.5 °C ; 0.058 ; 2 6(c)(ii) 0.033(3) ; 1 6(c)(iii) the rate of cooling decreases as the temperature of the water falls / higher rate of cooling at higher temperature ora ; 1 6(d) Any two from: external/room temperature ; size/shape/surface area, of beaker ; thickness (conductivity) of beaker wall ; draughts ; 2
Q7 · A student investigates the total resistance of two different combinations of identical…
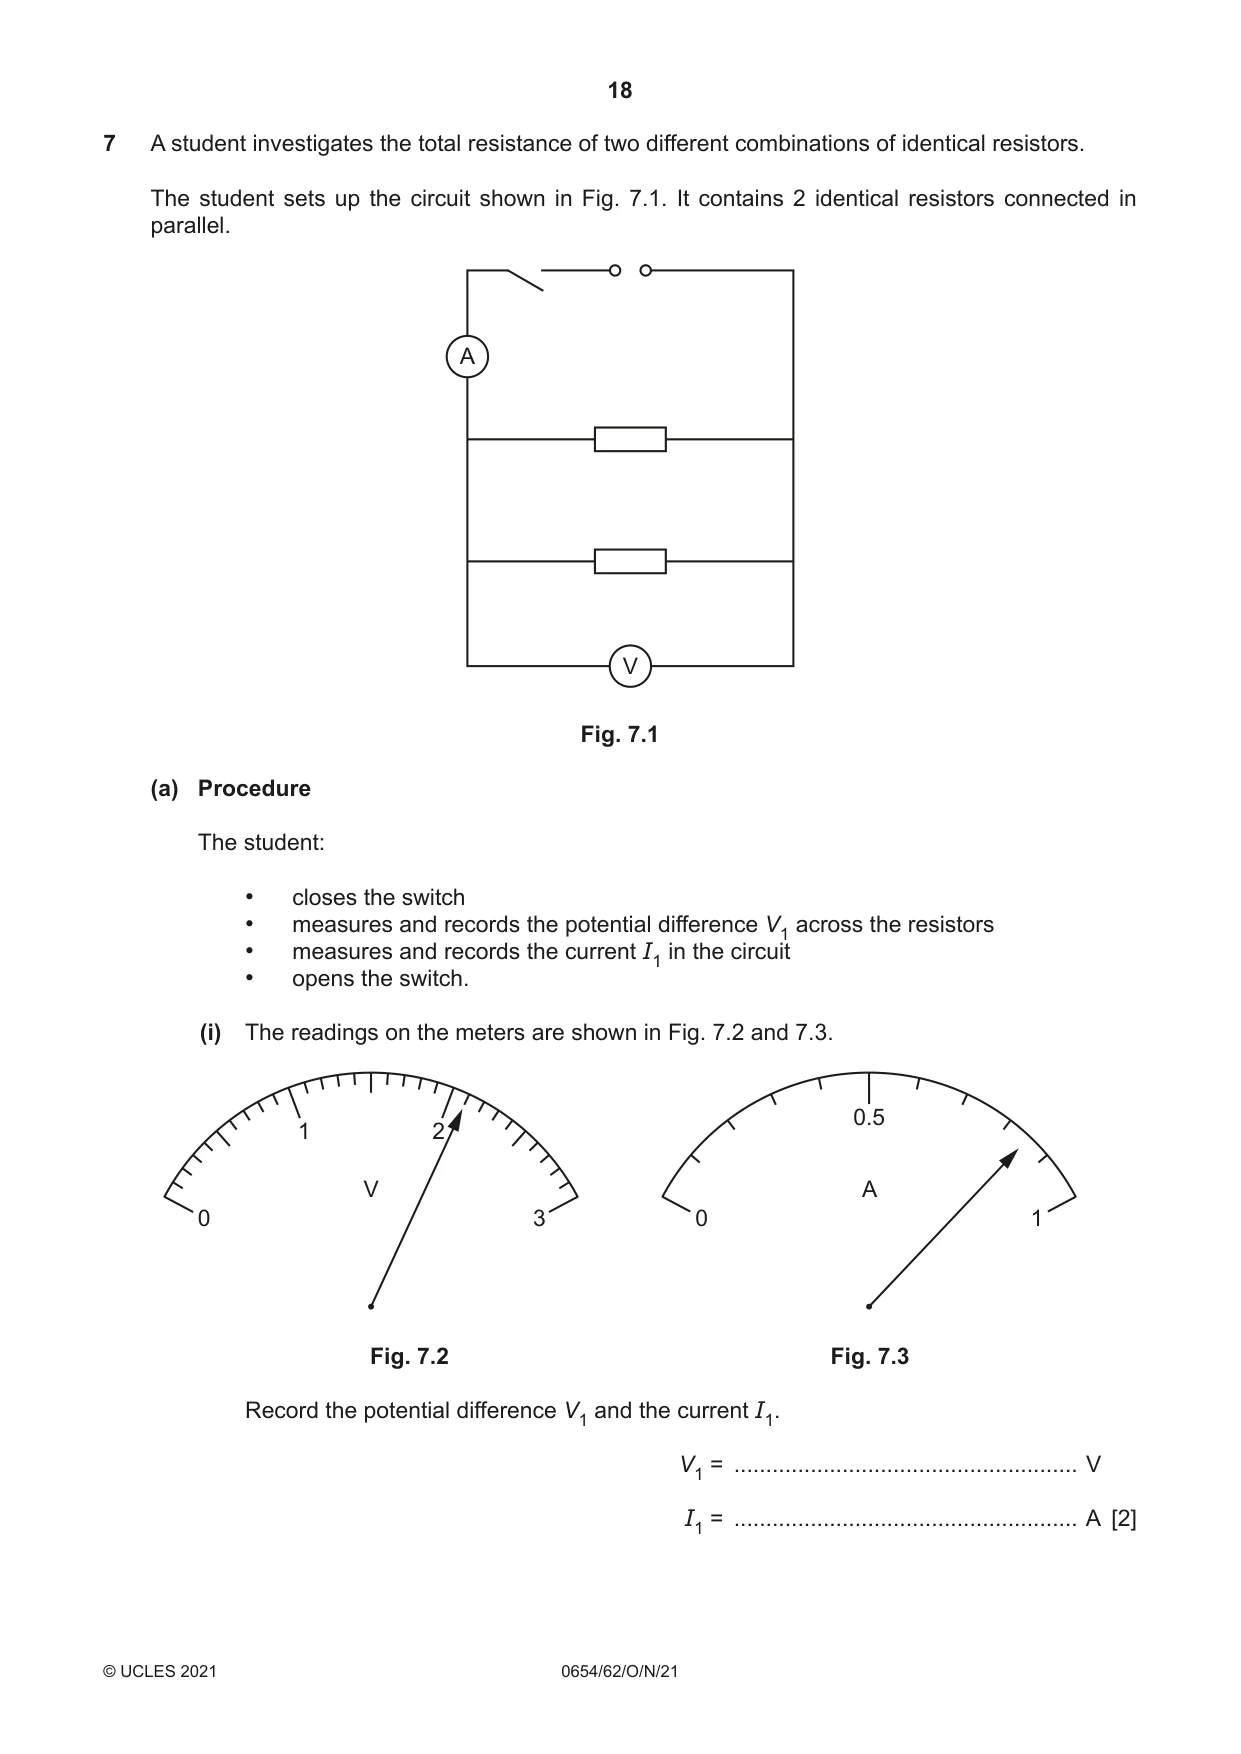
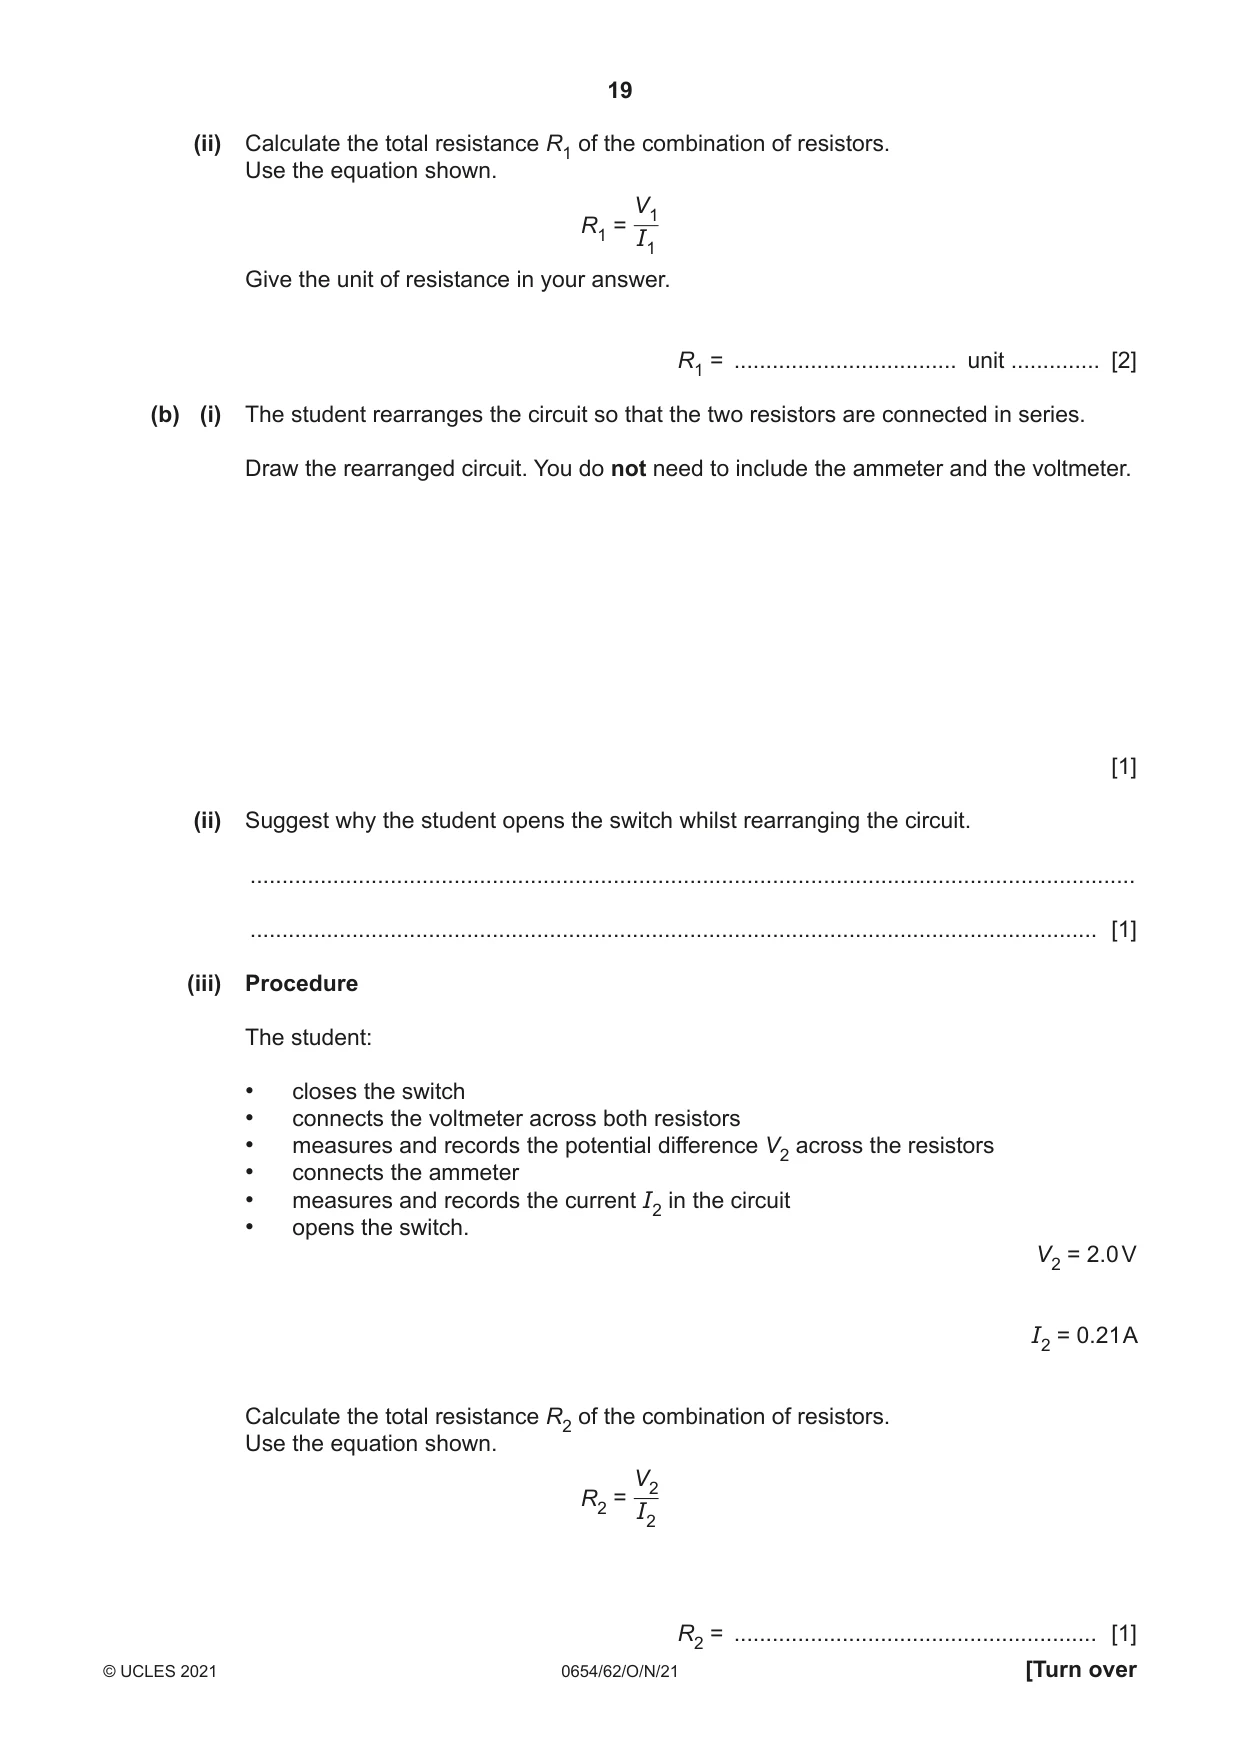
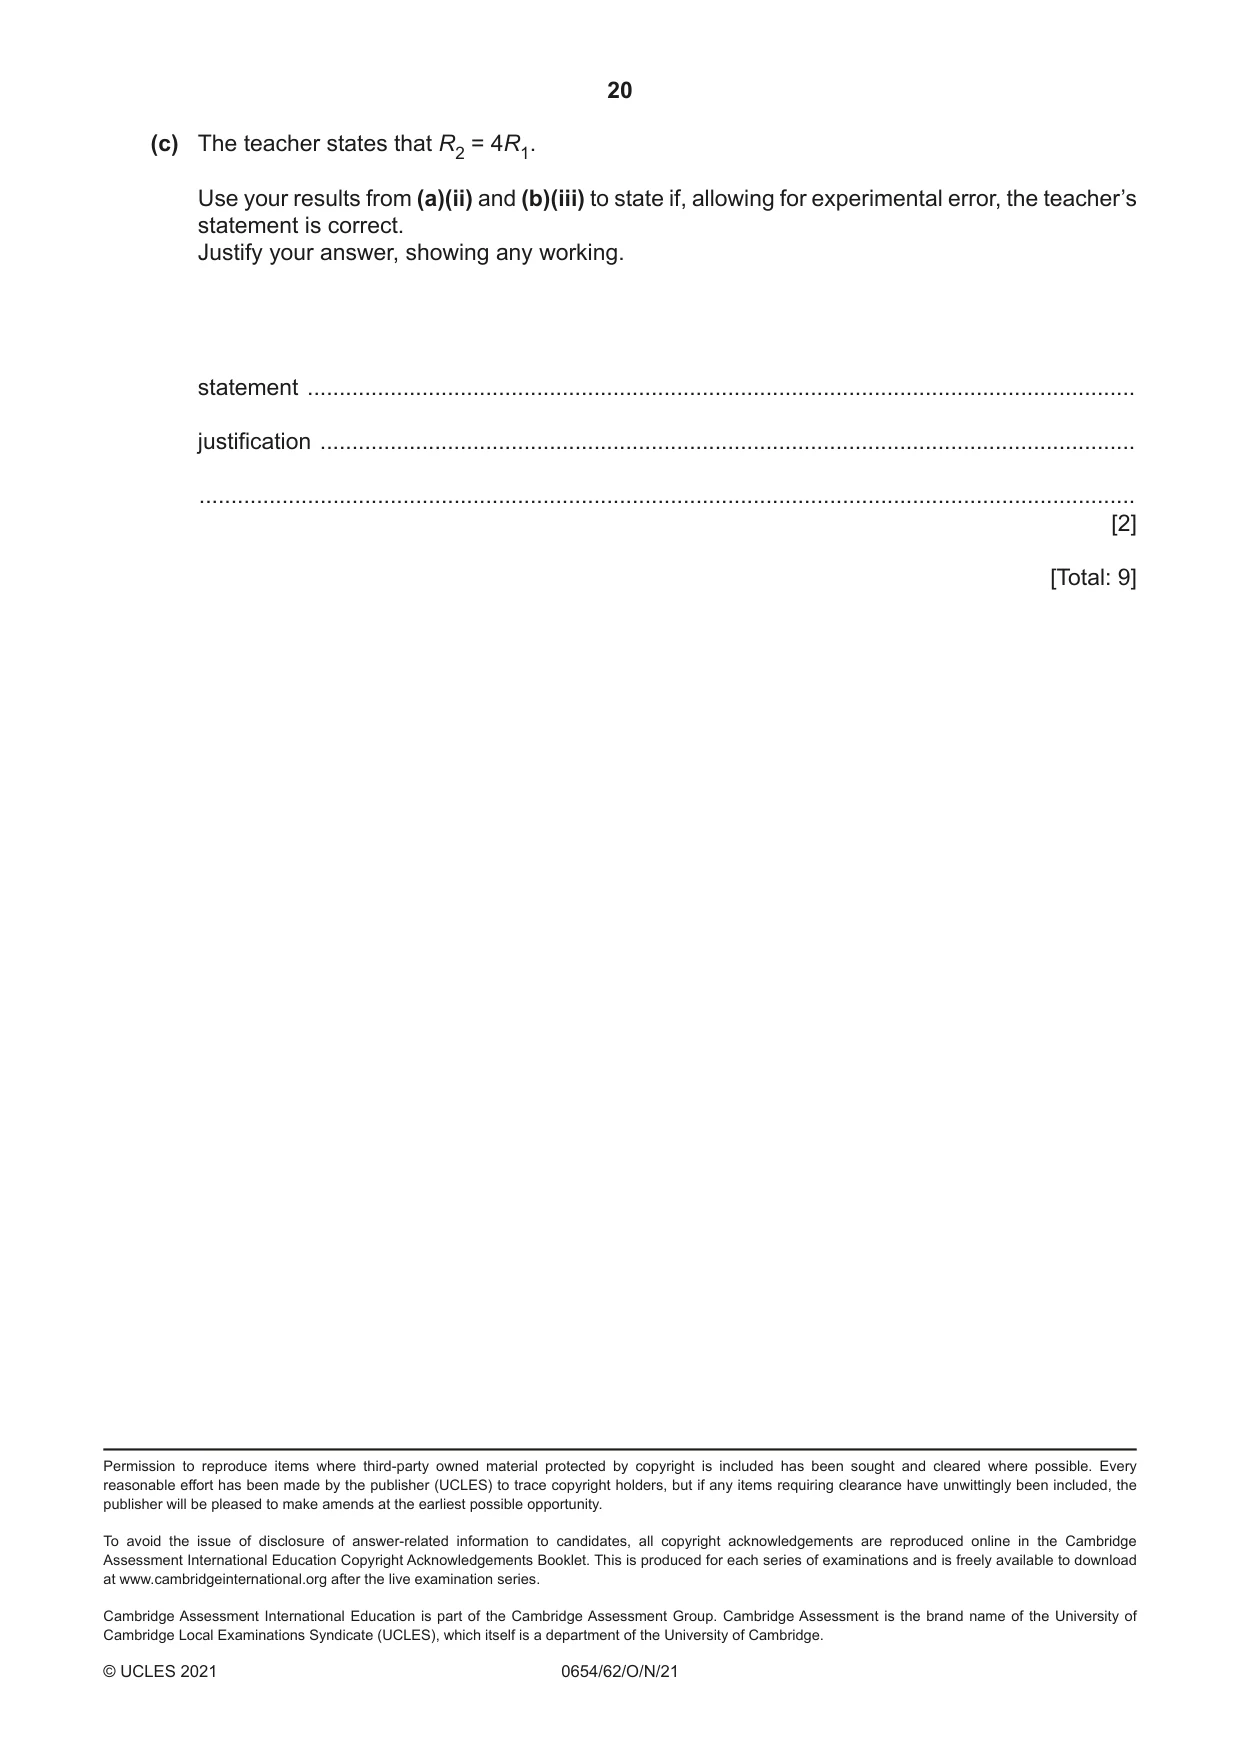
7 A student investigates the total resistance of two different combinations of identical resistors. The student sets up the circuit shown in Fig. 7.1. It contains 2 identical resistors connected in parallel. A V Fig. 7.1 (a) Procedure The student: • closes the switch • measures and records the potential difference V1 across the resistors • measures and records the current I1 in the circuit • opens the switch. (i) The readings on the meters are shown in Fig. 7.2 and 7.3. 0.5 1 2 V A 0 3 0 1 Fig. 7.2 Fig. 7.3 Record the potential difference V1 and the current I1. V1 = ...................................................... V I1 = ...................................................... A [2] (ii) Calculate the total resistance R1 of the combination of resistors. Use the equation shown. V1 R1 = I1 Give the unit of resistance in your answer. R1 = ................................... unit .............. [2] (b) (i) The student rearranges the circuit so that the two resistors are connected in series. Draw the rearranged circuit. You do not need to include the ammeter and the voltmeter. [1] (ii) Suggest why the student opens the switch whilst rearranging the circuit. ........................................................................................................................................... ..................................................................................................................................... [1] (iii) Procedure The student: • closes the switch • connects the voltmeter across both resistors • measures and records the potential difference V2 across the resistors • connects the ammeter • measures and records the current I2 in the circuit • opens the switch. V2 = 2.0 V I2 = 0.21 A Calculate the total resistance R2 of the combination of resistors. Use the equation shown. V2 R2 = I2 R2 = ......................................................... [1] (c) The teacher states that R2 = 4R1. Use your results from (a)(ii) and (b)(iii) to state if, allowing for experimental error, the teacher’s statement is correct. Justify your answer, showing any working. statement .................................................................................................................................. justification ................................................................................................................................ ................................................................................................................................................... [2] [Total: 9]
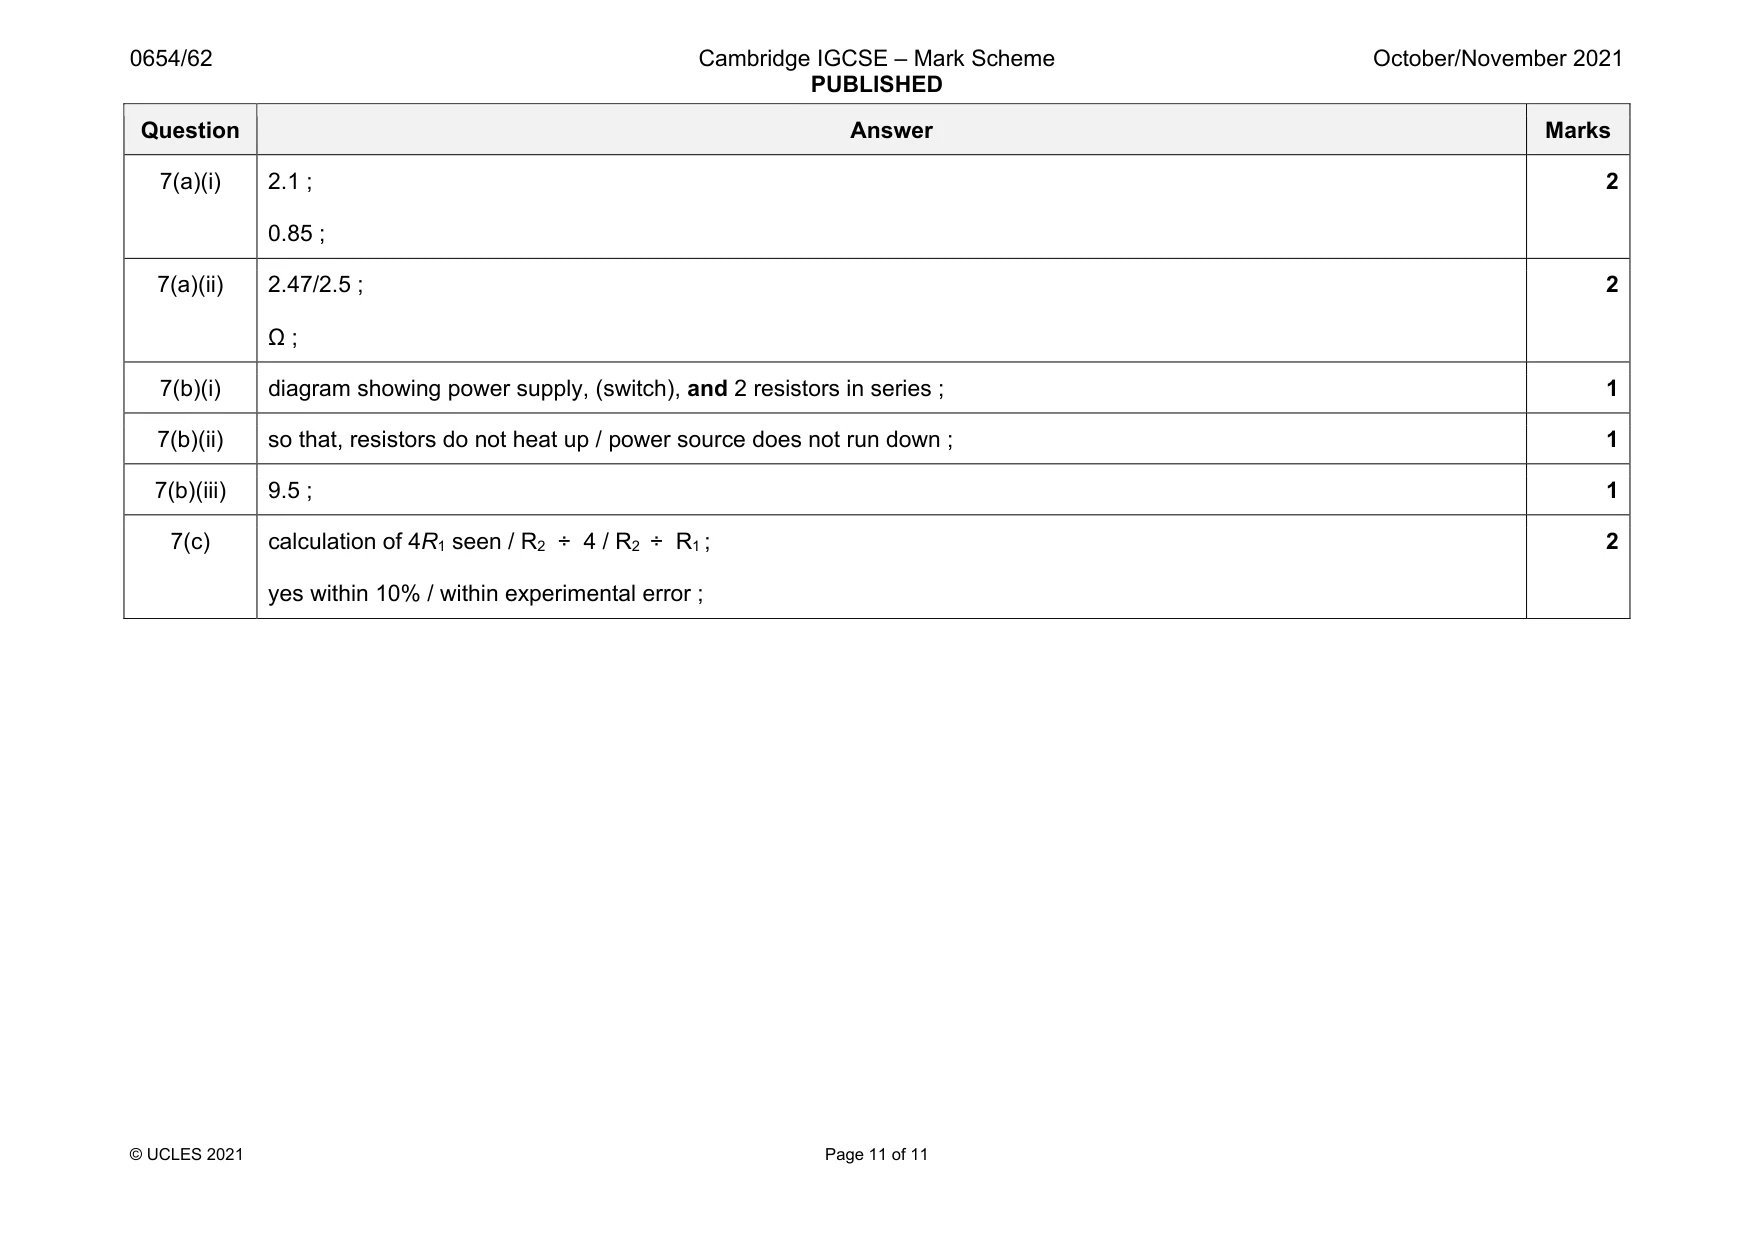
Mark scheme: 7(a)(i) 2.1 ; 0.85 ; 2 7(a)(ii) 2.47/2.5 ; Ω ; 2 7(b)(i) diagram showing power supply, (switch), and 2 resistors in series ; 1 7(b)(ii) so that, resistors do not heat up / power source does not run down ; 1 7(b)(iii) 9.5 ; 1 7(c) calculation of 4R1 seen / R2 ÷ 4 / R2 ÷ R1 ; yes within 10% / within experimental error ; 2
What was in this paper
The subtopics covered by these 7 questions, and how many questions each got. Open one in a new tab to see every Cambridge question on it.
What you needed in this session
Cambridge’s own grade thresholds for 2021 Oct/Nov, Paper 6 · Variant 2. A higher threshold means an easier paper — the bar moves with how the cohort did.