Cambridge IGCSE Sciences - Co-ordinated (Double) 0654 — 2020 Oct/Nov Paper 6 · Variant 2
0654/62/O/N/20 · 6 questions · 60 marks · ≈68 min
The question paper and its mark scheme, free to read here and free to download. This is Cambridge’s own paper, exactly as it was sat.
Question paper20 pages



Mark scheme9 pages
Answers below. Sit the paper first if you are practising.
Questions as text
Q1 · A student investigates the movement of molecules through a membrane
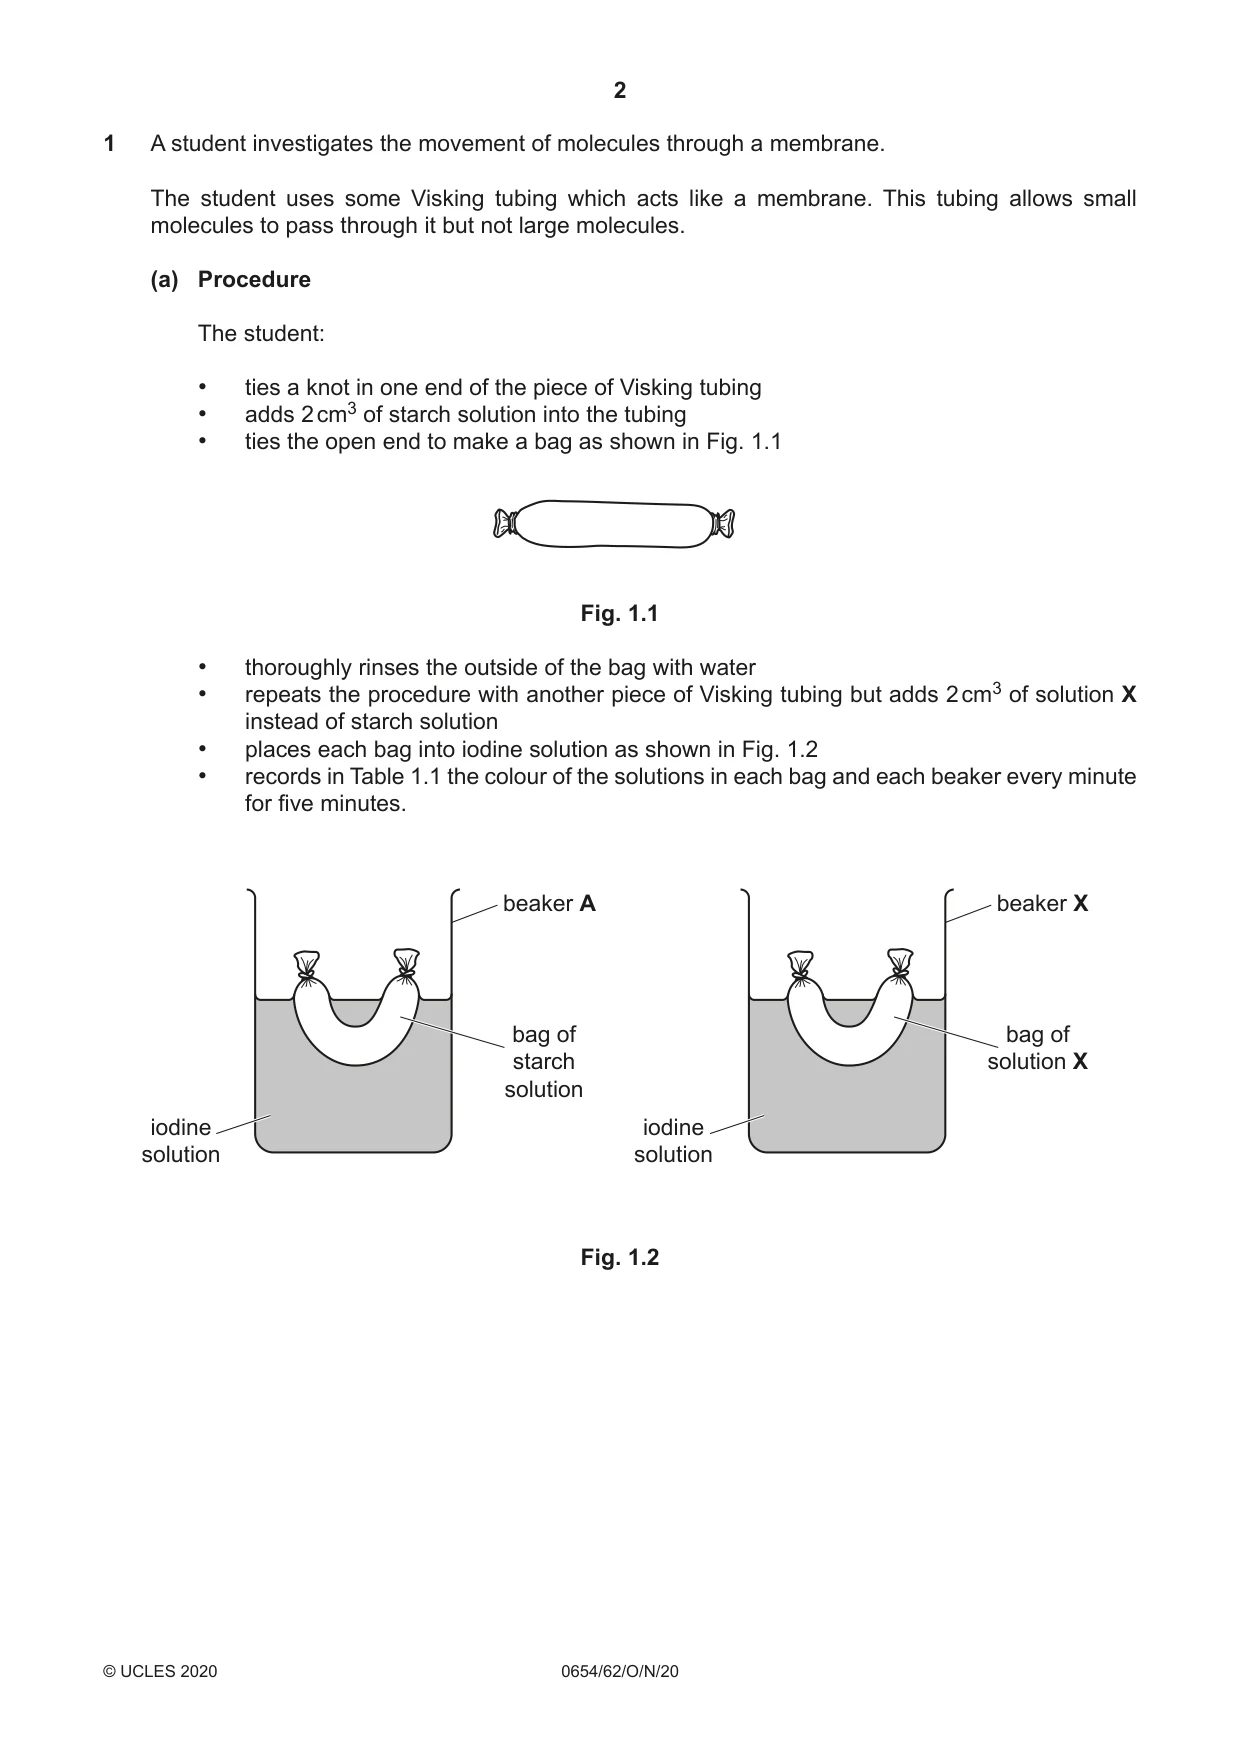
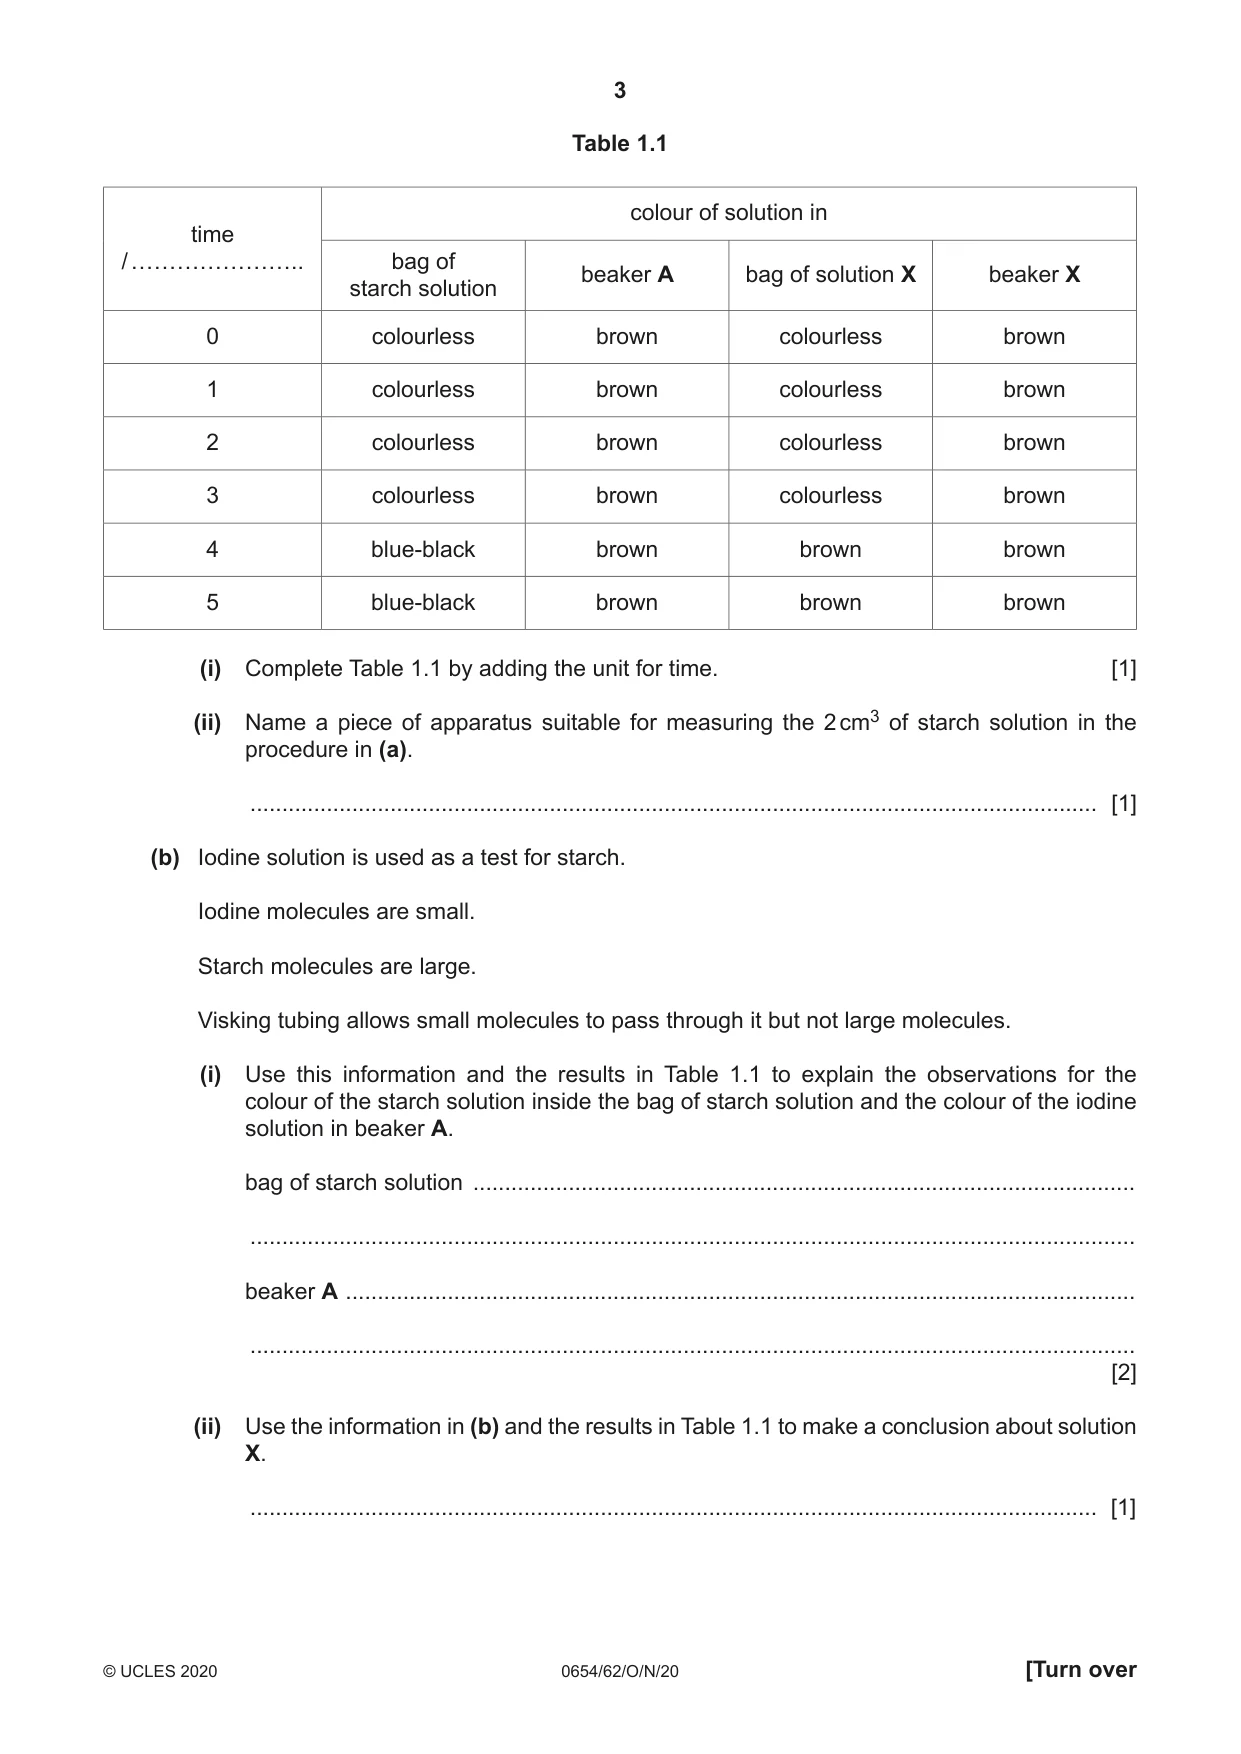
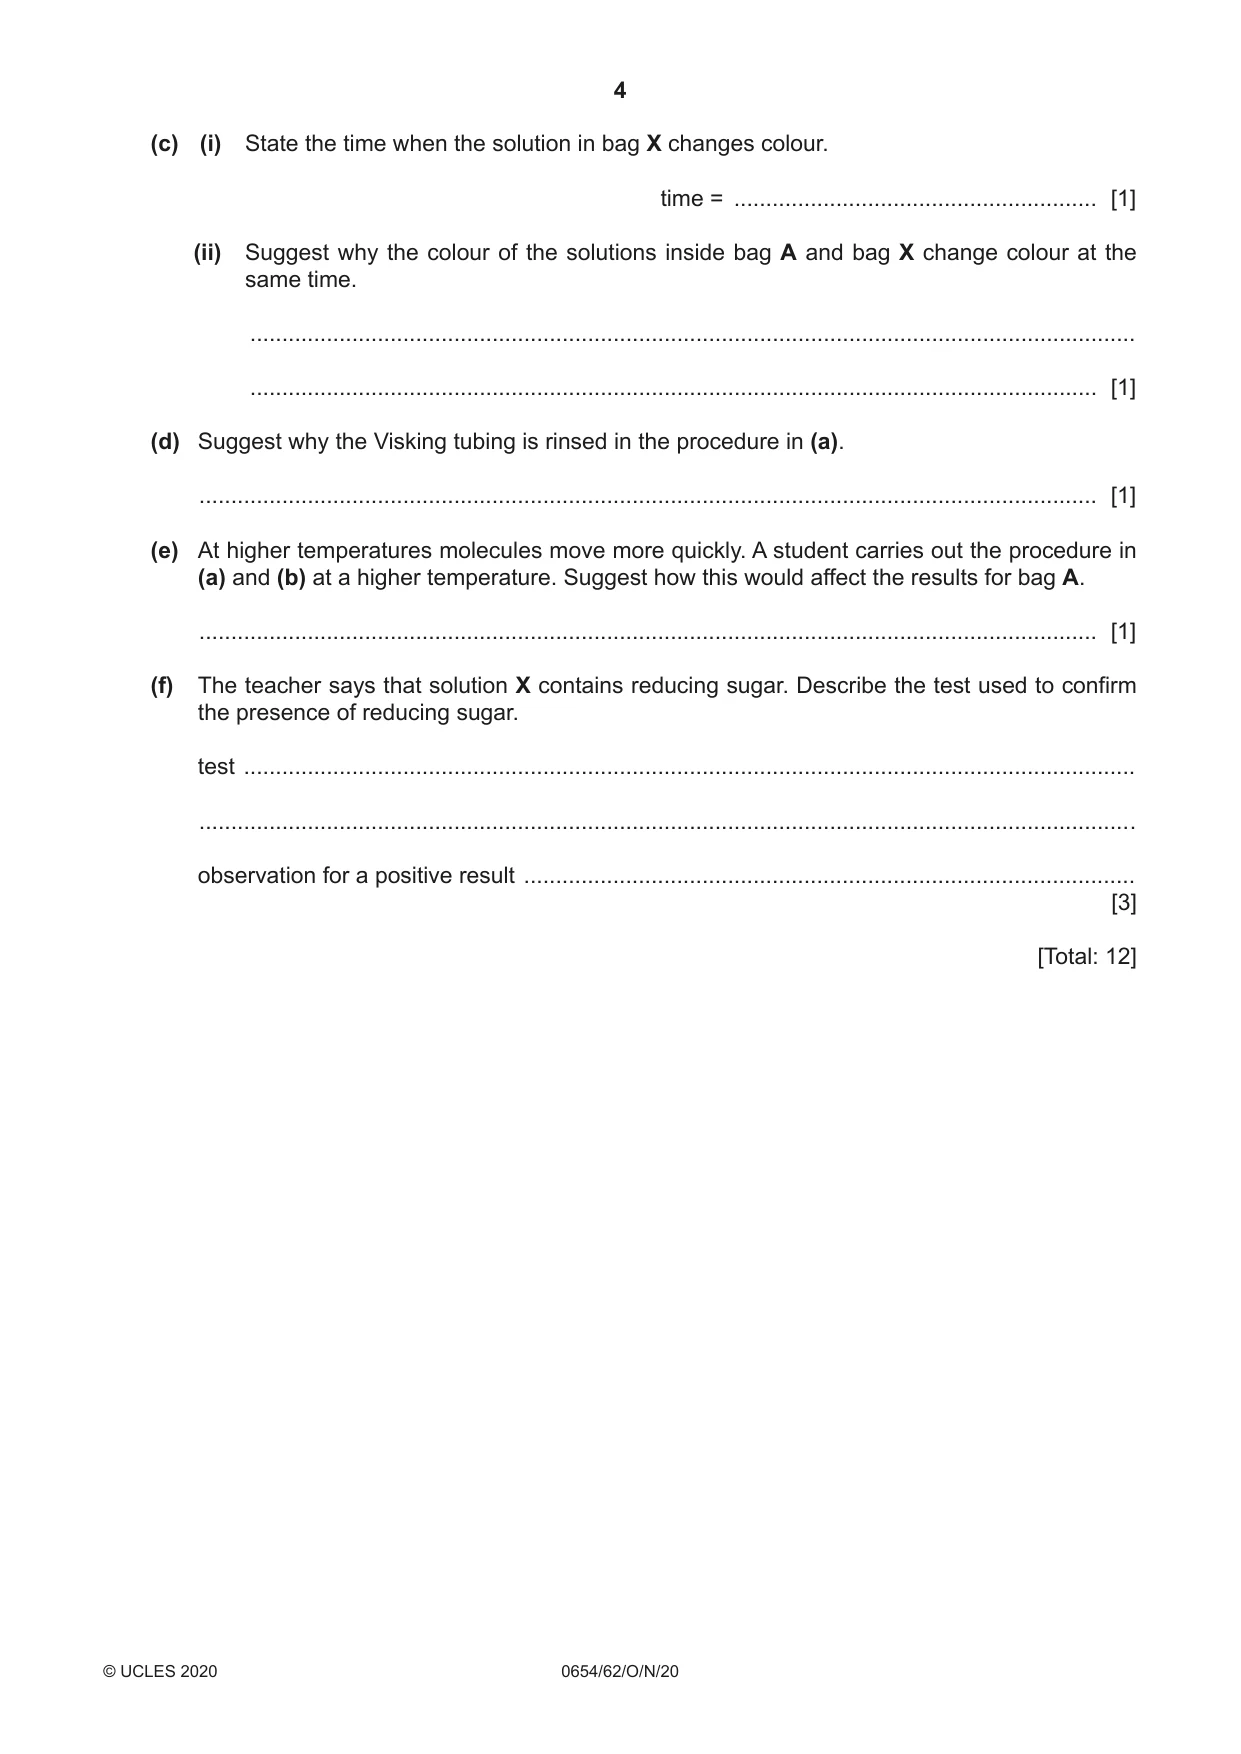
1 A student investigates the movement of molecules through a membrane. The student uses some Visking tubing which acts like a membrane. This tubing allows small molecules to pass through it but not large molecules. (a) Procedure The student: • ties a knot in one end of the piece of Visking tubing • adds 2 cm3 of starch solution into the tubing • ties the open end to make a bag as shown in Fig. 1.1 Fig. 1.1 • thoroughly rinses the outside of the bag with water • repeats the procedure with another piece of Visking tubing but adds 2 cm3 of solution X instead of starch solution • places each bag into iodine solution as shown in Fig. 1.2 • records in Table 1.1 the colour of the solutions in each bag and each beaker every minute for five minutes. beaker A beaker X bag of bag of starch solution X solution iodine iodine solution solution Fig. 1.2 Table 1.1 colour of solution in time / ………………….. bag of beaker A bag of solution X beaker X starch solution 0 colourless brown colourless brown 1 colourless brown colourless brown 2 colourless brown colourless brown 3 colourless brown colourless brown 4 blue-black brown brown brown 5 blue-black brown brown brown (i) Complete Table 1.1 by adding the unit for time. [1] (ii) Name a piece of apparatus suitable for measuring the 2 cm3 of starch solution in the procedure in (a). ..................................................................................................................................... [1] (b) Iodine solution is used as a test for starch. Iodine molecules are small. Starch molecules are large. Visking tubing allows small molecules to pass through it but not large molecules. (i) Use this information and the results in Table 1.1 to explain the observations for the colour of the starch solution inside the bag of starch solution and the colour of the iodine solution in beaker A. bag of starch solution ........................................................................................................ ........................................................................................................................................... beaker A ............................................................................................................................ ........................................................................................................................................... [2] (ii) Use the information in (b) and the results in Table 1.1 to make a conclusion about solution X. ..................................................................................................................................... [1] (c) (i) State the time when the solution in bag X changes colour. time = ......................................................... [1] (ii) Suggest why the colour of the solutions inside bag A and bag X change colour at the same time. ........................................................................................................................................... ..................................................................................................................................... [1] (d) Suggest why the Visking tubing is rinsed in the procedure in (a). ............................................................................................................................................. [1] (e) At higher temperatures molecules move more quickly. A student carries out the procedure in (a) and (b) at a higher temperature. Suggest how this would affect the results for bag A. ............................................................................................................................................. [1] (f) The teacher says that solution X contains reducing sugar. Describe the test used to confirm the presence of reducing sugar. test ............................................................................................................................................ ................................................................................................................................................... observation for a positive result ................................................................................................ [3] [Total: 12]
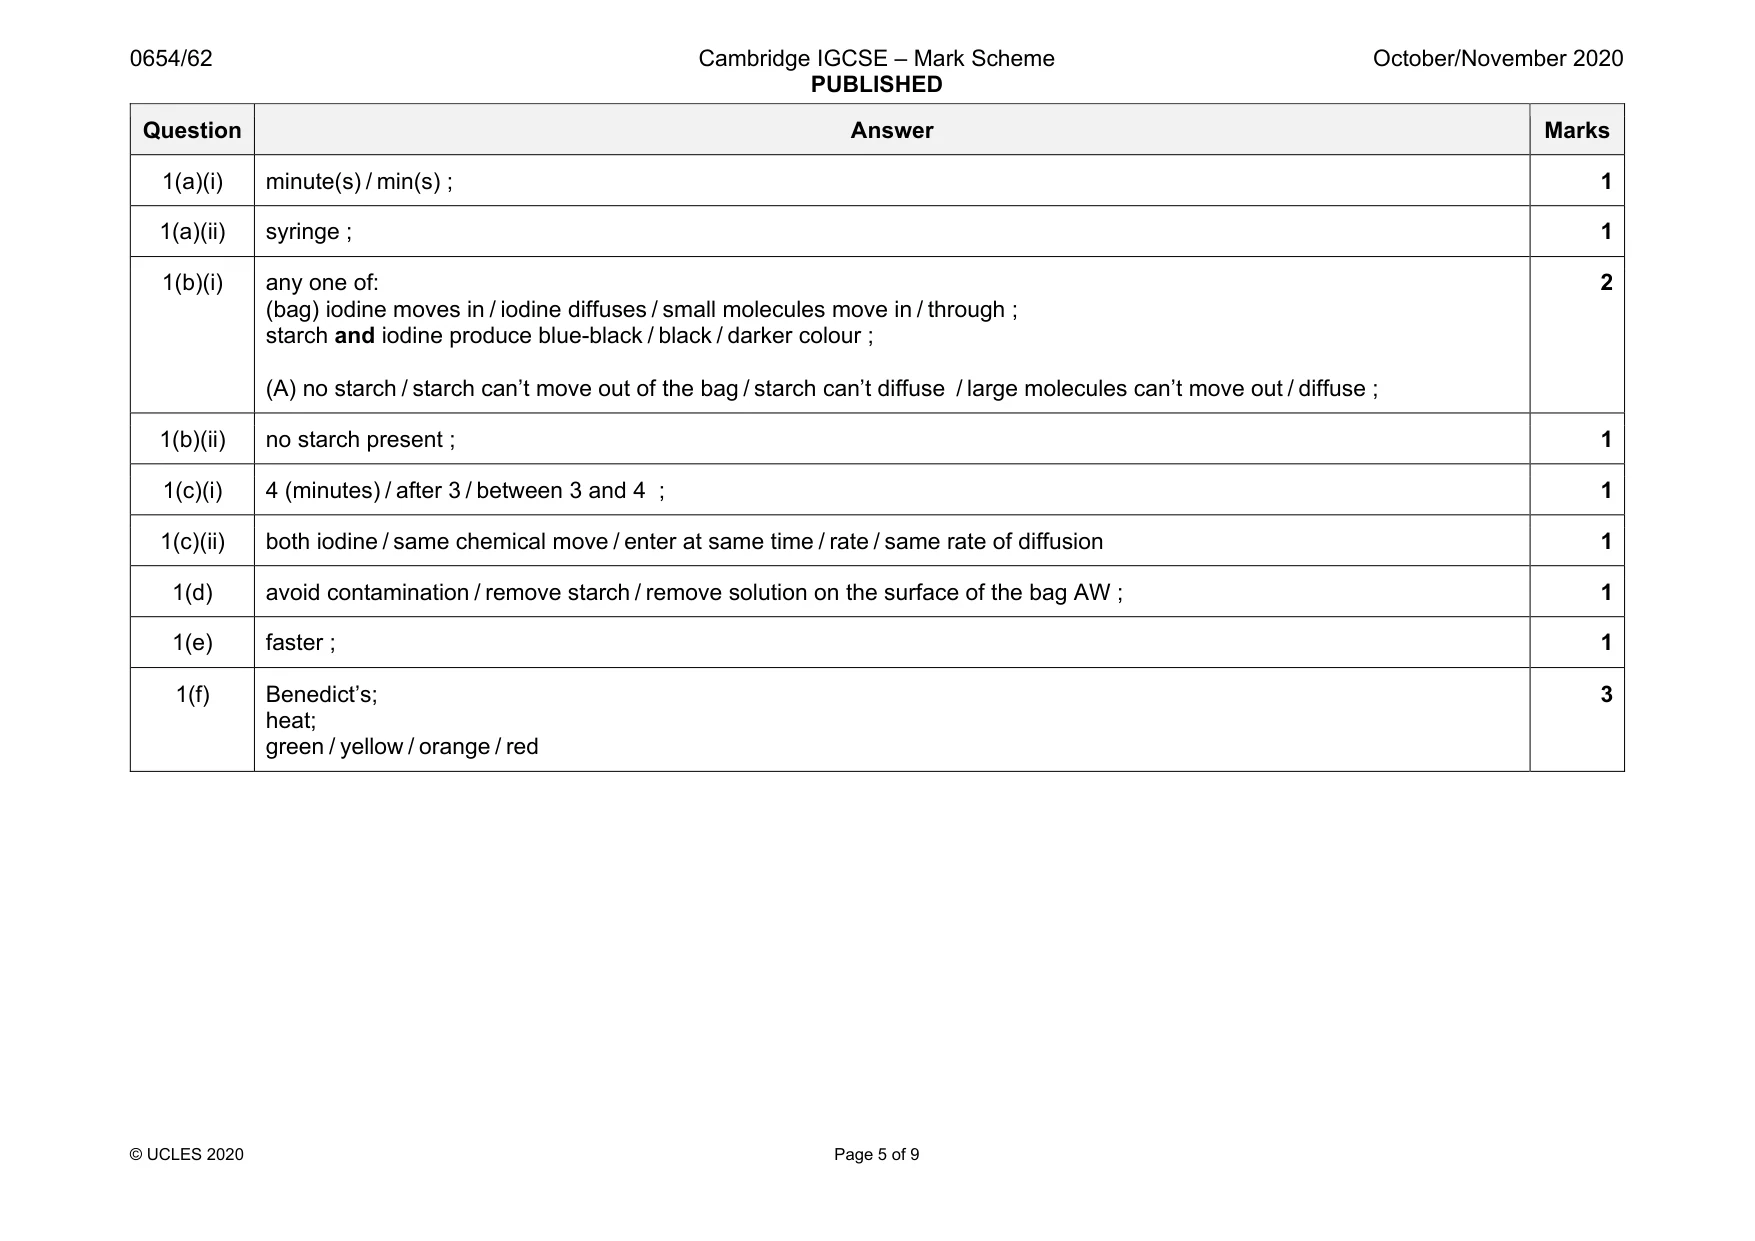
Mark scheme: 1(a)(i) minute(s) / min(s) ; 1 1(a)(ii) syringe ; 1 1(b)(i) any one of: (bag) iodine moves in / iodine diffuses / small molecules move in / through ; starch and iodine produce blue-black / black / darker colour ; (A) no starch / starch can’t move out of the bag / starch can’t diffuse / large molecules can’t move out / diffuse ; 2 1(b)(ii) no starch present ; 1 1(c)(i) 4 (minutes) / after 3 / between 3 and 4 ; 1 1(c)(ii) both iodine / same chemical move / enter at same time / rate / same rate of diffusion 1 1(d) avoid contamination / remove starch / remove solution on the surface of the bag AW ; 1 1(e) faster ; 1 1(f) Benedict’s; heat; green / yellow / orange / red 3
More questions on Physical quantities and measurement techniques
Q2 · A photograph of a slice of cucumber
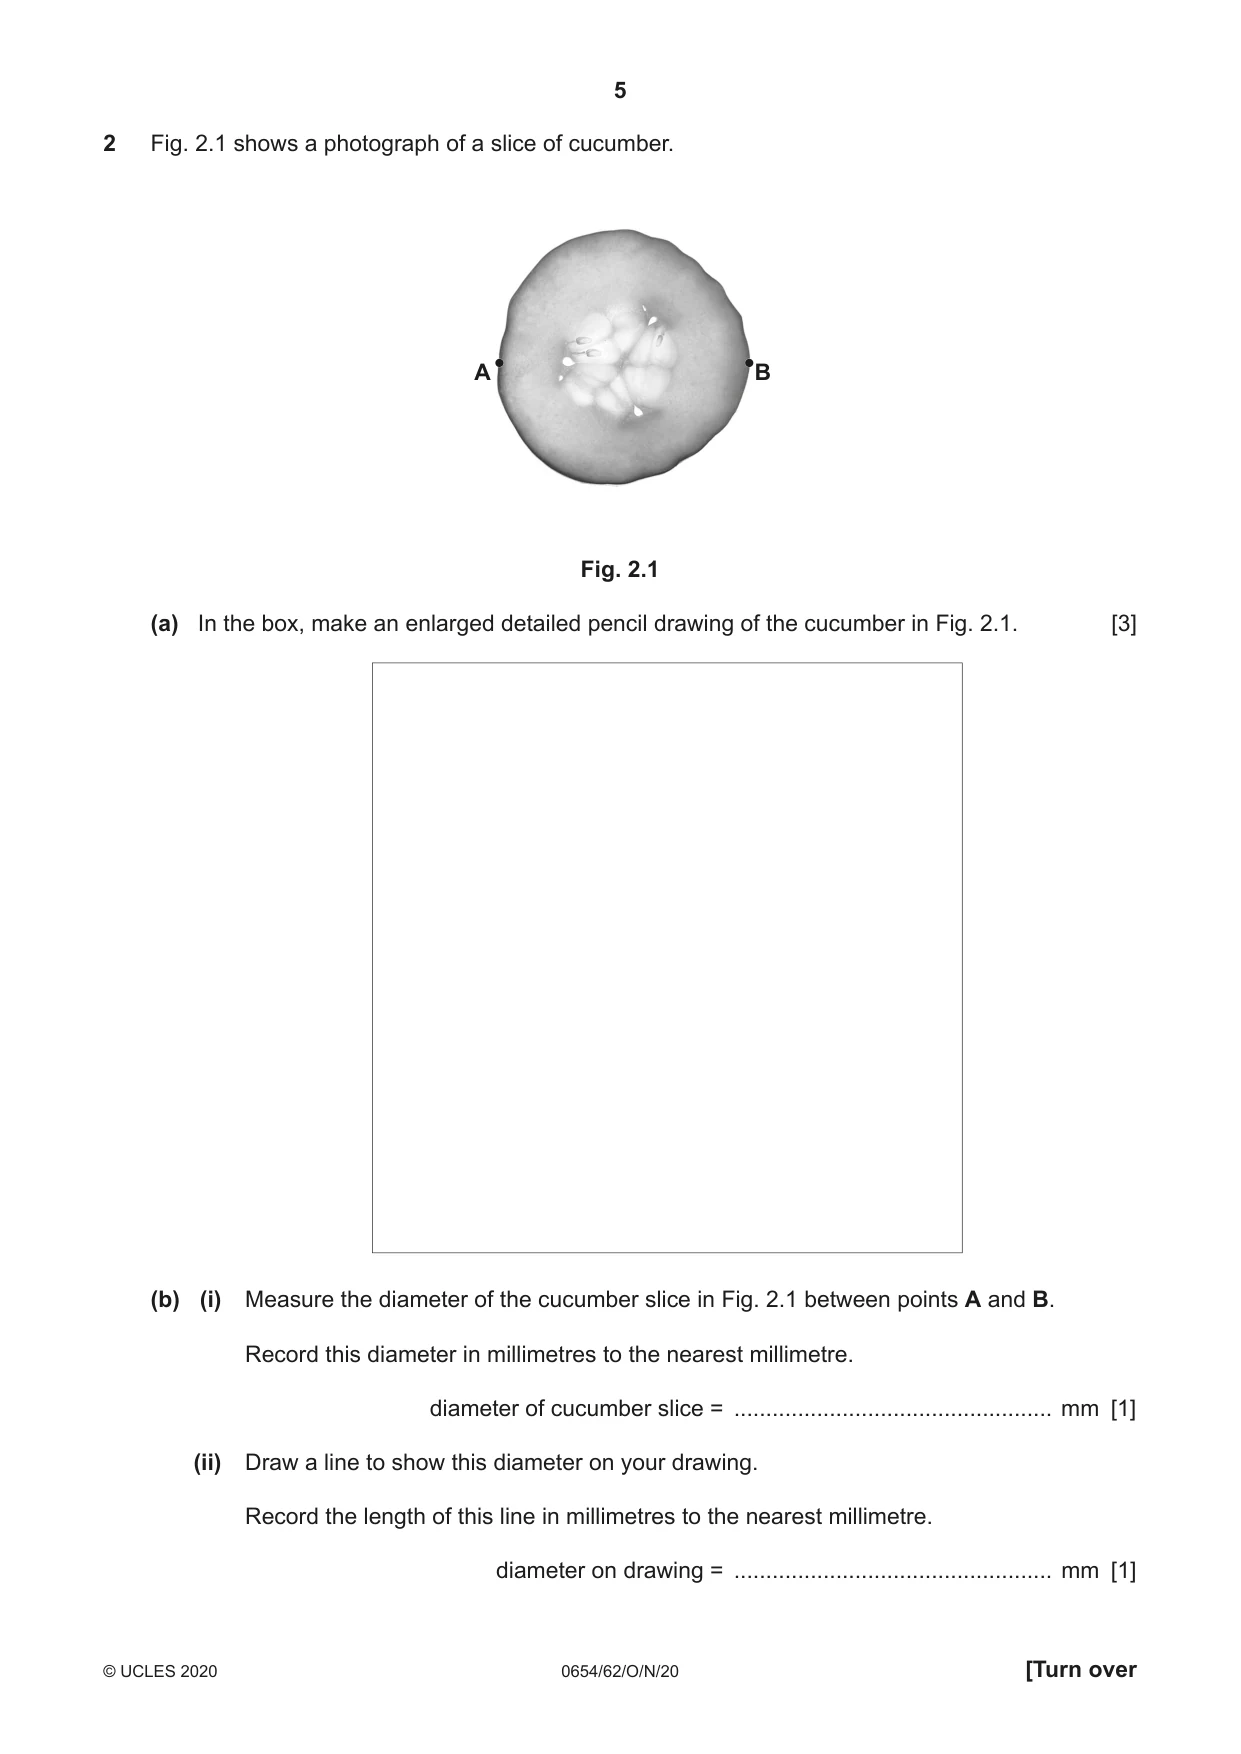
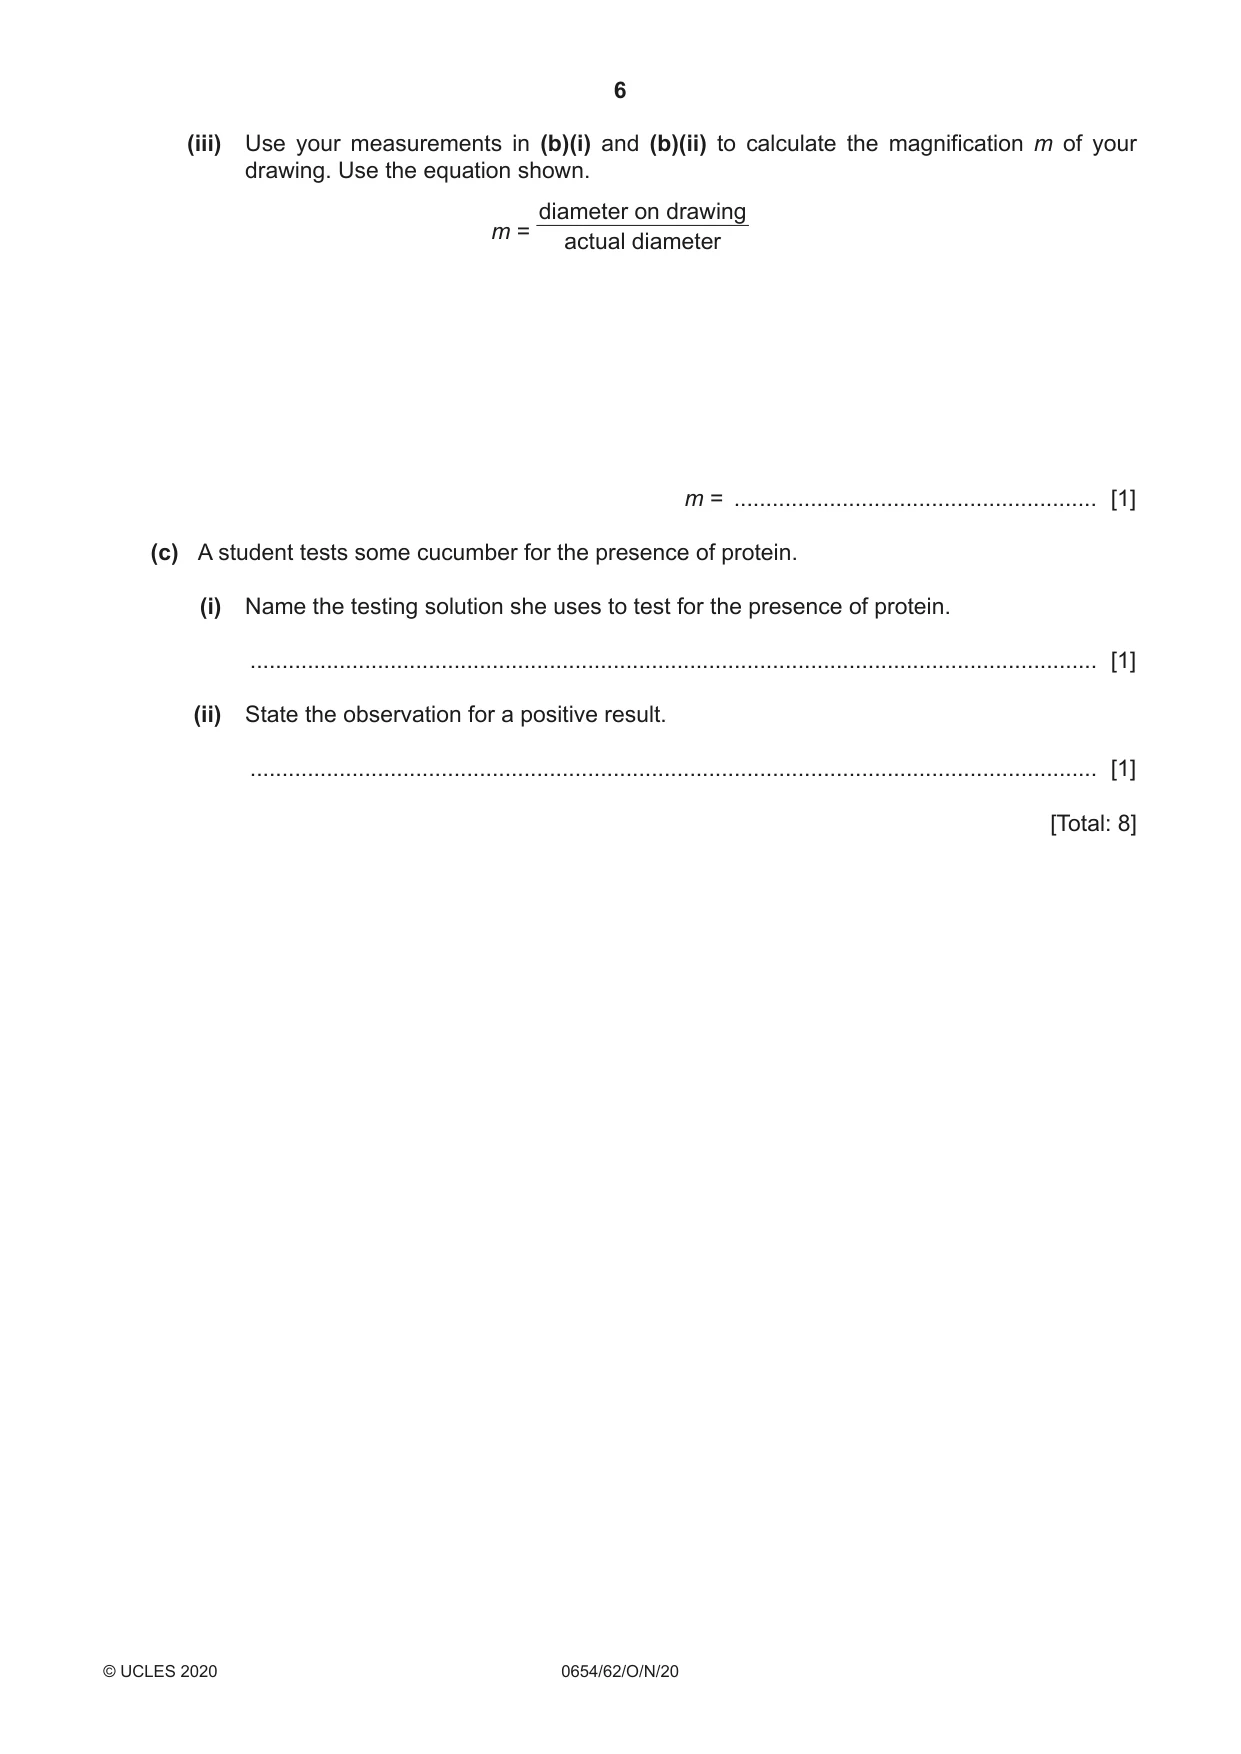
2 Fig. 2.1 shows a photograph of a slice of cucumber. A B Fig. 2.1 (a) In the box, make an enlarged detailed pencil drawing of the cucumber in Fig. 2.1. [3] (b) (i) Measure the diameter of the cucumber slice in Fig. 2.1 between points A and B. Record this diameter in millimetres to the nearest millimetre. diameter of cucumber slice = .................................................. mm [1] (ii) Draw a line to show this diameter on your drawing. Record the length of this line in millimetres to the nearest millimetre. diameter on drawing = .................................................. mm [1] (iii) Use your measurements in (b)(i) and (b)(ii) to calculate the magnification m of your drawing. Use the equation shown. diameter on drawing m = actual diameter m = ......................................................... [1] (c) A student tests some cucumber for the presence of protein. (i) Name the testing solution she uses to test for the presence of protein. ..................................................................................................................................... [1] (ii) State the observation for a positive result. ..................................................................................................................................... [1] [Total: 8]
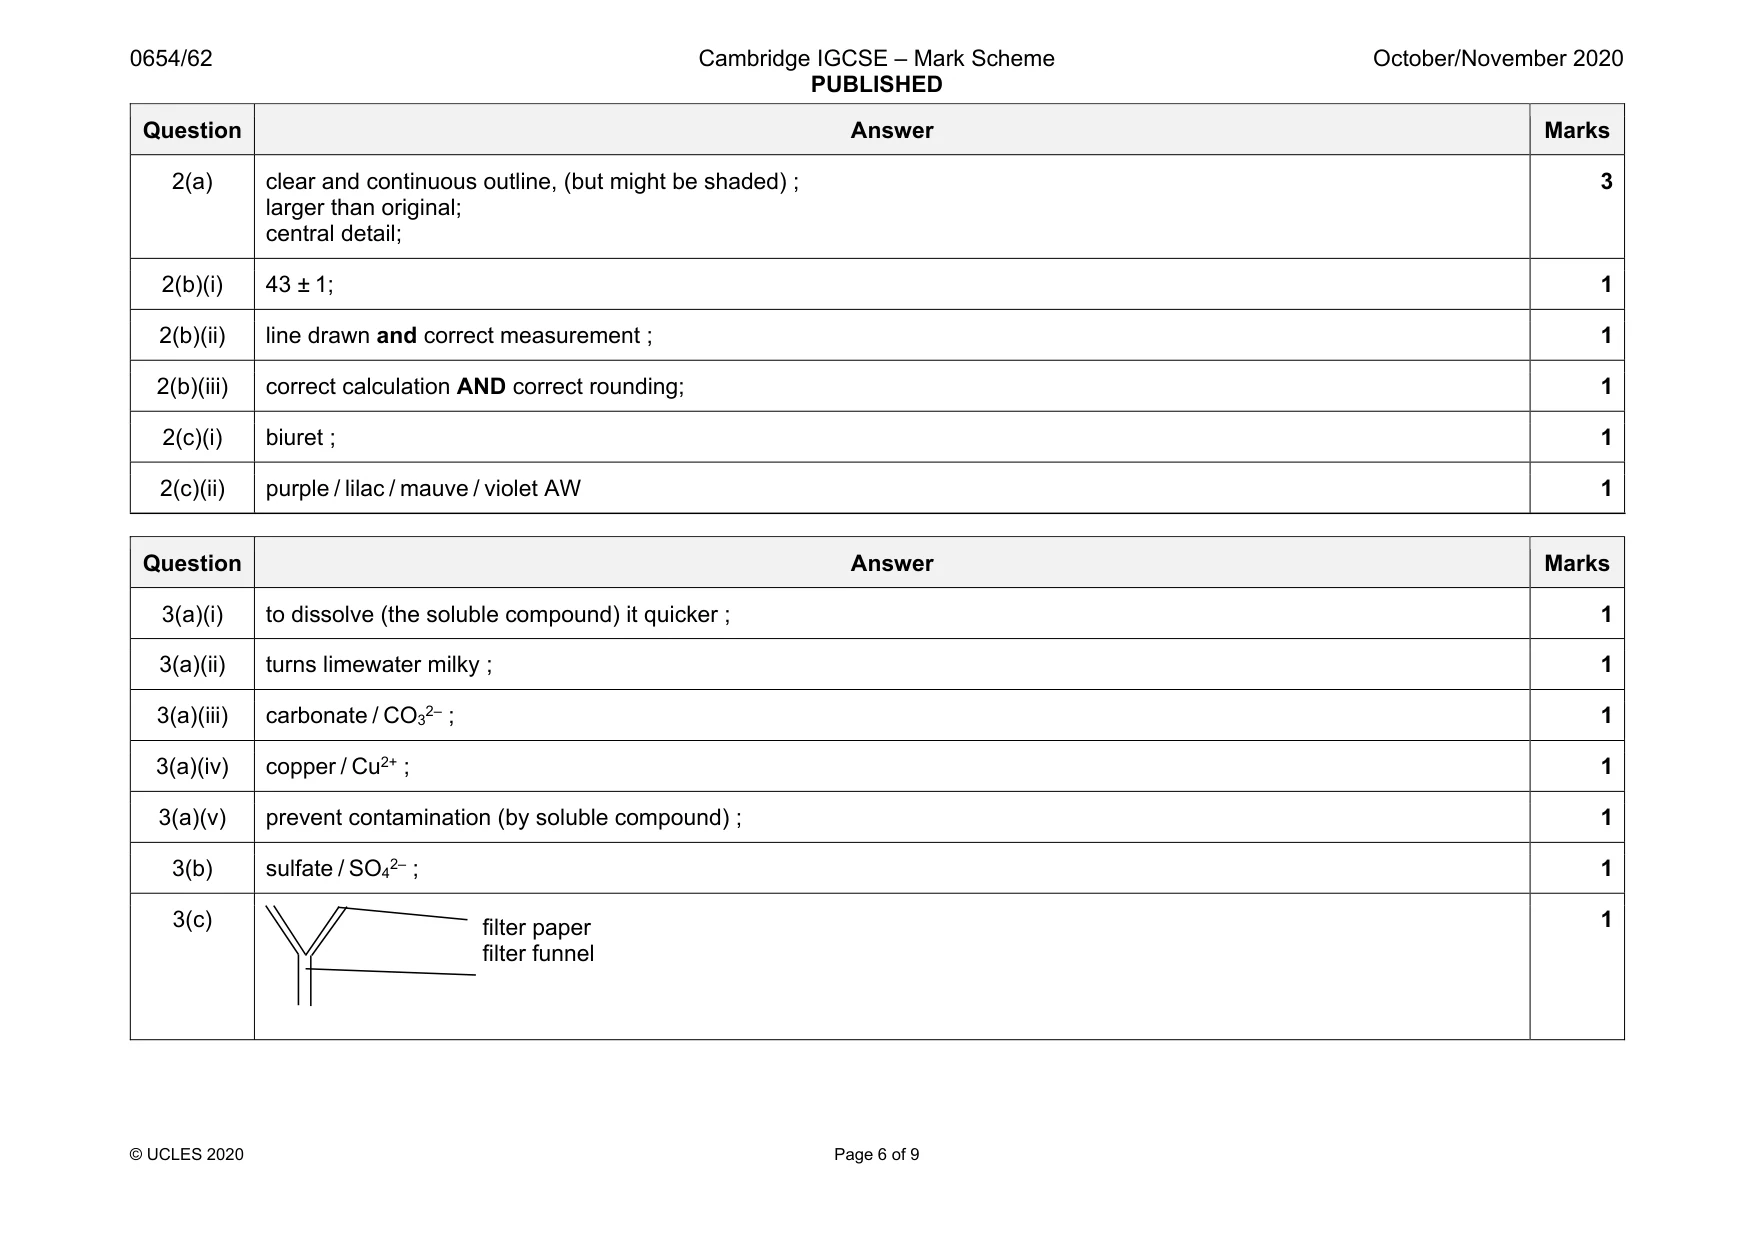
Mark scheme: 2(a) clear and continuous outline, (but might be shaded) ; larger than original; central detail; 3 2(b)(i) 43 ± 1; 1 2(b)(ii) line drawn and correct measurement ; 1 2(b)(iii) correct calculation AND correct rounding; 1 2(c)(i) biuret ; 1 2(c)(ii) purple / lilac / mauve / violet AW 1
Q3 · A student is provided with solid J, which is a mixture of two compounds
3 A student is provided with solid J, which is a mixture of two compounds. Solid J contains one cation and two anions. One compound is soluble in water and the other is insoluble in water. A student does a series of experiments to identify the ions in J. (a) The student: • places some of solid J into a beaker • adds water to J and stirs thoroughly • filters the mixture into a test-tube and keeps both the residue and the blue filtrate • washes the residue with distilled water. (i) Suggest why the student stirs the mixture of water and J. ........................................................................................................................................... ..................................................................................................................................... [1] (ii) The student places a small sample of the residue from the filter paper into a test-tube. The student adds dilute nitric acid to the residue. The mixture fizzes and gives a blue solution. Carbon dioxide is made. State the test used to identify carbon dioxide and give the observation for a positive result. test .................................................................................................................................... observation ........................................................................................................................ [1] (iii) Identify an anion shown to be present in J. ..................................................................................................................................... [1] (iv) As soon as the mixture in (a)(ii) stops fizzing the student divides the solution into two portions. • To one portion the student adds aqueous sodium hydroxide drop by drop until it is in excess. A light blue precipitate is formed that is insoluble in excess. • To the other portion the student adds aqueous ammonia drop by drop until it is in excess. A light blue precipitate is formed that is soluble in excess to give a dark blue solution. Identify the cation shown to be present in J. ..................................................................................................................................... [1] (v) Explain why it is important to wash the residue with distilled water. ........................................................................................................................................... ..................................................................................................................................... [1] (b) The student tests the blue filtrate from the test-tube in (a). The student adds dilute nitric acid followed by aqueous barium nitrate to the filtrate. A white precipitate is formed. Identify the other anion shown to be present in J. anion .................................................................................................................................. [1] (c) Draw a labelled diagram of the assembled apparatus used to filter the mixture in (a). [1] [Total: 7]
Mark scheme: 3(a)(i) to dissolve (the soluble compound) it quicker ; 1 3(a)(ii) turns limewater milky ; 1 3(a)(iii) carbonate / CO32– ; 1 3(a)(iv) copper / Cu2+ ; 1 3(a)(v) prevent contamination (by soluble compound) ; 1 3(b) sulfate / SO42– ; 1 3(c) 1 filter paper filter funnel
Q4 · A student investigates the time taken for the reaction between magnesium ribbon and…
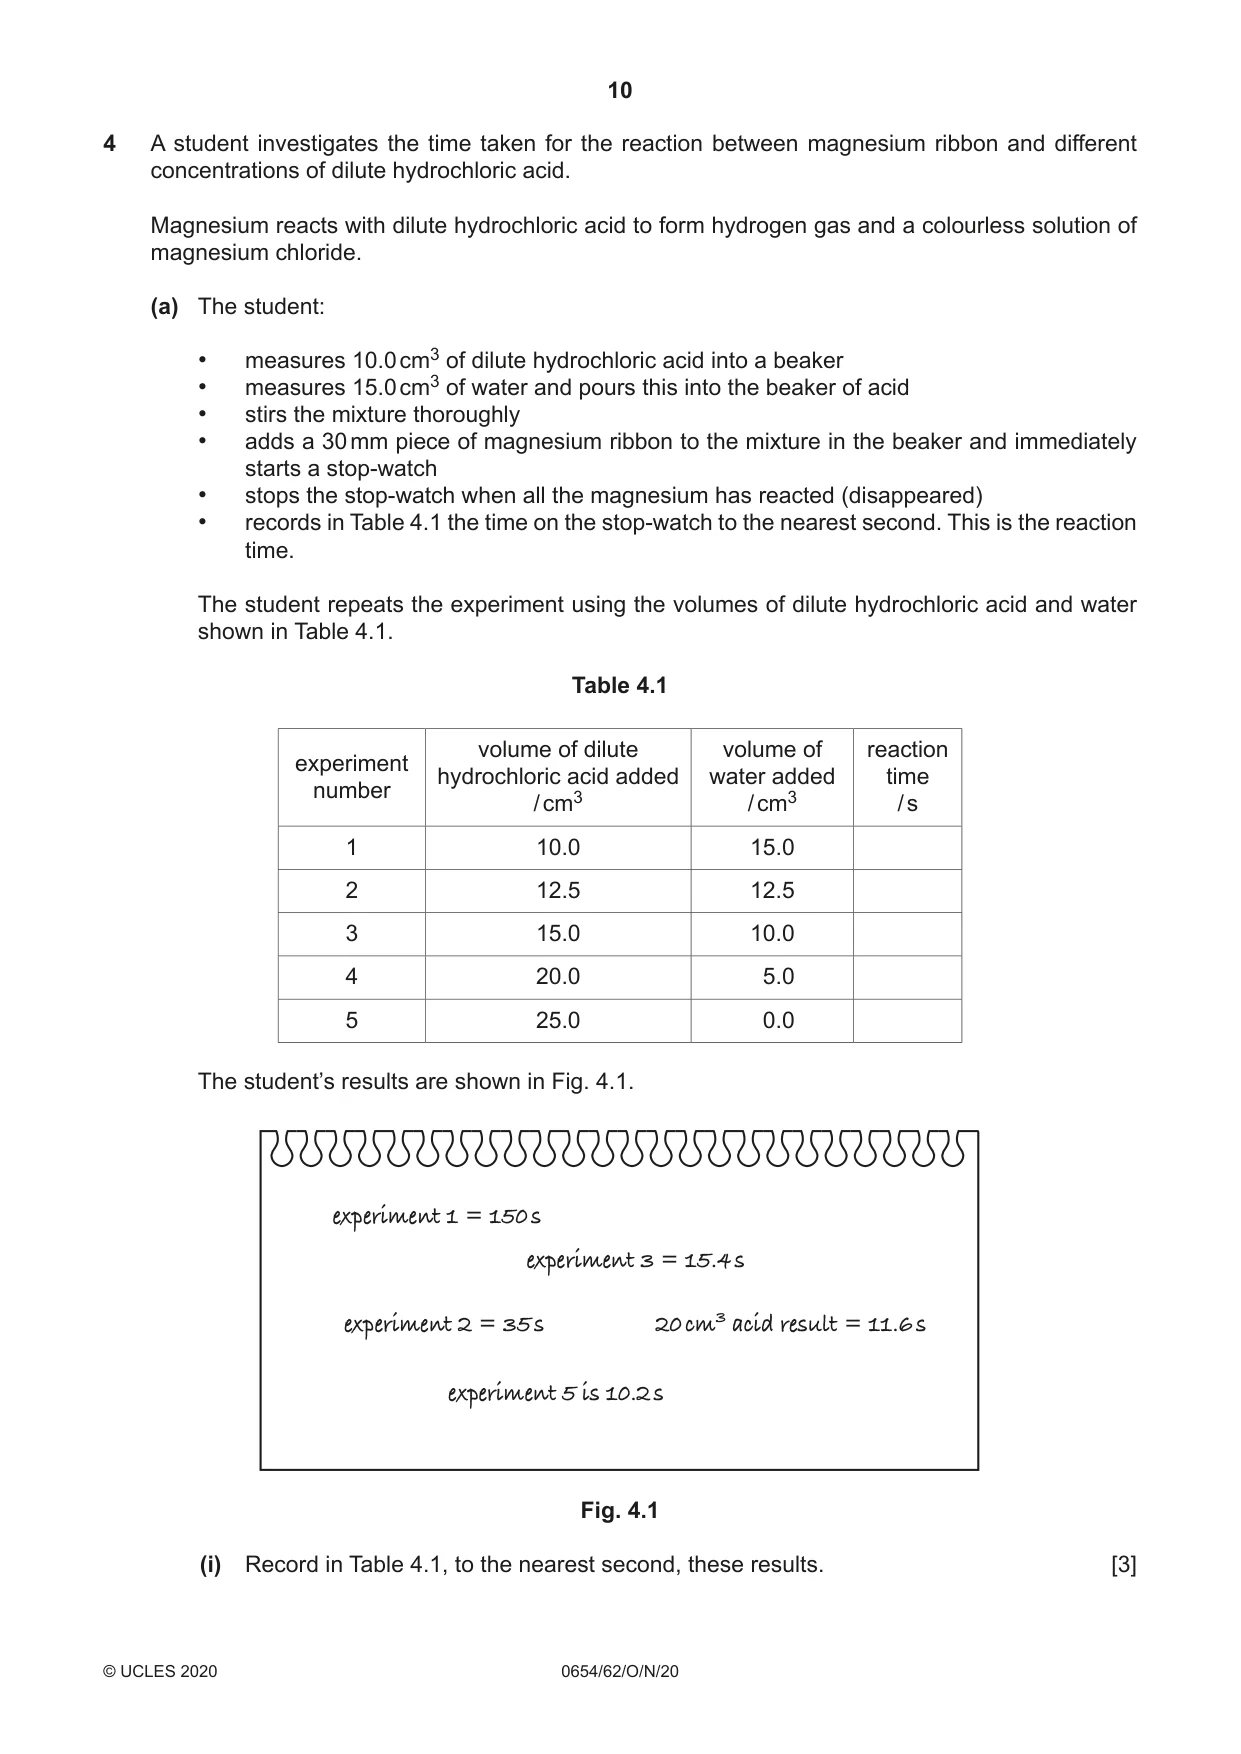
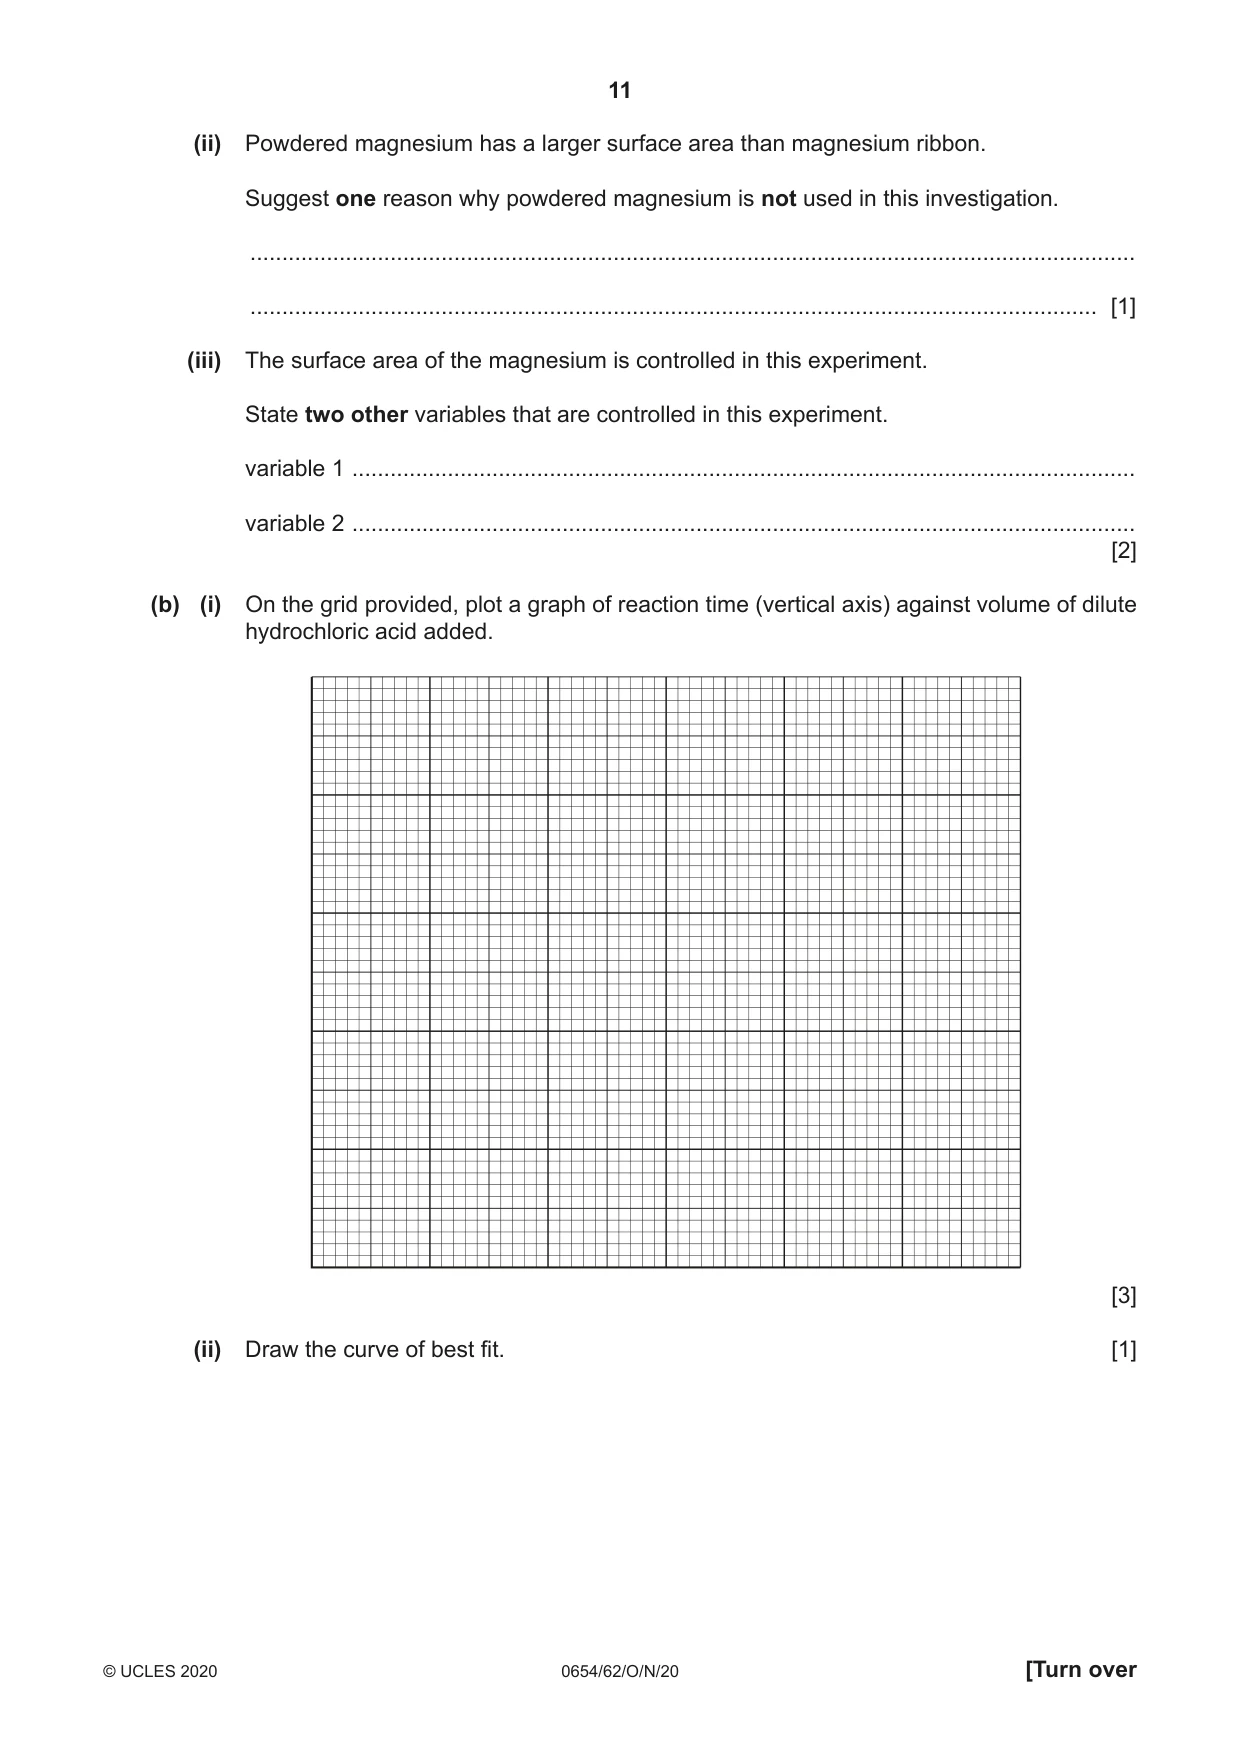
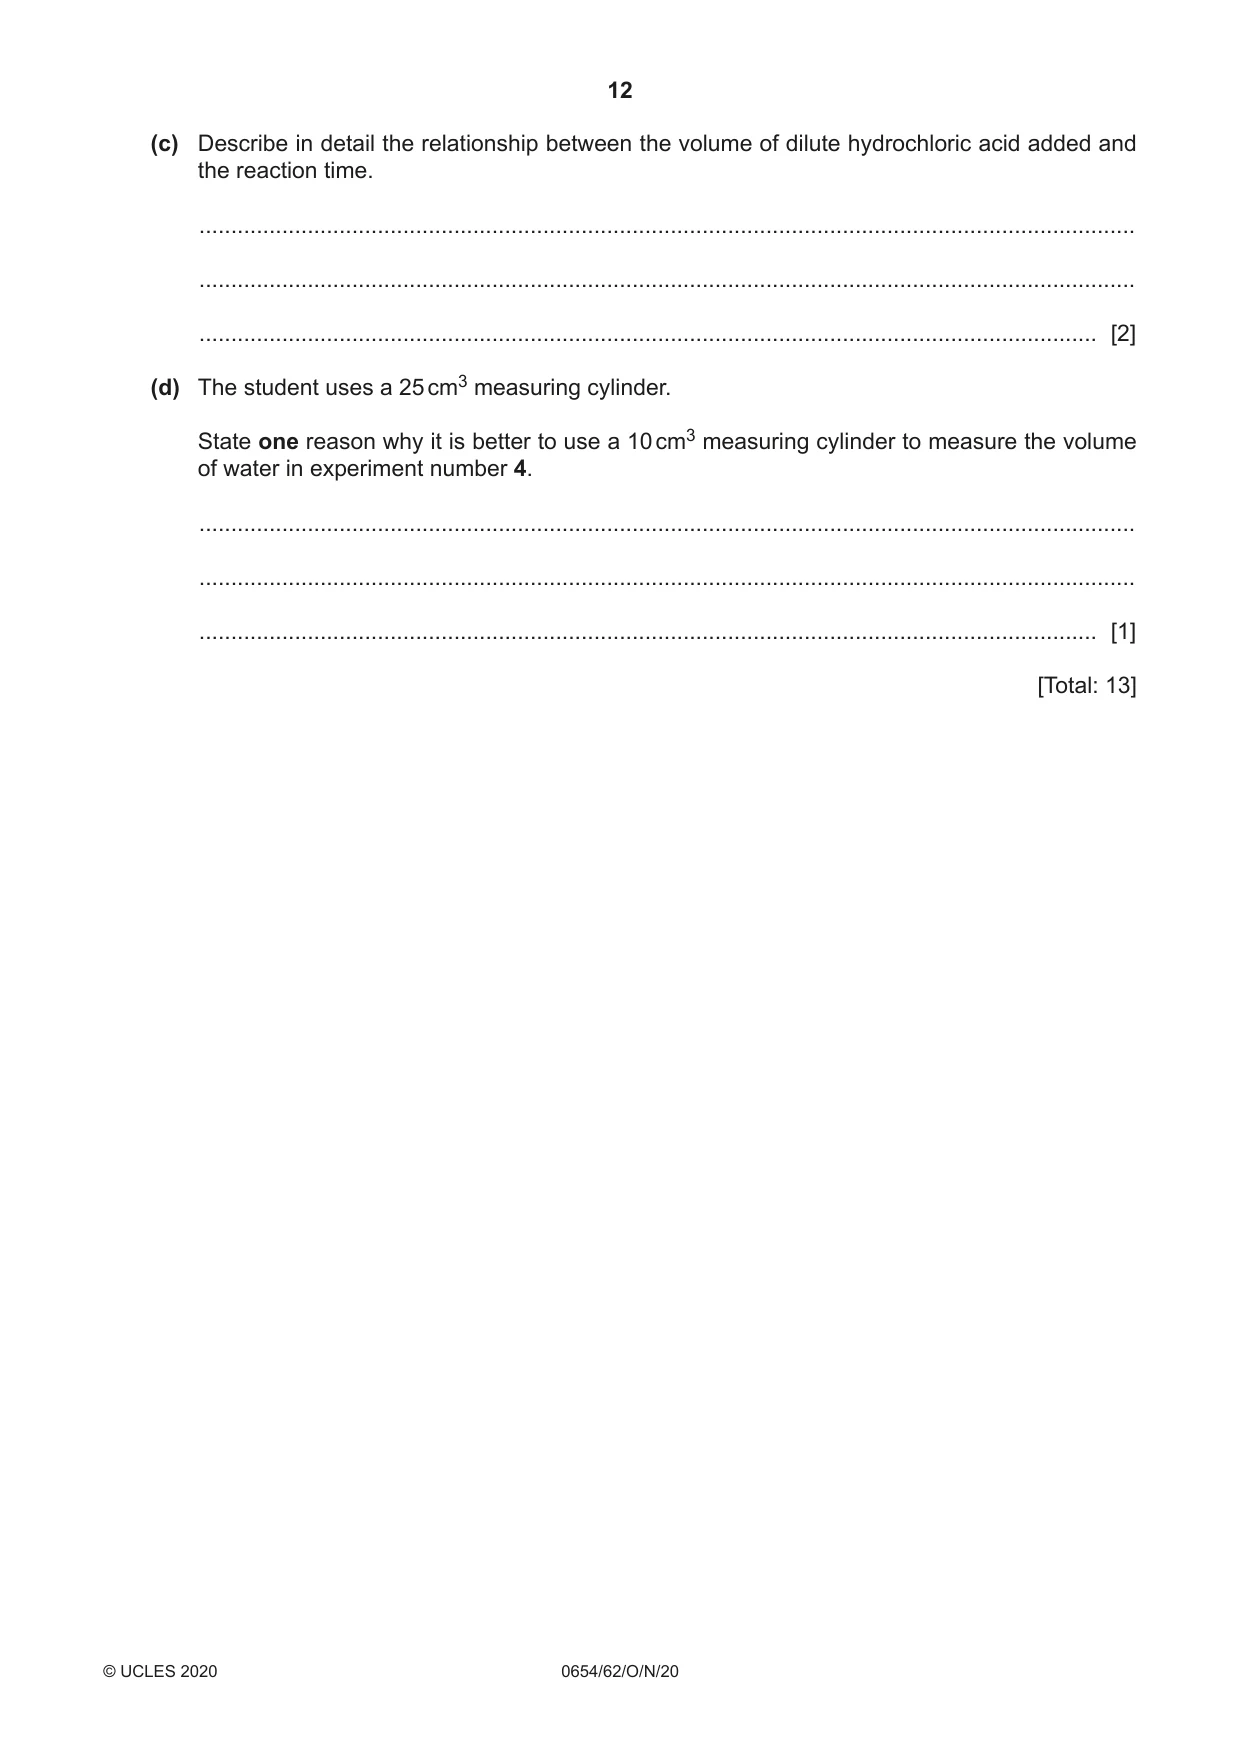
4 A student investigates the time taken for the reaction between magnesium ribbon and different concentrations of dilute hydrochloric acid. Magnesium reacts with dilute hydrochloric acid to form hydrogen gas and a colourless solution of magnesium chloride. (a) The student: • measures 10.0 cm3 of dilute hydrochloric acid into a beaker • measures 15.0 cm3 of water and pours this into the beaker of acid • stirs the mixture thoroughly • adds a 30 mm piece of magnesium ribbon to the mixture in the beaker and immediately starts a stop-watch • stops the stop-watch when all the magnesium has reacted (disappeared) • records in Table 4.1 the time on the stop-watch to the nearest second. This is the reaction time. The student repeats the experiment using the volumes of dilute hydrochloric acid and water shown in Table 4.1. Table 4.1 volume of dilute volume of reaction experiment hydrochloric acid added water added time number / cm3 / cm3 / s 1 10.0 15.0 2 12.5 12.5 3 15.0 10.0 4 20.0 5.0 5 25.0 0.0 The student’s results are shown in Fig. 4.1. experiment 1 = 150 s experiment 3 = 15.4 s experiment 2 = 35 s 20 cm3 acid result = 11.6 s experiment 5 is 10.2 s Fig. 4.1 (i) Record in Table 4.1, to the nearest second, these results. [3] (ii) Powdered magnesium has a larger surface area than magnesium ribbon. Suggest one reason why powdered magnesium is not used in this investigation. ........................................................................................................................................... ..................................................................................................................................... [1] (iii) The surface area of the magnesium is controlled in this experiment. State two other variables that are controlled in this experiment. variable 1 ........................................................................................................................... variable 2 ........................................................................................................................... [2] (b) (i) On the grid provided, plot a graph of reaction time (vertical axis) against volume of dilute hydrochloric acid added. [3] (ii) Draw the curve of best fit. [1] (c) Describe in detail the relationship between the volume of dilute hydrochloric acid added and the reaction time. ................................................................................................................................................... ................................................................................................................................................... ............................................................................................................................................. [2] (d) The student uses a 25 cm3 measuring cylinder. State one reason why it is better to use a 10 cm3 measuring cylinder to measure the volume of water in experiment number 4. ................................................................................................................................................... ................................................................................................................................................... ............................................................................................................................................. [1] [Total: 13]
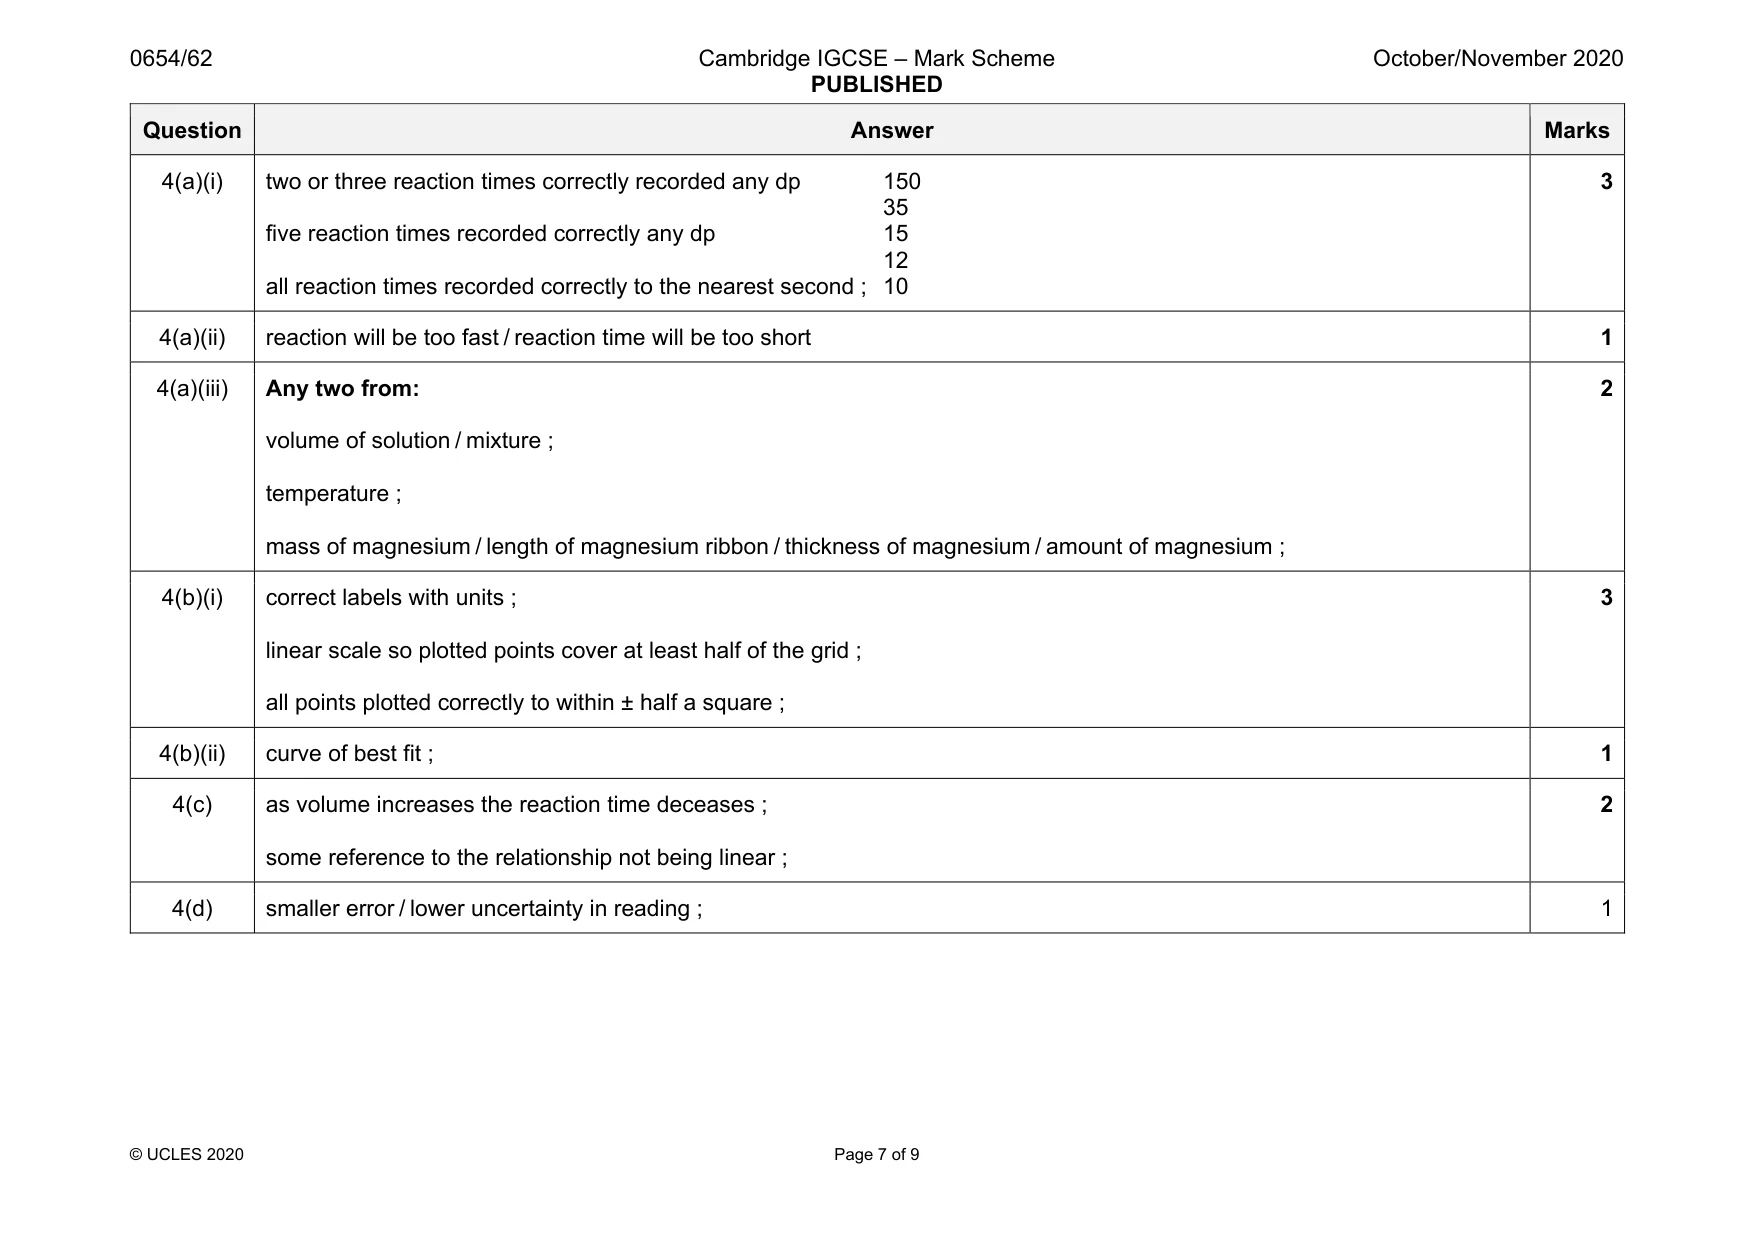
Mark scheme: 4(a)(i) two or three reaction times correctly recorded any dp 150 35 five reaction times recorded correctly any dp 15 12 all reaction times recorded correctly to the nearest second ; 10 3 4(a)(ii) reaction will be too fast / reaction time will be too short 1 4(a)(iii) Any two from: volume of solution / mixture ; temperature ; mass of magnesium / length of magnesium ribbon / thickness of magnesium / amount of magnesium ; 2 4(b)(i) correct labels with units ; linear scale so plotted points cover at least half of the grid ; all points plotted correctly to within ± half a square ; 3 4(b)(ii) curve of best fit ; 1 4(c) as volume increases the reaction time deceases ; some reference to the relationship not being linear ; 2 4(d) smaller error / lower uncertainty in reading ; 1
Q5 · A student investigates how the resistance R of a lamp and its power P vary with the…
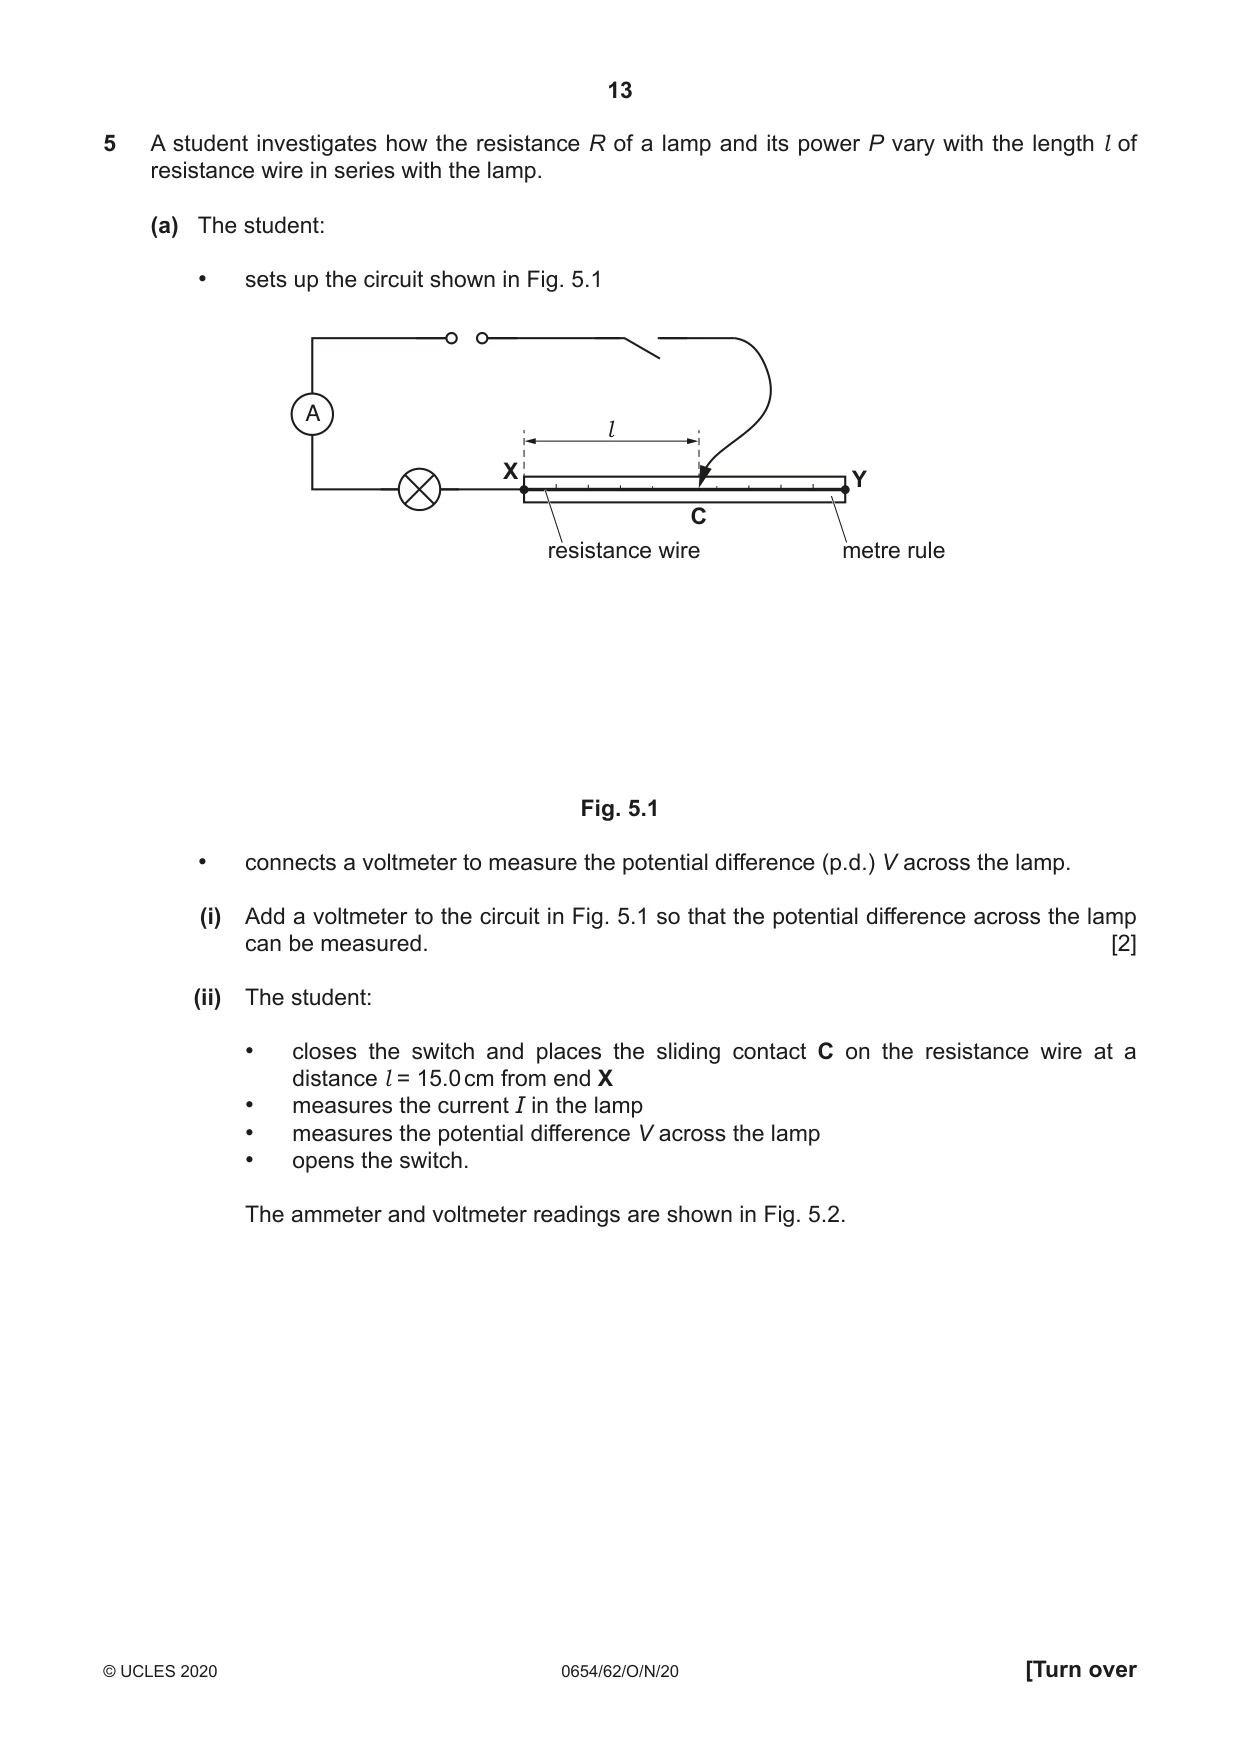
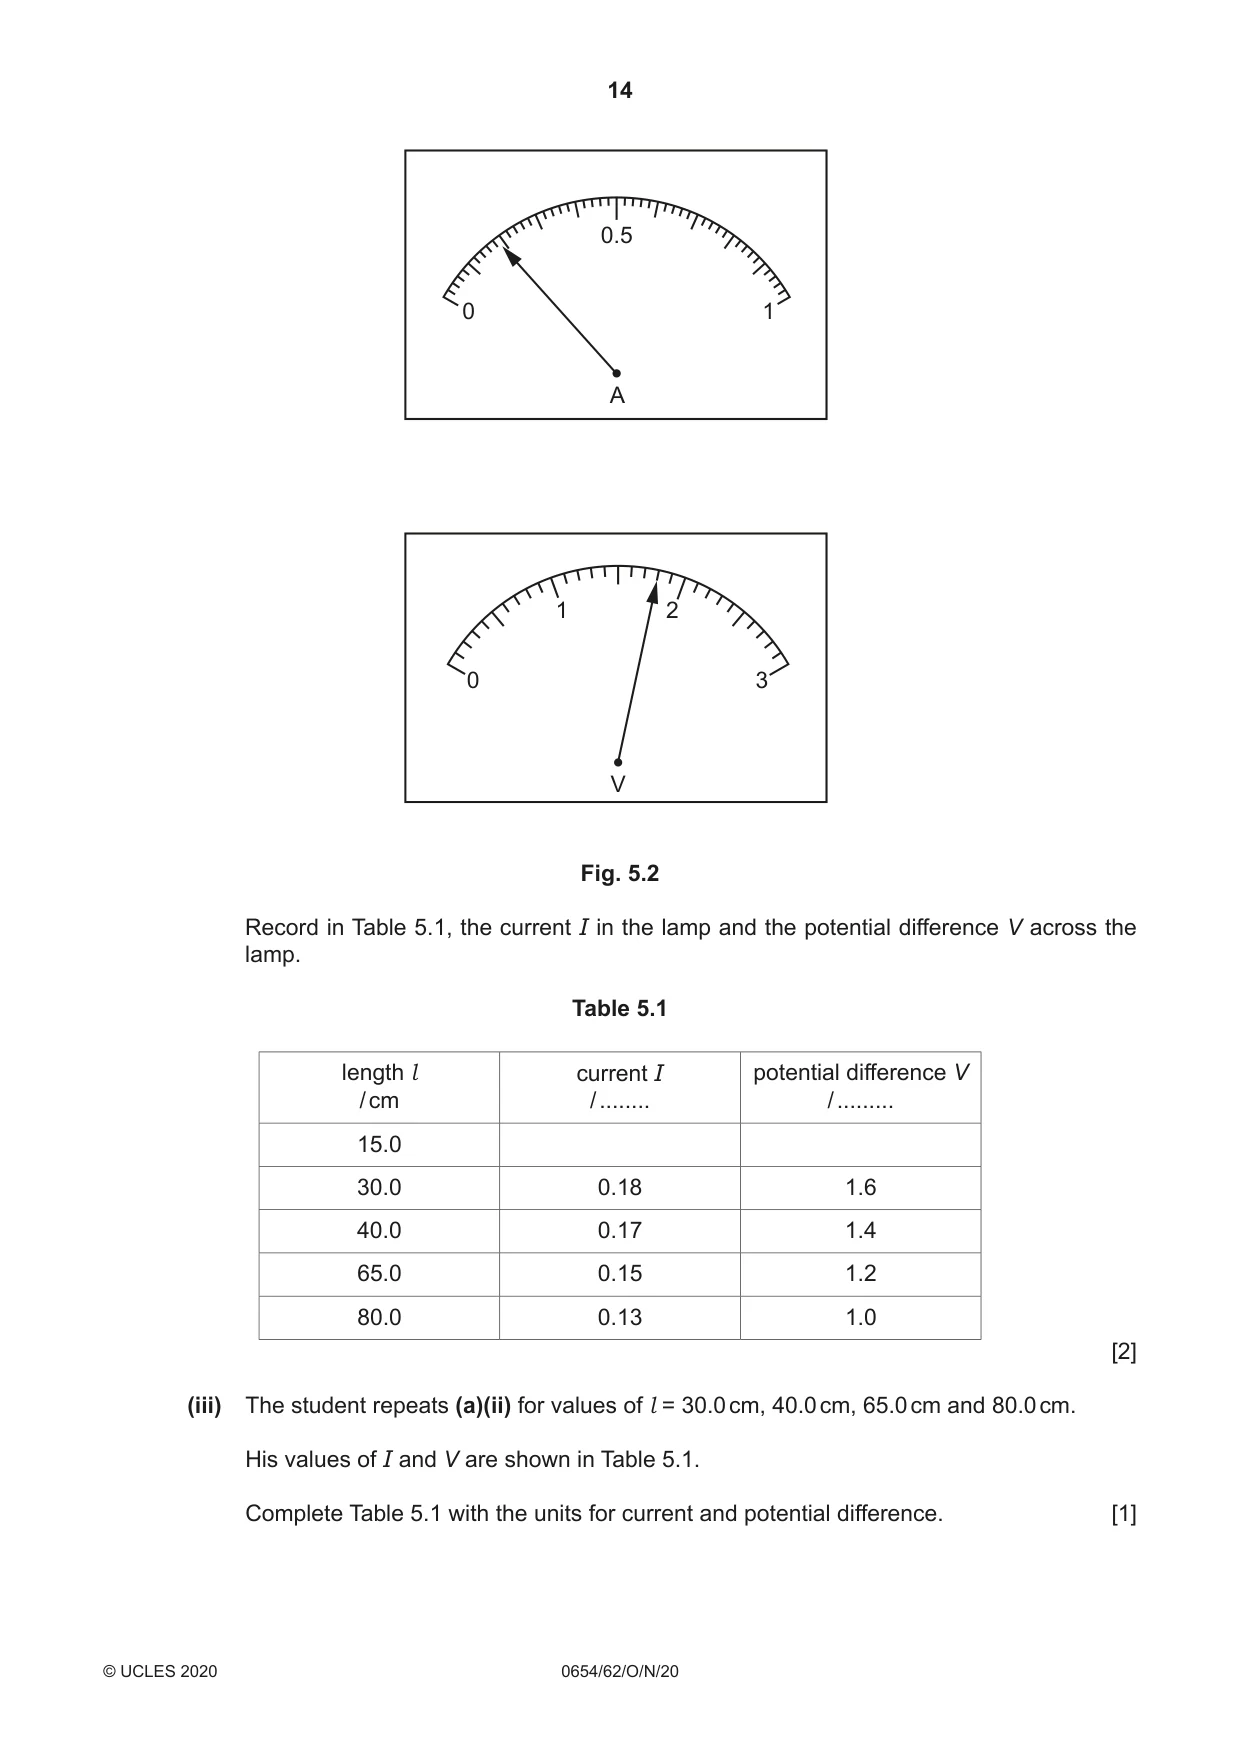
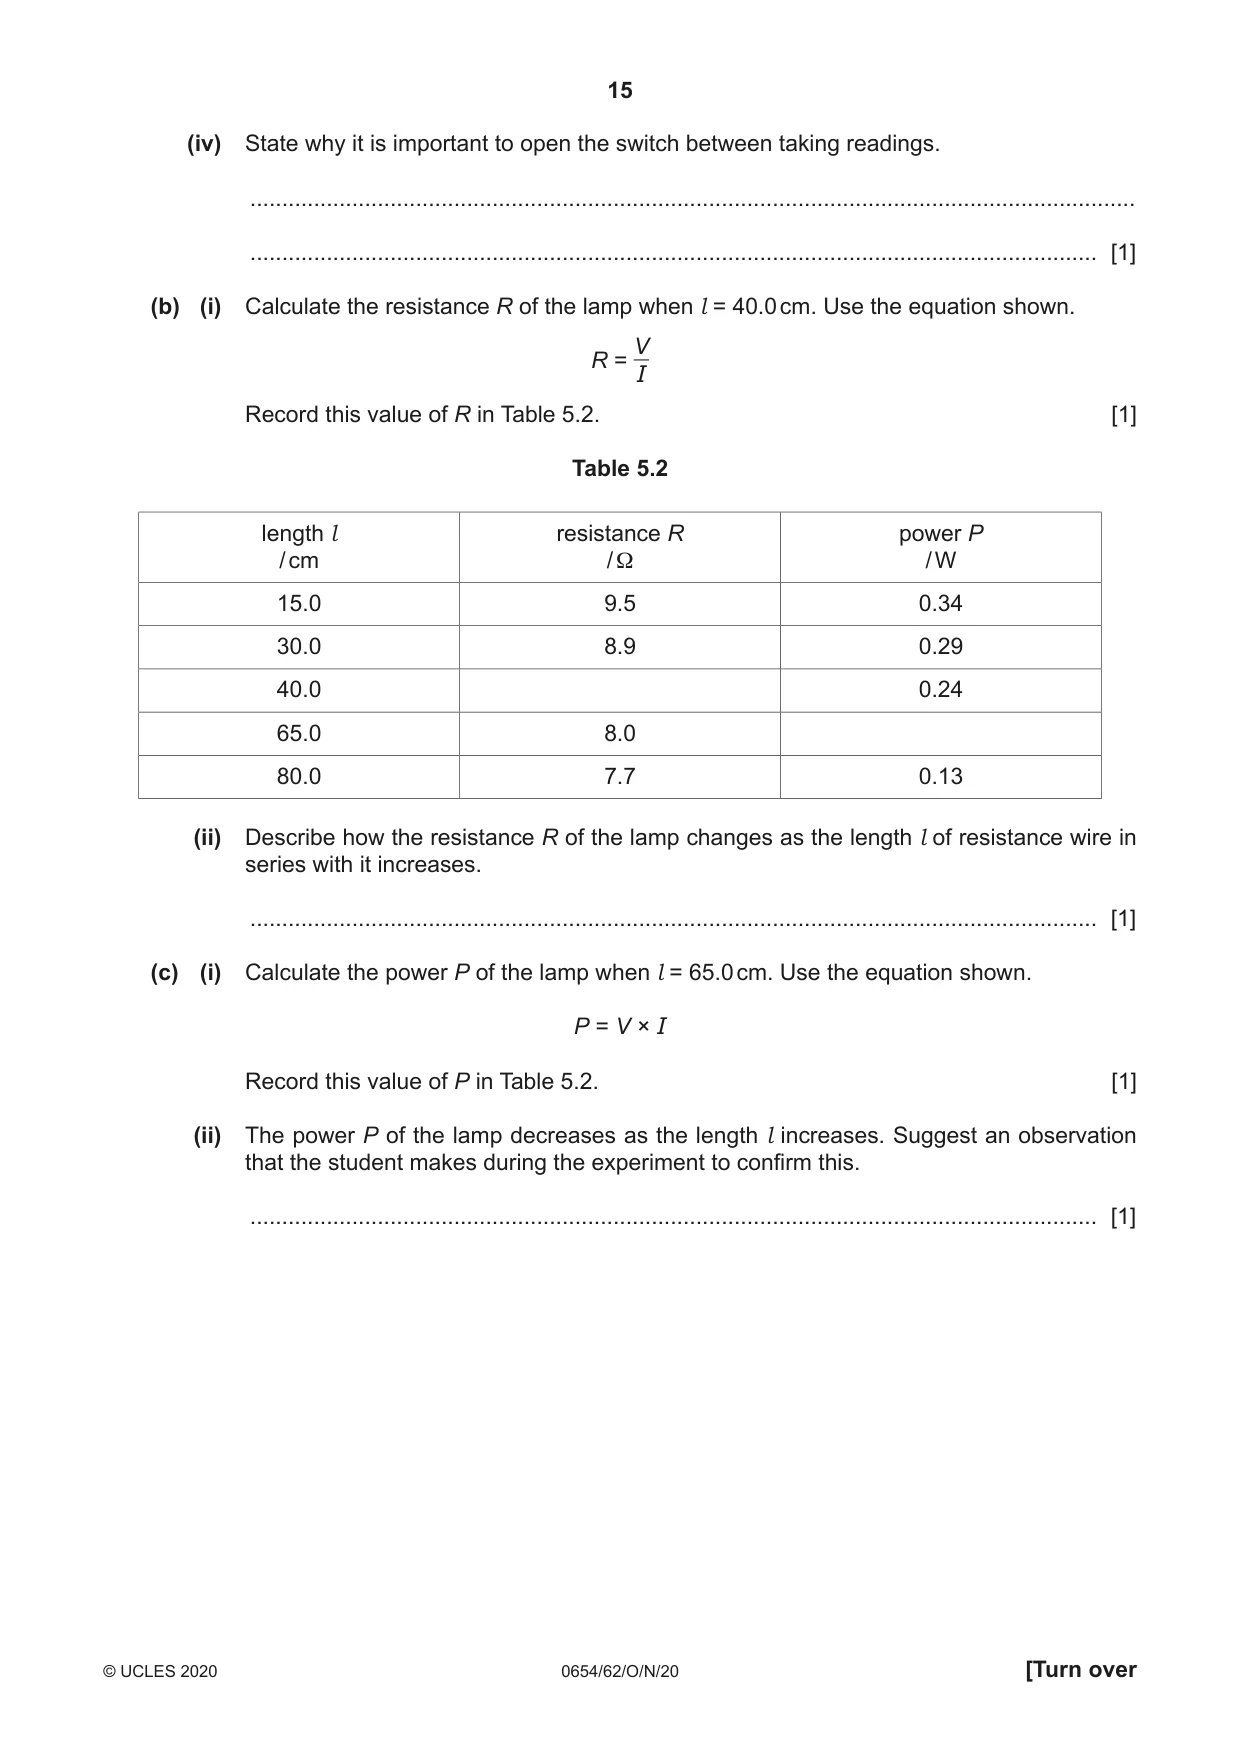
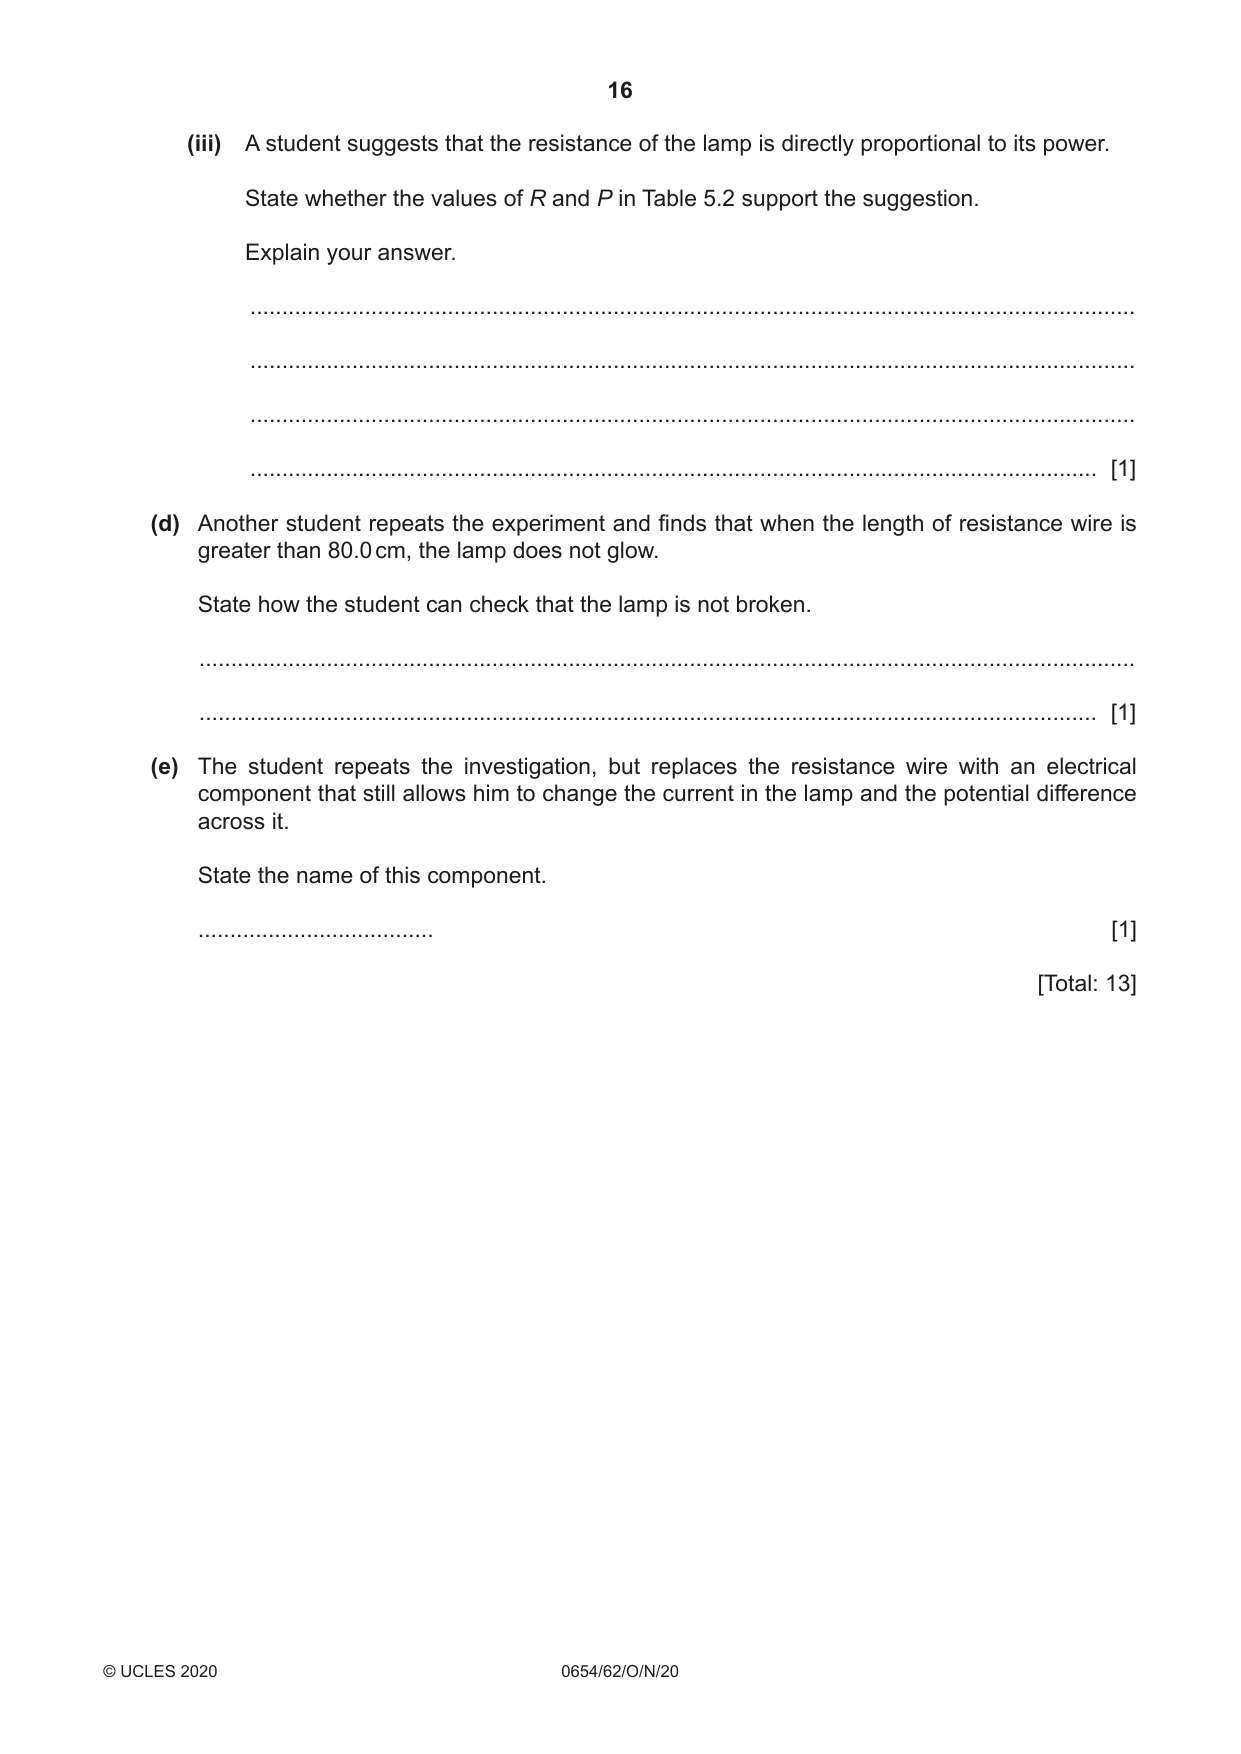
5 A student investigates how the resistance R of a lamp and its power P vary with the length l of resistance wire in series with the lamp. (a) The student: • sets up the circuit shown in Fig. 5.1 A l X Y C resistance wire metre rule Fig. 5.1 • connects a voltmeter to measure the potential difference (p.d.) V across the lamp. (i) Add a voltmeter to the circuit in Fig. 5.1 so that the potential difference across the lamp can be measured. [2] (ii) The student: • closes the switch and places the sliding contact C on the resistance wire at a distance l = 15.0 cm from end X • measures the current I in the lamp • measures the potential difference V across the lamp • opens the switch. The ammeter and voltmeter readings are shown in Fig. 5.2. 0.5 0 1 A 1 2 0 3 V Fig. 5.2 Record in Table 5.1, the current I in the lamp and the potential difference V across the lamp. Table 5.1 length l current I potential difference V / cm / ........ / ......... 15.0 30.0 0.18 1.6 40.0 0.17 1.4 65.0 0.15 1.2 80.0 0.13 1.0 [2] (iii) The student repeats (a)(ii) for values of l = 30.0 cm, 40.0 cm, 65.0 cm and 80.0 cm. His values of I and V are shown in Table 5.1. Complete Table 5.1 with the units for current and potential difference. [1] (iv) State why it is important to open the switch between taking readings. ........................................................................................................................................... ..................................................................................................................................... [1] (b) (i) Calculate the resistance R of the lamp when l = 40.0 cm. Use the equation shown. V R = I Record this value of R in Table 5.2. [1] Table 5.2 length l resistance R power P / cm / Ω / W 15.0 9.5 0.34 30.0 8.9 0.29 40.0 0.24 65.0 8.0 80.0 7.7 0.13 (ii) Describe how the resistance R of the lamp changes as the length l of resistance wire in series with it increases. ..................................................................................................................................... [1] (c) (i) Calculate the power P of the lamp when l = 65.0 cm. Use the equation shown. P = V × I Record this value of P in Table 5.2. [1] (ii) The power P of the lamp decreases as the length l increases. Suggest an observation that the student makes during the experiment to confirm this. ..................................................................................................................................... [1] (iii) A student suggests that the resistance of the lamp is directly proportional to its power. State whether the values of R and P in Table 5.2 support the suggestion. Explain your answer. ........................................................................................................................................... ........................................................................................................................................... ........................................................................................................................................... ..................................................................................................................................... [1] (d) Another student repeats the experiment and finds that when the length of resistance wire is greater than 80.0 cm, the lamp does not glow. State how the student can check that the lamp is not broken. ................................................................................................................................................... ............................................................................................................................................. [1] (e) The student repeats the investigation, but replaces the resistance wire with an electrical component that still allows him to change the current in the lamp and the potential difference across it. State the name of this component. ..................................... [1] [Total: 13]
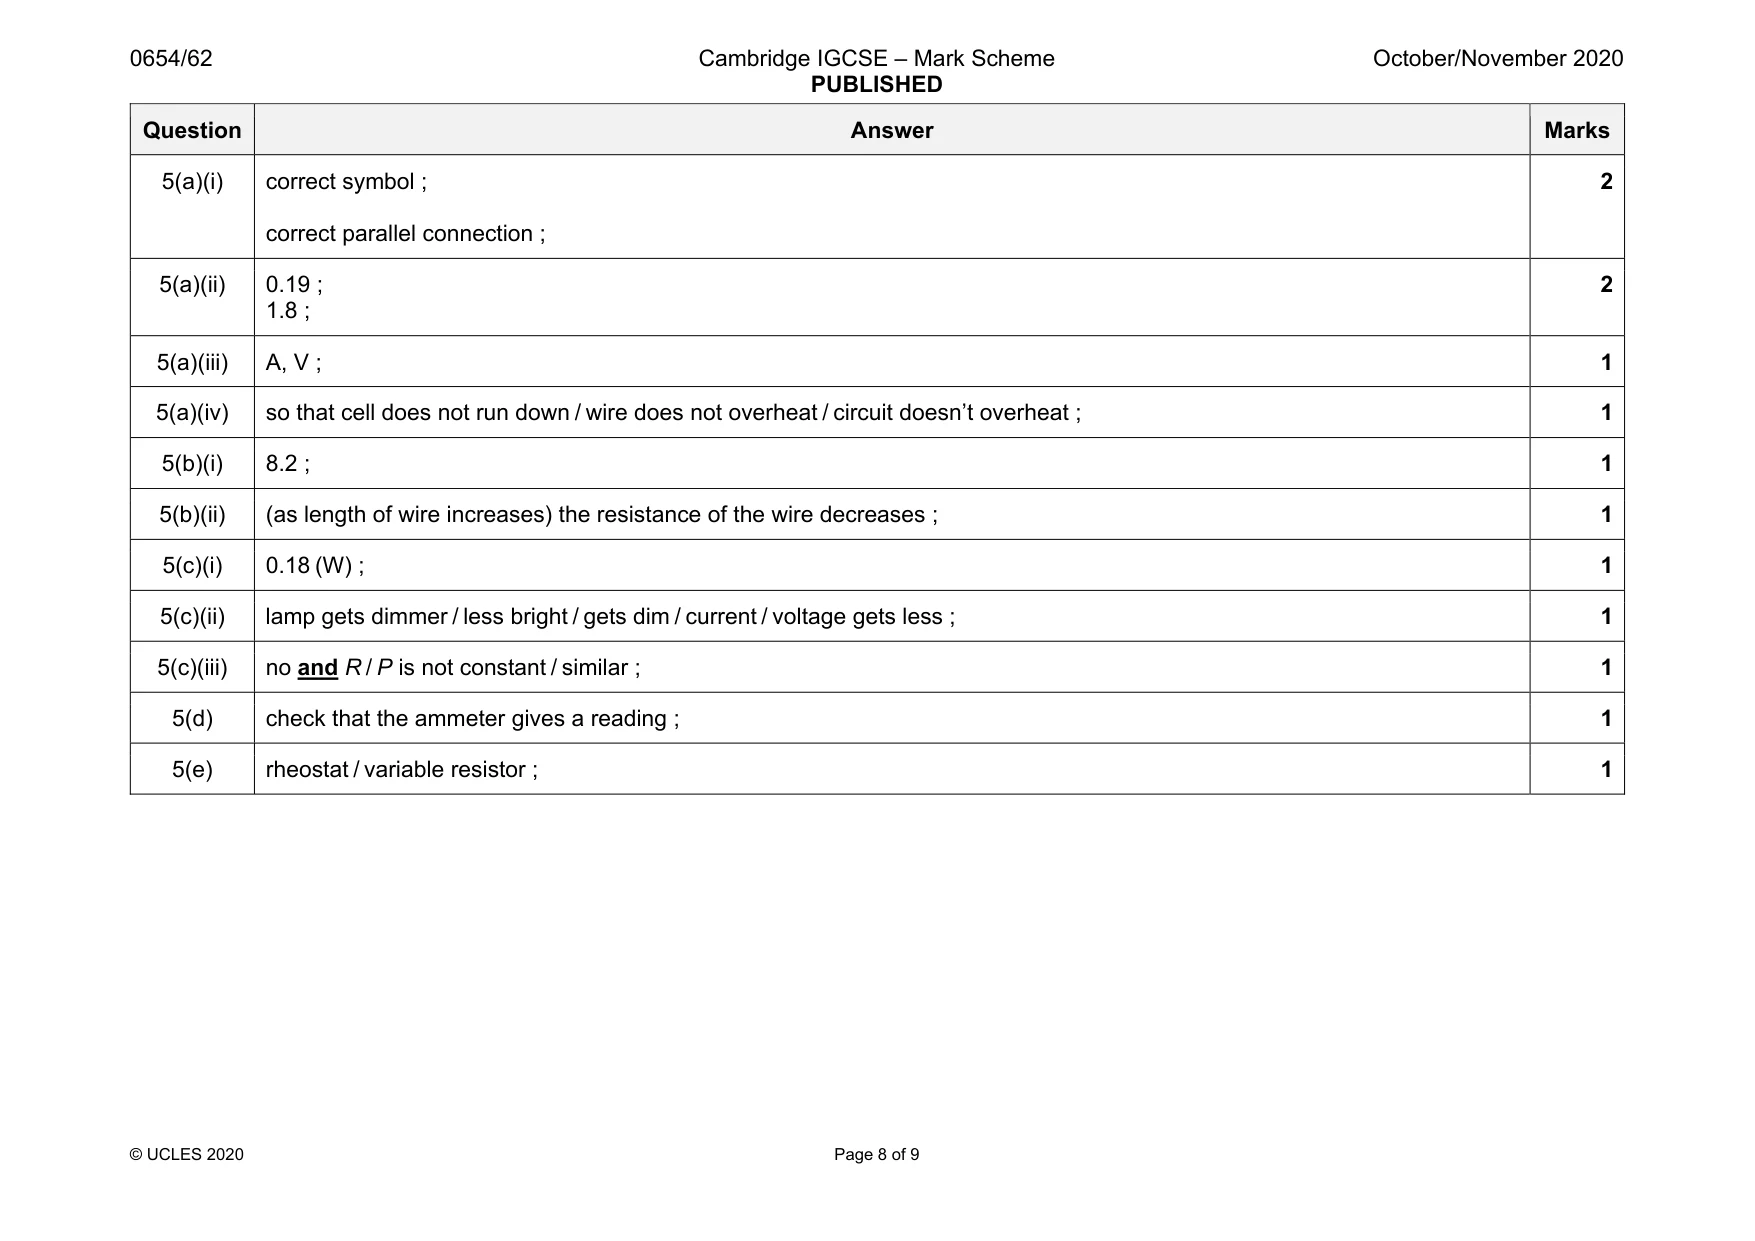
Mark scheme: 5(a)(i) correct symbol ; correct parallel connection ; 2 5(a)(ii) 0.19 ; 1.8 ; 2 5(a)(iii) A, V ; 1 5(a)(iv) so that cell does not run down / wire does not overheat / circuit doesn’t overheat ; 1 5(b)(i) 8.2 ; 1 5(b)(ii) (as length of wire increases) the resistance of the wire decreases ; 1 5(c)(i) 0.18 (W) ; 1 5(c)(ii) lamp gets dimmer / less bright / gets dim / current / voltage gets less ; 1 5(c)(iii) no and R / P is not constant / similar ; 1 5(d) check that the ammeter gives a reading ; 1 5(e) rheostat / variable resistor ; 1
Q6 · A student investigates how the extension of a spring depends upon the original length of…
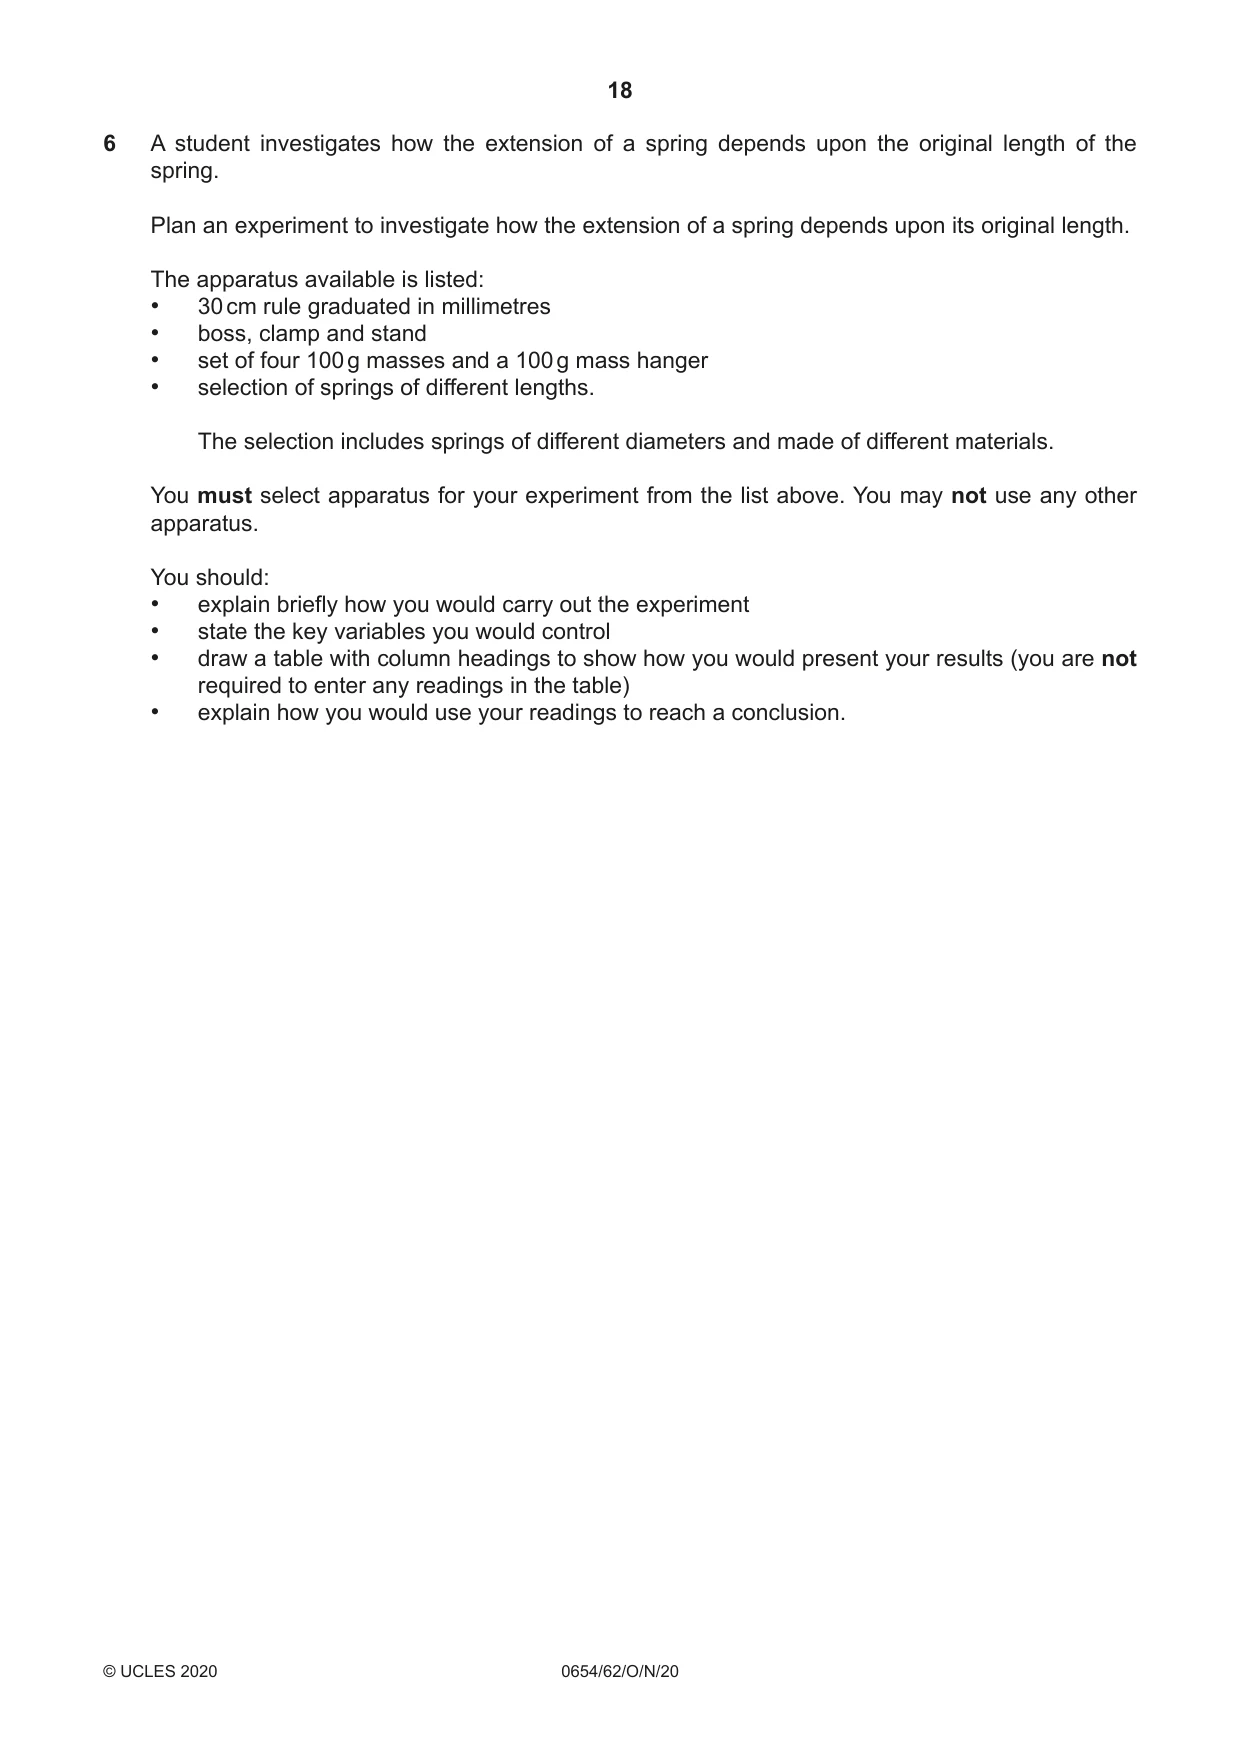
6 A student investigates how the extension of a spring depends upon the original length of the spring. Plan an experiment to investigate how the extension of a spring depends upon its original length. The apparatus available is listed: • 30 cm rule graduated in millimetres • boss, clamp and stand • set of four 100 g masses and a 100 g mass hanger • selection of springs of different lengths. The selection includes springs of different diameters and made of different materials. You must select apparatus for your experiment from the list above. You may not use any other apparatus. You should: • explain briefly how you would carry out the experiment • state the key variables you would control • draw a table with column headings to show how you would present your results (you are not required to enter any readings in the table) • explain how you would use your readings to reach a conclusion. .......................................................................................................................................................... .......................................................................................................................................................... .......................................................................................................................................................... .......................................................................................................................................................... .......................................................................................................................................................... .......................................................................................................................................................... .......................................................................................................................................................... .......................................................................................................................................................... .......................................................................................................................................................... .......................................................................................................................................................... [7]
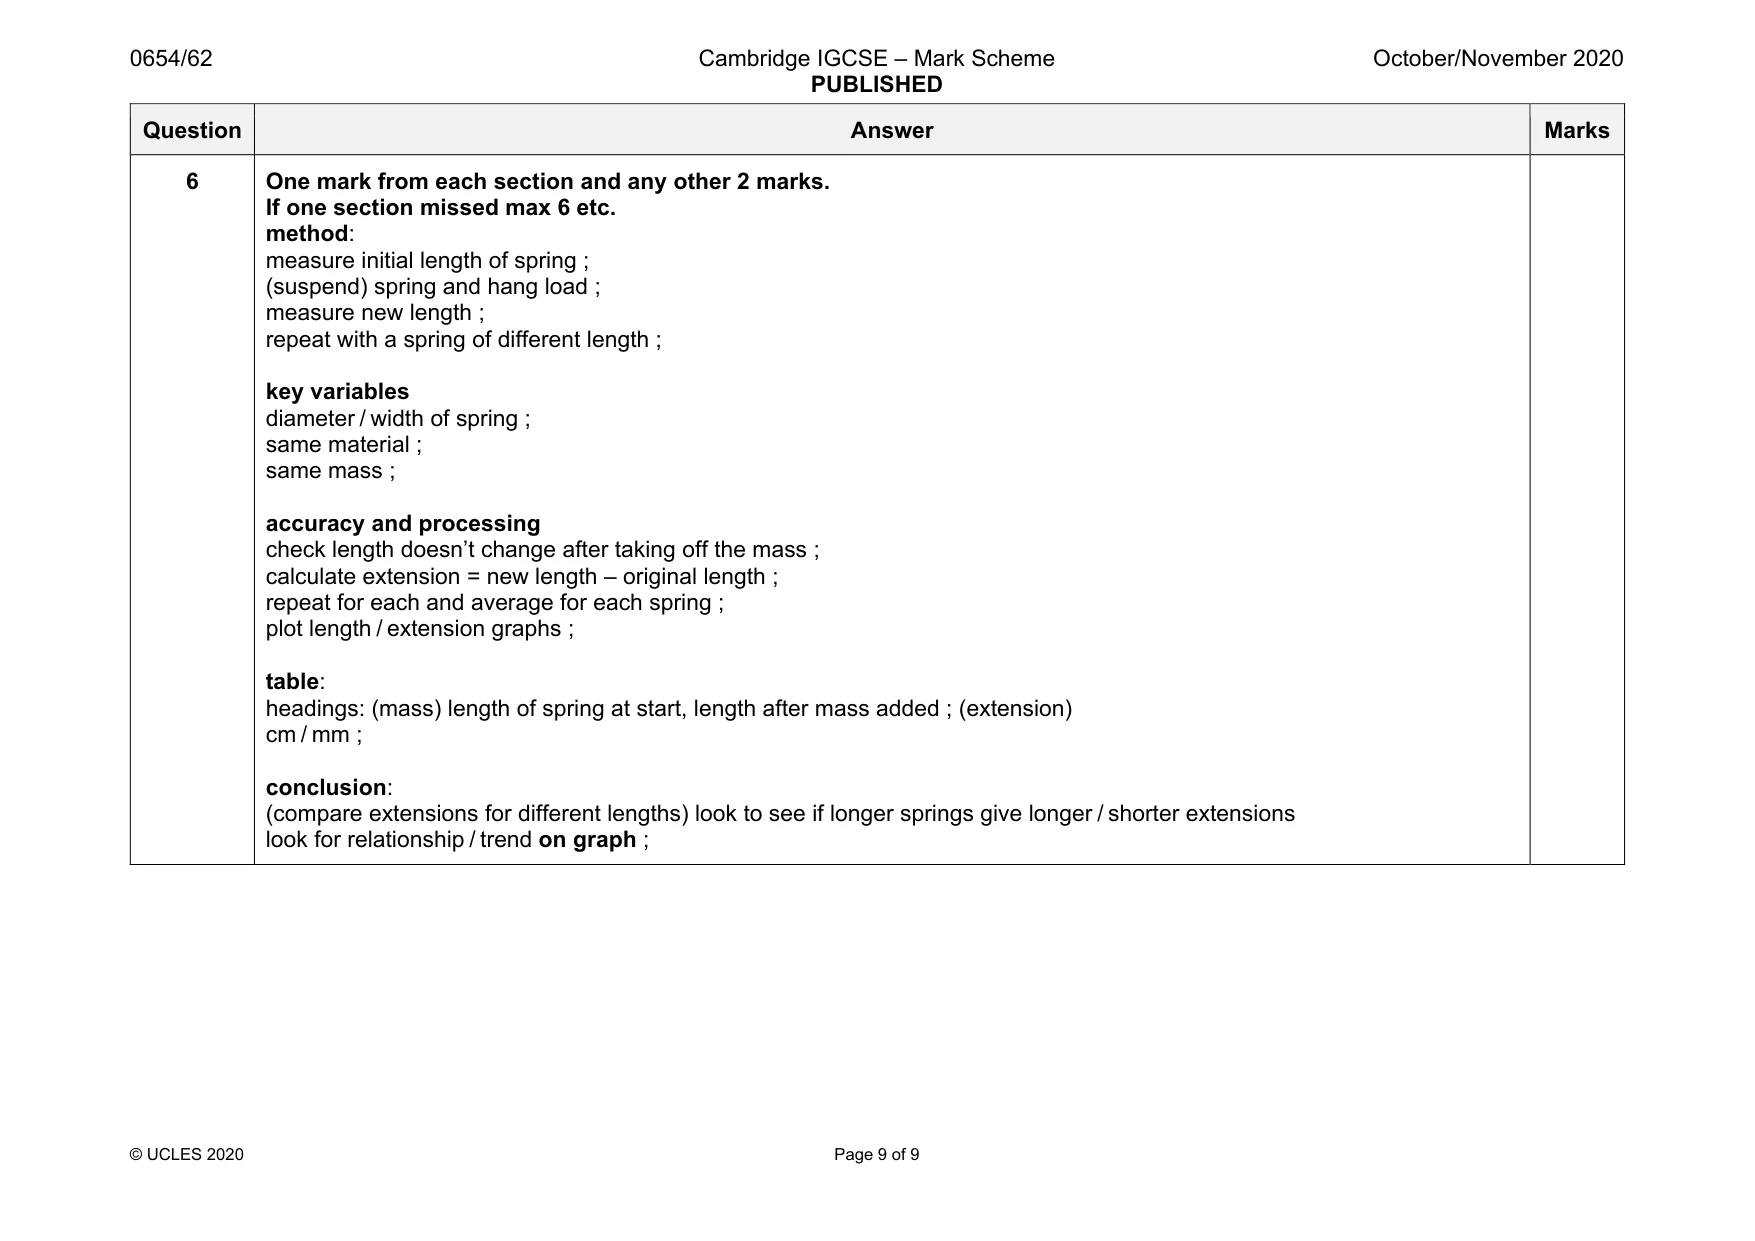
Mark scheme: 6 One mark from each section and any other 2 marks. If one section missed max 6 etc. method: measure initial length of spring ; (suspend) spring and hang load ; measure new length ; repeat with a spring of different length ; key variables diameter / width of spring ; same material ; same mass ; accuracy and processing check length doesn’t change after taking off the mass ; calculate extension = new length – original length ; repeat for each and average for each spring ; plot length / extension graphs ; table: headings: (mass) length of spring at start, length after mass added ; (extension) cm / mm ; conclusion: (compare extensions for different lengths) look to see if longer springs give longer / shorter extensions look for relationship / trend on graph ;
What was in this paper
The subtopics covered by these 6 questions, and how many questions each got. Open one in a new tab to see every Cambridge question on it.
What you needed in this session
Cambridge’s own grade thresholds for 2020 Oct/Nov, Paper 6 · Variant 2. A higher threshold means an easier paper — the bar moves with how the cohort did.