Cambridge IGCSE Sciences - Co-ordinated (Double) 0654 — 2025 May/June Paper 6 · Variant 3
0654/63/M/J/25 · 6 questions · 60 marks · 90 min
The question paper and its mark scheme, free to read here and free to download. This is Cambridge’s own paper, exactly as it was sat.
Question paper24 pages






Mark scheme12 pages
Answers below. Sit the paper first if you are practising.
Questions as text
Q1 · Urine tests are commonly used for the diagnosis of diseases
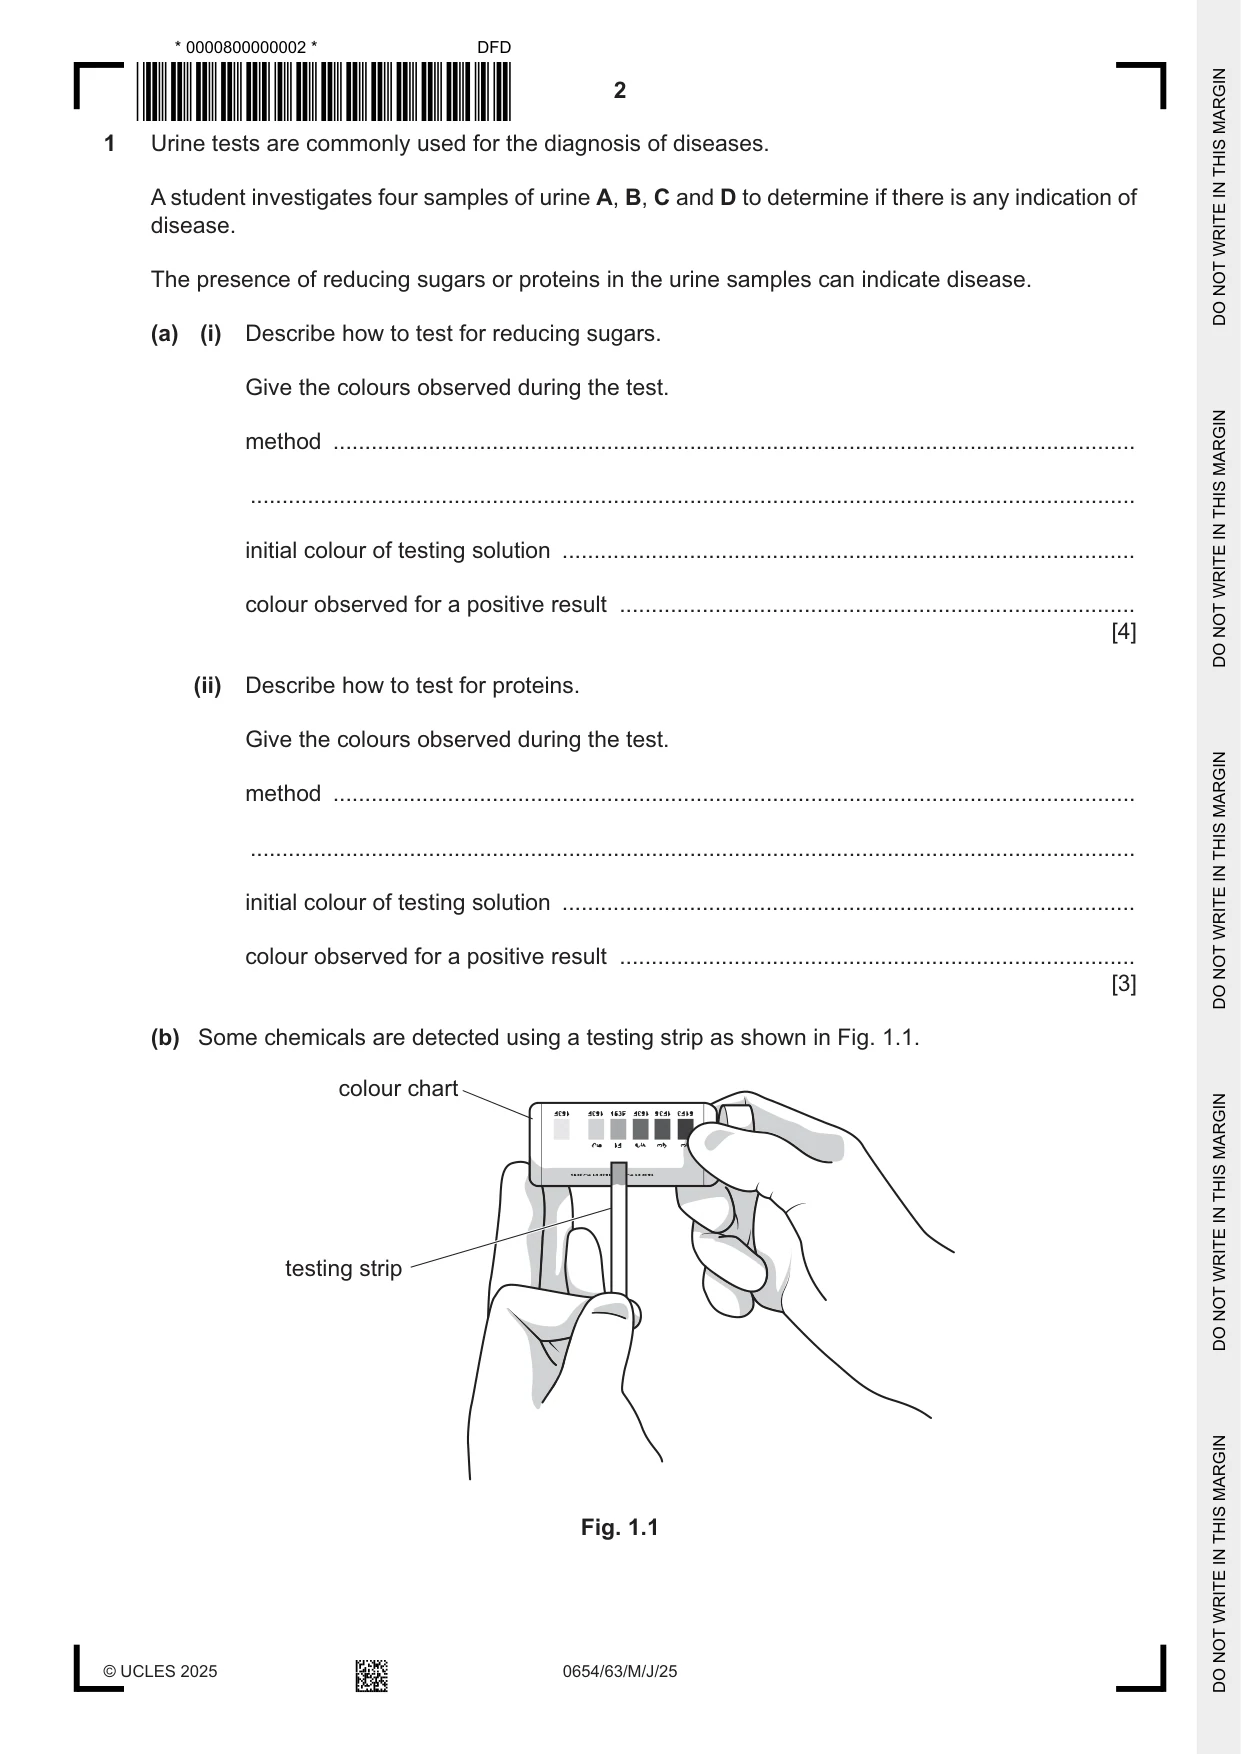
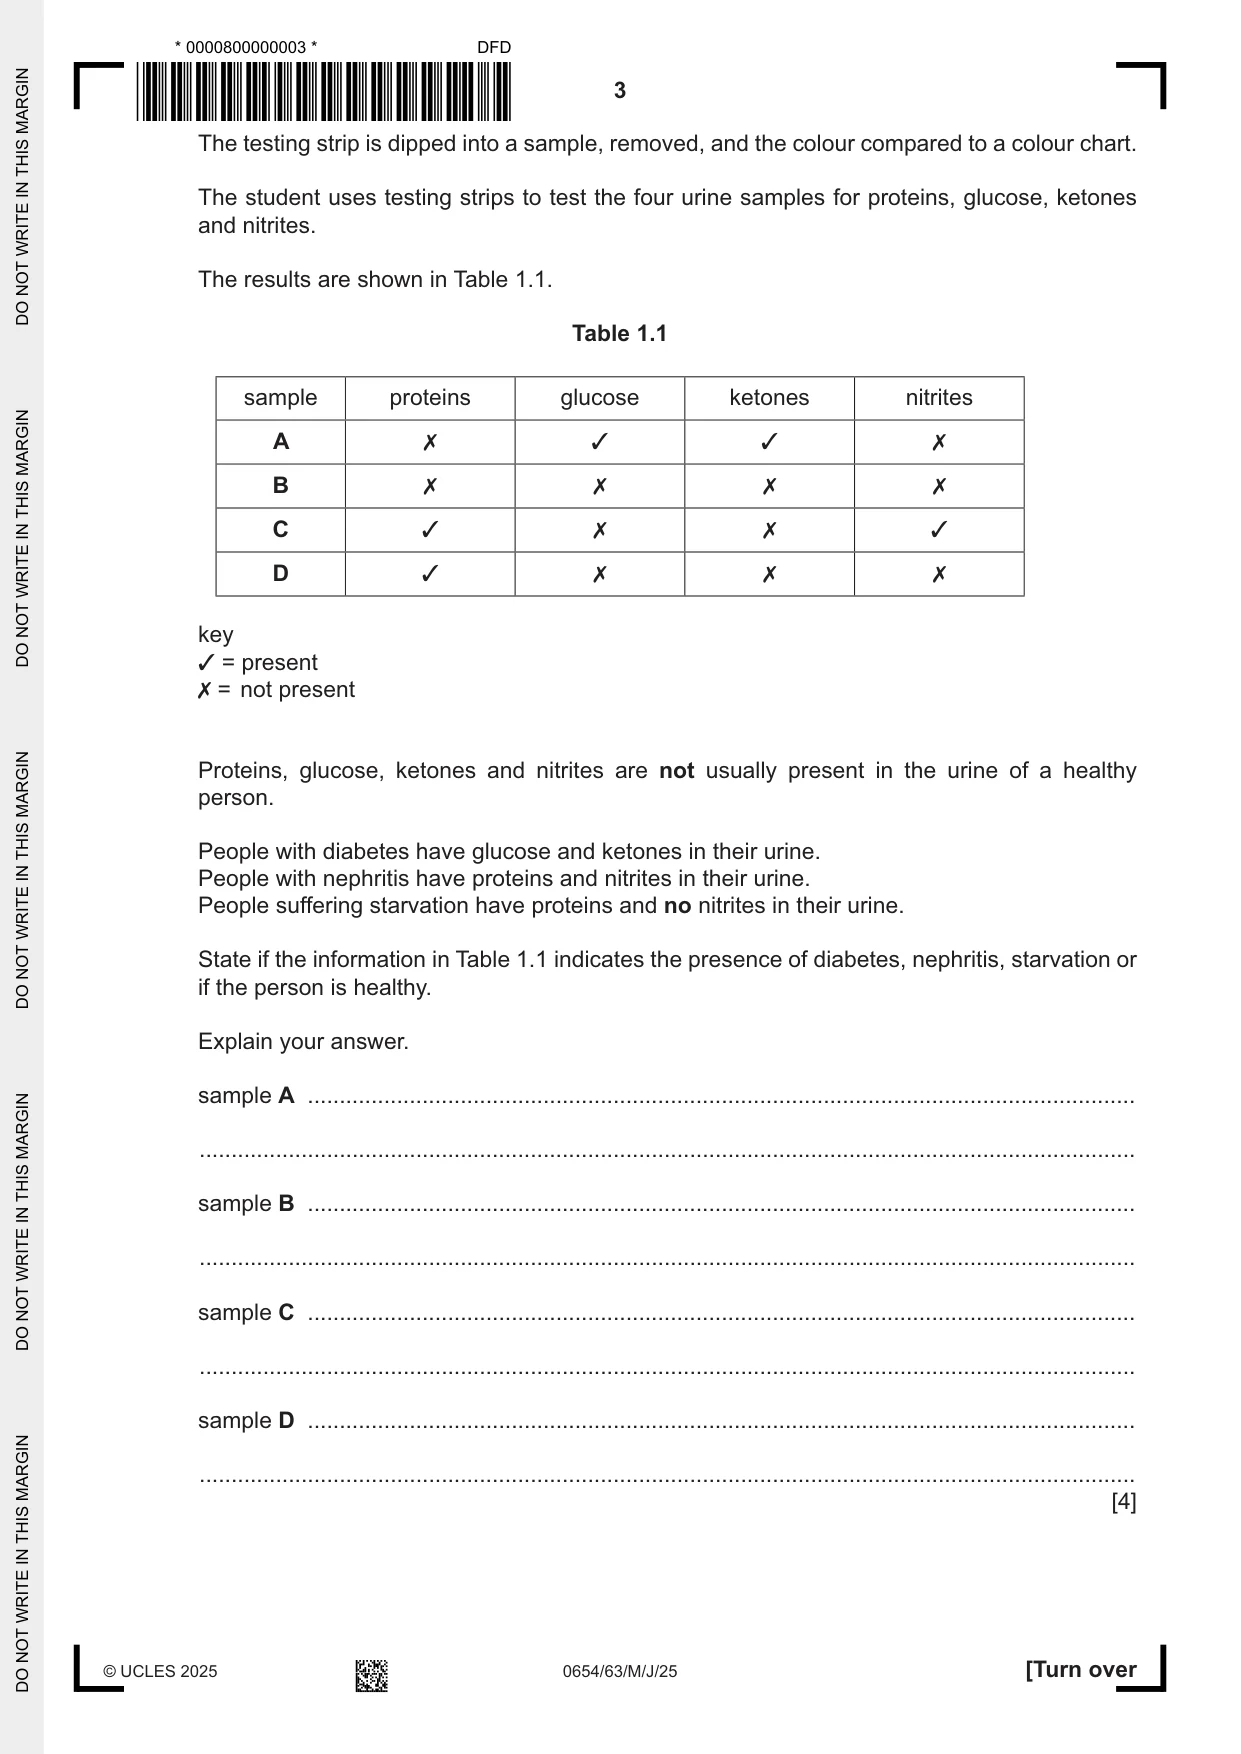
1 Urine tests are commonly used for the diagnosis of diseases. A student investigates four samples of urine A, B, C and D to determine if there is any indication of disease. The presence of reducing sugars or proteins in the urine samples can indicate disease. (a) (i) Describe how to test for reducing sugars. Give the colours observed during the test. method .............................................................................................................................. ........................................................................................................................................... initial colour of testing solution .......................................................................................... colour observed for a positive result ................................................................................. [4] (ii) Describe how to test for proteins. Give the colours observed during the test. method .............................................................................................................................. ........................................................................................................................................... initial colour of testing solution .......................................................................................... colour observed for a positive result ................................................................................. [3] (b) Some chemicals are detected using a testing strip as shown in Fig. 1.1. colour chart testing strip Fig. 1.1 The testing strip is dipped into a sample, removed, and the colour compared to a colour chart. The student uses testing strips to test the four urine samples for proteins, glucose, ketones and nitrites. The results are shown in Table 1.1. Table 1.1 sample proteins glucose ketones nitrites A ✗ 3 3 ✗ B ✗ ✗ ✗ ✗ C 3 ✗ ✗ 3 D 3 ✗ ✗ ✗ key 3 = present ✗ = not present Proteins, glucose, ketones and nitrites are not usually present in the urine of a healthy person. People with diabetes have glucose and ketones in their urine. People with nephritis have proteins and nitrites in their urine. People suffering starvation have proteins and no nitrites in their urine. State if the information in Table 1.1 indicates the presence of diabetes, nephritis, starvation or if the person is healthy. Explain your answer. sample A .................................................................................................................................. ................................................................................................................................................... sample B .................................................................................................................................. ................................................................................................................................................... sample C .................................................................................................................................. ................................................................................................................................................... sample D .................................................................................................................................. ................................................................................................................................................... [4] (c) The chemical test for the presence of nitrite is: • heat with aqueous sodium hydroxide and add aluminium foil • the gas released turns damp red litmus paper blue. Give two reasons why people use testing strips for nitrite instead of doing this chemical test. Do not include cost in your answer. 1 ................................................................................................................................................ ................................................................................................................................................... 2 ................................................................................................................................................ ................................................................................................................................................... [2] [Total: 13]
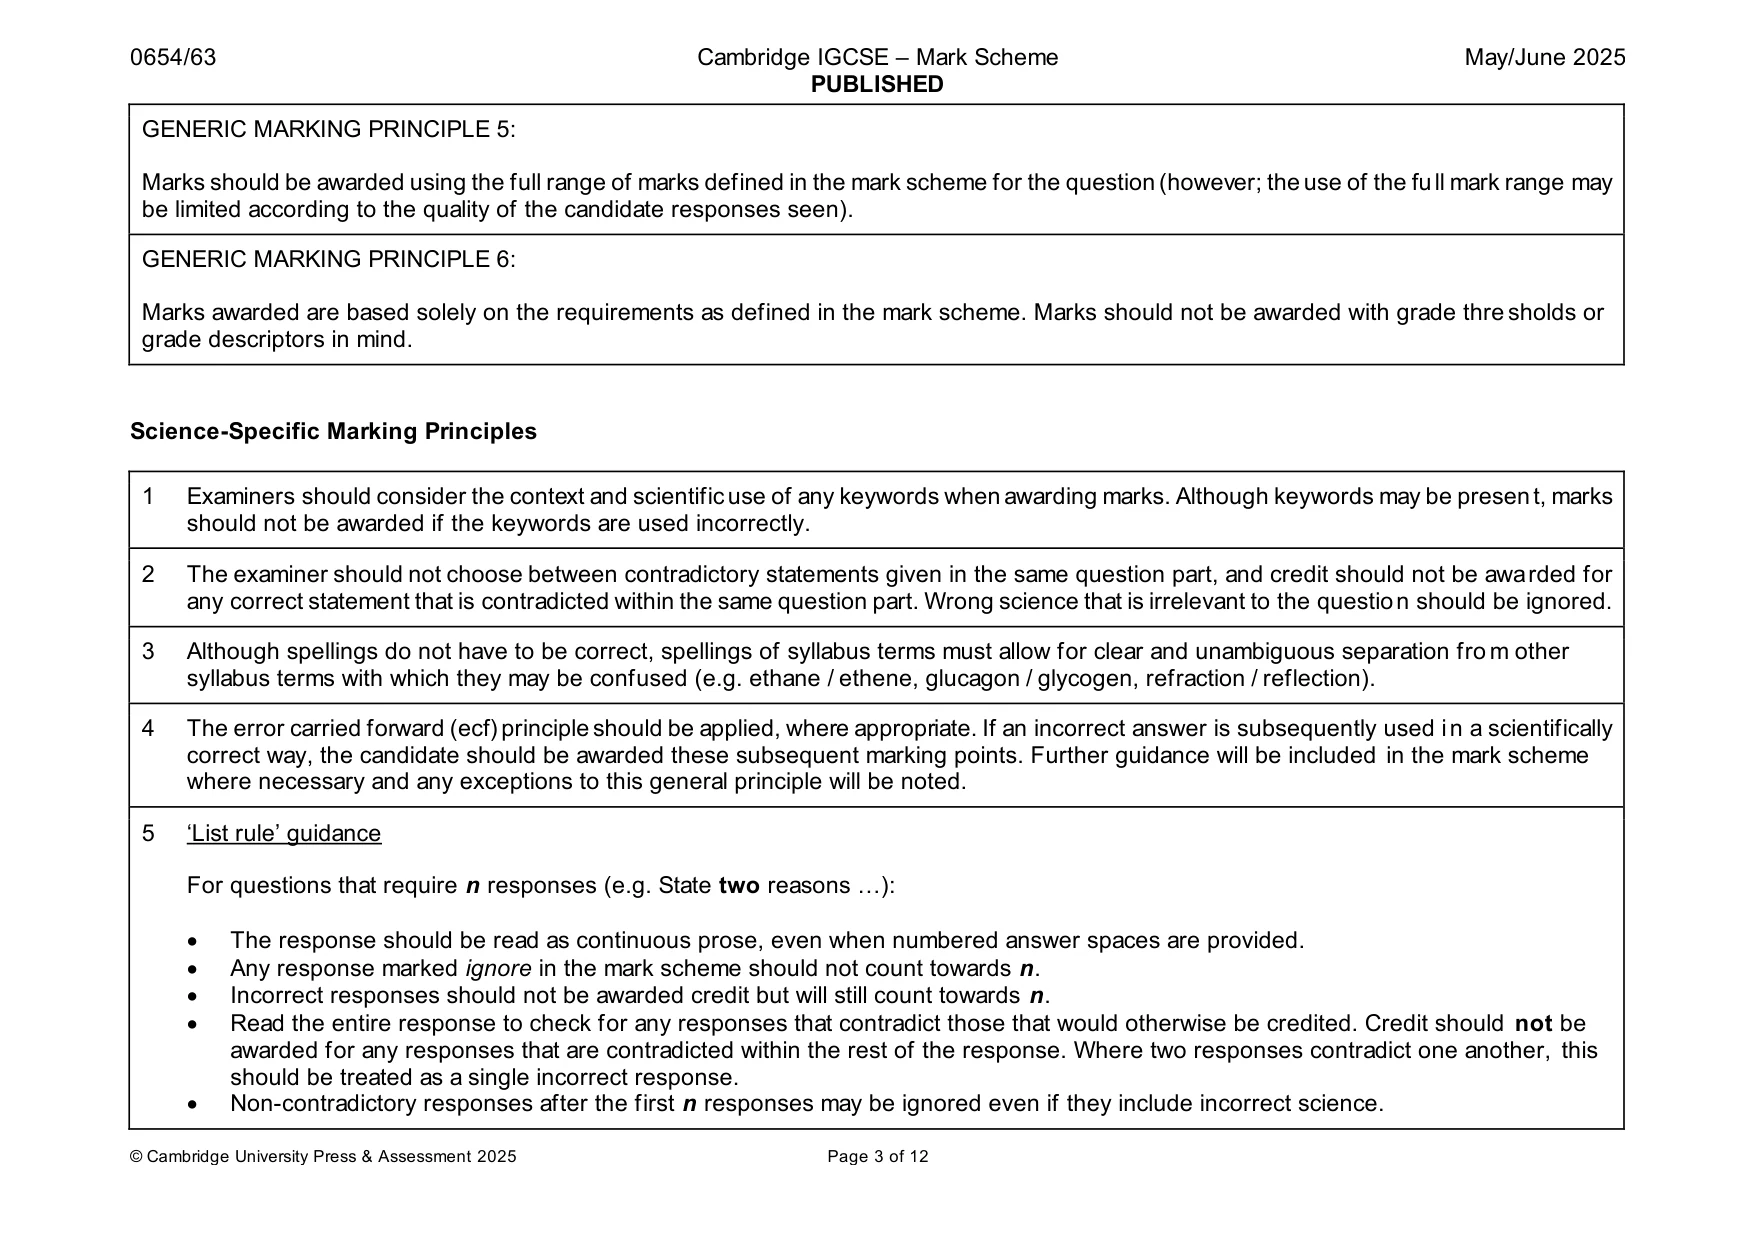
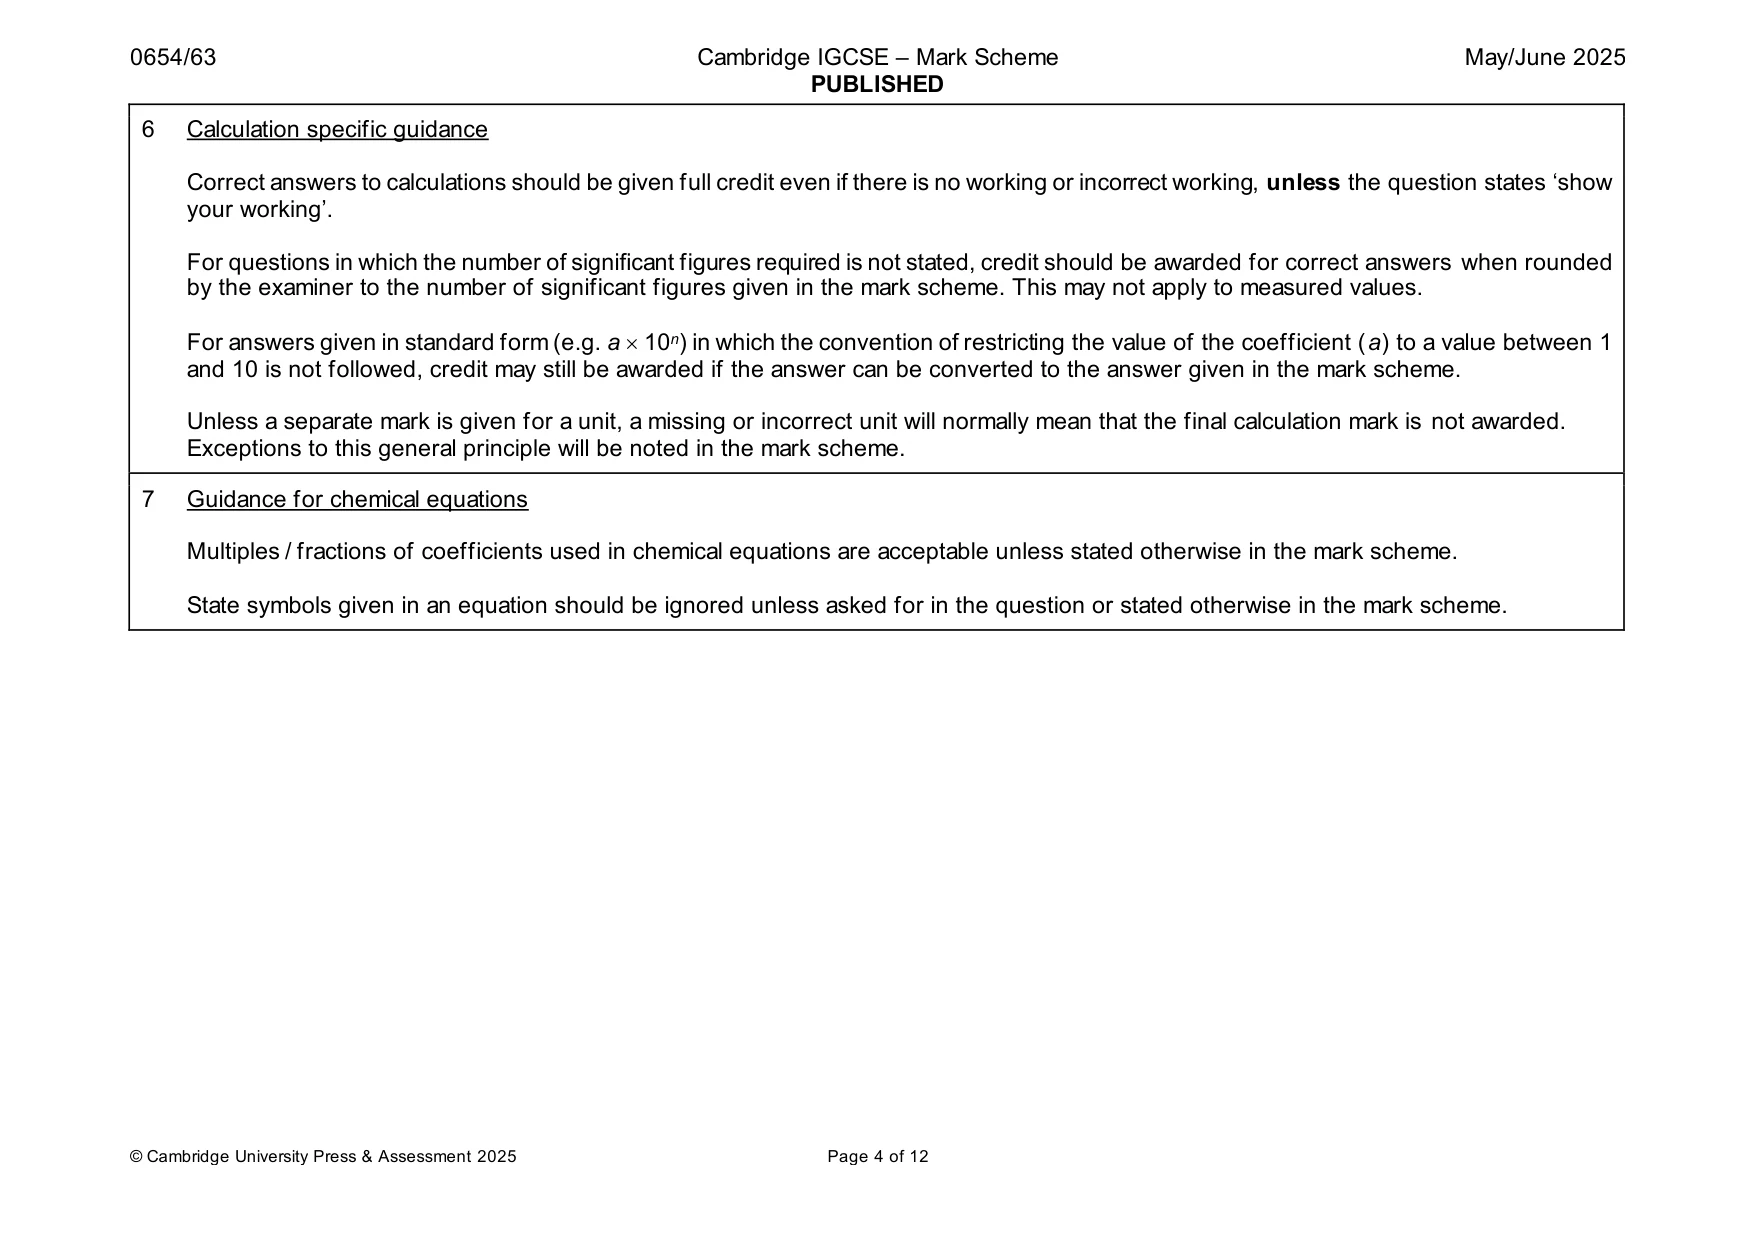
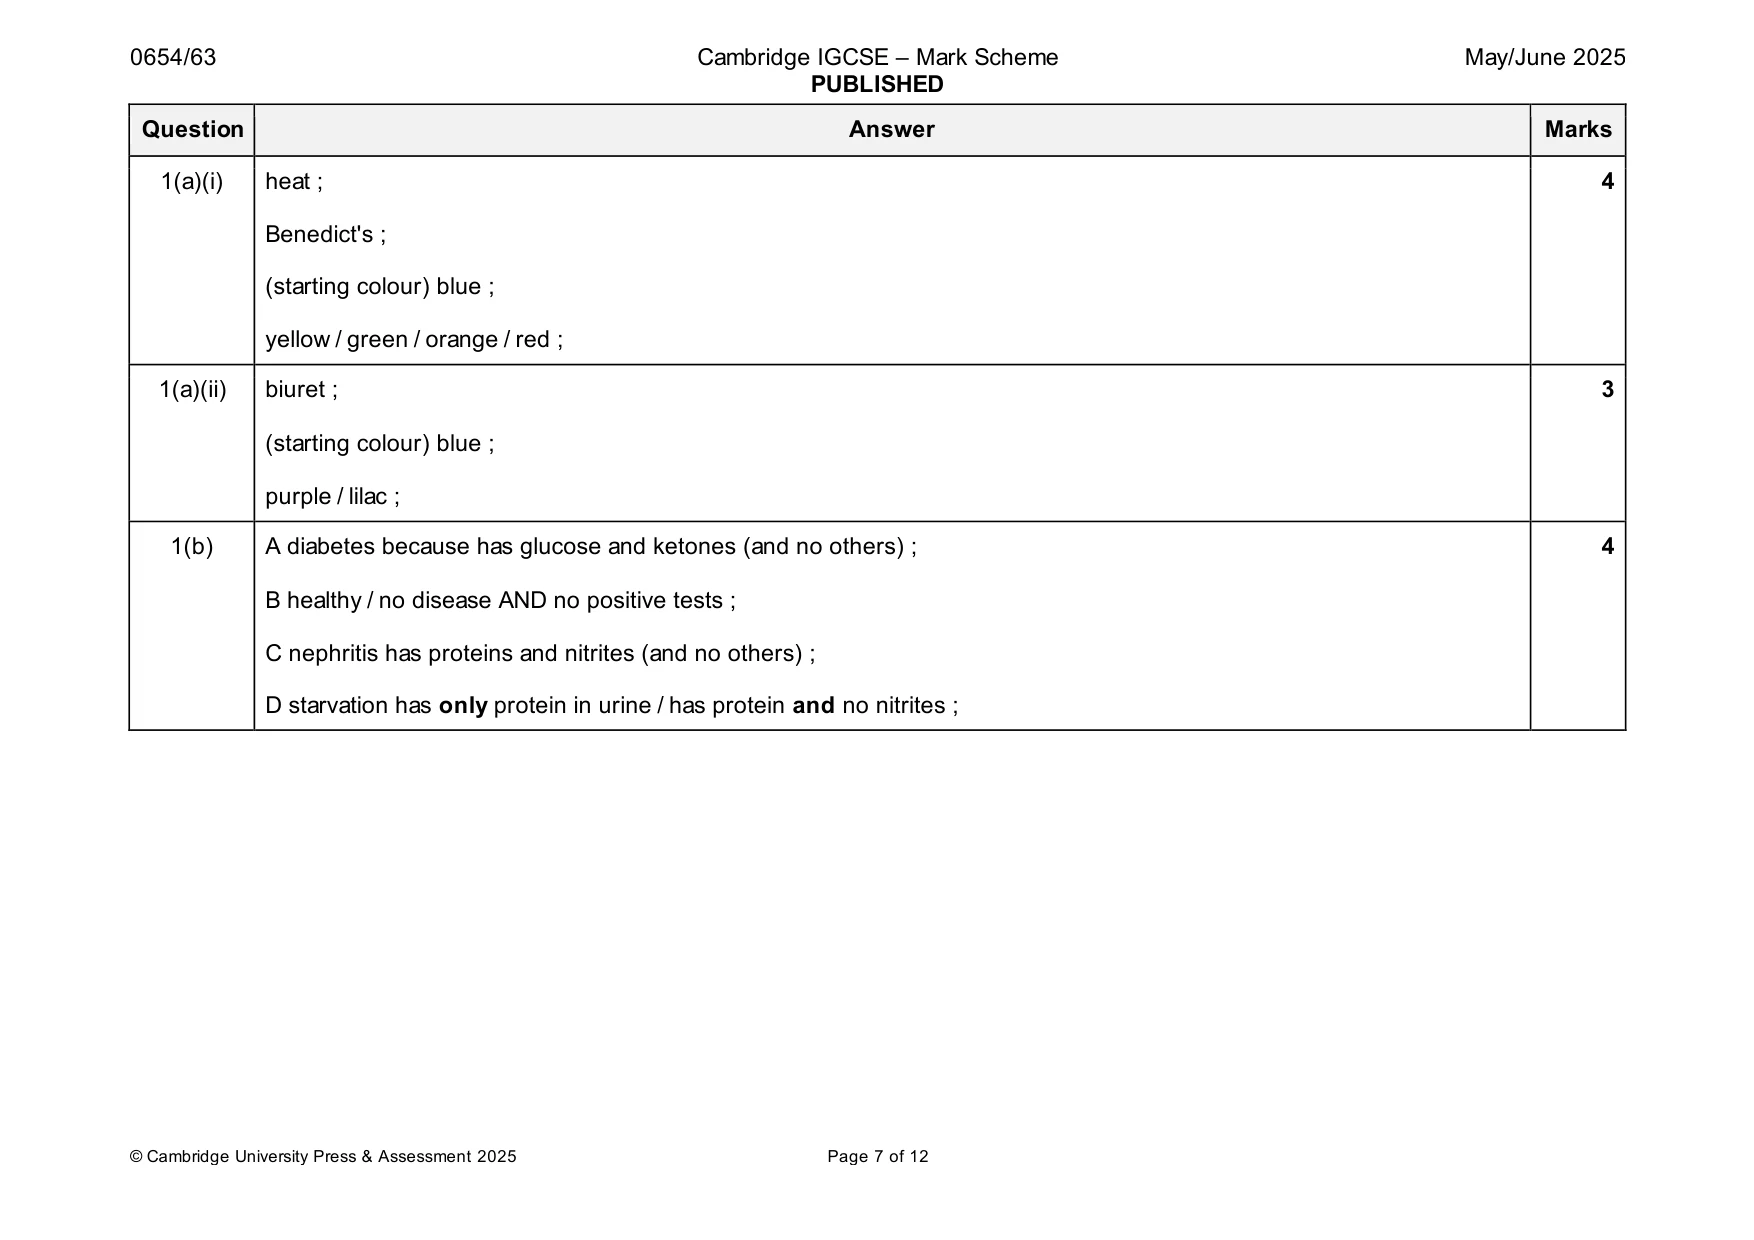
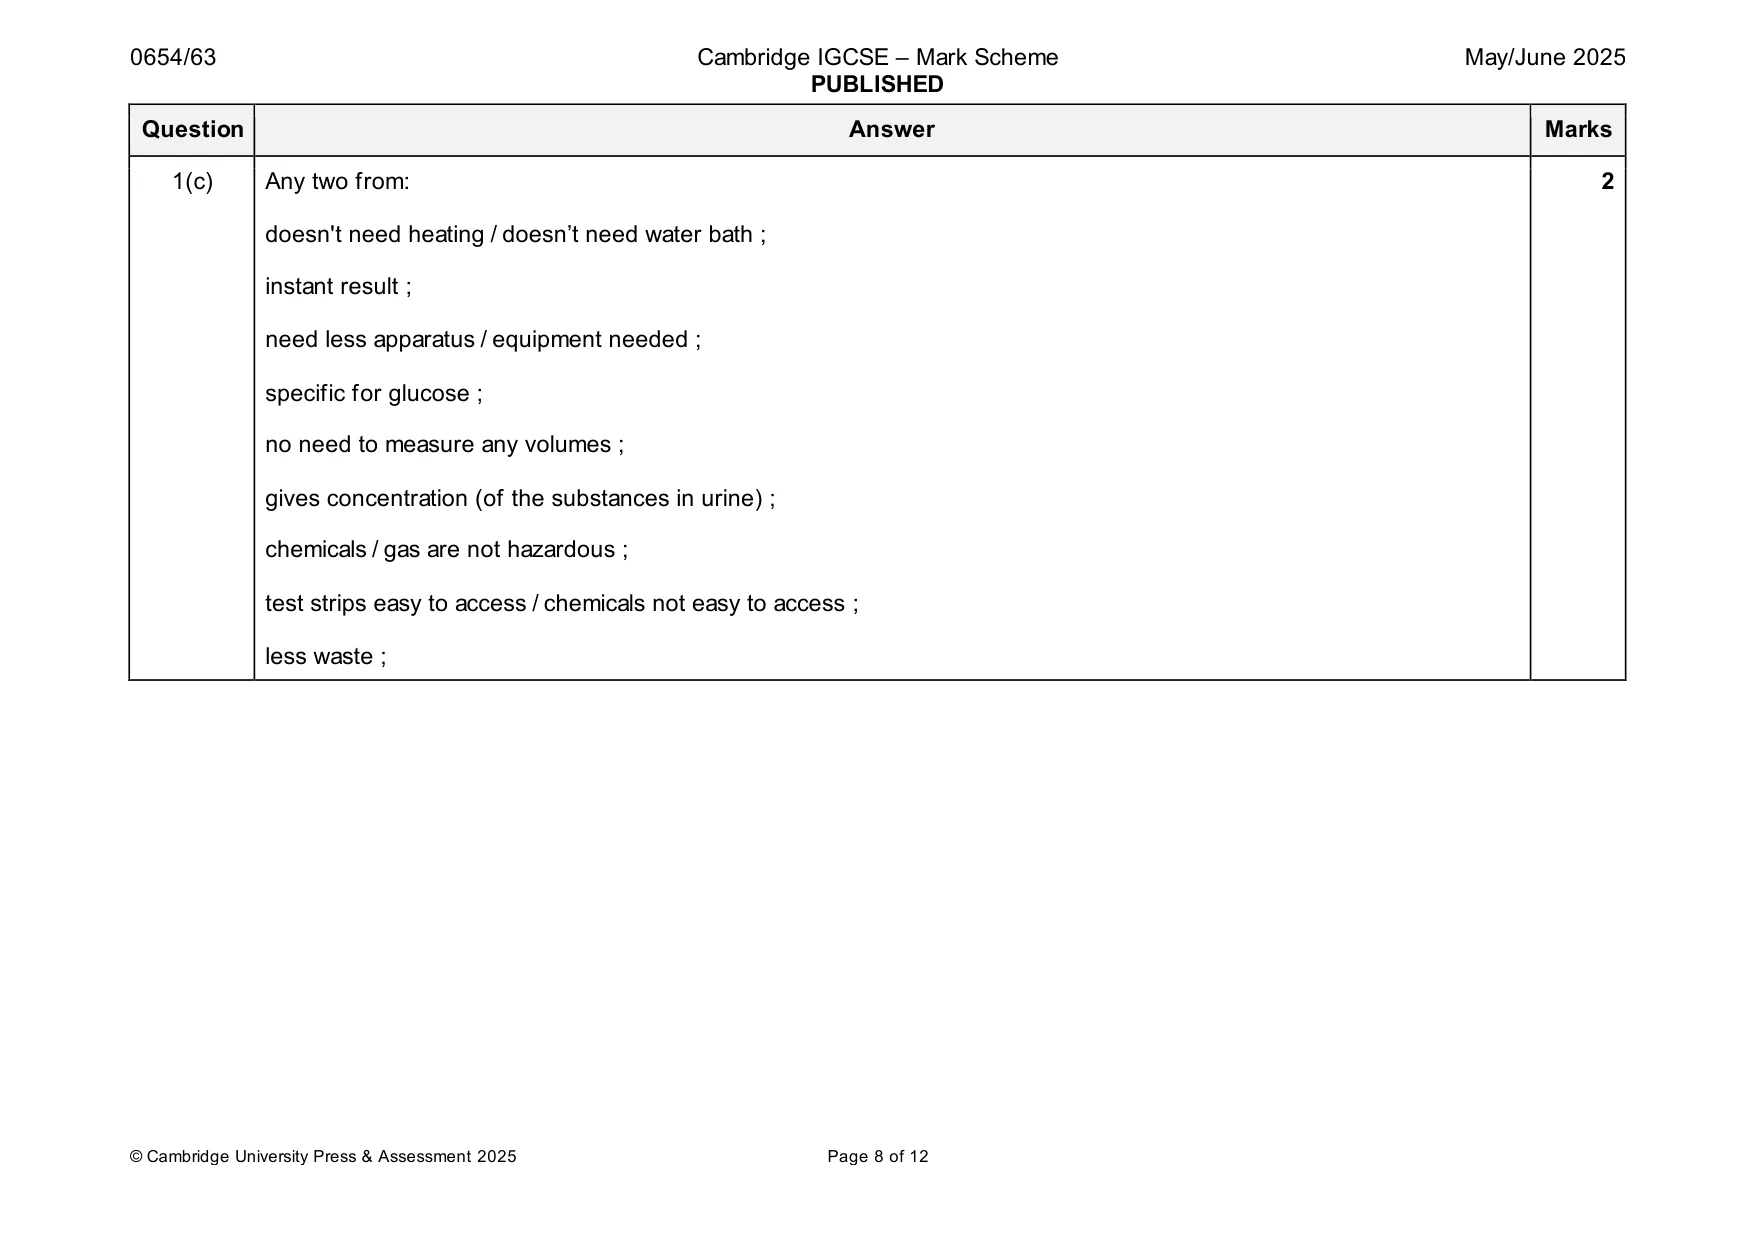
Mark scheme: Question Answer Marks 1(a)(i) heat ; 4 Benedict's ; (starting colour) blue ; yellow / green / orange / red ; 1(a)(ii) biuret ; 3 (starting colour) blue ; purple / lilac ; 1(b) A diabetes because has glucose and ketones (and no others) ; 4 B healthy / no disease AND no positive tests ; C nephritis has proteins and nitrites (and no others) ; D starvation has only protein in urine / has protein and no nitrites ; 1(c) Any two from: 2 doesn't need heating / doesn’t need water bath ; instant result ; need less apparatus / equipment needed ; specific for glucose ; no need to measure any volumes ; gives concentration (of the substances in urine) ; chemicals / gas are not hazardous ; test strips easy to access / chemicals not easy to access ; less waste ;
Q2 · The pH of urine in a healthy person is approximately 6.5
2 The pH of urine in a healthy person is approximately 6.5. A student suggests that the pH of urine changes as the amount of water a person drinks during the day changes. Plan an investigation to determine the relationship between the volume of water a person drinks and the pH of their urine three hours later. You may use any common laboratory apparatus in your plan. In your plan, include: • the apparatus and chemicals you will need • a brief description of the method • the measurements you will make and how you make them as valid as possible • the variables you will control • how you will process your results to reach a conclusion. You may include a results table if you wish. You are not required to enter any readings in the table. .......................................................................................................................................................... .......................................................................................................................................................... .......................................................................................................................................................... .......................................................................................................................................................... .......................................................................................................................................................... .......................................................................................................................................................... .......................................................................................................................................................... .......................................................................................................................................................... .......................................................................................................................................................... .......................................................................................................................................................... .......................................................................................................................................................... .......................................................................................................................................................... .......................................................................................................................................................... .......................................................................................................................................................... .......................................................................................................................................................... .......................................................................................................................................................... .......................................................................................................................................................... .......................................................................................................................................................... .......................................................................................................................................................... .......................................................................................................................................................... .......................................................................................................................................................... .......................................................................................................................................................... .......................................................................................................................................................... .......................................................................................................................................................... .......................................................................................................................................................... .......................................................................................................................................................... .......................................................................................................................................................... .................................................................................................................................................... [7]
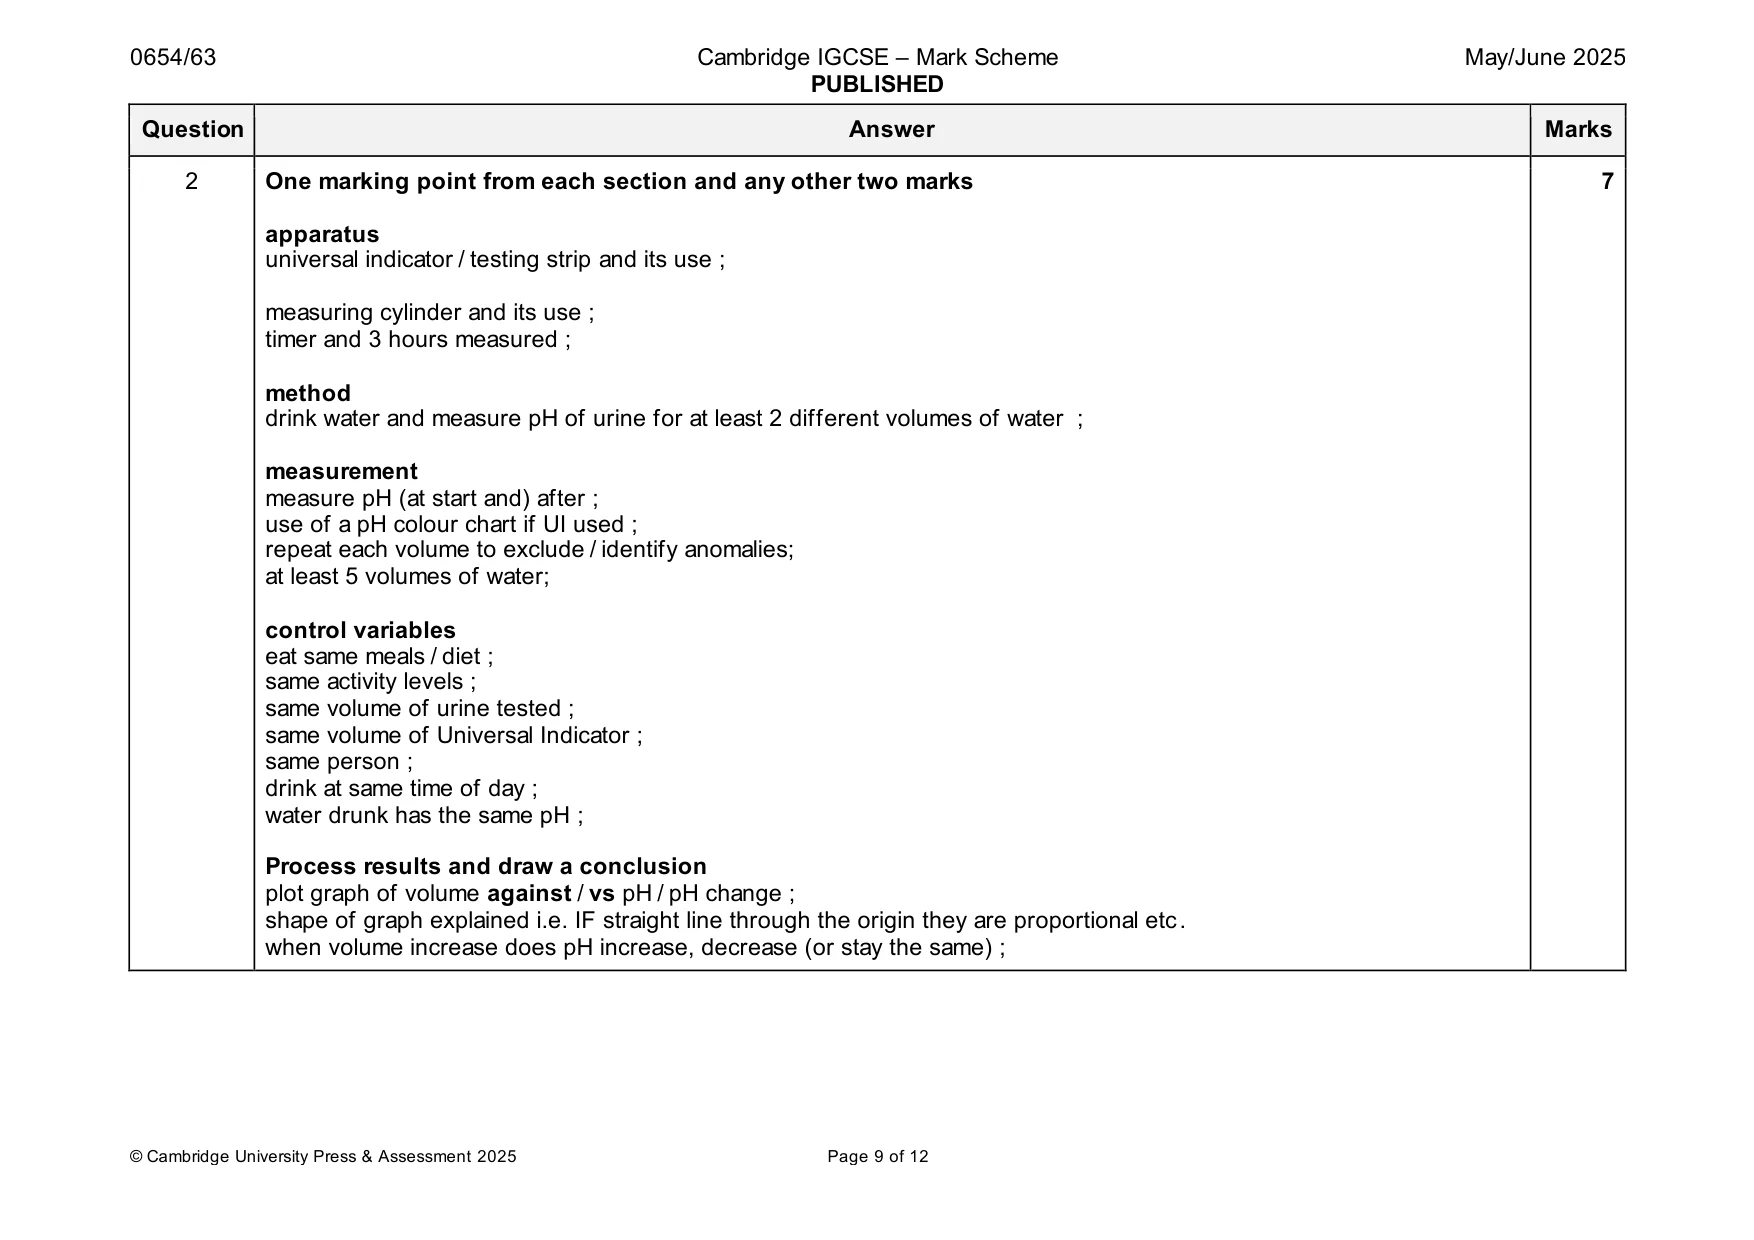
Mark scheme: 2 One marking point from each section and any other two marks 7 apparatus universal indicator / testing strip and its use ; measuring cylinder and its use ; timer and 3 hours measured ; method drink water and measure pH of urine for at least 2 different volumes of water ; measurement measure pH (at start and) after ; use of a pH colour chart if UI used ; repeat each volume to exclude / identify anomalies; at least 5 volumes of water; control variables eat same meals / diet ; same activity levels ; same volume of urine tested ; same volume of Universal Indicator ; same person ; drink at same time of day ; water drunk has the same pH ; Process results and draw a conclusion plot graph of volume against / vs pH / pH change ; shape of graph explained i.e. IF straight line through the origin they are proportional etc. when volume increase does pH increase, decrease (or stay the same) ;
Q3 · A student investigates the effect of concentration on the rate of a reaction
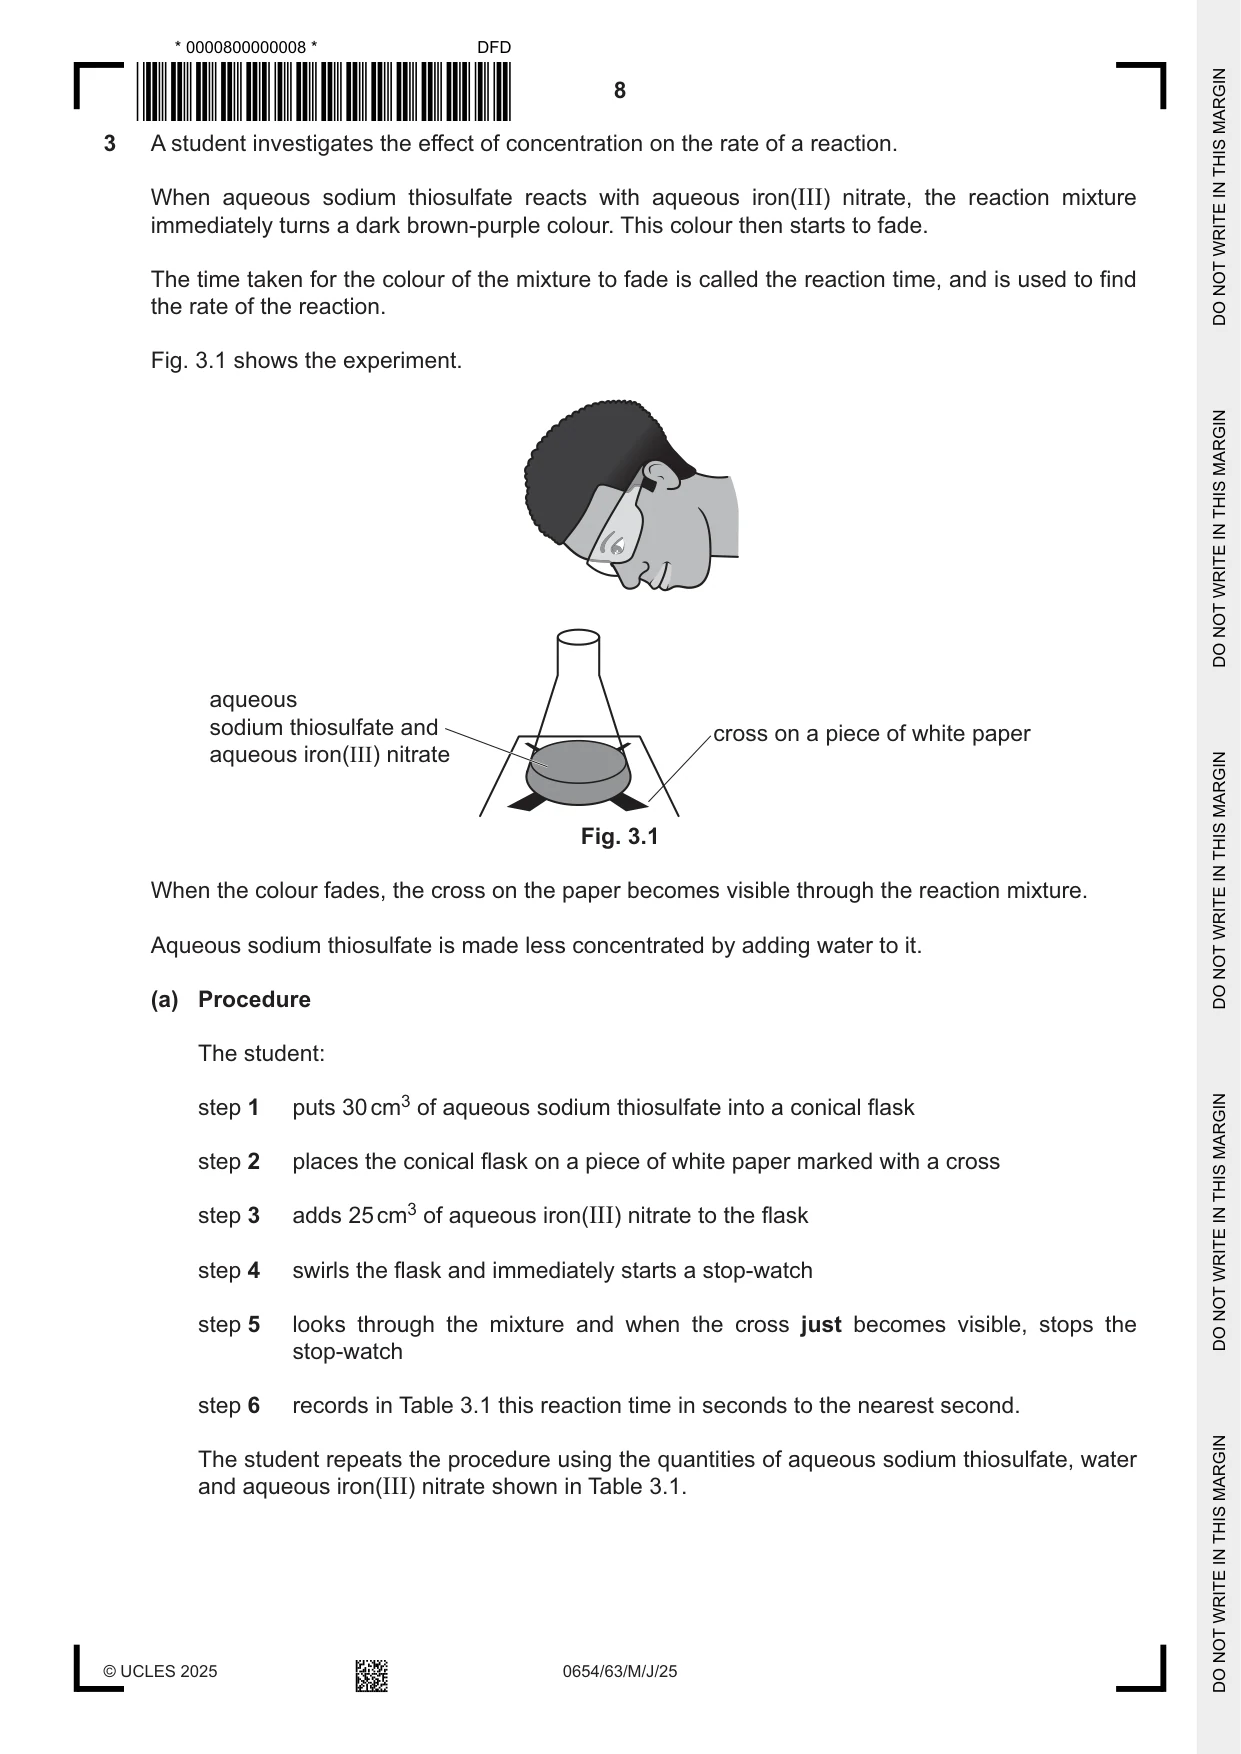
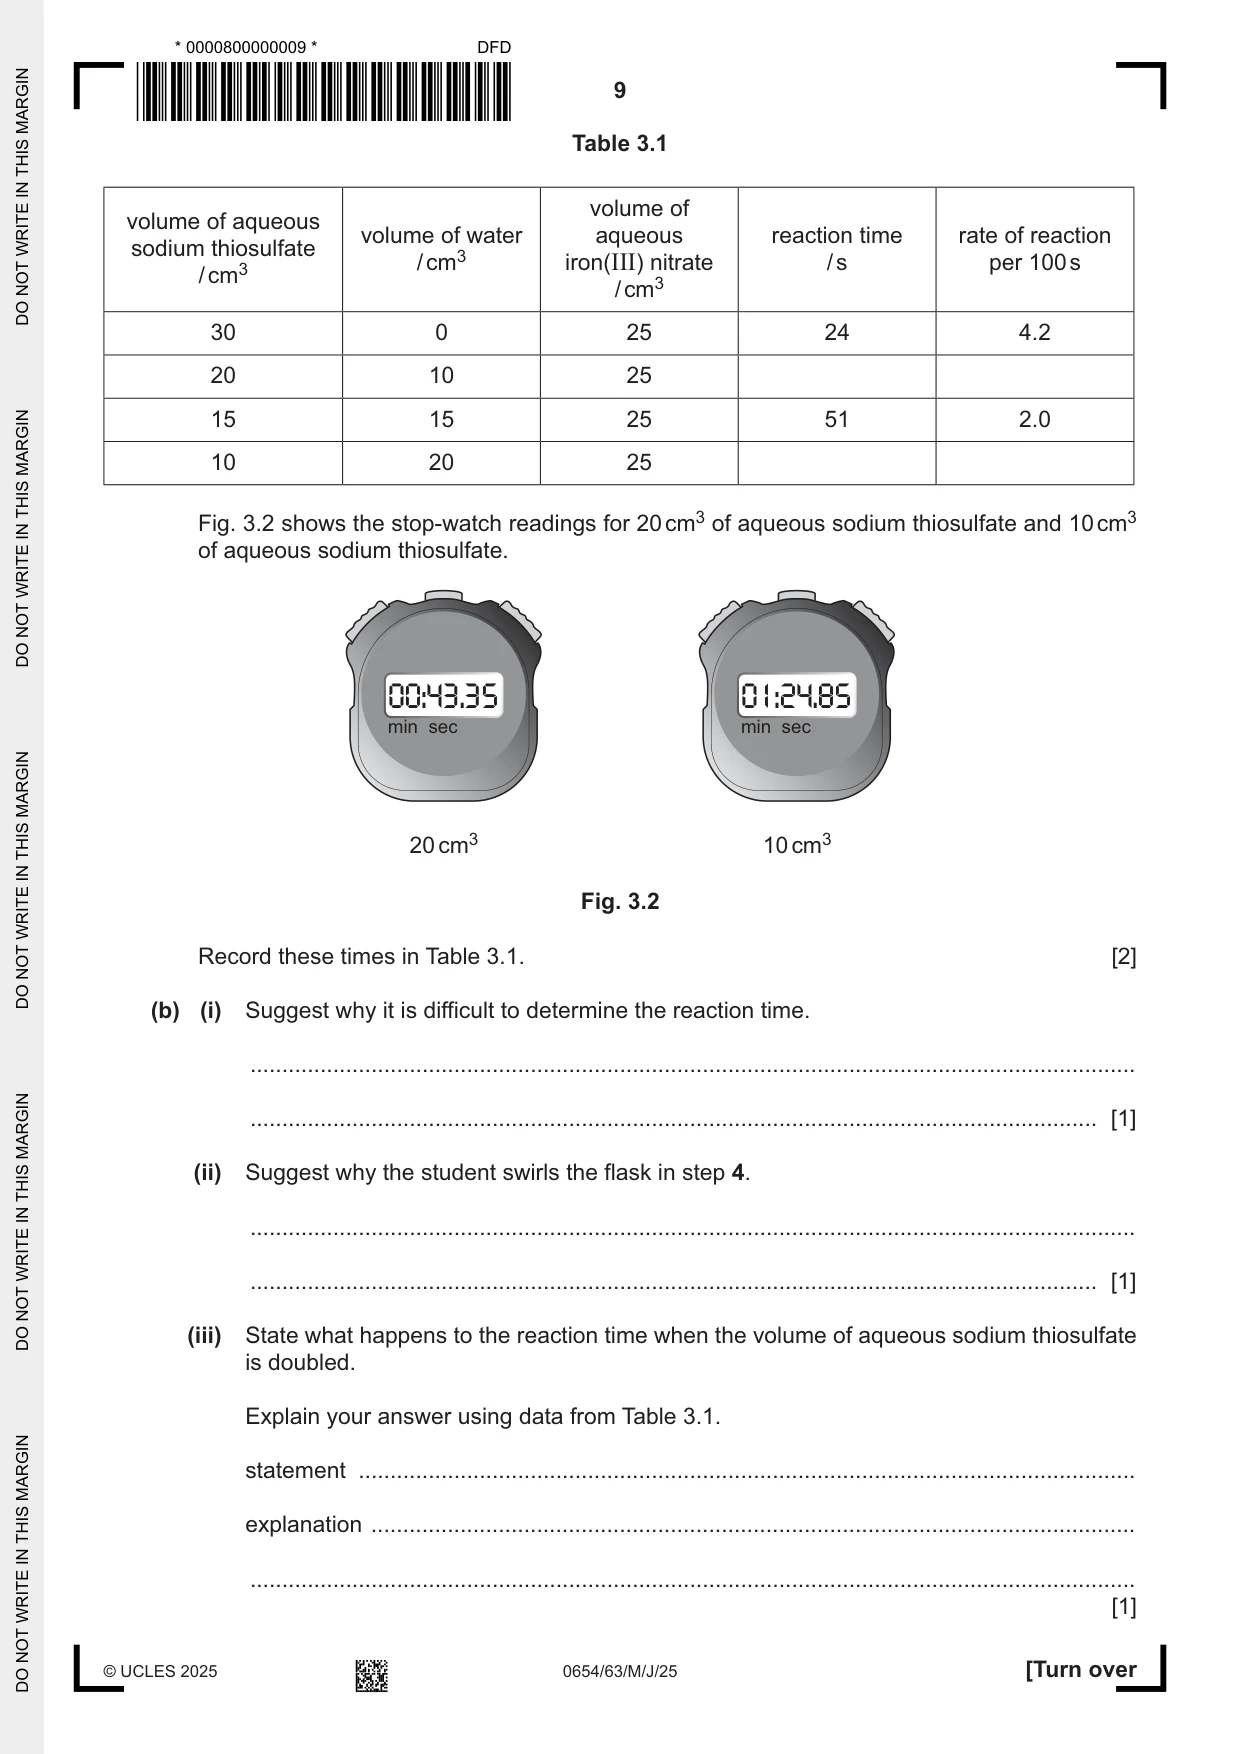
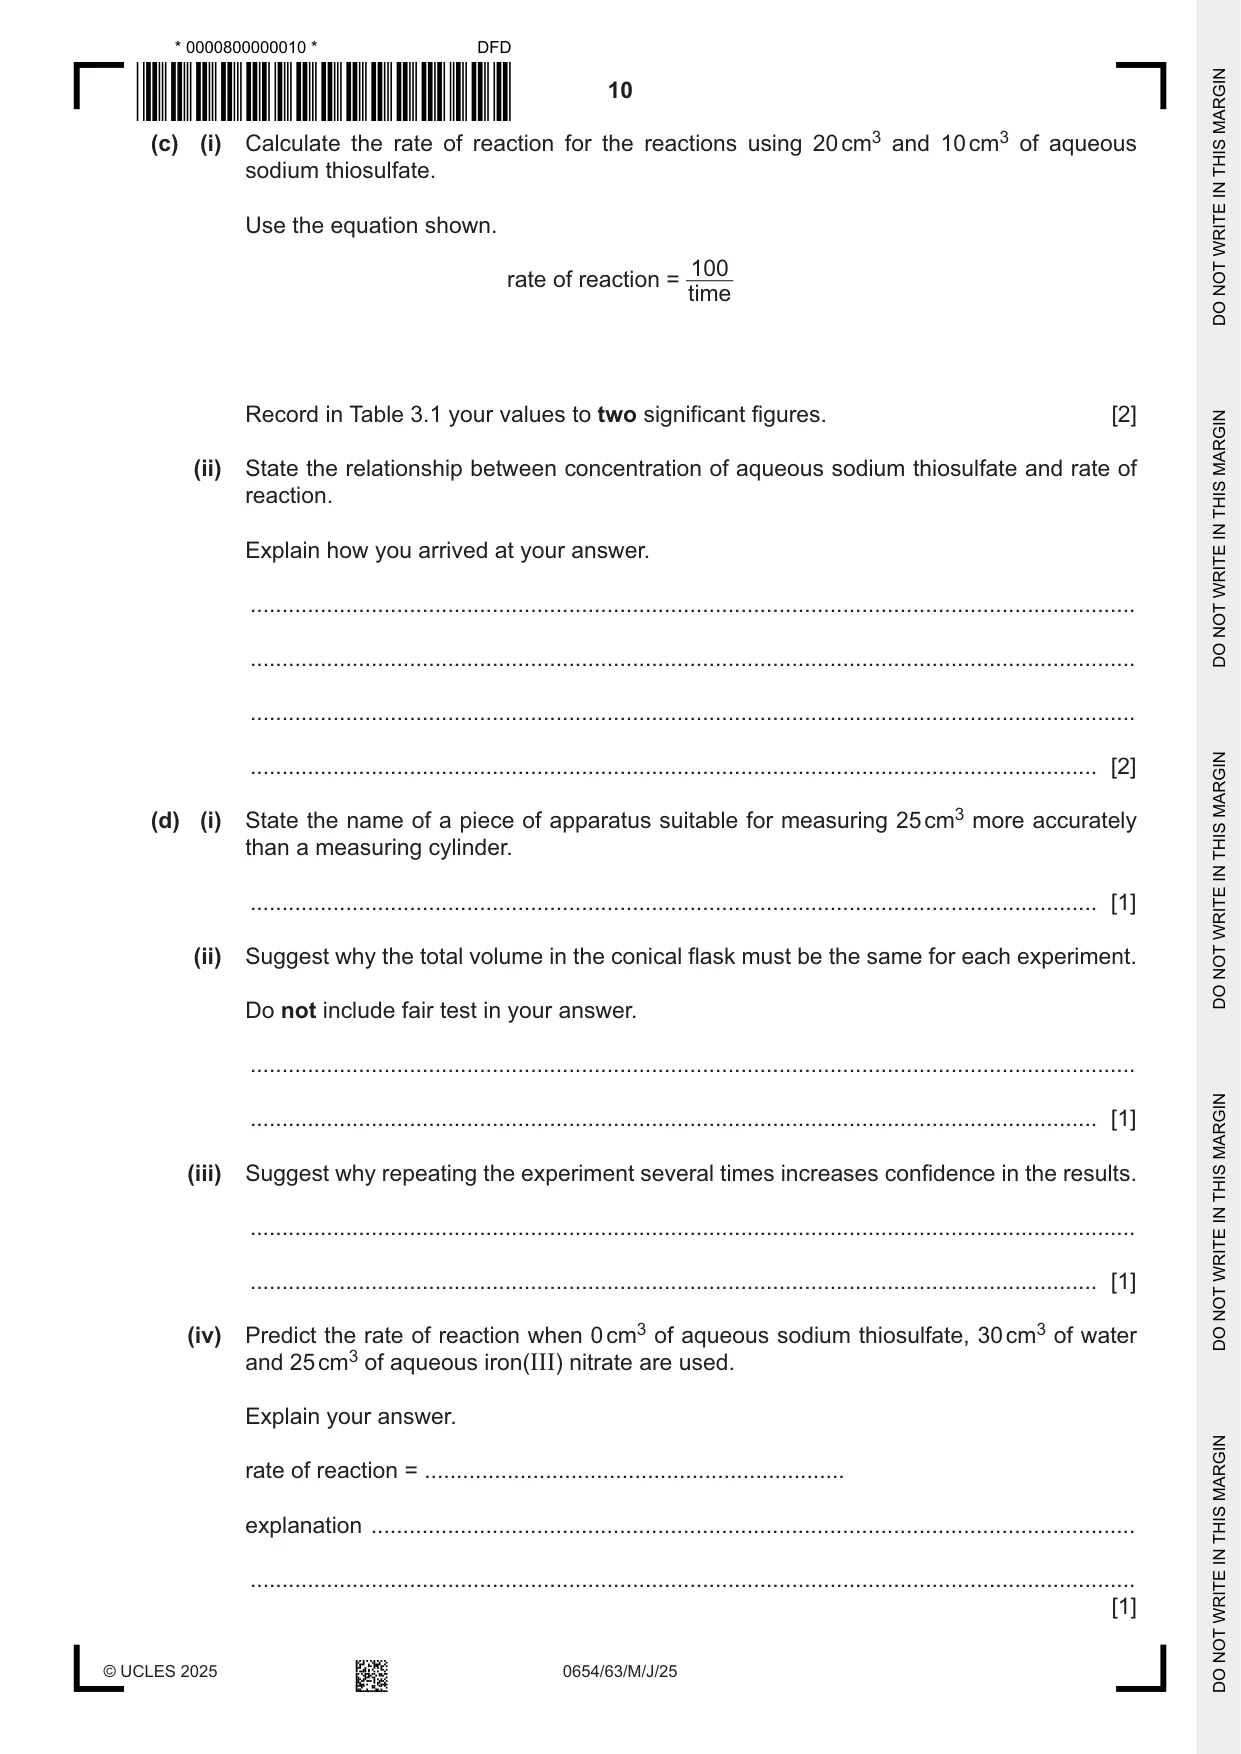
3 A student investigates the effect of concentration on the rate of a reaction. When aqueous sodium thiosulfate reacts with aqueous iron(III) nitrate, the reaction mixture immediately turns a dark brown-purple colour. This colour then starts to fade. The time taken for the colour of the mixture to fade is called the reaction time, and is used to find the rate of the reaction. Fig. 3.1 shows the experiment. aqueous sodium thiosulfate and cross on a piece of white paper aqueous iron(III) nitrate Fig. 3.1 When the colour fades, the cross on the paper becomes visible through the reaction mixture. Aqueous sodium thiosulfate is made less concentrated by adding water to it. (a) Procedure The student: step 1 puts 30 cm3 of aqueous sodium thiosulfate into a conical flask step 2 places the conical flask on a piece of white paper marked with a cross step 3 adds 25 cm3 of aqueous iron(III) nitrate to the flask step 4 swirls the flask and immediately starts a stop-watch step 5 looks through the mixture and when the cross just becomes visible, stops the stop-watch step 6 records in Table 3.1 this reaction time in seconds to the nearest second. The student repeats the procedure using the quantities of aqueous sodium thiosulfate, water and aqueous iron(III) nitrate shown in Table 3.1. Table 3.1 volume of volume of aqueous volume of water aqueous reaction time rate of reaction sodium thiosulfate / cm3 iron(III) nitrate / s per 100 s / cm3 / cm3 30 0 25 24 4.2 20 10 25 15 15 25 51 2.0 10 20 25 Fig. 3.2 shows the stop-watch readings for 20 cm3 of aqueous sodium thiosulfate and 10 cm3 of aqueous sodium thiosulfate. 00:43.35 01:24.85 min sec min sec 20 cm3 10 cm3 Fig. 3.2 Record these times in Table 3.1. [2] (b) (i) Suggest why it is difficult to determine the reaction time. ........................................................................................................................................... ..................................................................................................................................... [1] (ii) Suggest why the student swirls the flask in step 4. ........................................................................................................................................... ..................................................................................................................................... [1] (iii) State what happens to the reaction time when the volume of aqueous sodium thiosulfate is doubled. Explain your answer using data from Table 3.1. statement .......................................................................................................................... explanation ........................................................................................................................ ........................................................................................................................................... [1] (c) (i) Calculate the rate of reaction for the reactions using 20 cm3 and 10 cm3 of aqueous sodium thiosulfate. Use the equation shown. 100 rate of reaction = time Record in Table 3.1 your values to two significant figures. [2] (ii) State the relationship between concentration of aqueous sodium thiosulfate and rate of reaction. Explain how you arrived at your answer. ........................................................................................................................................... ........................................................................................................................................... ........................................................................................................................................... ..................................................................................................................................... [2] (d) (i) State the name of a piece of apparatus suitable for measuring 25 cm3 more accurately than a measuring cylinder. ..................................................................................................................................... [1] (ii) Suggest why the total volume in the conical flask must be the same for each experiment. Do not include fair test in your answer. ........................................................................................................................................... ..................................................................................................................................... [1] (iii) Suggest why repeating the experiment several times increases confidence in the results. ........................................................................................................................................... ..................................................................................................................................... [1] (iv) Predict the rate of reaction when 0 cm3 of aqueous sodium thiosulfate, 30 cm3 of water and 25 cm3 of aqueous iron(III) nitrate are used. Explain your answer. rate of reaction = .................................................................. explanation ........................................................................................................................ ........................................................................................................................................... [1] (e) A reaction happens when reactant particles collide with each other. When the concentration increases, there are more particles in the solution and they are closer together. Suggest why the rate of reaction changes as the concentration of the aqueous sodium thiosulfate changes. ................................................................................................................................................... ............................................................................................................................................. [1] (f) Aqueous iron(III) nitrate is yellow. Aqueous iron(III) nitrate is weakly acidic. Explain why universal indicator is not used to find the pH of aqueous iron(III) nitrate. ................................................................................................................................................... ............................................................................................................................................. [1] [Total: 15]
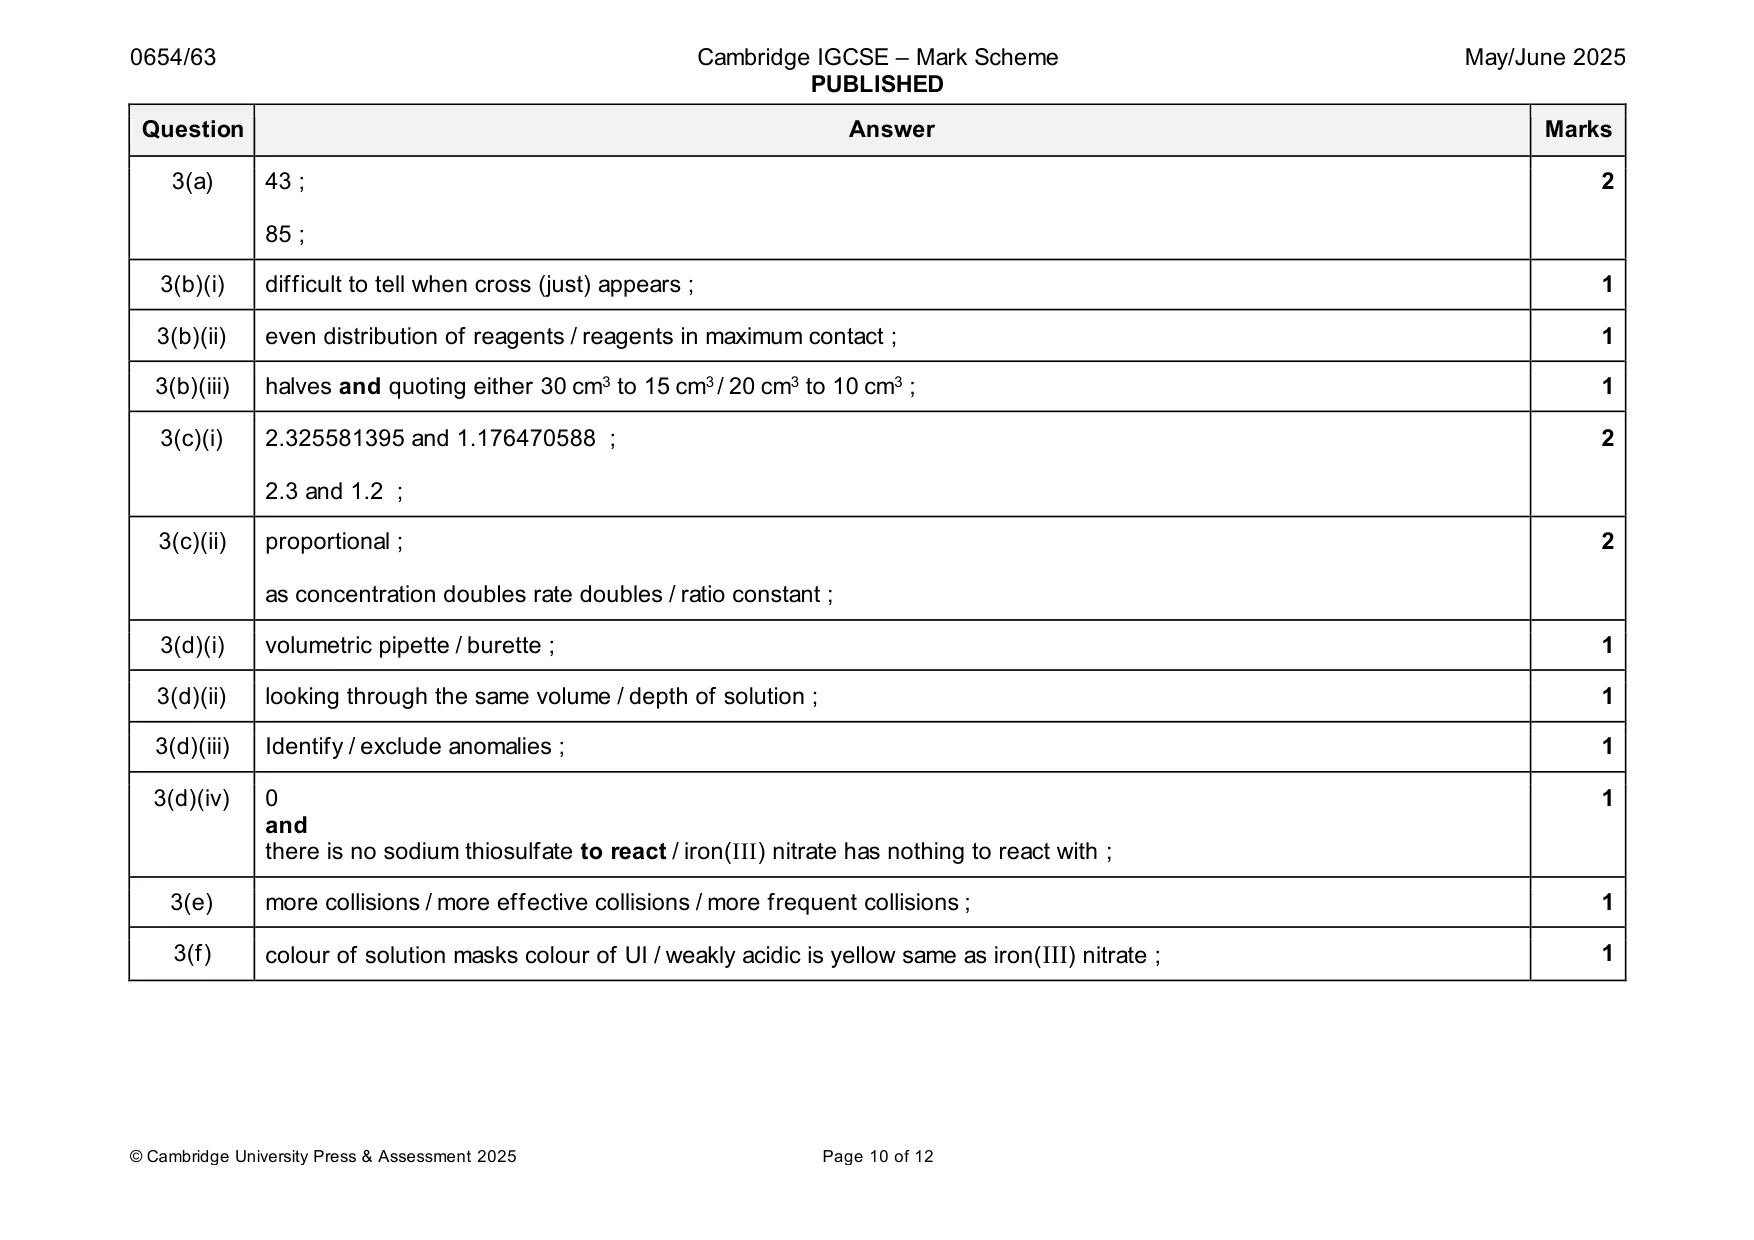
Mark scheme: 3(a) 43 ; 2 85 ; 3(b)(i) difficult to tell when cross (just) appears ; 1 3(b)(ii) even distribution of reagents / reagents in maximum contact ; 1 3(b)(iii) halves and quoting either 30 cm3 to 15 cm3 / 20 cm3 to 10 cm3 ; 1 3(c)(i) 2.325581395 and 1.176470588 ; 2 2.3 and 1.2 ; 3(c)(ii) proportional ; 2 as concentration doubles rate doubles / ratio constant ; 3(d)(i) volumetric pipette / burette ; 1 3(d)(ii) looking through the same volume / depth of solution ; 1 3(d)(iii) Identify / exclude anomalies ; 1 3(d)(iv) 0 1 and there is no sodium thiosulfate to react / iron(III) nitrate has nothing to react with ; 3(e) more collisions / more effective collisions / more frequent collisions ; 1 3(f) colour of solution masks colour of UI / weakly acidic is yellow same as iron(III) nitrate ; 1
Q4 · A student identifies the ions present in aqueous H
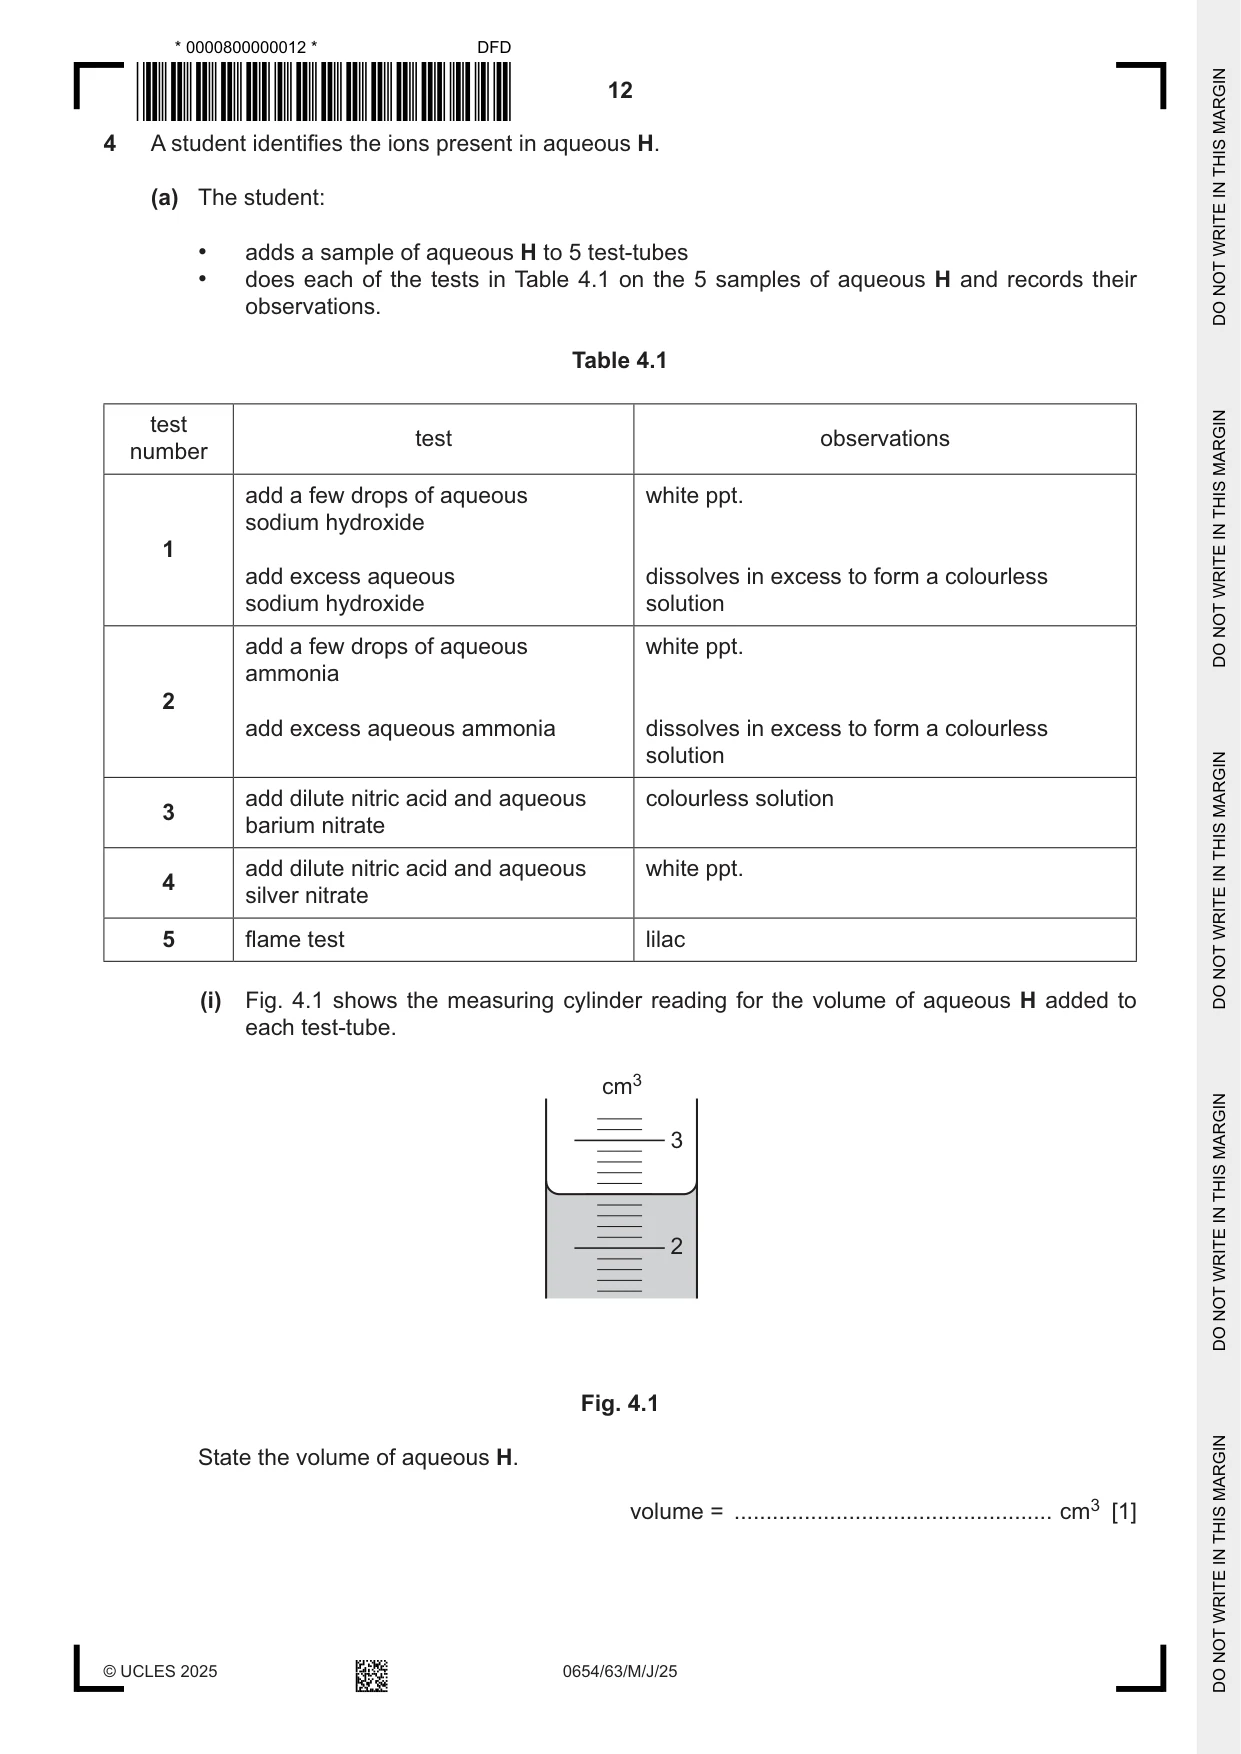
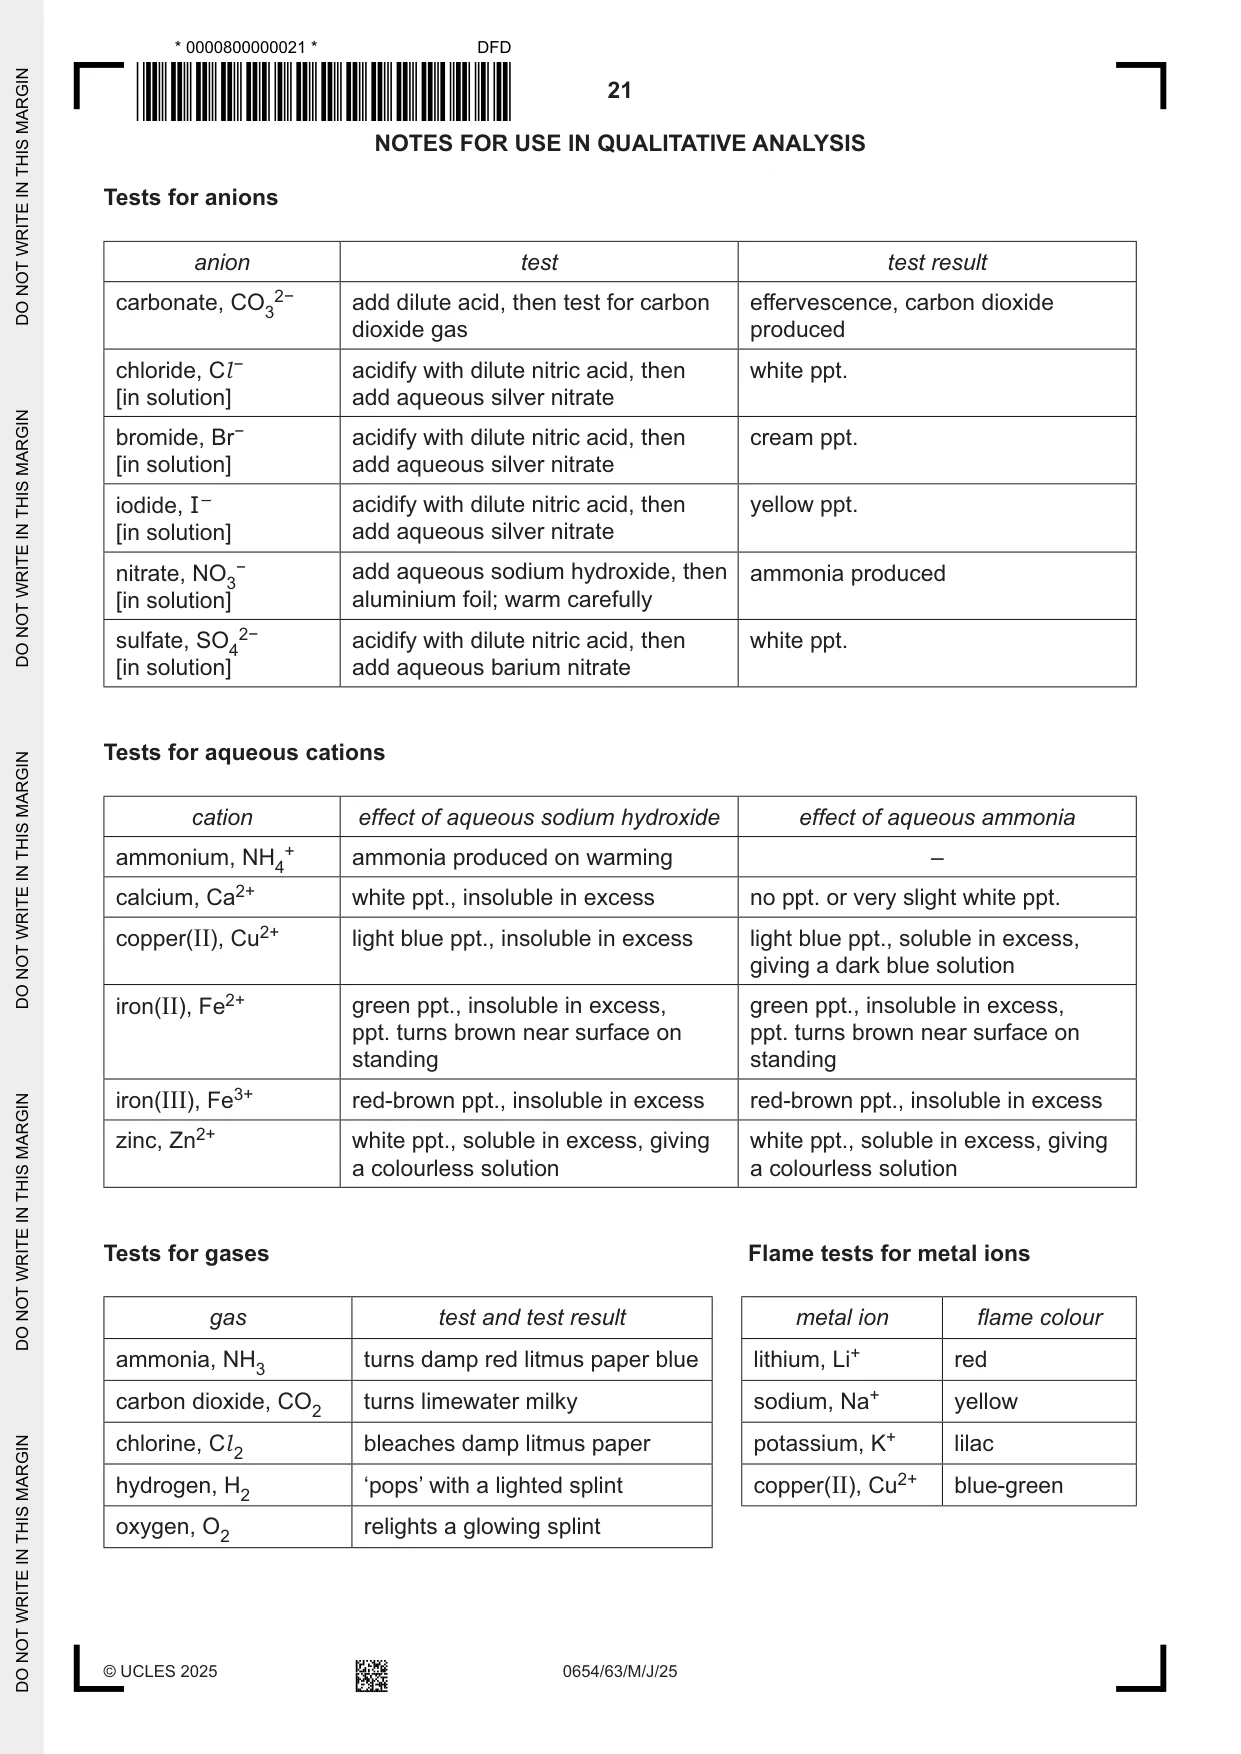
4 A student identifies the ions present in aqueous H. (a) The student: • adds a sample of aqueous H to 5 test-tubes • does each of the tests in Table 4.1 on the 5 samples of aqueous H and records their observations. Table 4.1 test test observations number add a few drops of aqueous white ppt. sodium hydroxide 1 add excess aqueous dissolves in excess to form a colourless sodium hydroxide solution add a few drops of aqueous white ppt. ammonia 2 add excess aqueous ammonia dissolves in excess to form a colourless solution add dilute nitric acid and aqueous colourless solution 3 barium nitrate add dilute nitric acid and aqueous white ppt. 4 silver nitrate 5 flame test lilac (i) Fig. 4.1 shows the measuring cylinder reading for the volume of aqueous H added to each test-tube. cm3 3 2 Fig. 4.1 State the volume of aqueous H. volume = .................................................. cm3 [1] (ii) State the identity of all of the ions in aqueous H. ........................................................................................................................................... ..................................................................................................................................... [1] (b) Explain why dilute nitric acid is added in tests 3 and 4. ................................................................................................................................................... ............................................................................................................................................. [1] (c) Describe how to do a flame test. ................................................................................................................................................... ................................................................................................................................................... ................................................................................................................................................... ............................................................................................................................................. [2] [Total: 5]
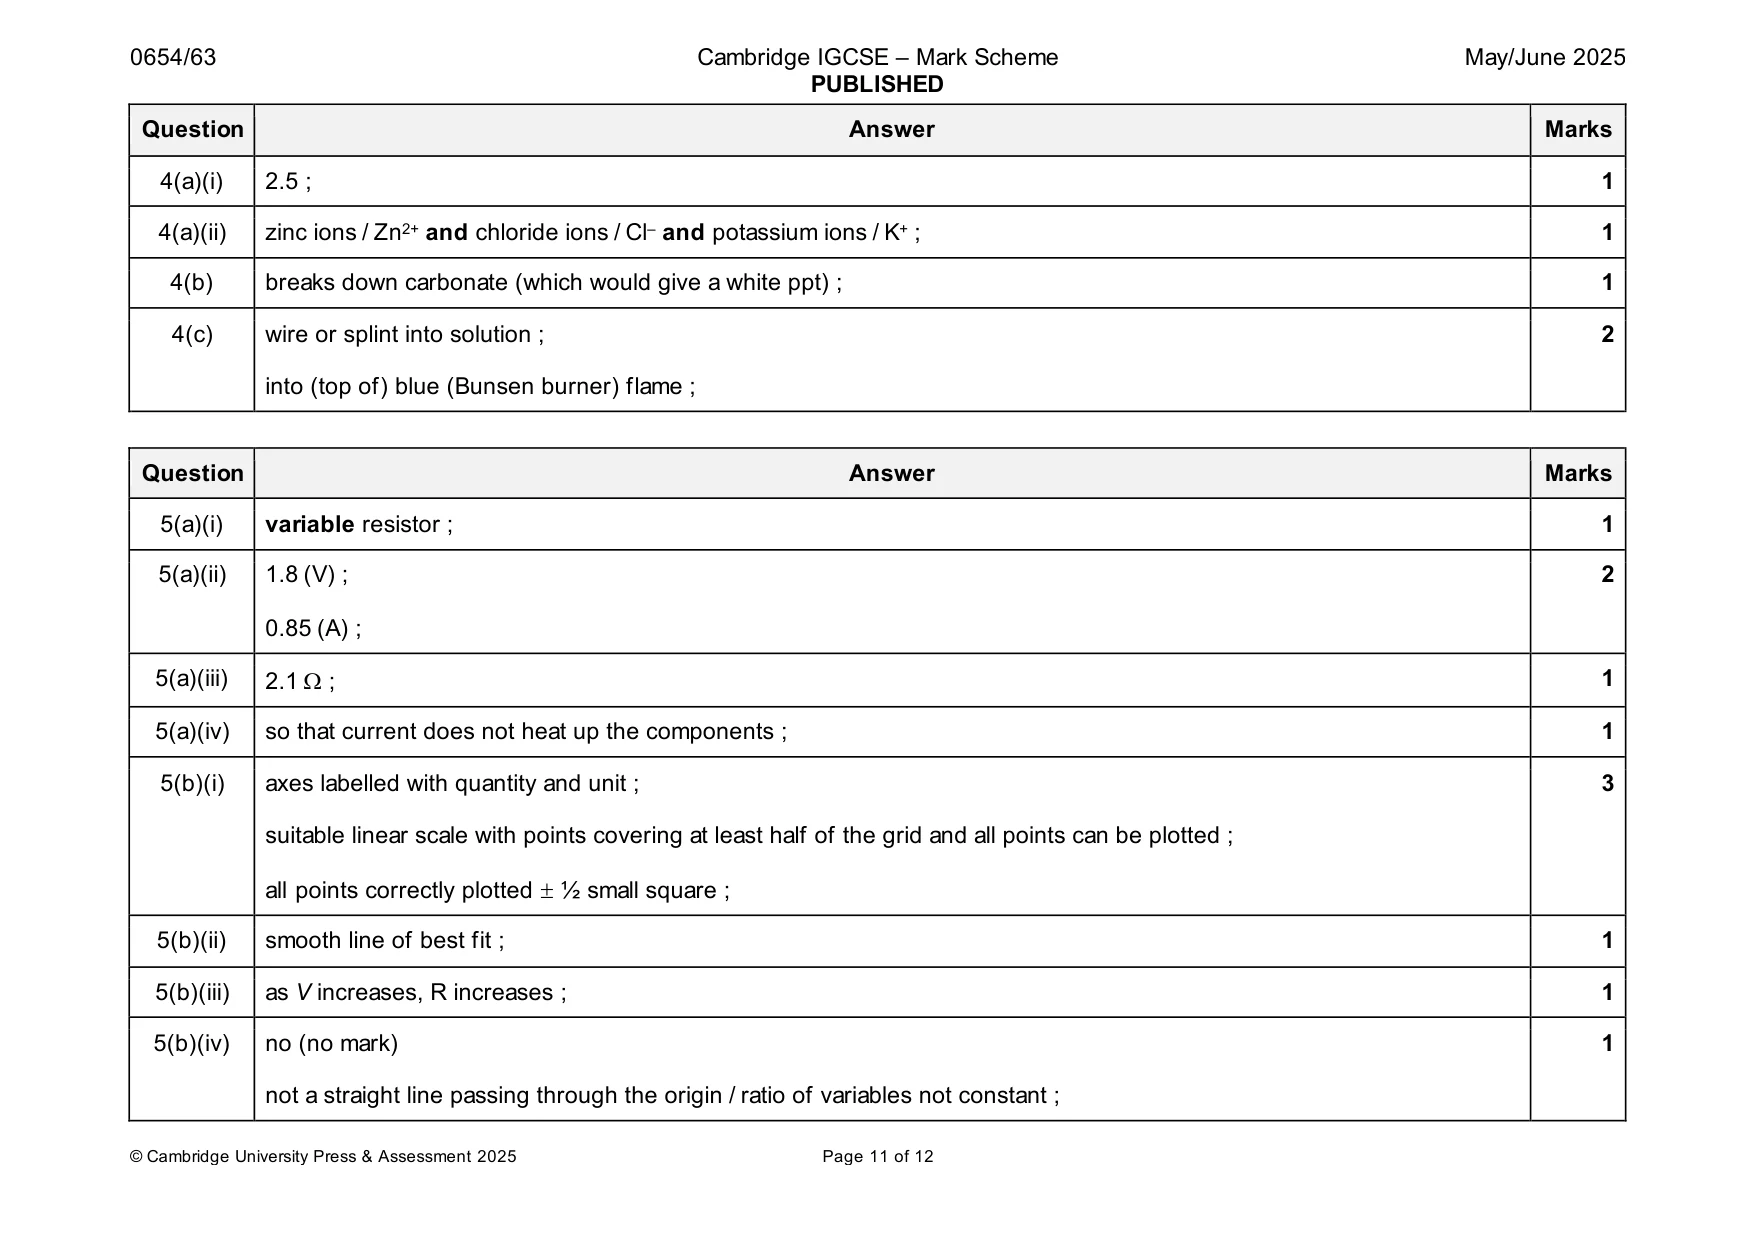
Mark scheme: 4(a)(i) 2.5 ; 1 4(a)(ii) zinc ions / Zn2+ and chloride ions / Cl– and potassium ions / K+ ; 1 4(b) breaks down carbonate (which would give a white ppt) ; 1 4(c) wire or splint into solution ; 2 into (top of) blue (Bunsen burner) flame ;
Q5 · A student investigates how the resistance of a lamp depends on the potential difference…
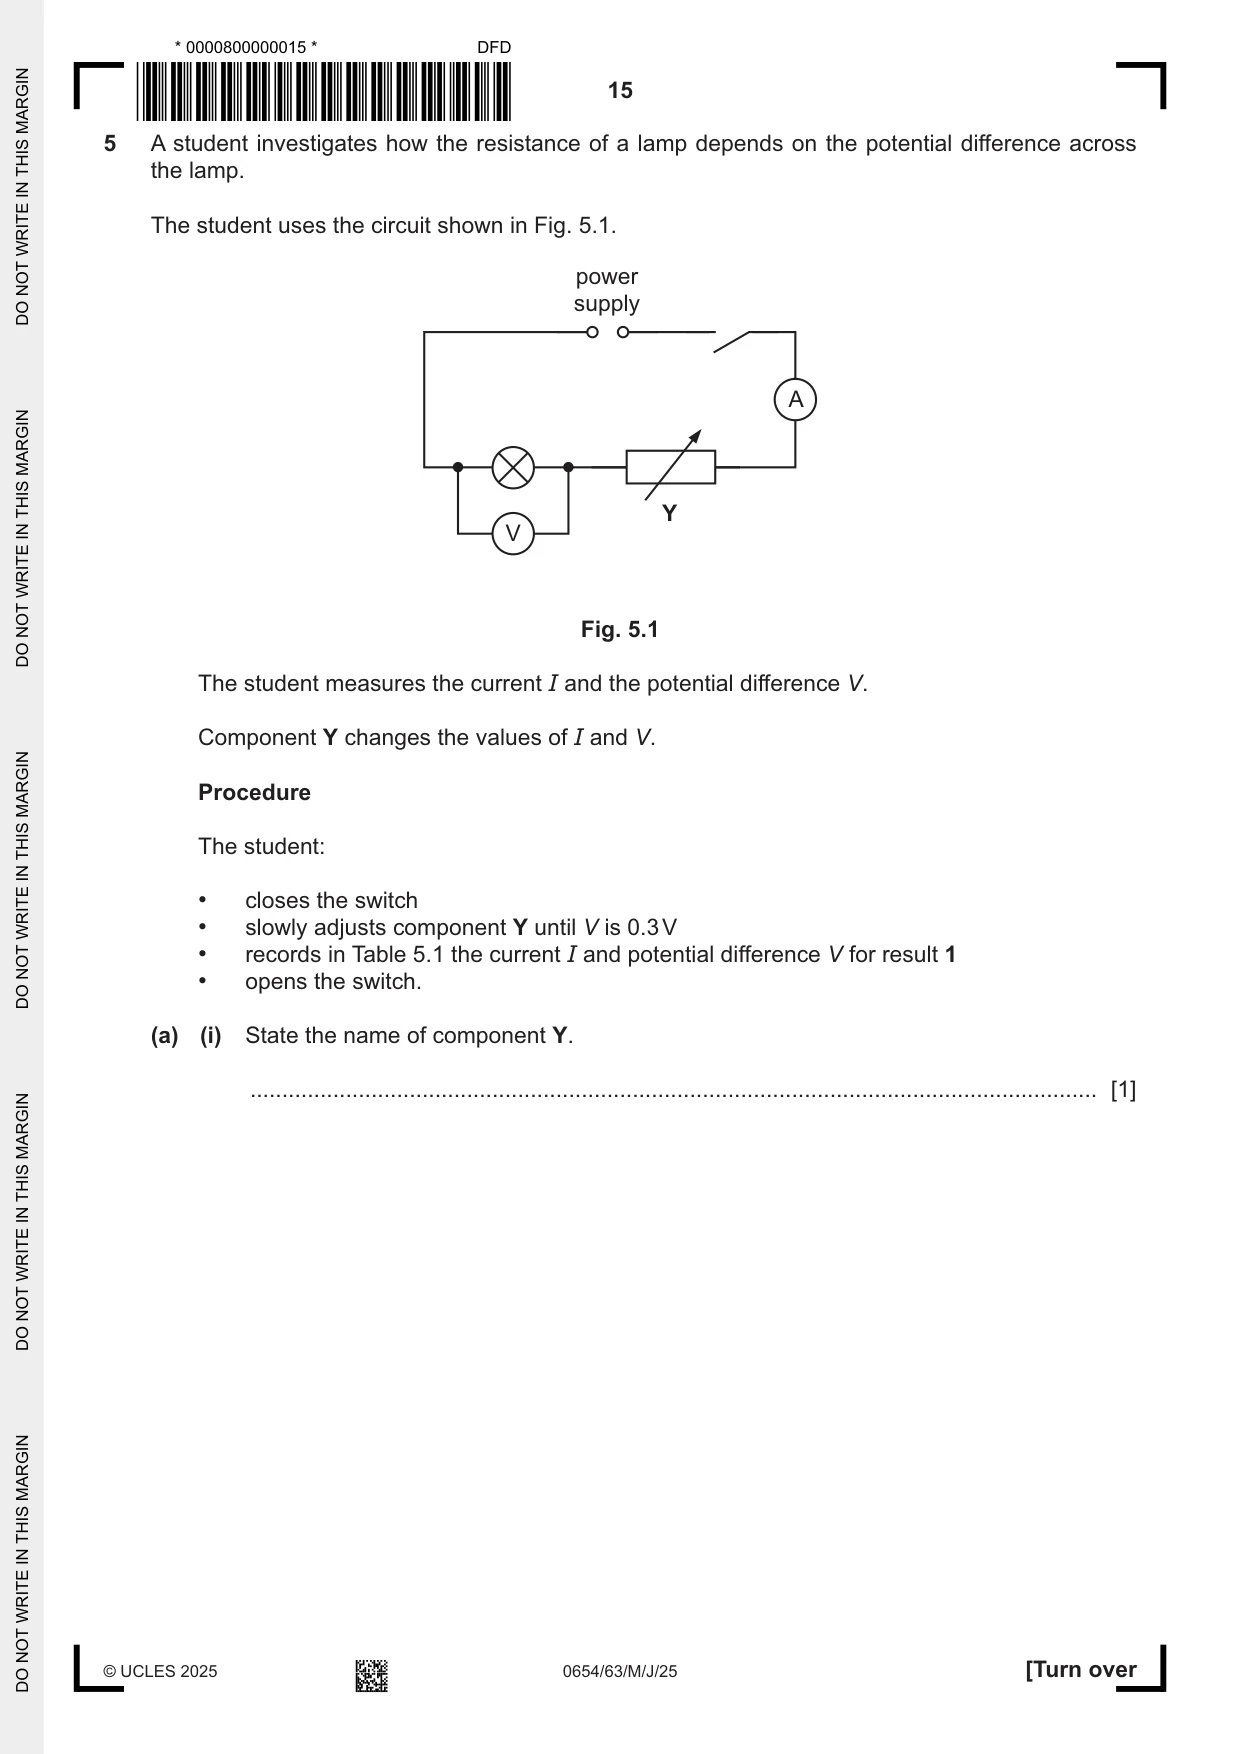
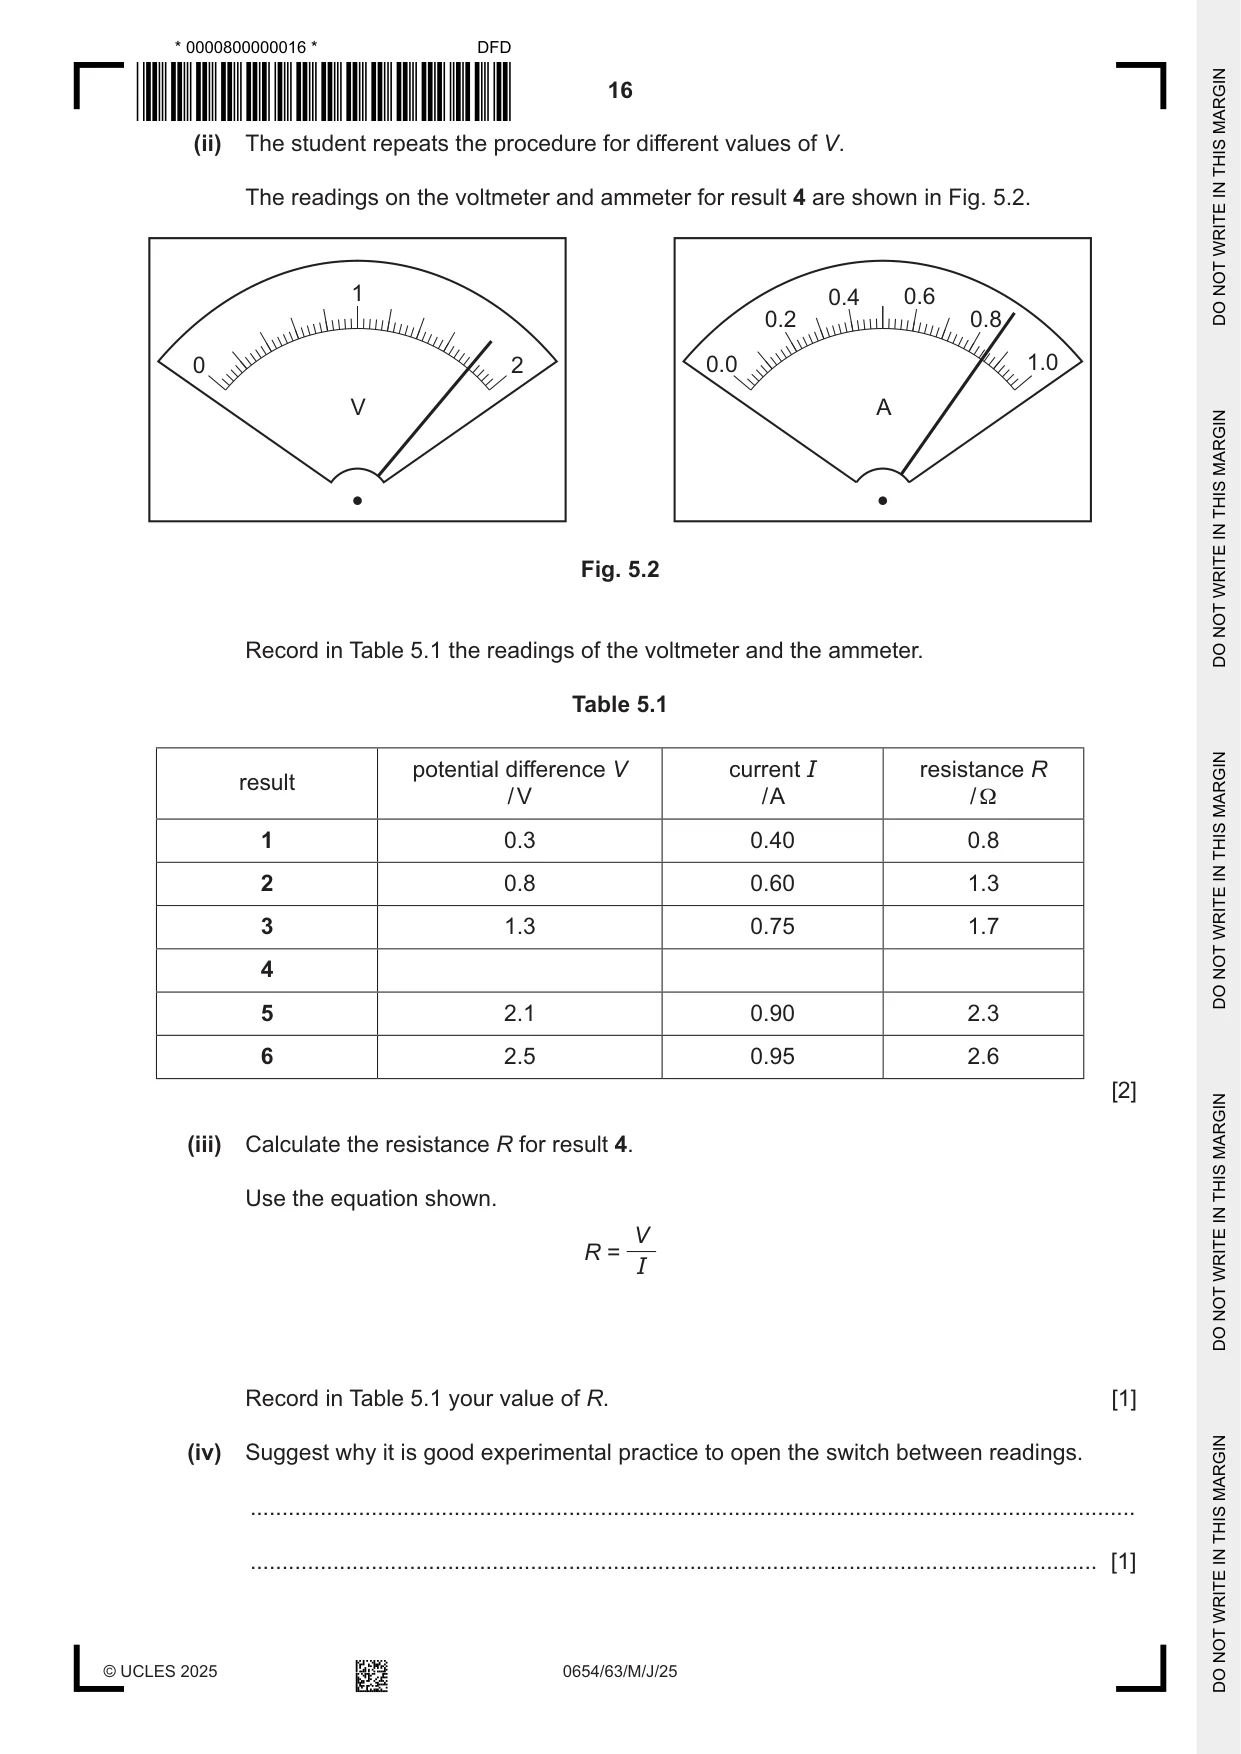
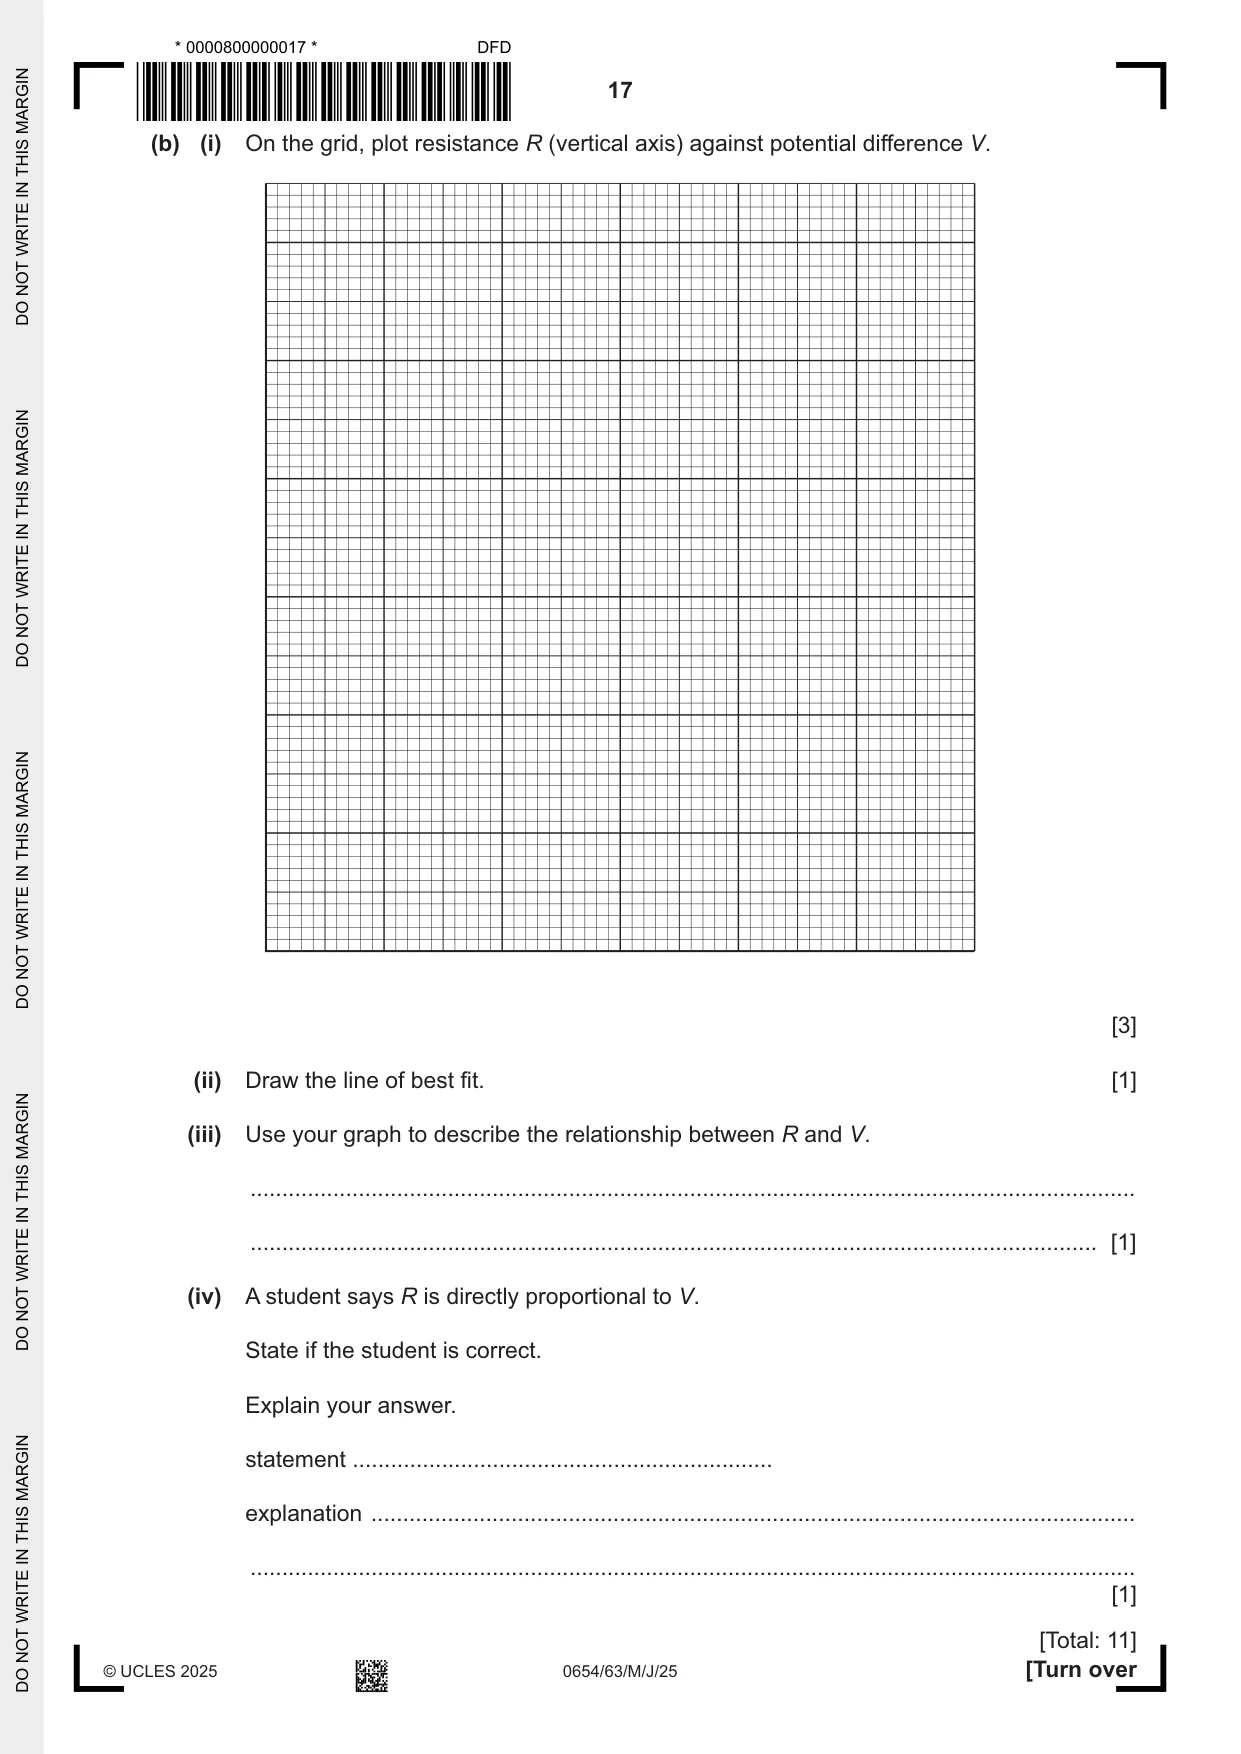
5 A student investigates how the resistance of a lamp depends on the potential difference across the lamp. The student uses the circuit shown in Fig. 5.1. power supply A Y V Fig. 5.1 The student measures the current I and the potential difference V. Component Y changes the values of I and V. Procedure The student: • closes the switch • slowly adjusts component Y until V is 0.3 V • records in Table 5.1 the current I and potential difference V for result 1 • opens the switch. (a) (i) State the name of component Y. ..................................................................................................................................... [1] (ii) The student repeats the procedure for different values of V. The readings on the voltmeter and ammeter for result 4 are shown in Fig. 5.2. 1 0.4 0.6 0.2 0.8 0 2 0.0 1.0 V A Fig. 5.2 Record in Table 5.1 the readings of the voltmeter and the ammeter. Table 5.1 potential difference V current I resistance R result / V / A / Ω 1 0.3 0.40 0.8 2 0.8 0.60 1.3 3 1.3 0.75 1.7 4 5 2.1 0.90 2.3 6 2.5 0.95 2.6 [2] (iii) Calculate the resistance R for result 4. Use the equation shown. V R = I Record in Table 5.1 your value of R. [1] (iv) Suggest why it is good experimental practice to open the switch between readings. ........................................................................................................................................... ..................................................................................................................................... [1] (b) (i) On the grid, plot resistance R (vertical axis) against potential difference V. [3] (ii) Draw the line of best fit. [1] (iii) Use your graph to describe the relationship between R and V. ........................................................................................................................................... ..................................................................................................................................... [1] (iv) A student says R is directly proportional to V. State if the student is correct. Explain your answer. statement .................................................................. explanation ........................................................................................................................ ........................................................................................................................................... [1] [Total: 11]
Mark scheme: 5(a)(i) variable resistor ; 1 5(a)(ii) 1.8 (V) ; 2 0.85 (A) ; 5(a)(iii) 2.1 ; 1 5(a)(iv) so that current does not heat up the components ; 1 5(b)(i) axes labelled with quantity and unit ; 3 suitable linear scale with points covering at least half of the grid and all points can be plotted ; all points correctly plotted ½ small square ; 5(b)(ii) smooth line of best fit ; 1 5(b)(iii) as V increases, R increases ; 1 5(b)(iv) no (no mark) 1 not a straight line passing through the origin / ratio of variables not constant ;
Q6 · A student does an experiment to calculate the spring constant k of a spring
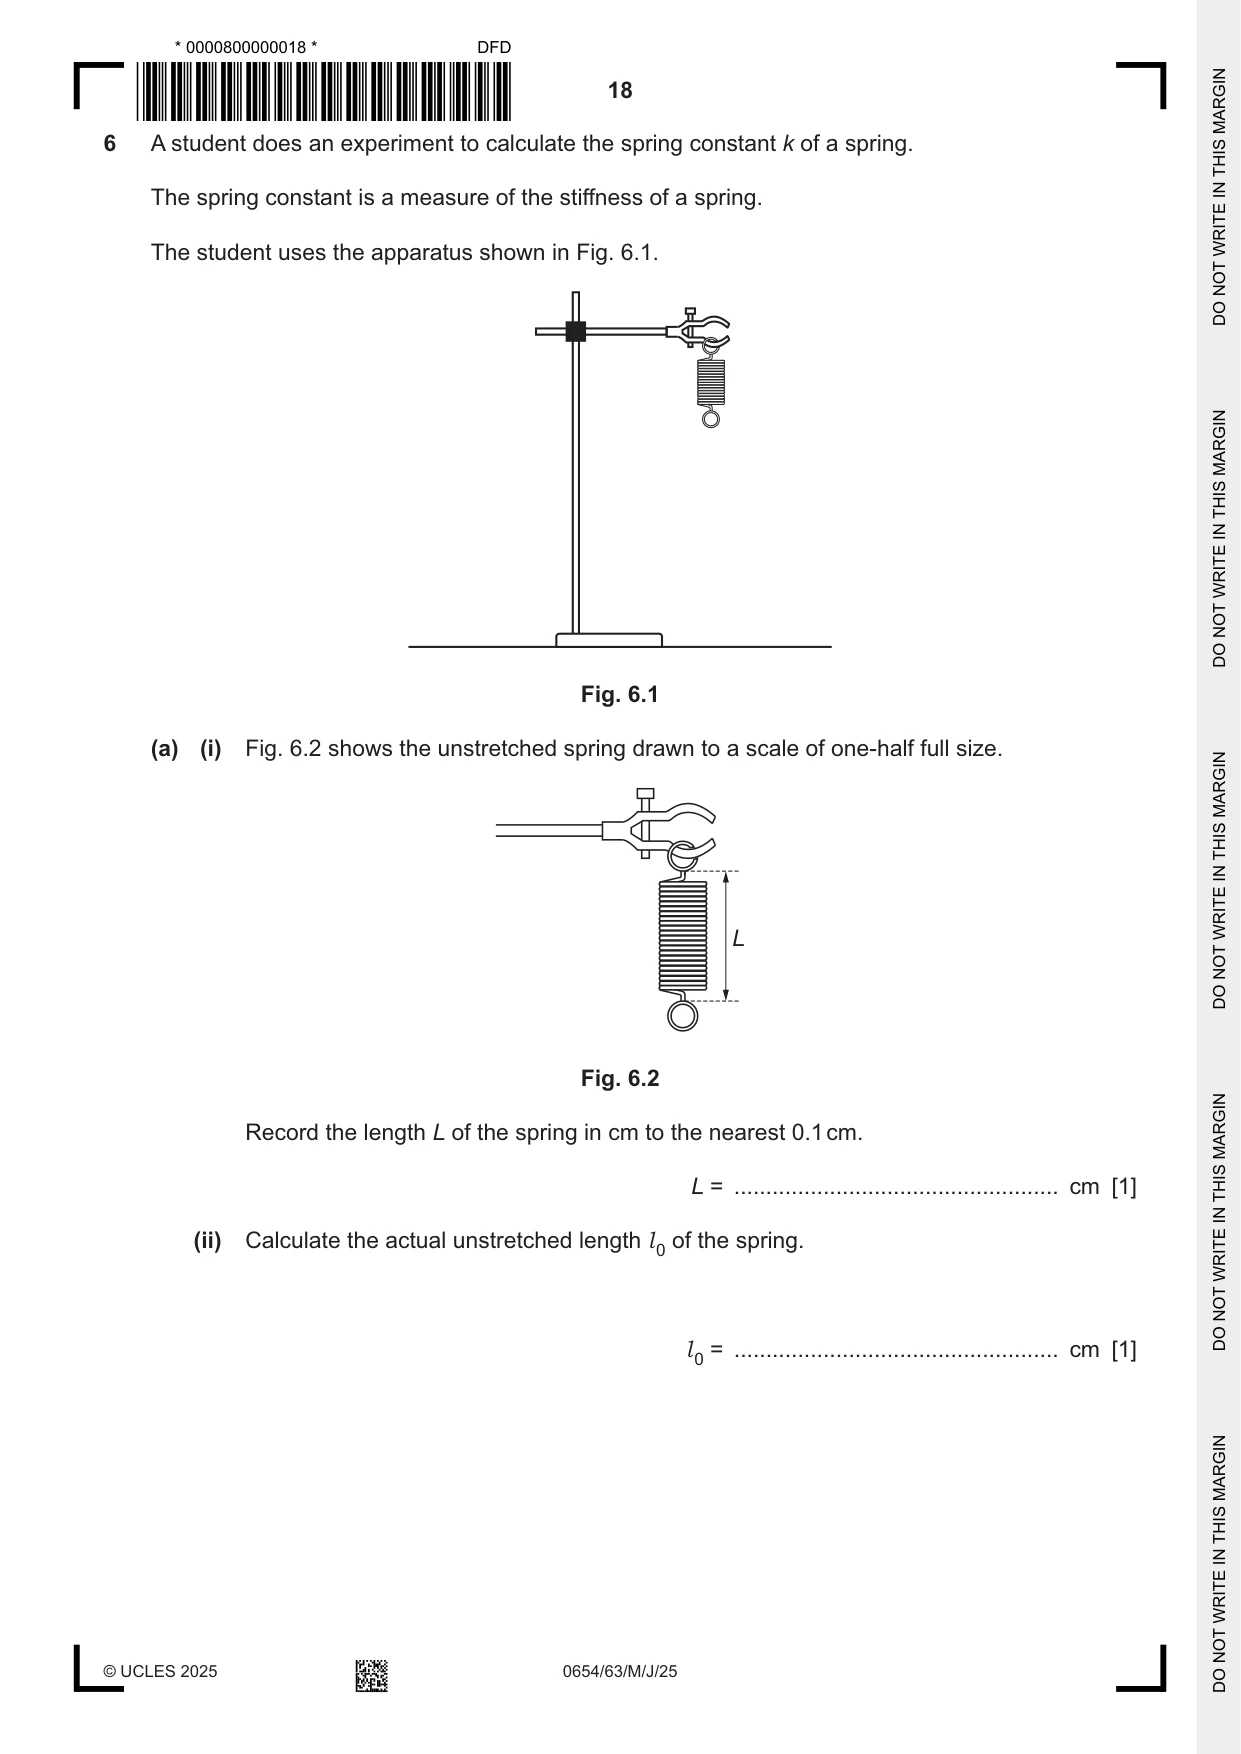
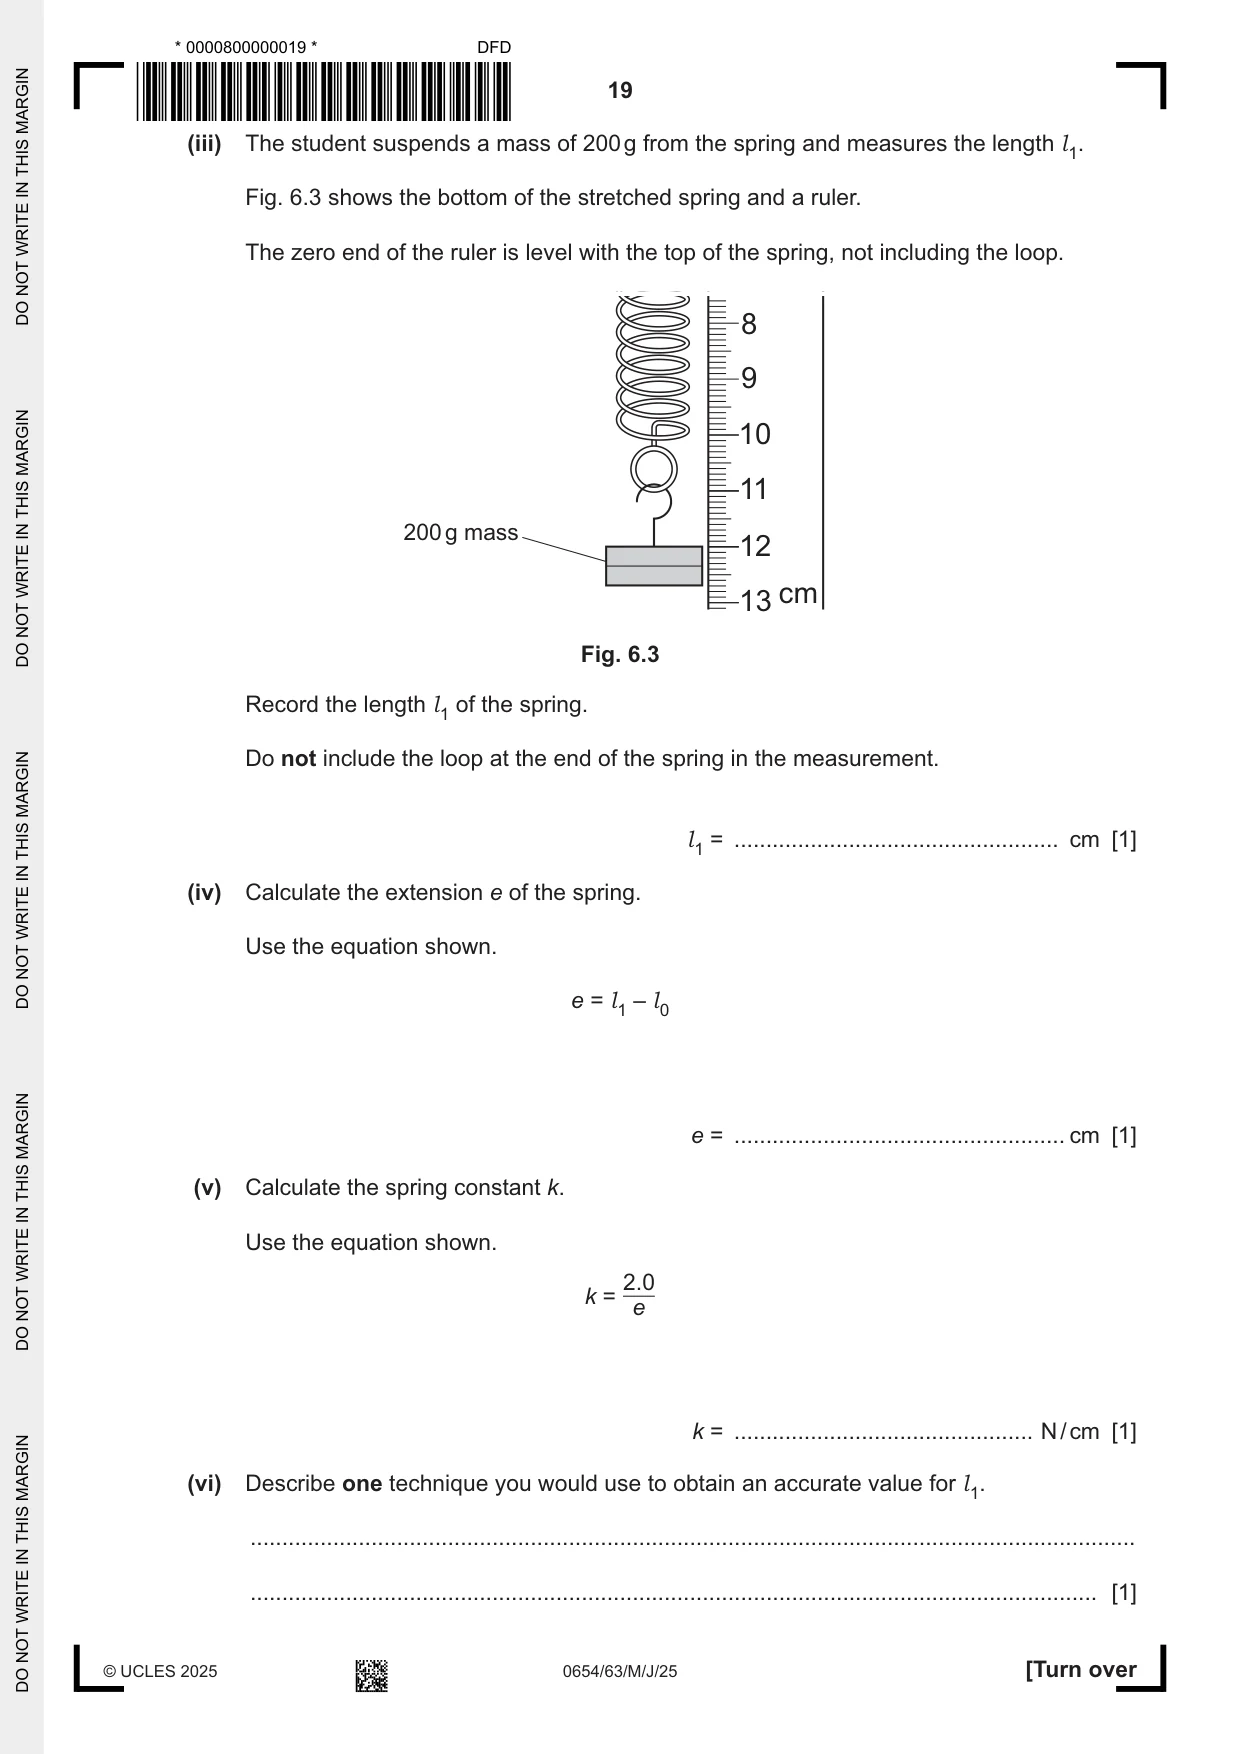
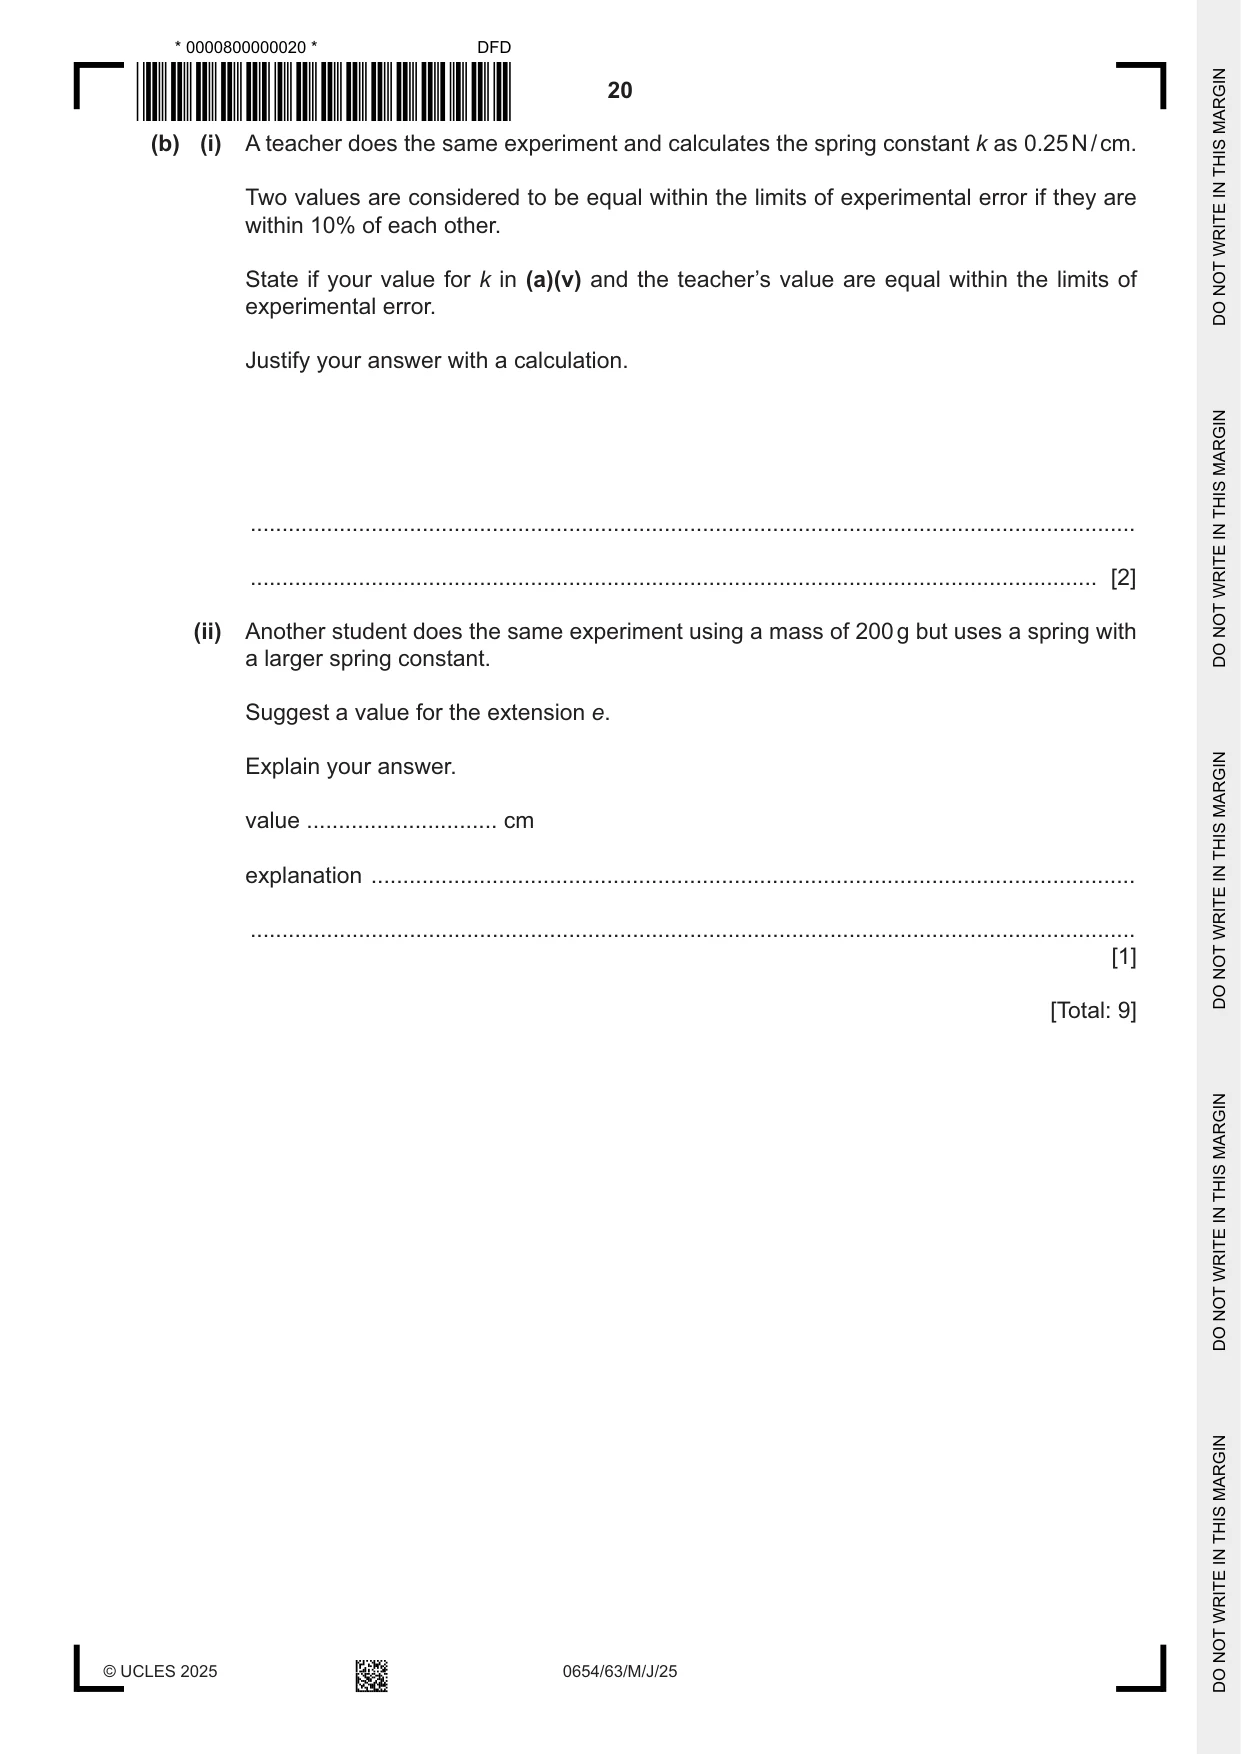
6 A student does an experiment to calculate the spring constant k of a spring. The spring constant is a measure of the stiffness of a spring. The student uses the apparatus shown in Fig. 6.1. Fig. 6.1 (a) (i) Fig. 6.2 shows the unstretched spring drawn to a scale of one-half full size. L Fig. 6.2 Record the length L of the spring in cm to the nearest 0.1 cm. L = ................................................... cm [1] (ii) Calculate the actual unstretched length l 0 of the spring. l 0 = ................................................... cm [1] (iii) The student suspends a mass of 200 g from the spring and measures the length l 1. Fig. 6.3 shows the bottom of the stretched spring and a ruler. The zero end of the ruler is level with the top of the spring, not including the loop. 8 9 10 11 200 g mass 12 cm 13 Fig. 6.3 Record the length l of the spring. 1 Do not include the loop at the end of the spring in the measurement. l = ................................................... cm [1] 1 (iv) Calculate the extension e of the spring. Use the equation shown. e = l – l 1 0 e = .................................................... cm [1] (v) Calculate the spring constant k. Use the equation shown. 2.0 k = e k = ............................................... N / cm [1] (vi) Describe one technique you would use to obtain an accurate value for l 1. ........................................................................................................................................... ..................................................................................................................................... [1] (b) (i) A teacher does the same experiment and calculates the spring constant k as 0.25 N / cm. Two values are considered to be equal within the limits of experimental error if they are within 10% of each other. State if your value for k in (a)(v) and the teacher’s value are equal within the limits of experimental error. Justify your answer with a calculation. ........................................................................................................................................... ..................................................................................................................................... [2] (ii) Another student does the same experiment using a mass of 200 g but uses a spring with a larger spring constant. Suggest a value for the extension e. Explain your answer. value .............................. cm explanation ........................................................................................................................ ........................................................................................................................................... [1] [Total: 9]
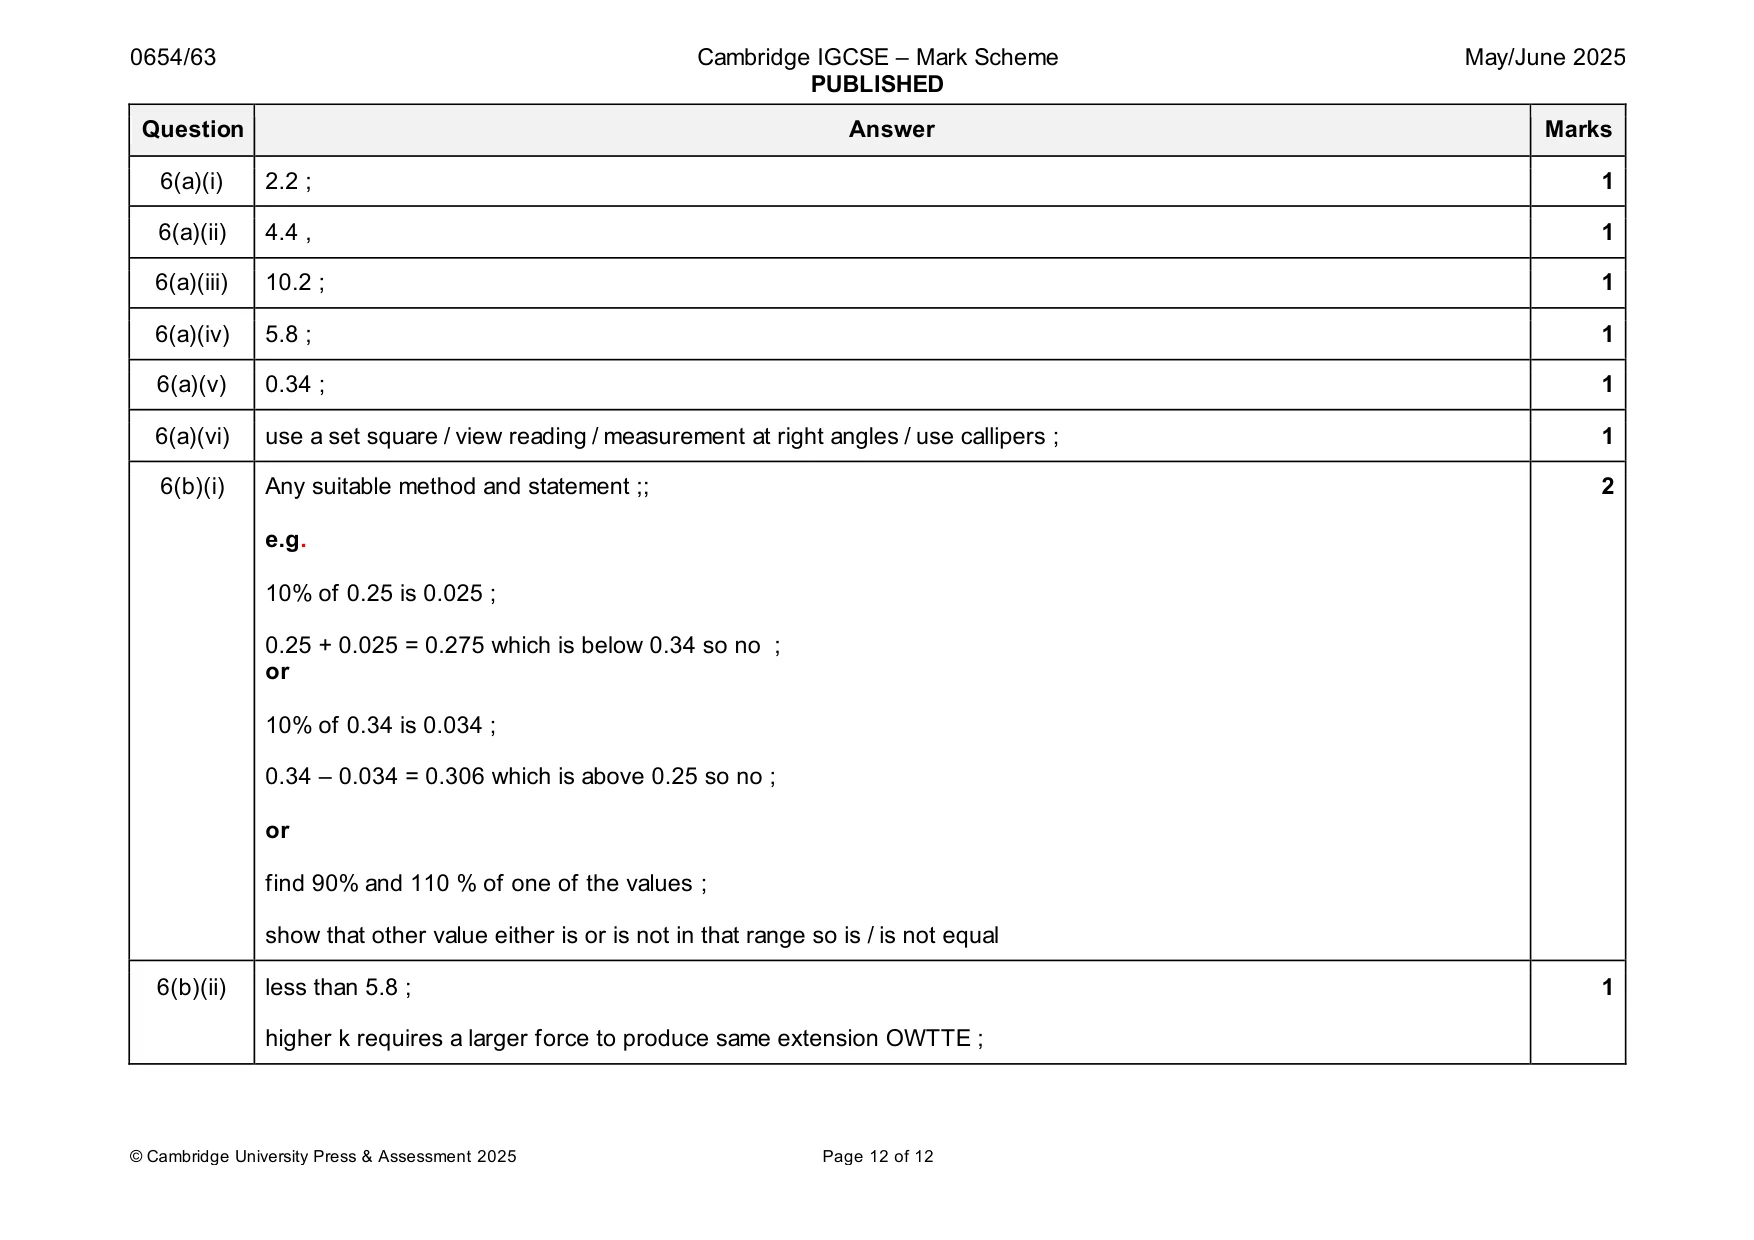
Mark scheme: 6(a)(i) 2.2 ; 1 6(a)(ii) 4.4 , 1 6(a)(iii) 10.2 ; 1 6(a)(iv) 5.8 ; 1 6(a)(v) 0.34 ; 1 6(a)(vi) use a set square / view reading / measurement at right angles / use callipers ; 1 6(b)(i) Any suitable method and statement ;; 2 e.g. 10% of 0.25 is 0.025 ; 0.25 + 0.025 = 0.275 which is below 0.34 so no ; or 10% of 0.34 is 0.034 ; 0.34 – 0.034 = 0.306 which is above 0.25 so no ; or find 90% and 110 % of one of the values ; show that other value either is or is not in that range so is / is not equal 6(b)(ii) less than 5.8 ; 1 higher k requires a larger force to produce same extension OWTTE ;
What was in this paper
The subtopics covered by these 6 questions, and how many questions each got. Open one in a new tab to see every Cambridge question on it.
What you needed in this session
Cambridge’s own grade thresholds for 2025 May/June, Paper 6 · Variant 3. A higher threshold means an easier paper — the bar moves with how the cohort did.