Cambridge IGCSE Sciences - Co-ordinated (Double) 0654 — 2016 May/June Paper 6 · Variant 2
0654/62/M/J/16 · 60 marks · ≈68 min
The question paper and its mark scheme, free to read here and free to download. This is Cambridge’s own paper, exactly as it was sat.
Question paper20 pages




Mark scheme4 pages
Answers below. Sit the paper first if you are practising.
Paper as text
Question paper, page 1
This document consists of 19 printed pages and 1 blank page. DC (KN/SG) 111679/5 © UCLES 2016 [Turn over Cambridge International Examinations Cambridge International General Certificate of Secondary Education * 2 5 6 9 1 2 4 2 5 9 * CO-ORDINATED SCIENCES 0654/62 Paper 6 Alternative to Practical May/June 2016 1 hour Candidates answer on the Question Paper. No Additional Materials are required. READ THESE INSTRUCTIONS FIRST Write your Centre number, candidate number and name on all the work you hand in. Write in dark blue or black pen. You may use an HB pencil for any diagrams or graphs. Do not use staples, paper clips, glue or correction fluid. DO NOT WRITE IN ANY BARCODES. Answer all questions. Electronic calculators may be used. You may lose marks if you do not show your working or if you do not use appropriate units. At the end of the examination, fasten all your work securely together. The number of marks is given in brackets [ ] at the end of each question or part question.
Question paper, page 2
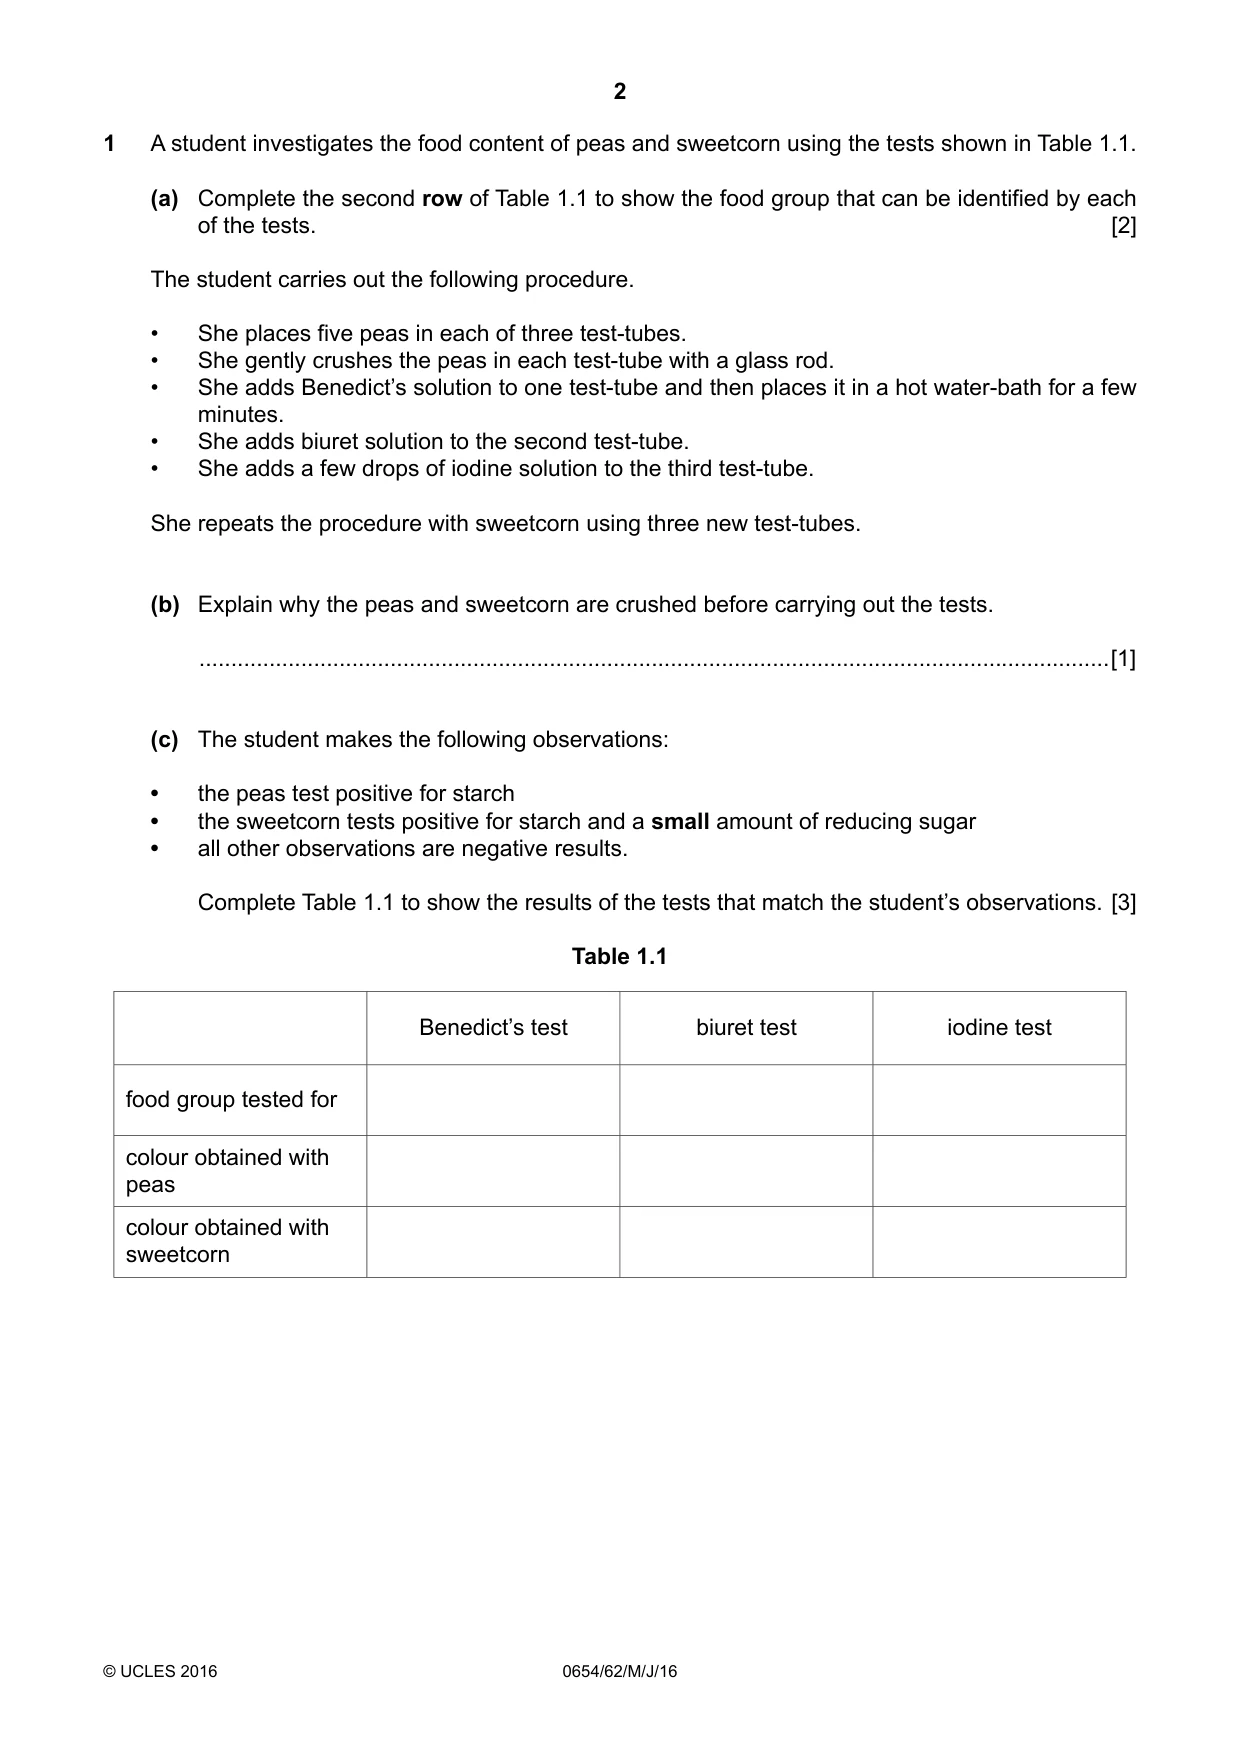
2 0654/62/M/J/16 © UCLES 2016 1 A student investigates the food content of peas and sweetcorn using the tests shown in Table 1.1. (a) Complete the second row of Table 1.1 to show the food group that can be identified by each of the tests. [2] The student carries out the following procedure. • She places five peas in each of three test-tubes. • She gently crushes the peas in each test-tube with a glass rod. • She adds Benedict’s solution to one test-tube and then places it in a hot water-bath for a few minutes. • She adds biuret solution to the second test-tube. • She adds a few drops of iodine solution to the third test-tube. She repeats the procedure with sweetcorn using three new test-tubes. (b) Explain why the peas and sweetcorn are crushed before carrying out the tests. …[1] (c) The student makes the following observations: • the peas test positive for starch • the sweetcorn tests positive for starch and a small amount of reducing sugar • all other observations are negative results. Complete Table 1.1 to show the results of the tests that match the student’s observations. [3] Table 1.1 Benedict’s test biuret test iodine test food group tested for colour obtained with peas colour obtained with sweetcorn
Question paper, page 3
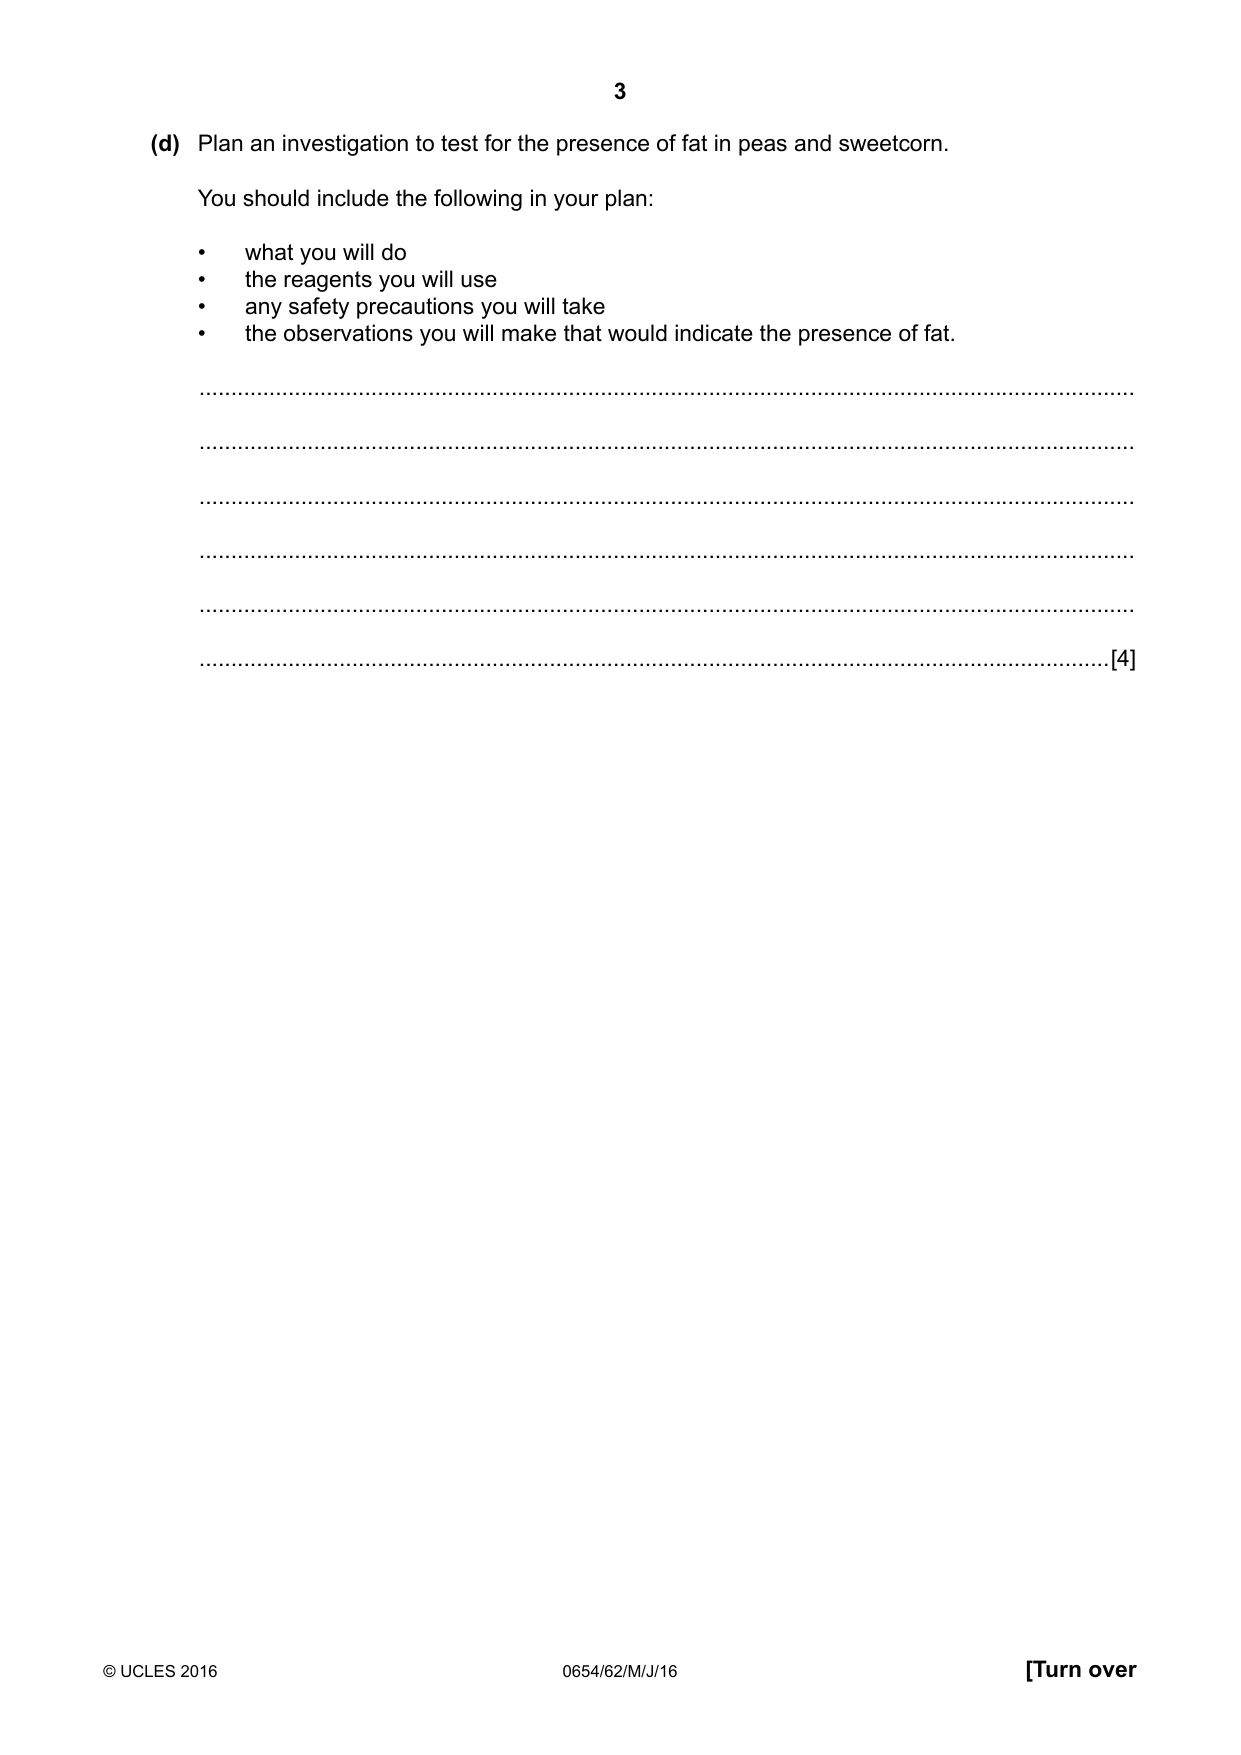
3 0654/62/M/J/16 © UCLES 2016 [Turn over (d) Plan an investigation to test for the presence of fat in peas and sweetcorn. You should include the following in your plan: • what you will do • the reagents you will use • any safety precautions you will take • the observations you will make that would indicate the presence of fat. … … … … … …[4]
Question paper, page 4
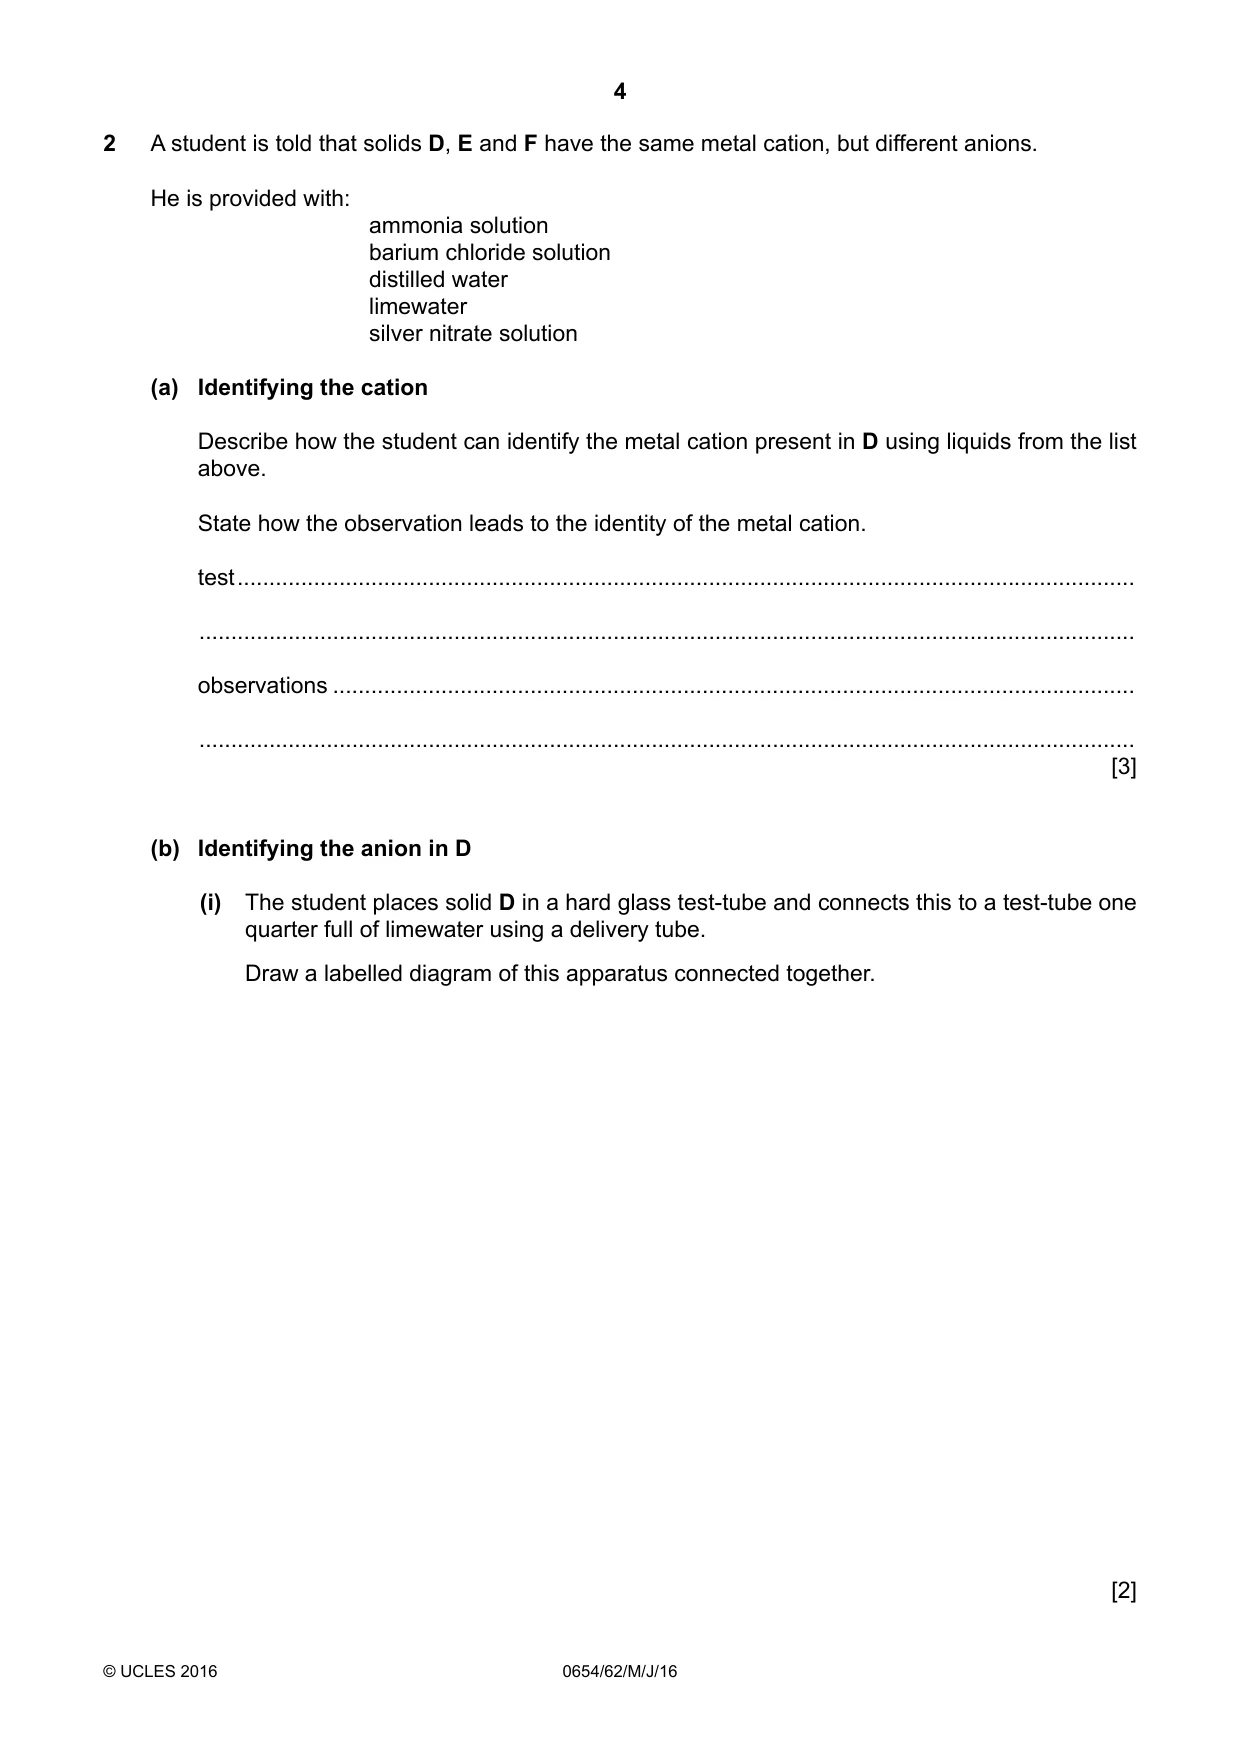
4 0654/62/M/J/16 © UCLES 2016 2 A student is told that solids D, E and F have the same metal cation, but different anions. He is provided with: ammonia solution barium chloride solution distilled water limewater silver nitrate solution (a) Identifying the cation Describe how the student can identify the metal cation present in D using liquids from the list above. State how the observation leads to the identity of the metal cation. test … … observations … … [3] (b) Identifying the anion in D (i) The student places solid D in a hard glass test-tube and connects this to a test-tube one quarter full of limewater using a delivery tube. Draw a labelled diagram of this apparatus connected together. [2]
Question paper, page 5
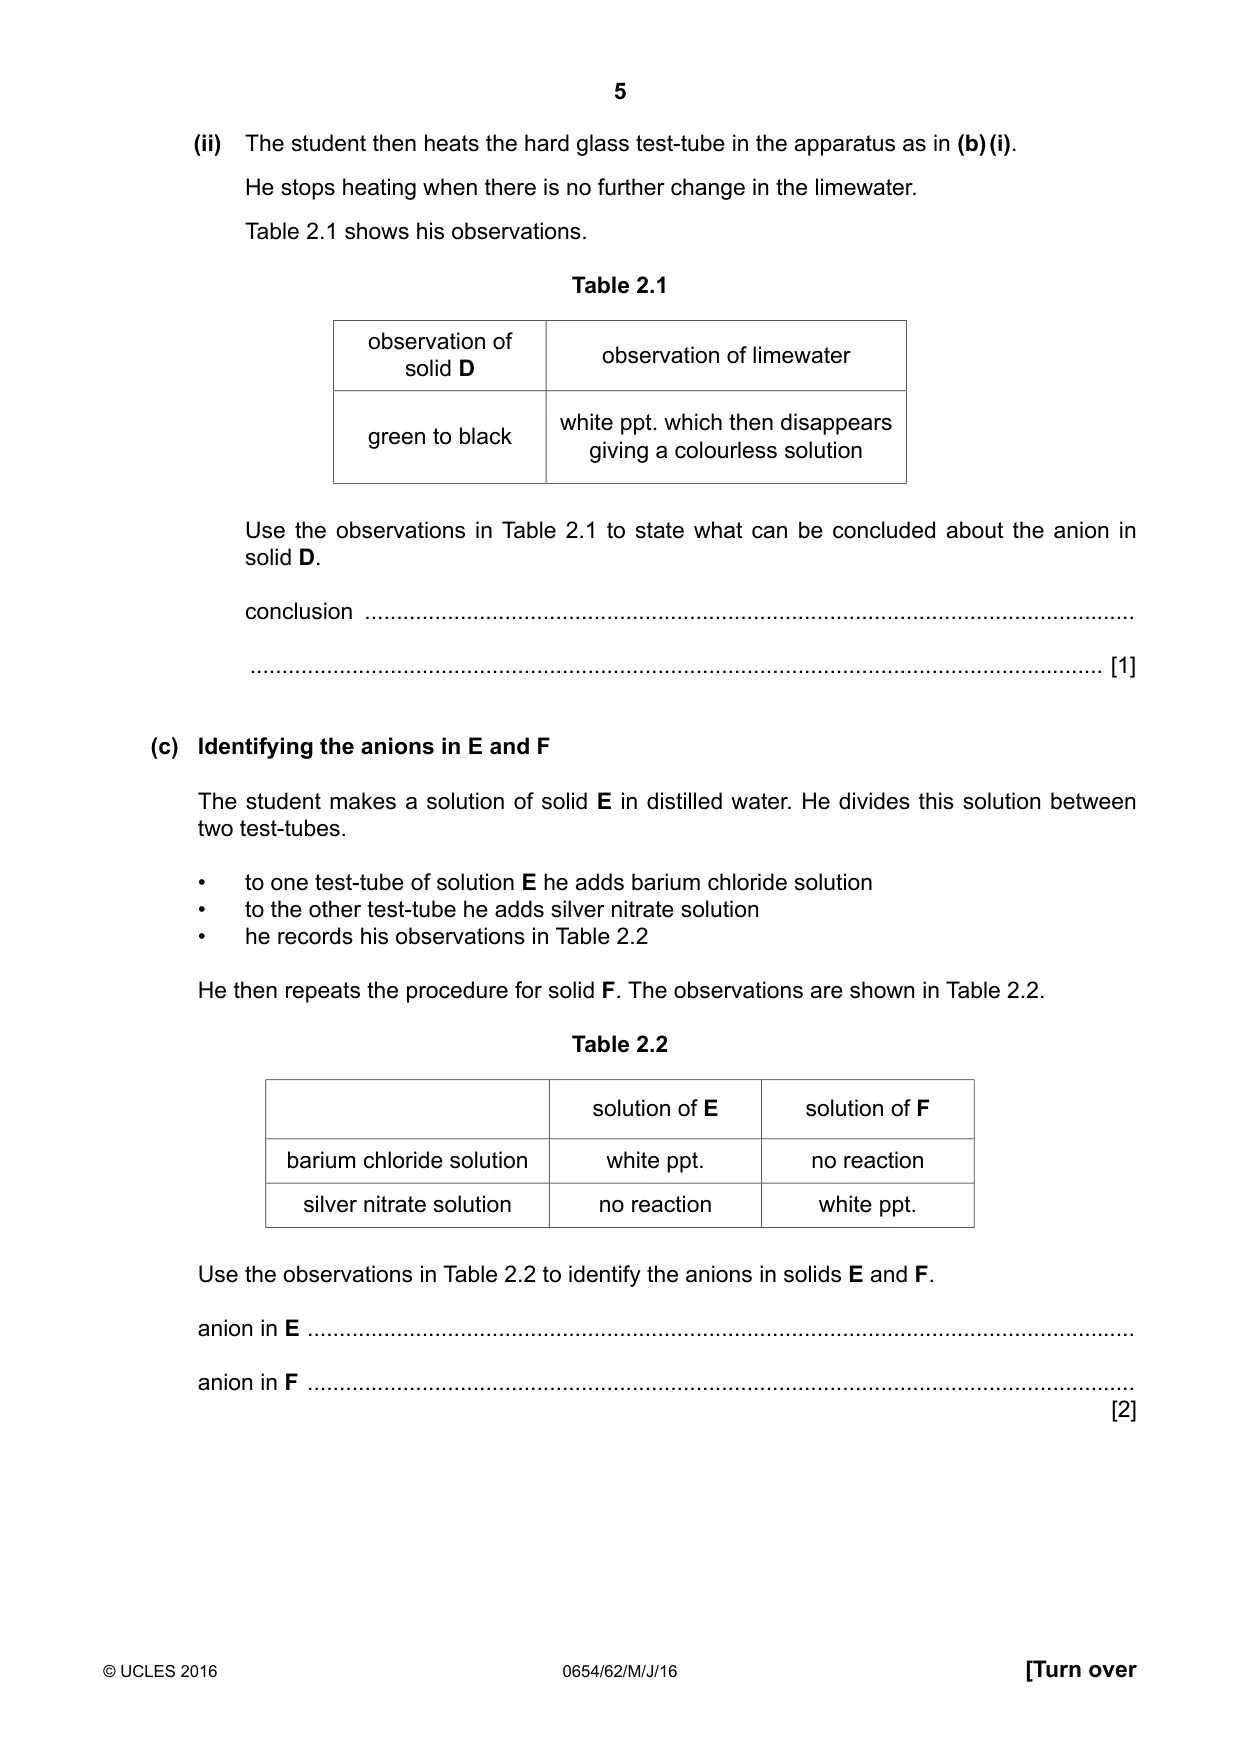
5 0654/62/M/J/16 © UCLES 2016 [Turn over (ii) The student then heats the hard glass test-tube in the apparatus as in (b) (i). He stops heating when there is no further change in the limewater. Table 2.1 shows his observations. Table 2.1 observation of solid D observation of limewater green to black white ppt. which then disappears giving a colourless solution Use the observations in Table 2.1 to state what can be concluded about the anion in solid D. conclusion … … [1] (c) Identifying the anions in E and F The student makes a solution of solid E in distilled water. He divides this solution between two test-tubes. • to one test-tube of solution E he adds barium chloride solution • to the other test-tube he adds silver nitrate solution • he records his observations in Table 2.2 He then repeats the procedure for solid F. The observations are shown in Table 2.2. Table 2.2 solution of E solution of F barium chloride solution white ppt. no reaction silver nitrate solution no reaction white ppt. Use the observations in Table 2.2 to identify the anions in solids E and F. anion in E … anion in F … [2]
Question paper, page 6
6 0654/62/M/J/16 © UCLES 2016 (d) Suggest a different reagent, not listed on page 4, that could be used to identify the metal cation. State the expected observation for your chosen reagent if the metal cation in D, E and F is Cu2+. reagent … expected observation … [2]
Question paper, page 7
7 0654/62/M/J/16 © UCLES 2016 [Turn over Please turn over for Question 3.
Question paper, page 8
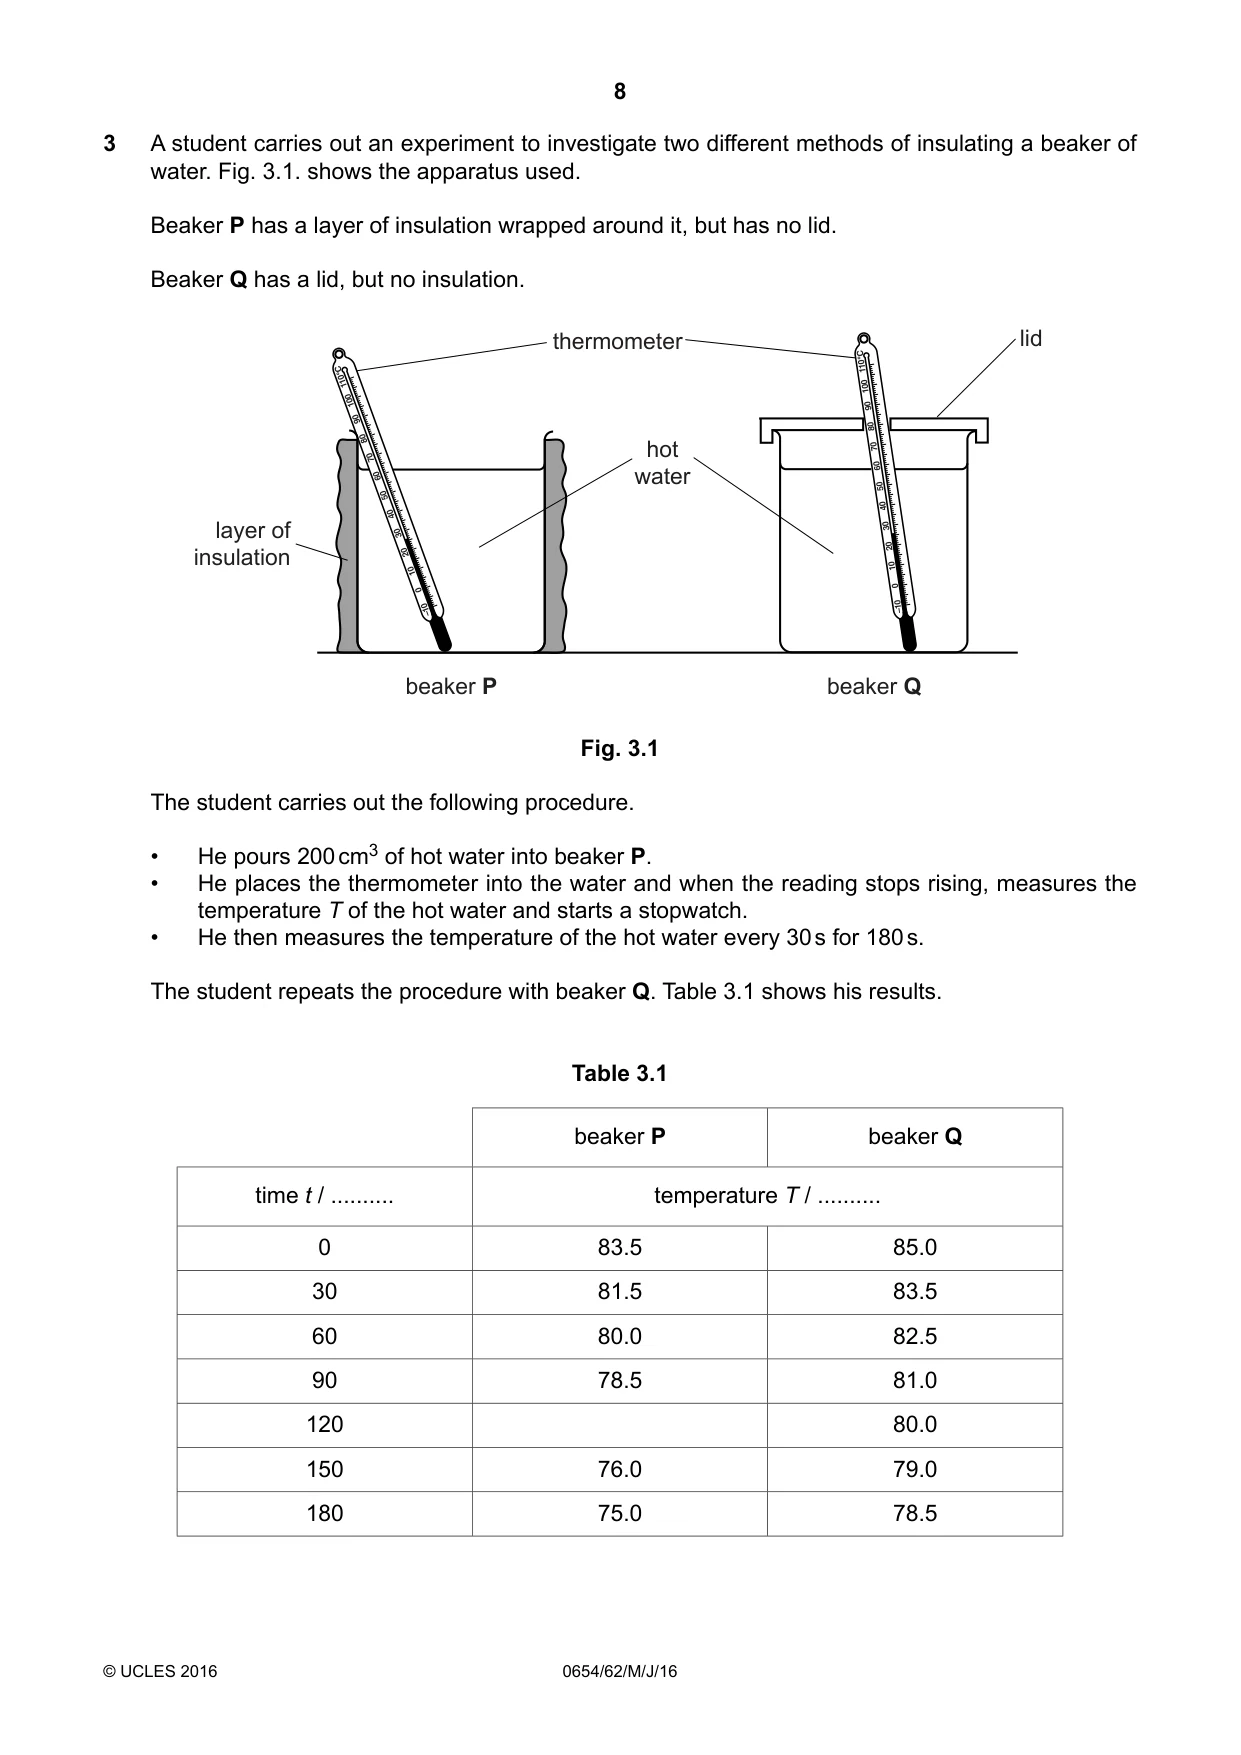
8 0654/62/M/J/16 © UCLES 2016 3 A student carries out an experiment to investigate two different methods of insulating a beaker of water. Fig. 3.1. shows the apparatus used. Beaker P has a layer of insulation wrapped around it, but has no lid. Beaker Q has a lid, but no insulation. –10 0 10 20 30 40 50 60 70 80 90 100 110°C –10 0 10 20 30 40 50 60 70 80 90 100 110°C layer of insulation thermometer hot water beaker P beaker Q lid Fig. 3.1 The student carries out the following procedure. • He pours 200 cm3 of hot water into beaker P. • He places the thermometer into the water and when the reading stops rising, measures the temperature T of the hot water and starts a stopwatch. • He then measures the temperature of the hot water every 30 s for 180 s. The student repeats the procedure with beaker Q. Table 3.1 shows his results. Table 3.1 beaker P beaker Q time t / … temperature T / … 0 83.5 85.0 30 81.5 83.5 60 80.0 82.5 90 78.5 81.0 120 80.0 150 76.0 79.0 180 75.0 78.5
Question paper, page 9
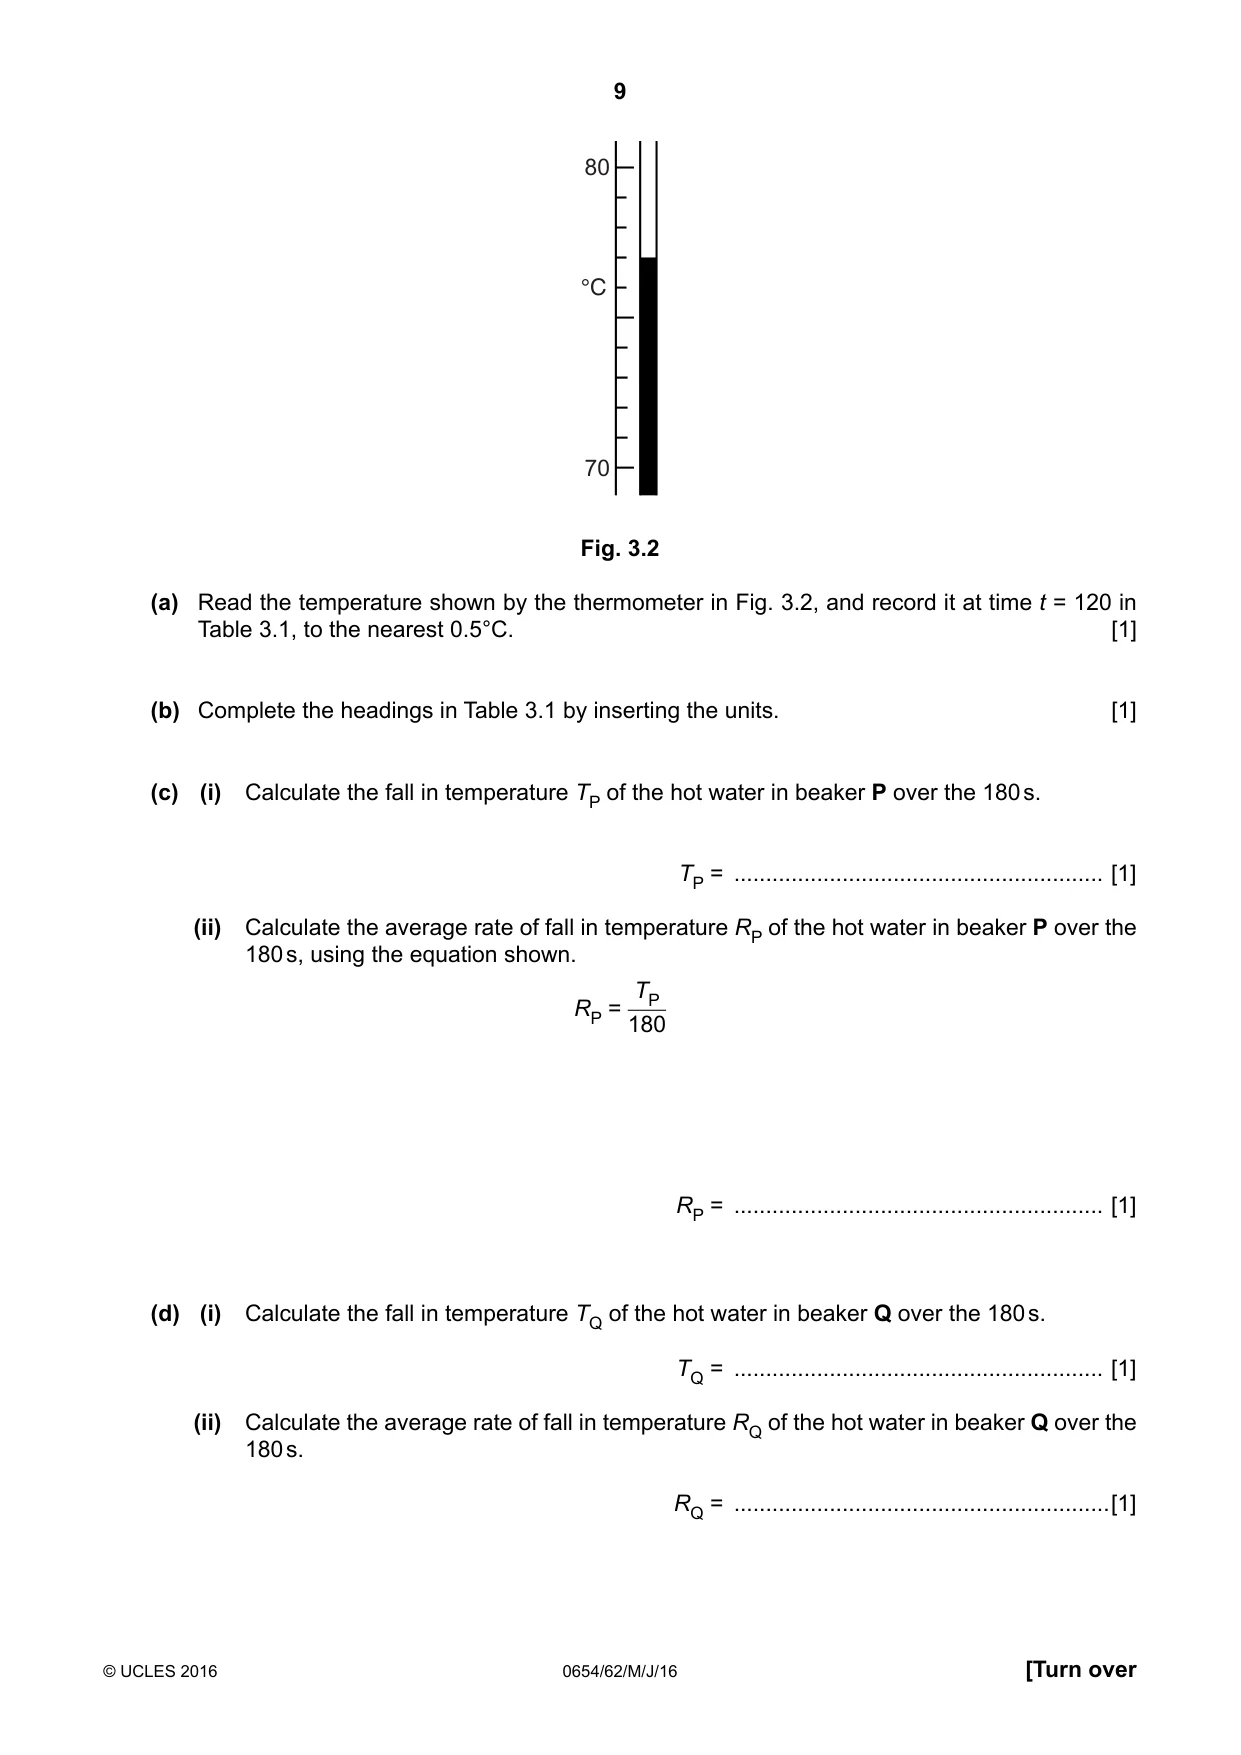
9 0654/62/M/J/16 © UCLES 2016 [Turn over 80 70 °C Fig. 3.2 (a) Read the temperature shown by the thermometer in Fig. 3.2, and record it at time t = 120 in Table 3.1, to the nearest 0.5°C. [1] (b) Complete the headings in Table 3.1 by inserting the units. [1] (c) (i) Calculate the fall in temperature TP of the hot water in beaker P over the 180 s. TP = … [1] (ii) Calculate the average rate of fall in temperature RP of the hot water in beaker P over the 180 s, using the equation shown. RP = TP 180 RP = … [1] (d) (i) Calculate the fall in temperature TQ of the hot water in beaker Q over the 180 s. TQ = … [1] (ii) Calculate the average rate of fall in temperature RQ of the hot water in beaker Q over the 180 s. RQ = …[1]
Question paper, page 10
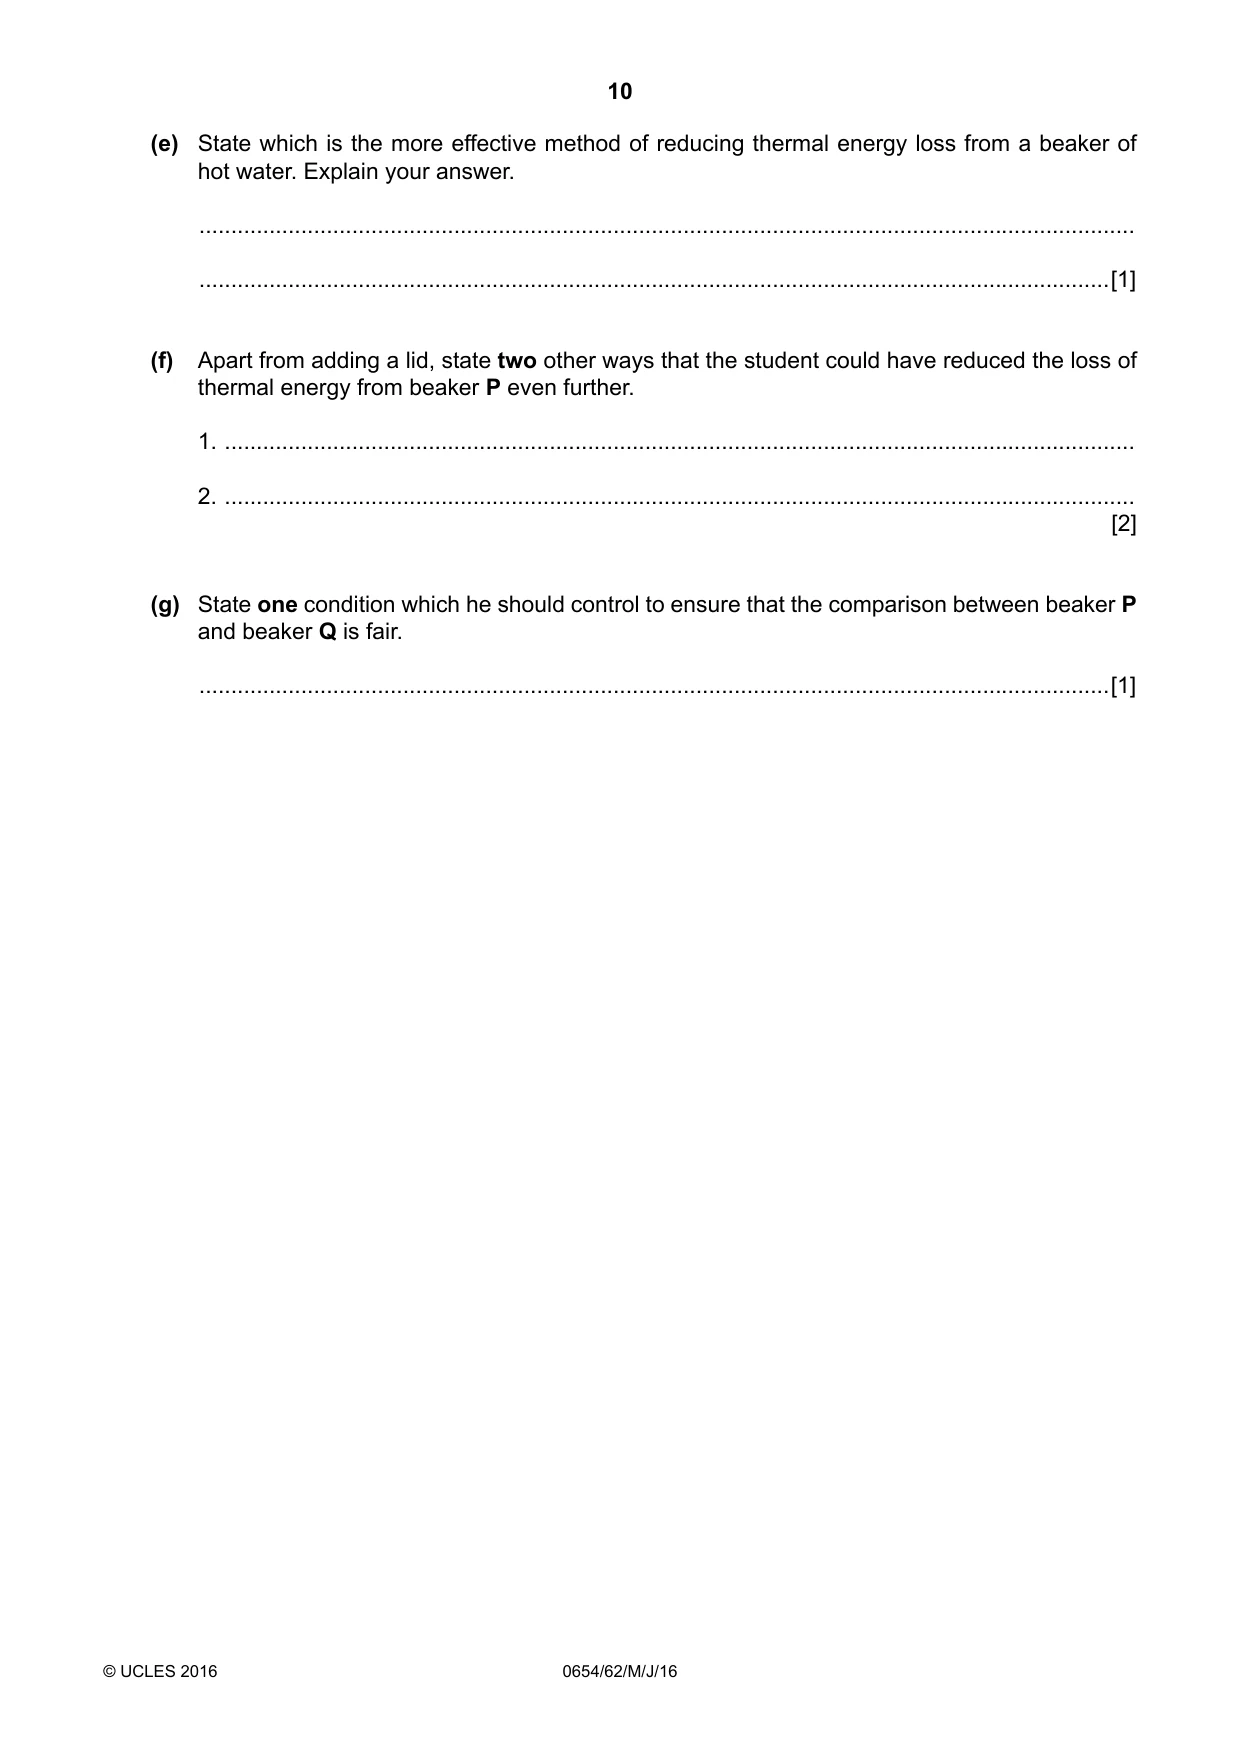
10 0654/62/M/J/16 © UCLES 2016 (e) State which is the more effective method of reducing thermal energy loss from a beaker of hot water. Explain your answer. … …[1] (f) Apart from adding a lid, state two other ways that the student could have reduced the loss of thermal energy from beaker P even further. 1. … 2. … [2] (g) State one condition which he should control to ensure that the comparison between beaker P and beaker Q is fair. …[1]
Question paper, page 11
11 0654/62/M/J/16 © UCLES 2016 [Turn over Please turn over for Question 4.
Question paper, page 12
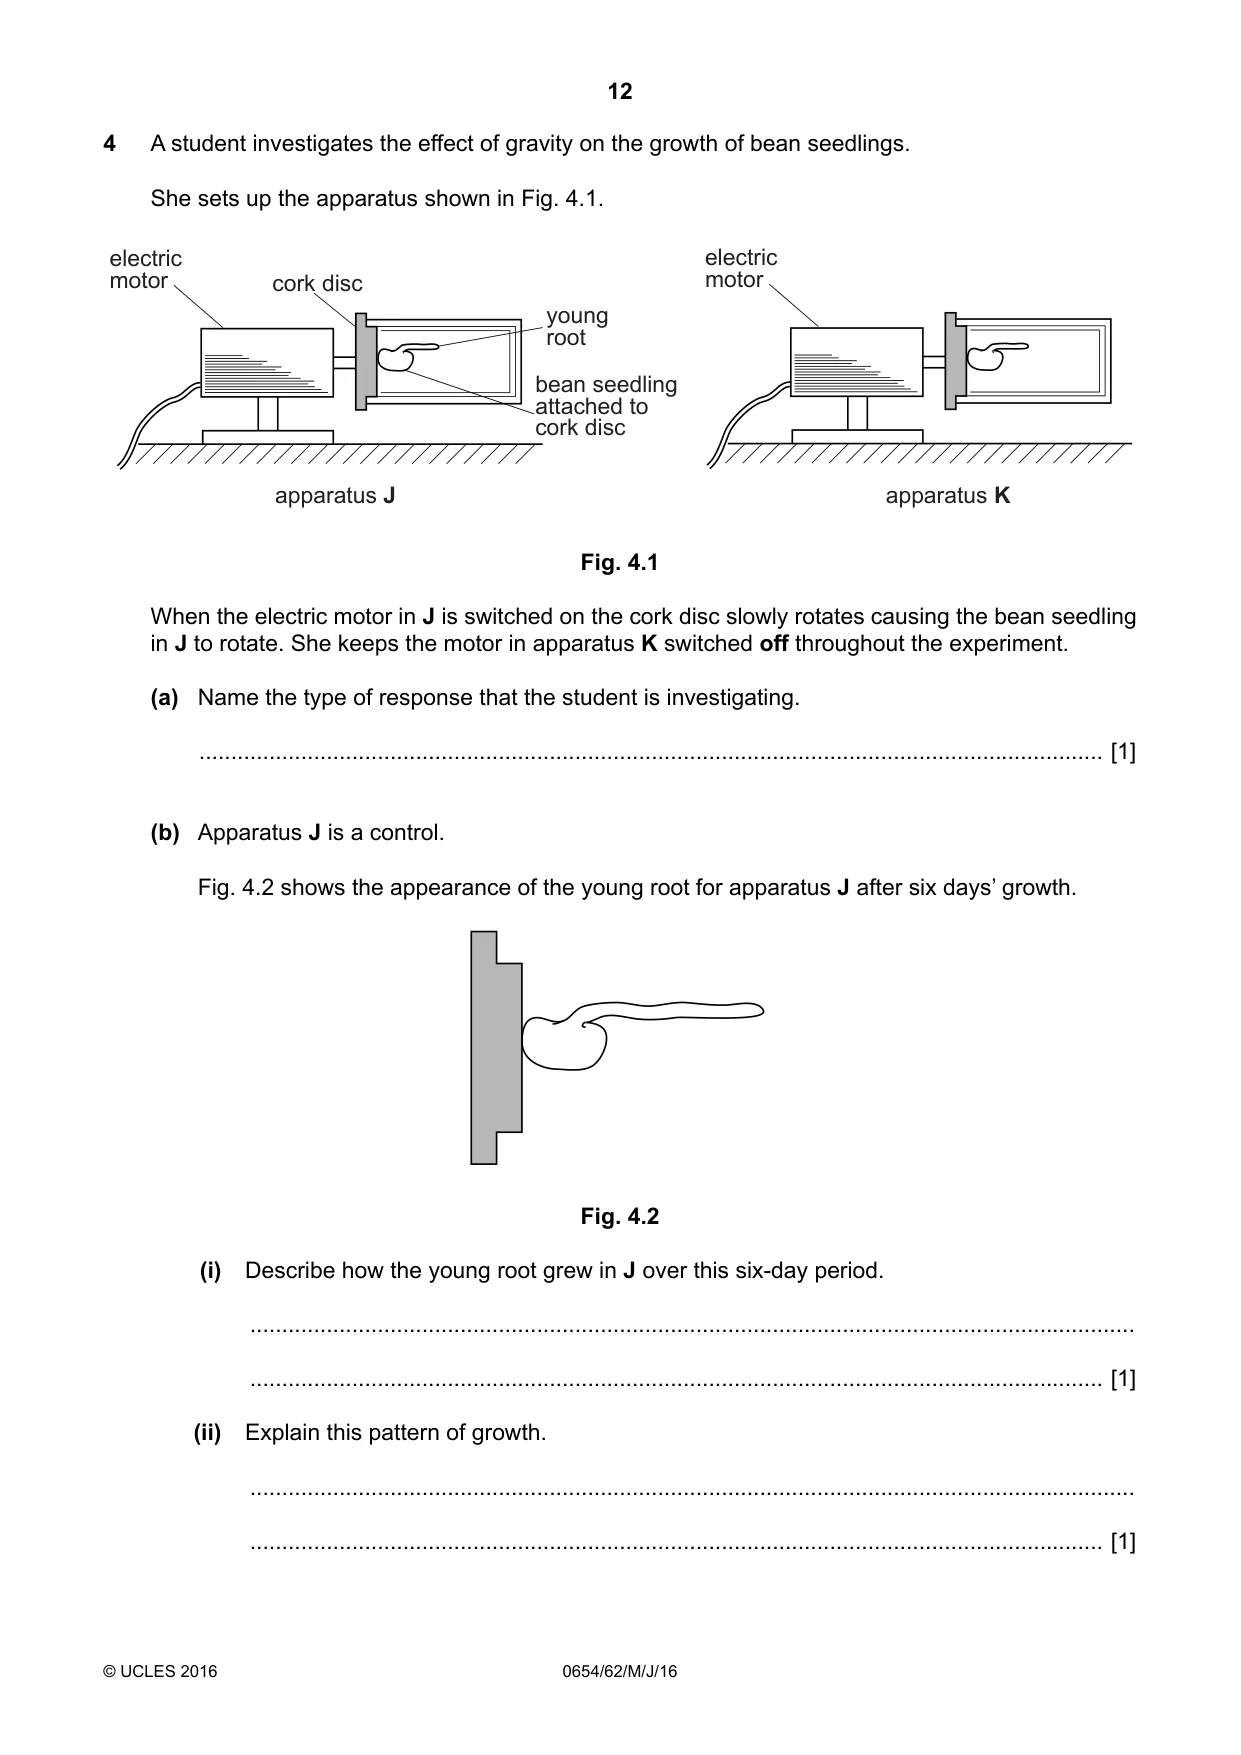
12 0654/62/M/J/16 © UCLES 2016 4 A student investigates the effect of gravity on the growth of bean seedlings. She sets up the apparatus shown in Fig. 4.1. electric motor cork disc young root bean seedling attached to cork disc electric motor apparatus J apparatus K Fig. 4.1 When the electric motor in J is switched on the cork disc slowly rotates causing the bean seedling in J to rotate. She keeps the motor in apparatus K switched off throughout the experiment. (a) Name the type of response that the student is investigating. … [1] (b) Apparatus J is a control. Fig. 4.2 shows the appearance of the young root for apparatus J after six days’ growth. Fig. 4.2 (i) Describe how the young root grew in J over this six-day period. … … [1] (ii) Explain this pattern of growth. … … [1]
Question paper, page 13
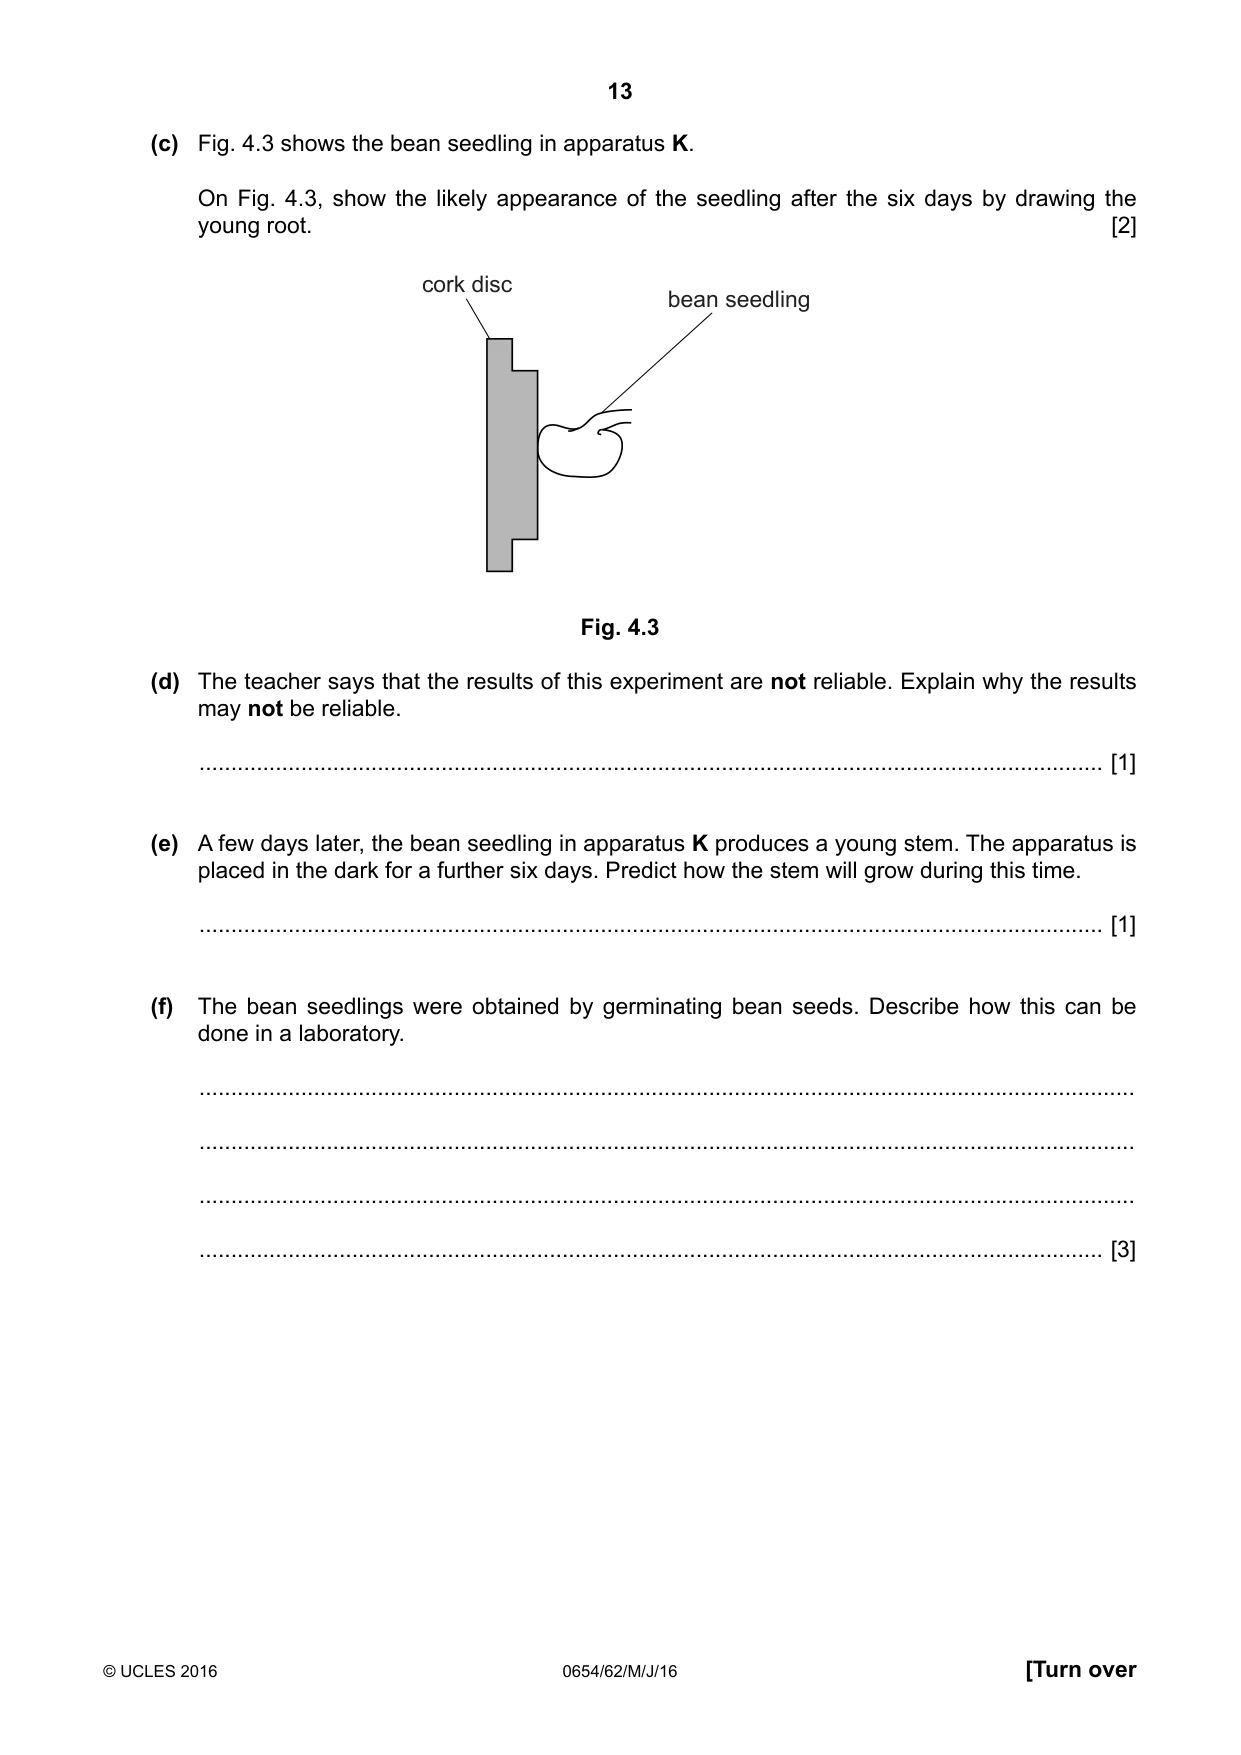
13 0654/62/M/J/16 © UCLES 2016 [Turn over (c) Fig. 4.3 shows the bean seedling in apparatus K. On Fig. 4.3, show the likely appearance of the seedling after the six days by drawing the young root. [2] cork disc bean seedling Fig. 4.3 (d) The teacher says that the results of this experiment are not reliable. Explain why the results may not be reliable. … [1] (e) A few days later, the bean seedling in apparatus K produces a young stem. The apparatus is placed in the dark for a further six days. Predict how the stem will grow during this time. … [1] (f) The bean seedlings were obtained by germinating bean seeds. Describe how this can be done in a laboratory. … … … … [3]
Question paper, page 14
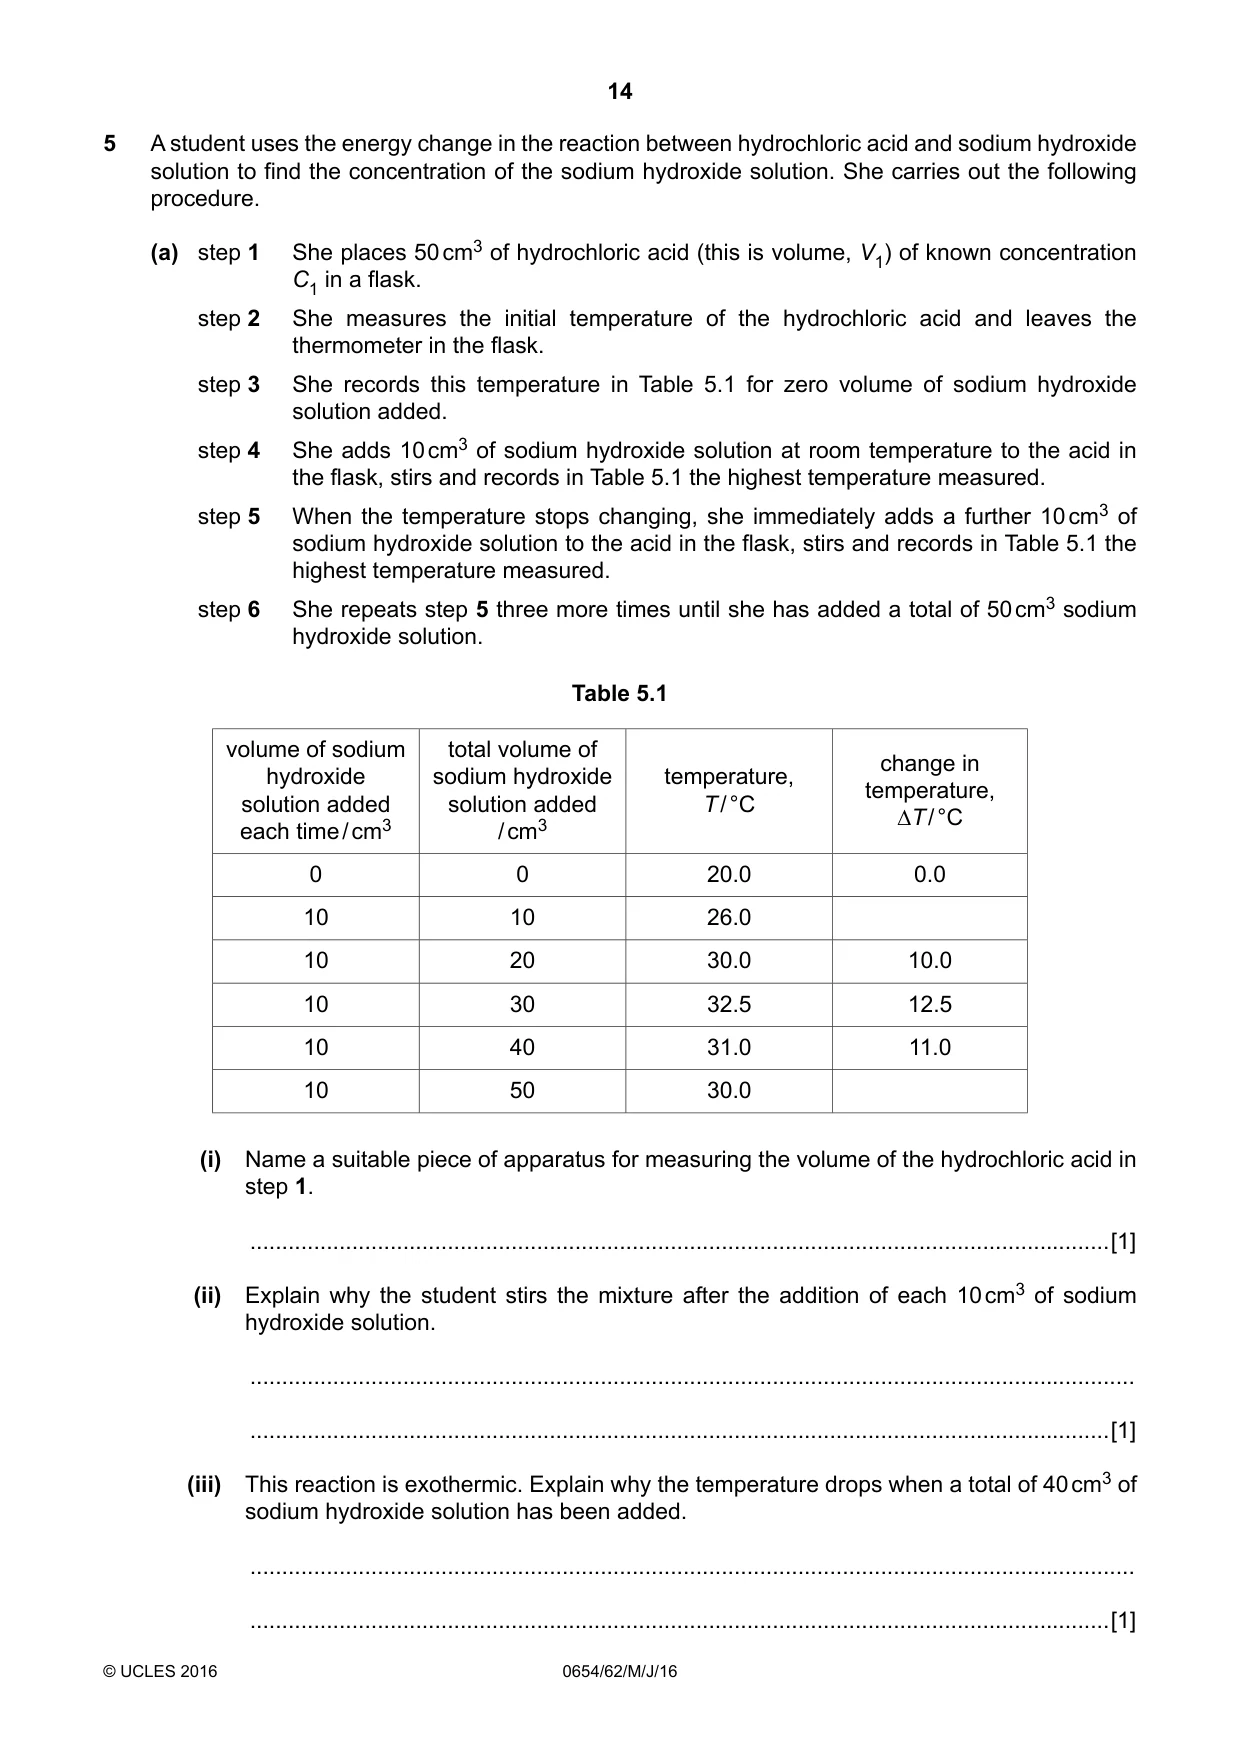
14 0654/62/M/J/16 © UCLES 2016 5 A student uses the energy change in the reaction between hydrochloric acid and sodium hydroxide solution to find the concentration of the sodium hydroxide solution. She carries out the following procedure. (a) step 1 She places 50 cm3 of hydrochloric acid (this is volume, V1) of known concentration C1 in a flask. step 2 She measures the initial temperature of the hydrochloric acid and leaves the thermometer in the flask. step 3 She records this temperature in Table 5.1 for zero volume of sodium hydroxide solution added. step 4 She adds 10 cm3 of sodium hydroxide solution at room temperature to the acid in the flask, stirs and records in Table 5.1 the highest temperature measured. step 5 When the temperature stops changing, she immediately adds a further 10 cm3 of sodium hydroxide solution to the acid in the flask, stirs and records in Table 5.1 the highest temperature measured. step 6 She repeats step 5 three more times until she has added a total of 50 cm3 sodium hydroxide solution. Table 5.1 volume of sodium hydroxide solution added each time / cm3 total volume of sodium hydroxide solution added / cm3 temperature, T / °C change in temperature, ∆T / °C 0 0 20.0 0.0 10 10 26.0 10 20 30.0 10.0 10 30 32.5 12.5 10 40 31.0 11.0 10 50 30.0 (i) Name a suitable piece of apparatus for measuring the volume of the hydrochloric acid in step 1. …[1] (ii) Explain why the student stirs the mixture after the addition of each 10 cm3 of sodium hydroxide solution. … …[1] (iii) This reaction is exothermic. Explain why the temperature drops when a total of 40 cm3 of sodium hydroxide solution has been added. … …[1]
Question paper, page 15
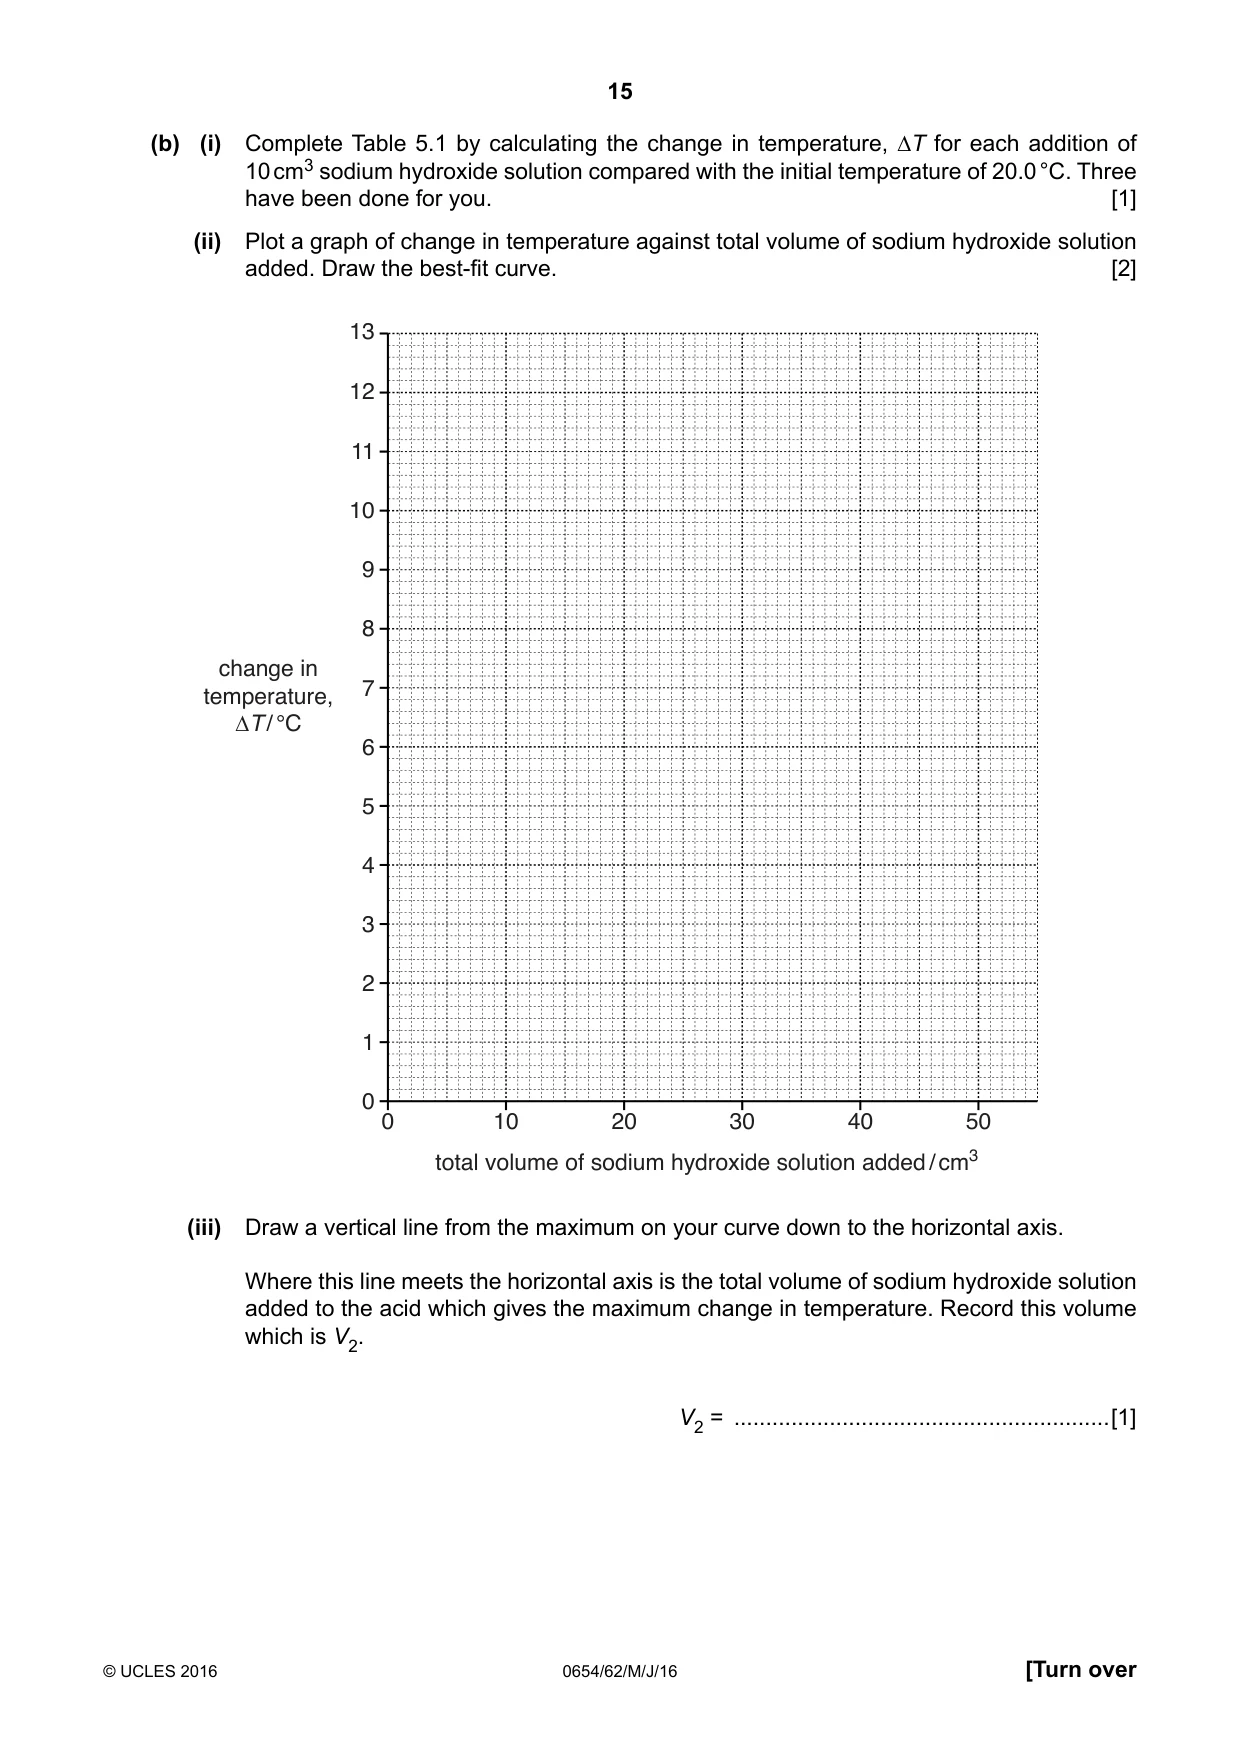
15 0654/62/M/J/16 © UCLES 2016 [Turn over (b) (i) Complete Table 5.1 by calculating the change in temperature, ∆T for each addition of 10 cm3 sodium hydroxide solution compared with the initial temperature of 20.0 °C. Three have been done for you. [1] (ii) Plot a graph of change in temperature against total volume of sodium hydroxide solution added. Draw the best-fit curve. [2] change in temperature, ¨T / °C 10 11 12 13 9 8 7 6 5 4 3 2 1 0 total volume of sodium hydroxide solution added / cm3 0 10 20 30 40 50 (iii) Draw a vertical line from the maximum on your curve down to the horizontal axis. Where this line meets the horizontal axis is the total volume of sodium hydroxide solution added to the acid which gives the maximum change in temperature. Record this volume which is V2. V2 = …[1]
Question paper, page 16
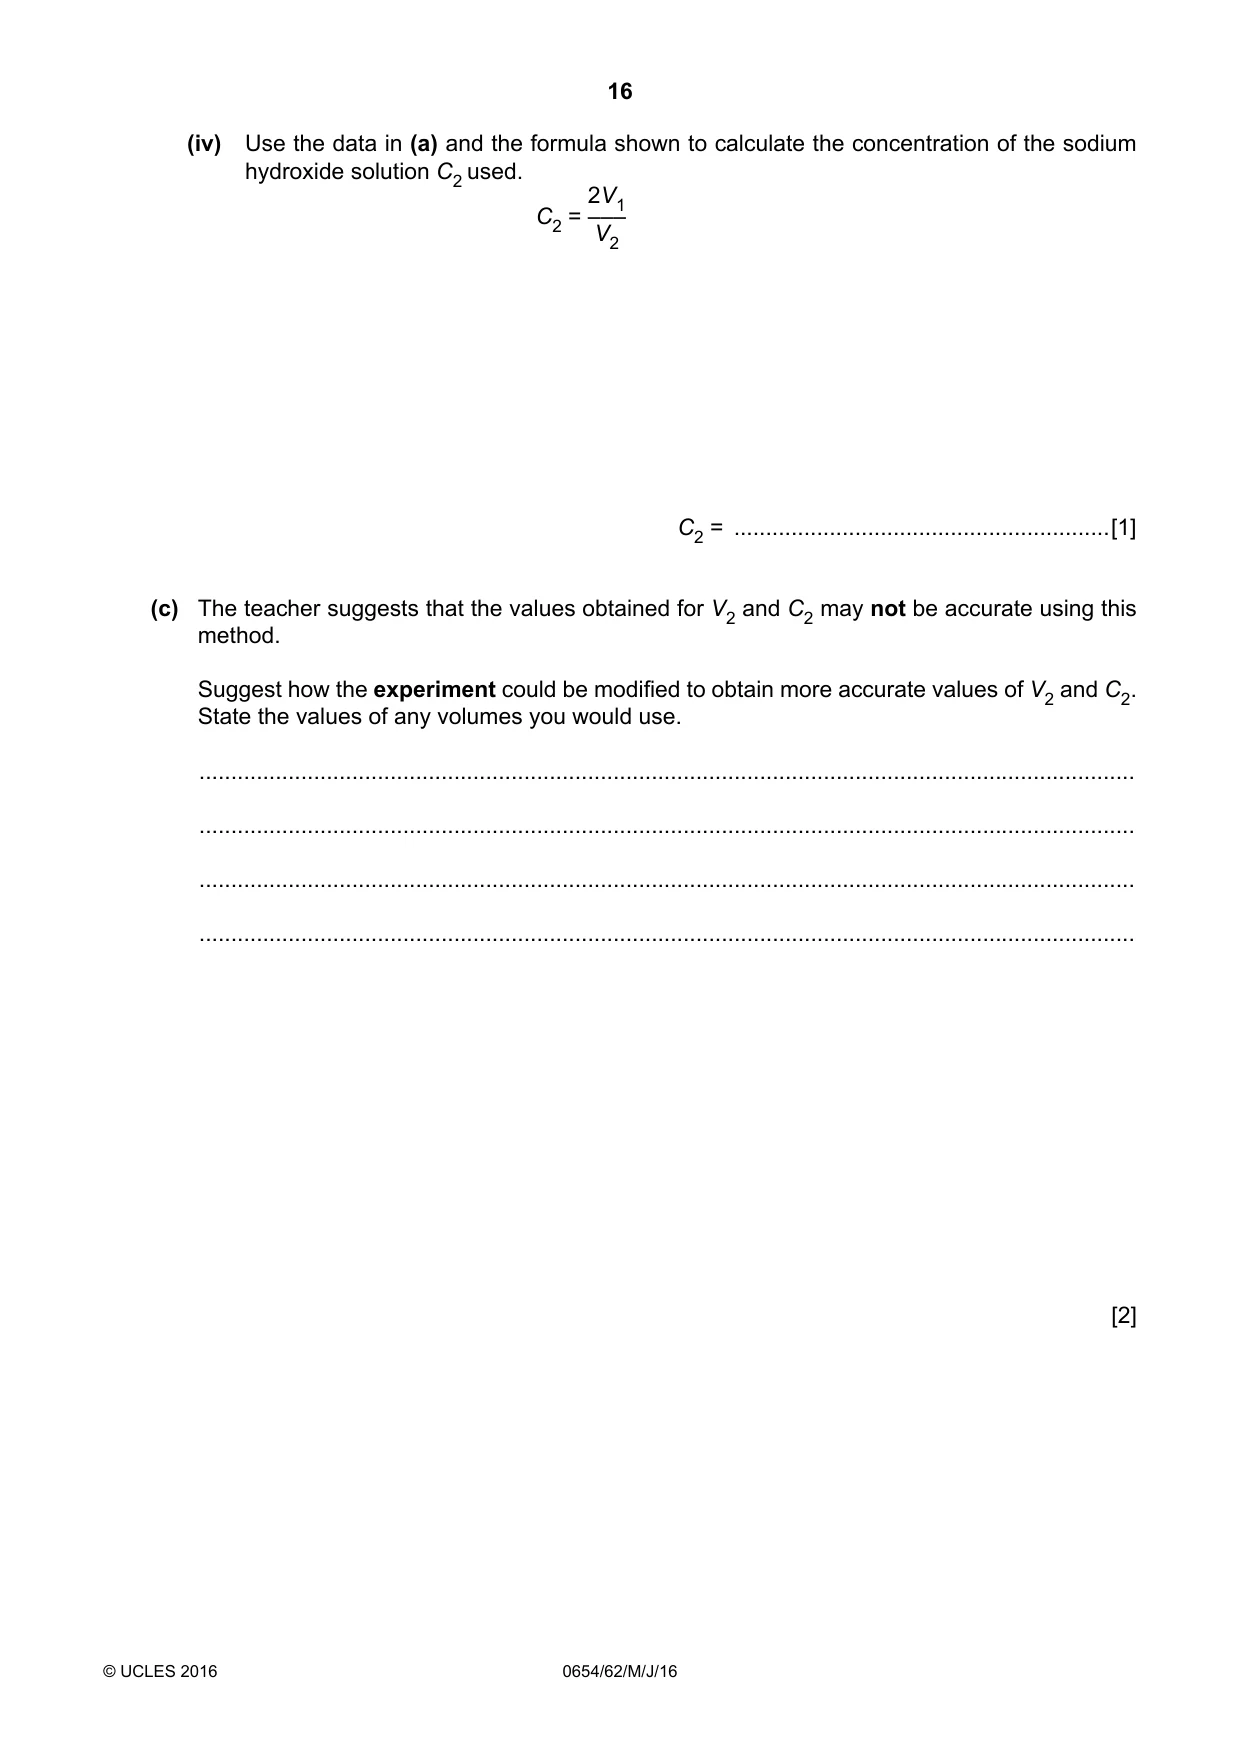
16 0654/62/M/J/16 © UCLES 2016 (iv) Use the data in (a) and the formula shown to calculate the concentration of the sodium hydroxide solution C2 used. C2 = 2V1 ––– V2 C2 = …[1] (c) The teacher suggests that the values obtained for V2 and C2 may not be accurate using this method. Suggest how the experiment could be modified to obtain more accurate values of V2 and C2. State the values of any volumes you would use. … … … … [2]
Question paper, page 17
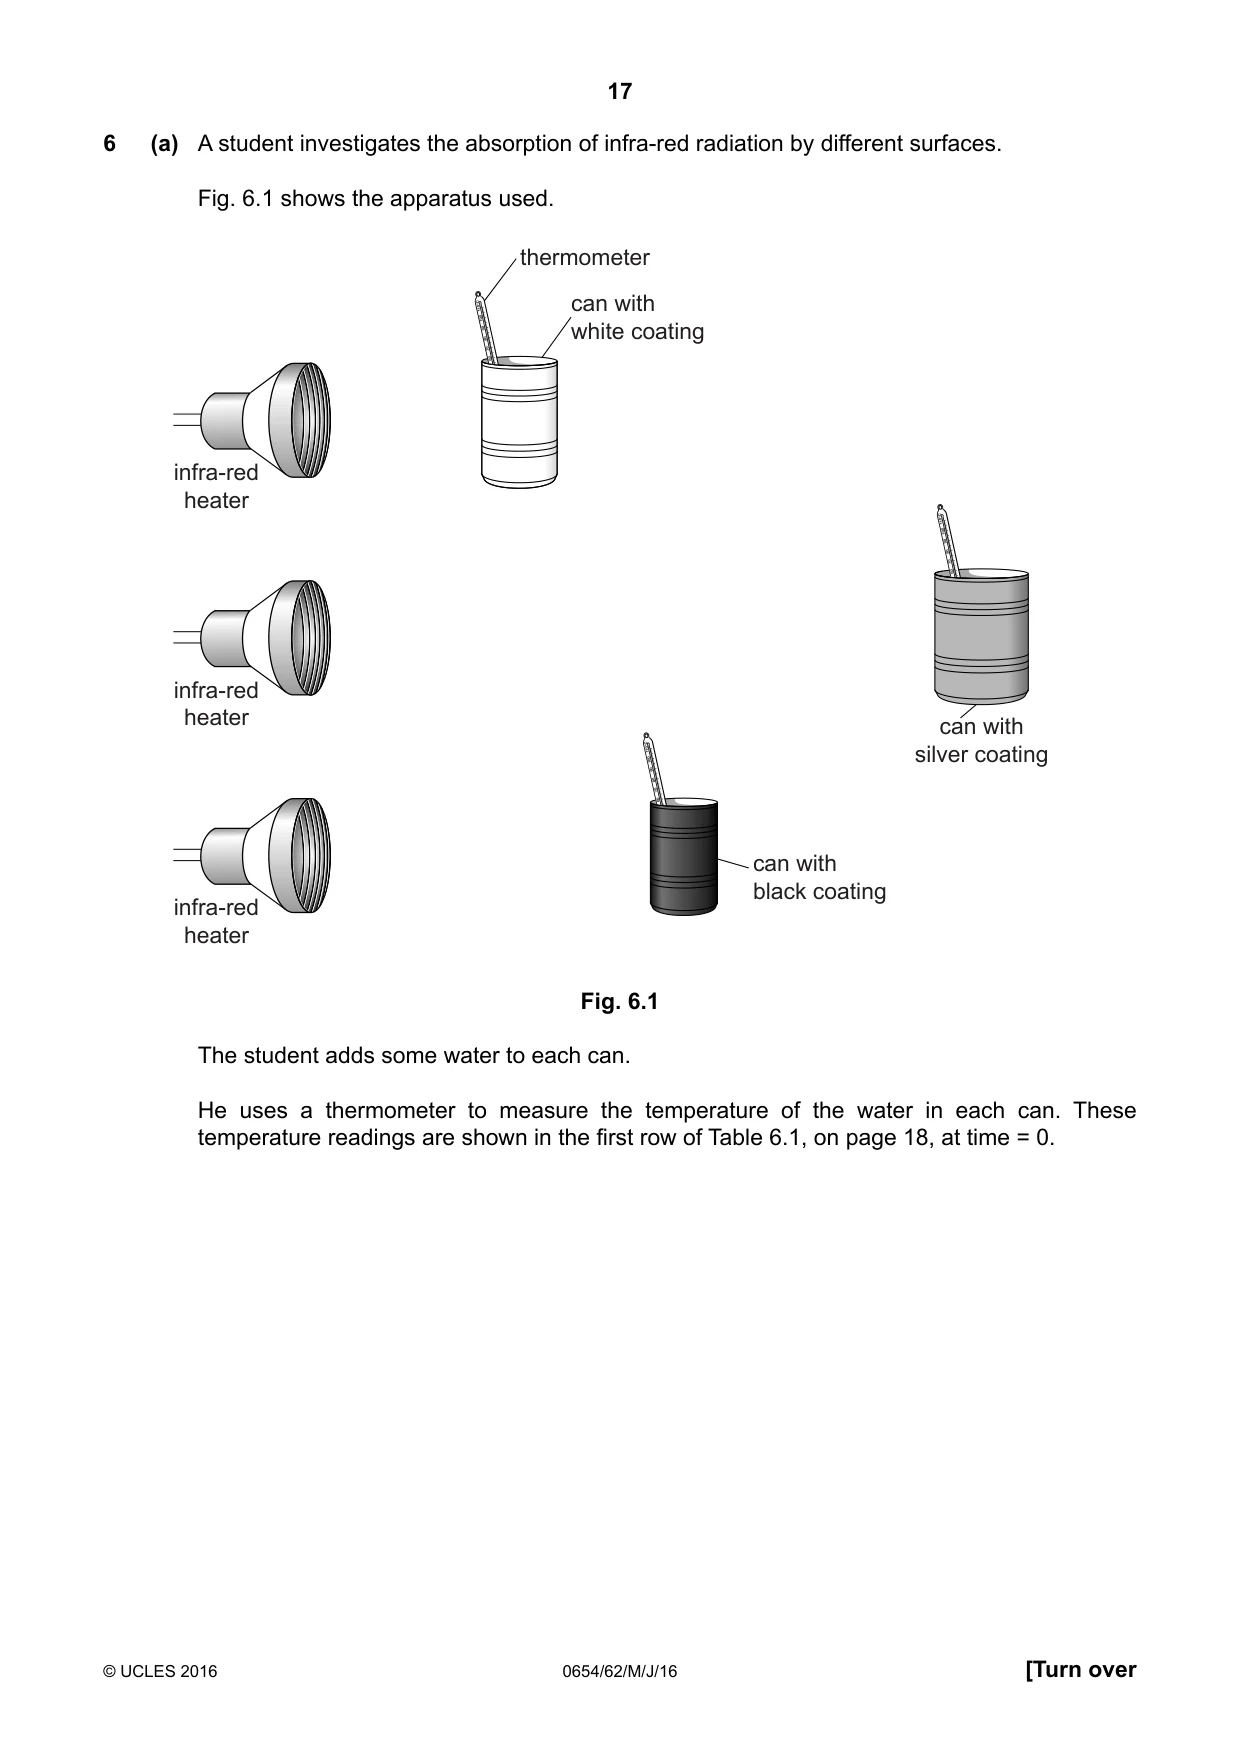
17 0654/62/M/J/16 © UCLES 2016 [Turn over 6 (a) A student investigates the absorption of infra-red radiation by different surfaces. Fig. 6.1 shows the apparatus used. 60 70 80 90 100 110°C 60 70 80 90 100 110°C 60 70 80 90 100 110°C infra-red heater infra-red heater infra-red heater thermometer can with white coating can with silver coating can with black coating Fig. 6.1 The student adds some water to each can. He uses a thermometer to measure the temperature of the water in each can. These temperature readings are shown in the first row of Table 6.1, on page 18, at time = 0.
Question paper, page 18
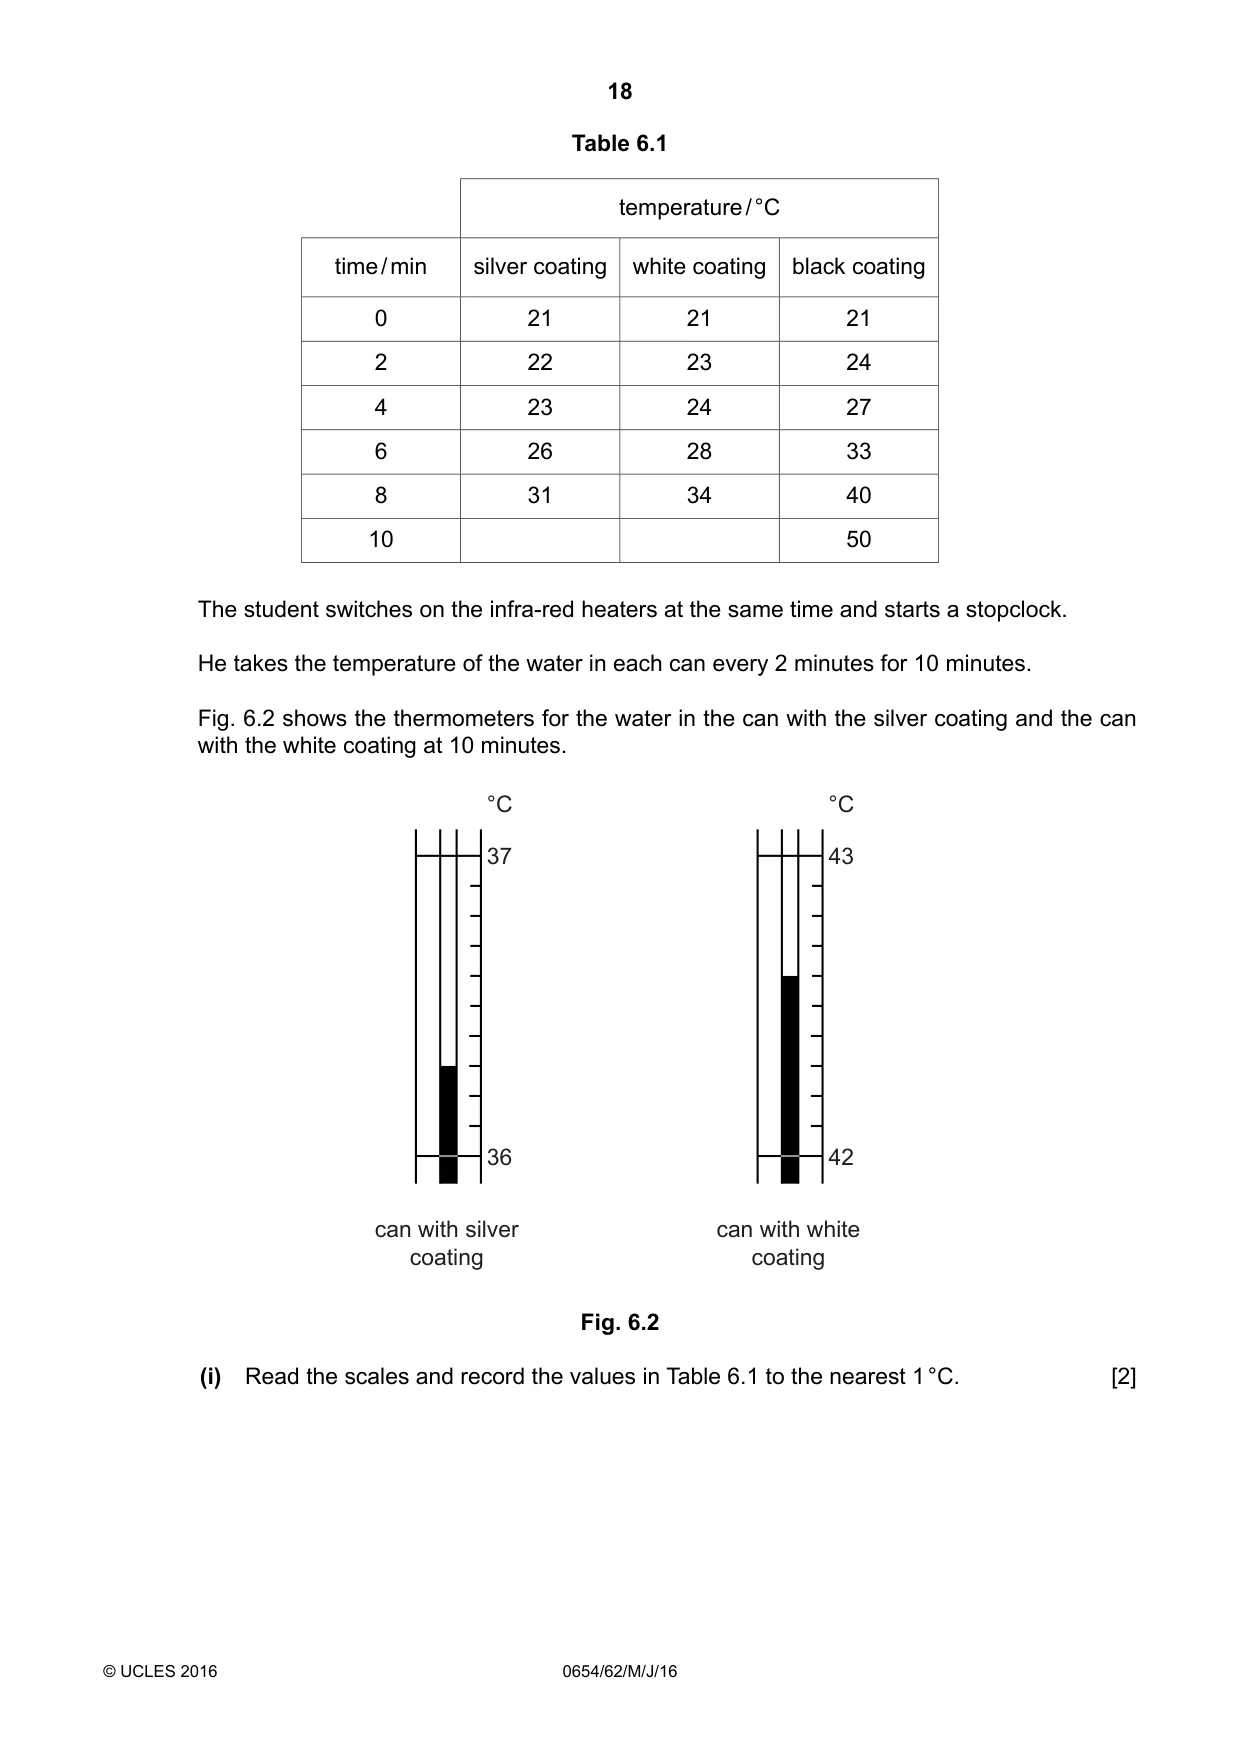
18 0654/62/M/J/16 © UCLES 2016 Table 6.1 temperature / °C time / min silver coating white coating black coating 0 21 21 21 2 22 23 24 4 23 24 27 6 26 28 33 8 31 34 40 10 50 The student switches on the infra-red heaters at the same time and starts a stopclock. He takes the temperature of the water in each can every 2 minutes for 10 minutes. Fig. 6.2 shows the thermometers for the water in the can with the silver coating and the can with the white coating at 10 minutes. 37 36 °C can with silver coating 43 42 °C can with white coating Fig. 6.2 (i) Read the scales and record the values in Table 6.1 to the nearest 1 °C. [2]
Question paper, page 19
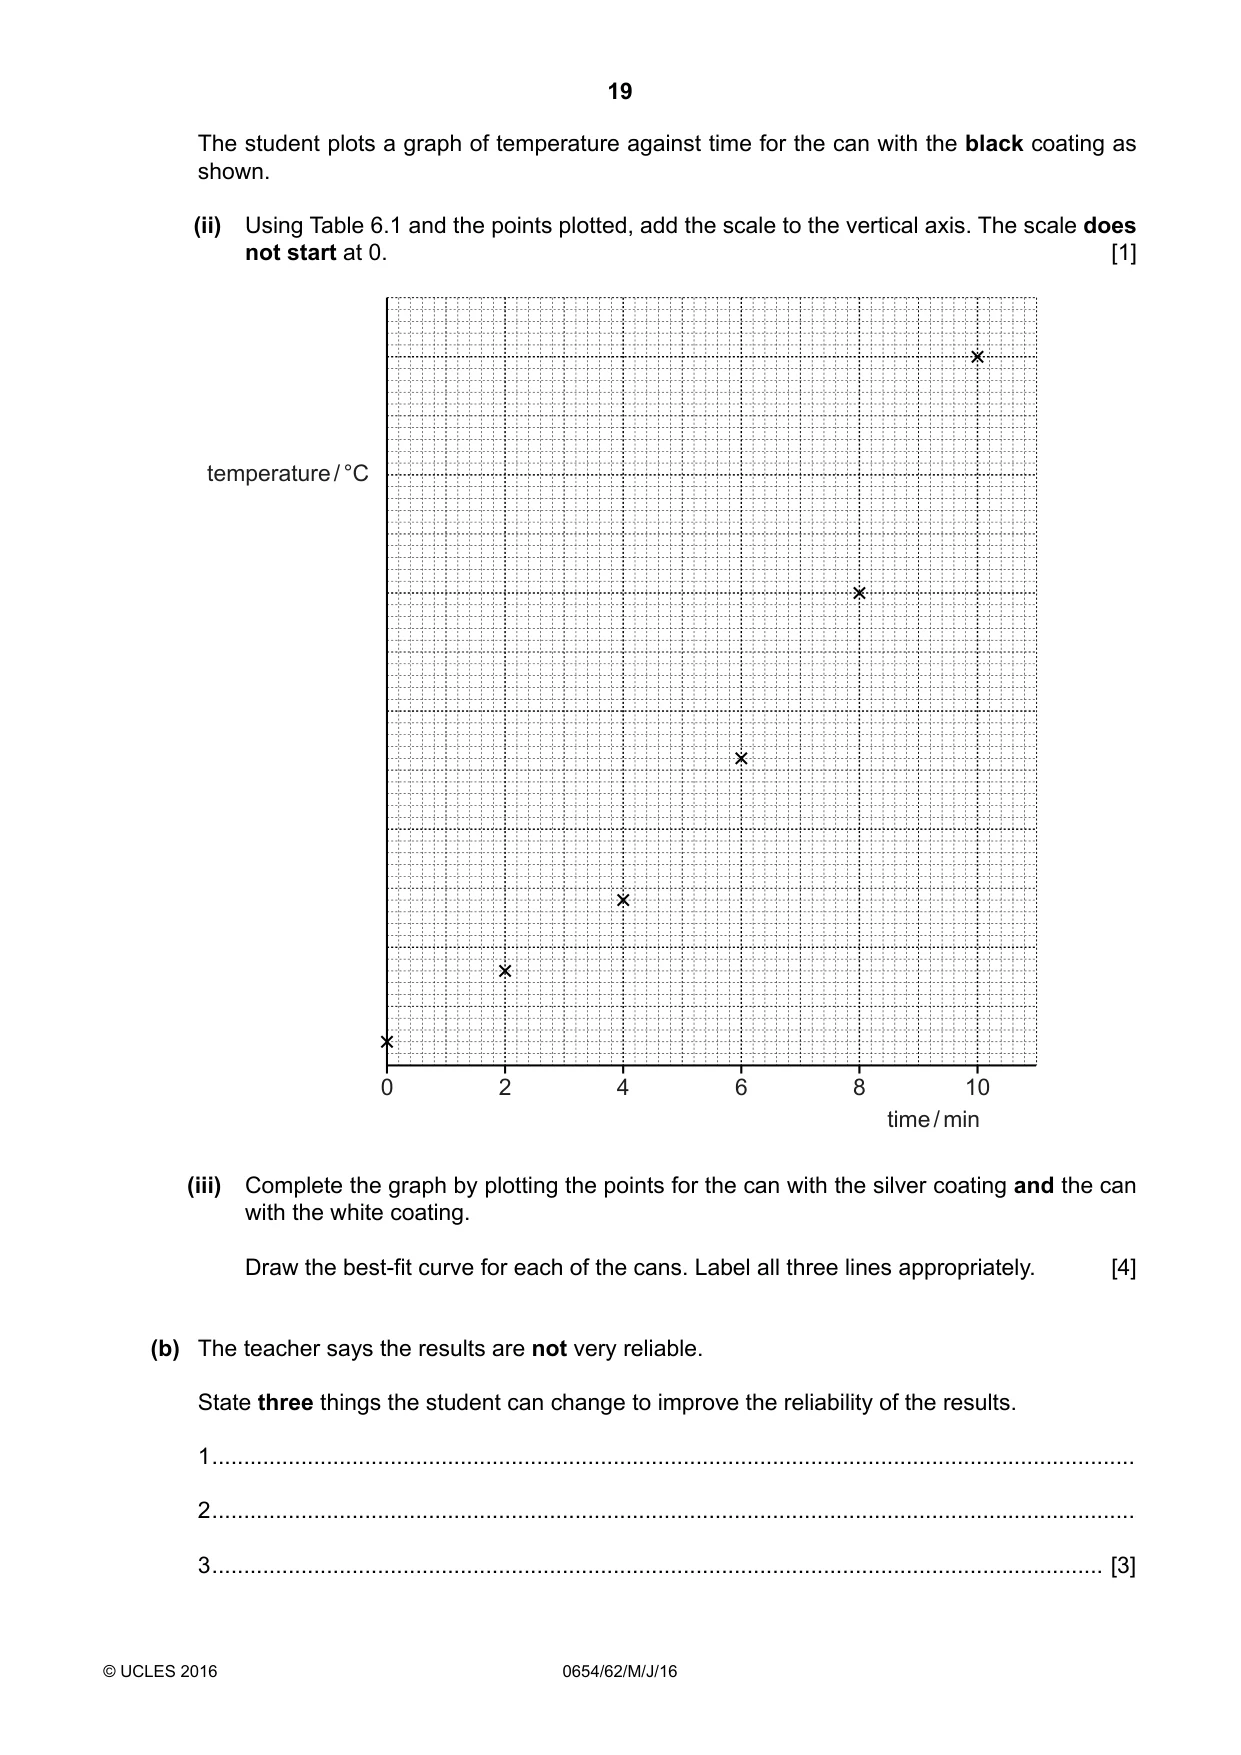
19 0654/62/M/J/16 © UCLES 2016 The student plots a graph of temperature against time for the can with the black coating as shown. (ii) Using Table 6.1 and the points plotted, add the scale to the vertical axis. The scale does not start at 0. [1] 0 2 4 6 8 10 time / min temperature / °C (iii) Complete the graph by plotting the points for the can with the silver coating and the can with the white coating. Draw the best-fit curve for each of the cans. Label all three lines appropriately. [4] (b) The teacher says the results are not very reliable. State three things the student can change to improve the reliability of the results. 1 … 2 … 3 … [3]
Question paper, page 20
20 0654/62/M/J/16 © UCLES 2016 Permission to reproduce items where third-party owned material protected by copyright is included has been sought and cleared where possible. Every reasonable effort has been made by the publisher (UCLES) to trace copyright holders, but if any items requiring clearance have unwittingly been included, the publisher will be pleased to make amends at the earliest possible opportunity. To avoid the issue of disclosure of answer-related information to candidates, all copyright acknowledgements are reproduced online in the Cambridge International Examinations Copyright Acknowledgements Booklet. This is produced for each series of examinations and is freely available to download at www.cie.org.uk after the live examination series. Cambridge International Examinations is part of the Cambridge Assessment Group. Cambridge Assessment is the brand name of University of Cambridge Local Examinations Syndicate (UCLES), which is itself a department of the University of Cambridge. BLANK PAGE
Mark scheme, page 1
® IGCSE is the registered trademark of Cambridge International Examinations. This document consists of 4 printed pages. © UCLES 2016 [Turn over Cambridge International Examinations Cambridge International General Certificate of Secondary Education CO-ORDINATED SCIENCES 0654/62 Paper 6 Alternative to Practical May/June 2016 MARK SCHEME Maximum Mark: 60 Published This mark scheme is published as an aid to teachers and candidates, to indicate the requirements of the examination. It shows the basis on which Examiners were instructed to award marks. It does not indicate the details of the discussions that took place at an Examiners’ meeting before marking began, which would have considered the acceptability of alternative answers. Mark schemes should be read in conjunction with the question paper and the Principal Examiner Report for Teachers. Cambridge will not enter into discussions about these mark schemes. Cambridge is publishing the mark schemes for the May/June 2016 series for most Cambridge IGCSE®, Cambridge International A and AS Level components and some Cambridge O Level components.
Mark scheme, page 2
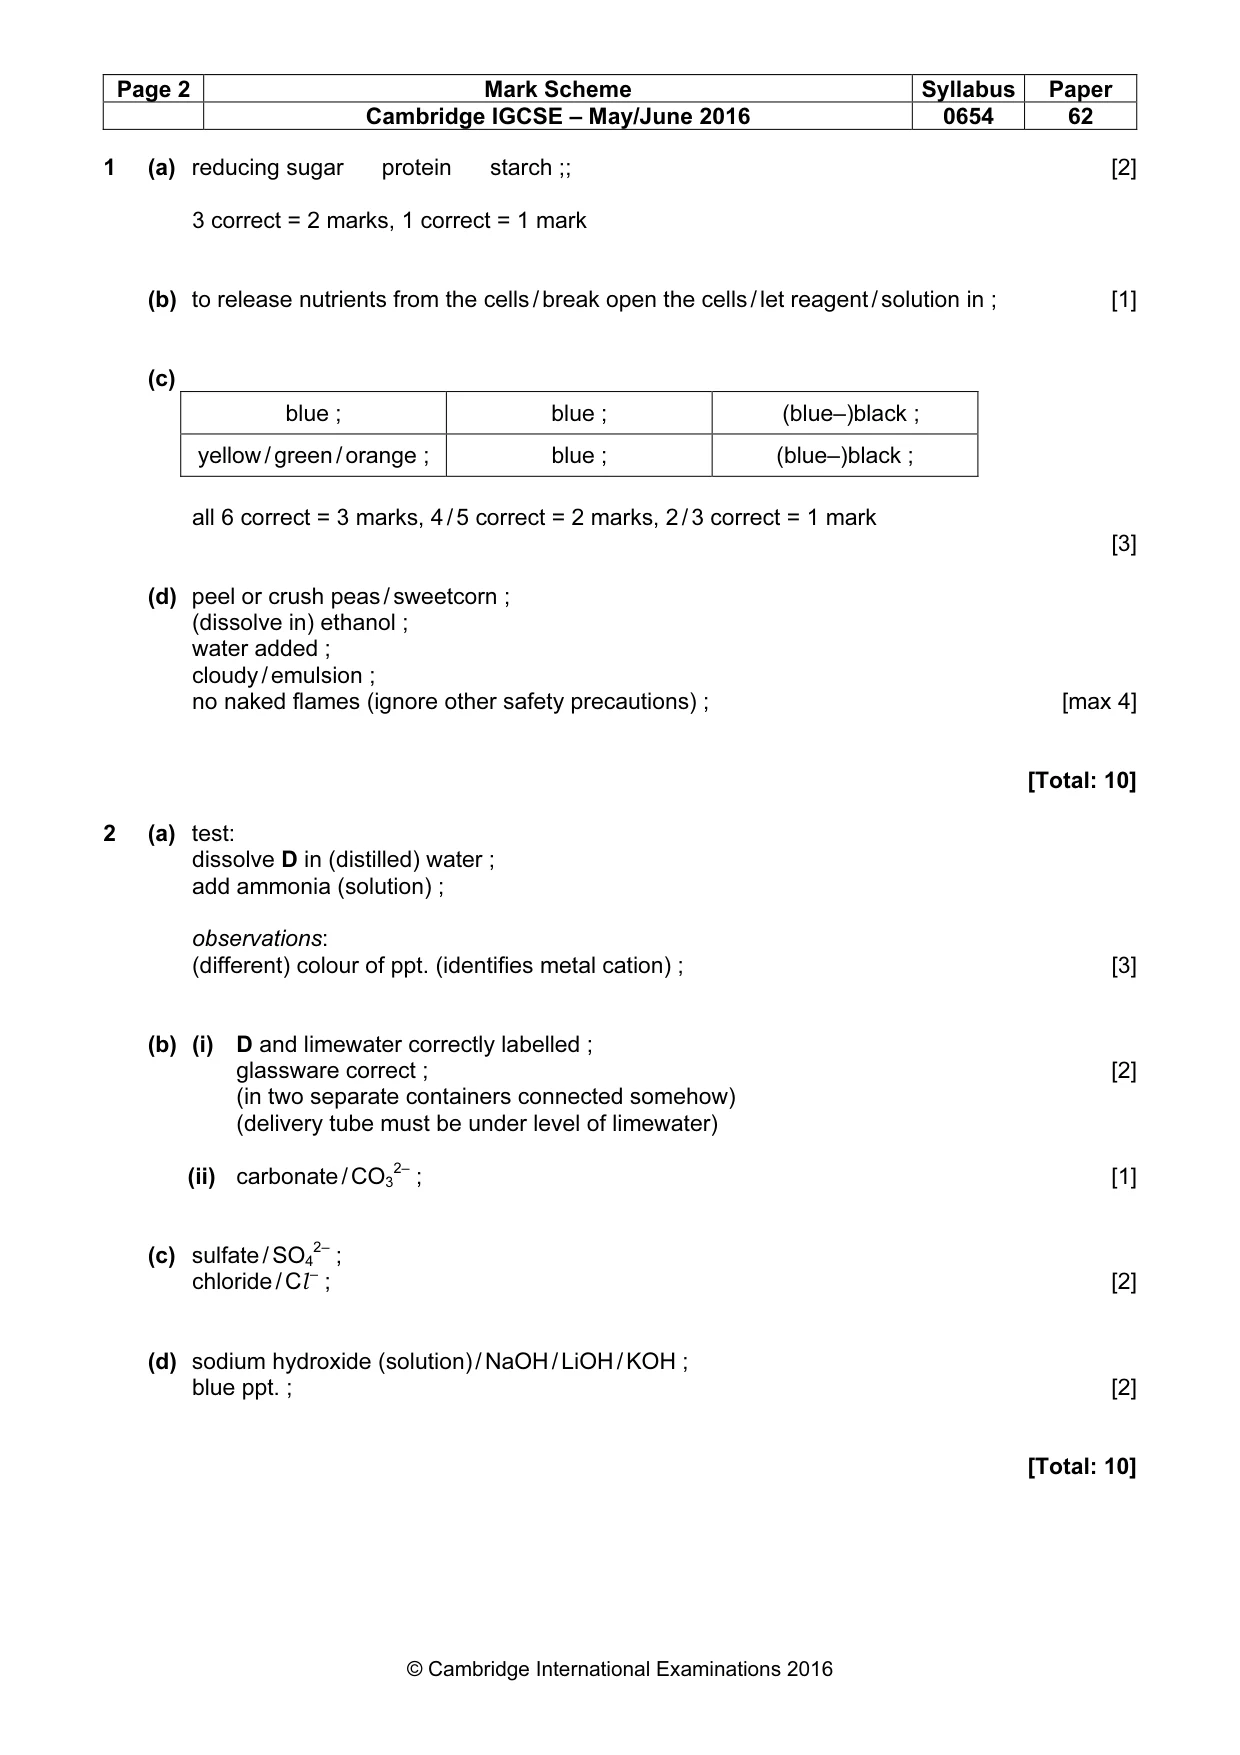
Page 2 Mark Scheme Syllabus Paper Cambridge IGCSE – May/June 2016 0654 62 © Cambridge International Examinations 2016 1 (a) reducing sugar protein starch ;; [2] 3 correct = 2 marks, 1 correct = 1 mark (b) to release nutrients from the cells / break open the cells / let reagent / solution in ; [1] (c) blue ; blue ; (blue–)black ; yellow / green / orange ; blue ; (blue–)black ; all 6 correct = 3 marks, 4 / 5 correct = 2 marks, 2 / 3 correct = 1 mark [3] (d) peel or crush peas / sweetcorn ; (dissolve in) ethanol ; water added ; cloudy / emulsion ; no naked flames (ignore other safety precautions) ; [max 4] [Total: 10] 2 (a) test: dissolve D in (distilled) water ; add ammonia (solution) ; observations: (different) colour of ppt. (identifies metal cation) ; [3] (b) (i) D and limewater correctly labelled ; glassware correct ; [2] (in two separate containers connected somehow) (delivery tube must be under level of limewater) (ii) carbonate / CO3 2– ; [1] (c) sulfate / SO4 2– ; chloride / Cl – ; [2] (d) sodium hydroxide (solution) / NaOH / LiOH / KOH ; blue ppt. ; [2] [Total: 10]
Mark scheme, page 3
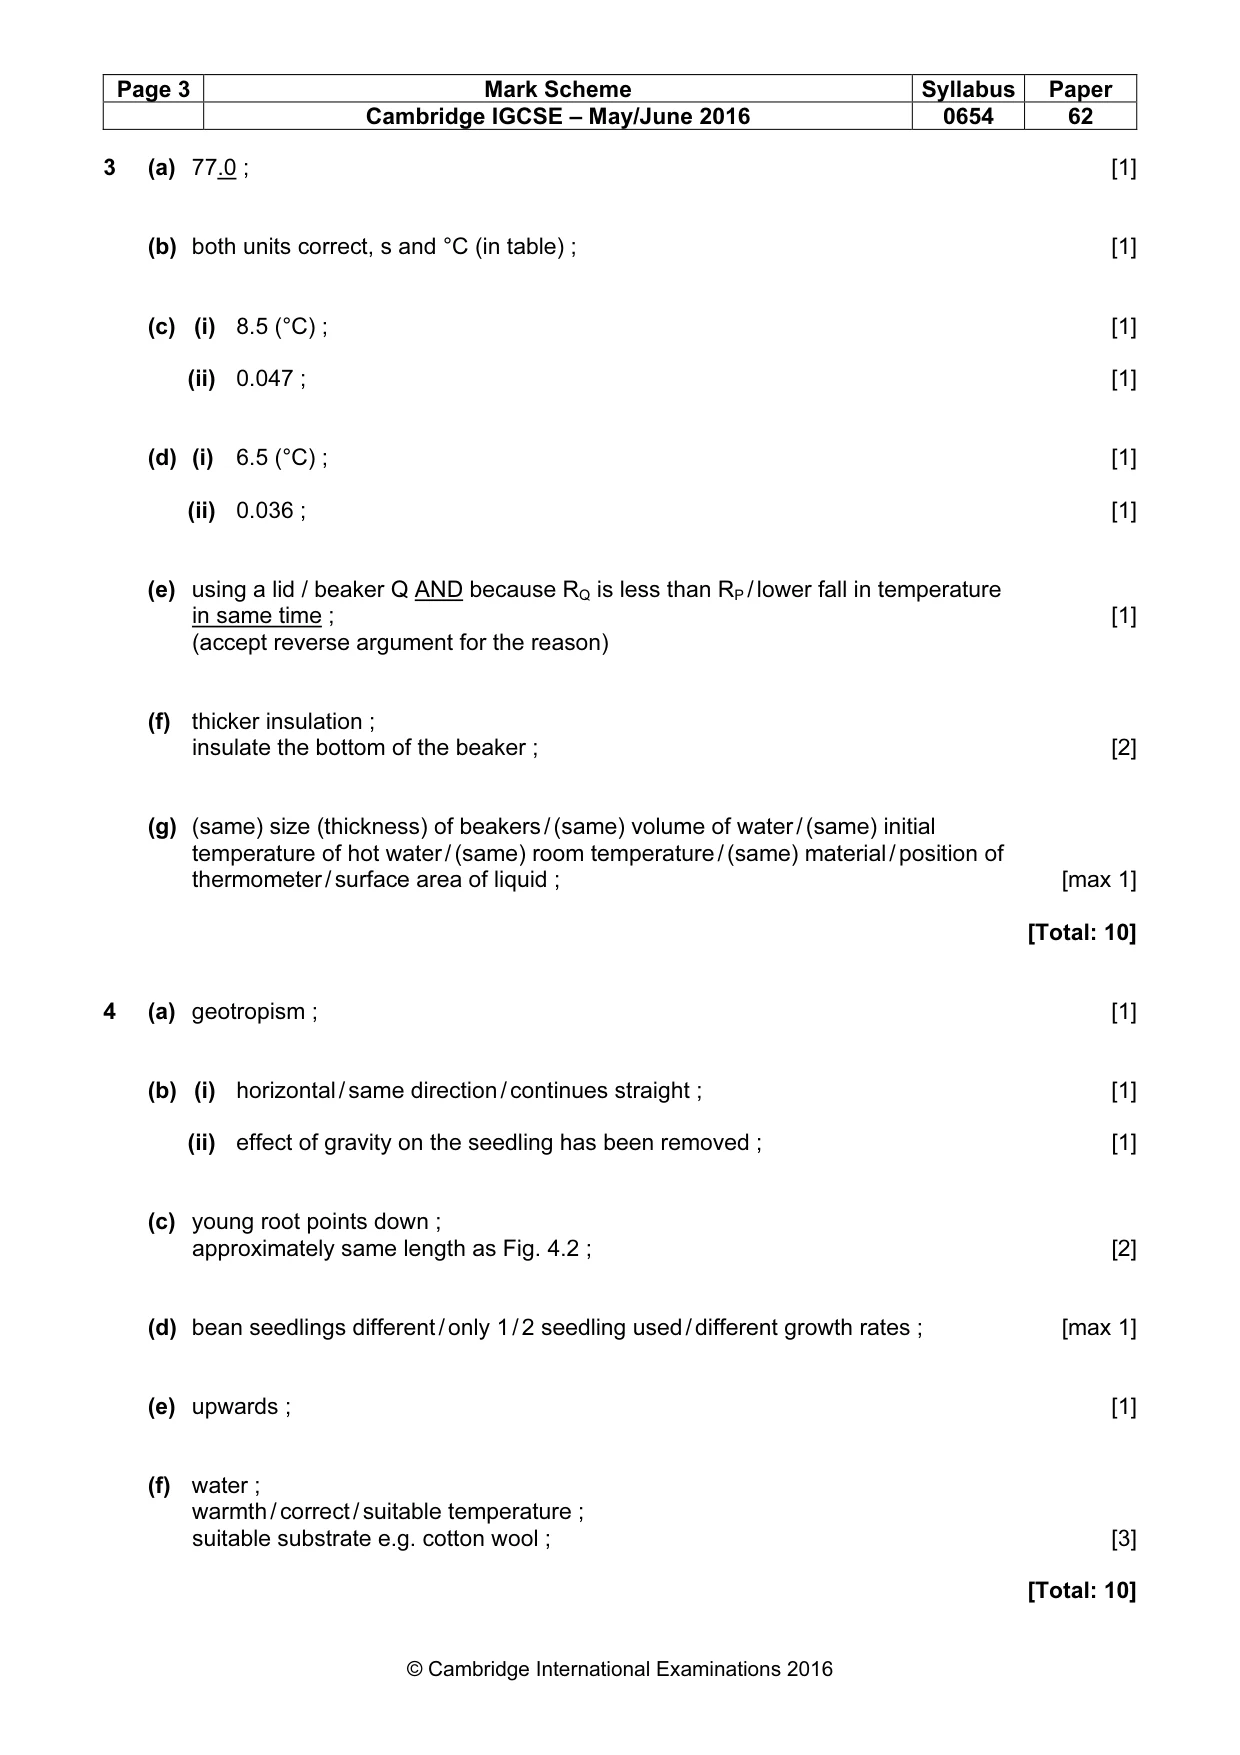
Page 3 Mark Scheme Syllabus Paper Cambridge IGCSE – May/June 2016 0654 62 © Cambridge International Examinations 2016 3 (a) 77.0 ; [1] (b) both units correct, s and °C (in table) ; [1] (c) (i) 8.5 (°C) ; [1] (ii) 0.047 ; [1] (d) (i) 6.5 (°C) ; [1] (ii) 0.036 ; [1] (e) using a lid / beaker Q AND because RQ is less than RP / lower fall in temperature in same time ; [1] (accept reverse argument for the reason) (f) thicker insulation ; insulate the bottom of the beaker ; [2] (g) (same) size (thickness) of beakers / (same) volume of water / (same) initial temperature of hot water / (same) room temperature / (same) material / position of thermometer / surface area of liquid ; [max 1] [Total: 10] 4 (a) geotropism ; [1] (b) (i) horizontal / same direction / continues straight ; [1] (ii) effect of gravity on the seedling has been removed ; [1] (c) young root points down ; approximately same length as Fig. 4.2 ; [2] (d) bean seedlings different / only 1 / 2 seedling used / different growth rates ; [max 1] (e) upwards ; [1] (f) water ; warmth / correct / suitable temperature ; suitable substrate e.g. cotton wool ; [3] [Total: 10]
Mark scheme, page 4
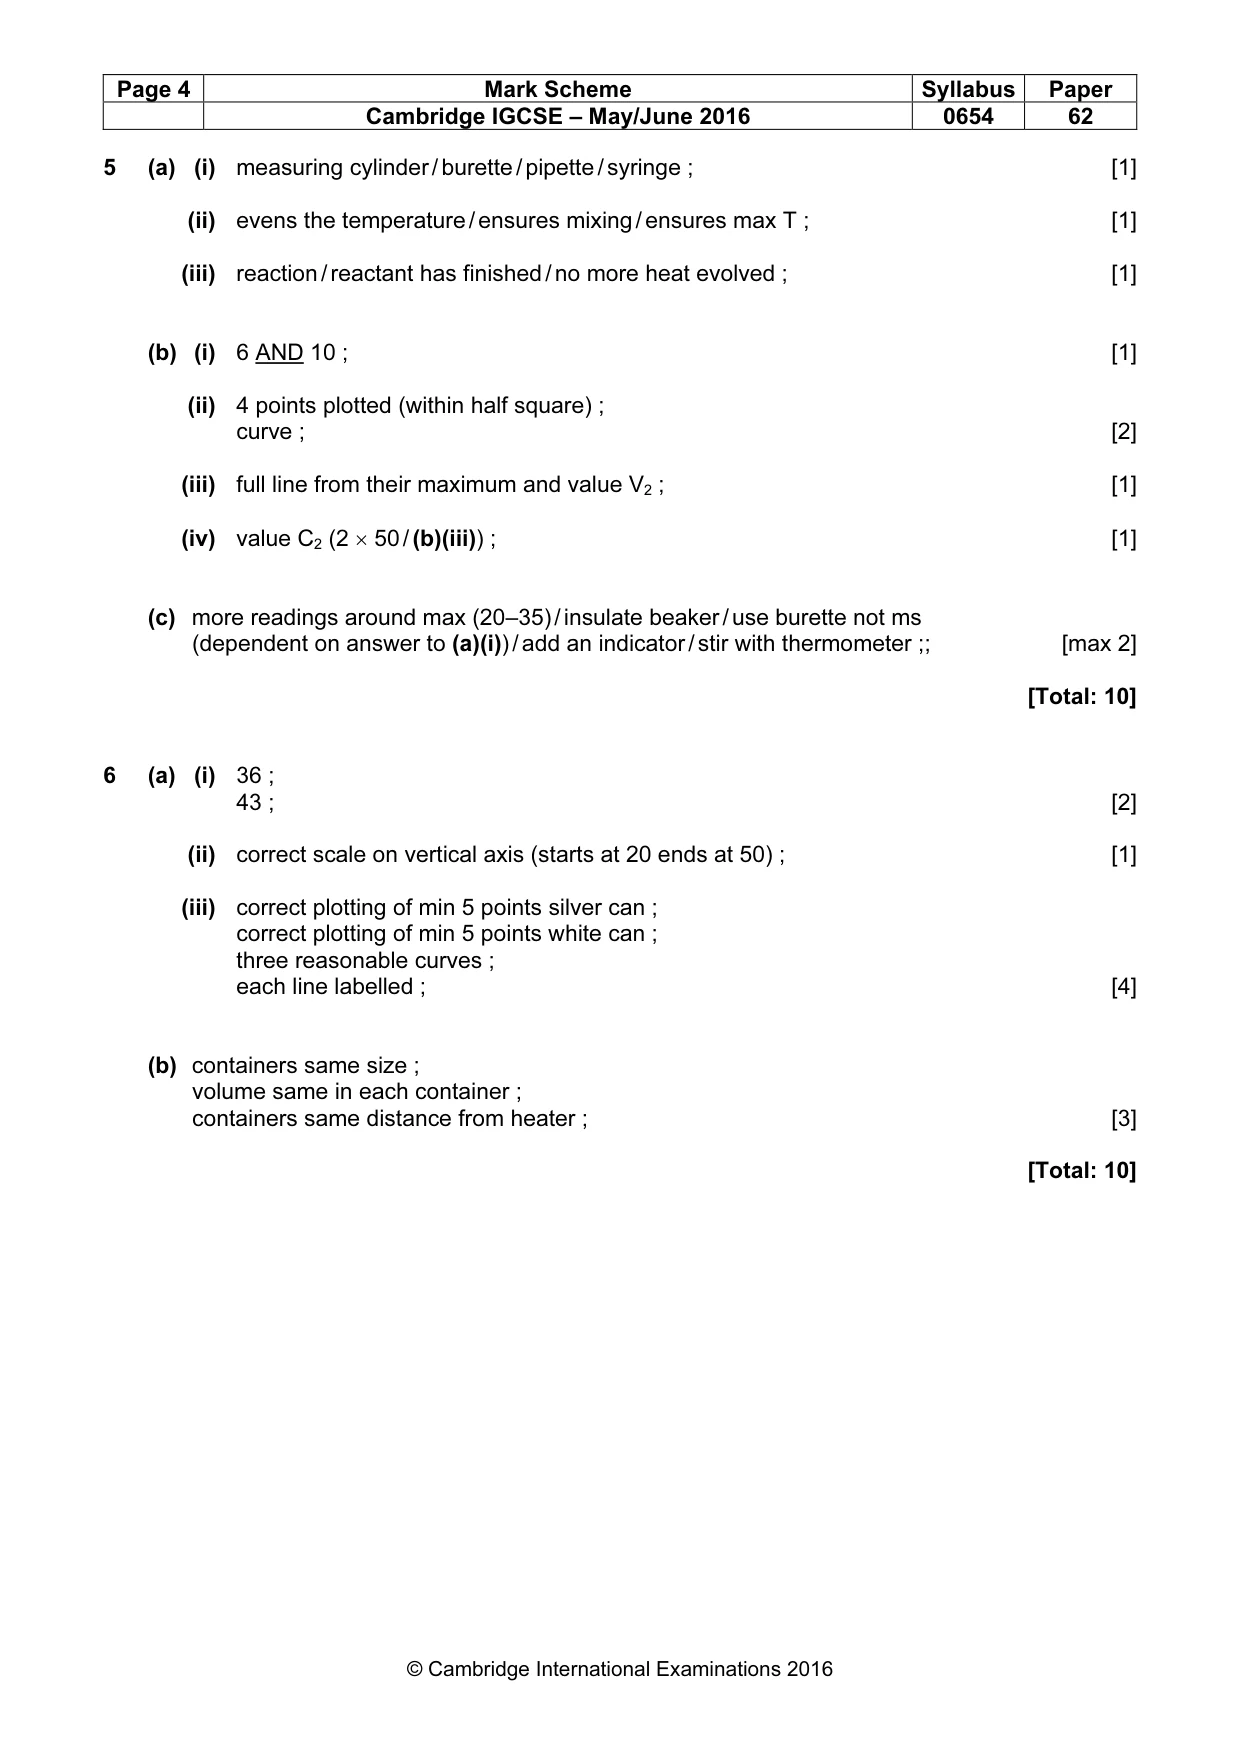
Page 4 Mark Scheme Syllabus Paper Cambridge IGCSE – May/June 2016 0654 62 © Cambridge International Examinations 2016 5 (a) (i) measuring cylinder / burette / pipette / syringe ; [1] (ii) evens the temperature / ensures mixing / ensures max T ; [1] (iii) reaction / reactant has finished / no more heat evolved ; [1] (b) (i) 6 AND 10 ; [1] (ii) 4 points plotted (within half square) ; curve ; [2] (iii) full line from their maximum and value V2 ; [1] (iv) value C2 (2 × 50 / (b)(iii)) ; [1] (c) more readings around max (20–35) / insulate beaker / use burette not ms (dependent on answer to (a)(i)) / add an indicator / stir with thermometer ;; [max 2] [Total: 10] 6 (a) (i) 36 ; 43 ; [2] (ii) correct scale on vertical axis (starts at 20 ends at 50) ; [1] (iii) correct plotting of min 5 points silver can ; correct plotting of min 5 points white can ; three reasonable curves ; each line labelled ; [4] (b) containers same size ; volume same in each container ; containers same distance from heater ; [3] [Total: 10]
What you needed in this session
Cambridge’s own grade thresholds for 2016 May/June, Paper 6 · Variant 2. A higher threshold means an easier paper — the bar moves with how the cohort did.