Cambridge IGCSE Sciences - Co-ordinated (Double) 0654 — 2016 May/June Paper 6 · Variant 3
0654/63/M/J/16 · 60 marks · ≈68 min
The question paper and its mark scheme, free to read here and free to download. This is Cambridge’s own paper, exactly as it was sat.
Question paper20 pages


Mark scheme4 pages
Answers below. Sit the paper first if you are practising.
Paper as text
Question paper, page 1
This document consists of 19 printed pages and 1 blank page. DC (LK/SG) 114223/5 © UCLES 2016 [Turn over Cambridge International Examinations Cambridge International General Certificate of Secondary Education * 6 7 0 2 5 0 9 7 1 5 * CO-ORDINATED SCIENCES 0654/63 Paper 6 Alternative to Practical May/June 2016 1 hour Candidates answer on the Question Paper. No Additional Materials are required. READ THESE INSTRUCTIONS FIRST Write your Centre number, candidate number and name on all the work you hand in. Write in dark blue or black pen. You may use an HB pencil for any diagrams or graphs. Do not use staples, paper clips, glue or correction fluid. DO NOT WRITE IN ANY BARCODES. Answer all questions. Electronic calculators may be used. You may lose marks if you do not show your working or if you do not use appropriate units. At the end of the examination, fasten all your work securely together. The number of marks is given in brackets [ ] at the end of each question or part question.
Question paper, page 2
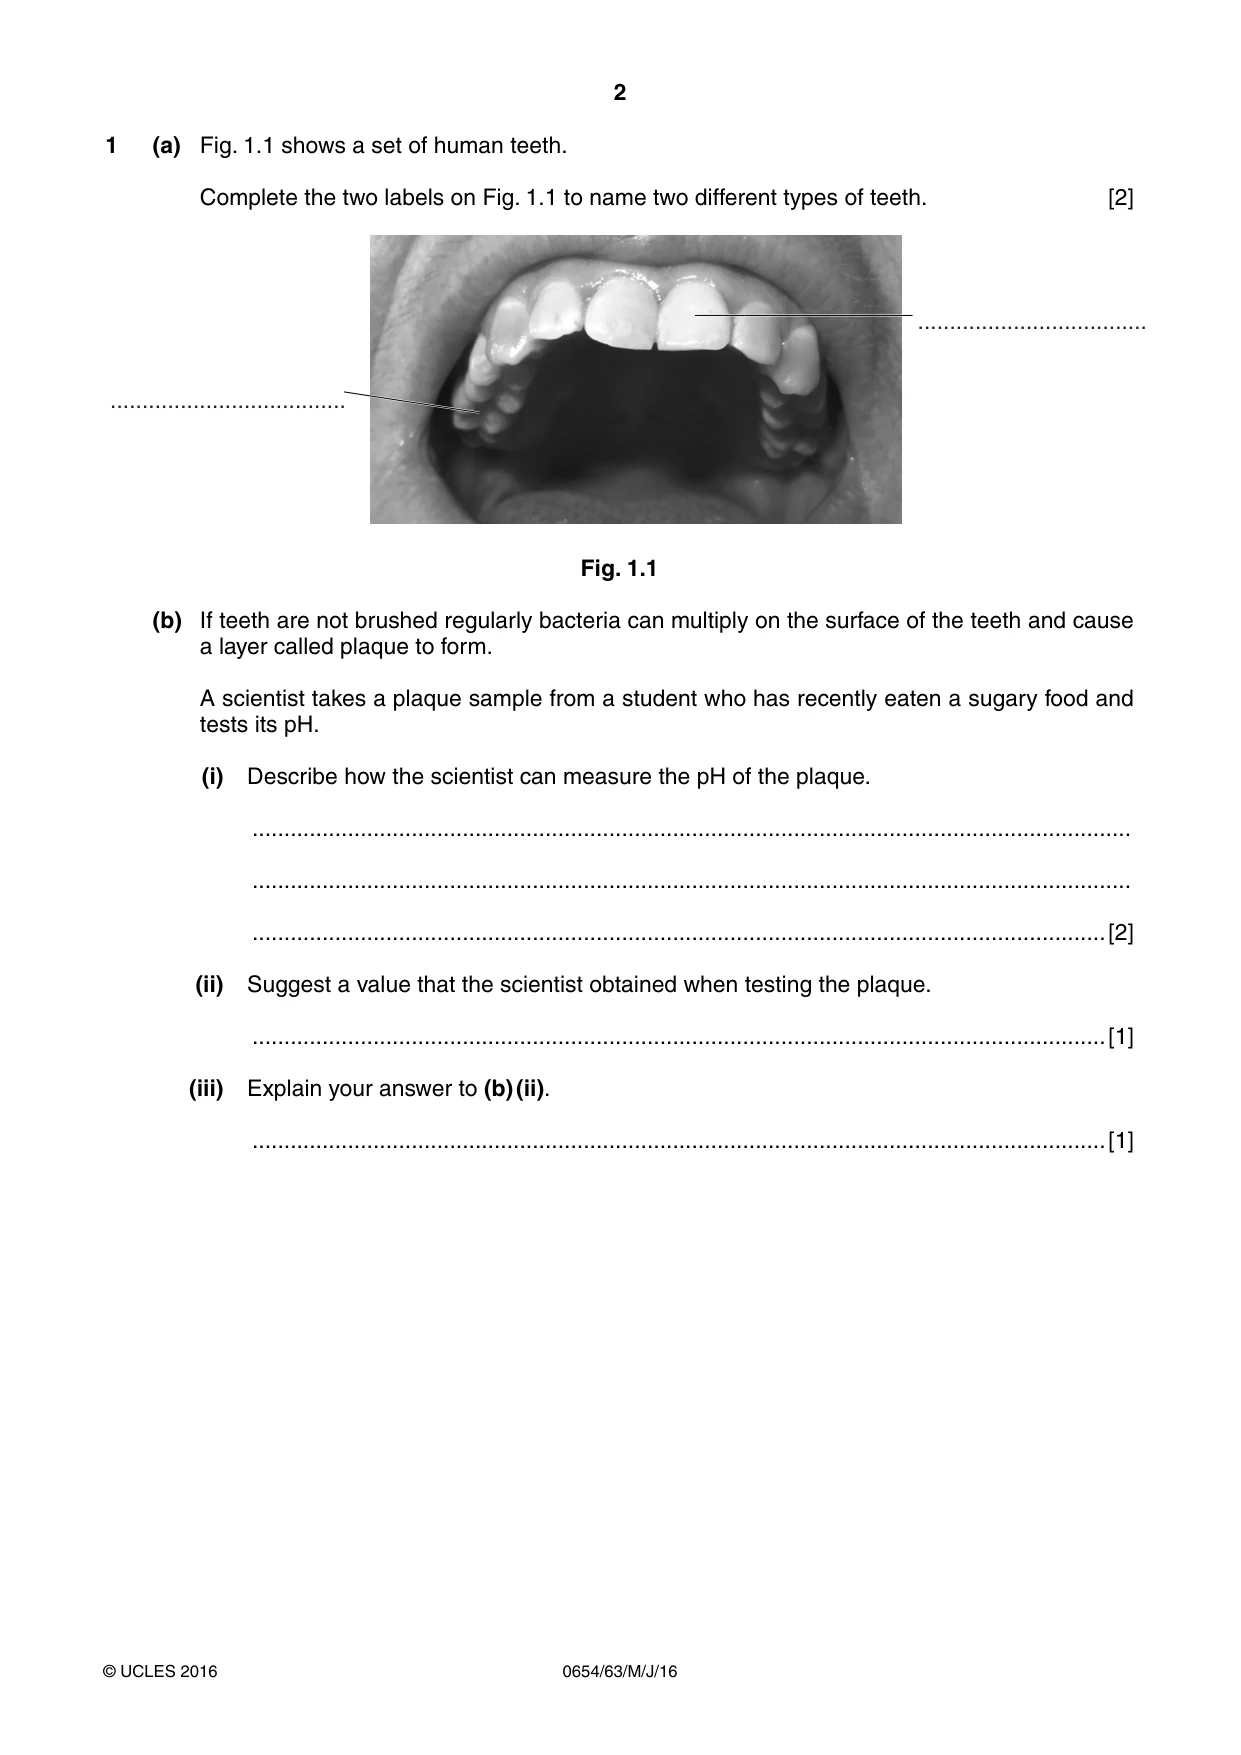
2 0654/63/M/J/16 © UCLES 2016 1 (a) Fig. 1.1 shows a set of human teeth. Complete the two labels on Fig. 1.1 to name two different types of teeth. [2] … … Fig. 1.1 (b) If teeth are not brushed regularly bacteria can multiply on the surface of the teeth and cause a layer called plaque to form. A scientist takes a plaque sample from a student who has recently eaten a sugary food and tests its pH. (i) Describe how the scientist can measure the pH of the plaque. … … …[2] (ii) Suggest a value that the scientist obtained when testing the plaque. …[1] (iii) Explain your answer to (b) (ii). …[1]
Question paper, page 3
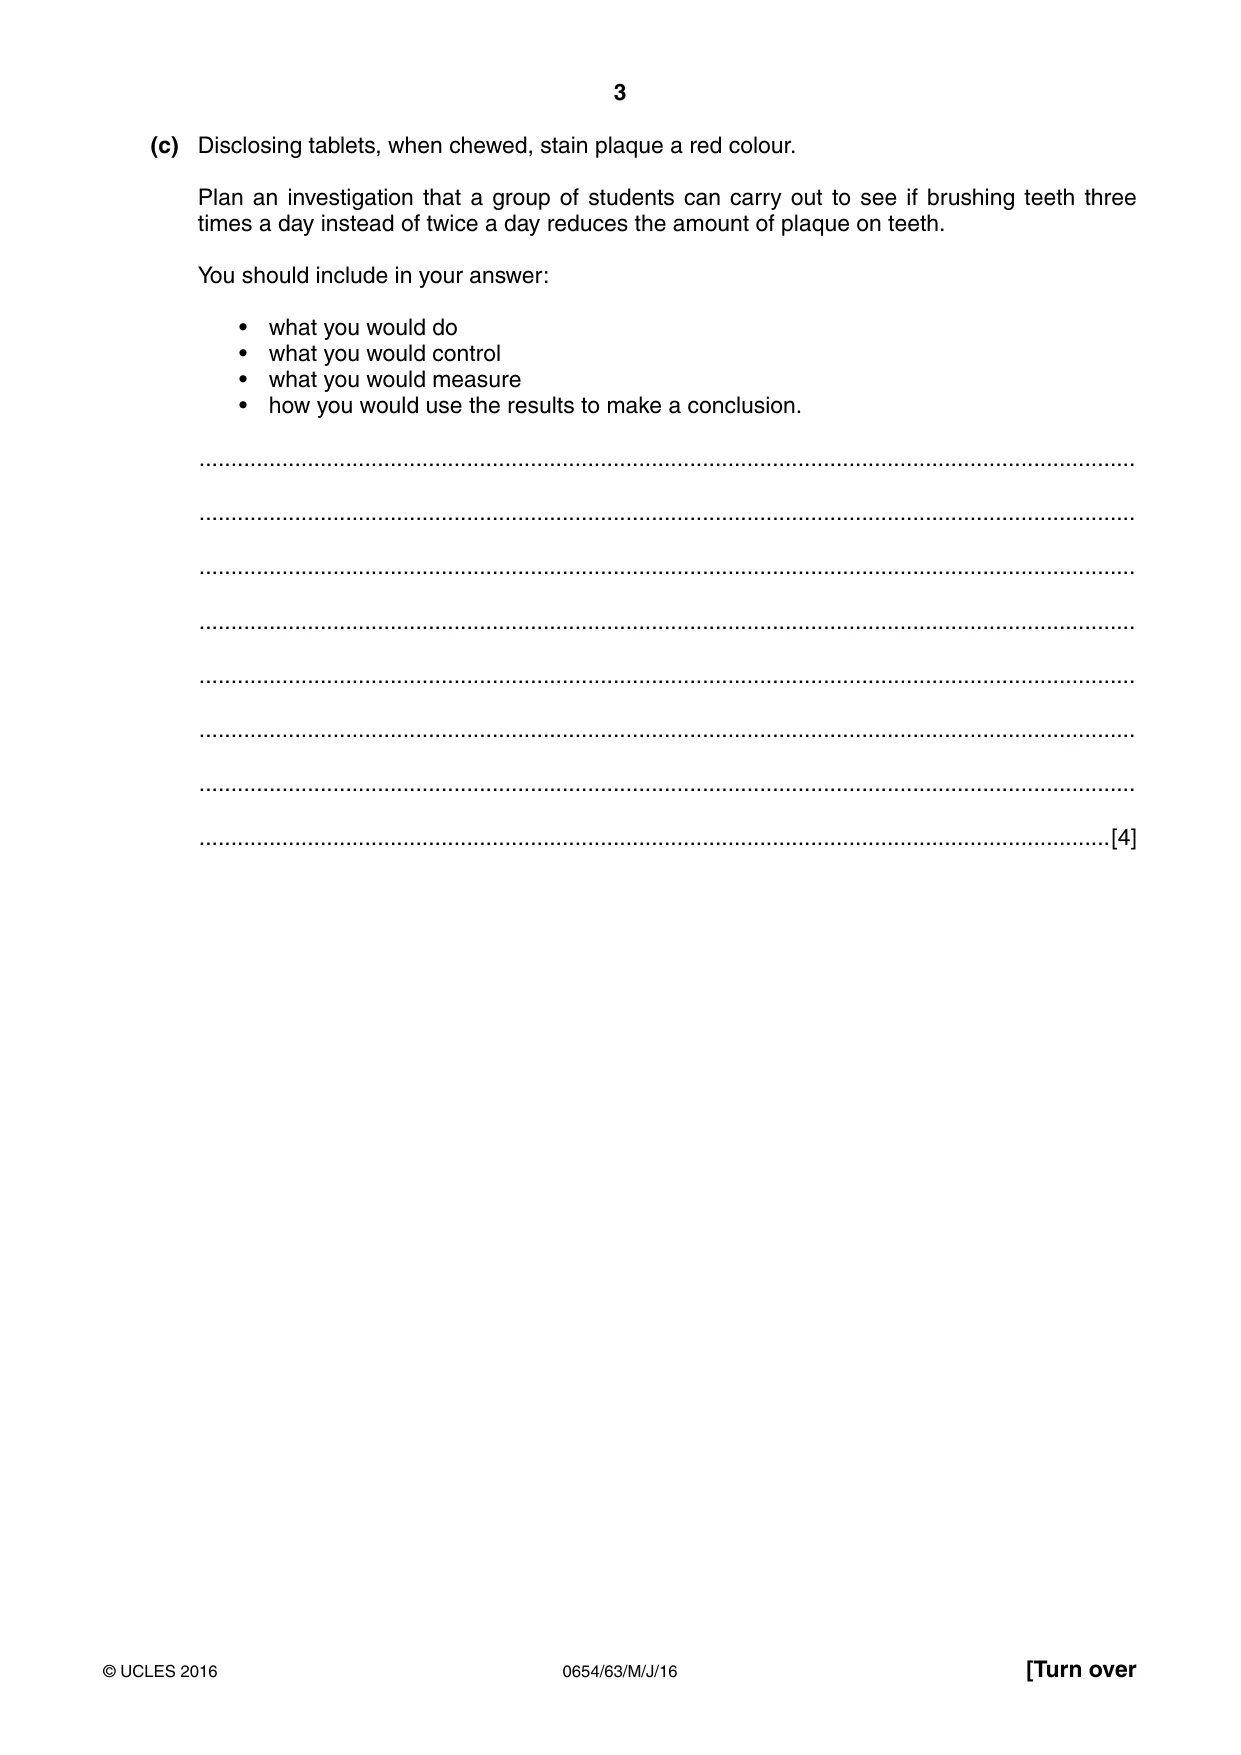
3 0654/63/M/J/16 © UCLES 2016 [Turn over (c) Disclosing tablets, when chewed, stain plaque a red colour. Plan an investigation that a group of students can carry out to see if brushing teeth three times a day instead of twice a day reduces the amount of plaque on teeth. You should include in your answer: • what you would do • what you would control • what you would measure • how you would use the results to make a conclusion. … … … … … … … …[4]
Question paper, page 4
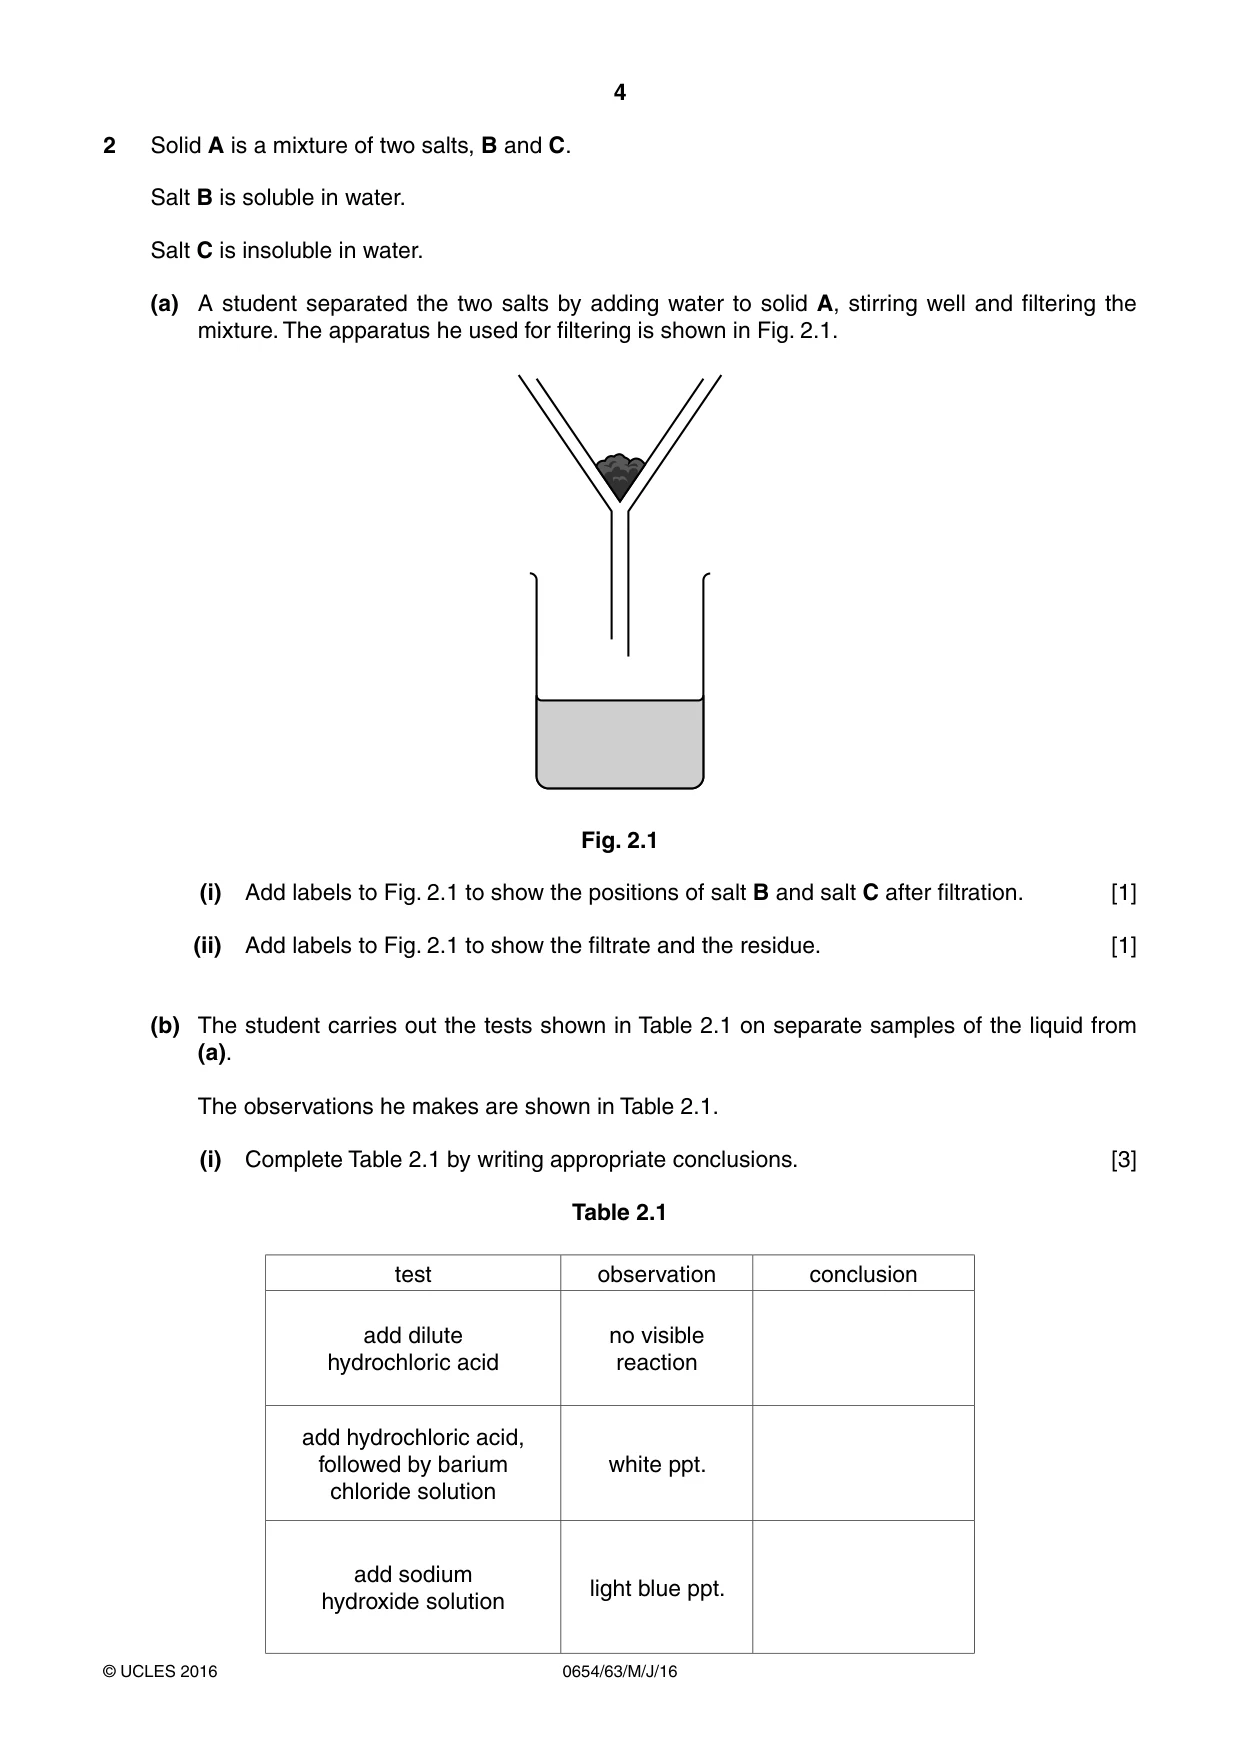
4 0654/63/M/J/16 © UCLES 2016 2 Solid A is a mixture of two salts, B and C. Salt B is soluble in water. Salt C is insoluble in water. (a) A student separated the two salts by adding water to solid A, stirring well and filtering the mixture. The apparatus he used for filtering is shown in Fig. 2.1. Fig. 2.1 (i) Add labels to Fig. 2.1 to show the positions of salt B and salt C after filtration. [1] (ii) Add labels to Fig. 2.1 to show the filtrate and the residue. [1] (b) The student carries out the tests shown in Table 2.1 on separate samples of the liquid from (a). The observations he makes are shown in Table 2.1. (i) Complete Table 2.1 by writing appropriate conclusions. [3] Table 2.1 test observation conclusion add dilute hydrochloric acid no visible reaction add hydrochloric acid, followed by barium chloride solution white ppt. add sodium hydroxide solution light blue ppt.
Question paper, page 5
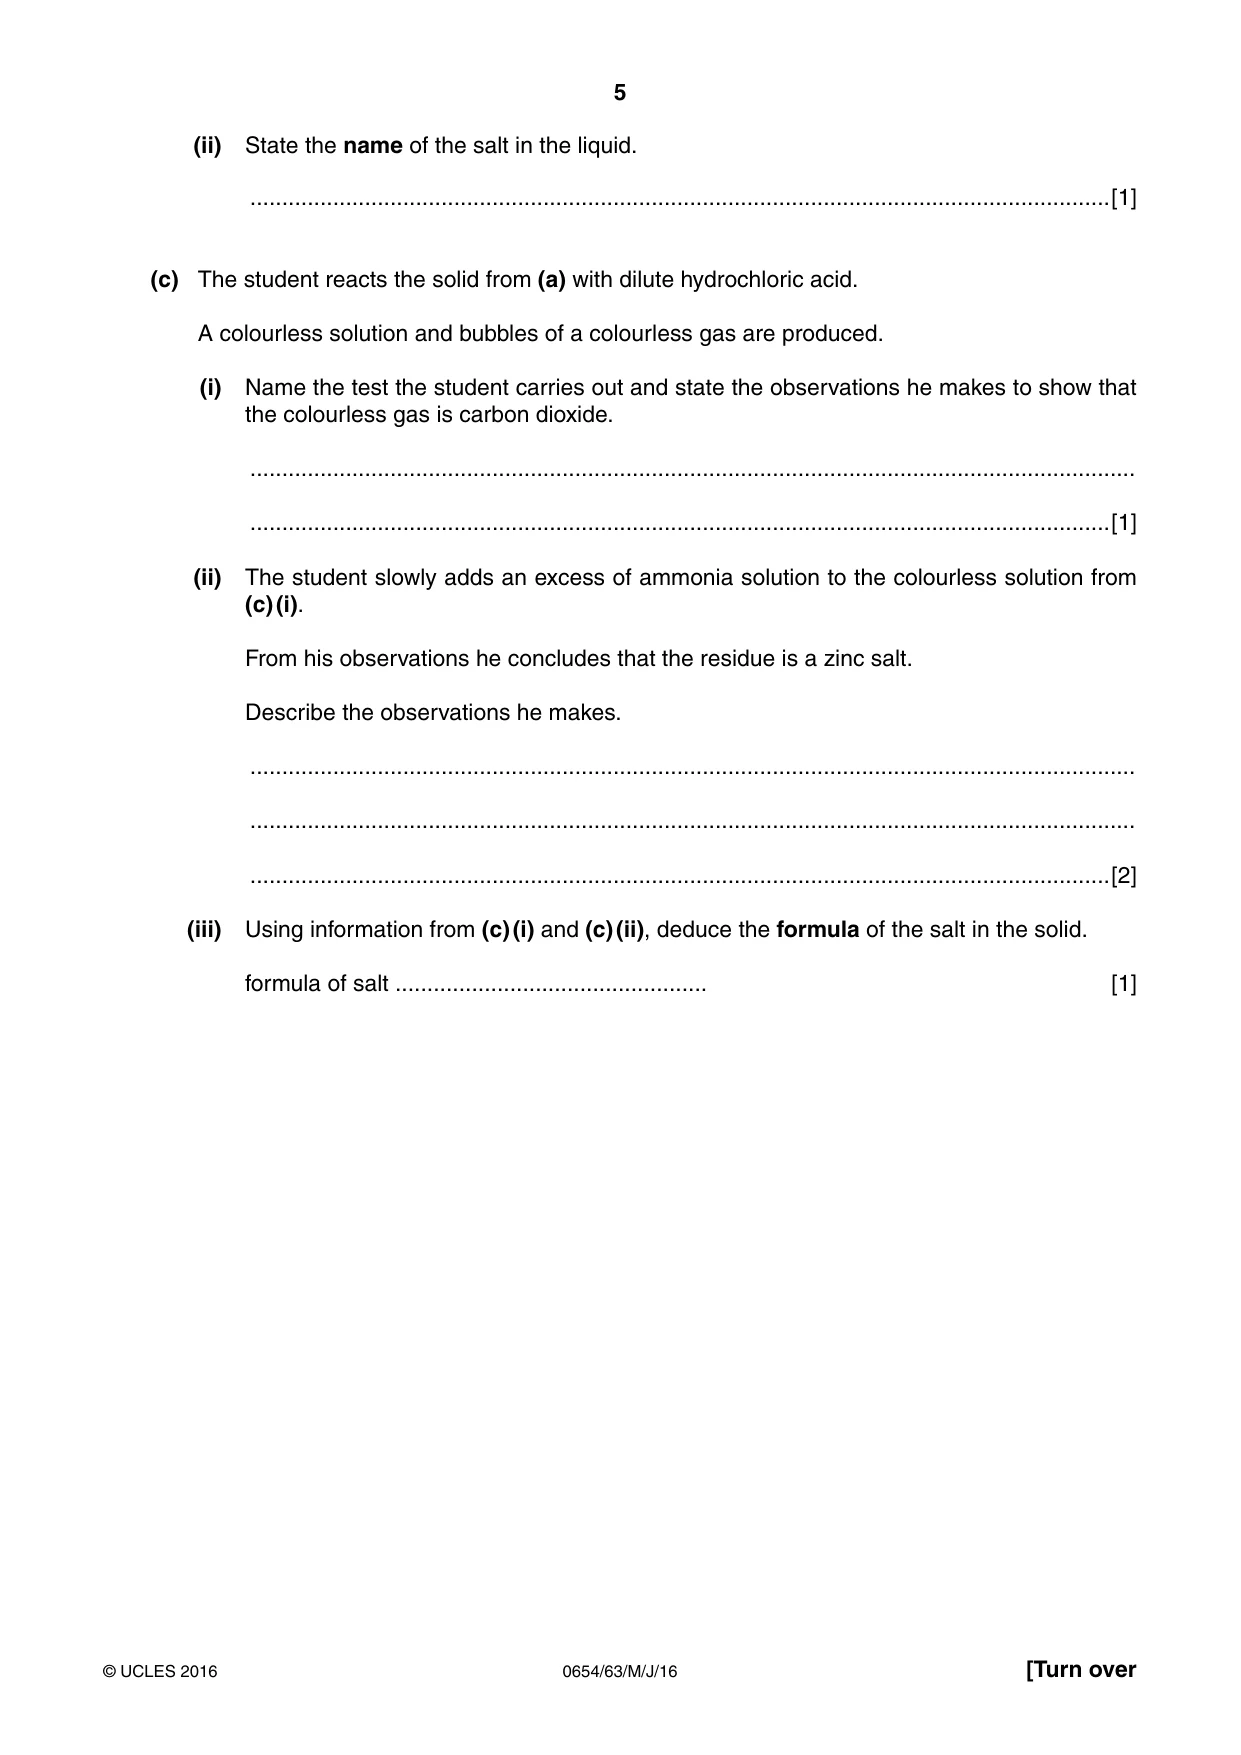
5 0654/63/M/J/16 © UCLES 2016 [Turn over (ii) State the name of the salt in the liquid. …[1] (c) The student reacts the solid from (a) with dilute hydrochloric acid. A colourless solution and bubbles of a colourless gas are produced. (i) Name the test the student carries out and state the observations he makes to show that the colourless gas is carbon dioxide. … …[1] (ii) The student slowly adds an excess of ammonia solution to the colourless solution from (c) (i). From his observations he concludes that the residue is a zinc salt. Describe the observations he makes. … … …[2] (iii) Using information from (c) (i) and (c) (ii), deduce the formula of the salt in the solid. formula of salt … [1]
Question paper, page 6
6 0654/63/M/J/16 © UCLES 2016 BLANK PAGE
Question paper, page 7
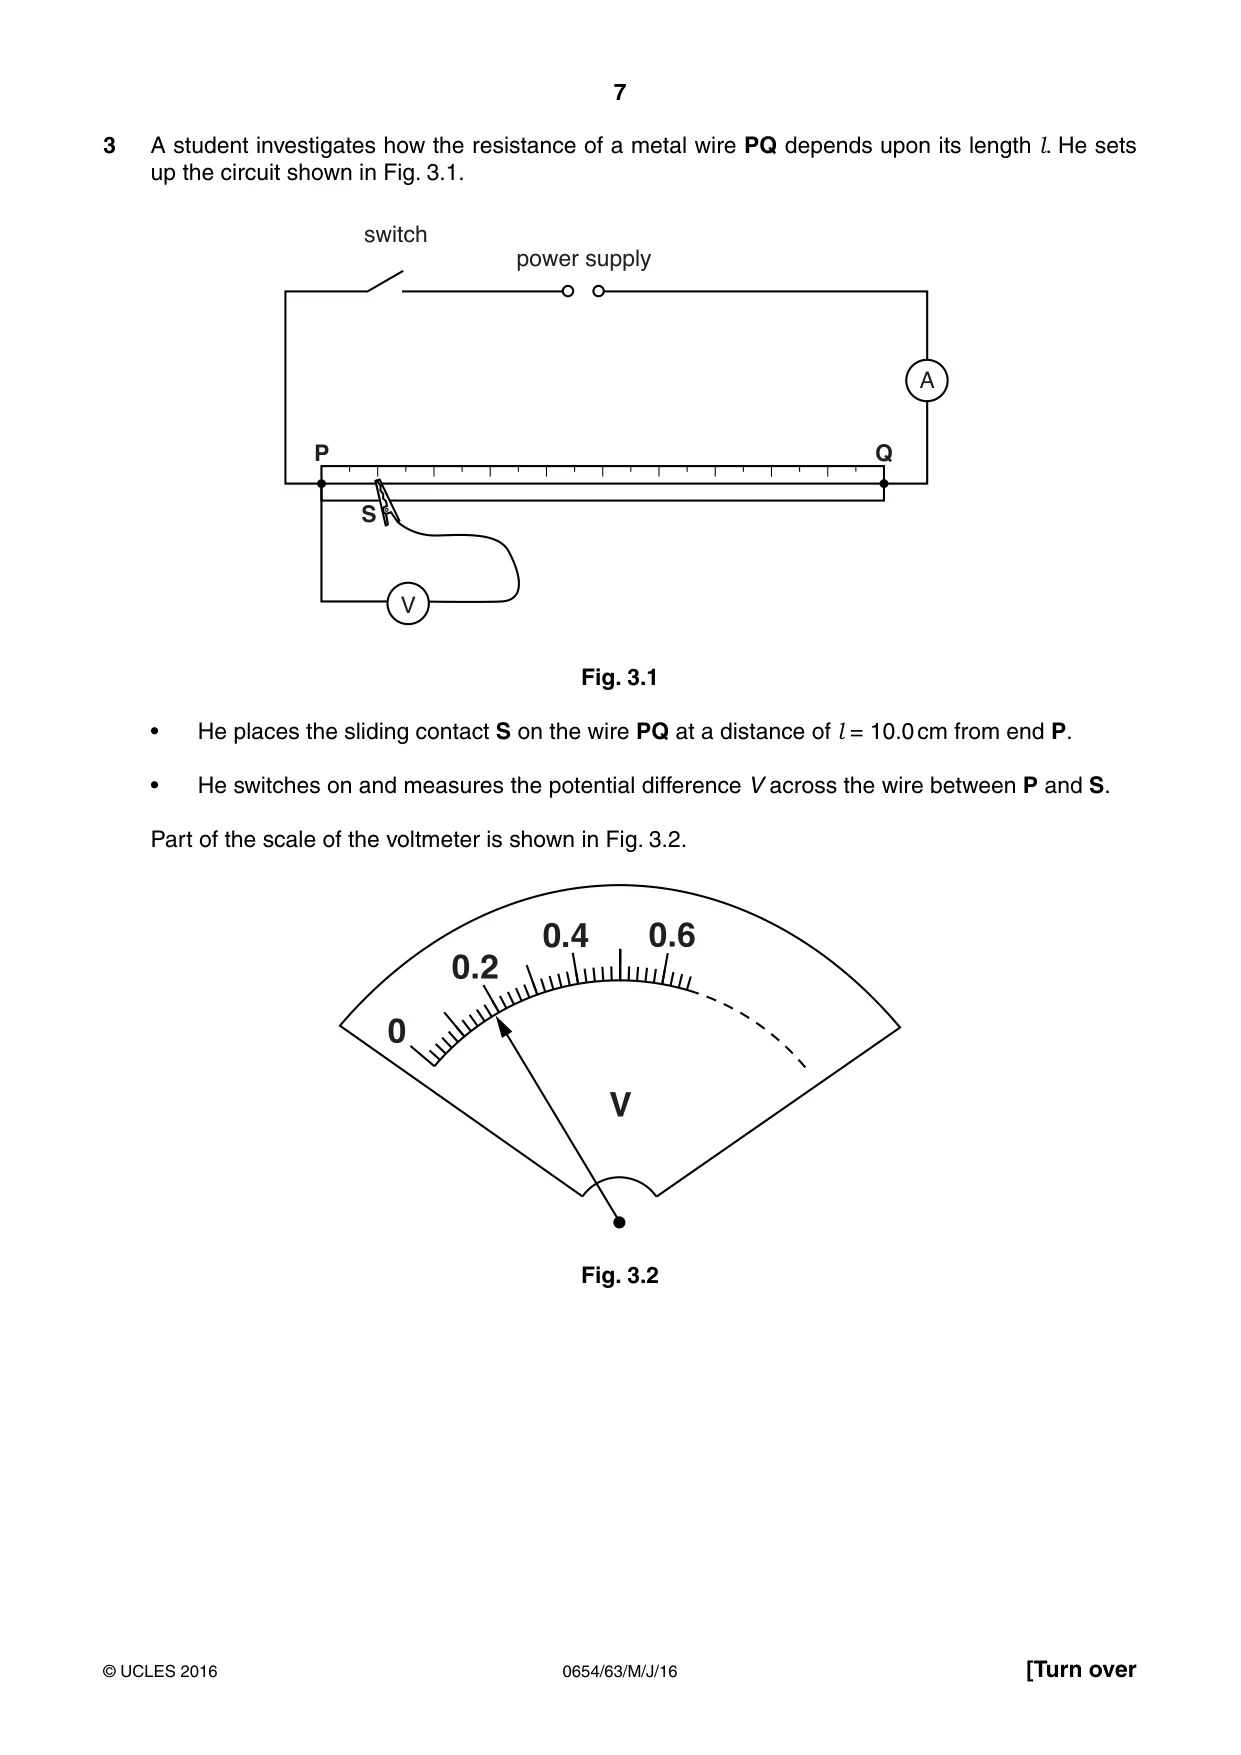
7 0654/63/M/J/16 © UCLES 2016 [Turn over 3 A student investigates how the resistance of a metal wire PQ depends upon its length l. He sets up the circuit shown in Fig. 3.1. power supply switch A V P S Q Fig. 3.1 • He places the sliding contact S on the wire PQ at a distance of l = 10.0 cm from end P. • He switches on and measures the potential difference V across the wire between P and S. Part of the scale of the voltmeter is shown in Fig. 3.2. V 0.6 0.4 0.2 0 Fig. 3.2
Question paper, page 8
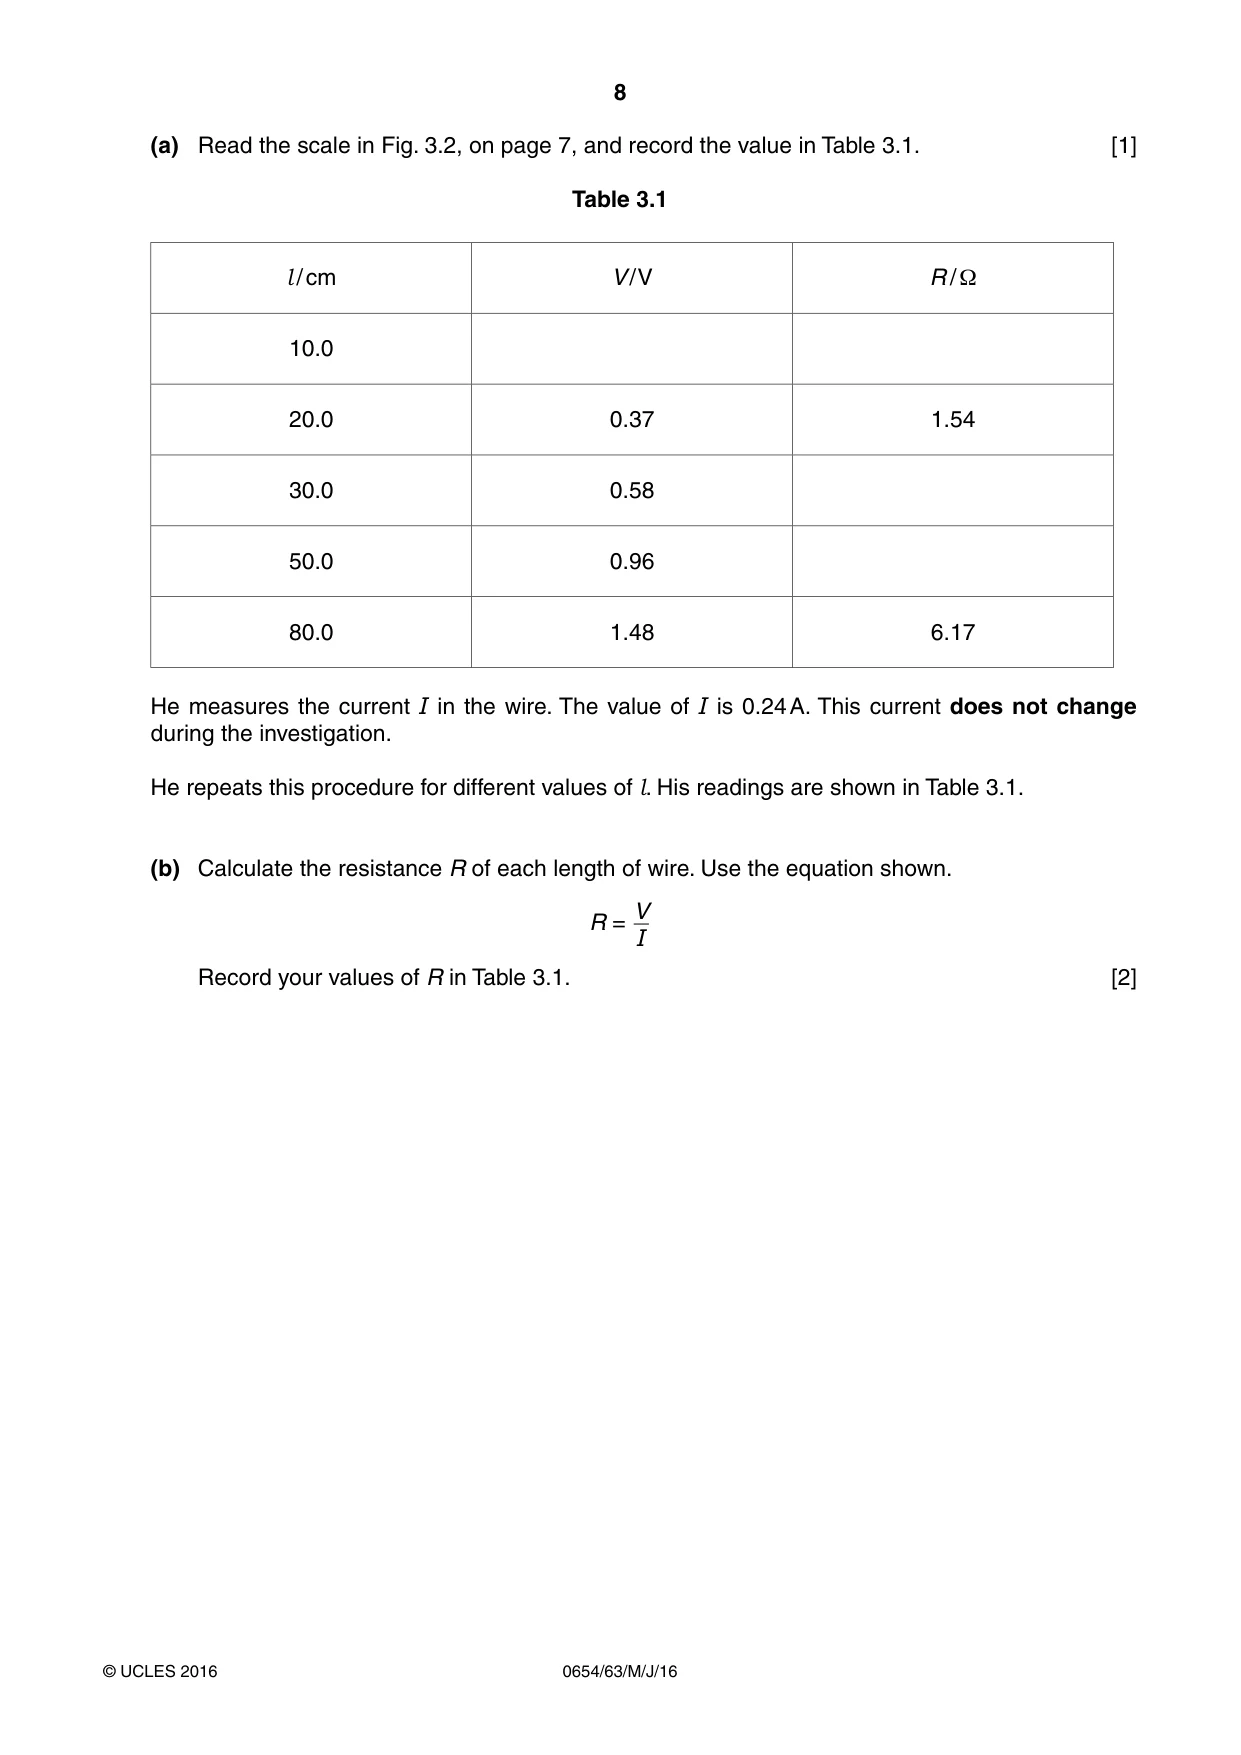
8 0654/63/M/J/16 © UCLES 2016 (a) Read the scale in Fig. 3.2, on page 7, and record the value in Table 3.1. [1] Table 3.1 l / cm V / V R / Ω 10.0 20.0 0.37 1.54 30.0 0.58 50.0 0.96 80.0 1.48 6.17 He measures the current I in the wire. The value of I is 0.24 A. This current does not change during the investigation. He repeats this procedure for different values of l. His readings are shown in Table 3.1. (b) Calculate the resistance R of each length of wire. Use the equation shown. R = V I Record your values of R in Table 3.1. [2]
Question paper, page 9
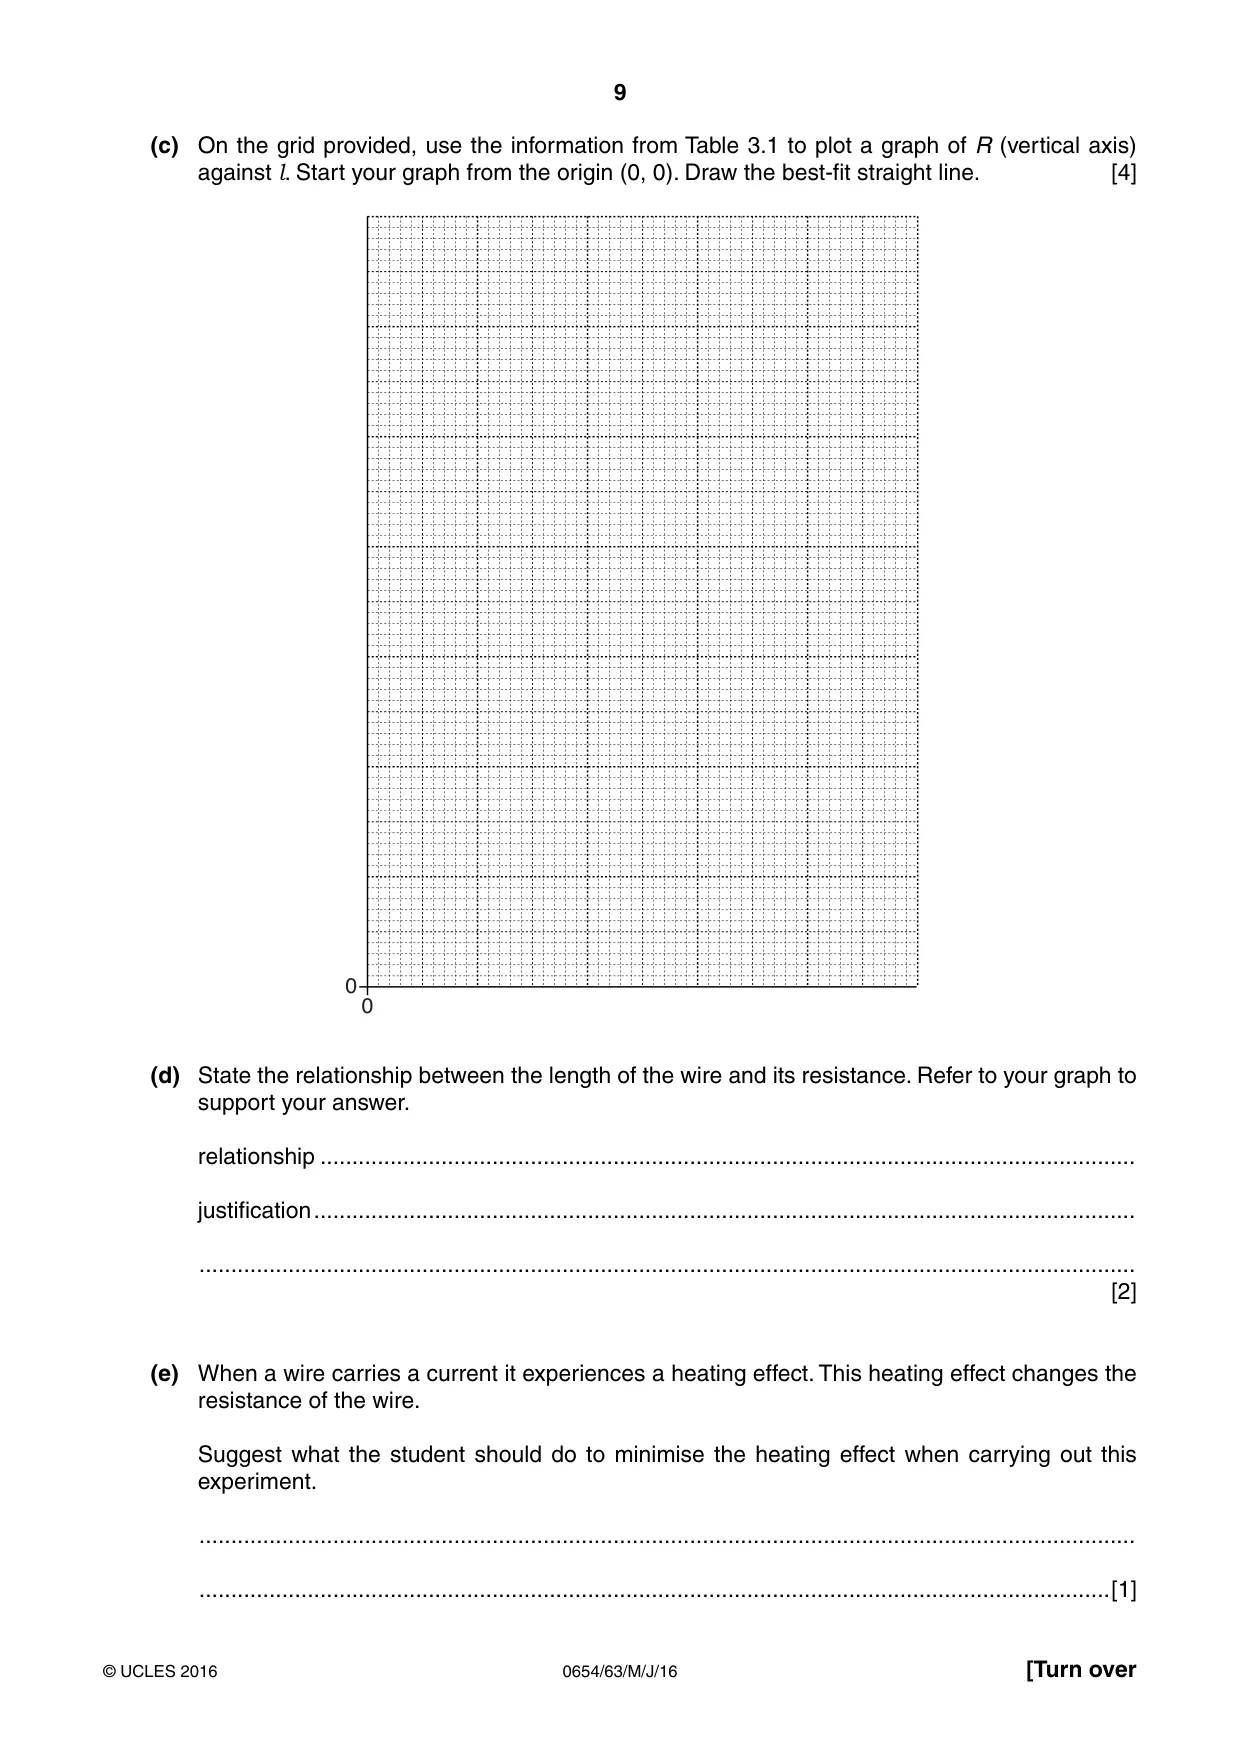
9 0654/63/M/J/16 © UCLES 2016 [Turn over (c) On the grid provided, use the information from Table 3.1 to plot a graph of R (vertical axis) against l. Start your graph from the origin (0, 0). Draw the best-fit straight line. [4] 0 0 (d) State the relationship between the length of the wire and its resistance. Refer to your graph to support your answer. relationship … justification … … [2] (e) When a wire carries a current it experiences a heating effect. This heating effect changes the resistance of the wire. Suggest what the student should do to minimise the heating effect when carrying out this experiment. … …[1]
Question paper, page 10
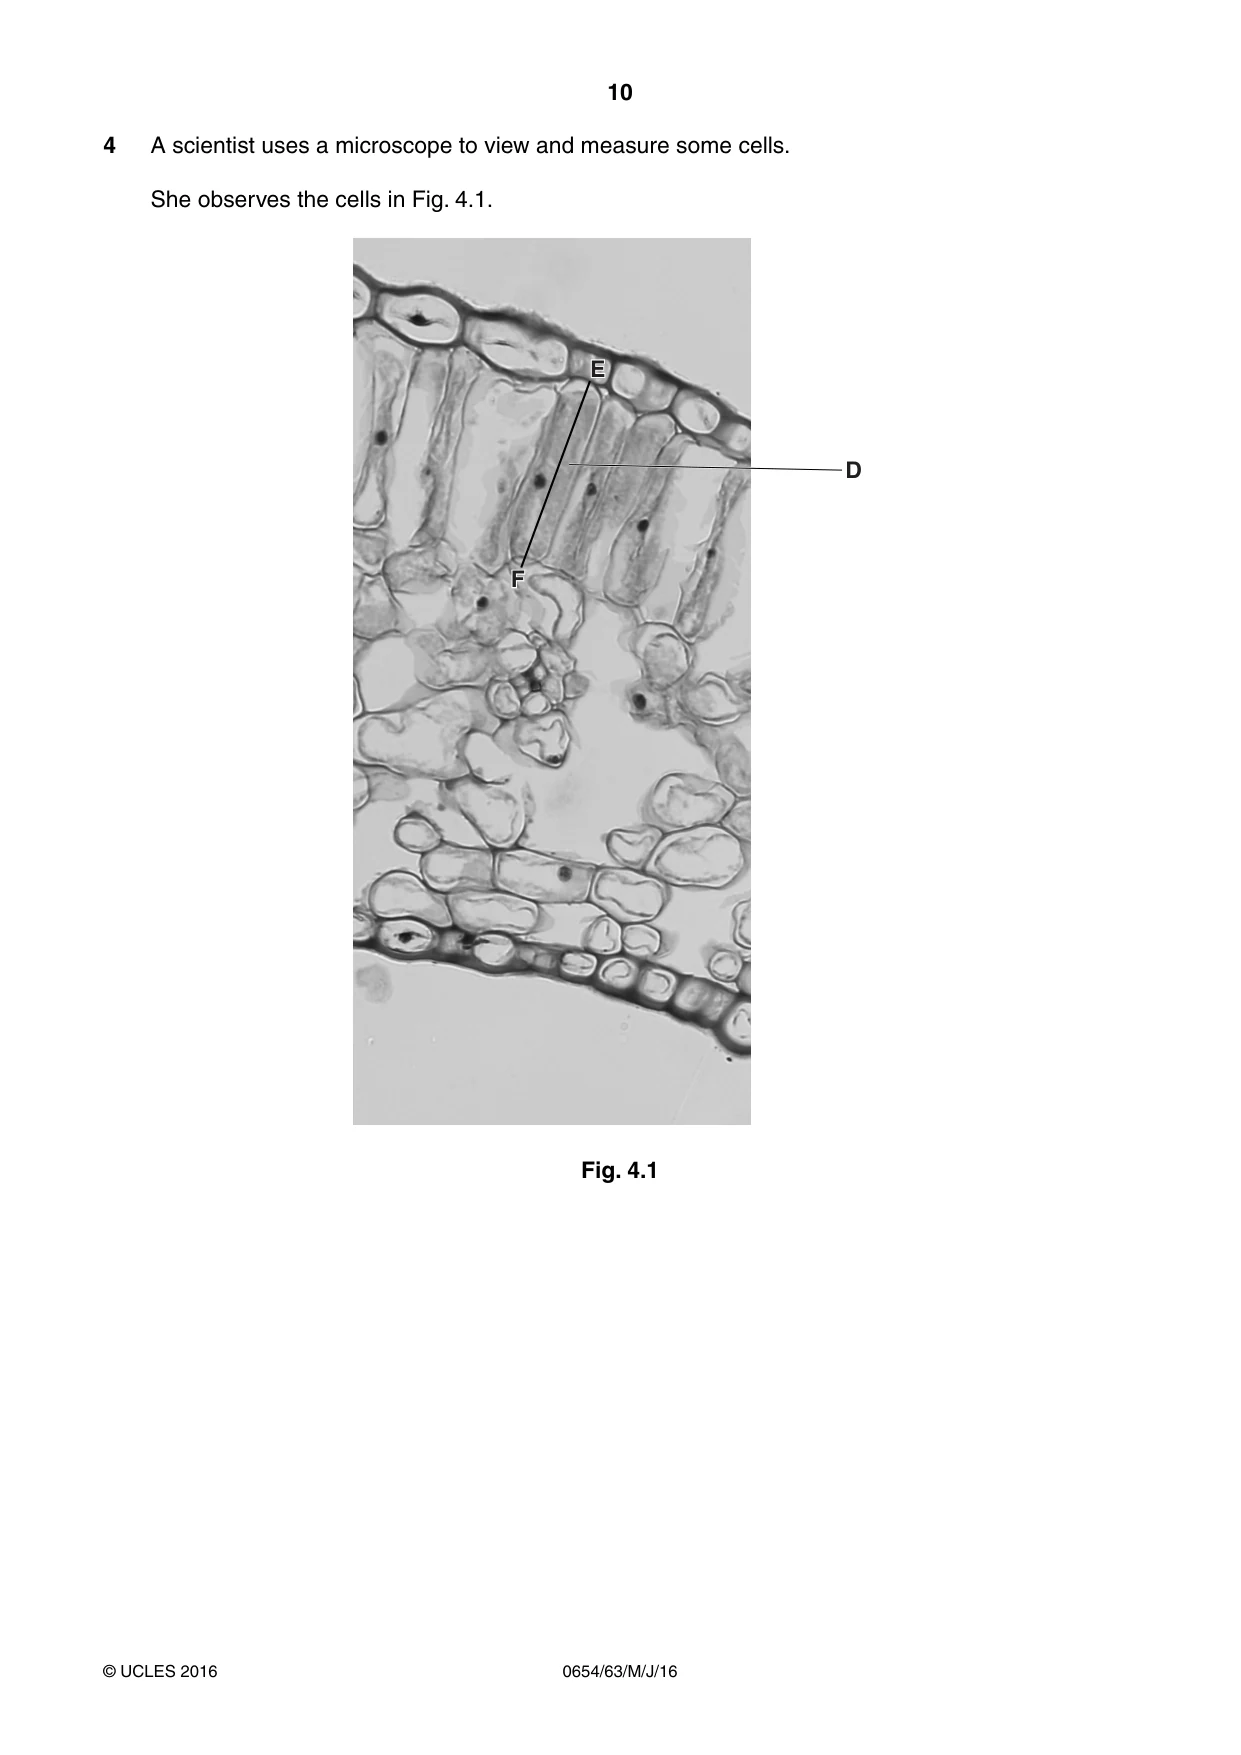
10 0654/63/M/J/16 © UCLES 2016 4 A scientist uses a microscope to view and measure some cells. She observes the cells in Fig. 4.1. D E F Fig. 4.1
Question paper, page 11
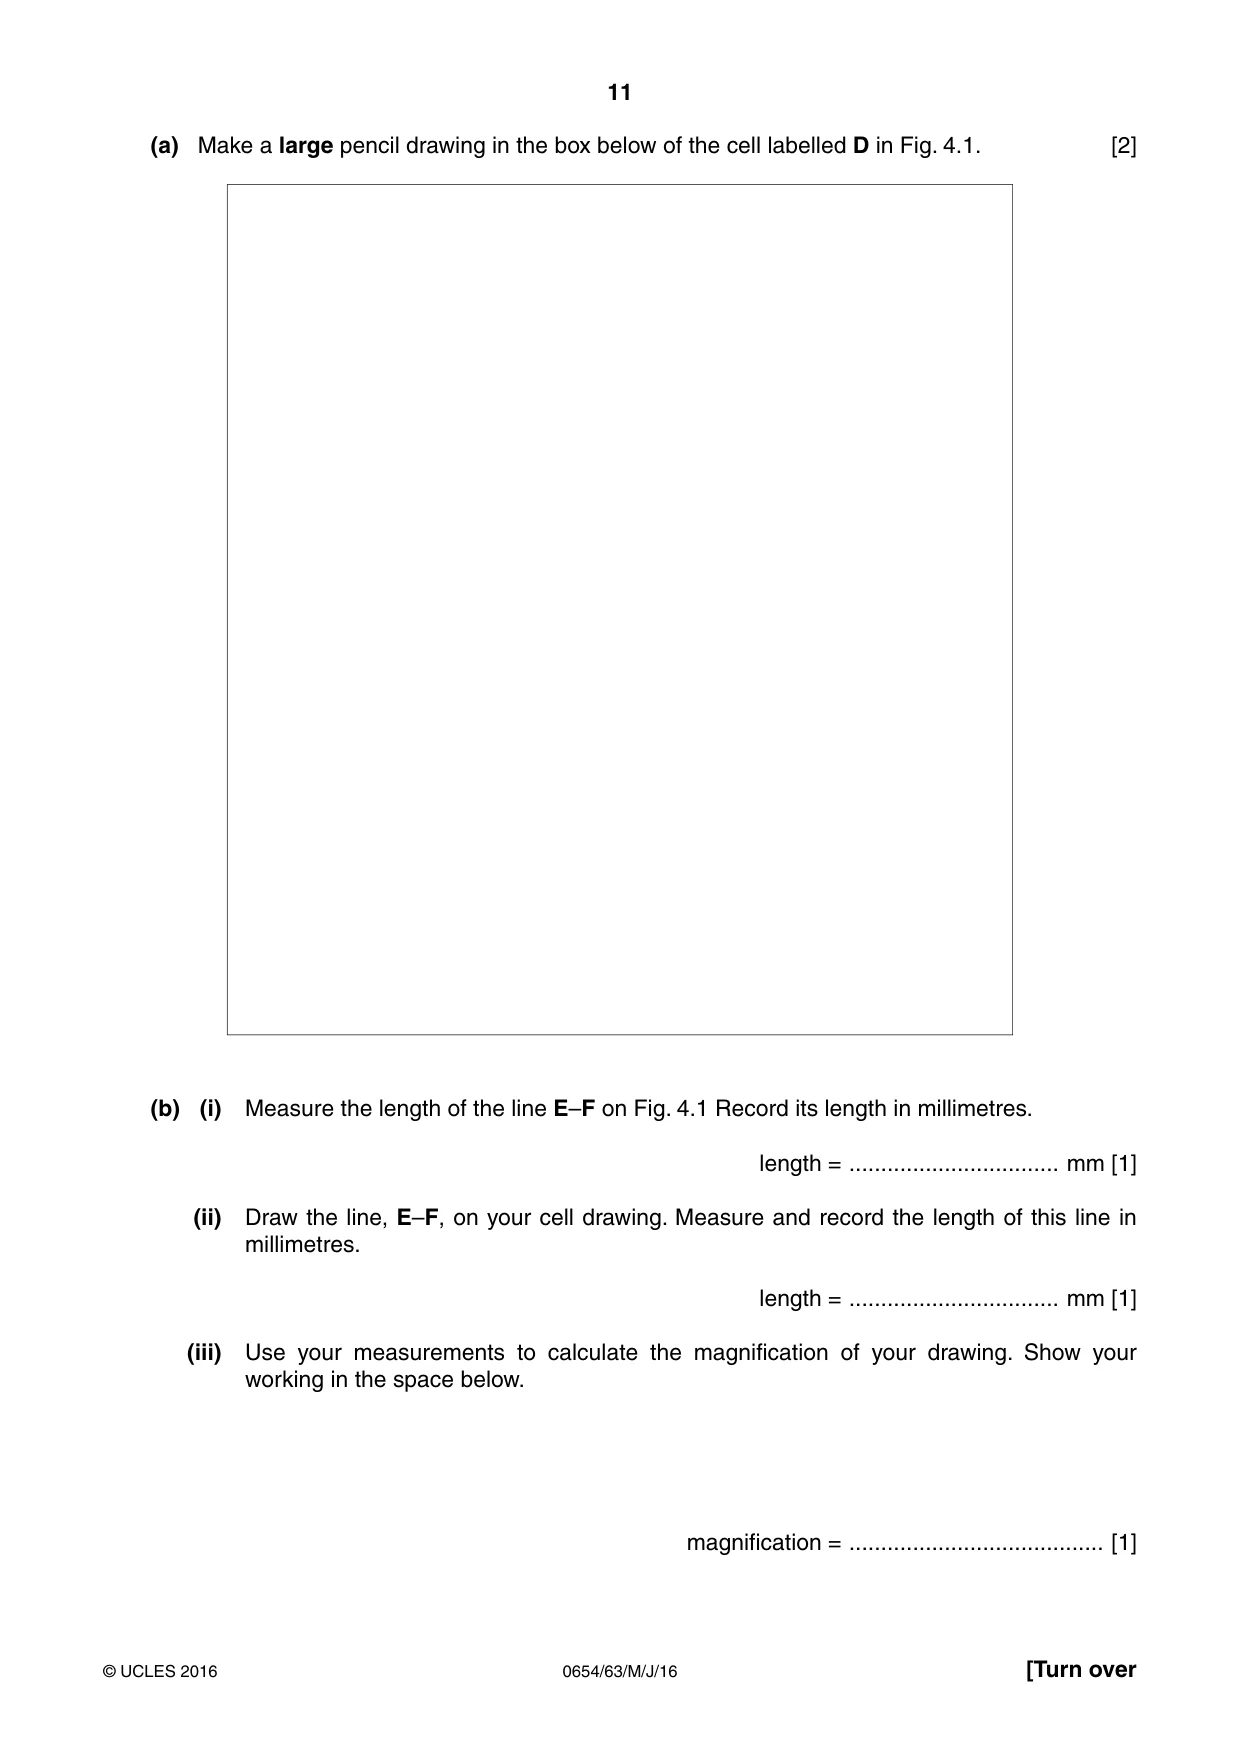
11 0654/63/M/J/16 © UCLES 2016 [Turn over (a) Make a large pencil drawing in the box below of the cell labelled D in Fig. 4.1. [2] (b) (i) Measure the length of the line E–F on Fig. 4.1 Record its length in millimetres. length = … mm [1] (ii) Draw the line, E–F, on your cell drawing. Measure and record the length of this line in millimetres. length = … mm [1] (iii) Use your measurements to calculate the magnification of your drawing. Show your working in the space below. magnification = … [1]
Question paper, page 12
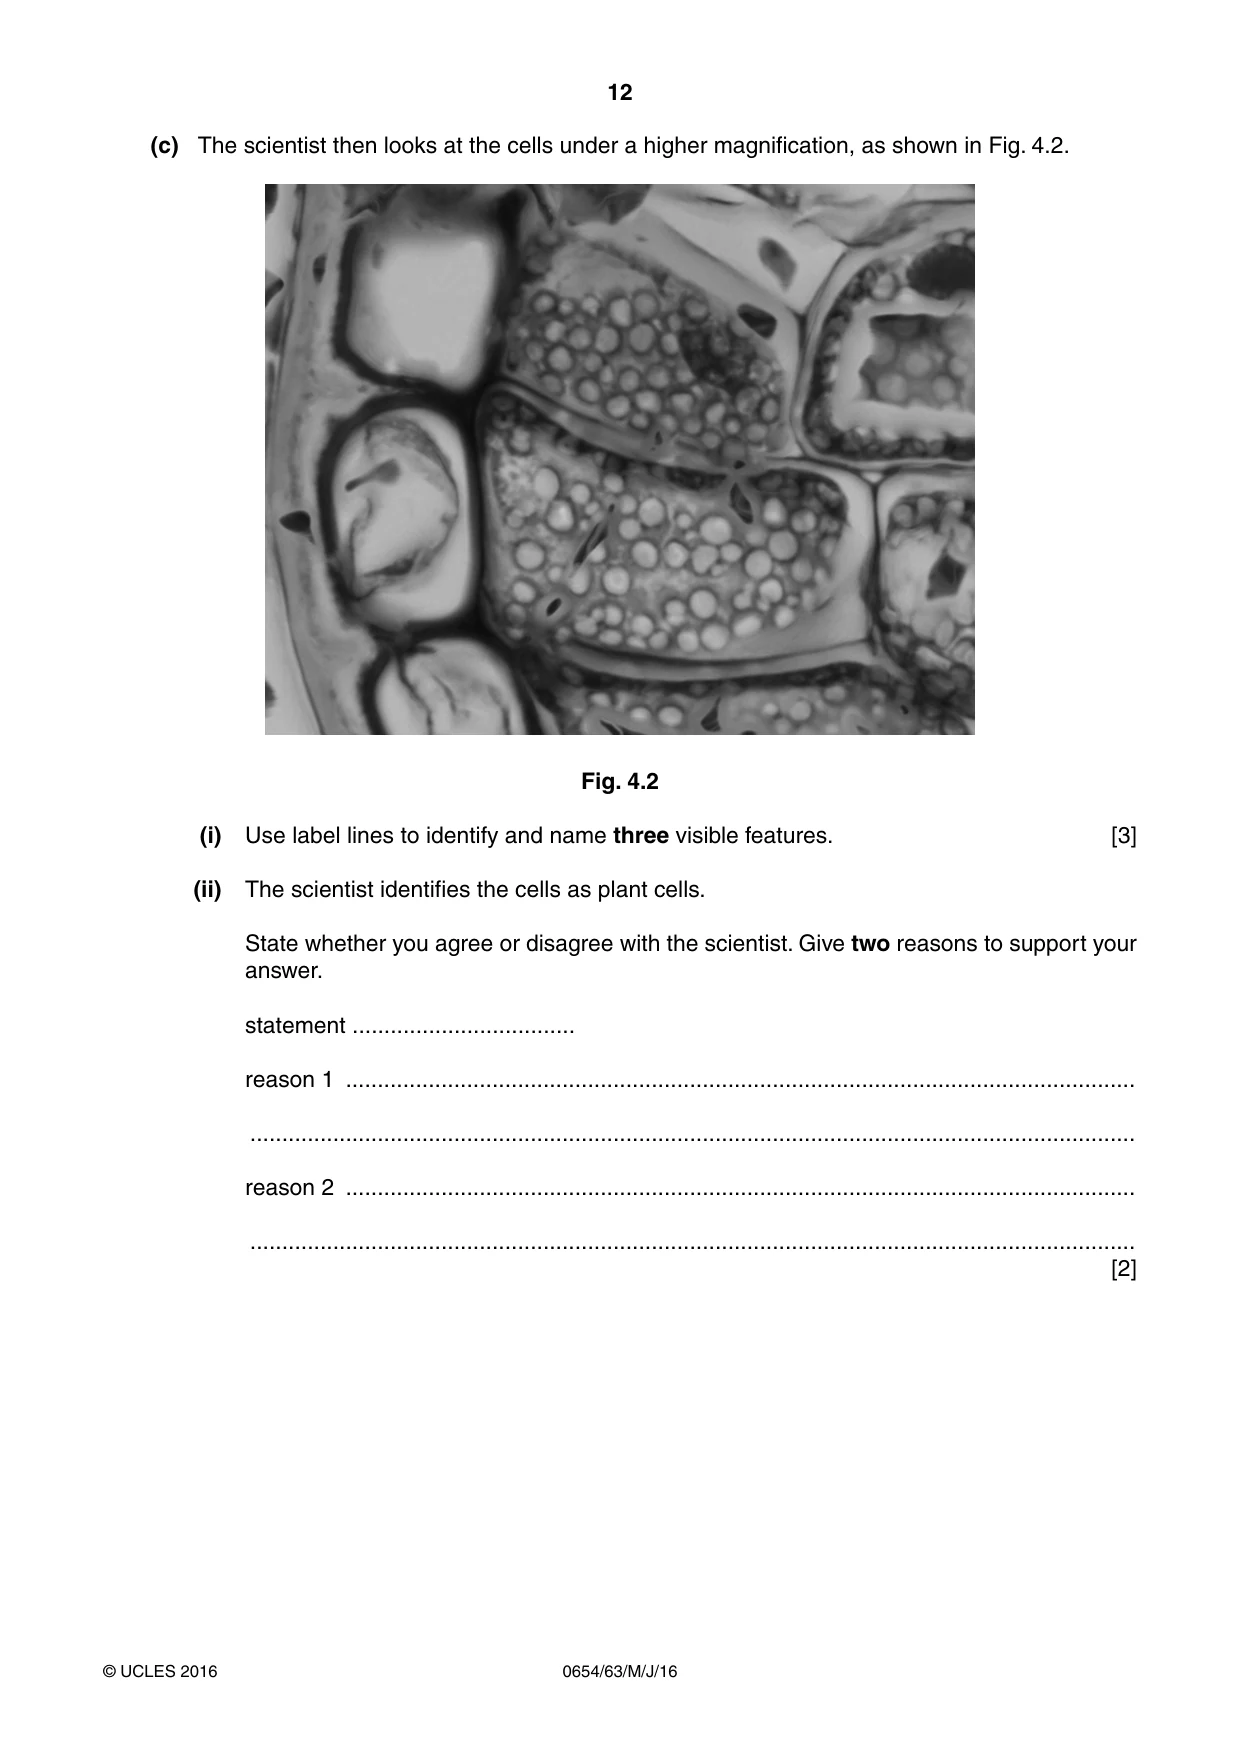
12 0654/63/M/J/16 © UCLES 2016 (c) The scientist then looks at the cells under a higher magnification, as shown in Fig. 4.2. Fig. 4.2 (i) Use label lines to identify and name three visible features. [3] (ii) The scientist identifies the cells as plant cells. State whether you agree or disagree with the scientist. Give two reasons to support your answer. statement … reason 1 … … reason 2 … … [2]
Question paper, page 13
13 0654/63/M/J/16 © UCLES 2016 [Turn over Please turn over for Question 5.
Question paper, page 14
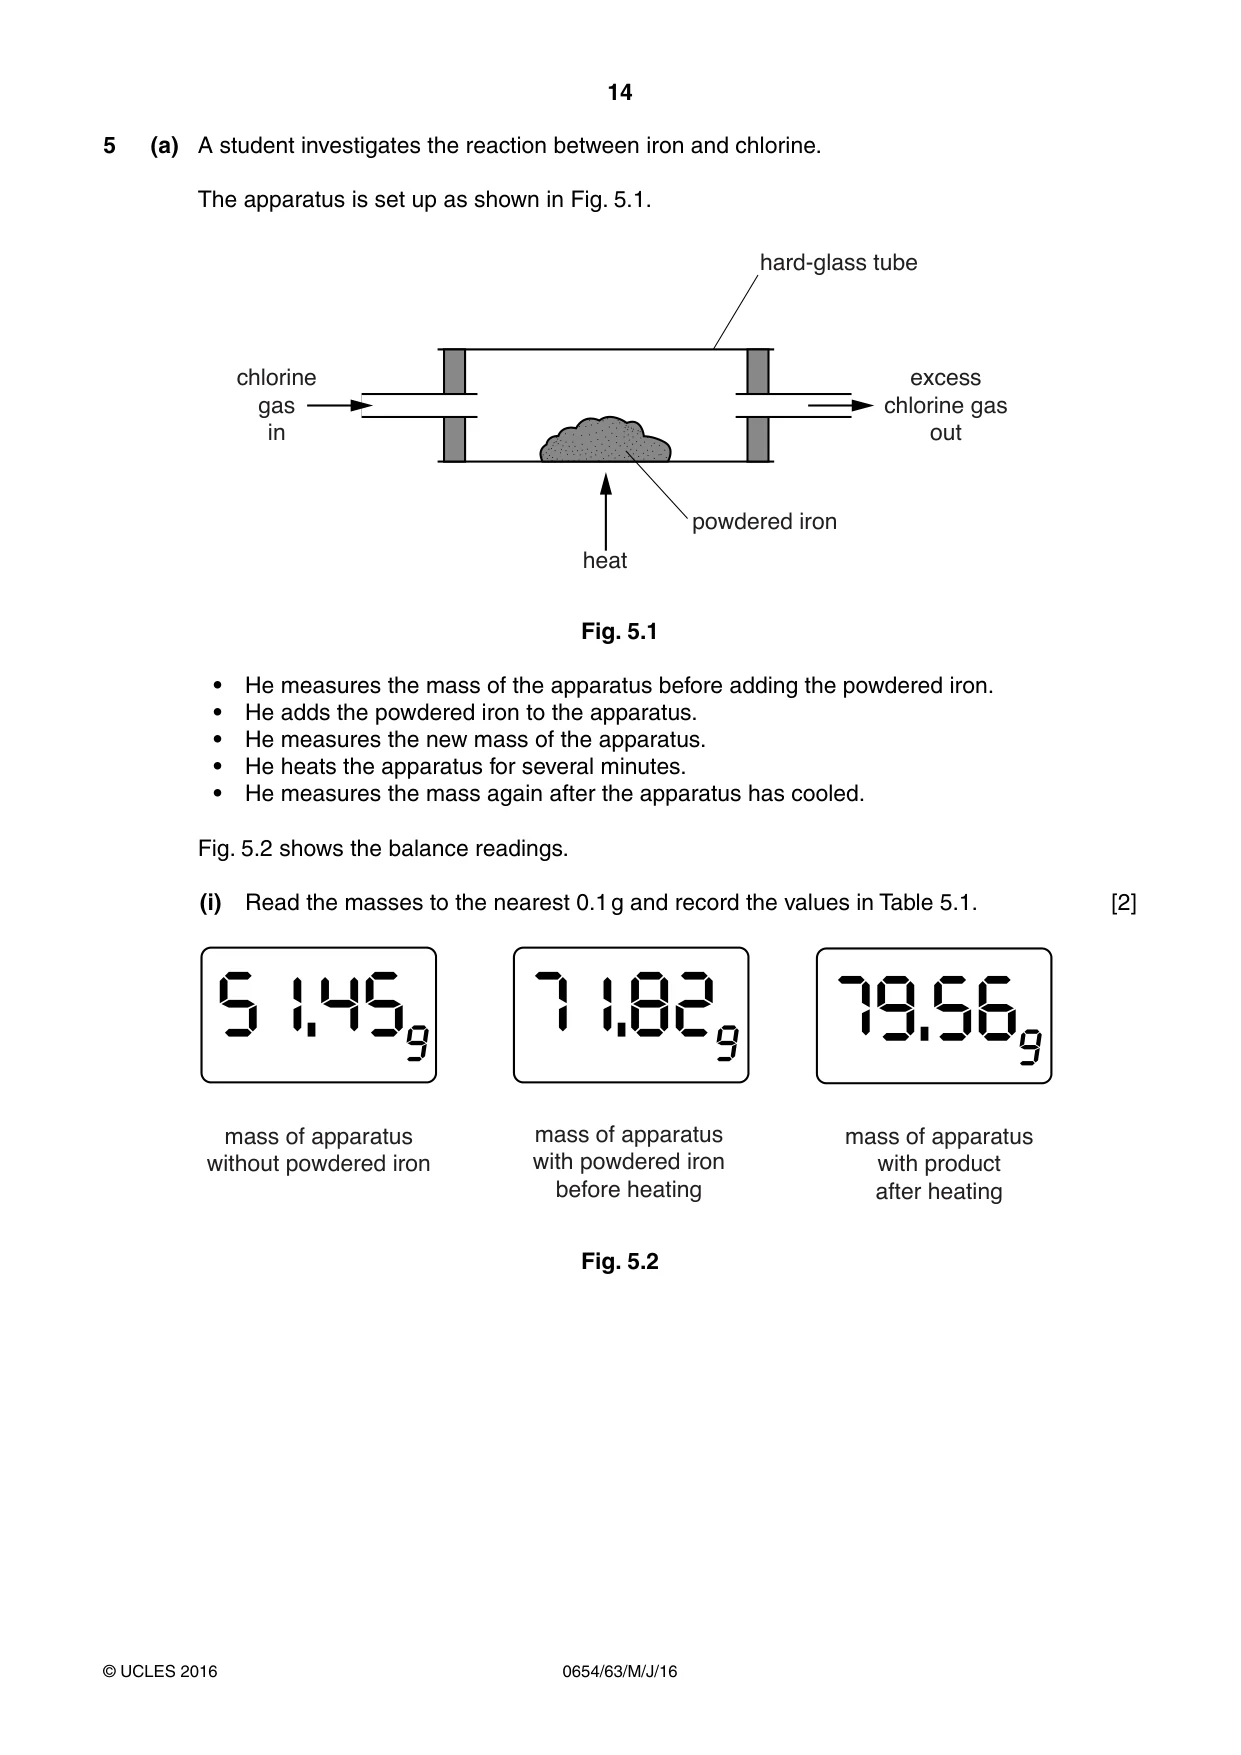
14 0654/63/M/J/16 © UCLES 2016 5 (a) A student investigates the reaction between iron and chlorine. The apparatus is set up as shown in Fig. 5.1. powdered iron hard-glass tube chlorine gas in excess chlorine gas out heat Fig. 5.1 • He measures the mass of the apparatus before adding the powdered iron. • He adds the powdered iron to the apparatus. • He measures the new mass of the apparatus. • He heats the apparatus for several minutes. • He measures the mass again after the apparatus has cooled. Fig. 5.2 shows the balance readings. (i) Read the masses to the nearest 0.1 g and record the values in Table 5.1. [2] mass of apparatus without powdered iron mass of apparatus with powdered iron before heating mass of apparatus with product after heating Fig. 5.2
Question paper, page 15
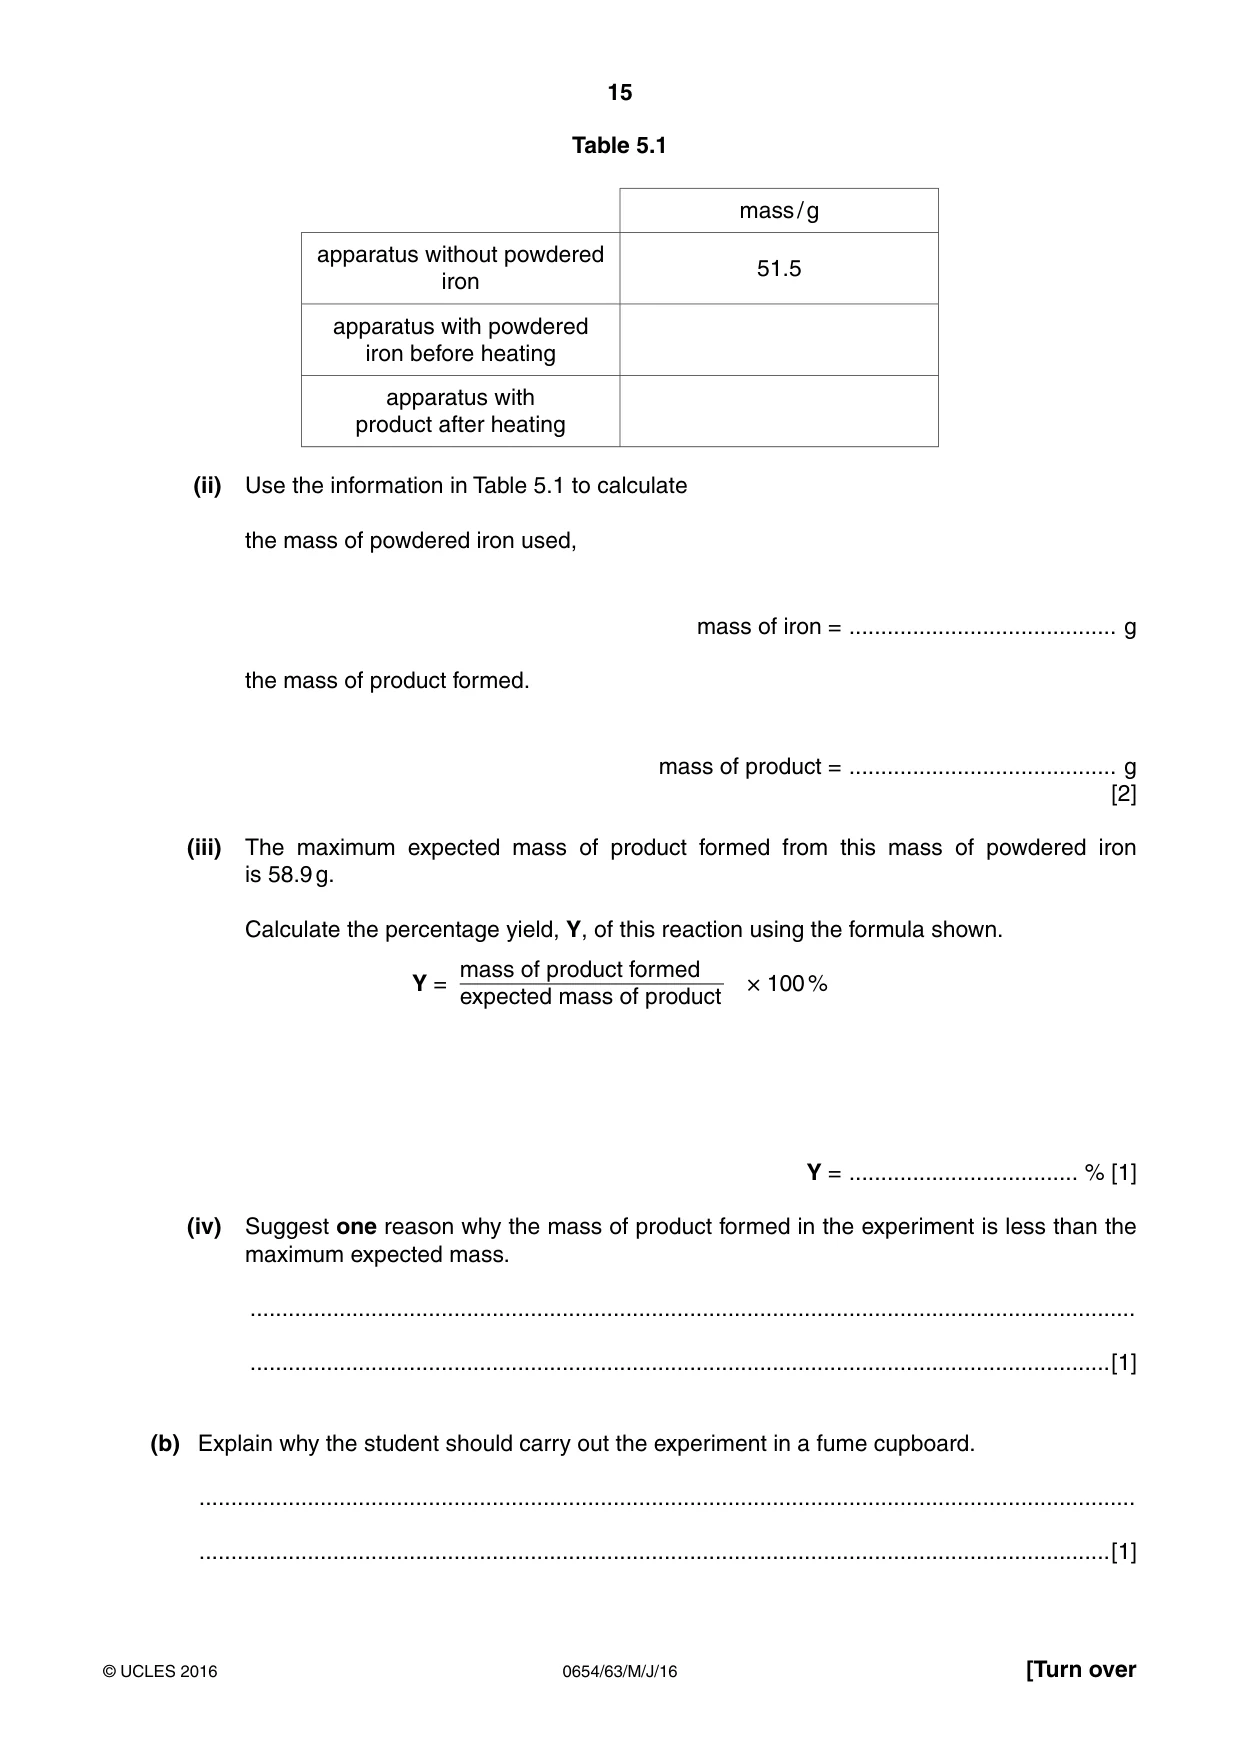
15 0654/63/M/J/16 © UCLES 2016 [Turn over Table 5.1 mass / g apparatus without powdered iron 51.5 apparatus with powdered iron before heating apparatus with product after heating (ii) Use the information in Table 5.1 to calculate the mass of powdered iron used, mass of iron = … g the mass of product formed. mass of product = … g [2] (iii) The maximum expected mass of product formed from this mass of powdered iron is 58.9 g. Calculate the percentage yield, Y, of this reaction using the formula shown. Y = mass of product formed expected mass of product × 100 % Y = … % [1] (iv) Suggest one reason why the mass of product formed in the experiment is less than the maximum expected mass. … …[1] (b) Explain why the student should carry out the experiment in a fume cupboard. … …[1]
Question paper, page 16
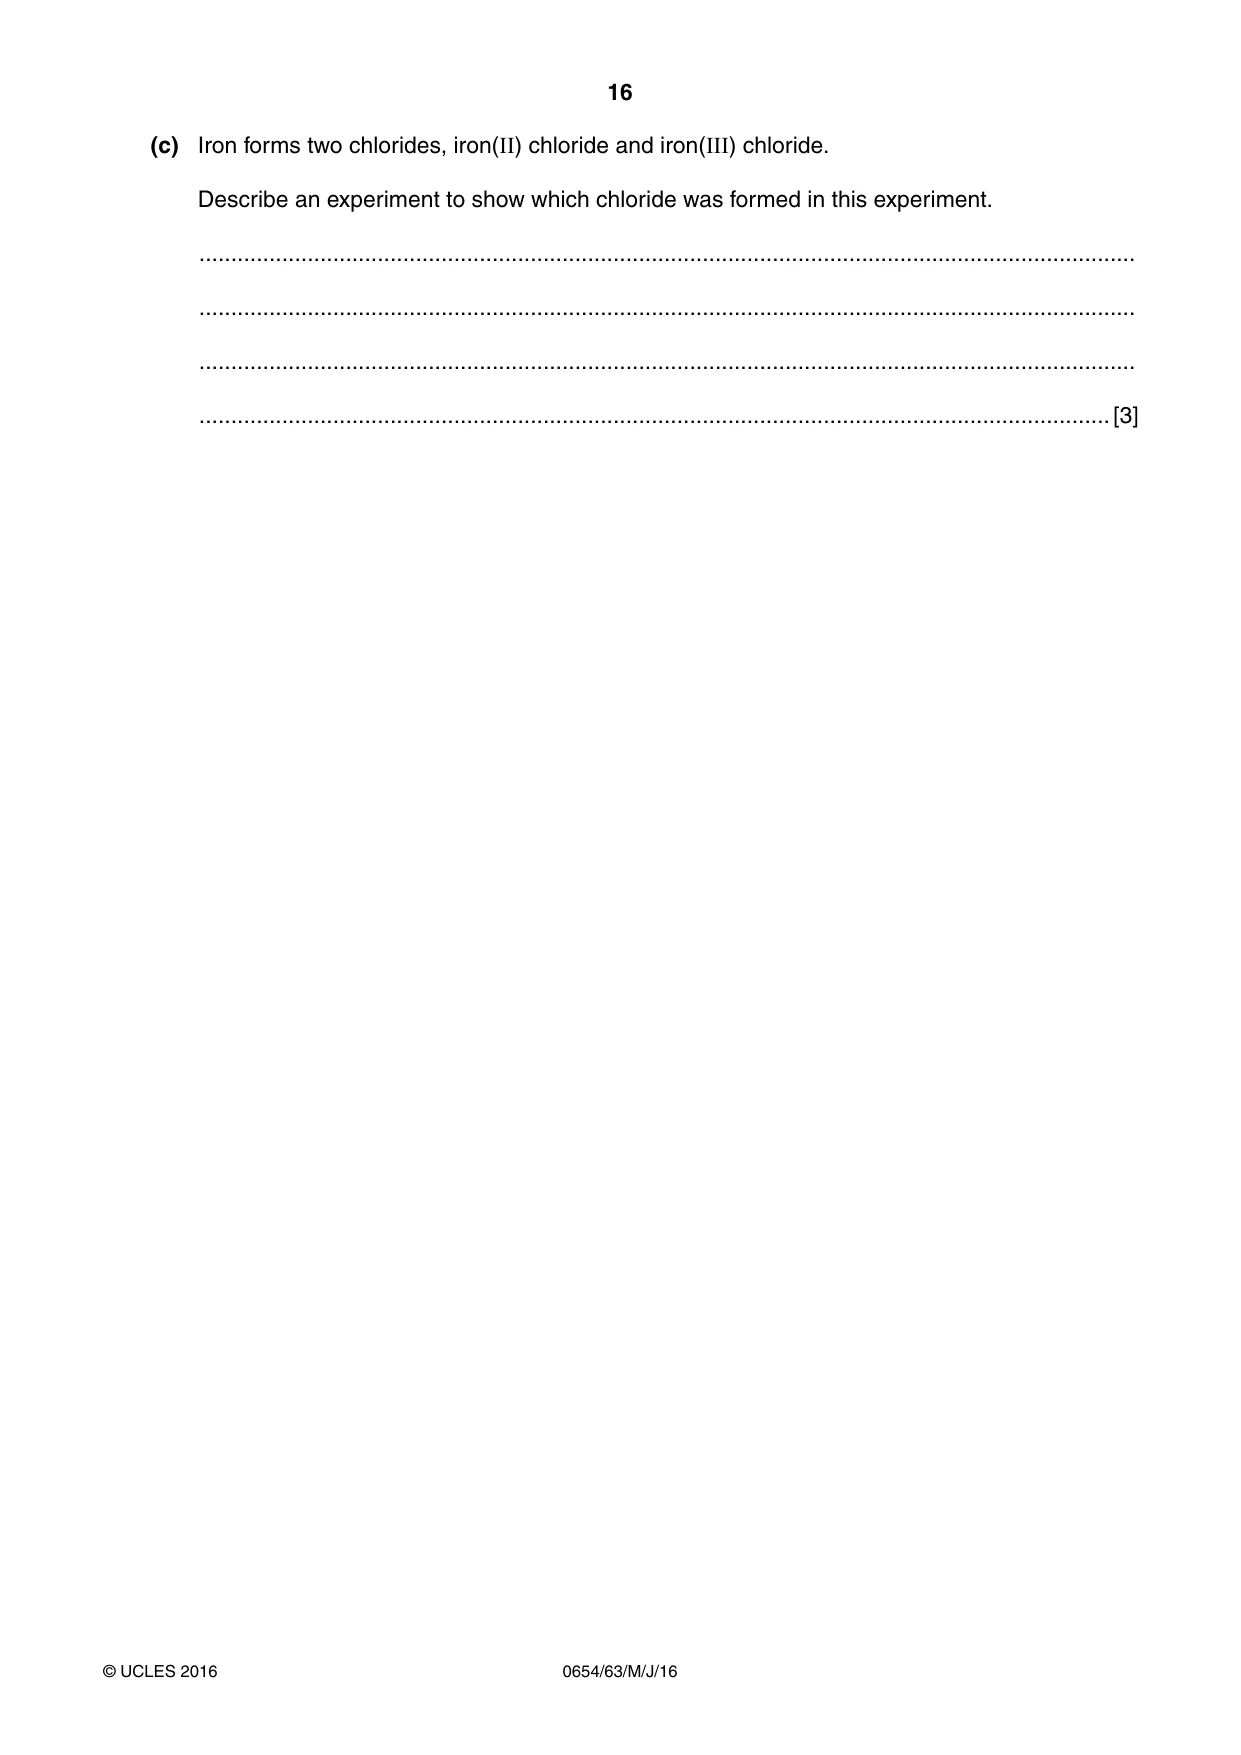
16 0654/63/M/J/16 © UCLES 2016 (c) Iron forms two chlorides, iron(II) chloride and iron(III) chloride. Describe an experiment to show which chloride was formed in this experiment. … … … …[3]
Question paper, page 17
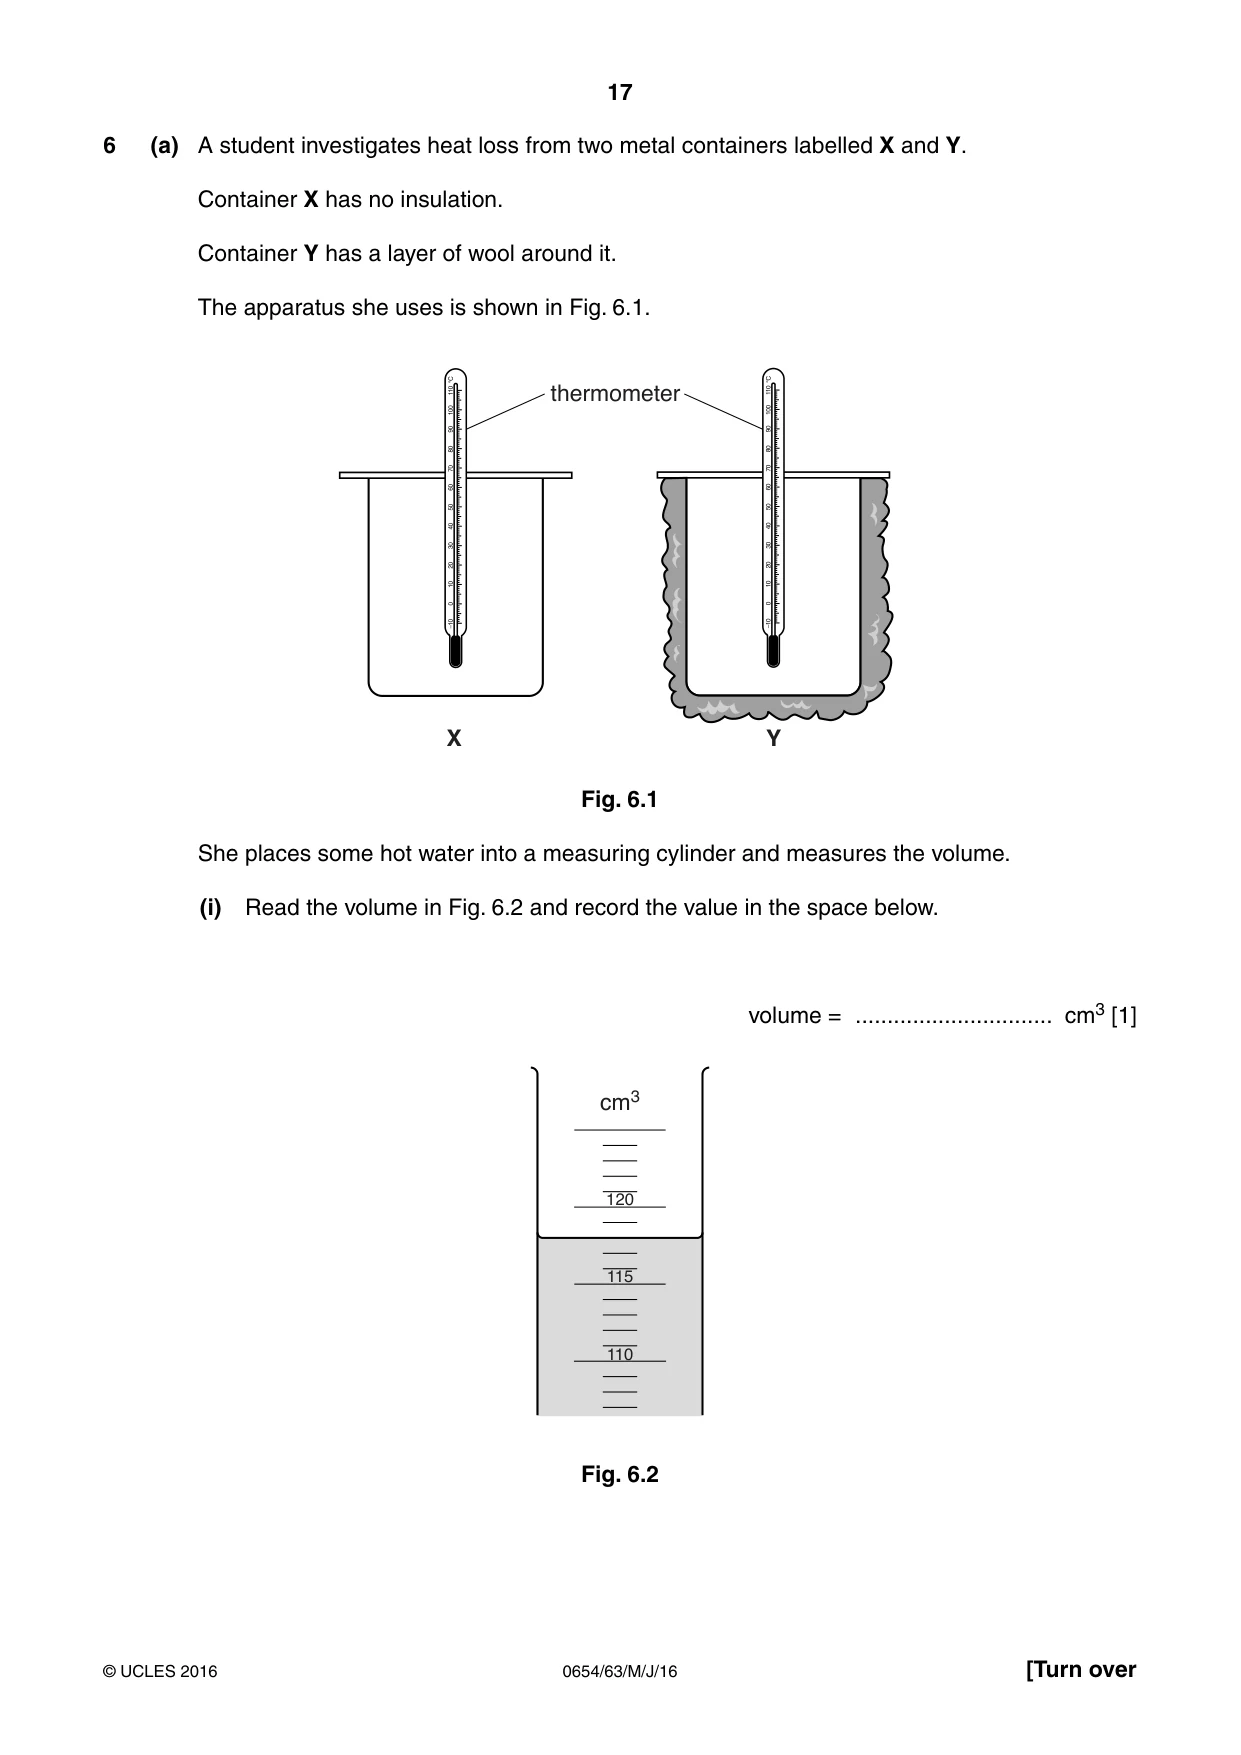
17 0654/63/M/J/16 © UCLES 2016 [Turn over 6 (a) A student investigates heat loss from two metal containers labelled X and Y. Container X has no insulation. Container Y has a layer of wool around it. The apparatus she uses is shown in Fig. 6.1. thermometer X Y Fig. 6.1 She places some hot water into a measuring cylinder and measures the volume. (i) Read the volume in Fig. 6.2 and record the value in the space below. volume = … cm3 [1] 110 115 120 cm3 Fig. 6.2
Question paper, page 18
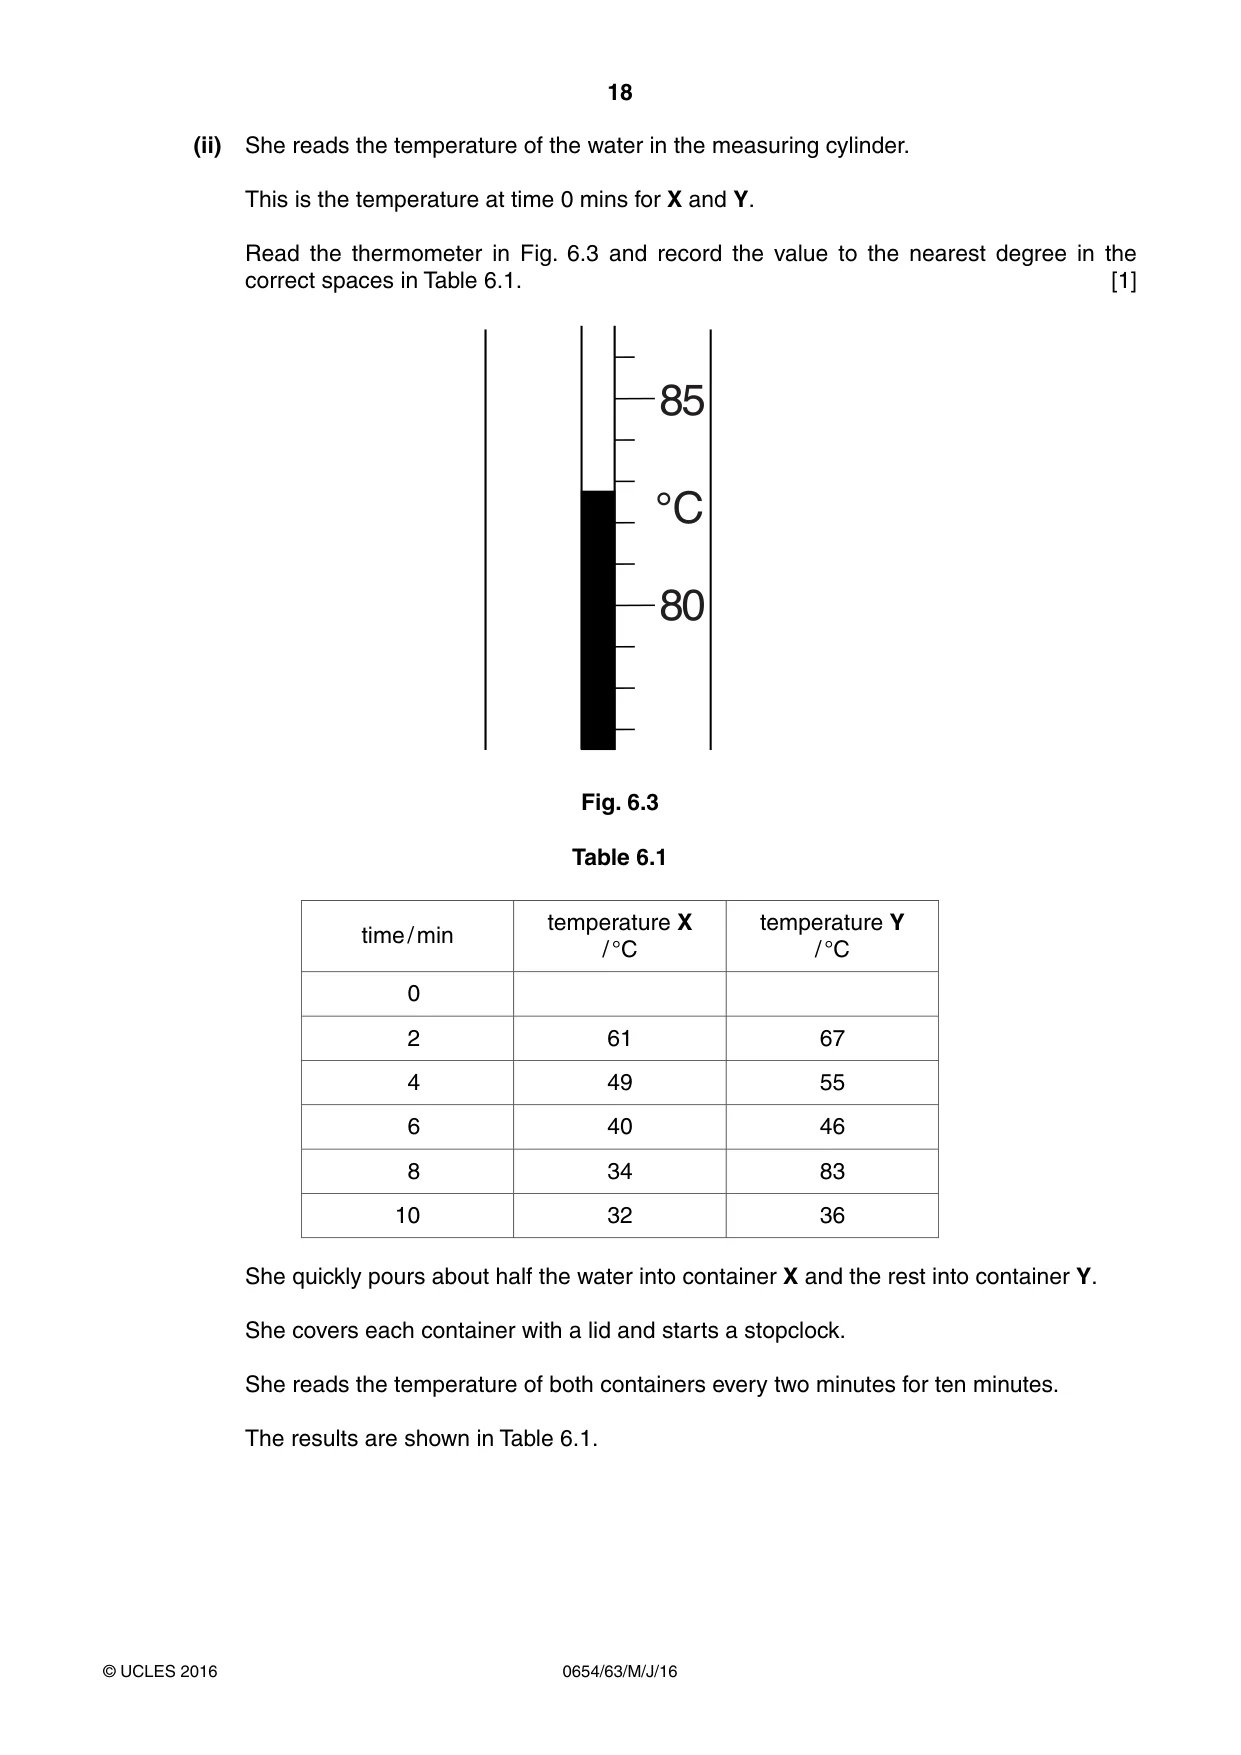
18 0654/63/M/J/16 © UCLES 2016 (ii) She reads the temperature of the water in the measuring cylinder. This is the temperature at time 0 mins for X and Y. Read the thermometer in Fig. 6.3 and record the value to the nearest degree in the correct spaces in Table 6.1. [1] 80 85 °C Fig. 6.3 Table 6.1 time / min temperature X / °C temperature Y / °C 0 2 61 67 4 49 55 6 40 46 8 34 83 10 32 36 She quickly pours about half the water into container X and the rest into container Y. She covers each container with a lid and starts a stopclock. She reads the temperature of both containers every two minutes for ten minutes. The results are shown in Table 6.1.
Question paper, page 19
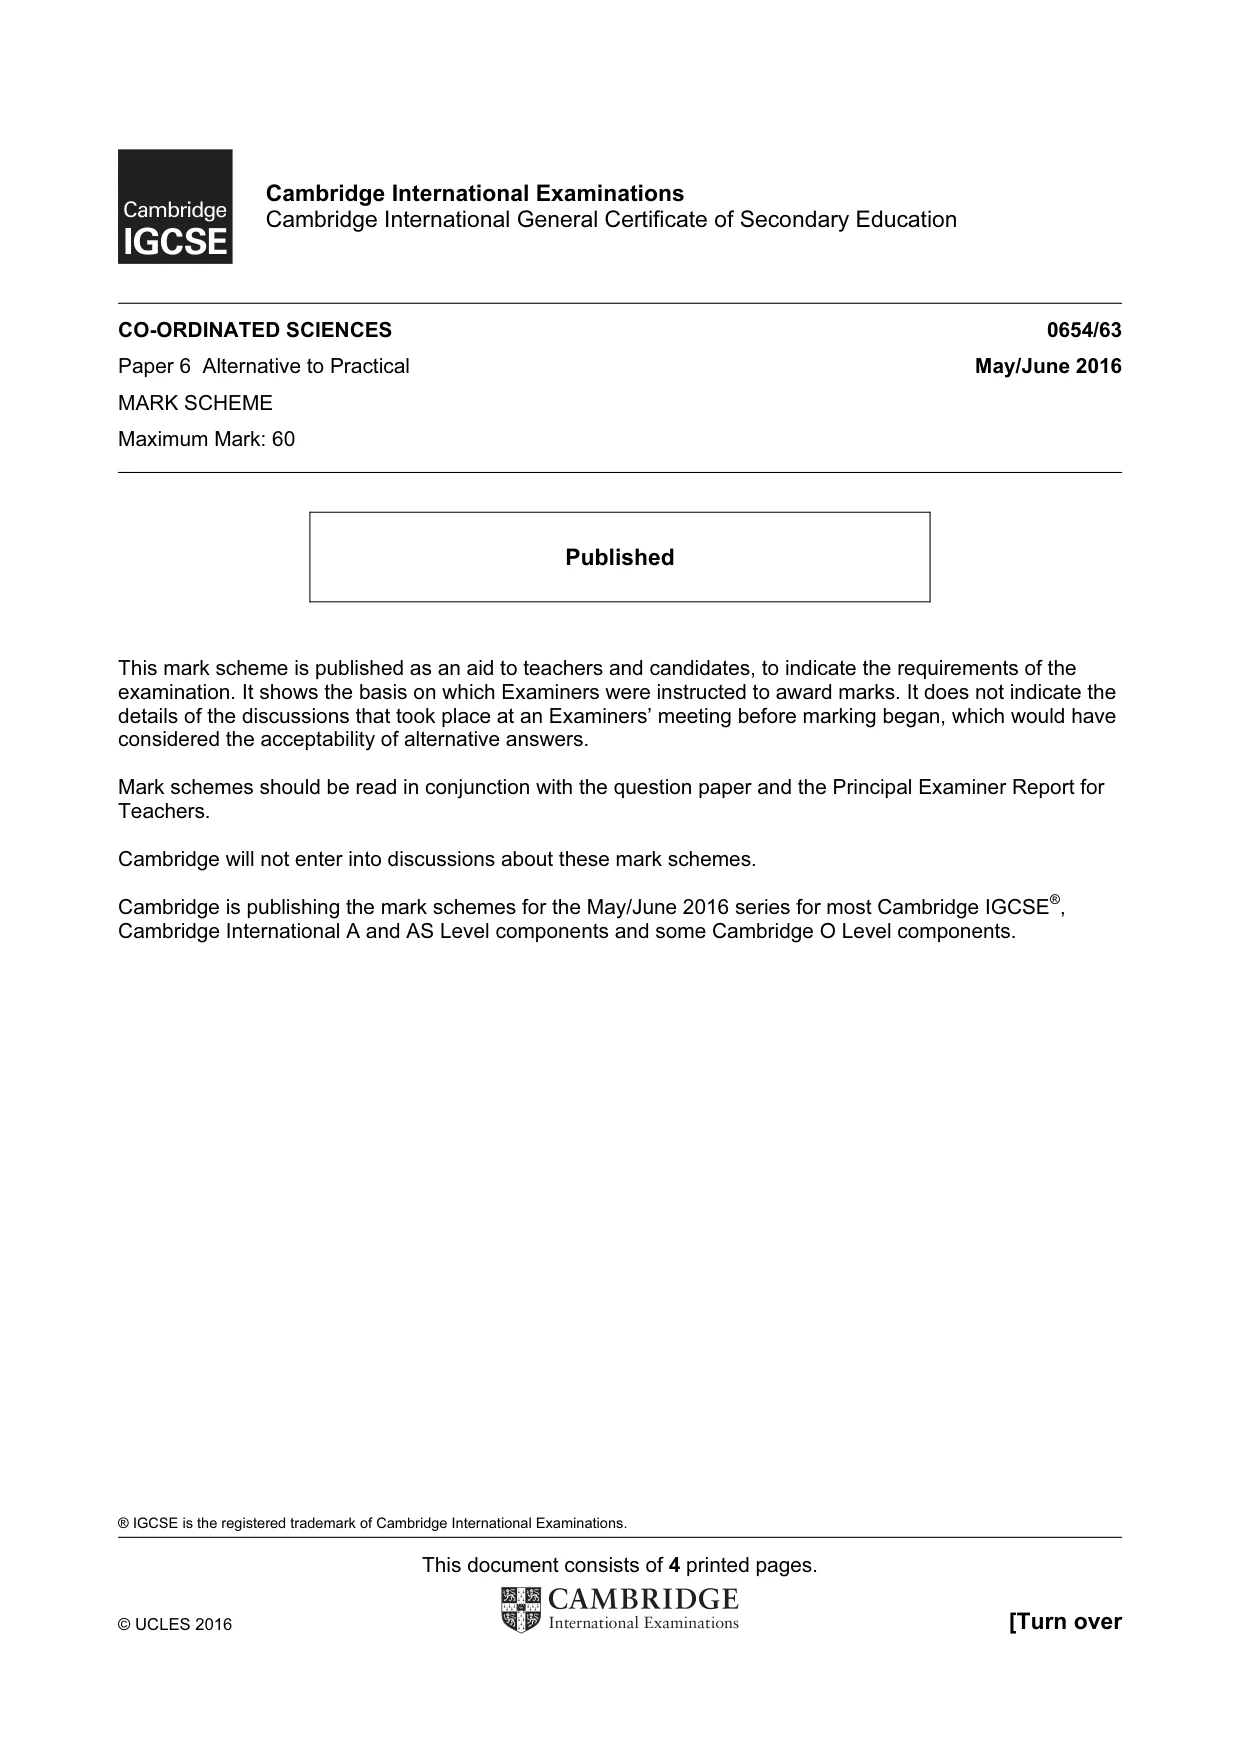
19 0654/63/M/J/16 © UCLES 2016 [Turn over (iii) On the grid provided plot a graph of temperature against time for both containers. Use as much of the grid as possible. Draw best-fit smooth curves and label each line. [4] temperature / °C time / min (iv) Describe one way in which the curves you have drawn for container X and container Y are similar, … … different. … … [2]
Question paper, page 20
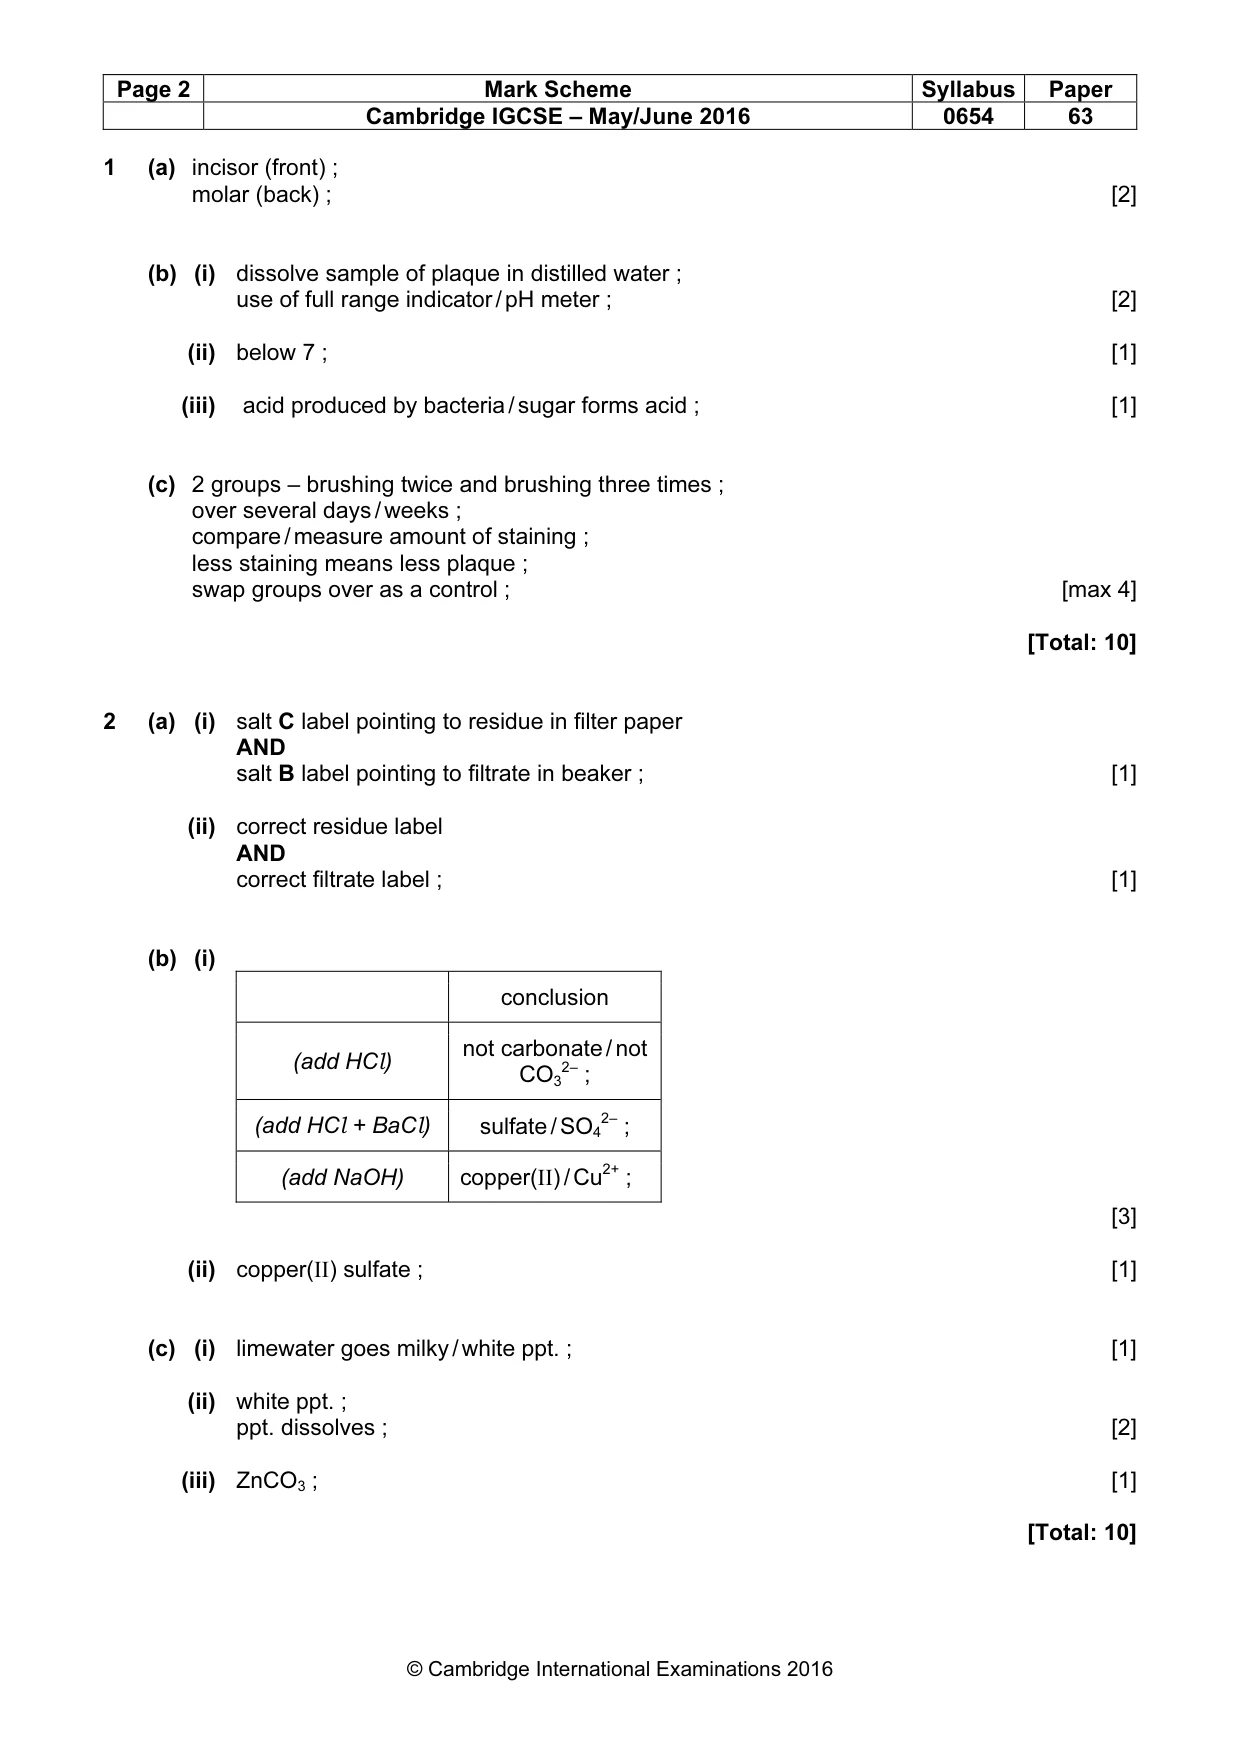
20 0654/63/M/J/16 © UCLES 2016 Permission to reproduce items where third-party owned material protected by copyright is included has been sought and cleared where possible. Every reasonable effort has been made by the publisher (UCLES) to trace copyright holders, but if any items requiring clearance have unwittingly been included, the publisher will be pleased to make amends at the earliest possible opportunity. To avoid the issue of disclosure of answer-related information to candidates, all copyright acknowledgements are reproduced online in the Cambridge International Examinations Copyright Acknowledgements Booklet. This is produced for each series of examinations and is freely available to download at www.cie.org.uk after the live examination series. Cambridge International Examinations is part of the Cambridge Assessment Group. Cambridge Assessment is the brand name of University of Cambridge Local Examinations Syndicate (UCLES), which is itself a department of the University of Cambridge. (b) The teacher states that the experiment with the wool insulation should be repeated. Suggest a reason why. … …[1] (c) The teacher says that the results from this experiment are unreliable. Suggest how the method could be changed to increase the reliability of the results. … …[1]
Mark scheme, page 1
® IGCSE is the registered trademark of Cambridge International Examinations. This document consists of 4 printed pages. © UCLES 2016 [Turn over Cambridge International Examinations Cambridge International General Certificate of Secondary Education CO-ORDINATED SCIENCES 0654/63 Paper 6 Alternative to Practical May/June 2016 MARK SCHEME Maximum Mark: 60 Published This mark scheme is published as an aid to teachers and candidates, to indicate the requirements of the examination. It shows the basis on which Examiners were instructed to award marks. It does not indicate the details of the discussions that took place at an Examiners’ meeting before marking began, which would have considered the acceptability of alternative answers. Mark schemes should be read in conjunction with the question paper and the Principal Examiner Report for Teachers. Cambridge will not enter into discussions about these mark schemes. Cambridge is publishing the mark schemes for the May/June 2016 series for most Cambridge IGCSE®, Cambridge International A and AS Level components and some Cambridge O Level components.
Mark scheme, page 2
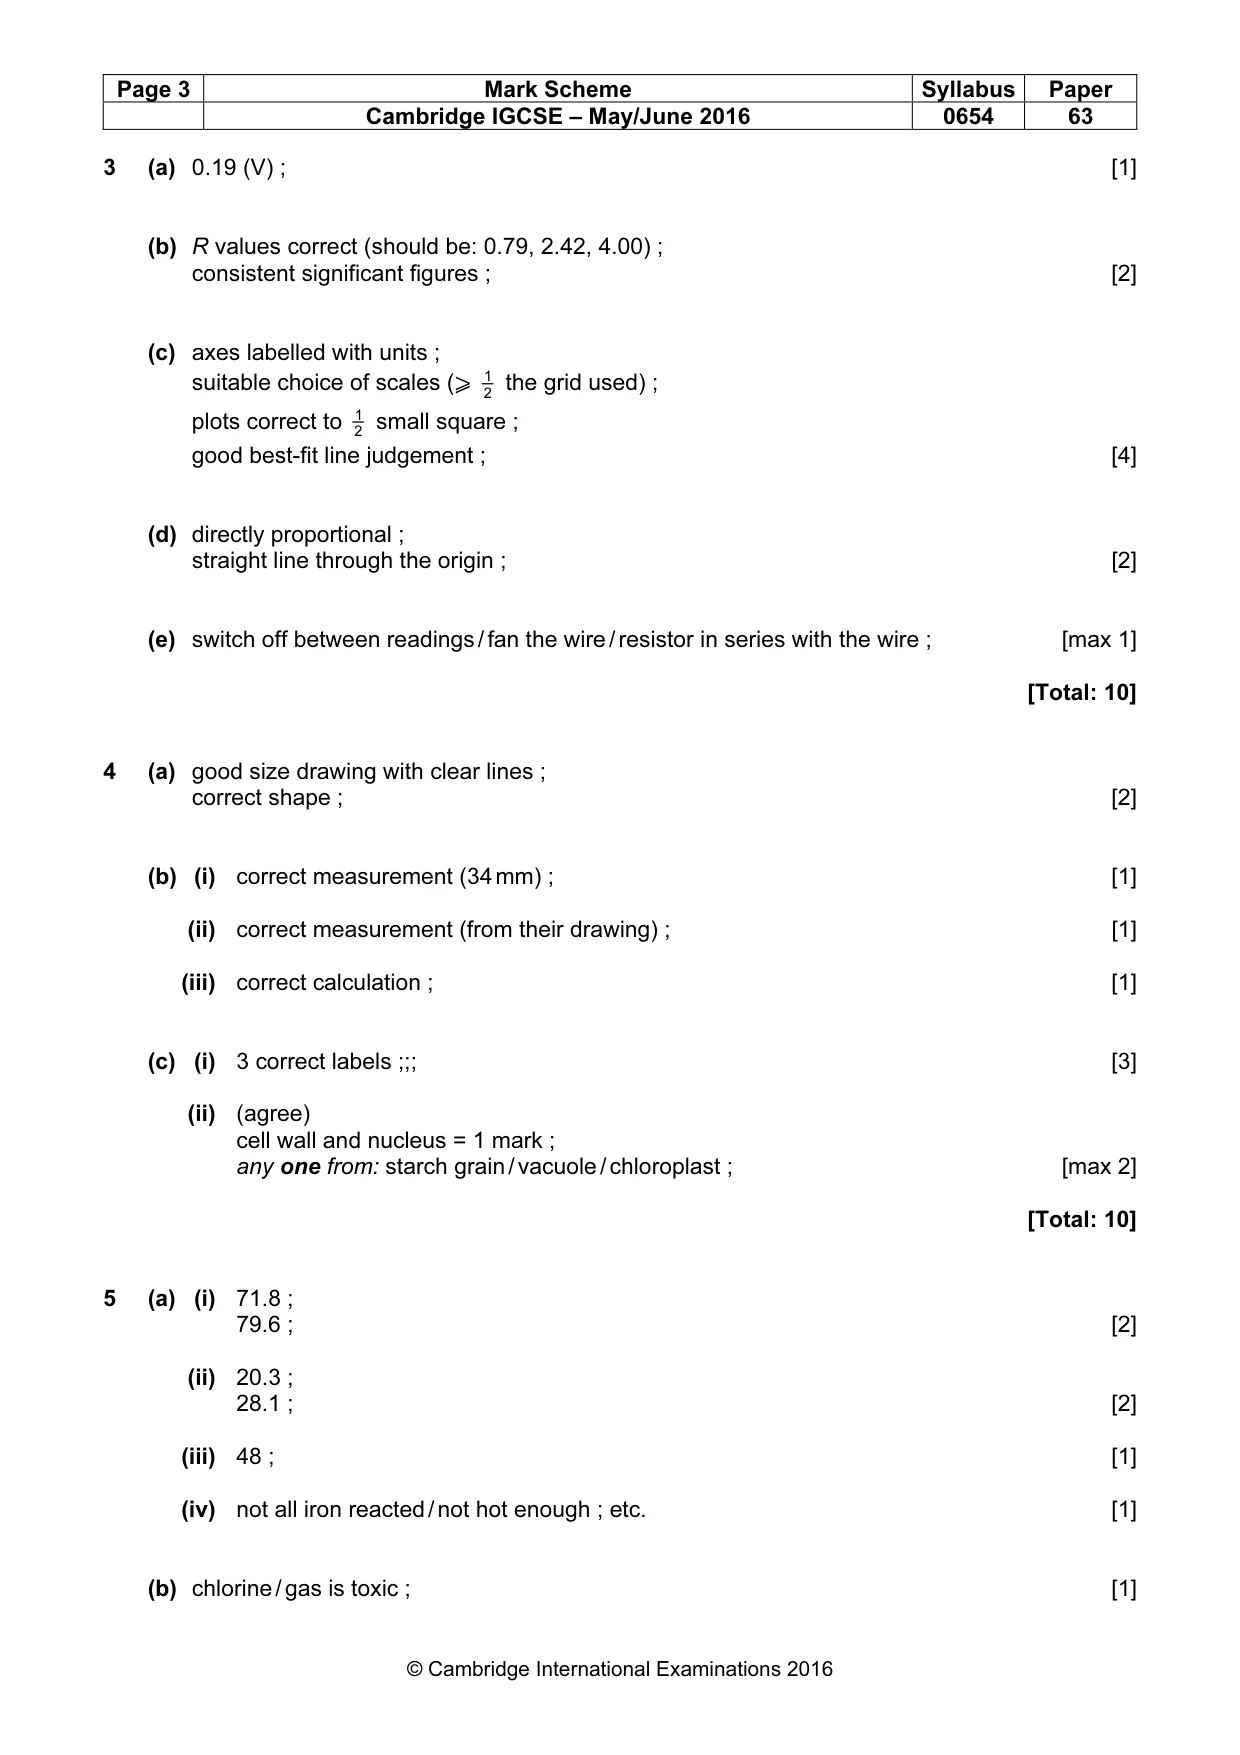
Page 2 Mark Scheme Syllabus Paper Cambridge IGCSE – May/June 2016 0654 63 © Cambridge International Examinations 2016 1 (a) incisor (front) ; molar (back) ; [2] (b) (i) dissolve sample of plaque in distilled water ; use of full range indicator / pH meter ; [2] (ii) below 7 ; [1] (iii) acid produced by bacteria / sugar forms acid ; [1] (c) 2 groups – brushing twice and brushing three times ; over several days / weeks ; compare / measure amount of staining ; less staining means less plaque ; swap groups over as a control ; [max 4] [Total: 10] 2 (a) (i) salt C label pointing to residue in filter paper AND salt B label pointing to filtrate in beaker ; [1] (ii) correct residue label AND correct filtrate label ; [1] (b) (i) conclusion (add HCl) not carbonate / not CO3 2– ; (add HCl + BaCl) sulfate / SO4 2– ; (add NaOH) copper(II) / Cu2+ ; [3] (ii) copper(II) sulfate ; [1] (c) (i) limewater goes milky / white ppt. ; [1] (ii) white ppt. ; ppt. dissolves ; [2] (iii) ZnCO3 ; [1] [Total: 10]
Mark scheme, page 3
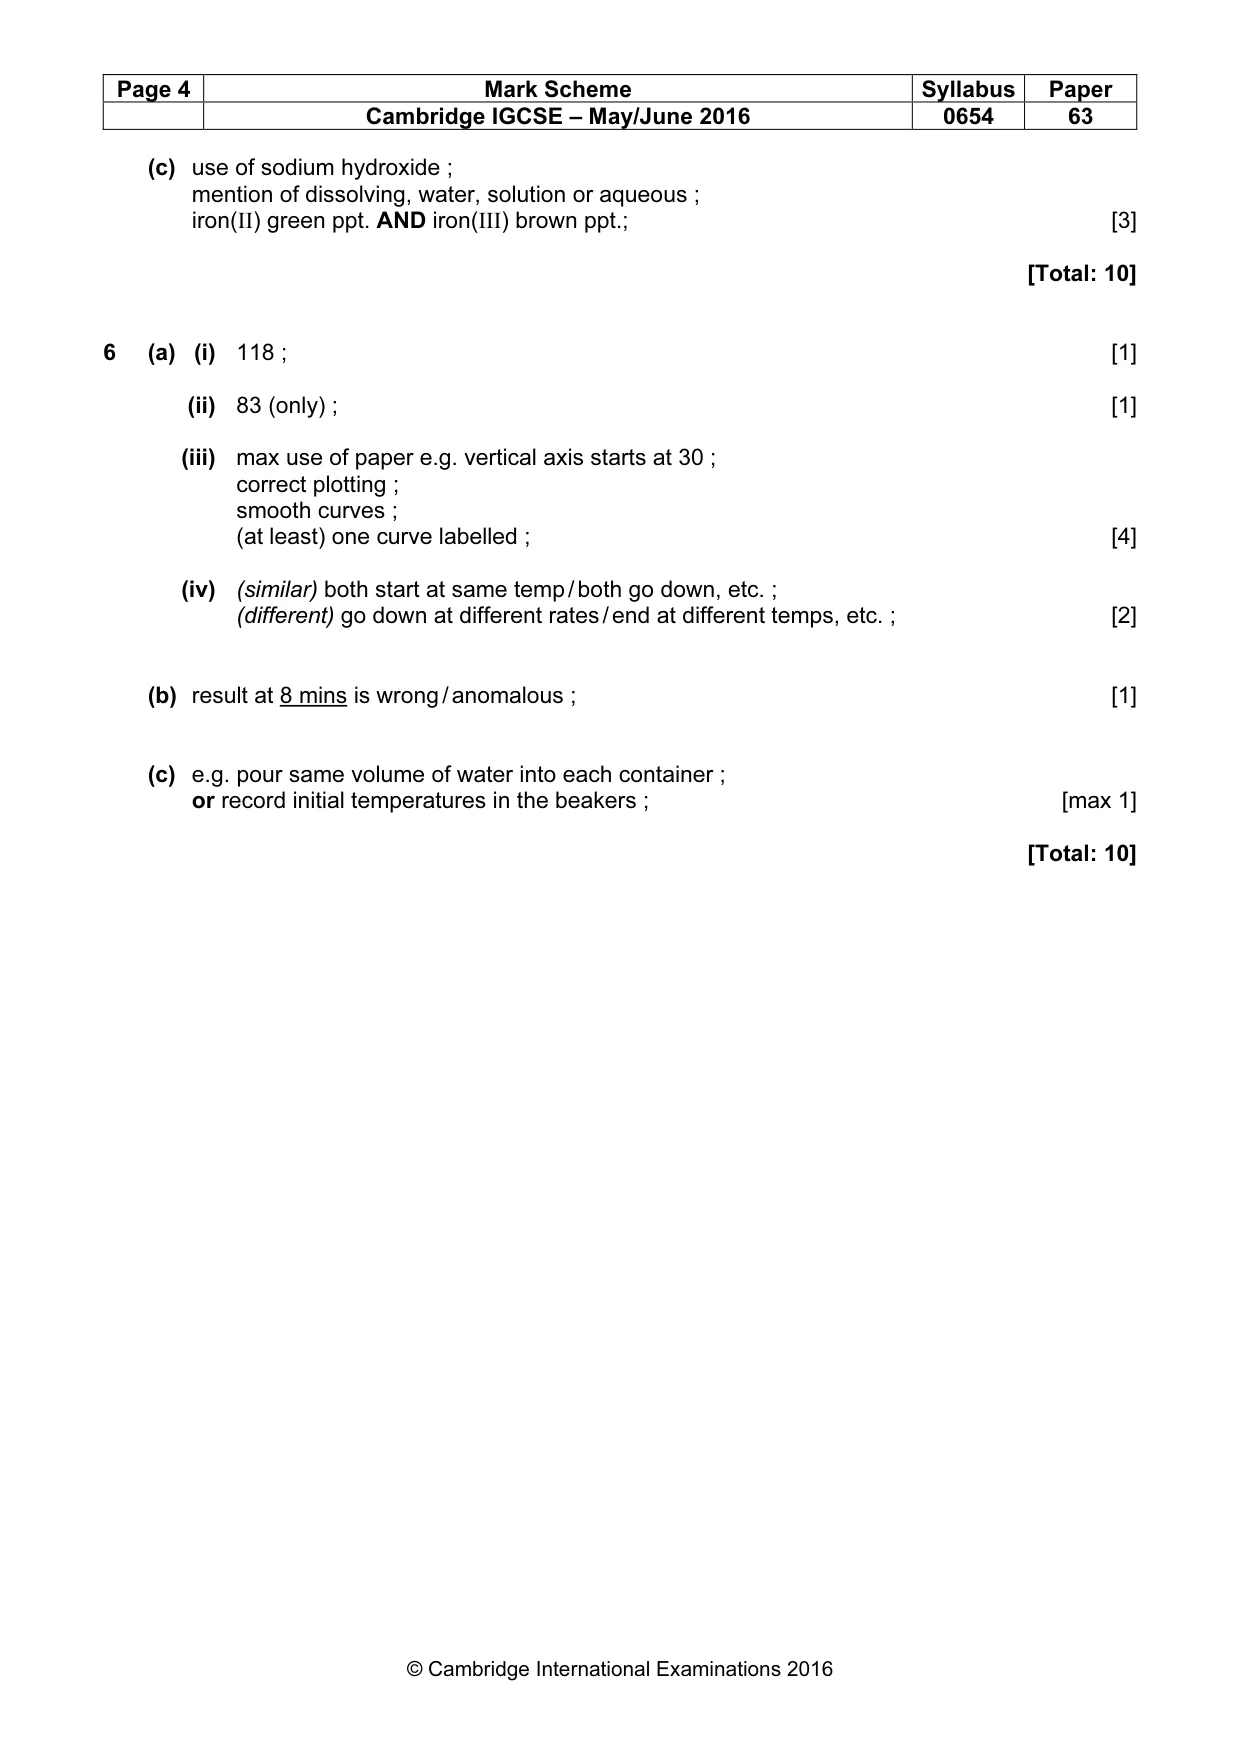
Page 3 Mark Scheme Syllabus Paper Cambridge IGCSE – May/June 2016 0654 63 © Cambridge International Examinations 2016 3 (a) 0.19 (V) ; [1] (b) R values correct (should be: 0.79, 2.42, 4.00) ; consistent significant figures ; [2] (c) axes labelled with units ; suitable choice of scales (⩾ 1 2 the grid used) ; plots correct to 1 2 small square ; good best-fit line judgement ; [4] (d) directly proportional ; straight line through the origin ; [2] (e) switch off between readings / fan the wire / resistor in series with the wire ; [max 1] [Total: 10] 4 (a) good size drawing with clear lines ; correct shape ; [2] (b) (i) correct measurement (34 mm) ; [1] (ii) correct measurement (from their drawing) ; [1] (iii) correct calculation ; [1] (c) (i) 3 correct labels ;;; [3] (ii) (agree) cell wall and nucleus = 1 mark ; any one from: starch grain / vacuole / chloroplast ; [max 2] [Total: 10] 5 (a) (i) 71.8 ; 79.6 ; [2] (ii) 20.3 ; 28.1 ; [2] (iii) 48 ; [1] (iv) not all iron reacted / not hot enough ; etc. [1] (b) chlorine / gas is toxic ; [1]
Mark scheme, page 4
Page 4 Mark Scheme Syllabus Paper Cambridge IGCSE – May/June 2016 0654 63 © Cambridge International Examinations 2016 (c) use of sodium hydroxide ; mention of dissolving, water, solution or aqueous ; iron(II) green ppt. AND iron(III) brown ppt.; [3] [Total: 10] 6 (a) (i) 118 ; [1] (ii) 83 (only) ; [1] (iii) max use of paper e.g. vertical axis starts at 30 ; correct plotting ; smooth curves ; (at least) one curve labelled ; [4] (iv) (similar) both start at same temp / both go down, etc. ; (different) go down at different rates / end at different temps, etc. ; [2] (b) result at 8 mins is wrong / anomalous ; [1] (c) e.g. pour same volume of water into each container ; or record initial temperatures in the beakers ; [max 1] [Total: 10]
What you needed in this session
Cambridge’s own grade thresholds for 2016 May/June, Paper 6 · Variant 3. A higher threshold means an easier paper — the bar moves with how the cohort did.