Cambridge IGCSE Science - Combined 0653 — 2022 May/June Paper 6 · Variant 1
0653/61/M/J/22 · 4 questions · 40 marks · ≈45 min
The question paper and its mark scheme, free to read here and free to download. This is Cambridge’s own paper, exactly as it was sat.
Question paper16 pages



Mark scheme9 pages
Answers below. Sit the paper first if you are practising.
Questions as text
Q1 · A student investigates the effect of ethanol on cell membranes
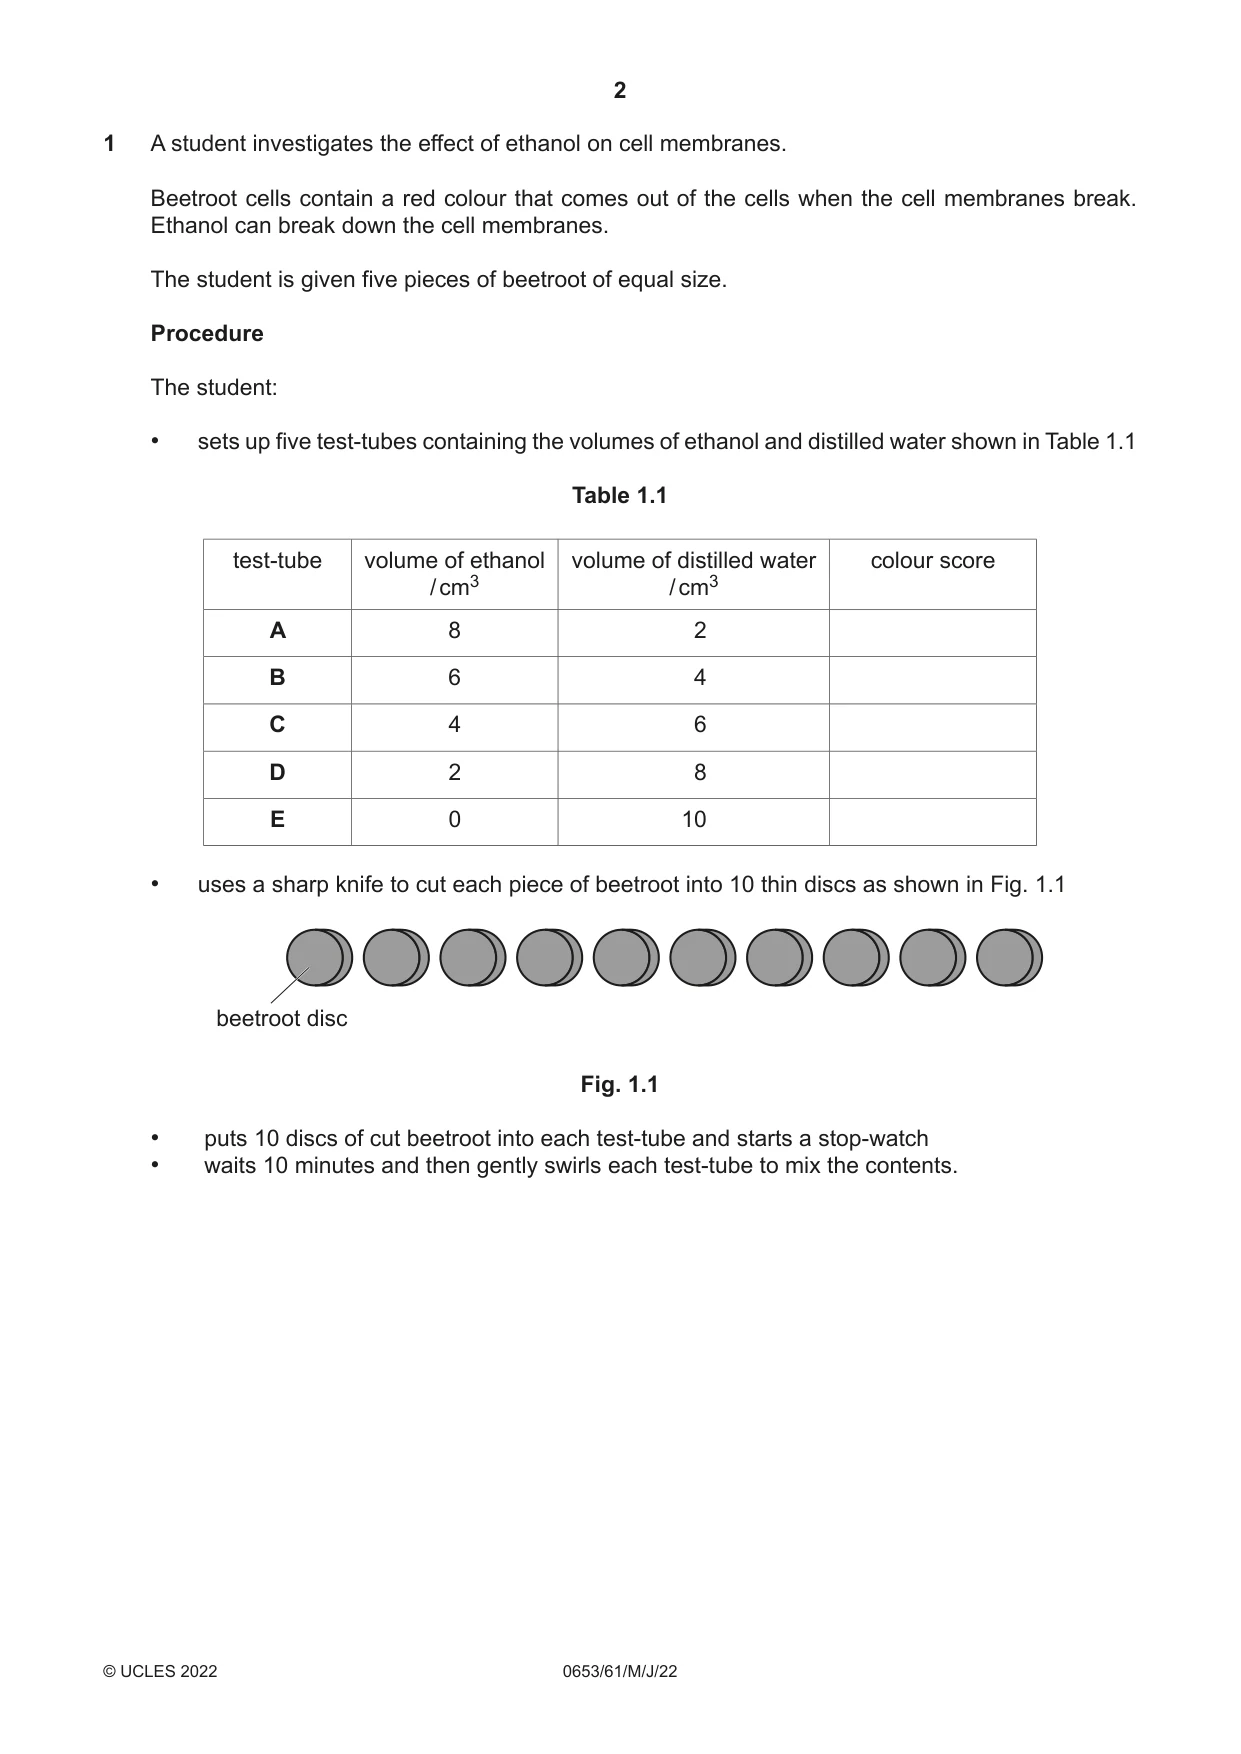
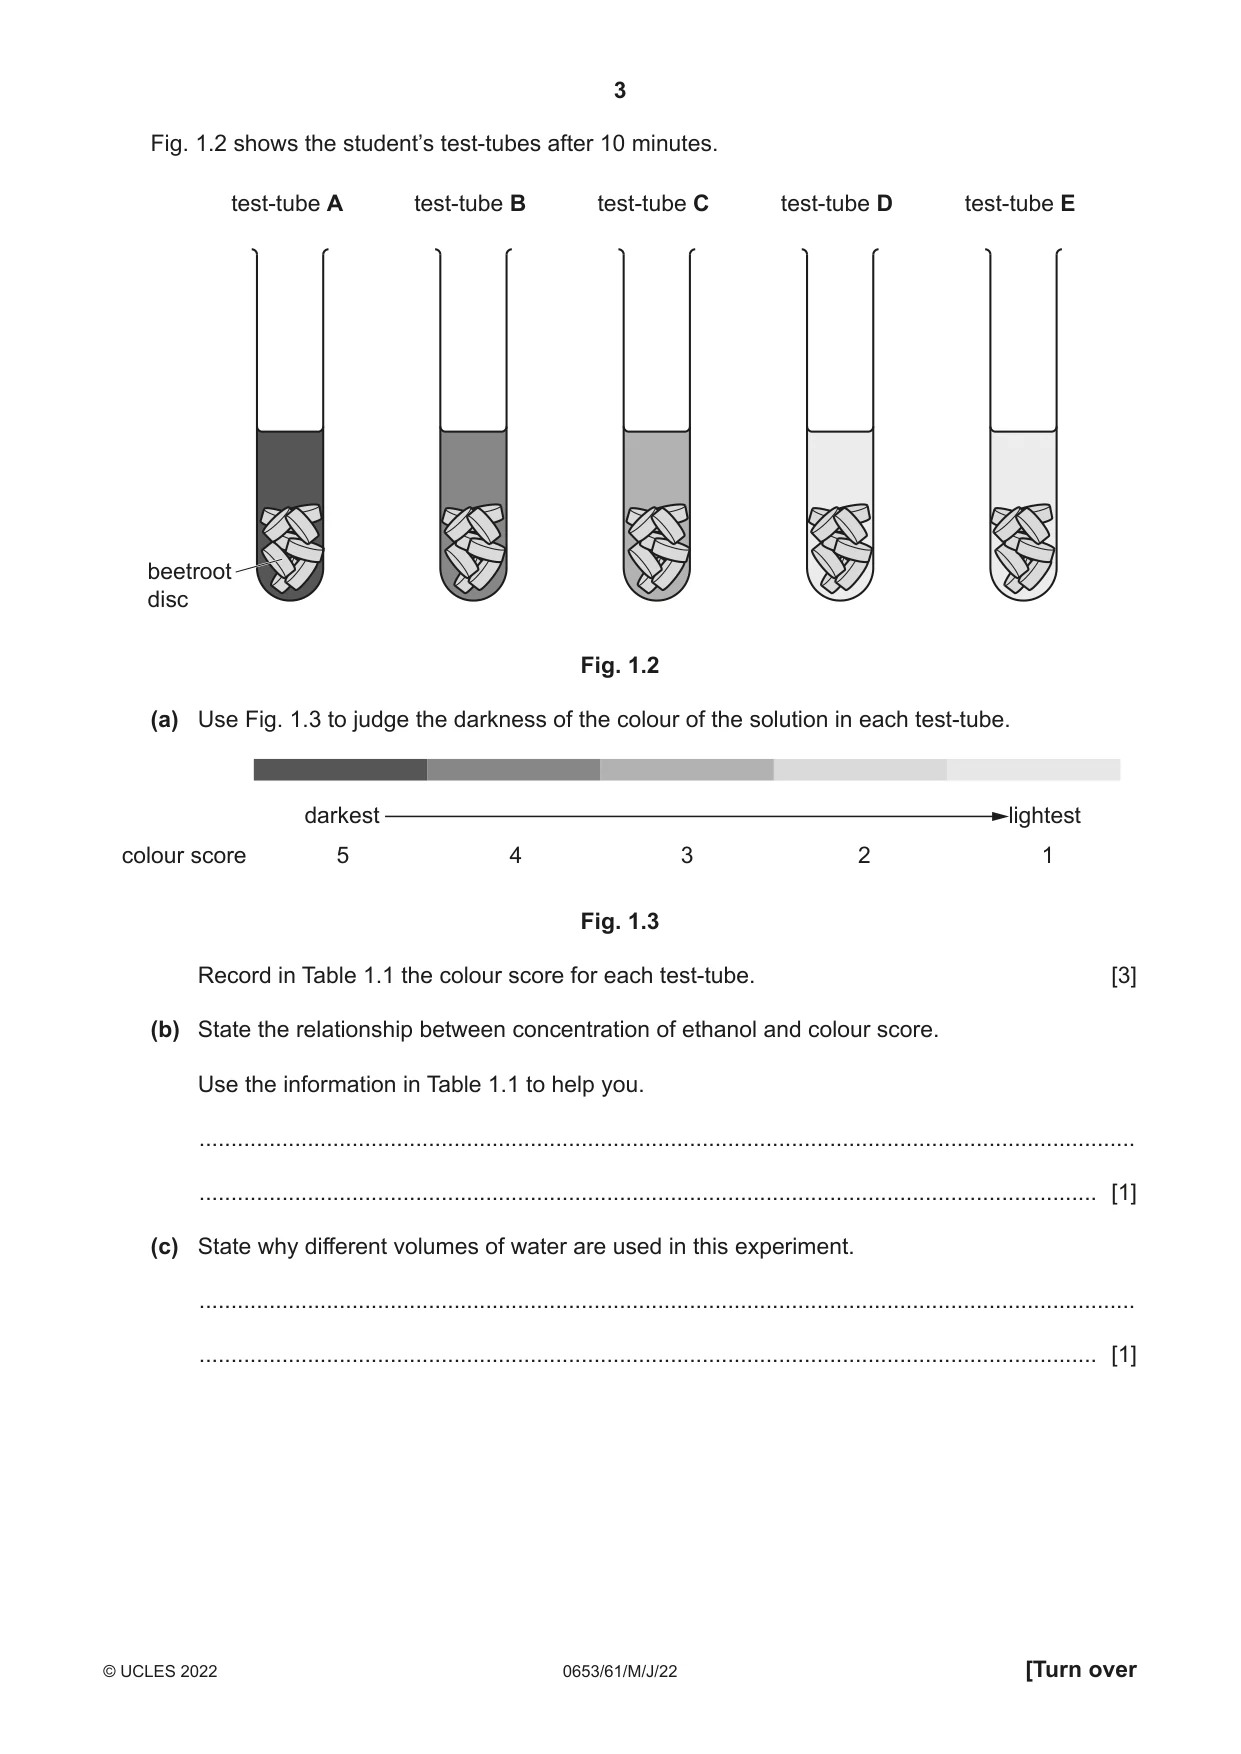
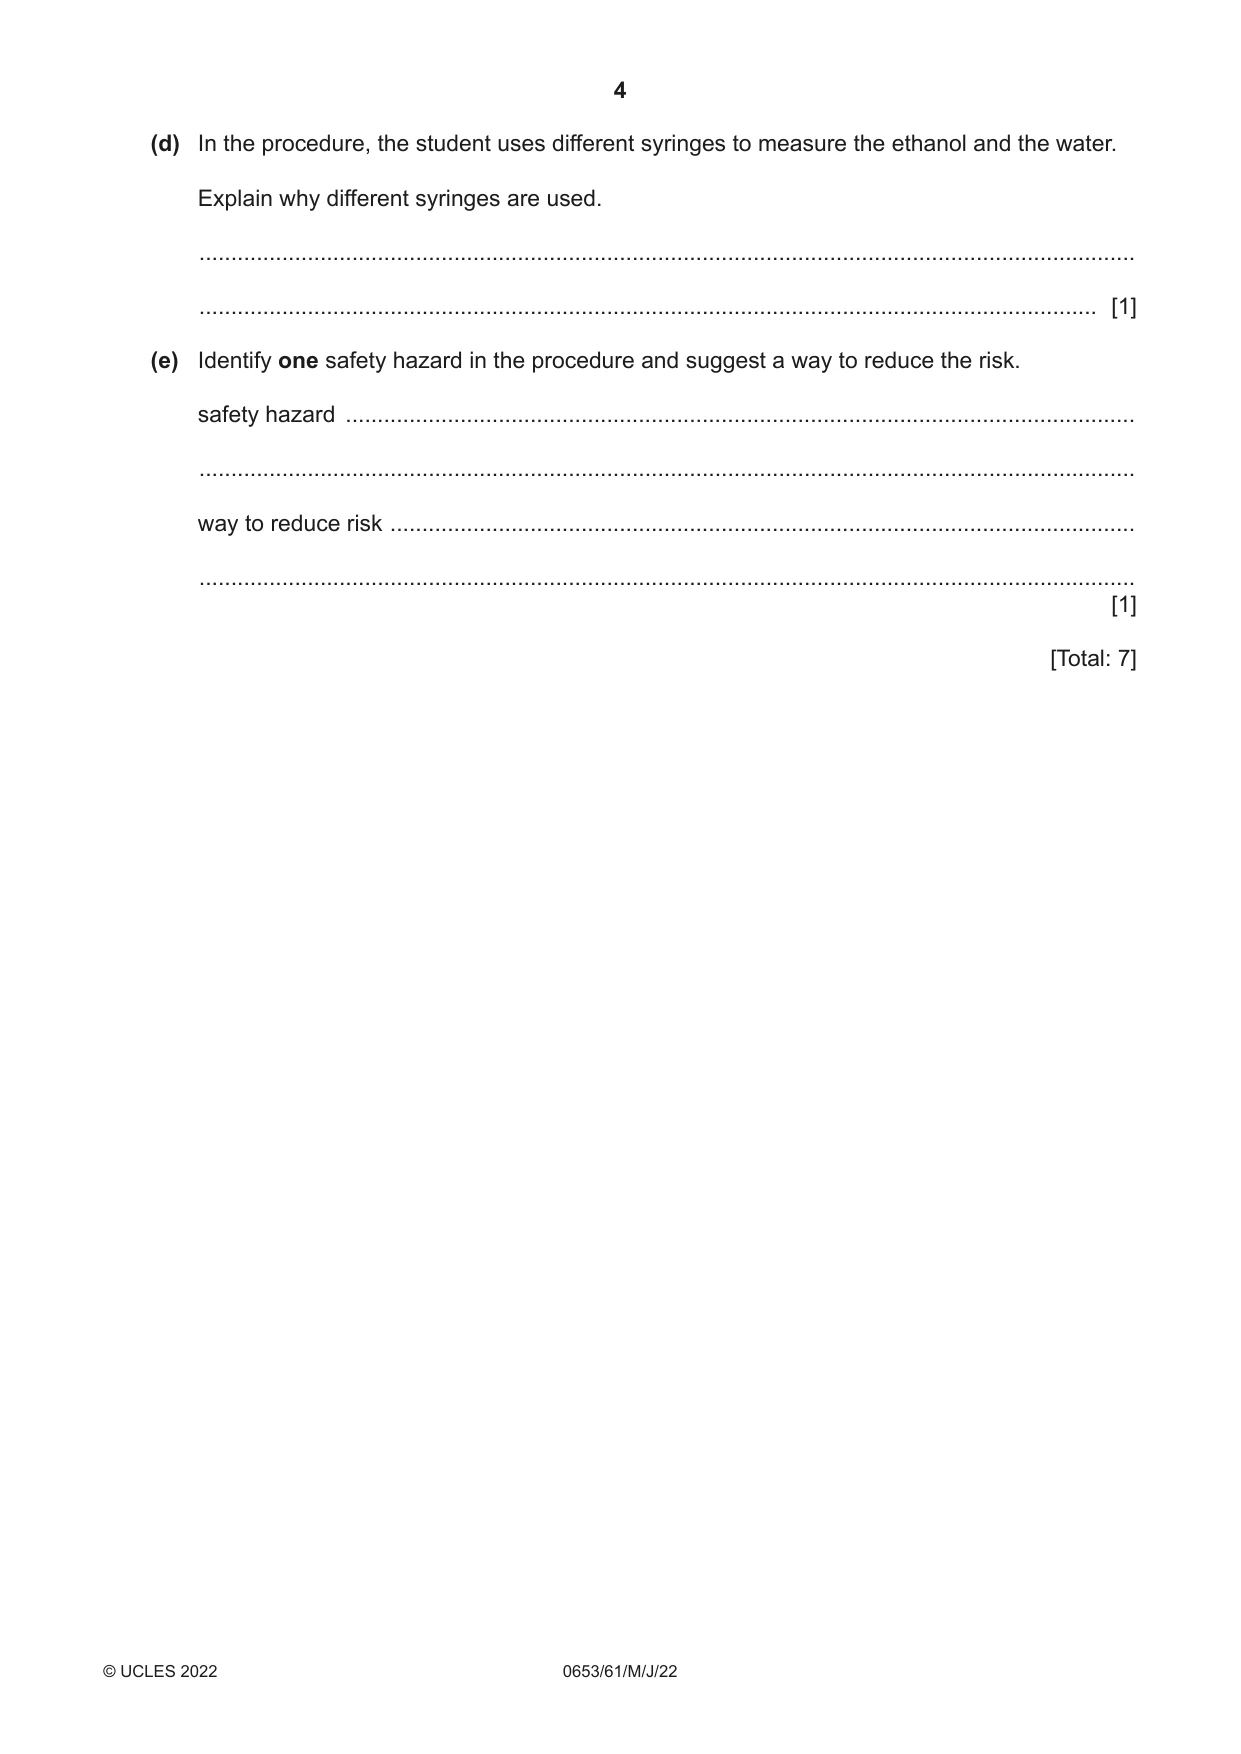
1 A student investigates the effect of ethanol on cell membranes. Beetroot cells contain a red colour that comes out of the cells when the cell membranes break. Ethanol can break down the cell membranes. The student is given five pieces of beetroot of equal size. Procedure The student: • sets up five test-tubes containing the volumes of ethanol and distilled water shown in Table 1.1 Table 1.1 test-tube volume of ethanol volume of distilled water colour score / cm3 / cm3 A 8 2 B 6 4 C 4 6 D 2 8 E 0 10 • uses a sharp knife to cut each piece of beetroot into 10 thin discs as shown in Fig. 1.1 beetroot disc Fig. 1.1 • puts 10 discs of cut beetroot into each test-tube and starts a stop-watch • waits 10 minutes and then gently swirls each test-tube to mix the contents. Fig. 1.2 shows the student’s test-tubes after 10 minutes. test-tube A test-tube B test-tube C test-tube D test-tube E beetroot disc Fig. 1.2 (a) Use Fig. 1.3 to judge the darkness of the colour of the solution in each test-tube. darkest lightest colour score 5 4 3 2 1 Fig. 1.3 Record in Table 1.1 the colour score for each test-tube. [3] (b) State the relationship between concentration of ethanol and colour score. Use the information in Table 1.1 to help you. ................................................................................................................................................... ............................................................................................................................................. [1] (c) State why different volumes of water are used in this experiment. ................................................................................................................................................... ............................................................................................................................................. [1] (d) In the procedure, the student uses different syringes to measure the ethanol and the water. Explain why different syringes are used. ................................................................................................................................................... ............................................................................................................................................. [1] (e) Identify one safety hazard in the procedure and suggest a way to reduce the risk. safety hazard ............................................................................................................................ ................................................................................................................................................... way to reduce risk ..................................................................................................................... ................................................................................................................................................... [1] [Total: 7]
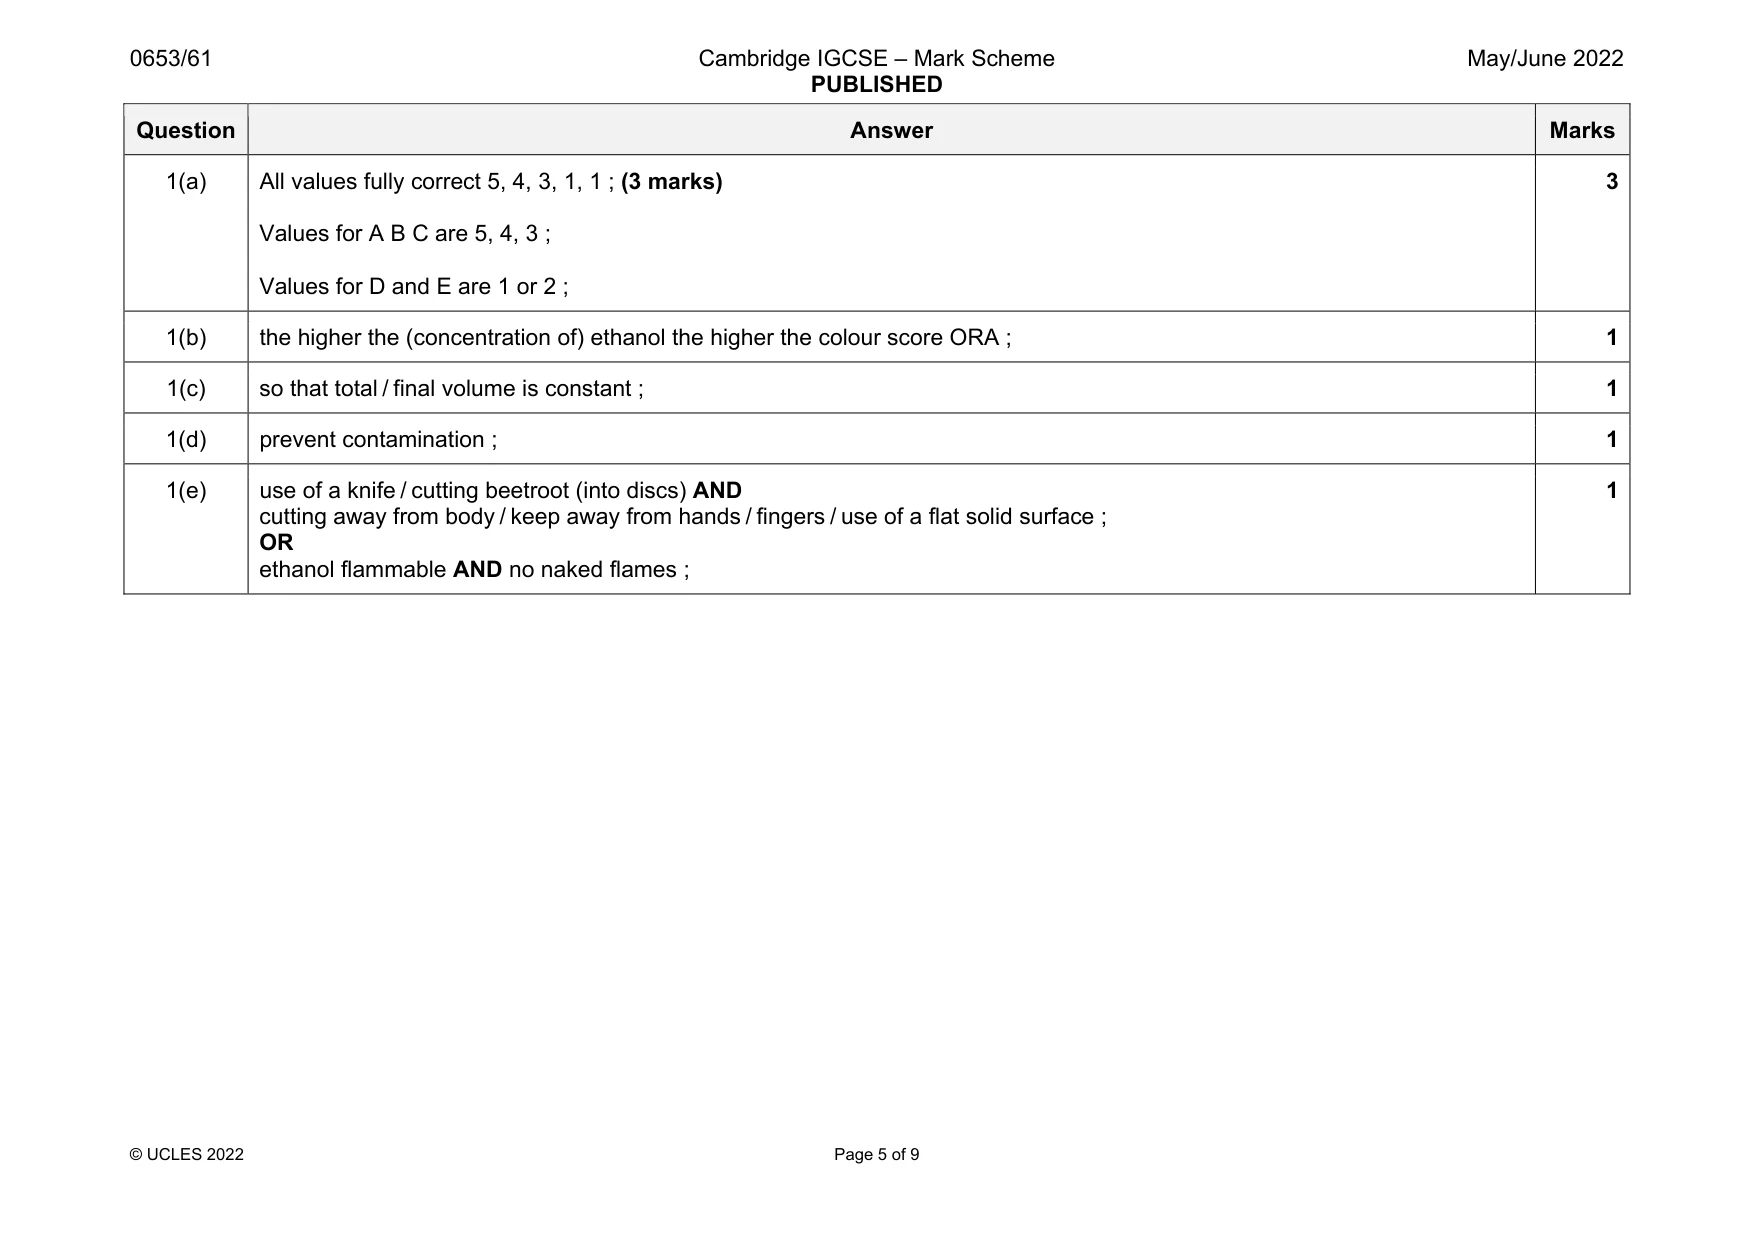
Mark scheme: 1(a) All values fully correct 5, 4, 3, 1, 1 ; (3 marks) Values for A B C are 5, 4, 3 ; Values for D and E are 1 or 2 ; 3 1(b) the higher the (concentration of) ethanol the higher the colour score ORA ; 1 1(c) so that total / final volume is constant ; 1 1(d) prevent contamination ; 1 1(e) use of a knife / cutting beetroot (into discs) AND cutting away from body / keep away from hands / fingers / use of a flat solid surface ; OR ethanol flammable AND no naked flames ; 1
Q2 · Photosynthesis takes place in aquatic plants (plants that live in water)
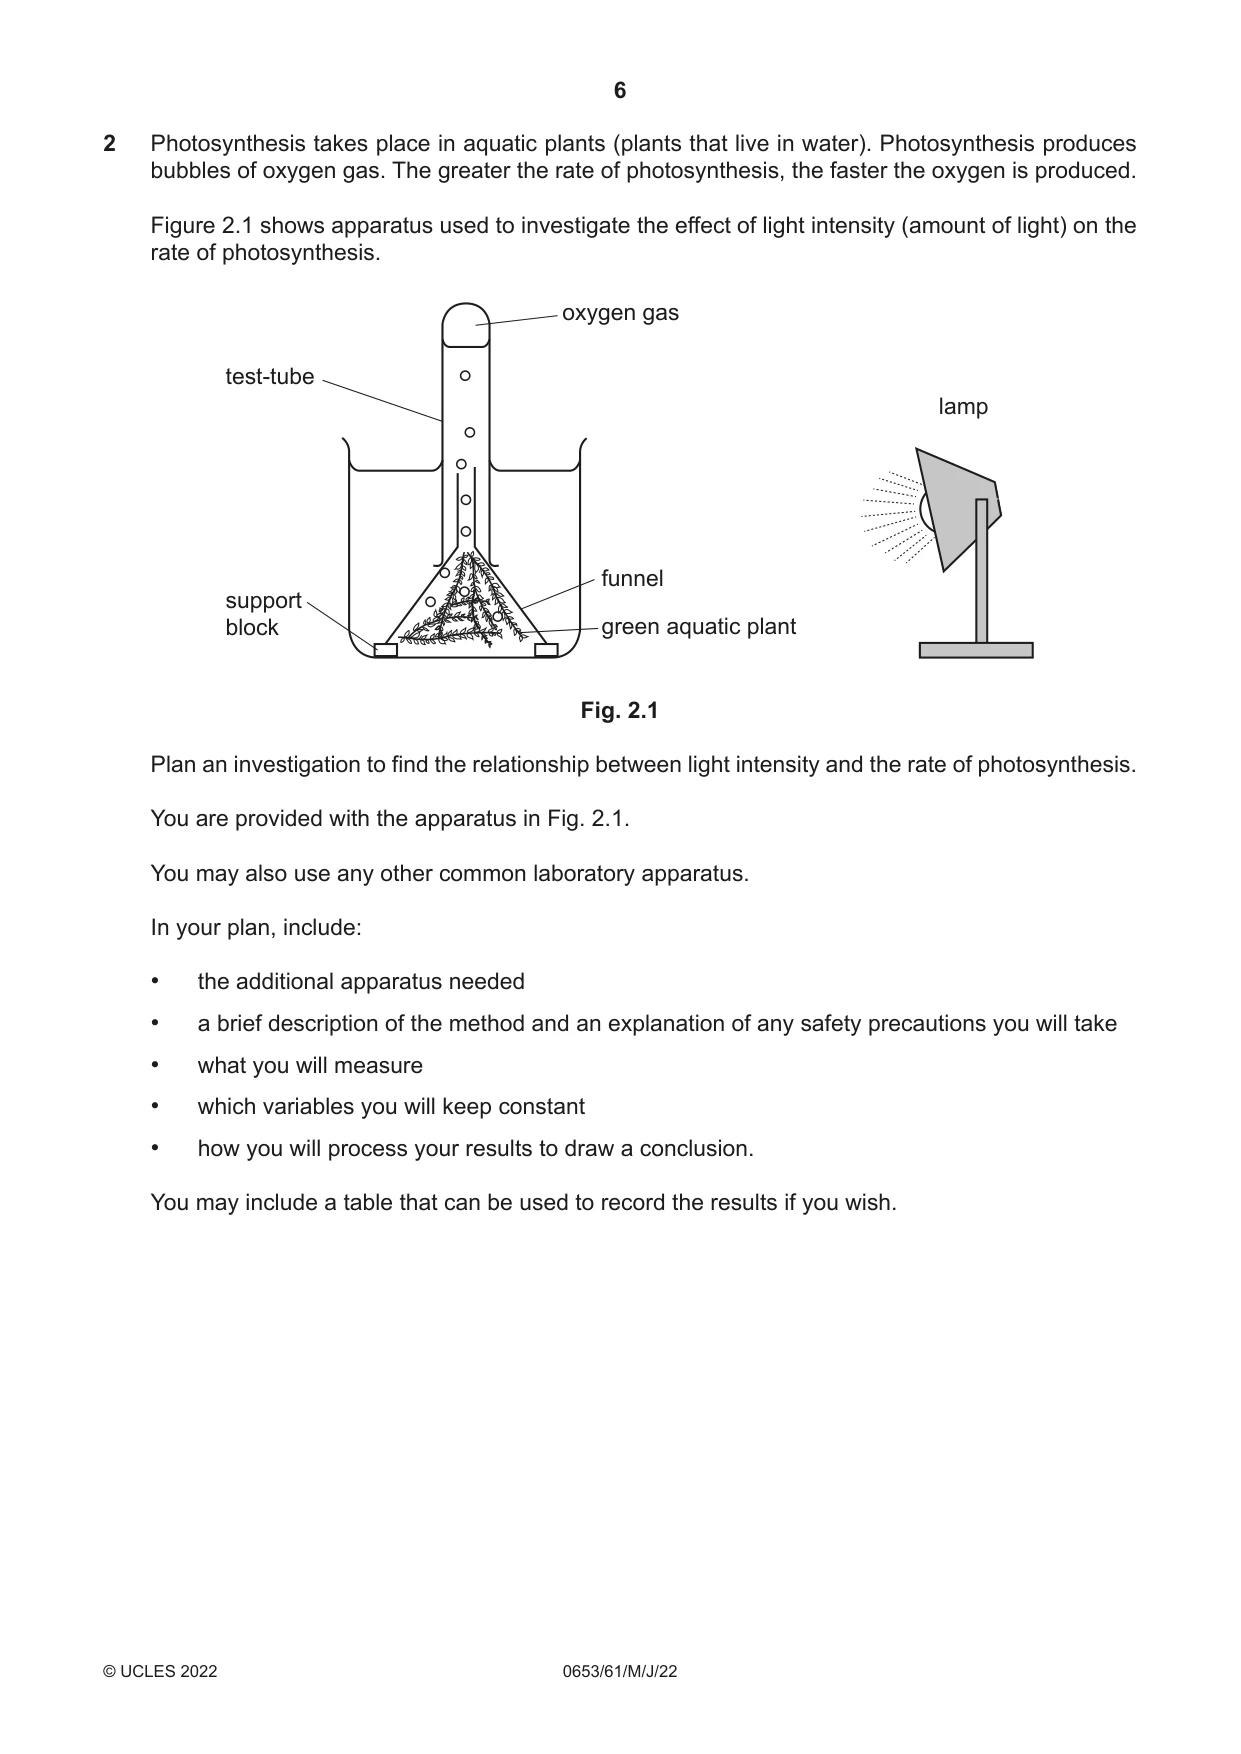
2 Photosynthesis takes place in aquatic plants (plants that live in water). Photosynthesis produces bubbles of oxygen gas. The greater the rate of photosynthesis, the faster the oxygen is produced. Figure 2.1 shows apparatus used to investigate the effect of light intensity (amount of light) on the rate of photosynthesis. oxygen gas test-tube lamp funnel support block green aquatic plant Fig. 2.1 Plan an investigation to find the relationship between light intensity and the rate of photosynthesis. You are provided with the apparatus in Fig. 2.1. You may also use any other common laboratory apparatus. In your plan, include: • the additional apparatus needed • a brief description of the method and an explanation of any safety precautions you will take • what you will measure • which variables you will keep constant • how you will process your results to draw a conclusion. You may include a table that can be used to record the results if you wish. .......................................................................................................................................................... .......................................................................................................................................................... .......................................................................................................................................................... .......................................................................................................................................................... .......................................................................................................................................................... .......................................................................................................................................................... .......................................................................................................................................................... .......................................................................................................................................................... .......................................................................................................................................................... .......................................................................................................................................................... .......................................................................................................................................................... .......................................................................................................................................................... .......................................................................................................................................................... .................................................................................................................................................... [7]
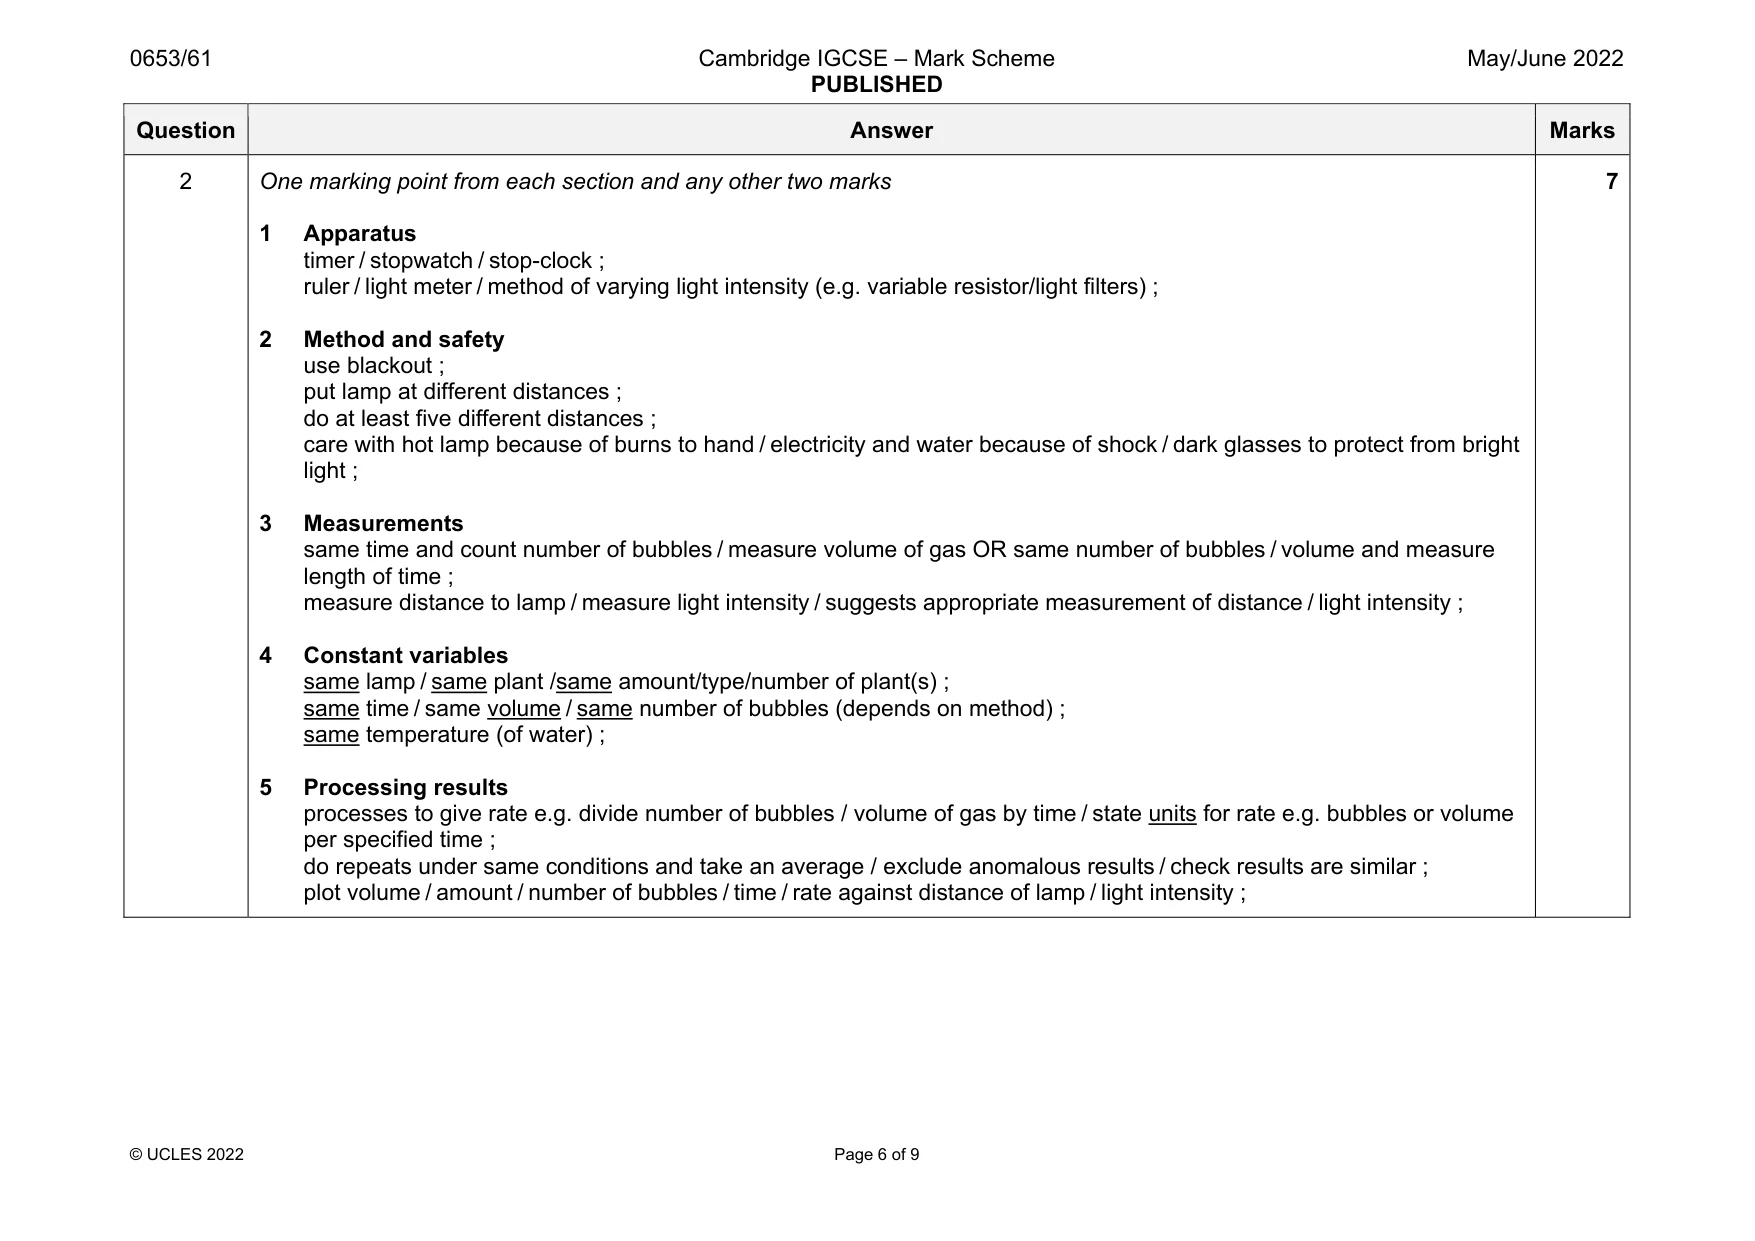
Mark scheme: 2 One marking point from each section and any other two marks 1 Apparatus timer / stopwatch / stop-clock ; ruler / light meter / method of varying light intensity (e.g. variable resistor/light filters) ; 2 Method and safety use blackout ; put lamp at different distances ; do at least five different distances ; care with hot lamp because of burns to hand / electricity and water because of shock / dark glasses to protect from bright light ; 3 Measurements same time and count number of bubbles / measure volume of gas OR same number of bubbles / volume and measure length of time ; measure distance to lamp / measure light intensity / suggests appropriate measurement of distance / light intensity ; 4 Constant variables same lamp / same plant /same amount/type/number of plant(s) ; same time / same volume / same number of bubbles (depends on method) ; same temperature (of water) ; 5 Processing results processes to give rate e.g. divide number of bubbles / volume of gas by time / state units for rate e.g. bubbles or volume per specified time ; do repeats under same conditions and take an average / exclude anomalous results / check results are similar ; plot volume / amount / number of bubbles / time / rate against distance of lamp / light intensity ; 7
Q3 · A student investigates some reactions of dilute sulfuric acid
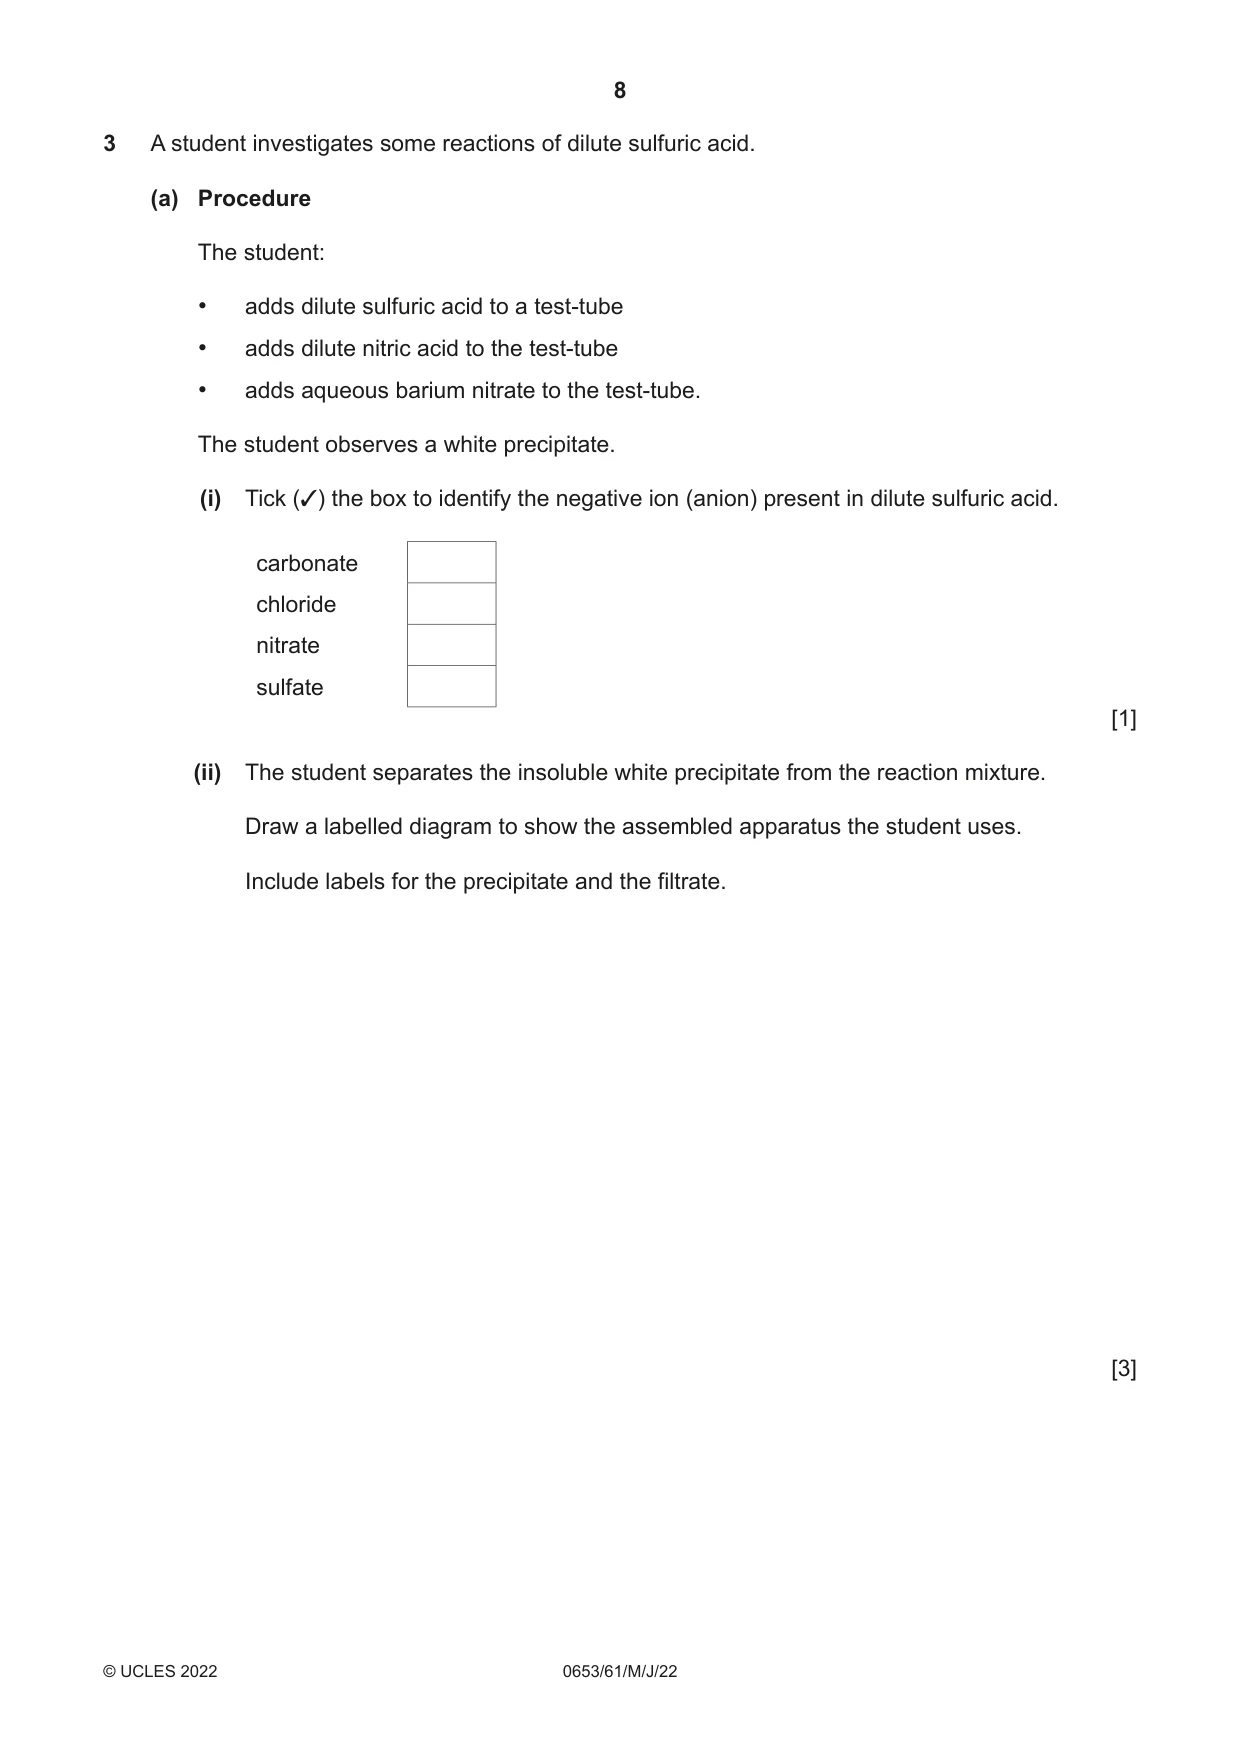
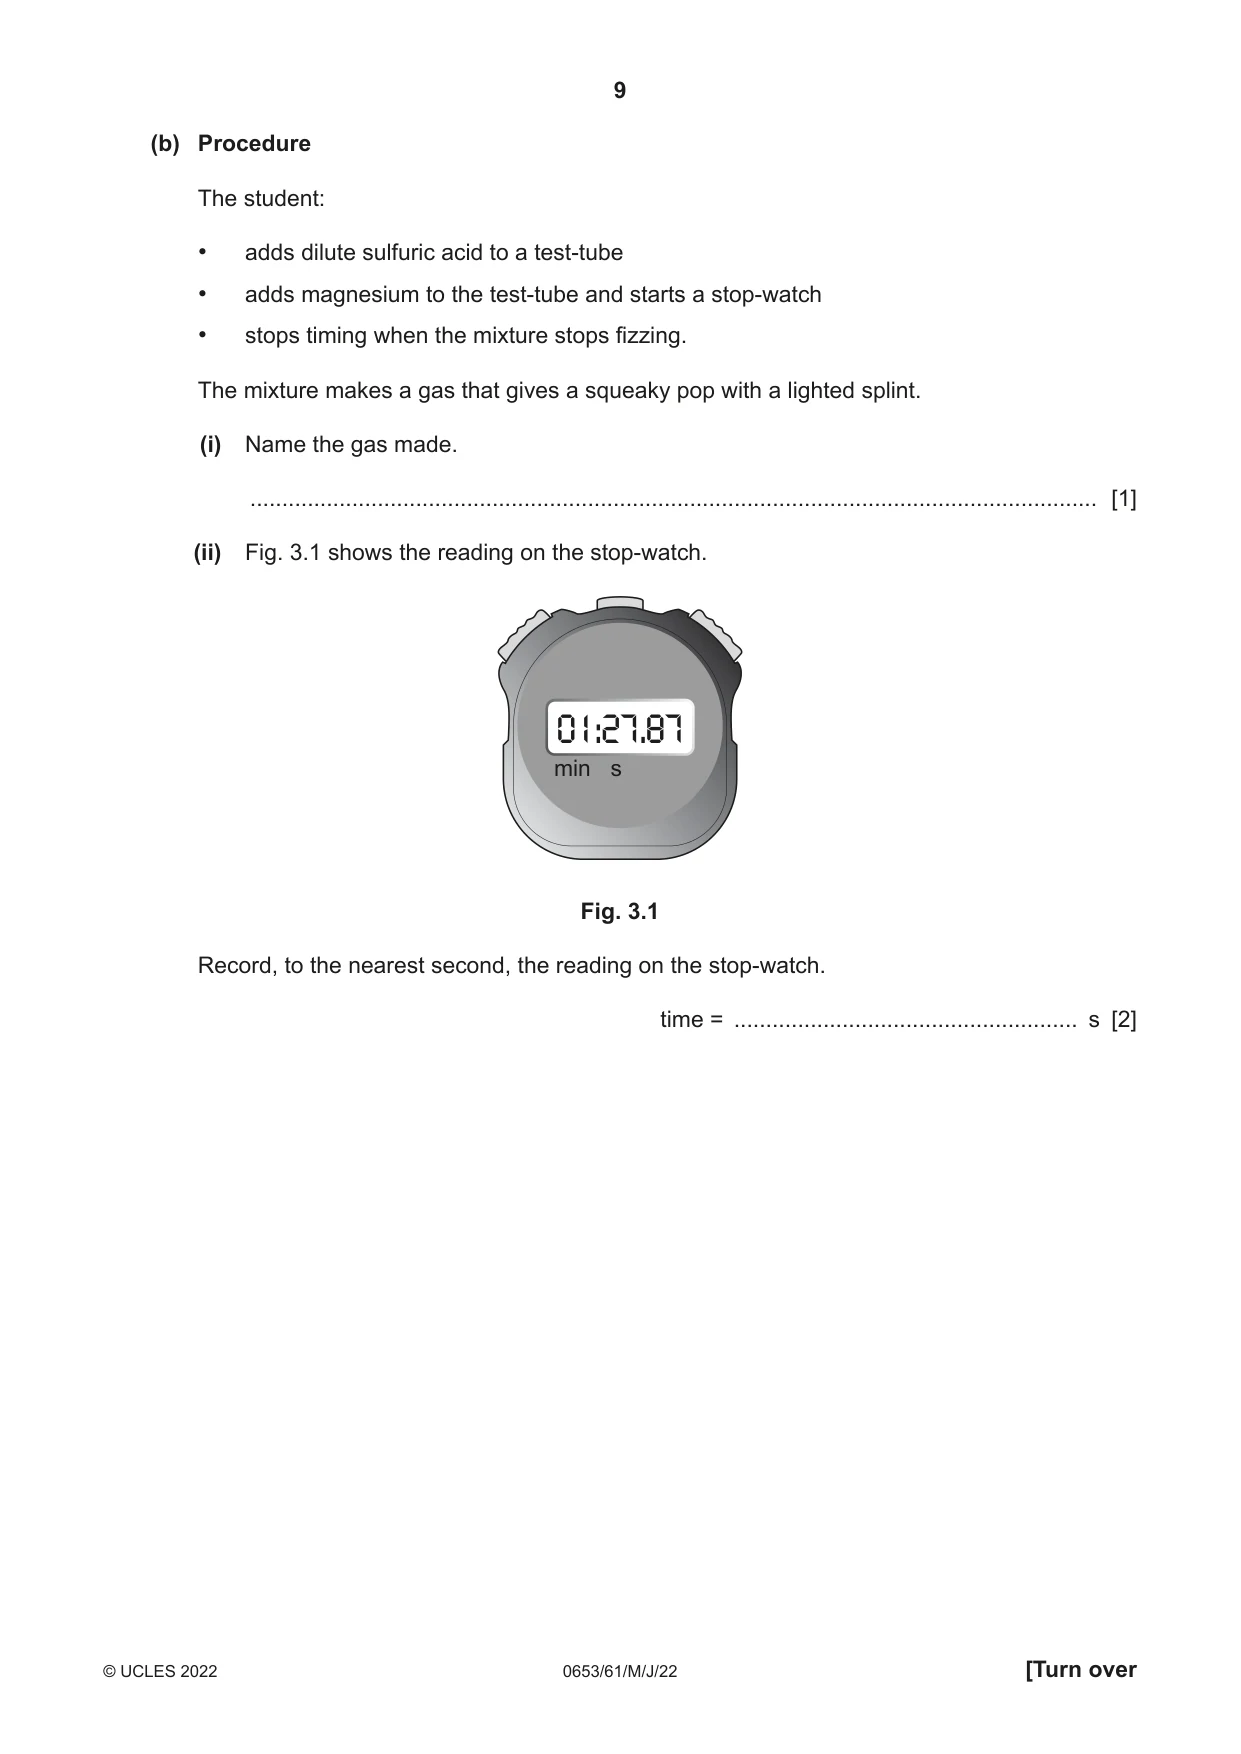
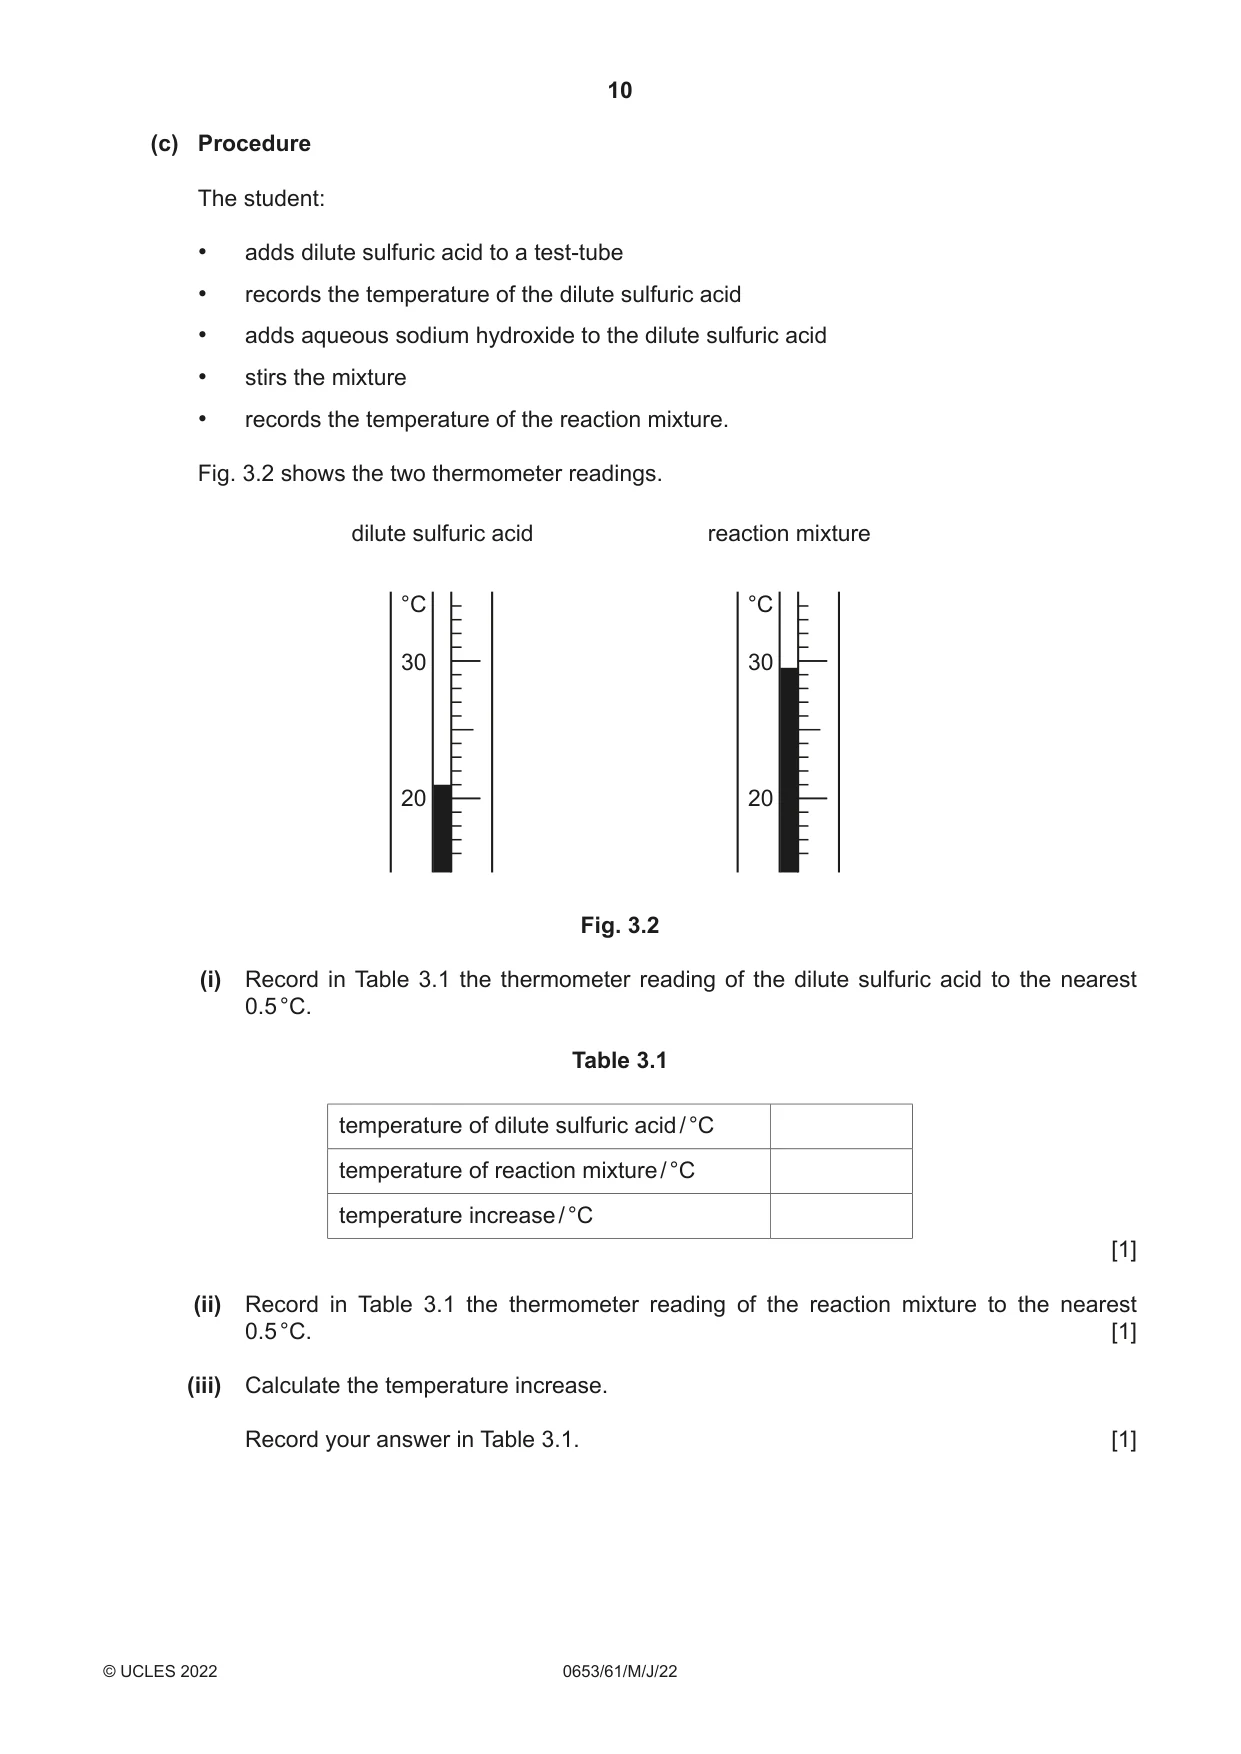
3 A student investigates some reactions of dilute sulfuric acid. (a) Procedure The student: • adds dilute sulfuric acid to a test-tube • adds dilute nitric acid to the test-tube • adds aqueous barium nitrate to the test-tube. The student observes a white precipitate. (i) Tick (3) the box to identify the negative ion (anion) present in dilute sulfuric acid. carbonate chloride nitrate sulfate [1] (ii) The student separates the insoluble white precipitate from the reaction mixture. Draw a labelled diagram to show the assembled apparatus the student uses. Include labels for the precipitate and the filtrate. [3] (b) Procedure The student: • adds dilute sulfuric acid to a test-tube • adds magnesium to the test-tube and starts a stop-watch • stops timing when the mixture stops fizzing. The mixture makes a gas that gives a squeaky pop with a lighted splint. (i) Name the gas made. ..................................................................................................................................... [1] (ii) Fig. 3.1 shows the reading on the stop-watch. 01:27.87 min s Fig. 3.1 Record, to the nearest second, the reading on the stop-watch. time = ...................................................... s [2] (c) Procedure The student: • adds dilute sulfuric acid to a test-tube • records the temperature of the dilute sulfuric acid • adds aqueous sodium hydroxide to the dilute sulfuric acid • stirs the mixture • records the temperature of the reaction mixture. Fig. 3.2 shows the two thermometer readings. dilute sulfuric acid reaction mixture °C °C 30 30 20 20 Fig. 3.2 (i) Record in Table 3.1 the thermometer reading of the dilute sulfuric acid to the nearest 0.5 °C. Table 3.1 temperature of dilute sulfuric acid / °C temperature of reaction mixture / °C temperature increase / °C [1] (ii) Record in Table 3.1 the thermometer reading of the reaction mixture to the nearest 0.5 °C. [1] (iii) Calculate the temperature increase. Record your answer in Table 3.1. [1] (iv) The temperature increase is not as large as expected. This is because some thermal energy (heat) is transferred into the air. Suggest a change in the apparatus or an addition to the apparatus that reduces this loss in thermal energy (heat). ........................................................................................................................................... ..................................................................................................................................... [1] (v) Suggest why the reaction mixture is stirred before its temperature is recorded. ........................................................................................................................................... ..................................................................................................................................... [1] (vi) Suggest why it is better to repeat the experiment and calculate the average temperature increase. ........................................................................................................................................... ..................................................................................................................................... [1] [Total: 13]
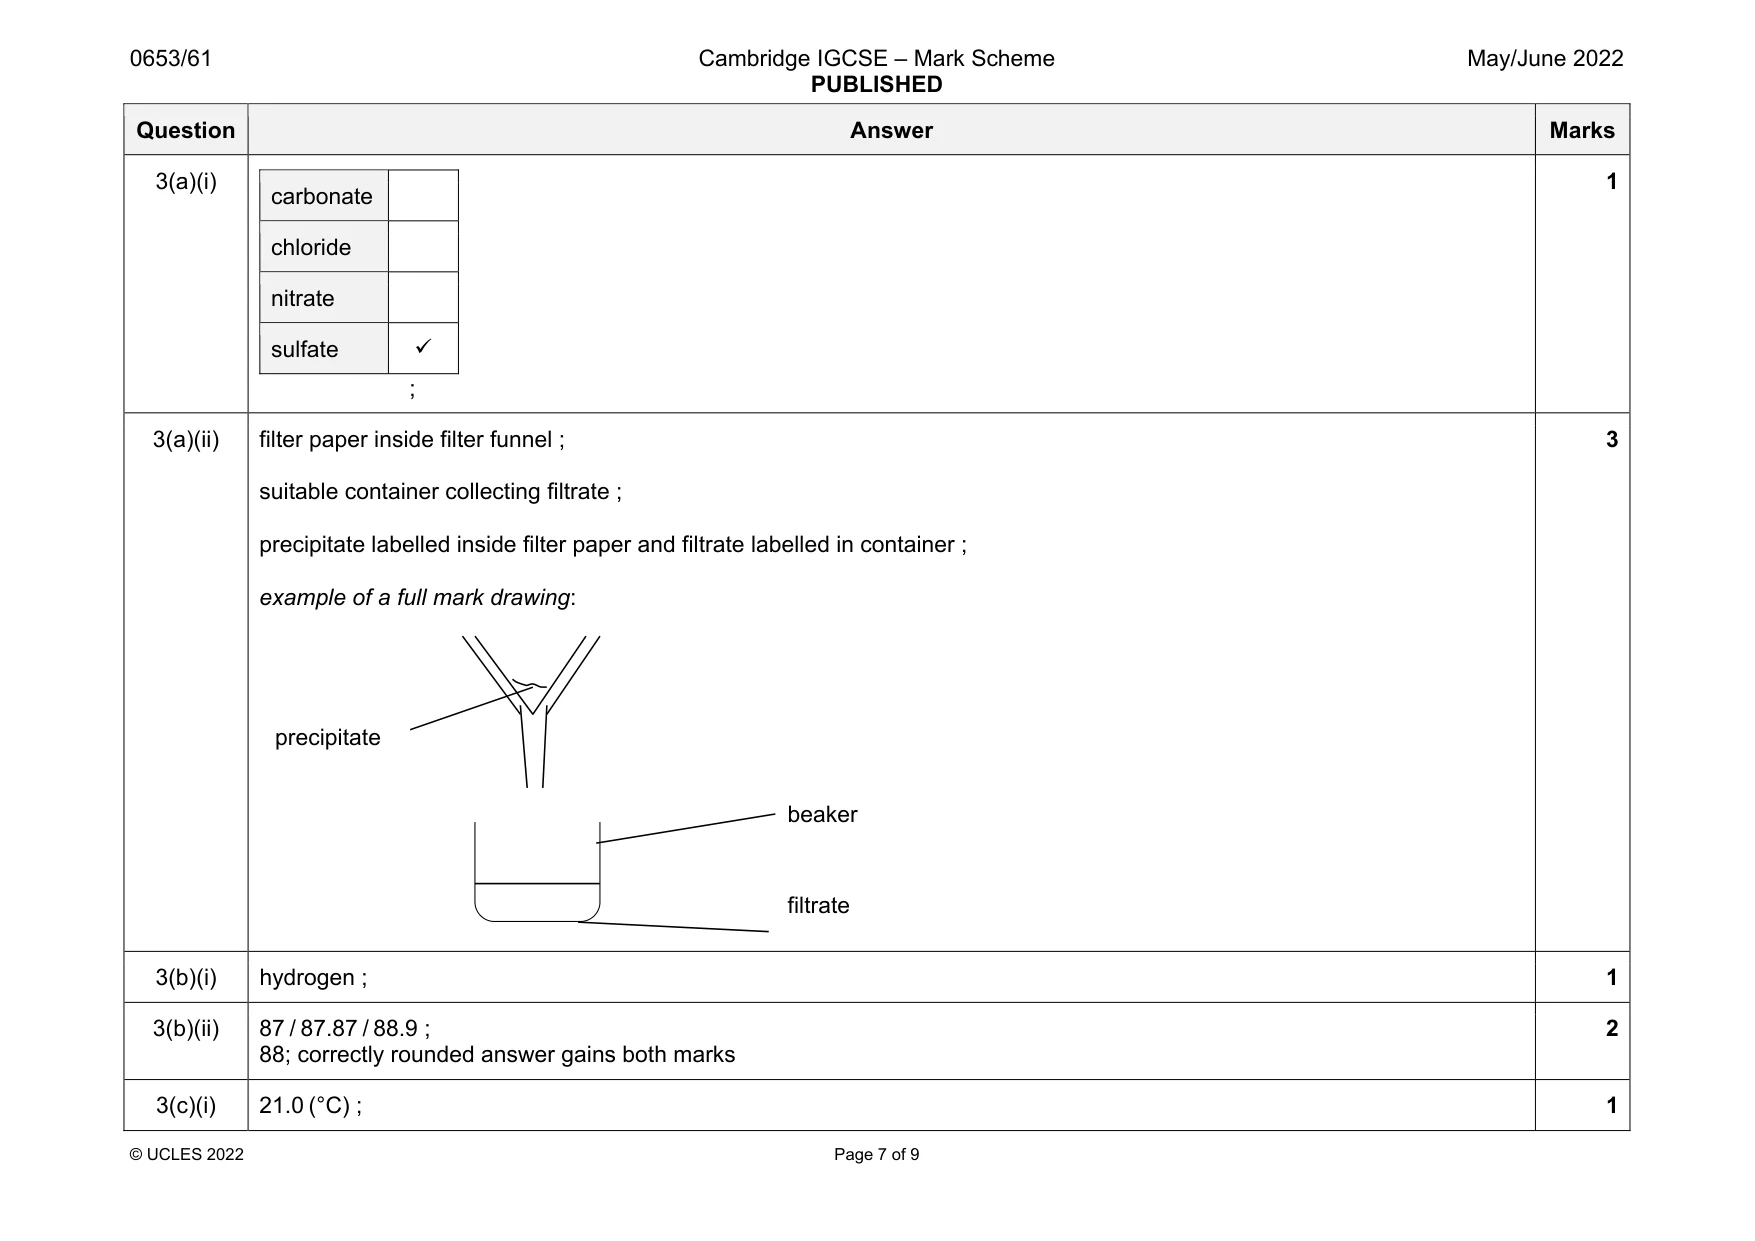
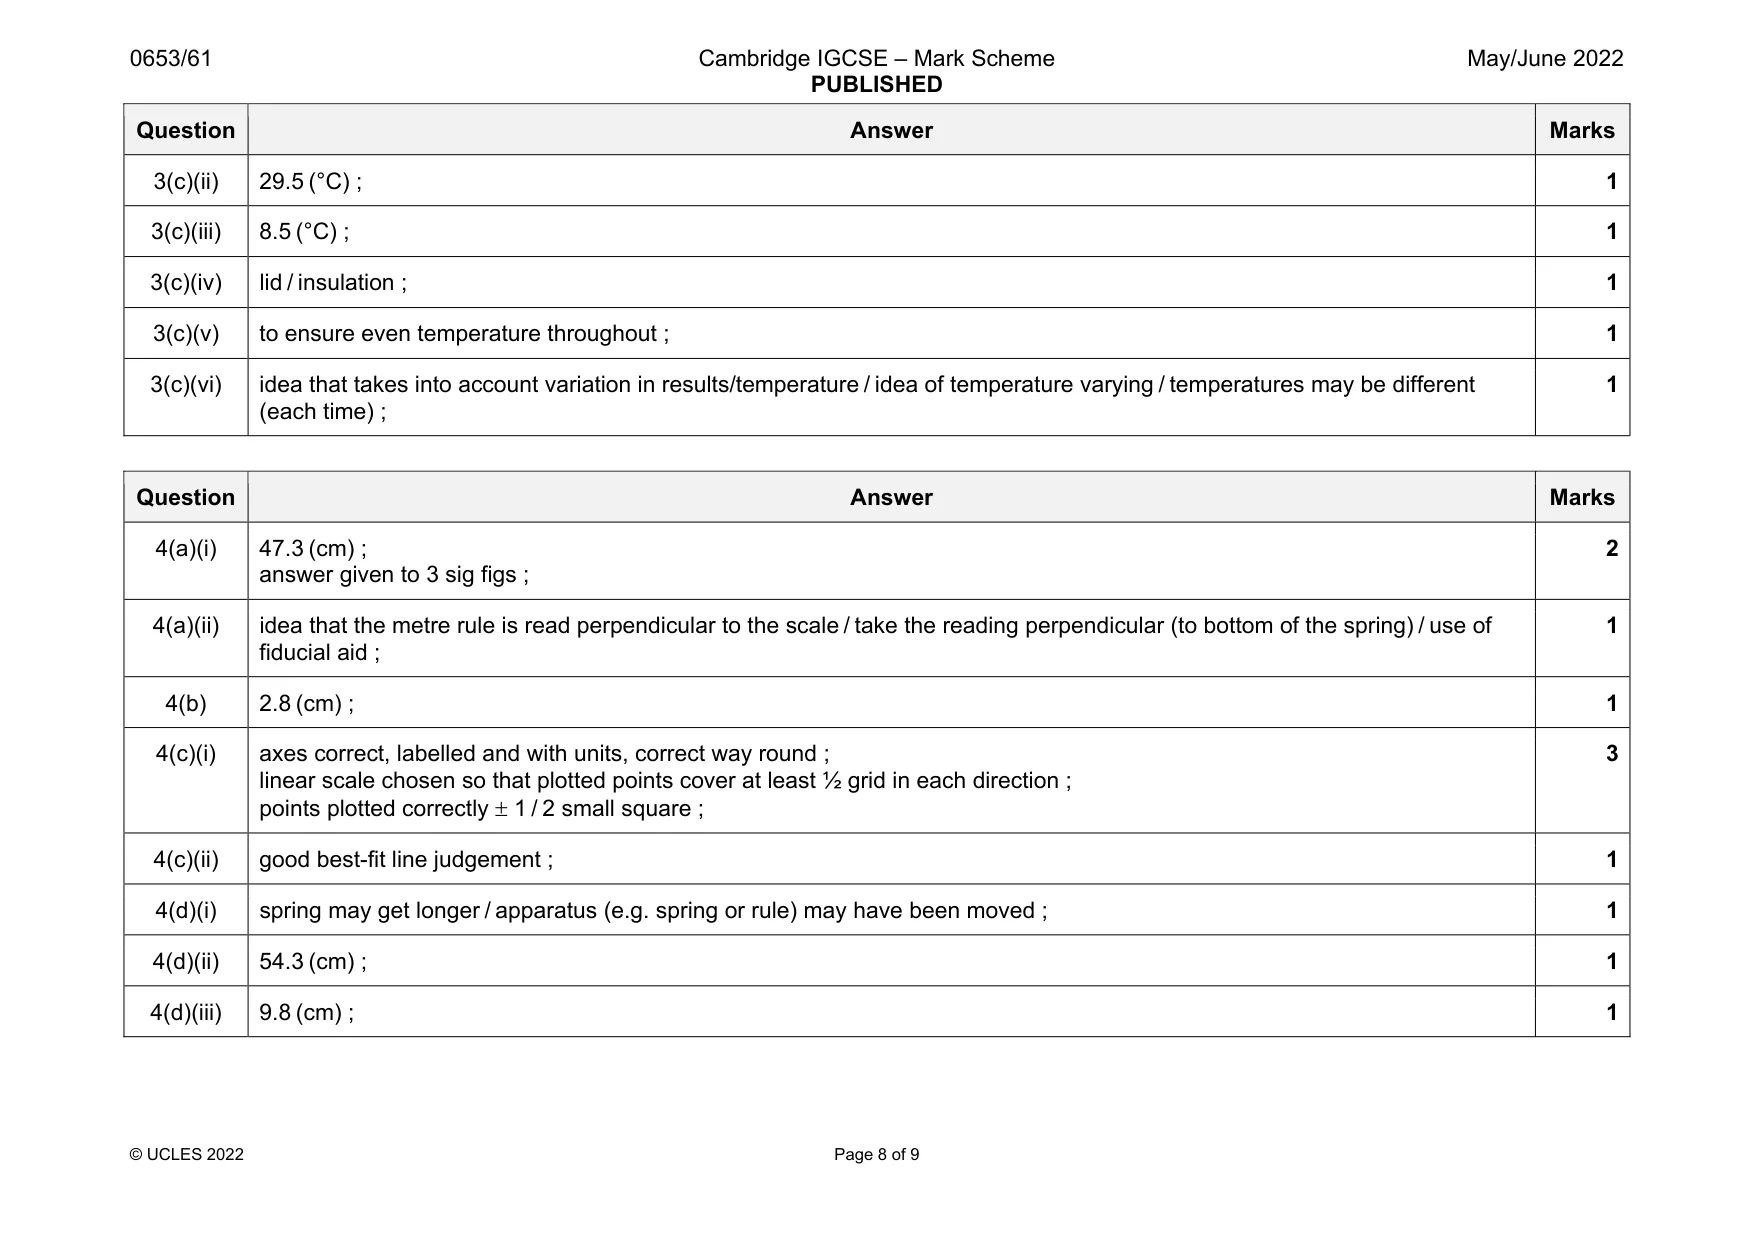
Mark scheme: 3(a)(i) carbonate chloride nitrate sulfate ; 1 3(a)(ii) filter paper inside filter funnel ; suitable container collecting filtrate ; precipitate labelled inside filter paper and filtrate labelled in container ; example of a full mark drawing: 3 3(b)(i) hydrogen ; 1 3(b)(ii) 87 / 87.87 / 88.9 ; 88; correctly rounded answer gains both marks 2 3(c)(i) 21.0 (°C) ; 1 beaker filtrate precipitate Question Answer Marks 3(c)(ii) 29.5 (°C) ; 1 3(c)(iii) 8.5 (°C) ; 1 3(c)(iv) lid / insulation ; 1 3(c)(v) to ensure even temperature throughout ; 1 3(c)(vi) idea that takes into account variation in results/temperature / idea of temperature varying / temperatures may be different (each time) ; 1
Q4 · A student uses a spring to determine the mass of an unknown object U
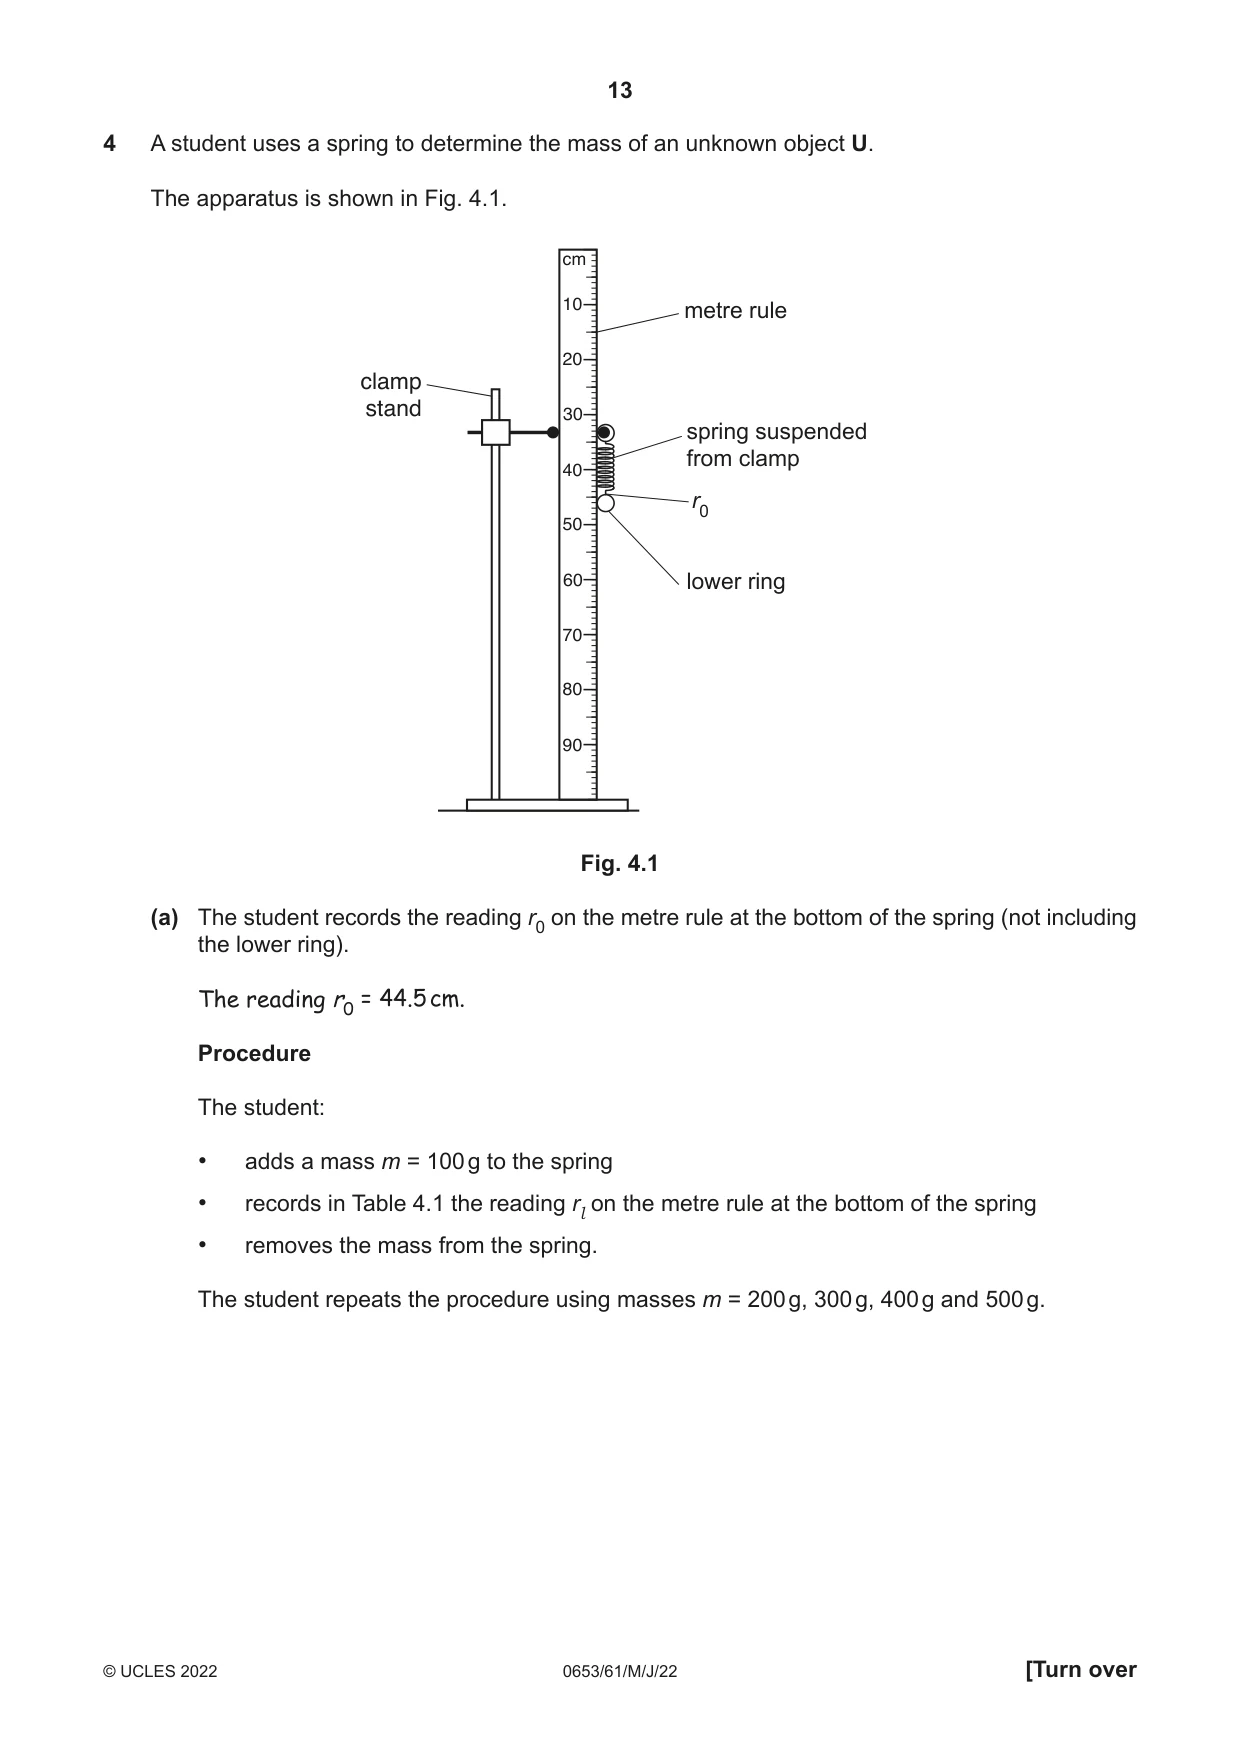
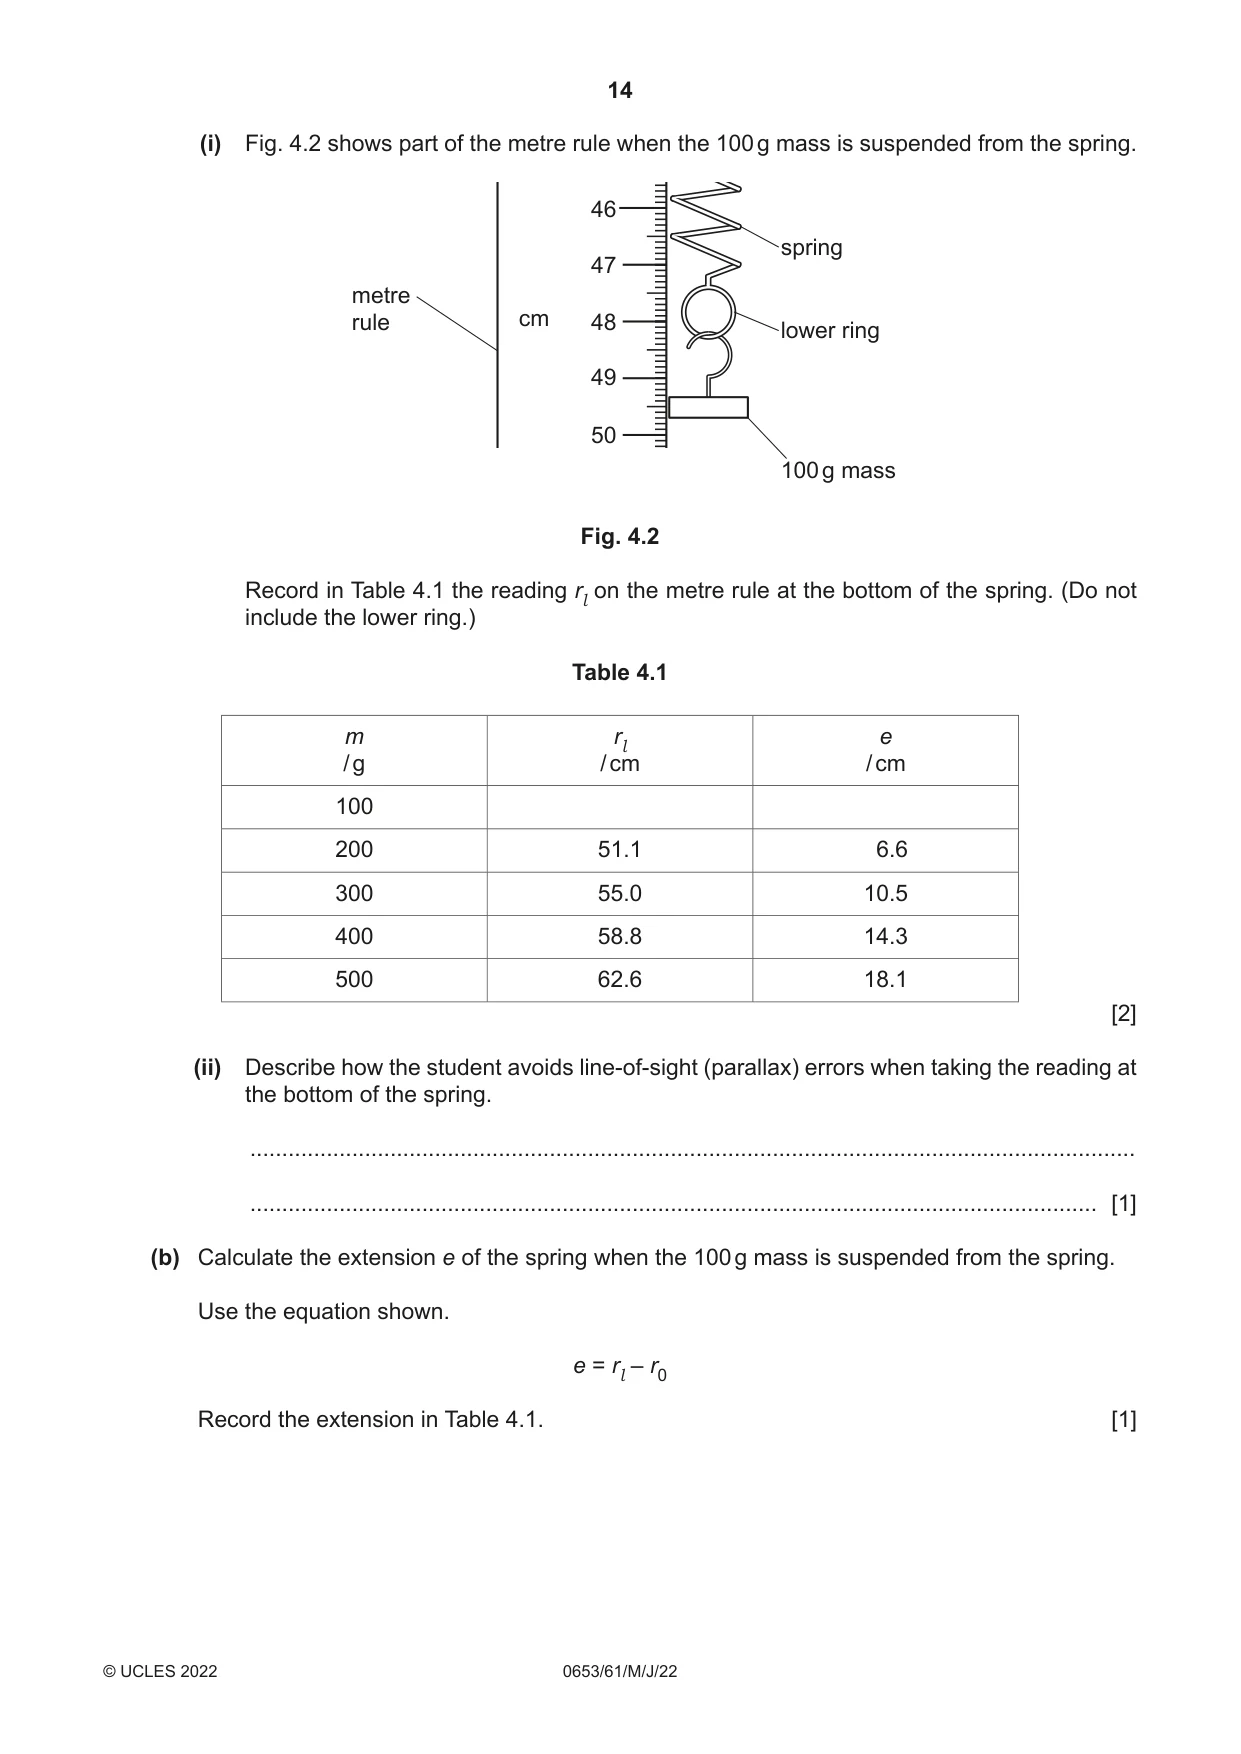
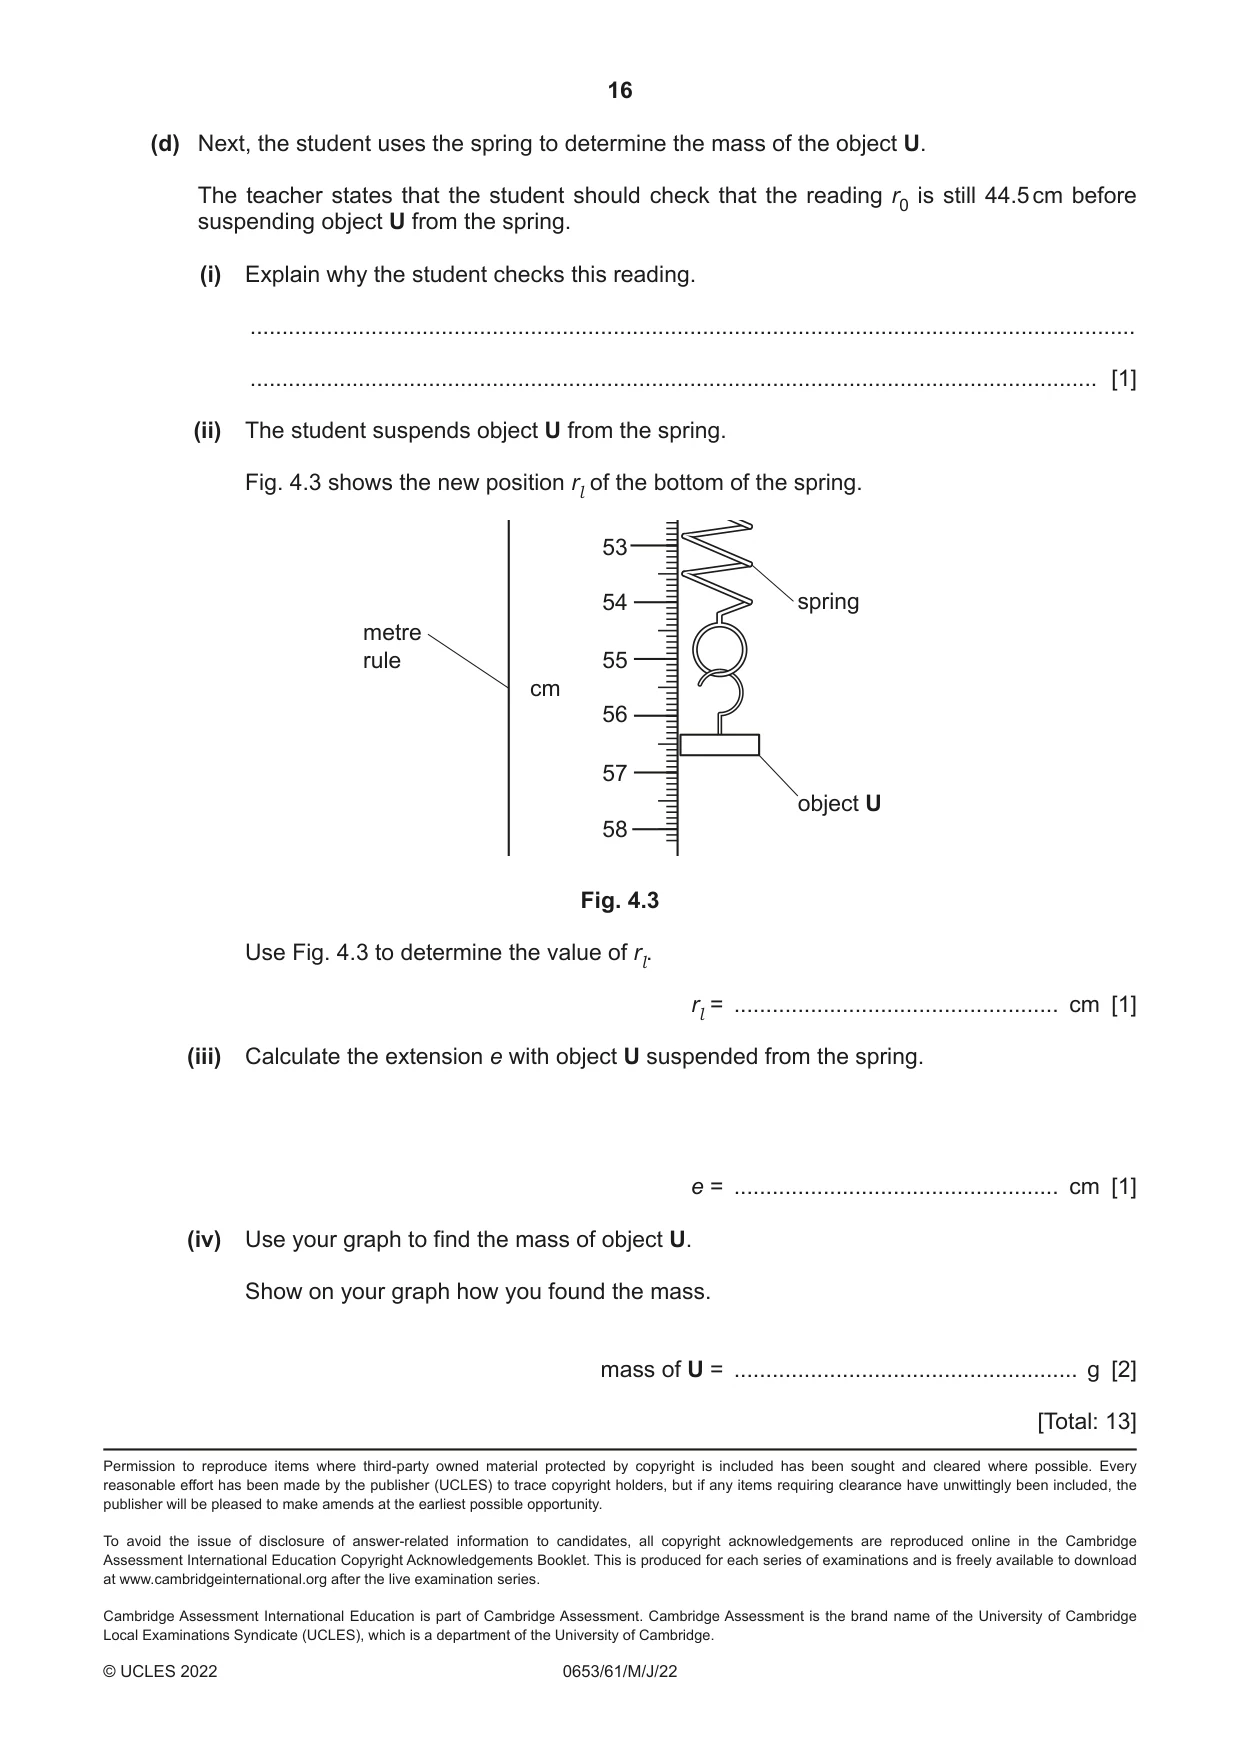
4 A student uses a spring to determine the mass of an unknown object U. The apparatus is shown in Fig. 4.1. cm 10 metre rule 20 clamp stand 30 spring suspended from clamp 40 r0 50 60 lower ring 70 80 90 Fig. 4.1 (a) The student records the reading r0 on the metre rule at the bottom of the spring (not including the lower ring). The reading r0 = 44.5 cm. Procedure The student: • adds a mass m = 100 g to the spring • records in Table 4.1 the reading rl on the metre rule at the bottom of the spring • removes the mass from the spring. The student repeats the procedure using masses m = 200 g, 300 g, 400 g and 500 g. (i) Fig. 4.2 shows part of the metre rule when the 100 g mass is suspended from the spring. 46 spring 47 metre rule cm 48 lower ring 49 50 100 g mass Fig. 4.2 Record in Table 4.1 the reading rl on the metre rule at the bottom of the spring. (Do not include the lower ring.) Table 4.1 m rl e / g / cm / cm 100 200 51.1 6.6 300 55.0 10.5 400 58.8 14.3 500 62.6 18.1 [2] (ii) Describe how the student avoids line-of-sight (parallax) errors when taking the reading at the bottom of the spring. ........................................................................................................................................... ..................................................................................................................................... [1] (b) Calculate the extension e of the spring when the 100 g mass is suspended from the spring. Use the equation shown. e = rl – r0 Record the extension in Table 4.1. [1]
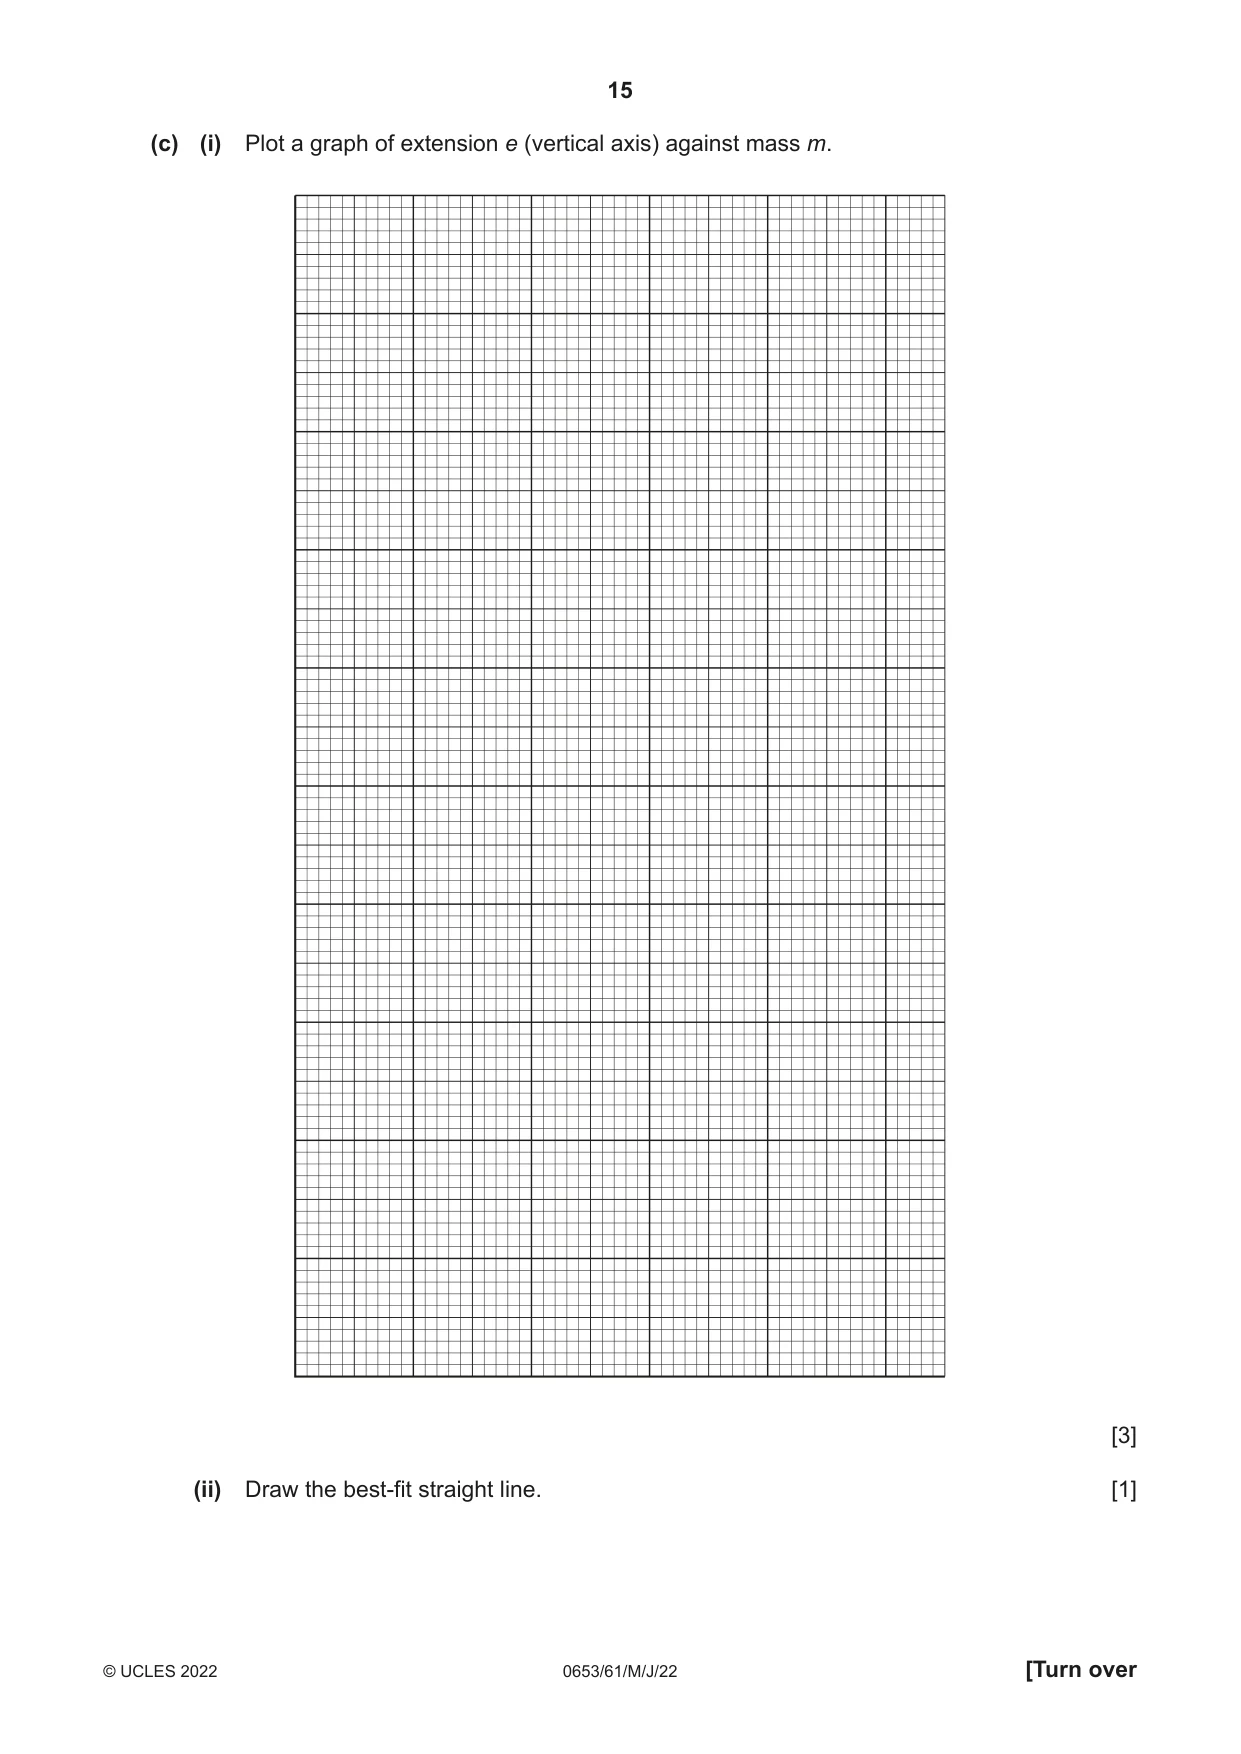
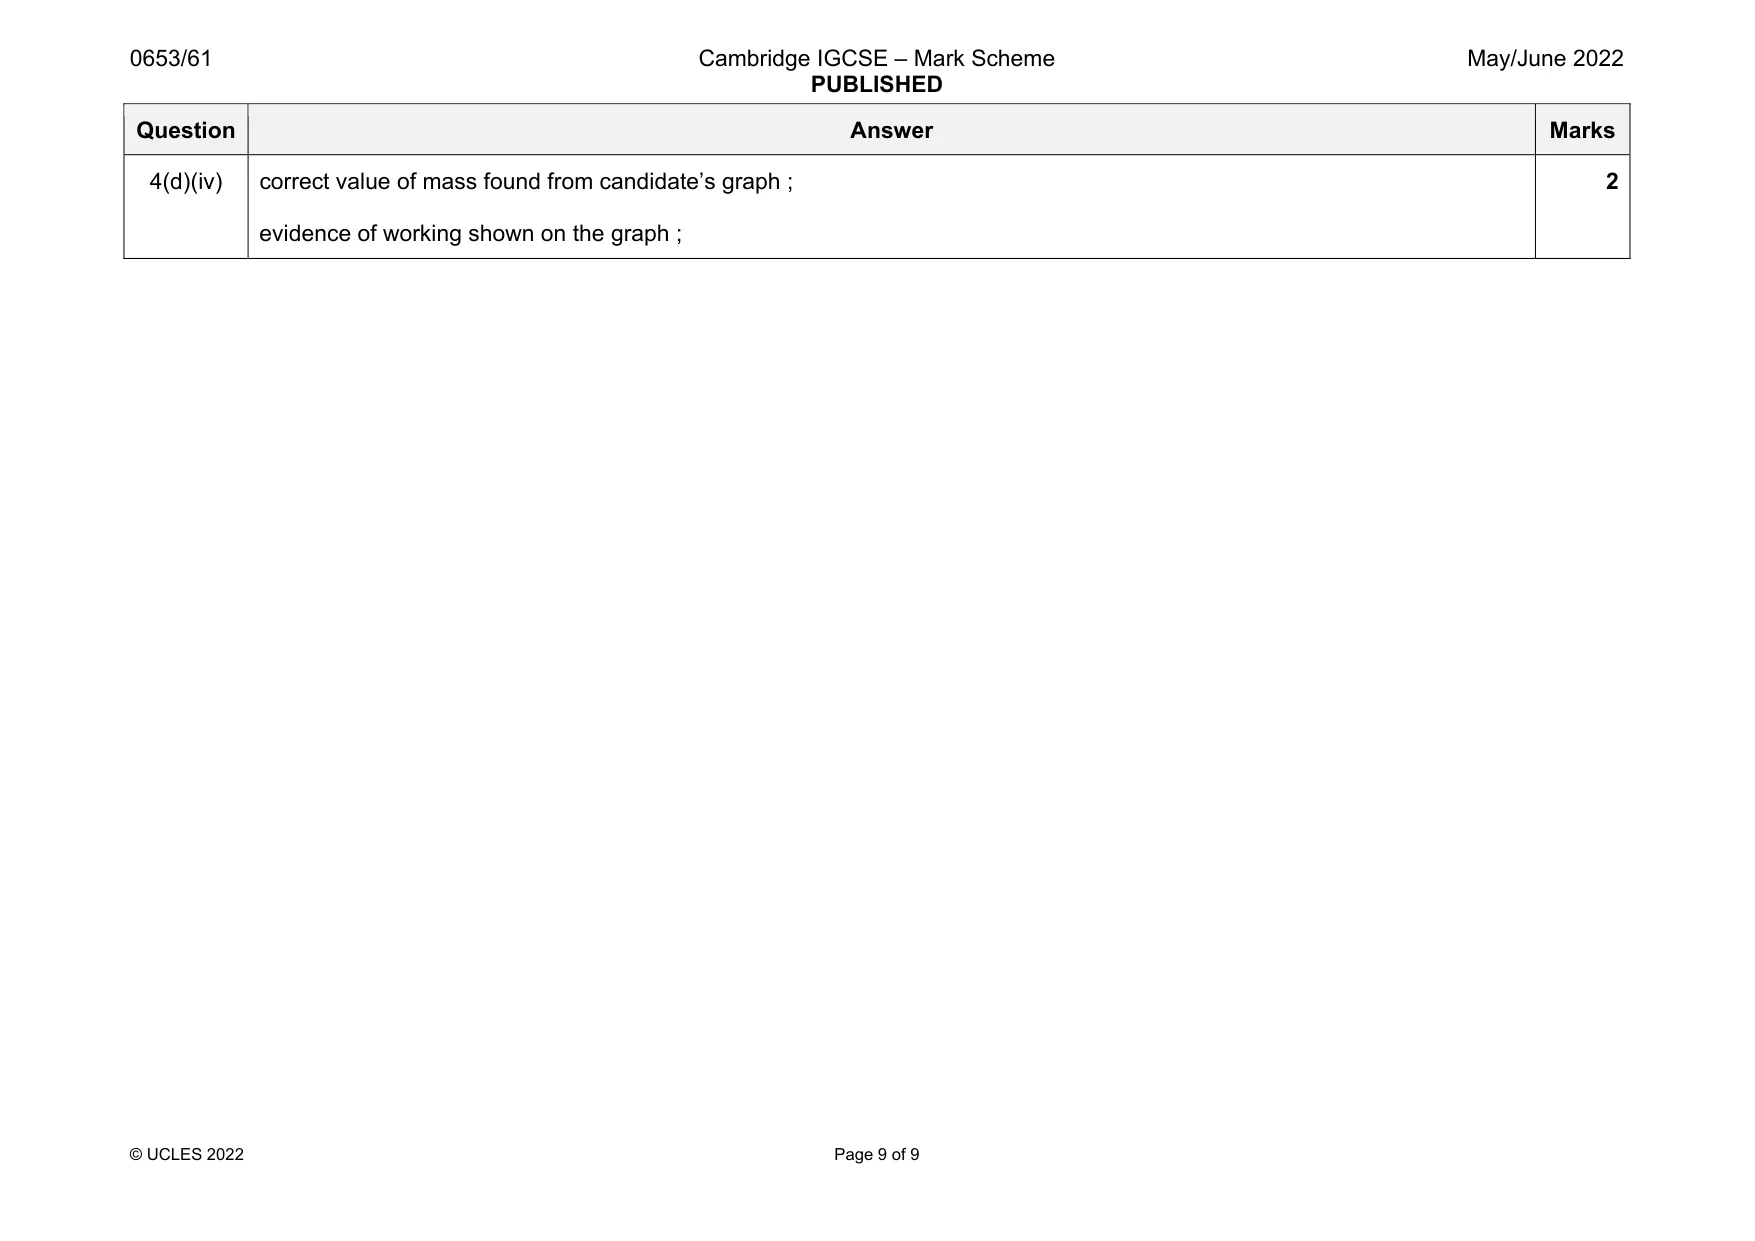
Mark scheme: 4(a)(i) 47.3 (cm) ; answer given to 3 sig figs ; 2 4(a)(ii) idea that the metre rule is read perpendicular to the scale / take the reading perpendicular (to bottom of the spring) / use of fiducial aid ; 1 4(b) 2.8 (cm) ; 1 4(c)(i) axes correct, labelled and with units, correct way round ; linear scale chosen so that plotted points cover at least ½ grid in each direction ; points plotted correctly 1 / 2 small square ; 3 4(c)(ii) good best-fit line judgement ; 1 4(d)(i) spring may get longer / apparatus (e.g. spring or rule) may have been moved ; 1 4(d)(ii) 54.3 (cm) ; 1 4(d)(iii) 9.8 (cm) ; 1 Question Answer Marks 4(d)(iv) correct value of mass found from candidate’s graph ; evidence of working shown on the graph ; 2
More questions on Physical quantities and measurement techniques
What was in this paper
The subtopics covered by these 4 questions, and how many questions each got. Open one in a new tab to see every Cambridge question on it.
What you needed in this session
Cambridge’s own grade thresholds for 2022 May/June, Paper 6 · Variant 1. A higher threshold means an easier paper — the bar moves with how the cohort did.