Cambridge IGCSE Science - Combined 0653 — 2025 Feb/March Paper 6 · Variant 2
0653/62/F/M/25 · 4 questions · 40 marks · 60 min
The question paper and its mark scheme, free to read here and free to download. This is Cambridge’s own paper, exactly as it was sat.
Question paper16 pages
Mark scheme9 pages
Answers below. Sit the paper first if you are practising.
Questions as text
Q1 · A student investigates the relationship between the length of a leaf and the width of a…
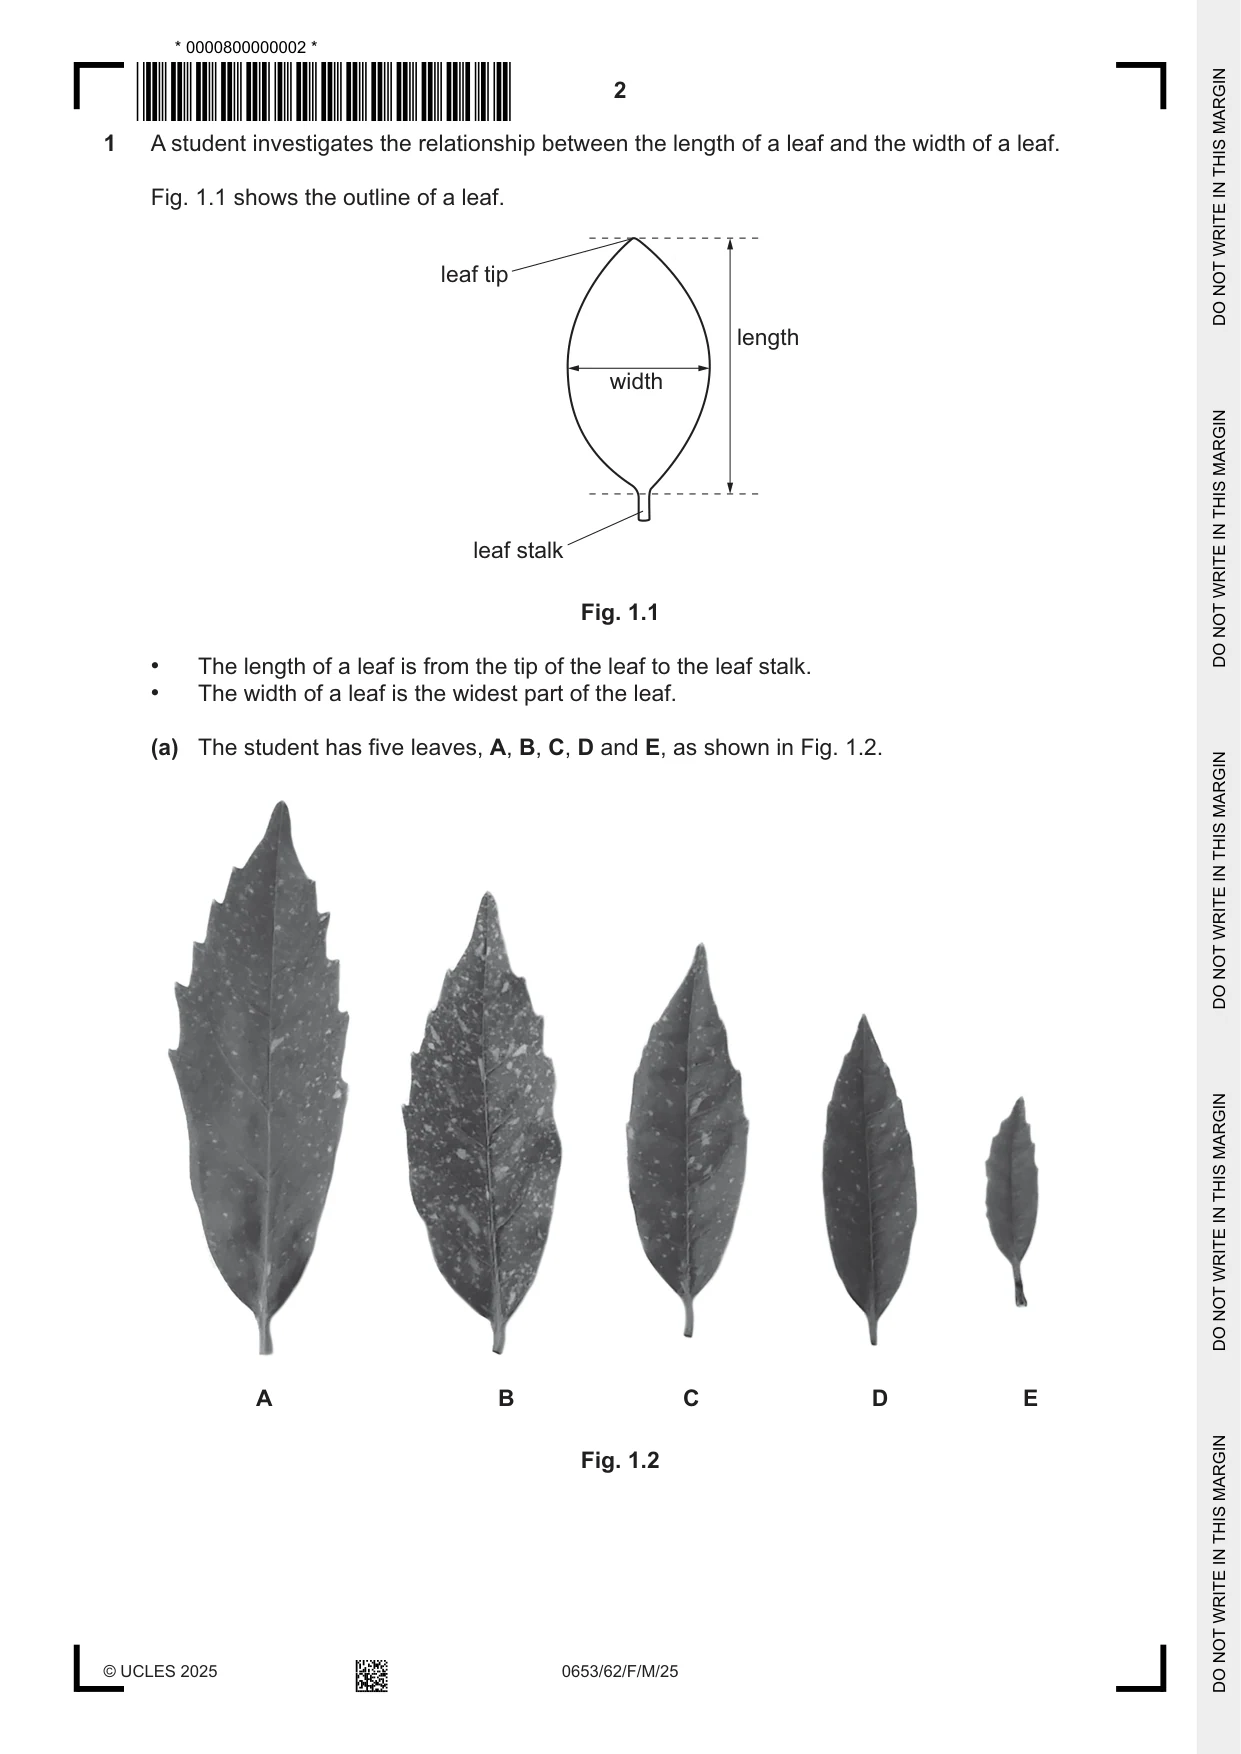
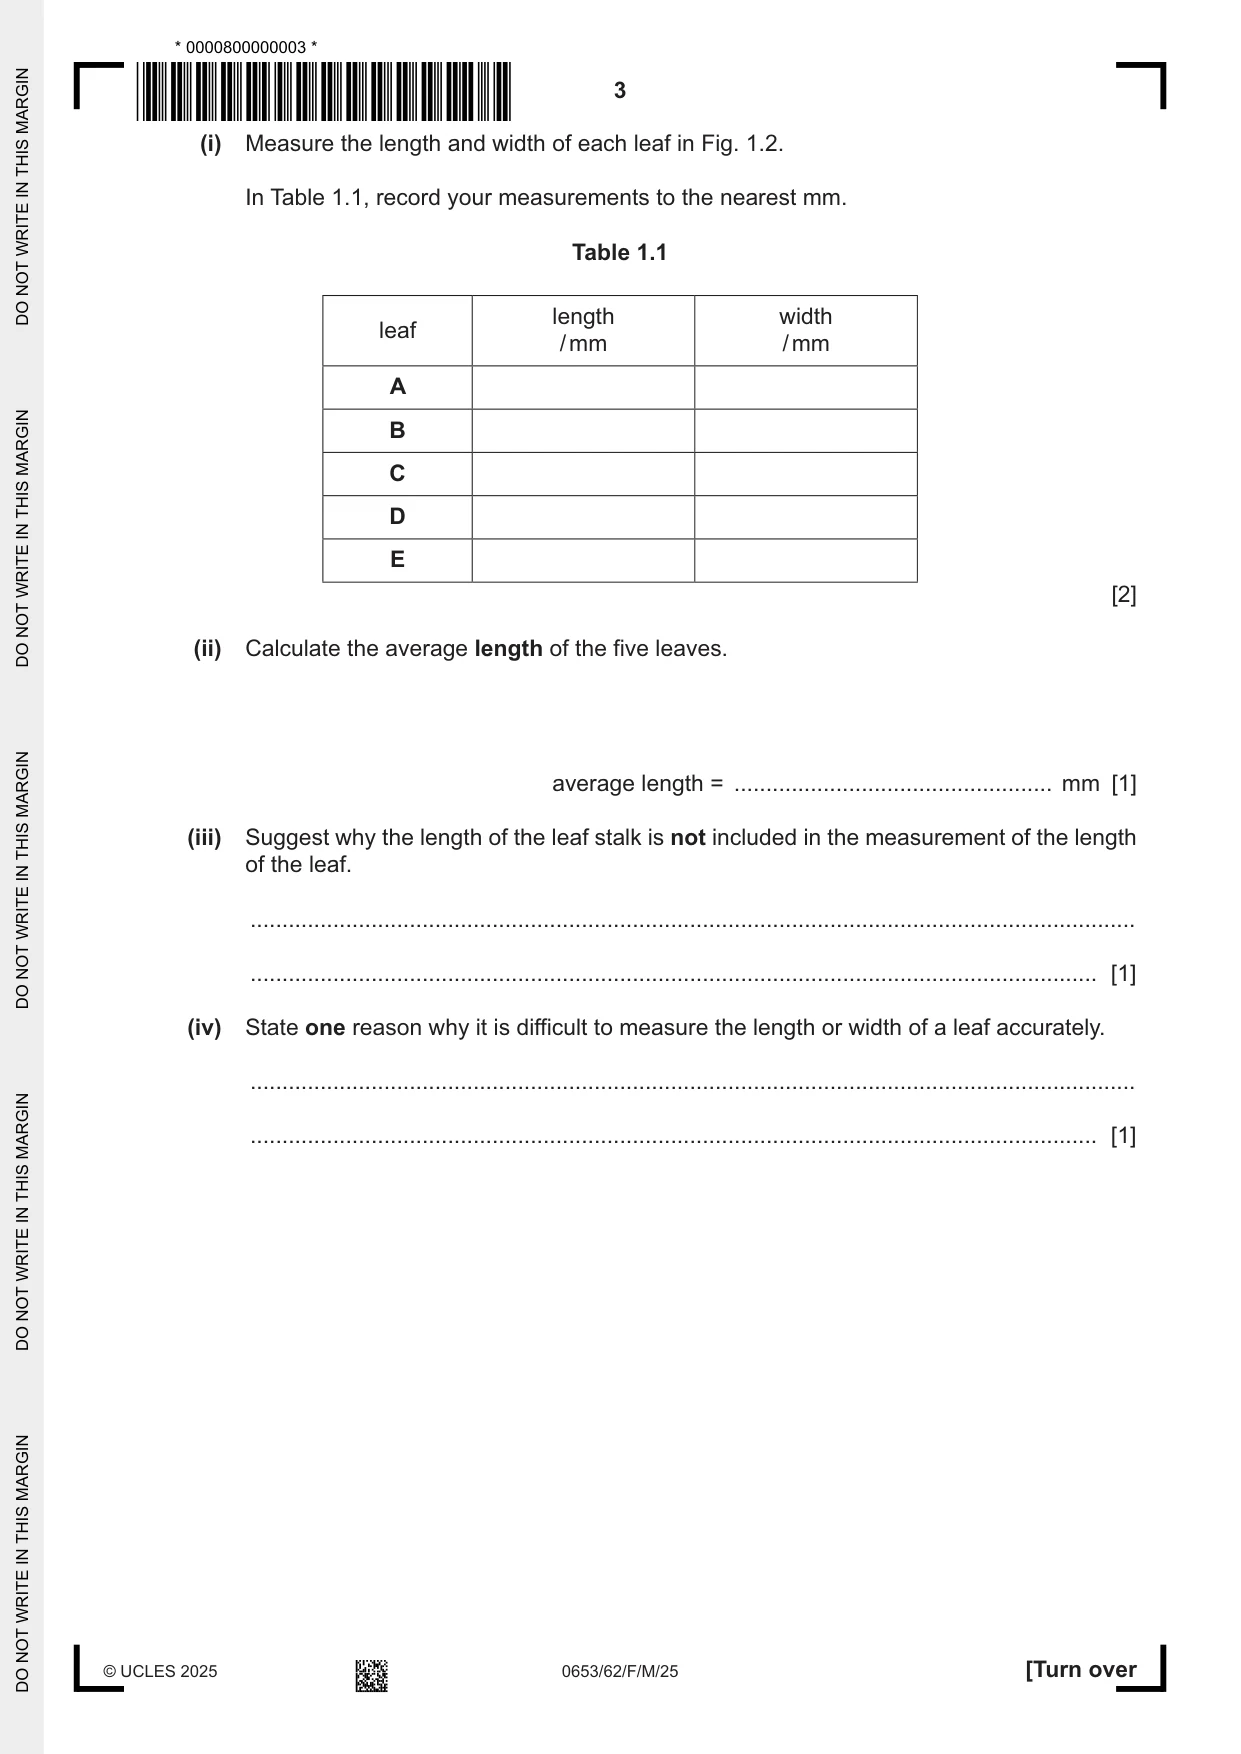
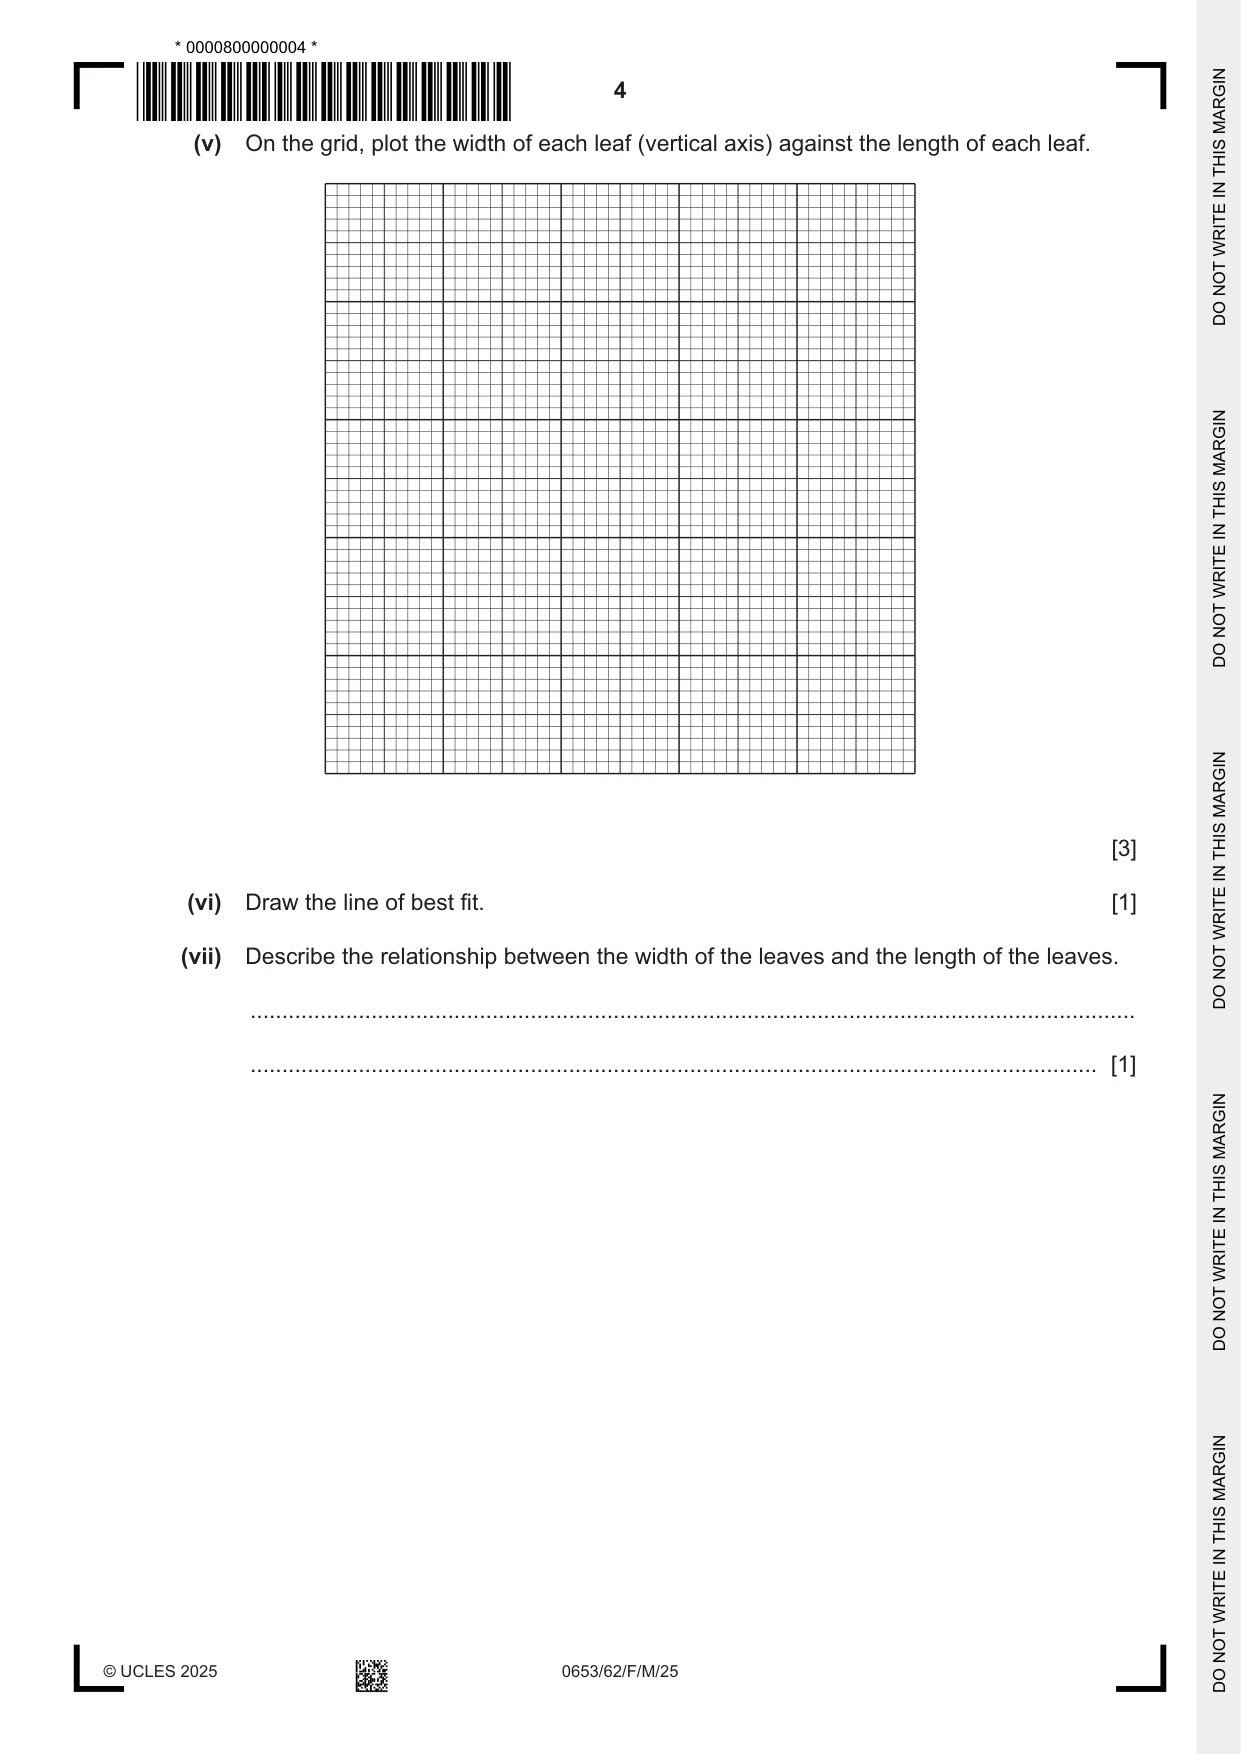
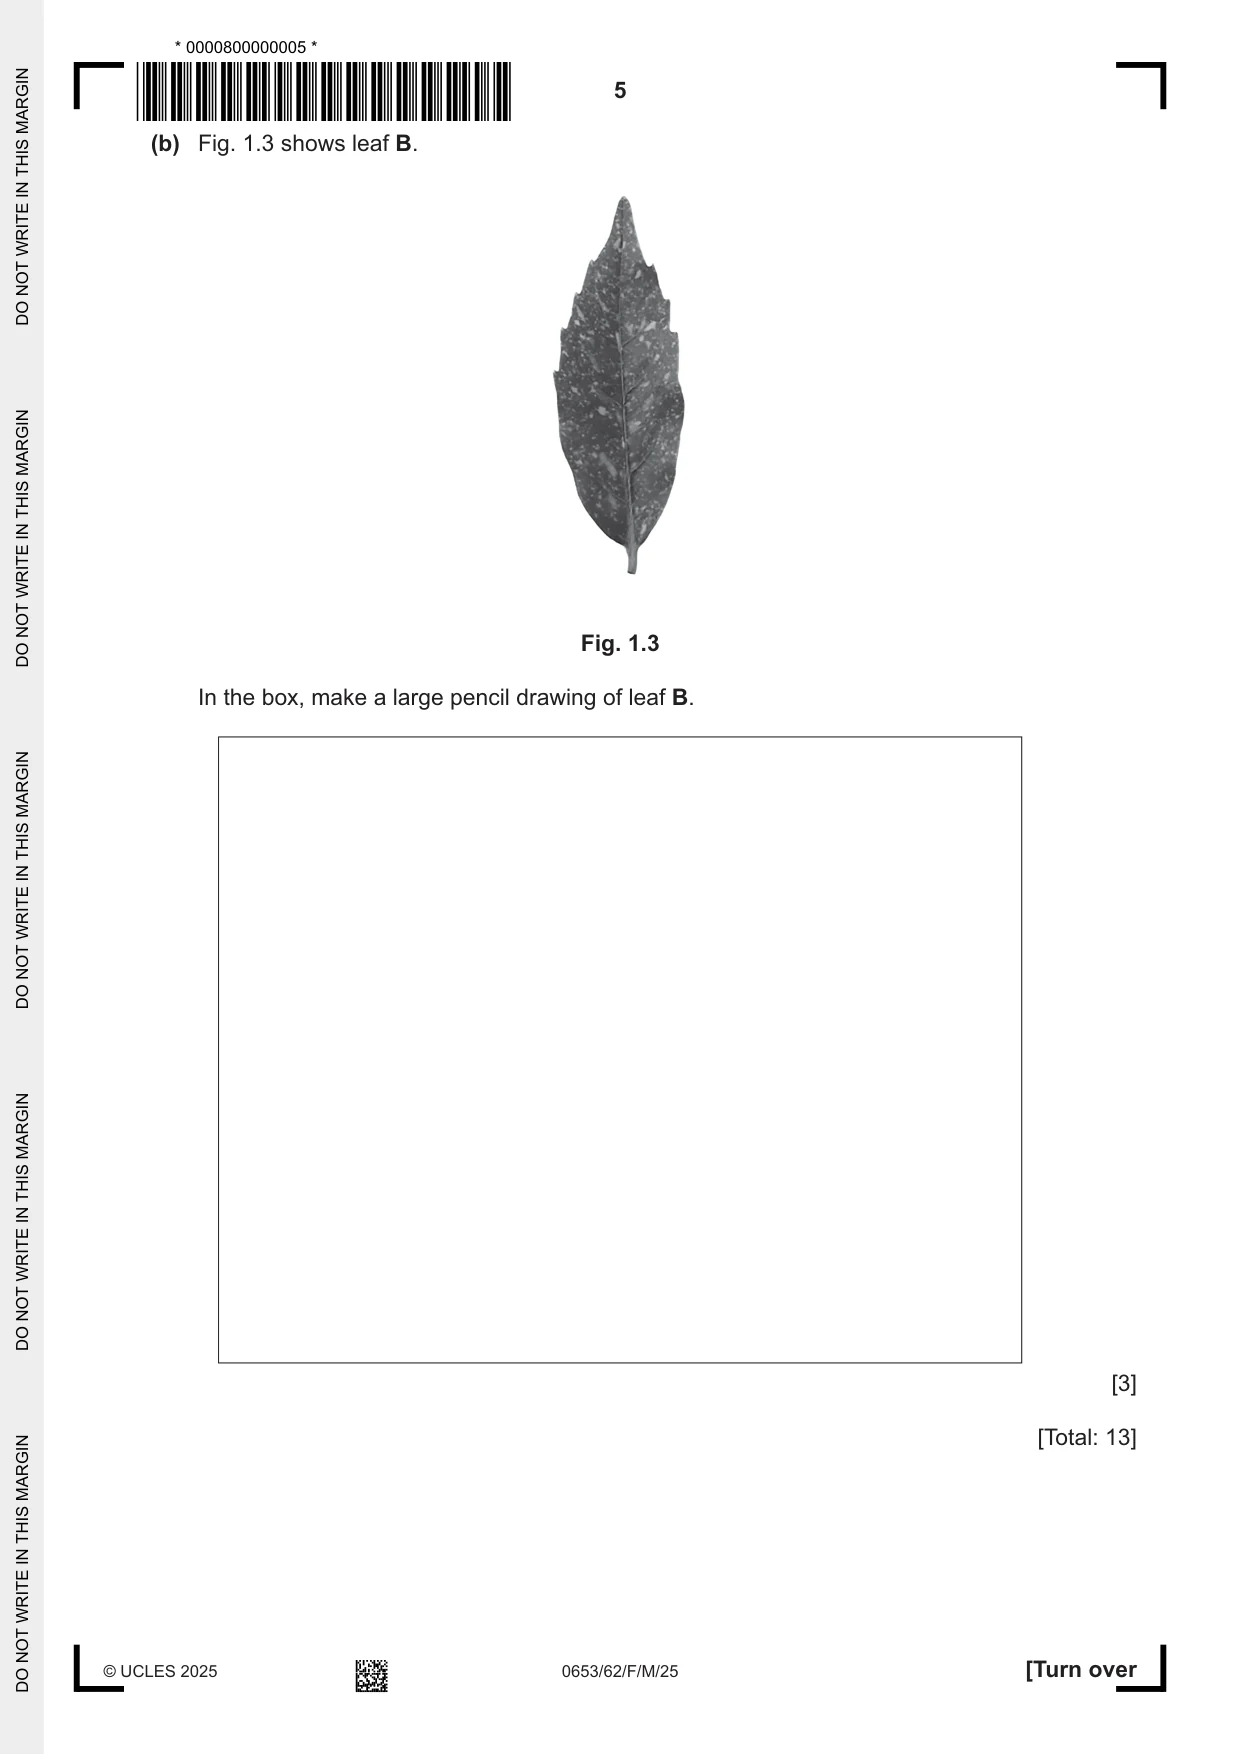
1 A student investigates the relationship between the length of a leaf and the width of a leaf. Fig. 1.1 shows the outline of a leaf. leaf tip length width leaf stalk Fig. 1.1 • The length of a leaf is from the tip of the leaf to the leaf stalk. • The width of a leaf is the widest part of the leaf. (a) The student has five leaves, A, B, C, D and E, as shown in Fig. 1.2. A B C D E Fig. 1.2 (i) Measure the length and width of each leaf in Fig. 1.2. In Table 1.1, record your measurements to the nearest mm. Table 1.1 length width leaf / mm / mm A B C D E [2] (ii) Calculate the average length of the five leaves. average length = .................................................. mm [1] (iii) Suggest why the length of the leaf stalk is not included in the measurement of the length of the leaf. ........................................................................................................................................... ..................................................................................................................................... [1] (iv) State one reason why it is difficult to measure the length or width of a leaf accurately. ........................................................................................................................................... ..................................................................................................................................... [1] (v) On the grid, plot the width of each leaf (vertical axis) against the length of each leaf. [3] (vi) Draw the line of best fit. [1] (vii) Describe the relationship between the width of the leaves and the length of the leaves. ........................................................................................................................................... ..................................................................................................................................... [1] (b) Fig. 1.3 shows leaf B. Fig. 1.3 In the box, make a large pencil drawing of leaf B. [3] [Total: 13]
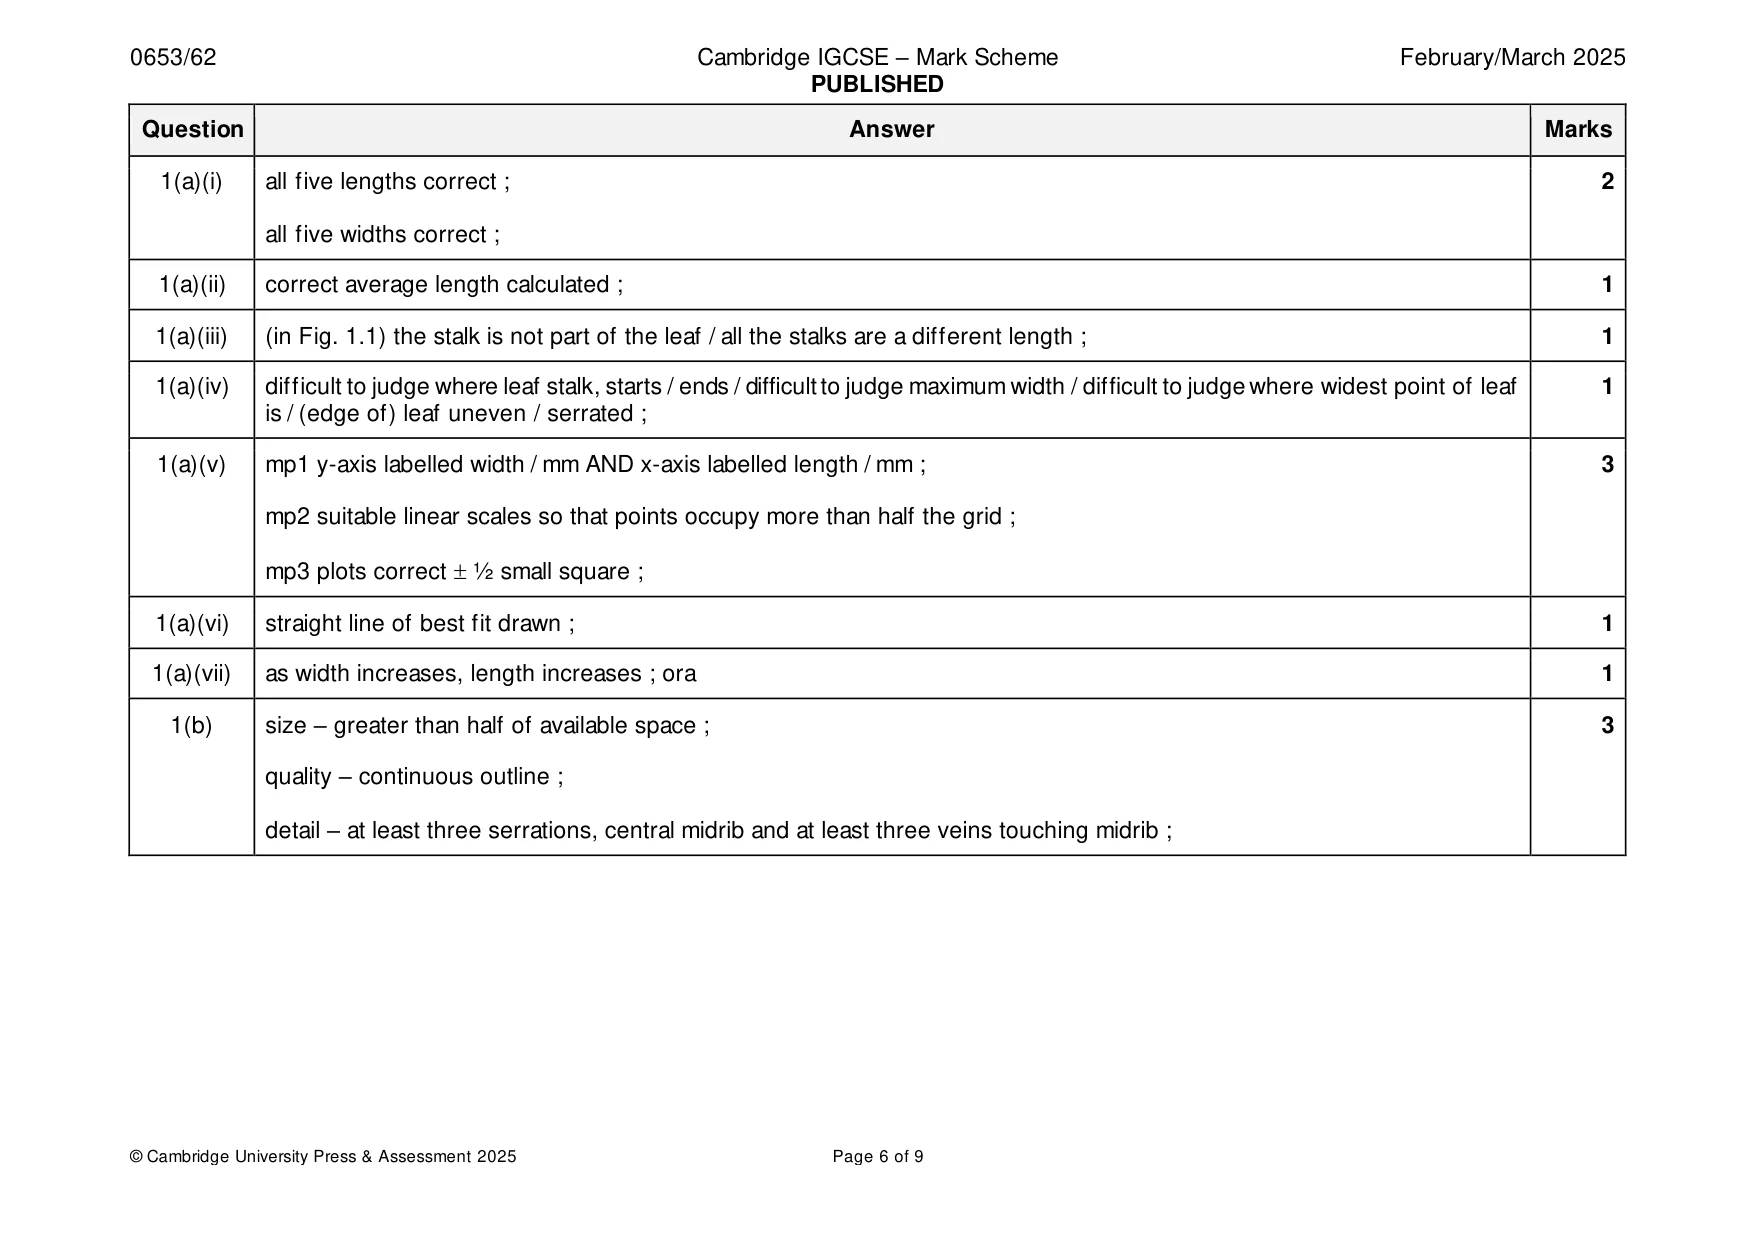
Mark scheme: Question Answer Marks 1(a)(i) all five lengths correct ; 2 all five widths correct ; 1(a)(ii) correct average length calculated ; 1 1(a)(iii) (in Fig. 1.1) the stalk is not part of the leaf / all the stalks are a different length ; 1 1(a)(iv) difficult to judge where leaf stalk, starts / ends / difficult to judge maximum width / difficult to judge where widest point of leaf 1 is / (edge of) leaf uneven / serrated ; 1(a)(v) mp1 y-axis labelled width / mm AND x-axis labelled length / mm ; 3 mp2 suitable linear scales so that points occupy more than half the grid ; mp3 plots correct ½ small square ; 1(a)(vi) straight line of best fit drawn ; 1 1(a)(vii) as width increases, length increases ; ora 1 1(b) size – greater than half of available space ; 3 quality – continuous outline ; detail – at least three serrations, central midrib and at least three veins touching midrib ;
More questions on Physical quantities and measurement techniques
Q2 · A student investigates four aqueous solutions, H, J, K and L
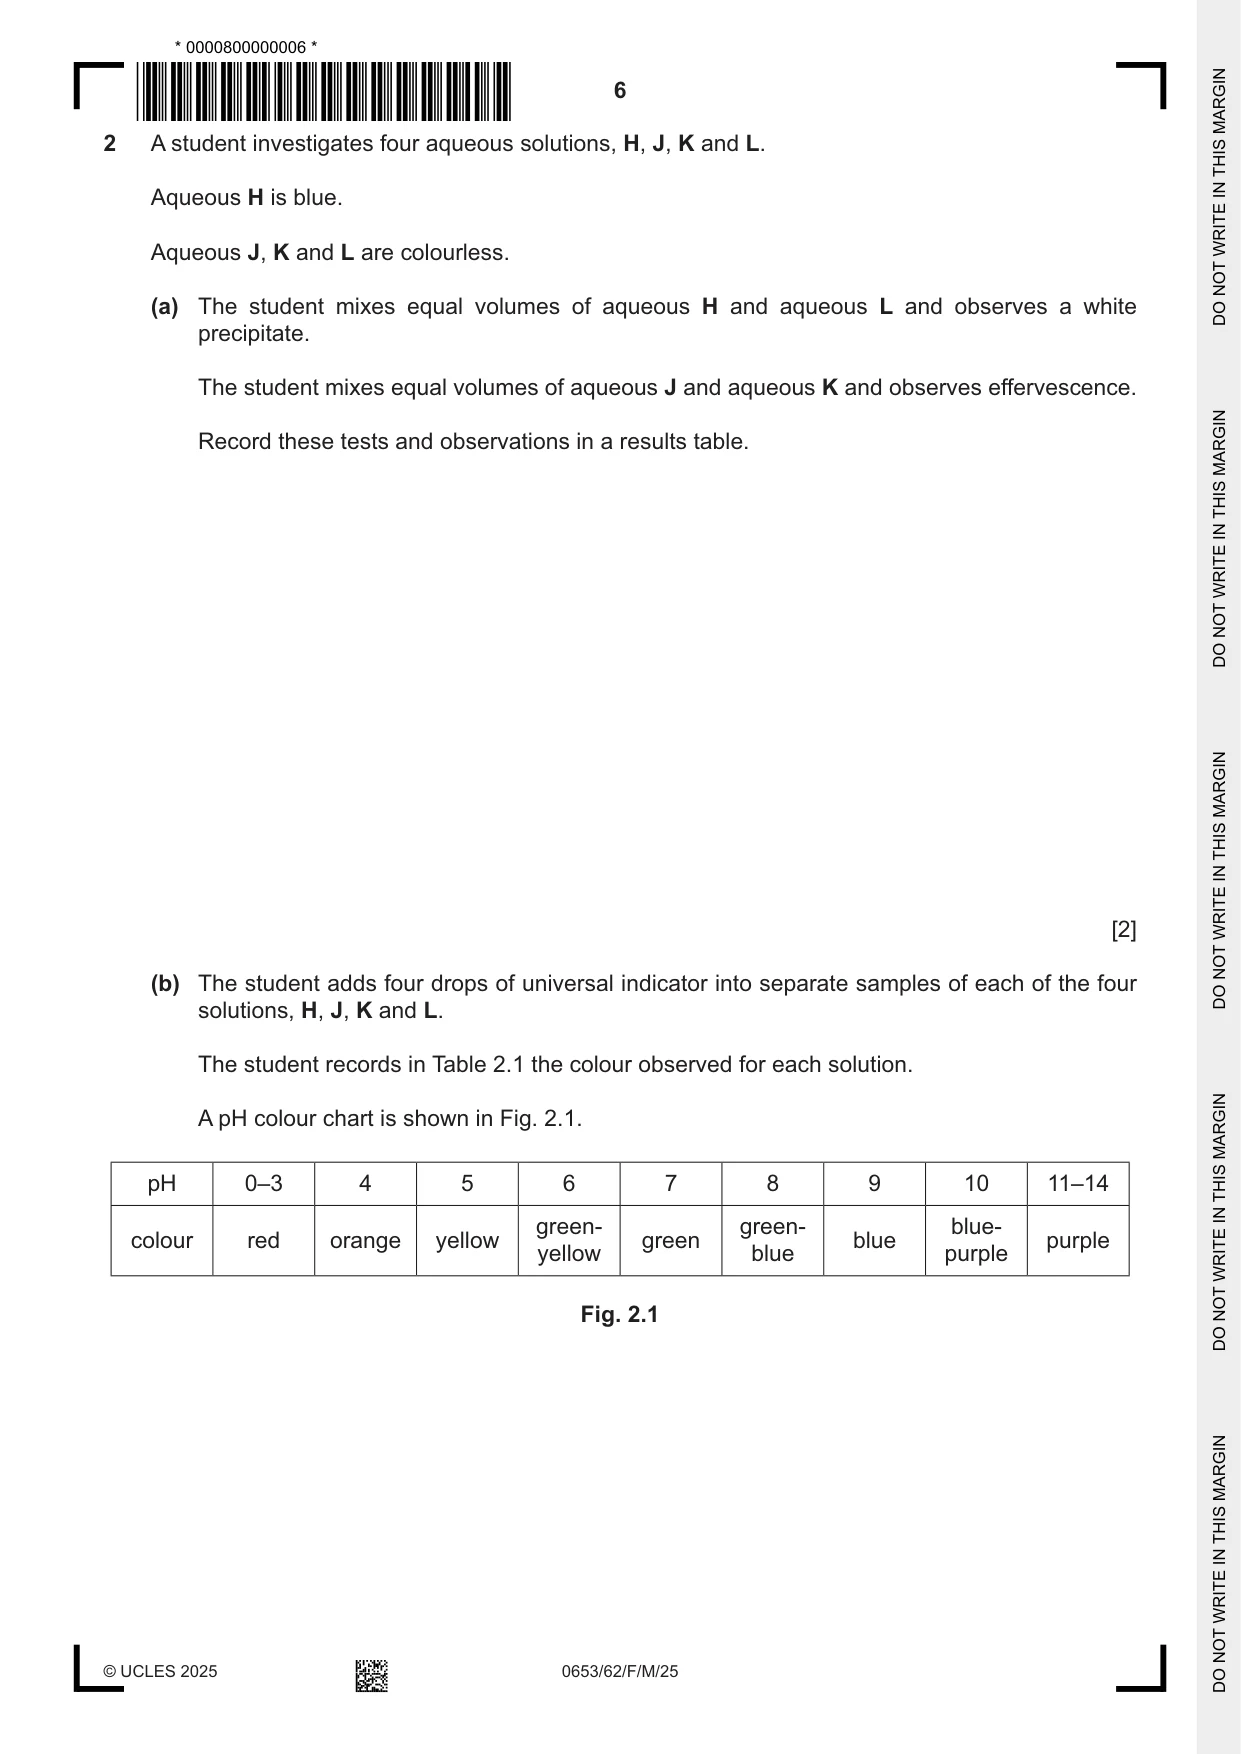
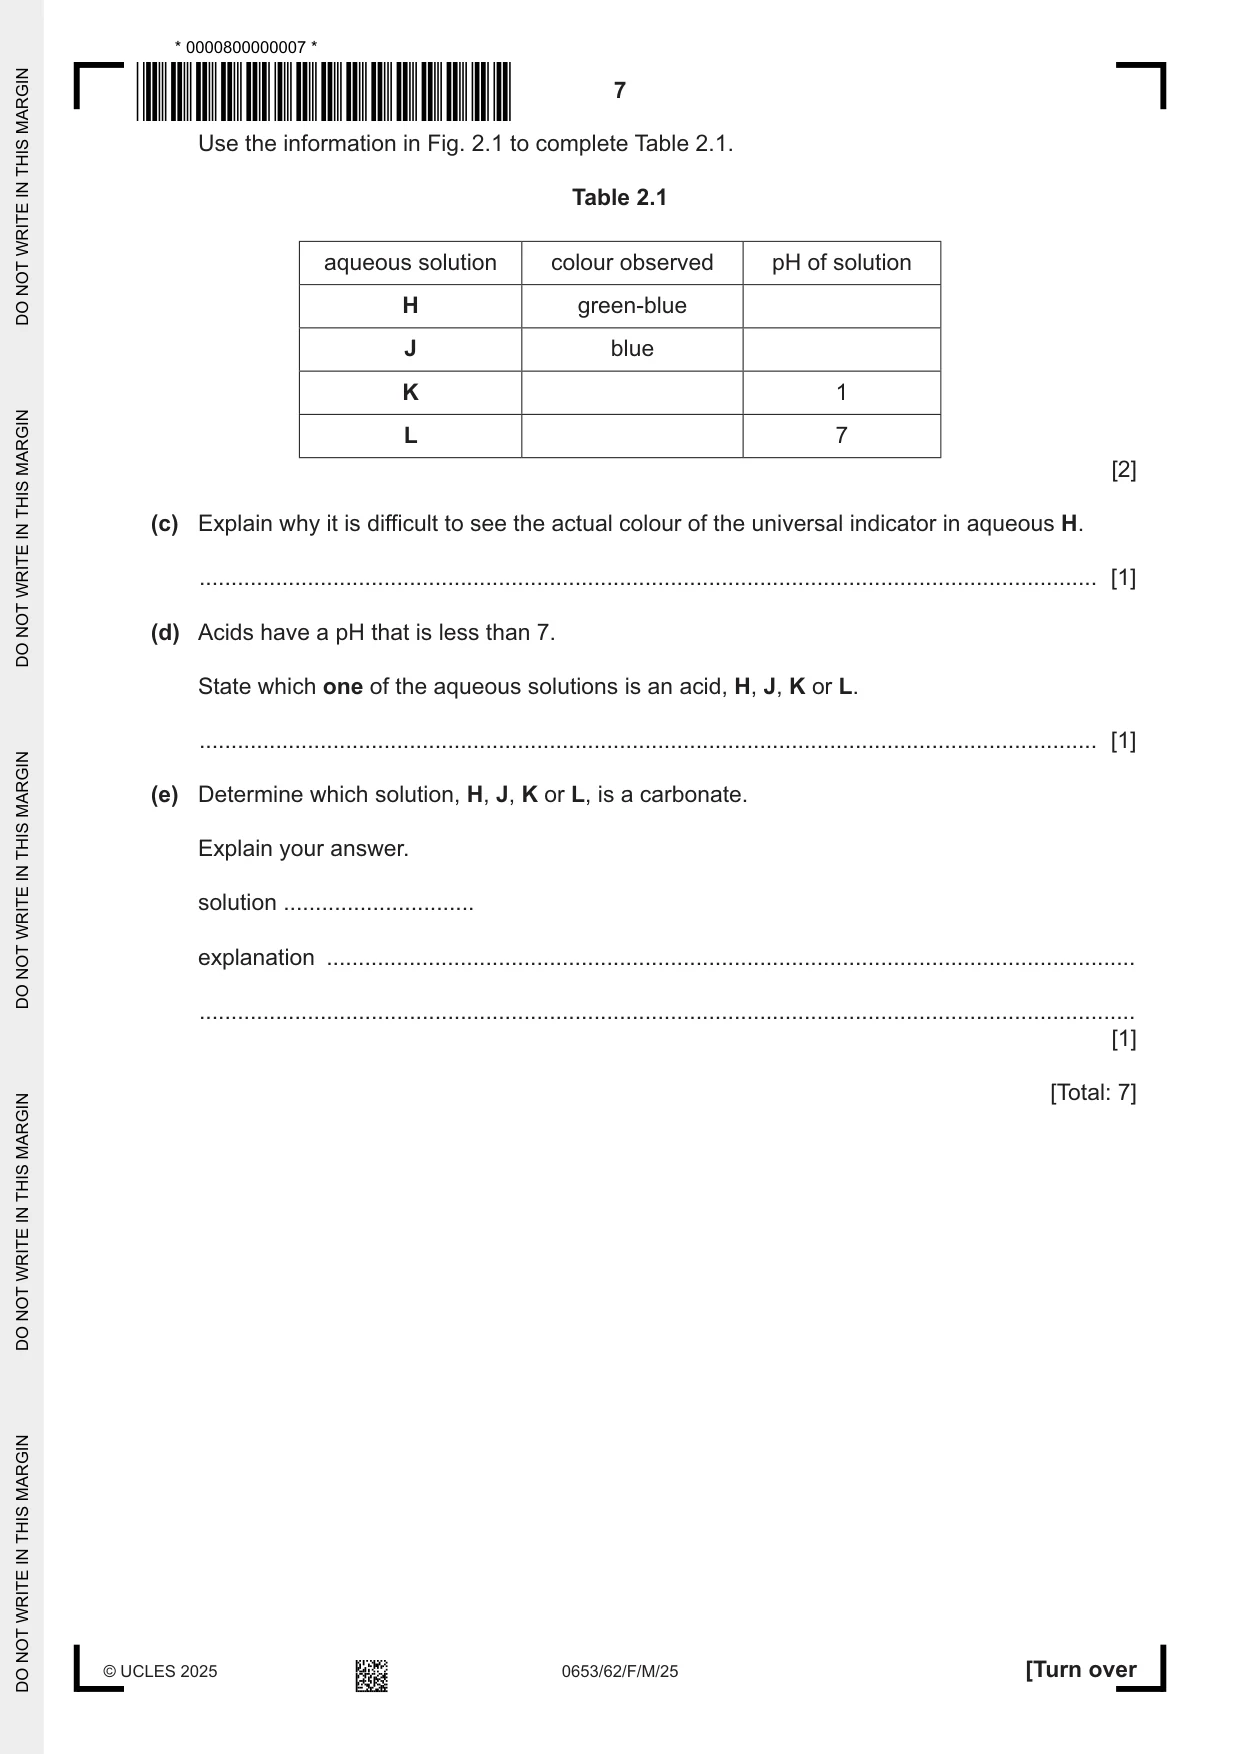
2 A student investigates four aqueous solutions, H, J, K and L. Aqueous H is blue. Aqueous J, K and L are colourless. (a) The student mixes equal volumes of aqueous H and aqueous L and observes a white precipitate. The student mixes equal volumes of aqueous J and aqueous K and observes effervescence. Record these tests and observations in a results table. [2] (b) The student adds four drops of universal indicator into separate samples of each of the four solutions, H, J, K and L. The student records in Table 2.1 the colour observed for each solution. A pH colour chart is shown in Fig. 2.1. pH 0–3 4 5 6 7 8 9 10 11–14 green- green- blue- colour red orange yellow green blue purple yellow blue purple Fig. 2.1 Use the information in Fig. 2.1 to complete Table 2.1. Table 2.1 aqueous solution colour observed pH of solution H green-blue J blue K 1 L 7 [2] (c) Explain why it is difficult to see the actual colour of the universal indicator in aqueous H. ............................................................................................................................................. [1] (d) Acids have a pH that is less than 7. State which one of the aqueous solutions is an acid, H, J, K or L. ............................................................................................................................................. [1] (e) Determine which solution, H, J, K or L, is a carbonate. Explain your answer. solution .............................. explanation ............................................................................................................................... ................................................................................................................................................... [1] [Total: 7]
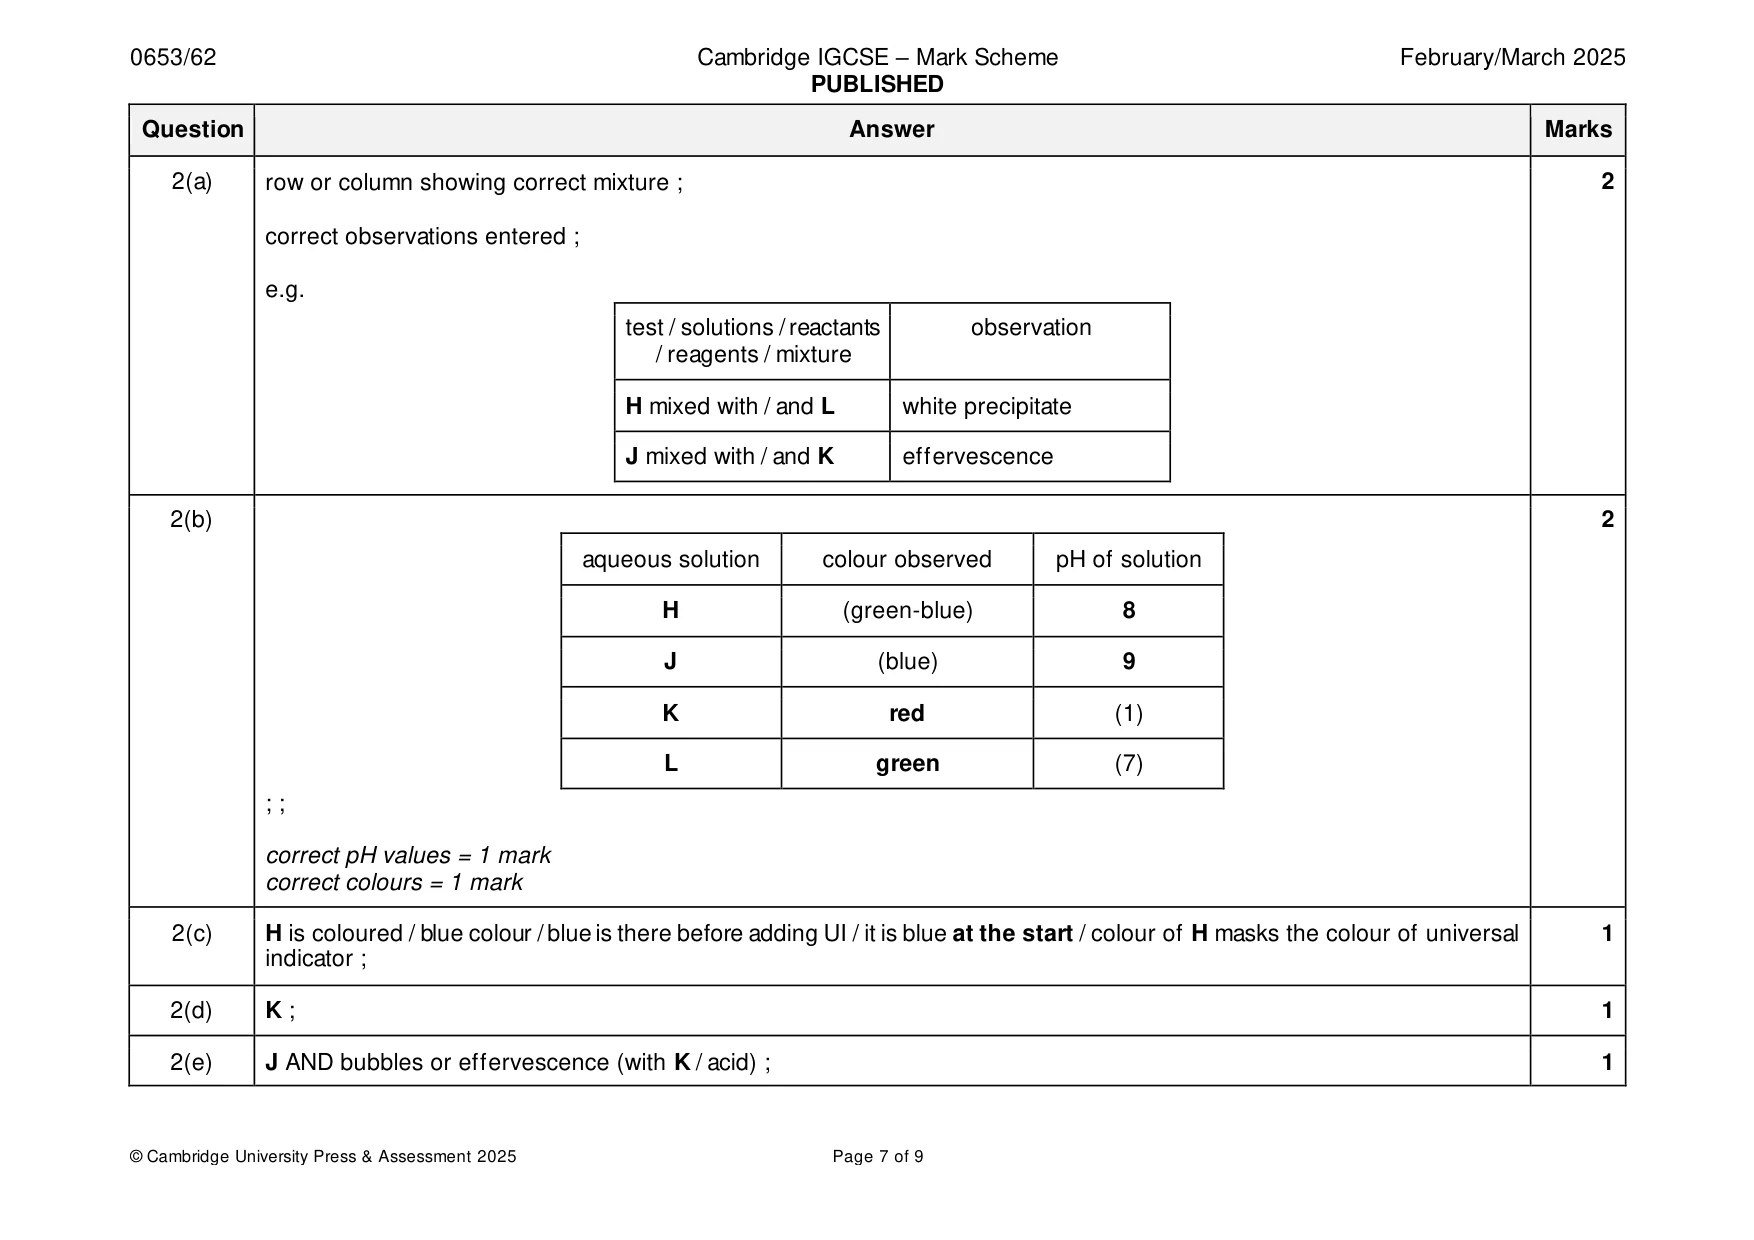
Mark scheme: 2(a) row or column showing correct mixture ; 2 correct observations entered ; e.g. test / solutions / reactants observation / reagents / mixture H mixed with / and L white precipitate J mixed with / and K effervescence 2(b) 2 aqueous solution colour observed pH of solution H (green-blue) 8 J (blue) 9 K red (1) L green (7) ; ; correct pH values = 1 mark correct colours = 1 mark 2(c) H is coloured / blue colour / blue is there before adding UI / it is blue at the start / colour of H masks the colour of universal 1 indicator ; 2(d) K ; 1 2(e) J AND bubbles or effervescence (with K / acid) ; 1
Q3 · When a detergent is shaken with water it forms a layer of bubbles called foam
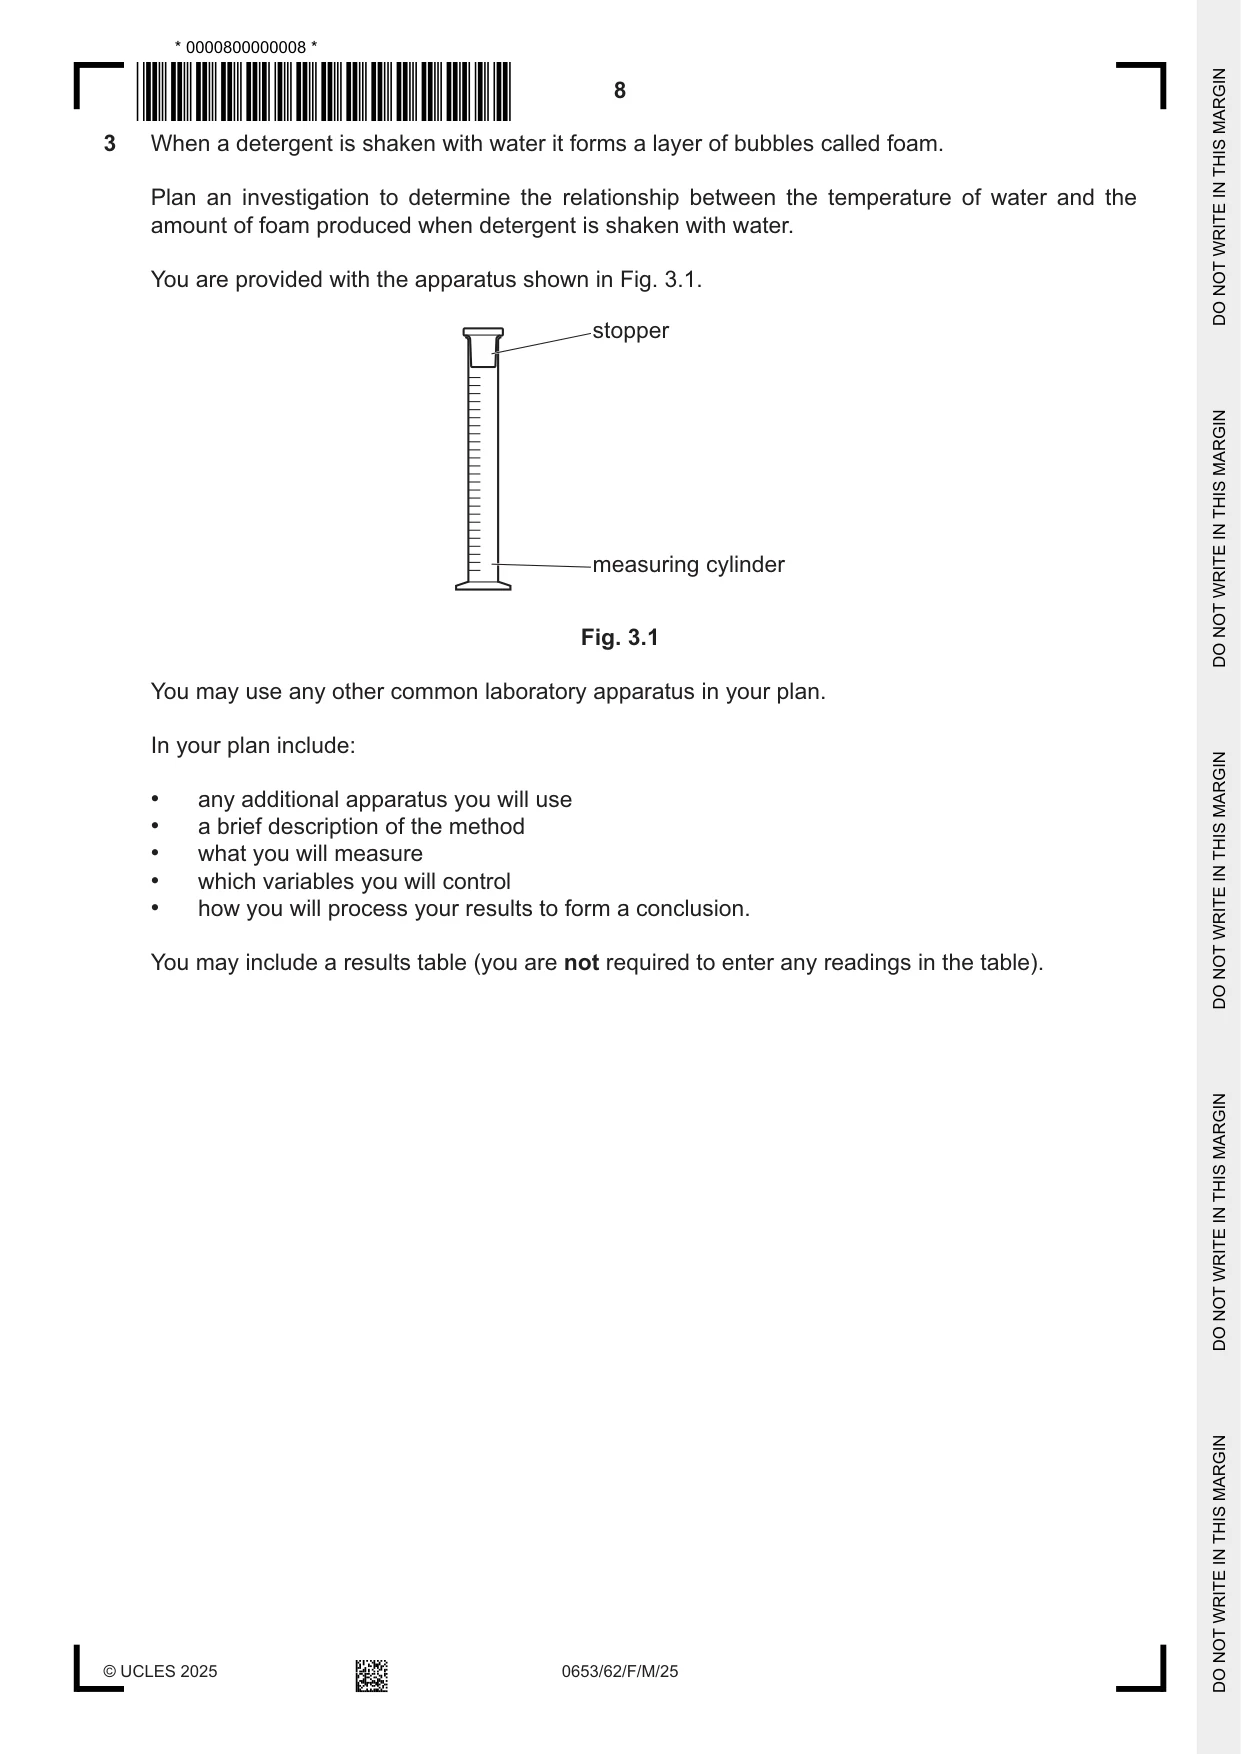
3 When a detergent is shaken with water it forms a layer of bubbles called foam. Plan an investigation to determine the relationship between the temperature of water and the amount of foam produced when detergent is shaken with water. You are provided with the apparatus shown in Fig. 3.1. stopper measuring cylinder Fig. 3.1 You may use any other common laboratory apparatus in your plan. In your plan include: • any additional apparatus you will use • a brief description of the method • what you will measure • which variables you will control • how you will process your results to form a conclusion. You may include a results table (you are not required to enter any readings in the table). ................................................................................................................................................... ................................................................................................................................................... ................................................................................................................................................... ................................................................................................................................................... ................................................................................................................................................... ................................................................................................................................................... ................................................................................................................................................... ................................................................................................................................................... ................................................................................................................................................... ................................................................................................................................................... ................................................................................................................................................... ................................................................................................................................................... ................................................................................................................................................... ............................................................................................................................................. [7]
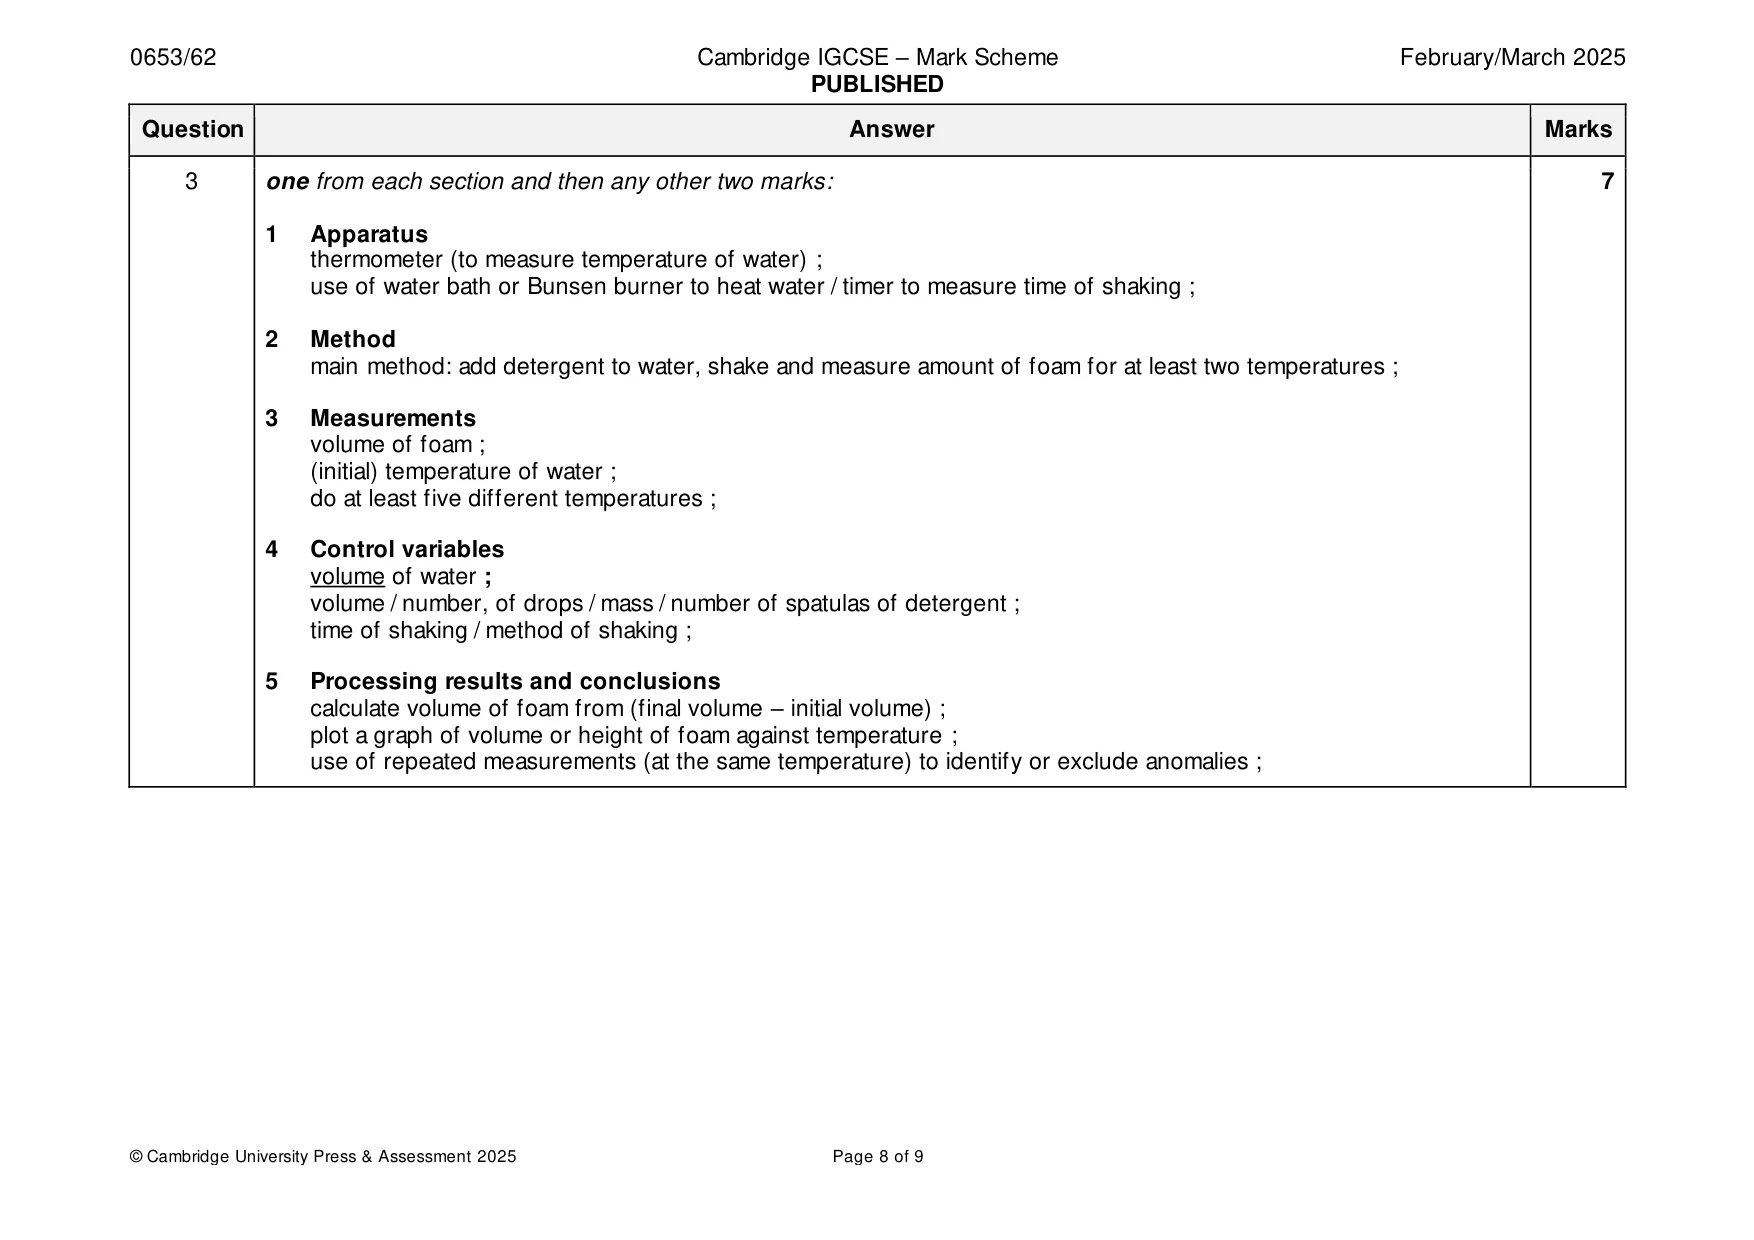
Mark scheme: 3 one from each section and then any other two marks: 7 1 Apparatus thermometer (to measure temperature of water) ; use of water bath or Bunsen burner to heat water / timer to measure time of shaking ; 2 Method main method: add detergent to water, shake and measure amount of foam for at least two temperatures ; 3 Measurements volume of foam ; (initial) temperature of water ; do at least five different temperatures ; 4 Control variables volume of water ; volume / number, of drops / mass / number of spatulas of detergent ; time of shaking / method of shaking ; 5 Processing results and conclusions calculate volume of foam from (final volume – initial volume) ; plot a graph of volume or height of foam against temperature ; use of repeated measurements (at the same temperature) to identify or exclude anomalies ;
Q4 · A student determines the pressure exerted on a table by a wooden block
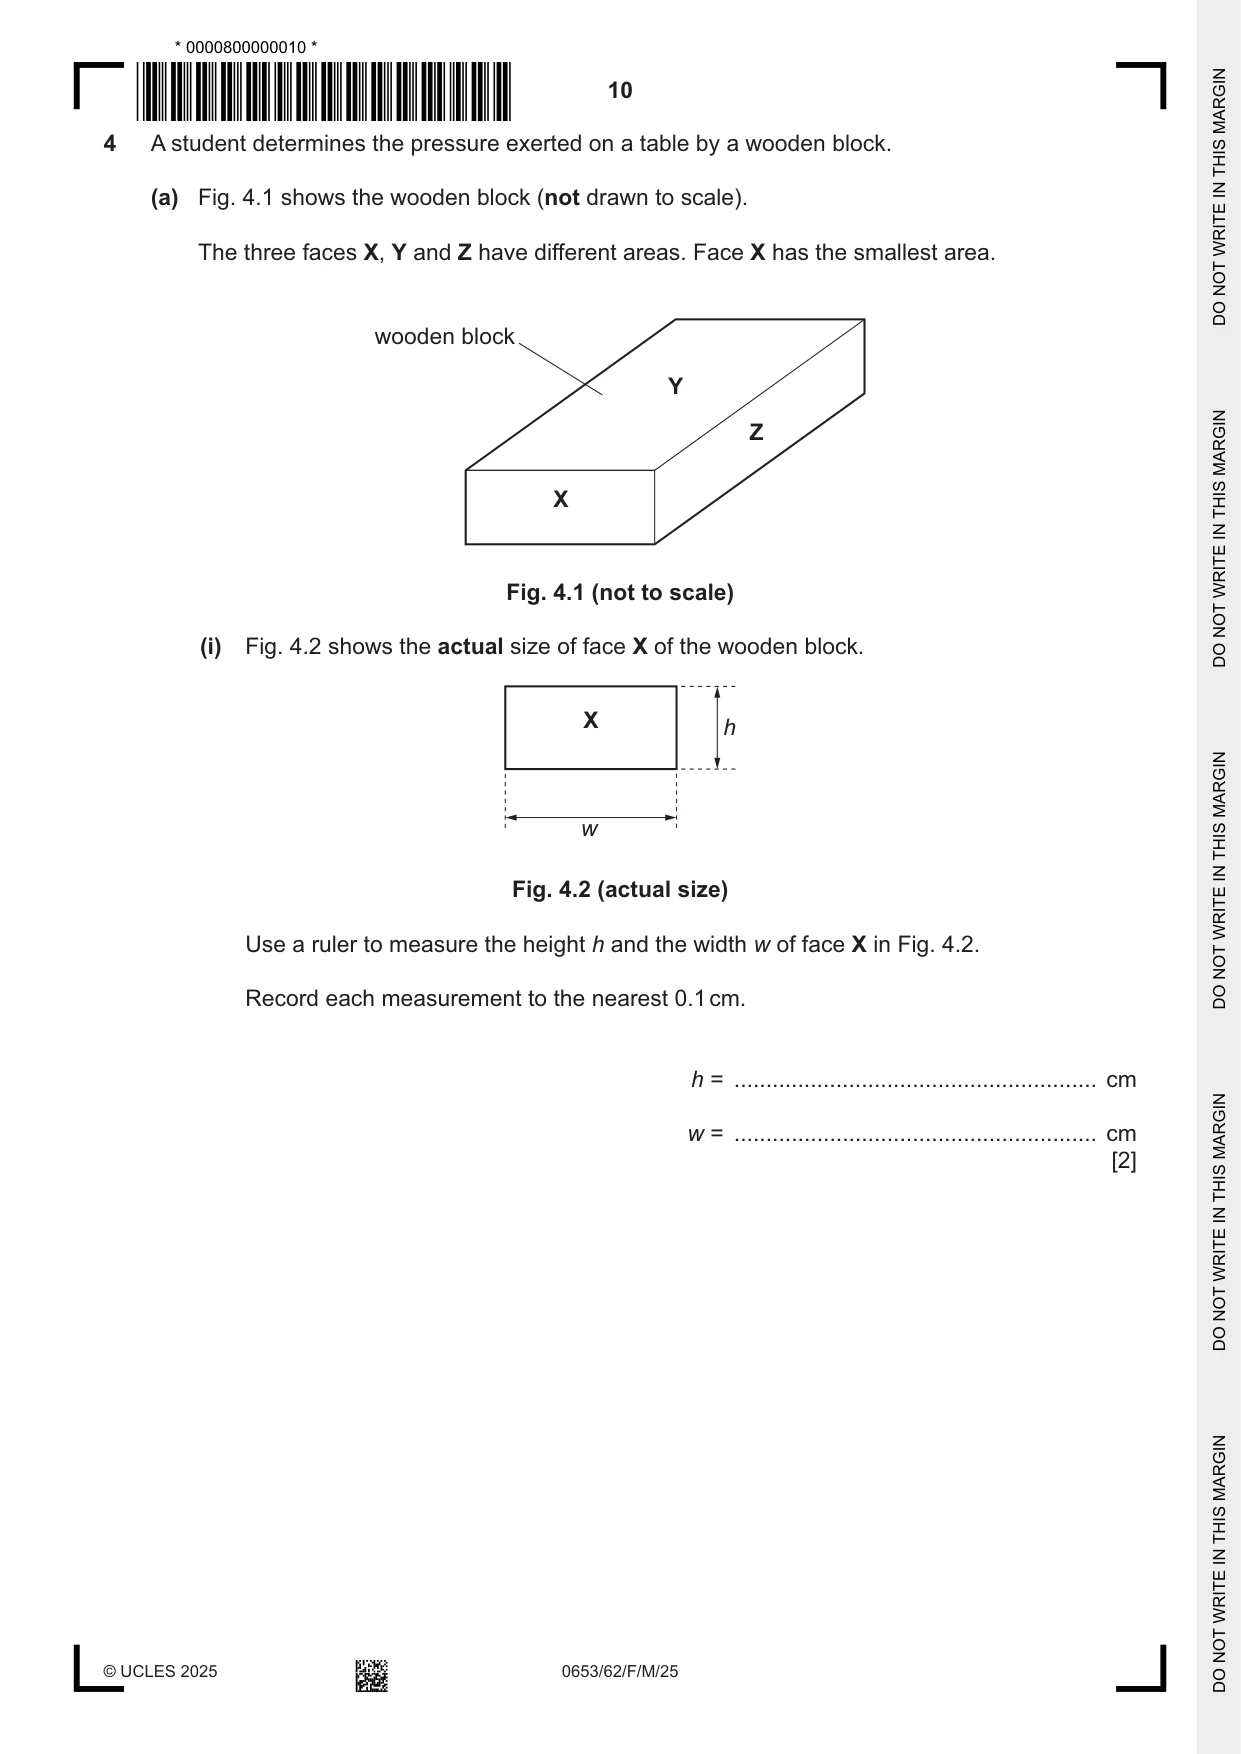
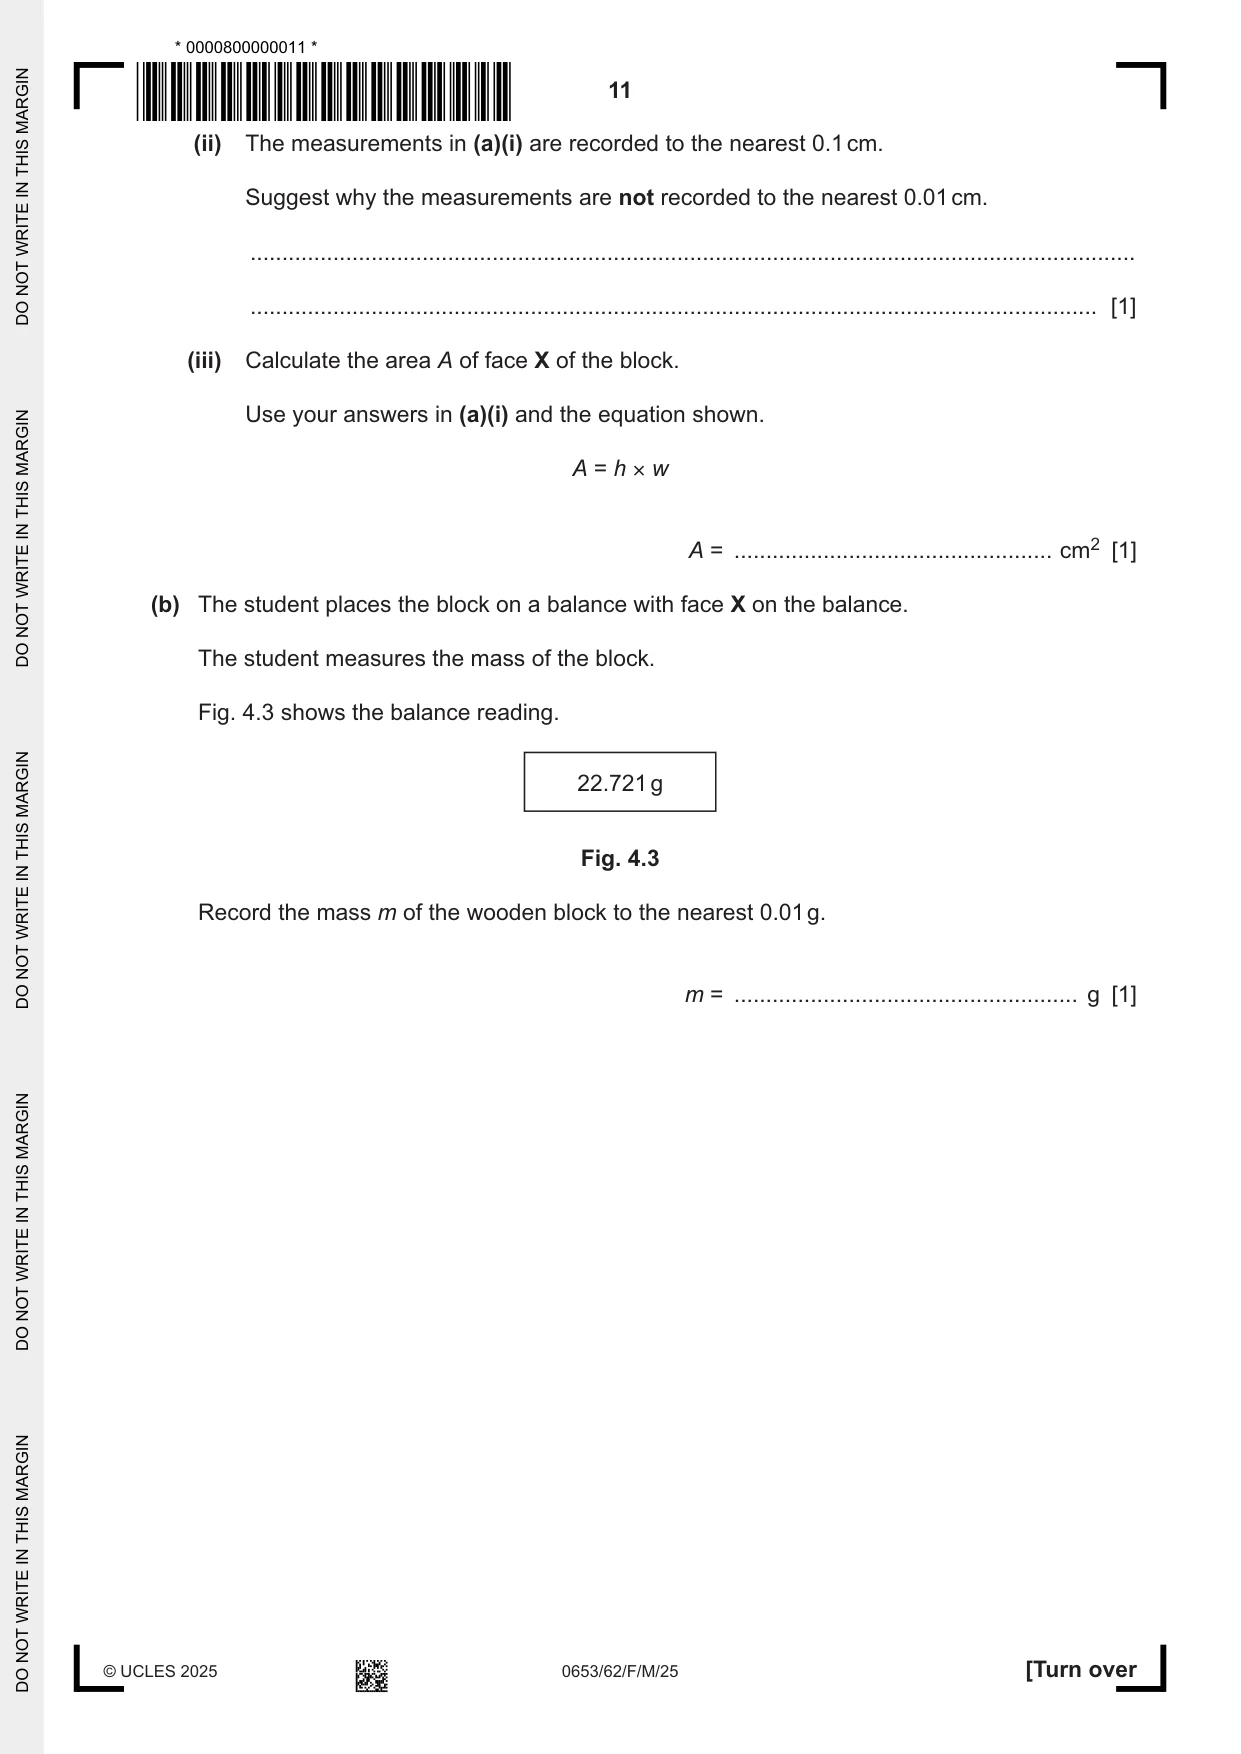
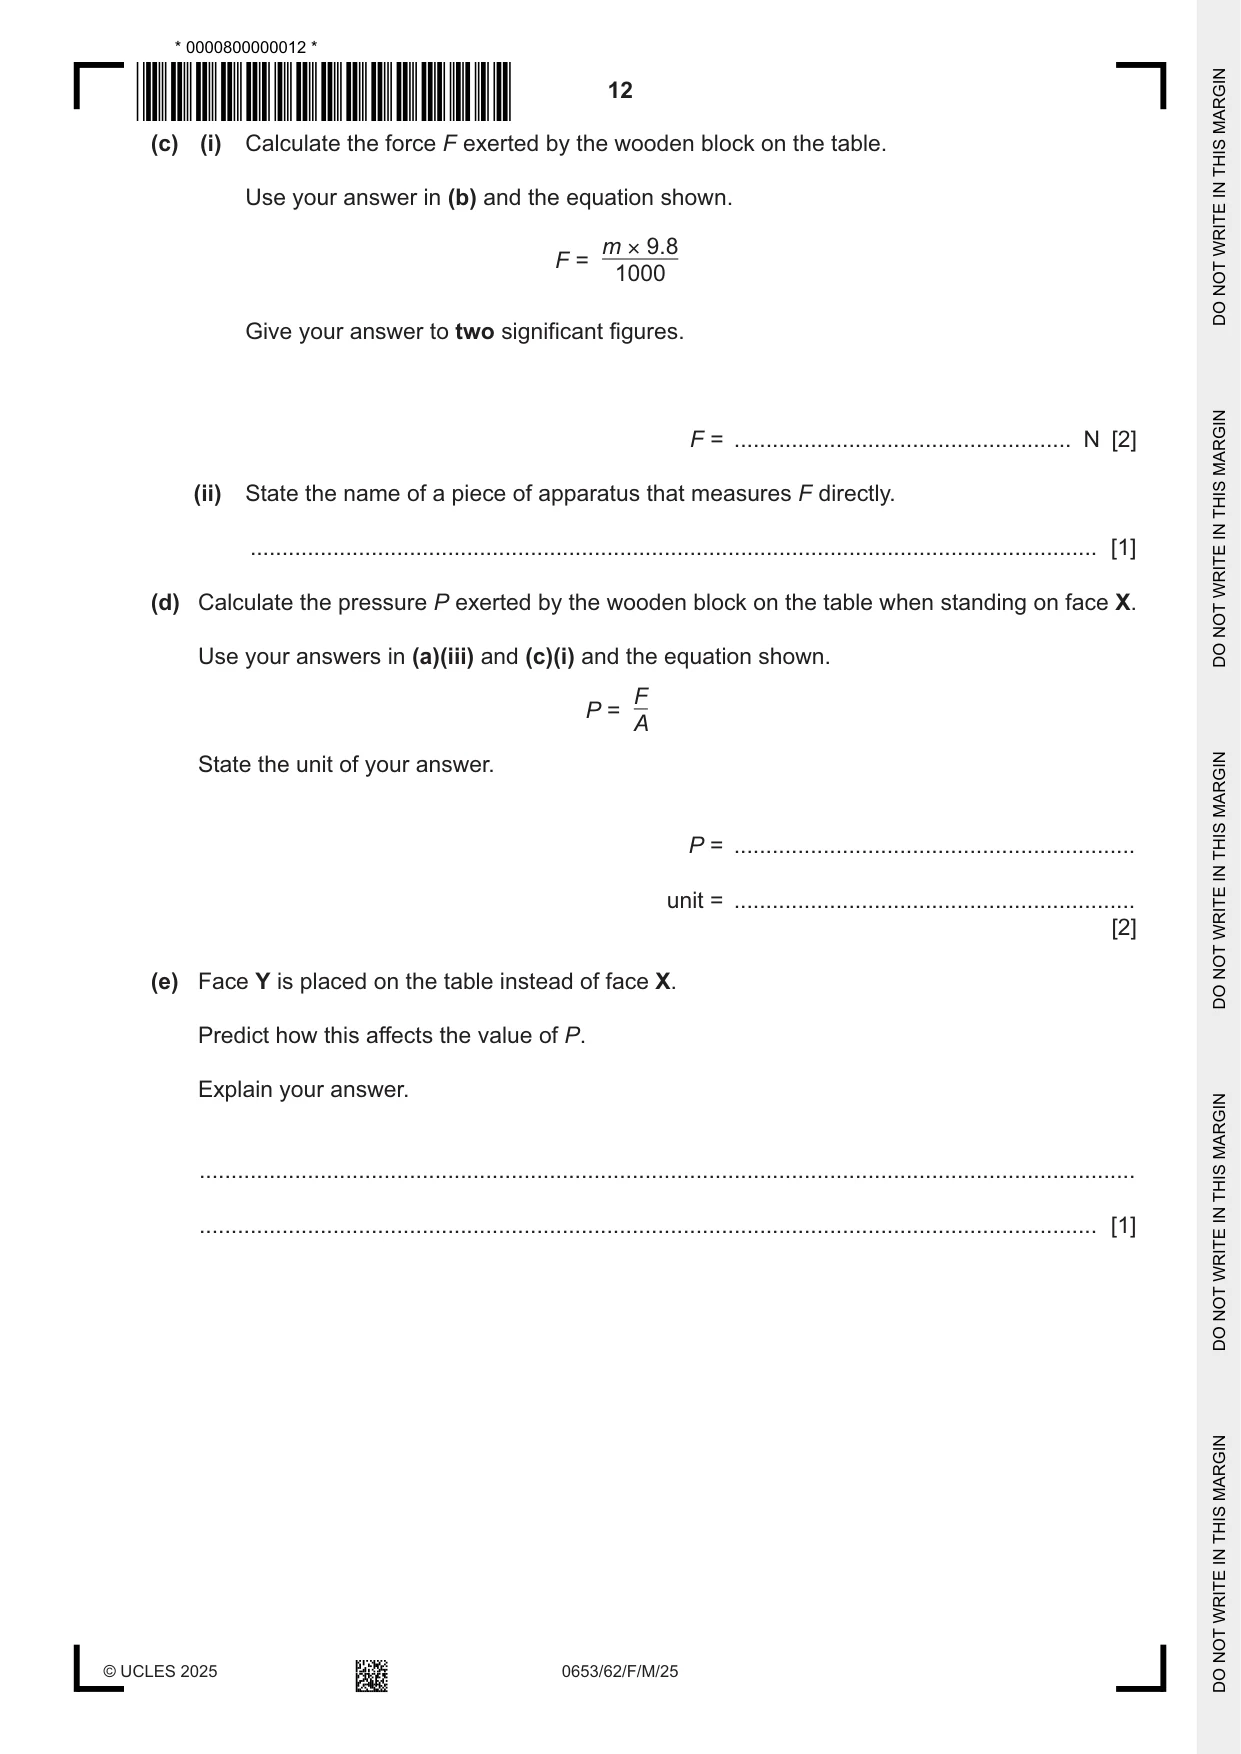
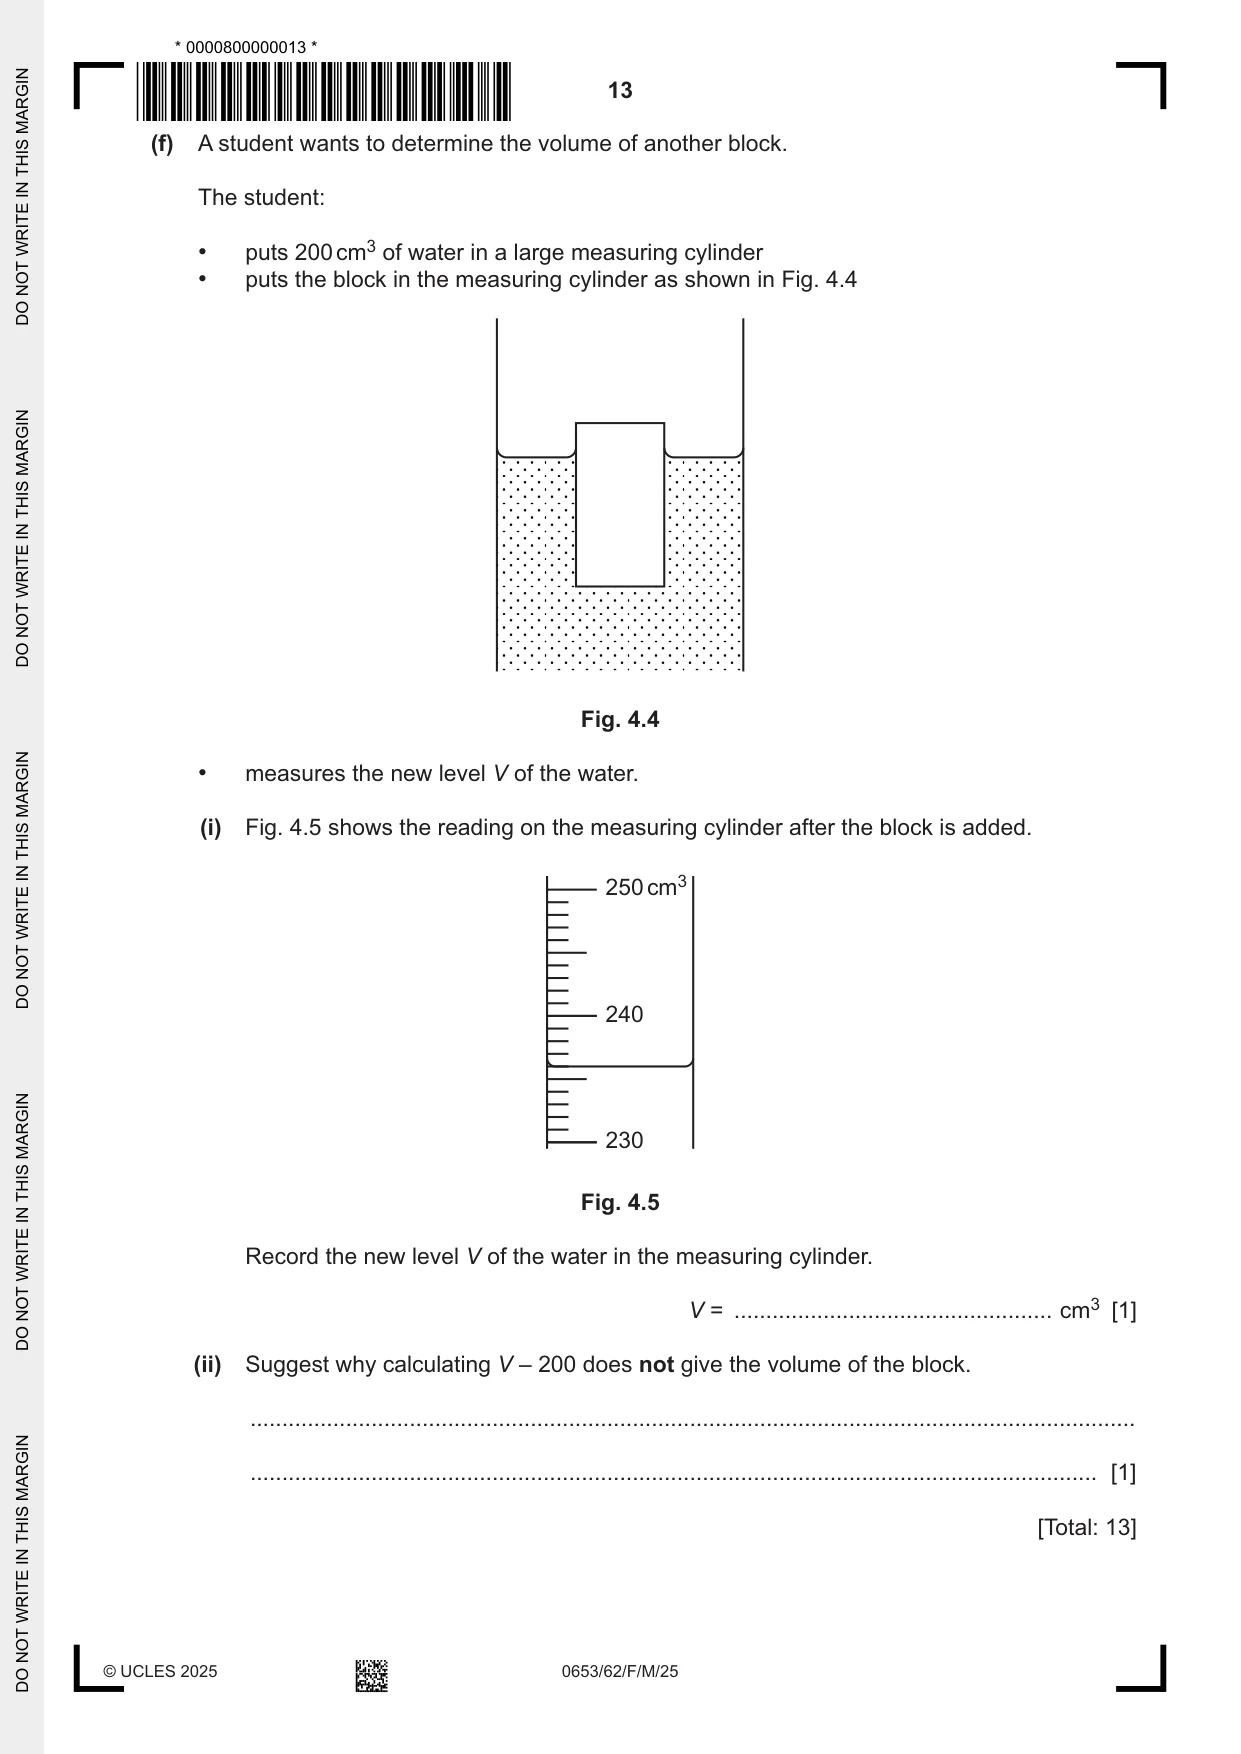
4 A student determines the pressure exerted on a table by a wooden block. (a) Fig. 4.1 shows the wooden block (not drawn to scale). The three faces X, Y and Z have different areas. Face X has the smallest area. wooden block Y Z X Fig. 4.1 (not to scale) (i) Fig. 4.2 shows the actual size of face X of the wooden block. X h w Fig. 4.2 (actual size) Use a ruler to measure the height h and the width w of face X in Fig. 4.2. Record each measurement to the nearest 0.1 cm. h = ......................................................... cm w = ......................................................... cm [2] (ii) The measurements in (a)(i) are recorded to the nearest 0.1 cm. Suggest why the measurements are not recorded to the nearest 0.01 cm. ........................................................................................................................................... ..................................................................................................................................... [1] (iii) Calculate the area A of face X of the block. Use your answers in (a)(i) and the equation shown. A = h × w A = .................................................. cm2 [1] (b) The student places the block on a balance with face X on the balance. The student measures the mass of the block. Fig. 4.3 shows the balance reading. 22.721 g Fig. 4.3 Record the mass m of the wooden block to the nearest 0.01 g. m = ...................................................... g [1] (c) (i) Calculate the force F exerted by the wooden block on the table. Use your answer in (b) and the equation shown. m × 9.8 F = 1000 Give your answer to two significant figures. F = ..................................................... N [2] (ii) State the name of a piece of apparatus that measures F directly. ..................................................................................................................................... [1] (d) Calculate the pressure P exerted by the wooden block on the table when standing on face X. Use your answers in (a)(iii) and (c)(i) and the equation shown. F P = A State the unit of your answer. P = ............................................................... unit = ............................................................... [2] (e) Face Y is placed on the table instead of face X. Predict how this affects the value of P. Explain your answer. ................................................................................................................................................... ............................................................................................................................................. [1]
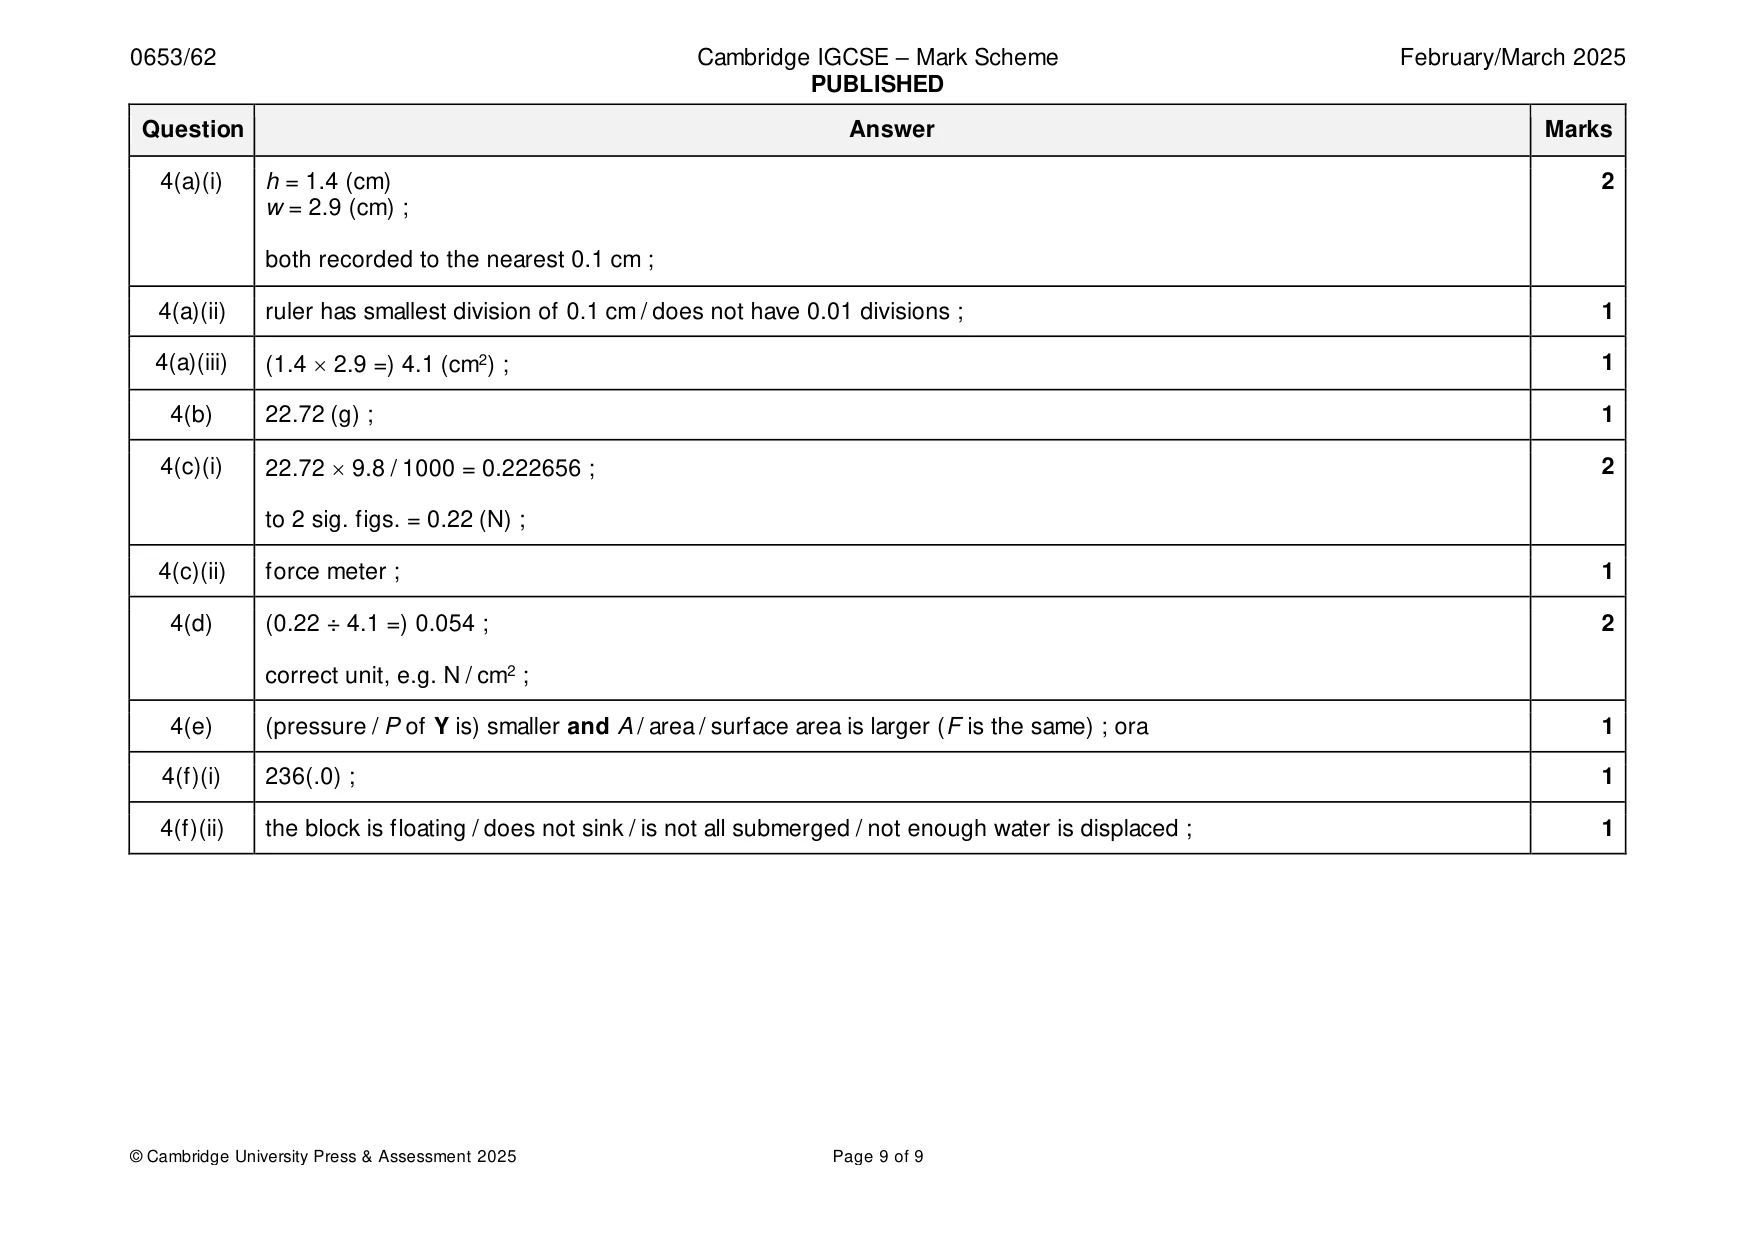
Mark scheme: 4(a)(i) h = 1.4 (cm) 2 w = 2.9 (cm) ; both recorded to the nearest 0.1 cm ; 4(a)(ii) ruler has smallest division of 0.1 cm / does not have 0.01 divisions ; 1 4(a)(iii) (1.4 2.9 =) 4.1 (cm2) ; 1 4(b) 22.72 (g) ; 1 4(c)(i) 22.72 9.8 / 1000 = 0.222656 ; 2 to 2 sig. figs. = 0.22 (N) ; 4(c)(ii) force meter ; 1 4(d) (0.22 ÷ 4.1 =) 0.054 ; 2 correct unit, e.g. N / cm2 ; 4(e) (pressure / P of Y is) smaller and A / area / surface area is larger (F is the same) ; ora 1 4(f)(i) 236(.0) ; 1 4(f)(ii) the block is floating / does not sink / is not all submerged / not enough water is displaced ; 1
What was in this paper
The subtopics covered by these 4 questions, and how many questions each got. Open one in a new tab to see every Cambridge question on it.
What you needed in this session
Cambridge’s own grade thresholds for 2025 Feb/March, Paper 6 · Variant 2. A higher threshold means an easier paper — the bar moves with how the cohort did.