Cambridge IGCSE Science - Combined 0653 — 2022 May/June Paper 6 · Variant 2
0653/62/M/J/22 · 4 questions · 40 marks · ≈45 min
The question paper and its mark scheme, free to read here and free to download. This is Cambridge’s own paper, exactly as it was sat.
Question paper16 pages



Mark scheme8 pages
Answers below. Sit the paper first if you are practising.
Questions as text
Q1 · Water moves into a cell by osmosis
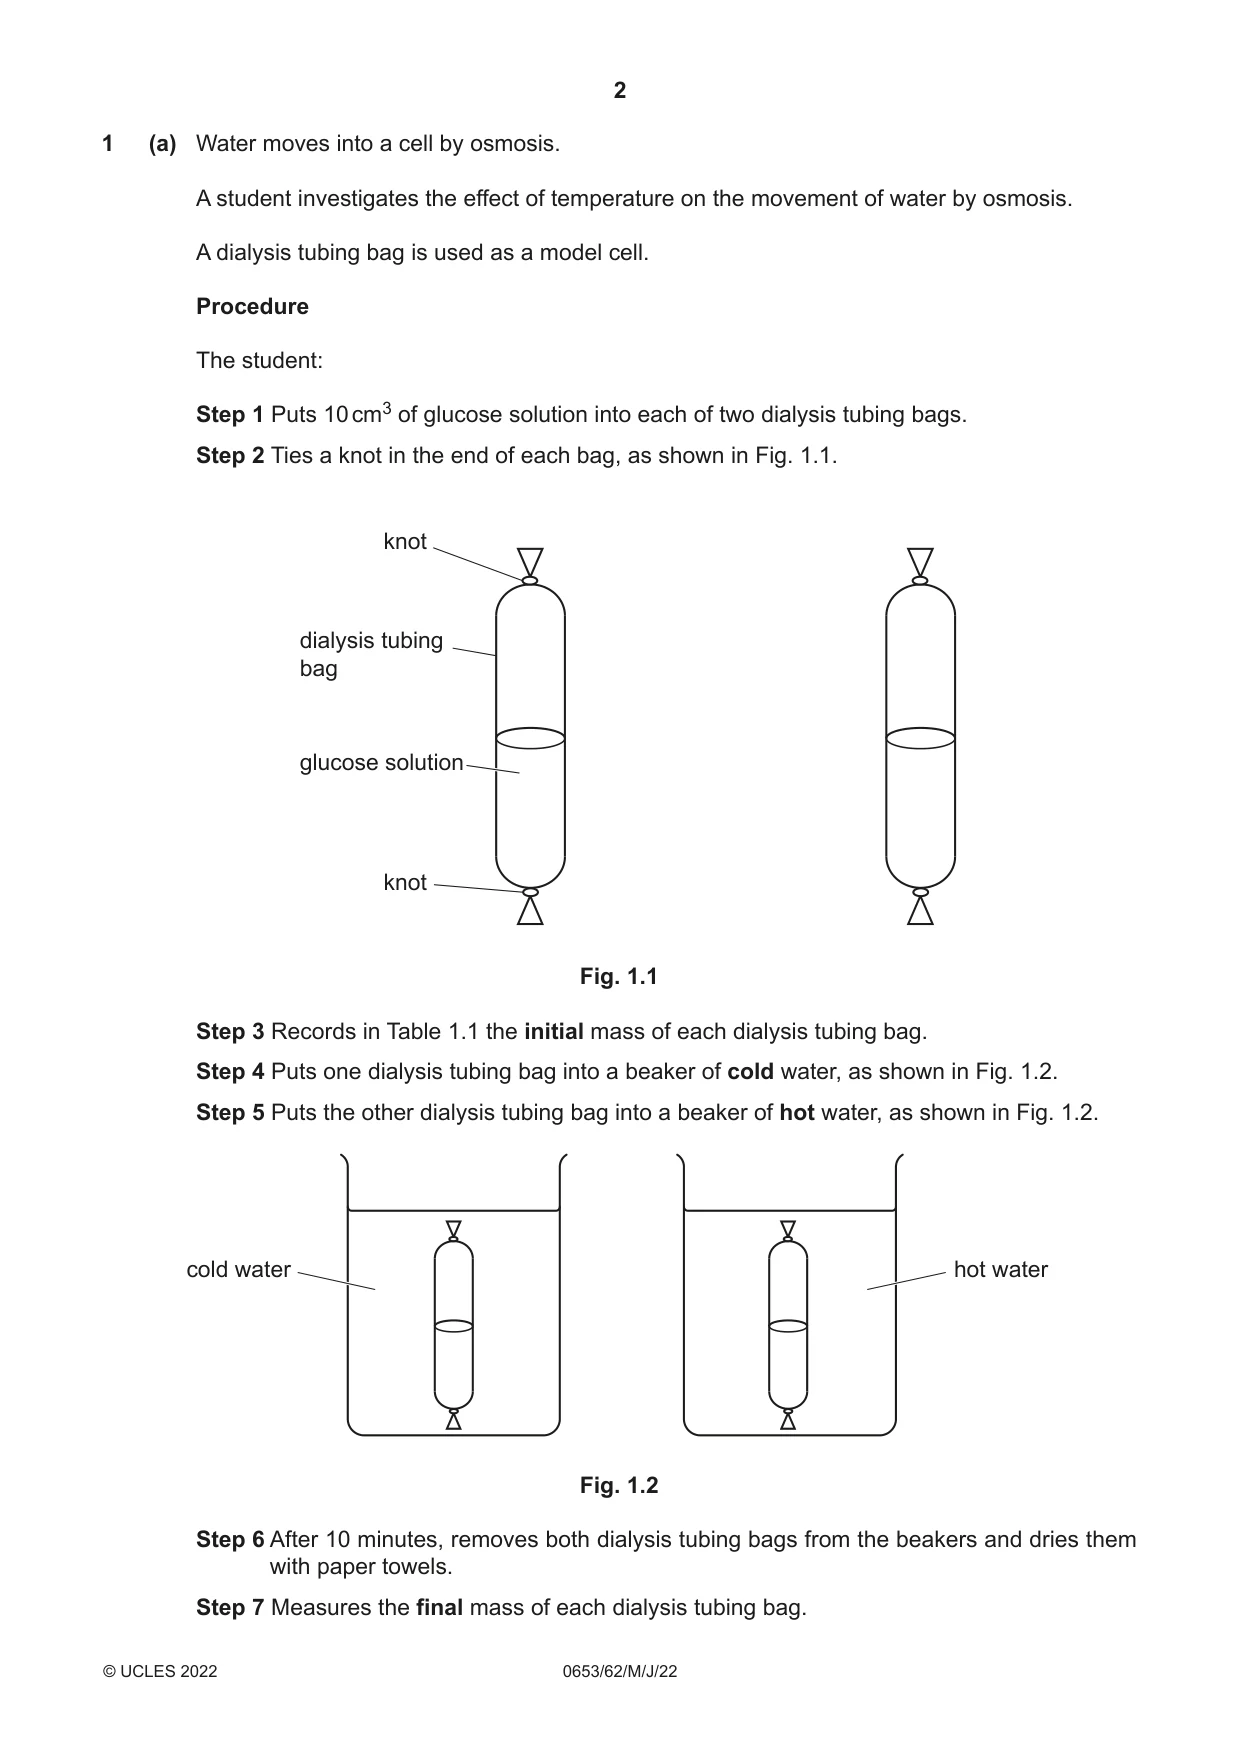
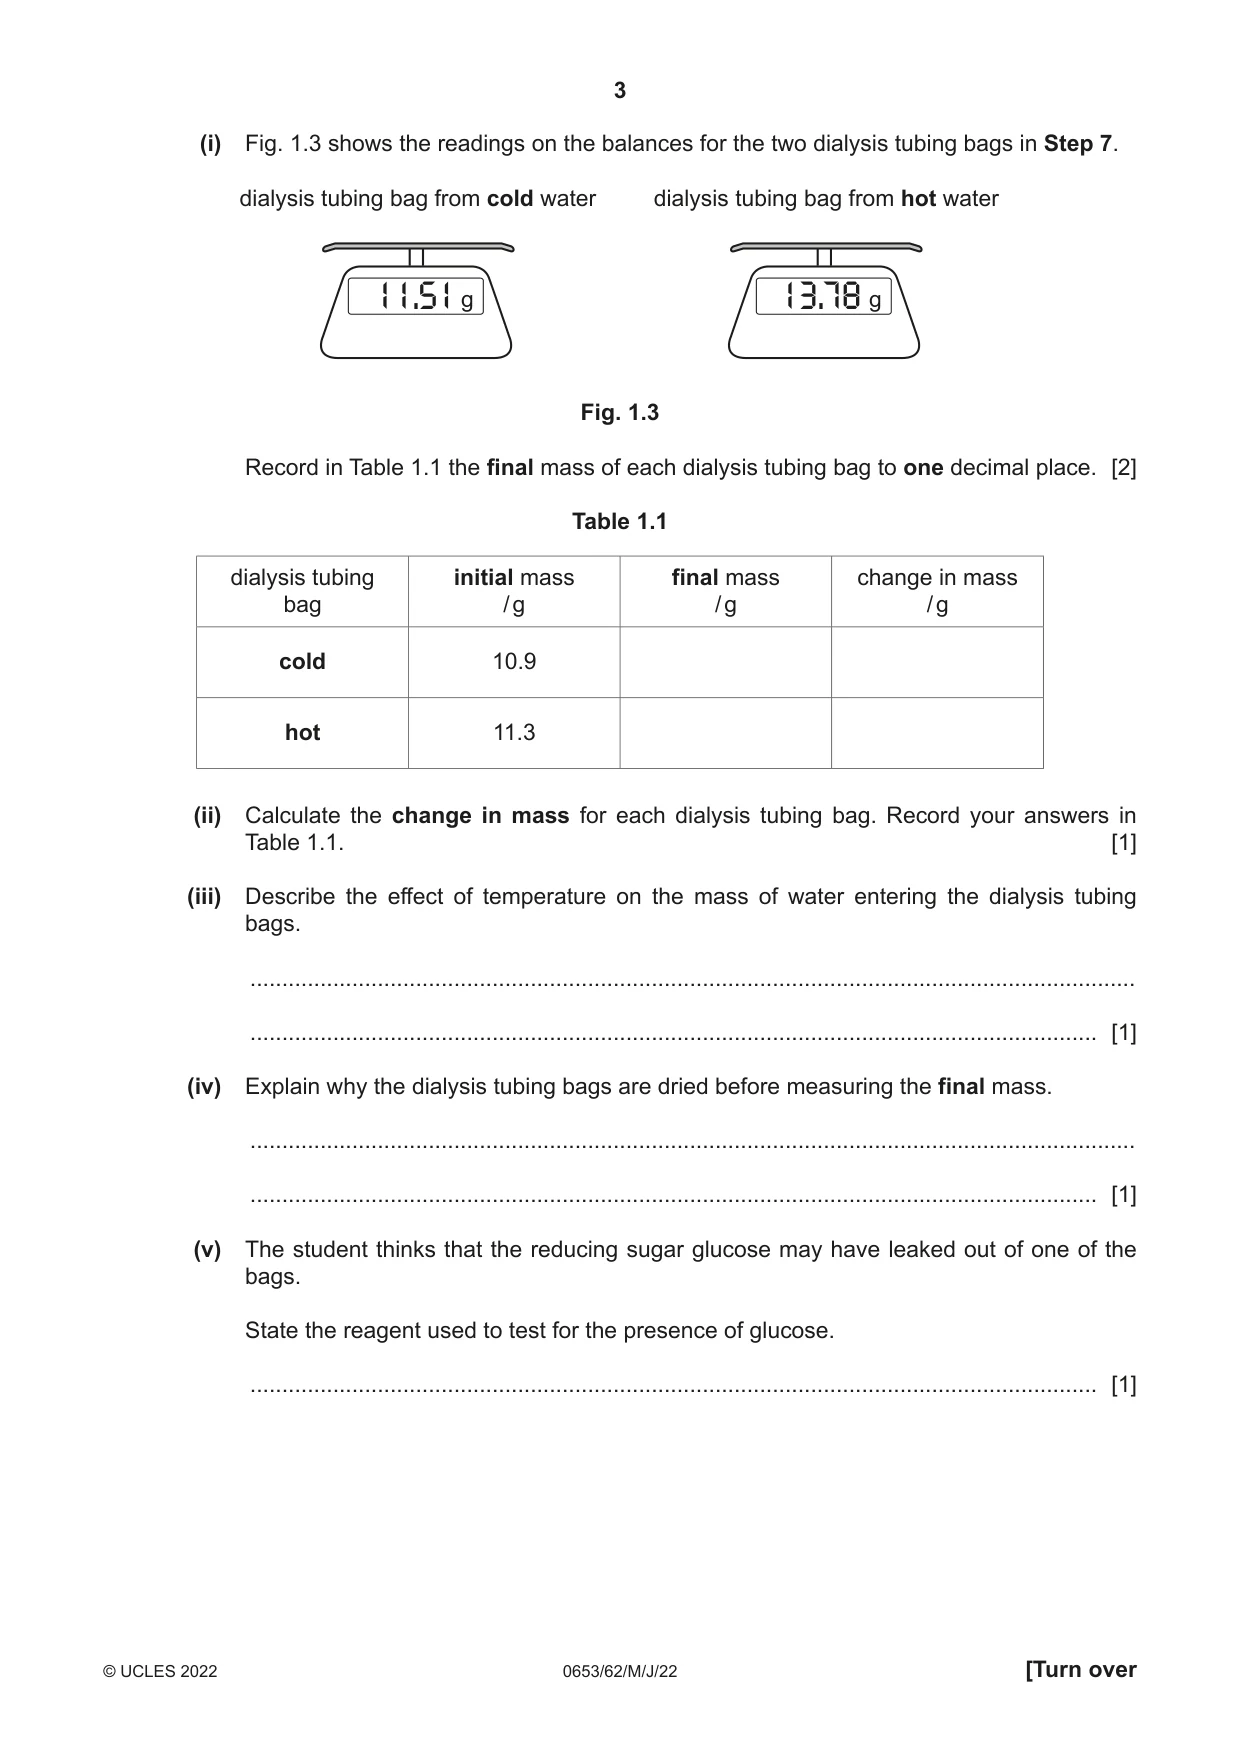
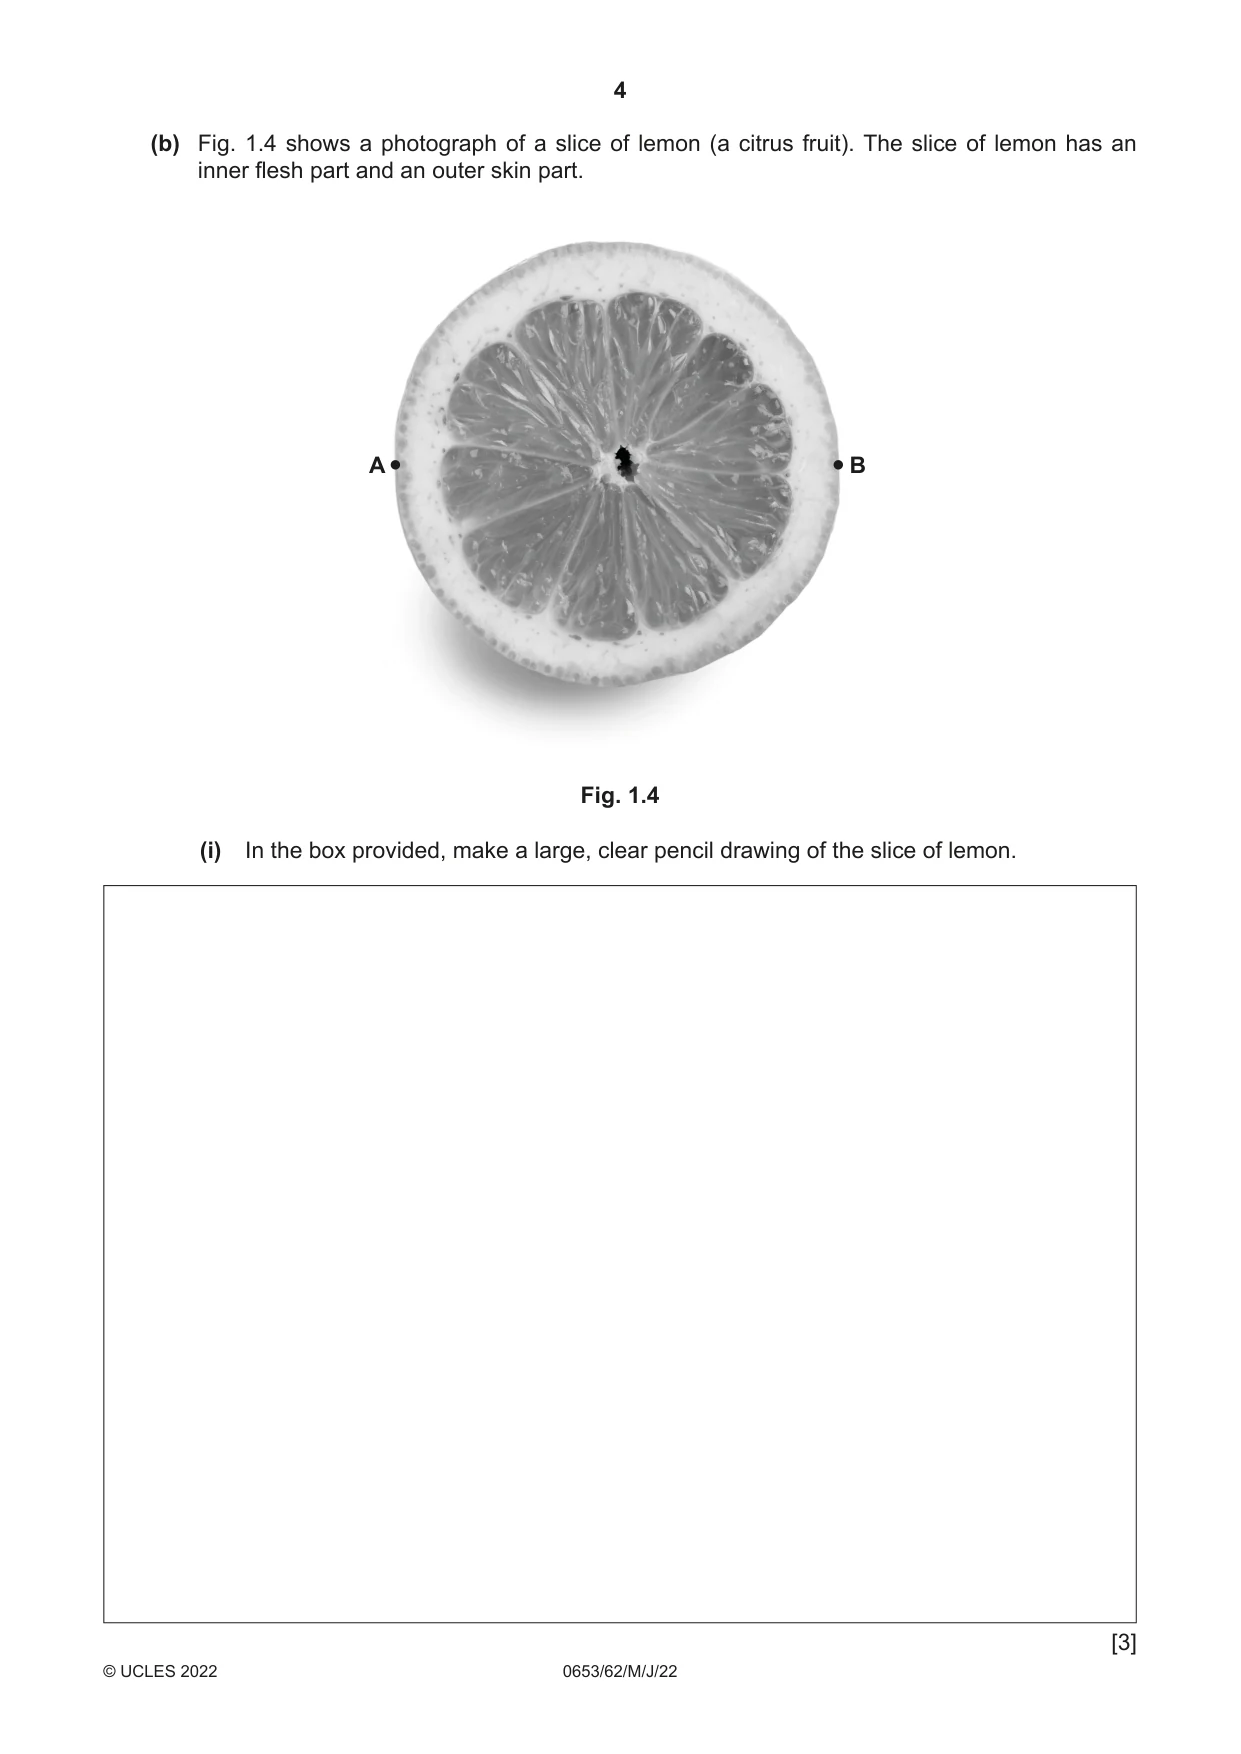
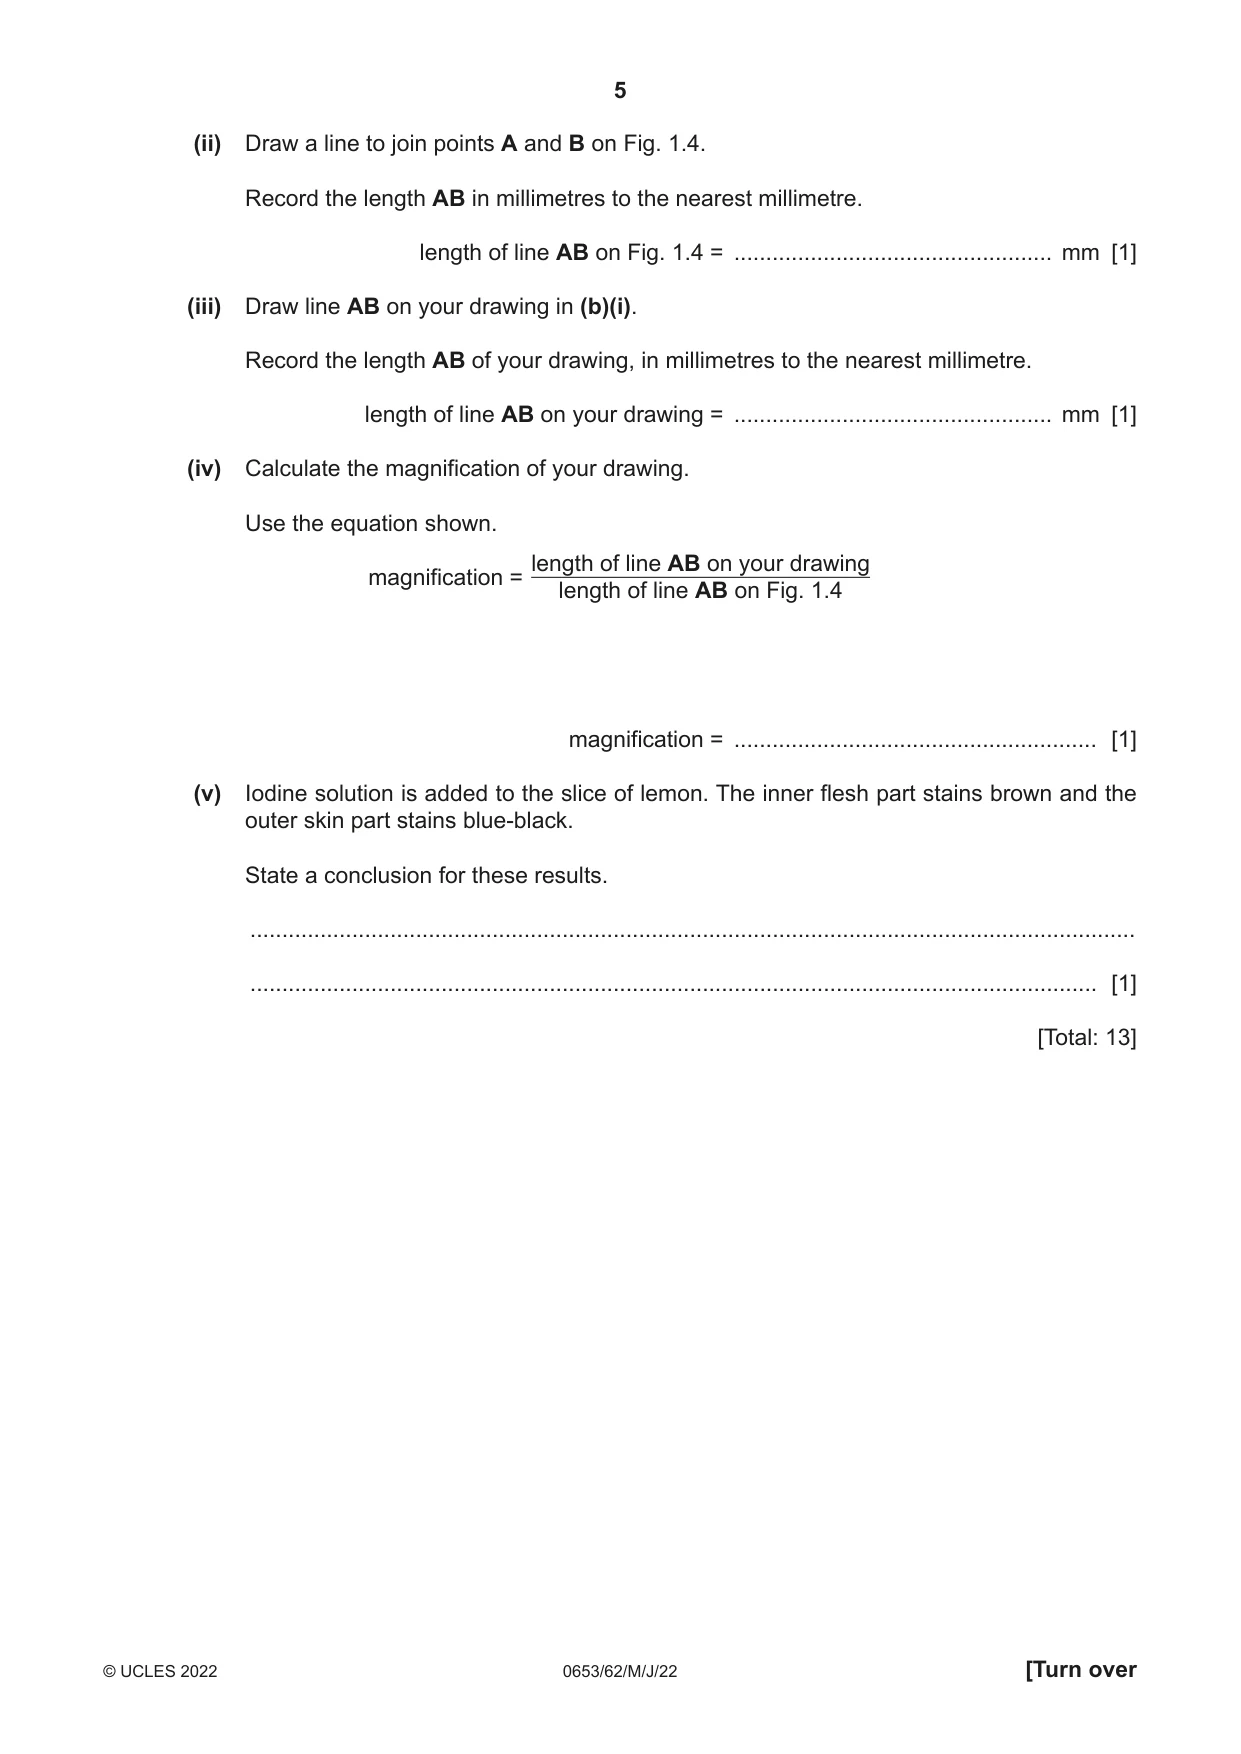
1 (a) Water moves into a cell by osmosis. A student investigates the effect of temperature on the movement of water by osmosis. A dialysis tubing bag is used as a model cell. Procedure The student: Step 1 Puts 10 cm3 of glucose solution into each of two dialysis tubing bags. Step 2 Ties a knot in the end of each bag, as shown in Fig. 1.1. knot dialysis tubing bag glucose solution knot Fig. 1.1 Step 3 Records in Table 1.1 the initial mass of each dialysis tubing bag. Step 4 Puts one dialysis tubing bag into a beaker of cold water, as shown in Fig. 1.2. Step 5 Puts the other dialysis tubing bag into a beaker of hot water, as shown in Fig. 1.2. cold water hot water Fig. 1.2 Step 6 After 10 minutes, removes both dialysis tubing bags from the beakers and dries them with paper towels. Step 7 Measures the final mass of each dialysis tubing bag. (i) Fig. 1.3 shows the readings on the balances for the two dialysis tubing bags in Step 7. dialysis tubing bag from cold water dialysis tubing bag from hot water 11.51 g 13.78 g Fig. 1.3 Record in Table 1.1 the final mass of each dialysis tubing bag to one decimal place. [2] Table 1.1 dialysis tubing initial mass final mass change in mass bag / g / g / g cold 10.9 hot 11.3 (ii) Calculate the change in mass for each dialysis tubing bag. Record your answers in Table 1.1. [1] (iii) Describe the effect of temperature on the mass of water entering the dialysis tubing bags. ........................................................................................................................................... ..................................................................................................................................... [1] (iv) Explain why the dialysis tubing bags are dried before measuring the final mass. ........................................................................................................................................... ..................................................................................................................................... [1] (v) The student thinks that the reducing sugar glucose may have leaked out of one of the bags. State the reagent used to test for the presence of glucose. ..................................................................................................................................... [1] (b) Fig. 1.4 shows a photograph of a slice of lemon (a citrus fruit). The slice of lemon has an inner flesh part and an outer skin part. A B Fig. 1.4 (i) In the box provided, make a large, clear pencil drawing of the slice of lemon. [3] (ii) Draw a line to join points A and B on Fig. 1.4. Record the length AB in millimetres to the nearest millimetre. length of line AB on Fig. 1.4 = .................................................. mm [1] (iii) Draw line AB on your drawing in (b)(i). Record the length AB of your drawing, in millimetres to the nearest millimetre. length of line AB on your drawing = .................................................. mm [1] (iv) Calculate the magnification of your drawing. Use the equation shown. length of line AB on your drawing magnification = length of line AB on Fig. 1.4 magnification = ......................................................... [1] (v) Iodine solution is added to the slice of lemon. The inner flesh part stains brown and the outer skin part stains blue-black. State a conclusion for these results. ........................................................................................................................................... ..................................................................................................................................... [1] [Total: 13]
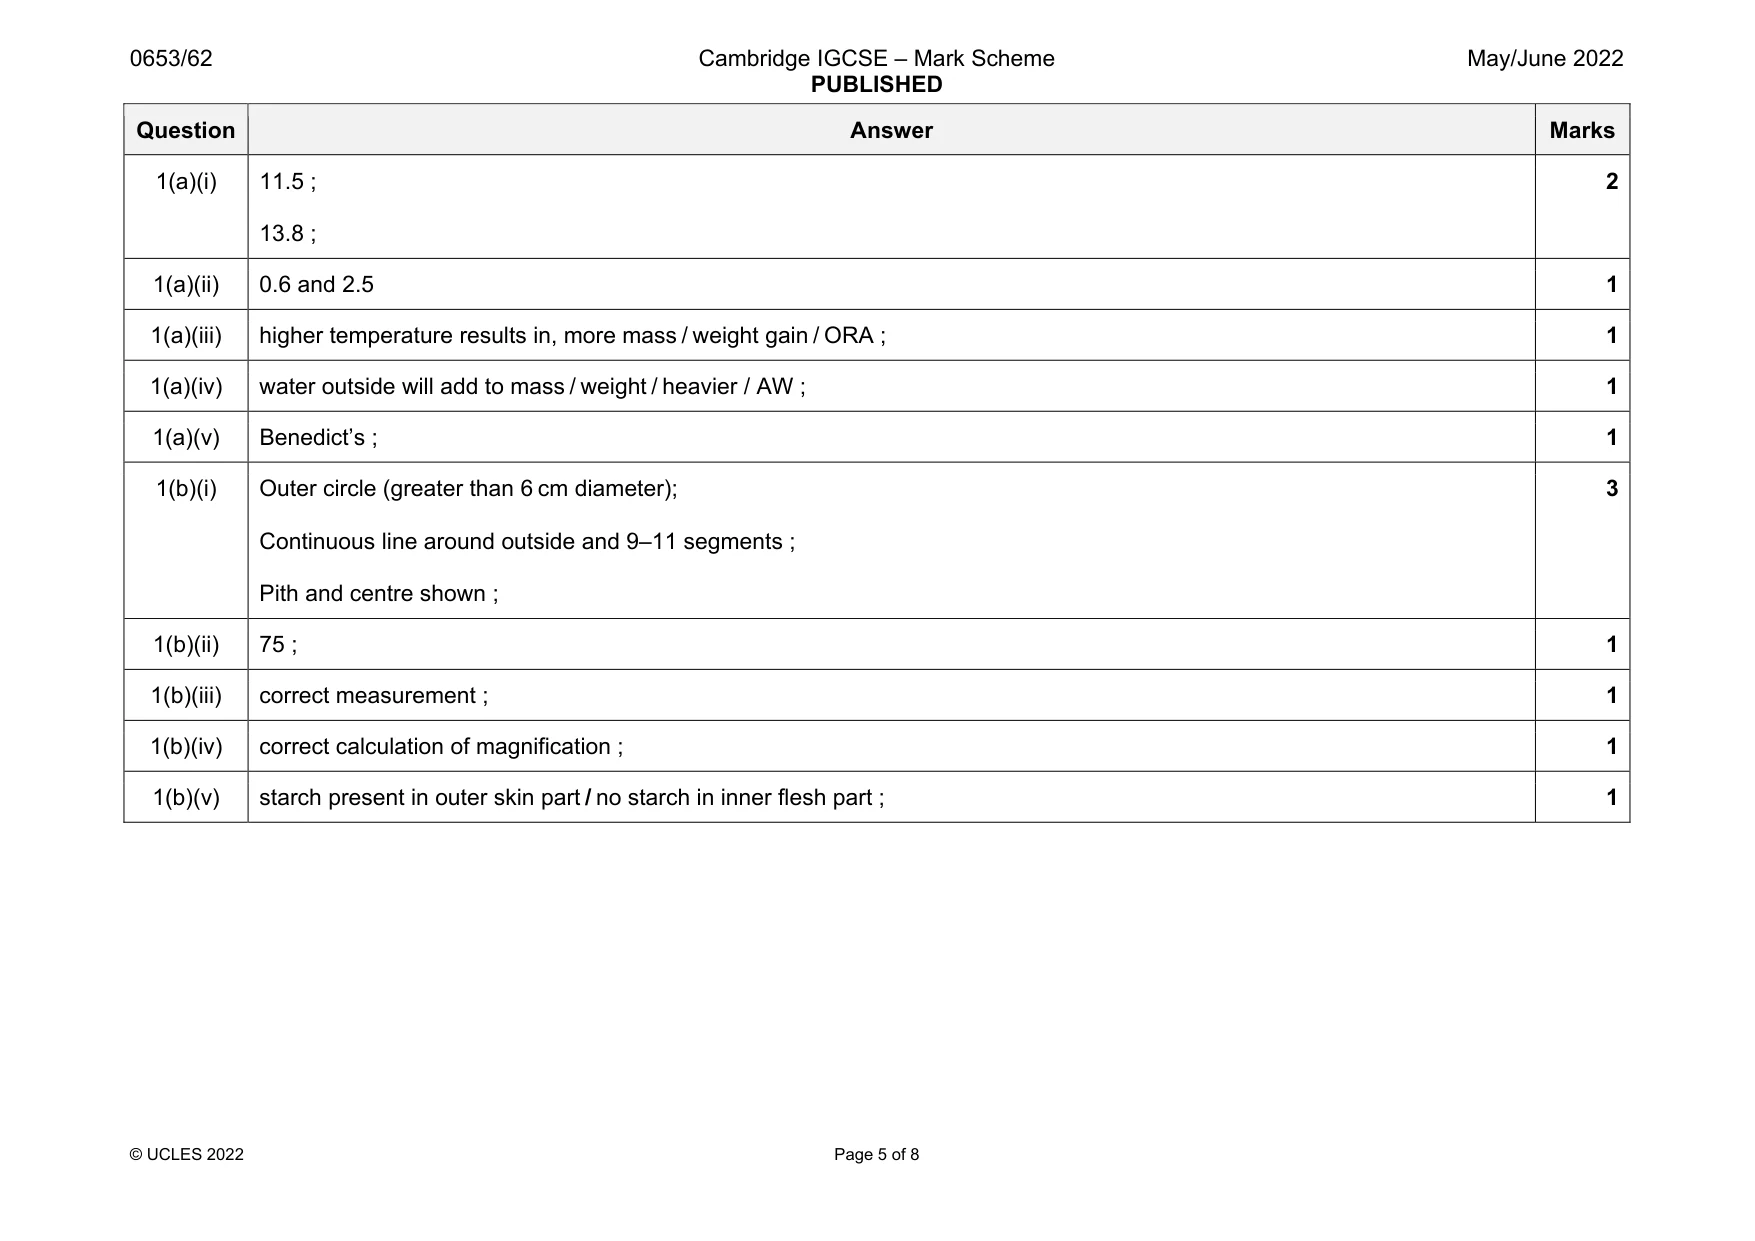
Mark scheme: 1(a)(i) 11.5 ; 13.8 ; 2 1(a)(ii) 0.6 and 2.5 1 1(a)(iii) higher temperature results in, more mass / weight gain / ORA ; 1 1(a)(iv) water outside will add to mass / weight / heavier / AW ; 1 1(a)(v) Benedict’s ; 1 1(b)(i) Outer circle (greater than 6 cm diameter); Continuous line around outside and 9–11 segments ; Pith and centre shown ; 3 1(b)(ii) 75 ; 1 1(b)(iii) correct measurement ; 1 1(b)(iv) correct calculation of magnification ; 1 1(b)(v) starch present in outer skin part / no starch in inner flesh part ; 1
Q2 · A student investigates the solubility in water of some substances, L, M, N, P and Q
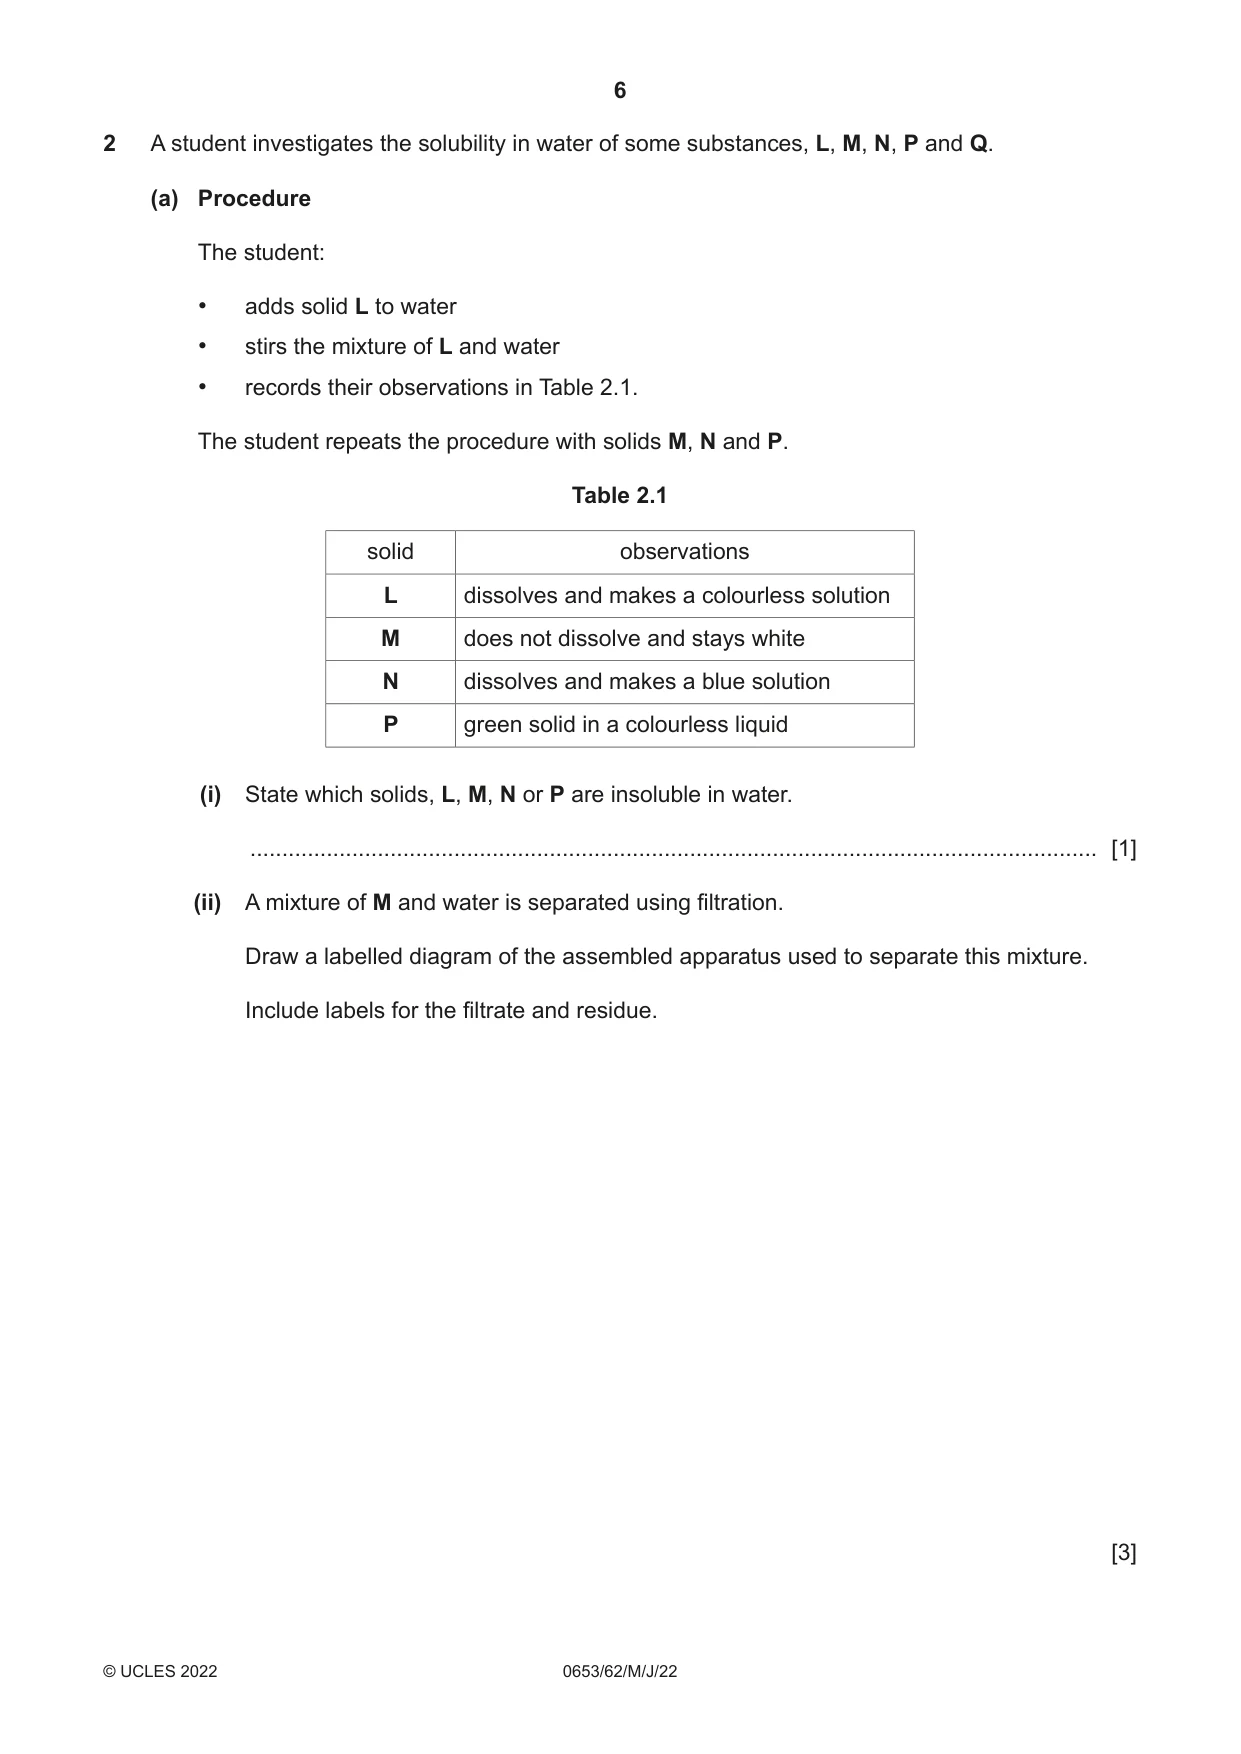
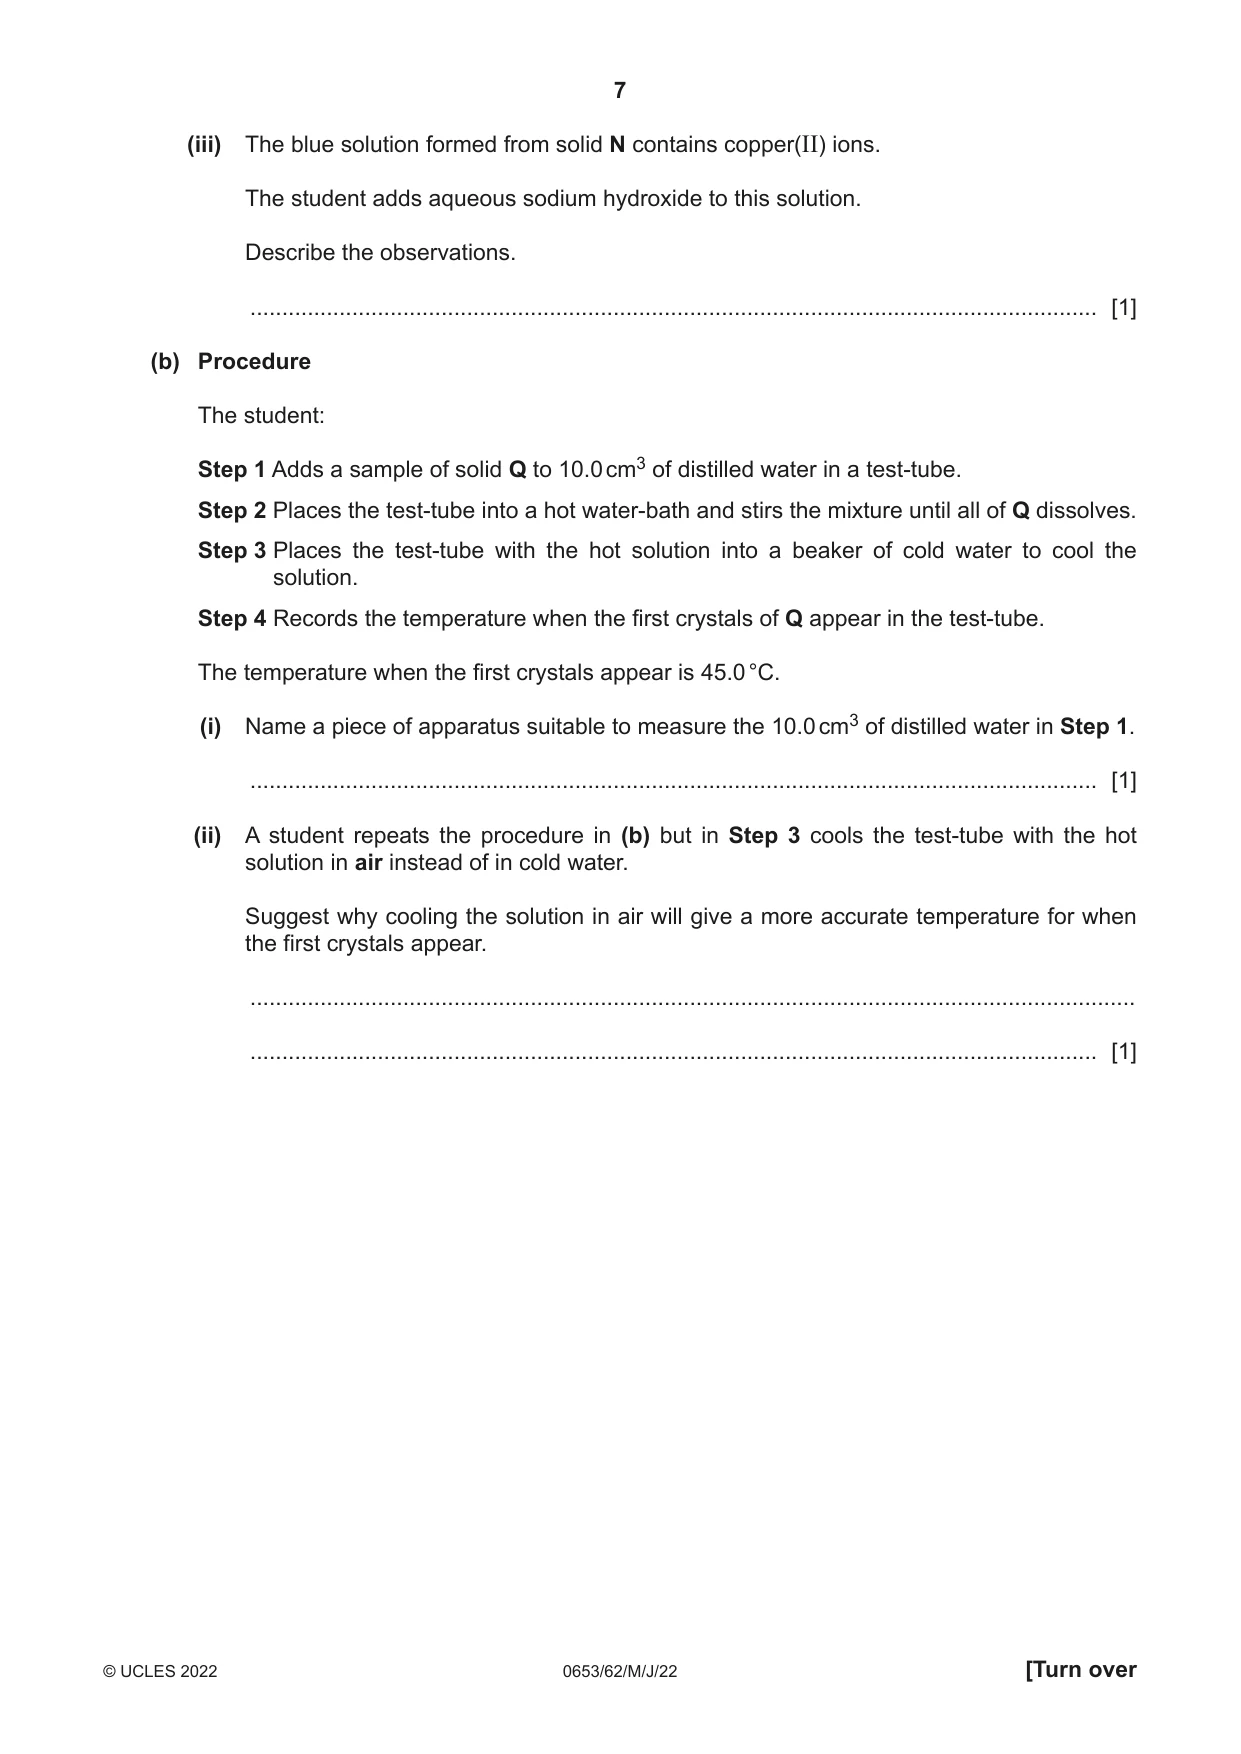
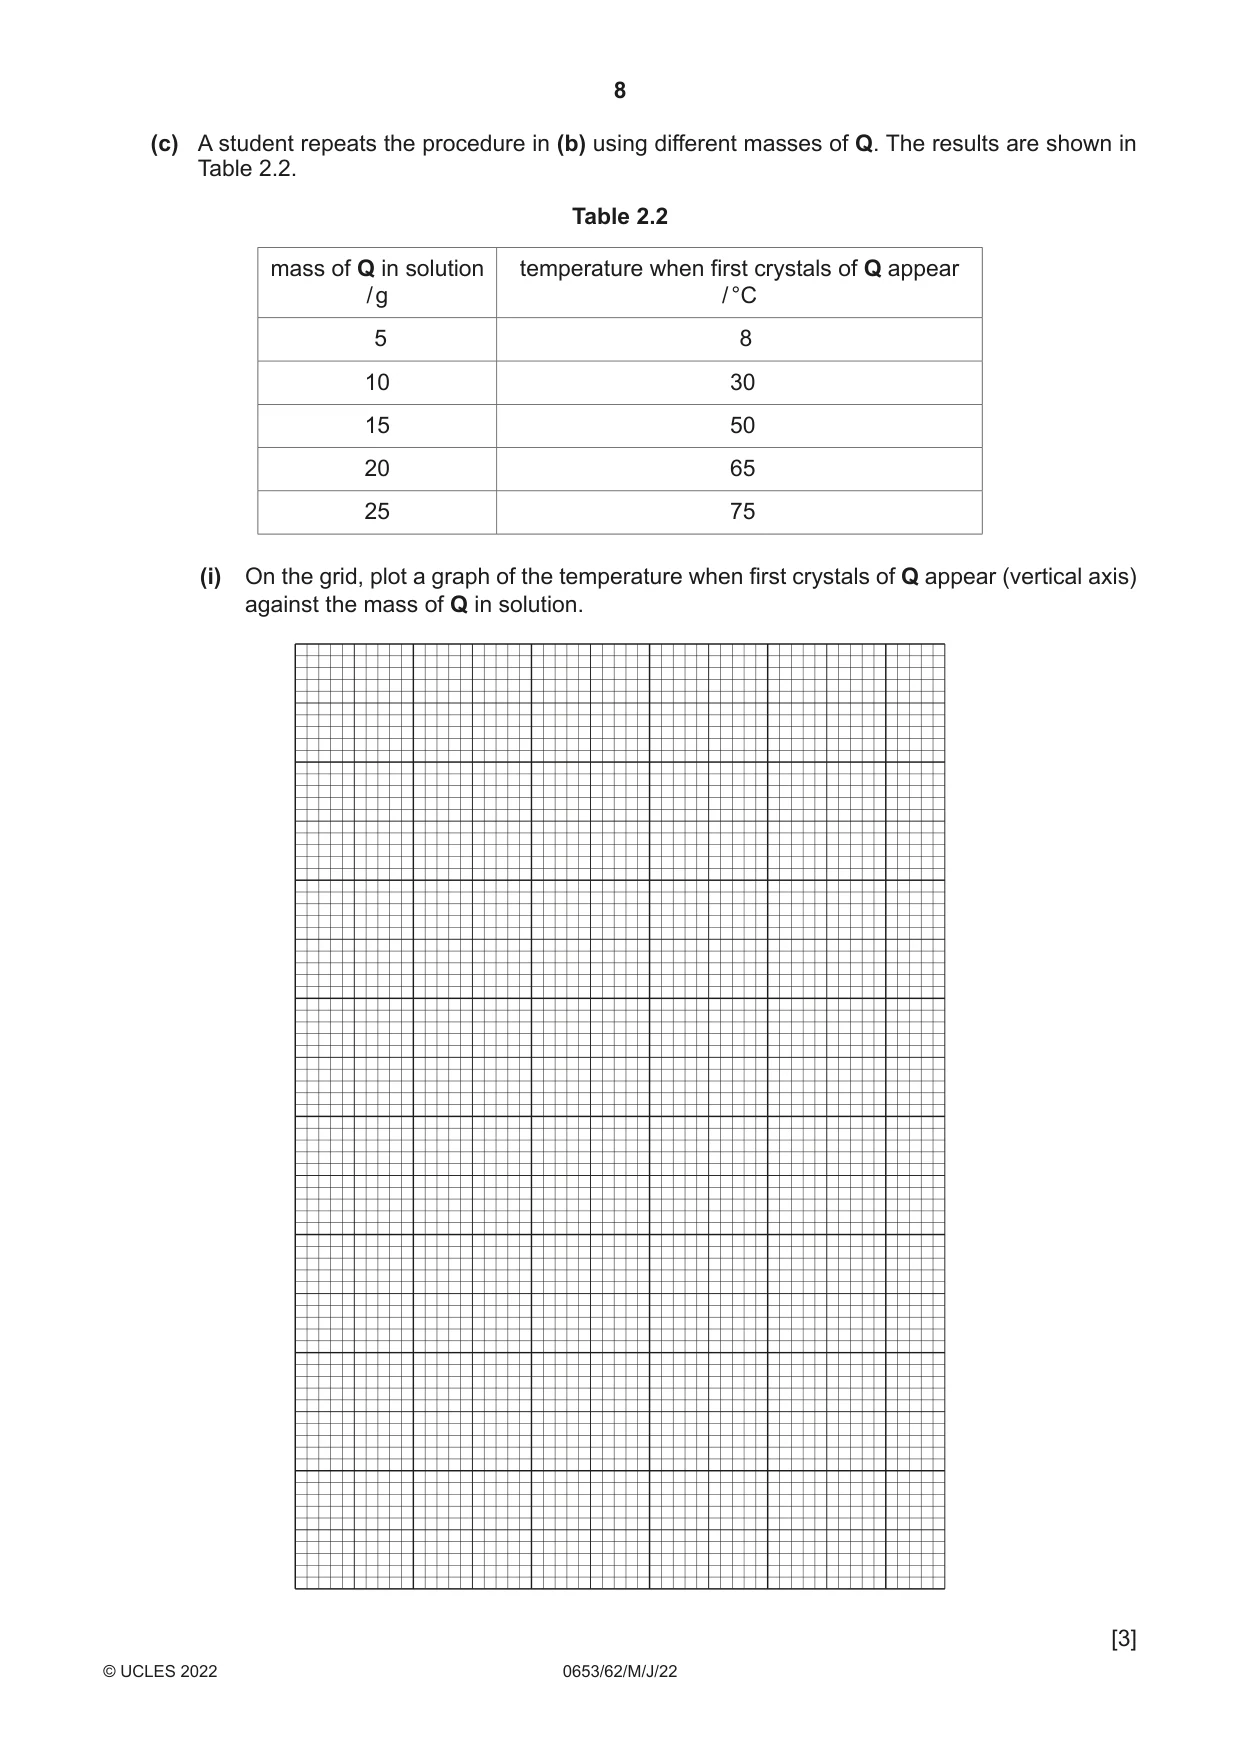
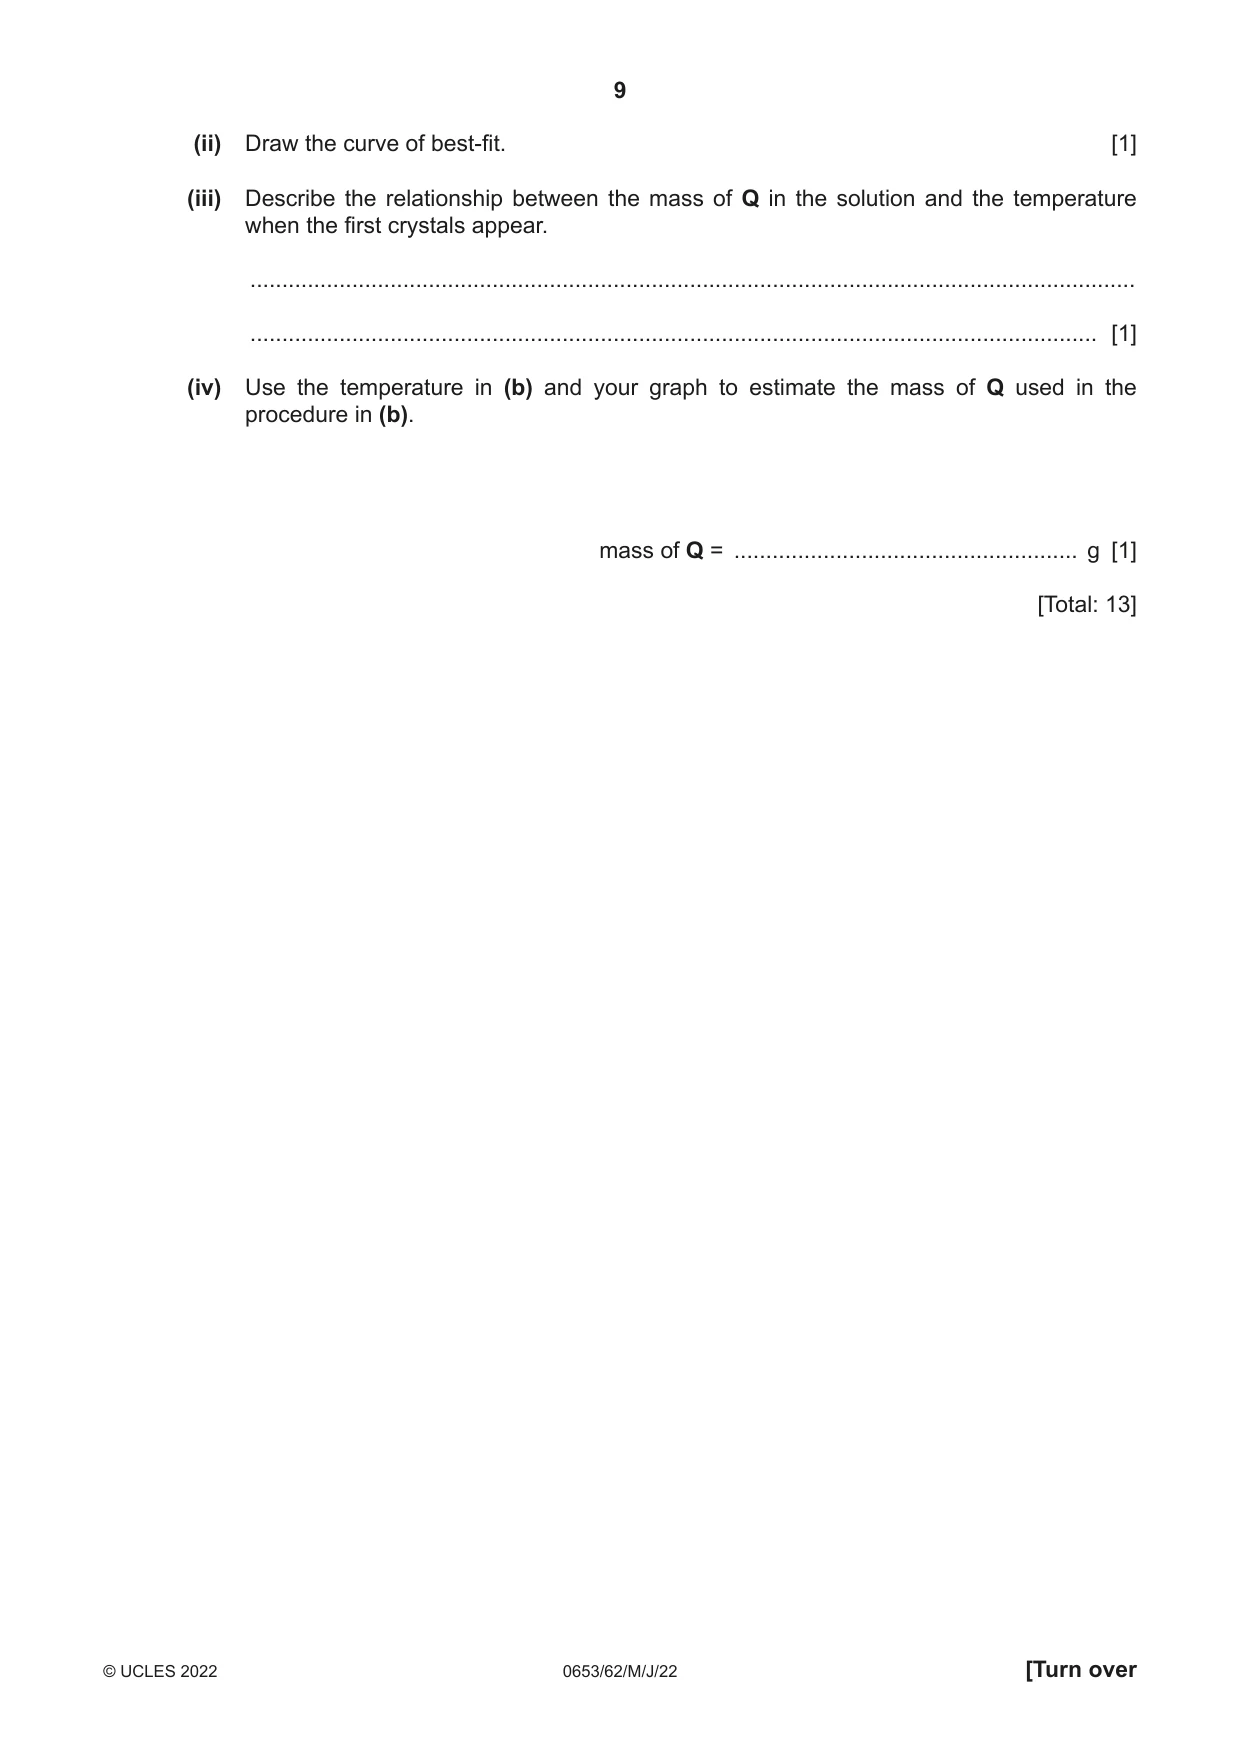
2 A student investigates the solubility in water of some substances, L, M, N, P and Q. (a) Procedure The student: • adds solid L to water • stirs the mixture of L and water • records their observations in Table 2.1. The student repeats the procedure with solids M, N and P. Table 2.1 solid observations L dissolves and makes a colourless solution M does not dissolve and stays white N dissolves and makes a blue solution P green solid in a colourless liquid (i) State which solids, L, M, N or P are insoluble in water. ..................................................................................................................................... [1] (ii) A mixture of M and water is separated using filtration. Draw a labelled diagram of the assembled apparatus used to separate this mixture. Include labels for the filtrate and residue. [3] (iii) The blue solution formed from solid N contains copper(II) ions. The student adds aqueous sodium hydroxide to this solution. Describe the observations. ..................................................................................................................................... [1] (b) Procedure The student: Step 1 Adds a sample of solid Q to 10.0 cm3 of distilled water in a test-tube. Step 2 Places the test-tube into a hot water-bath and stirs the mixture until all of Q dissolves. Step 3 Places the test-tube with the hot solution into a beaker of cold water to cool the solution. Step 4 Records the temperature when the first crystals of Q appear in the test-tube. The temperature when the first crystals appear is 45.0 °C. (i) Name a piece of apparatus suitable to measure the 10.0 cm3 of distilled water in Step 1. ..................................................................................................................................... [1] (ii) A student repeats the procedure in (b) but in Step 3 cools the test-tube with the hot solution in air instead of in cold water. Suggest why cooling the solution in air will give a more accurate temperature for when the first crystals appear. ........................................................................................................................................... ..................................................................................................................................... [1] (c) A student repeats the procedure in (b) using different masses of Q. The results are shown in Table 2.2. Table 2.2 mass of Q in solution temperature when first crystals of Q appear / g / °C 5 8 10 30 15 50 20 65 25 75 (i) On the grid, plot a graph of the temperature when first crystals of Q appear (vertical axis) against the mass of Q in solution. [3] (ii) Draw the curve of best-fit. [1] (iii) Describe the relationship between the mass of Q in the solution and the temperature when the first crystals appear. ........................................................................................................................................... ..................................................................................................................................... [1] (iv) Use the temperature in (b) and your graph to estimate the mass of Q used in the procedure in (b). mass of Q = ...................................................... g [1] [Total: 13]
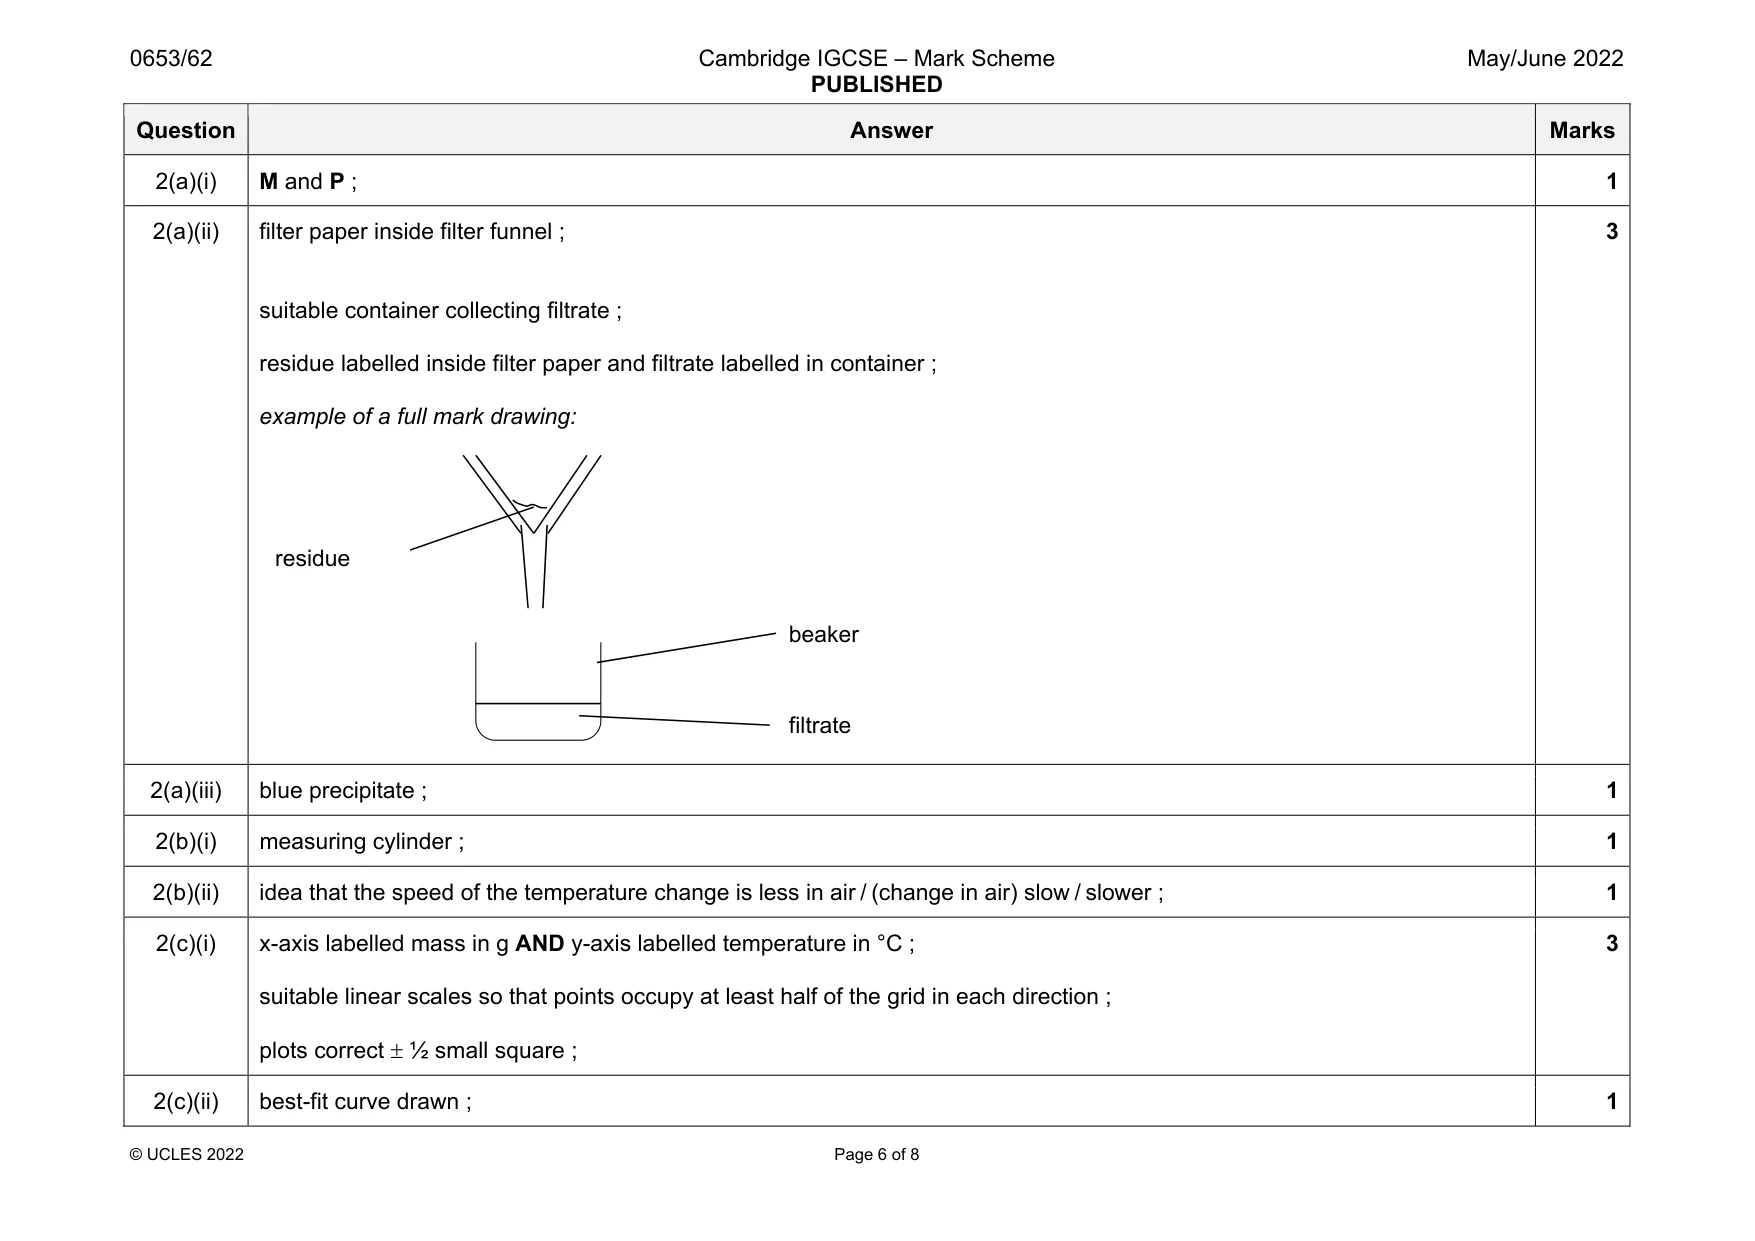
Mark scheme: 2(a)(i) M and P ; 1 2(a)(ii) filter paper inside filter funnel ; suitable container collecting filtrate ; residue labelled inside filter paper and filtrate labelled in container ; example of a full mark drawing: 3 2(a)(iii) blue precipitate ; 1 2(b)(i) measuring cylinder ; 1 2(b)(ii) idea that the speed of the temperature change is less in air / (change in air) slow / slower ; 1 2(c)(i) x-axis labelled mass in g AND y-axis labelled temperature in °C ; suitable linear scales so that points occupy at least half of the grid in each direction ; plots correct ½ small square ; 3 2(c)(ii) best-fit curve drawn ; 1 beaker filtrate residue Question Answer Marks 2(c)(iii) as temperature increases the mass increases ; 1 2(c)(iv) correct mass determined from the graph to within ½ small square ; 1
Q3 · A student investigates thermal energy changes in water
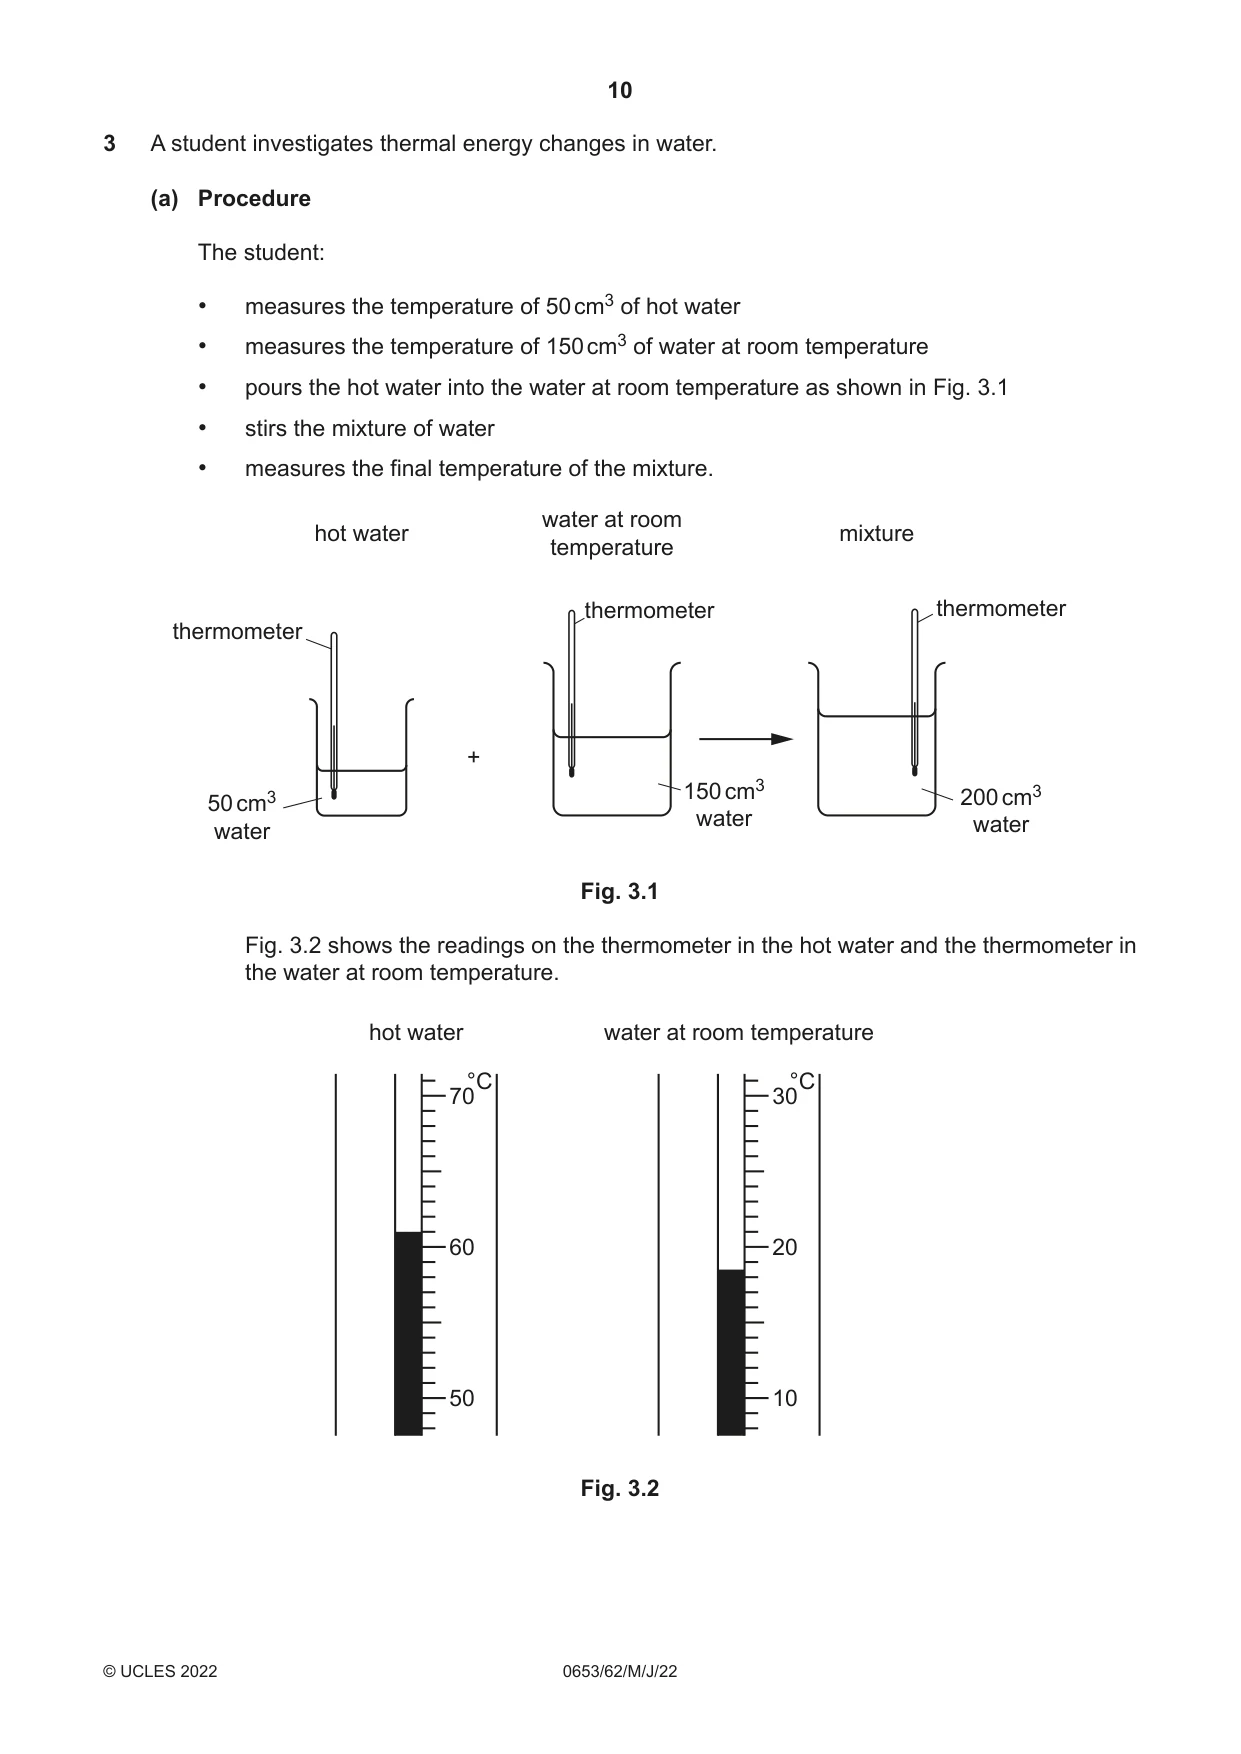
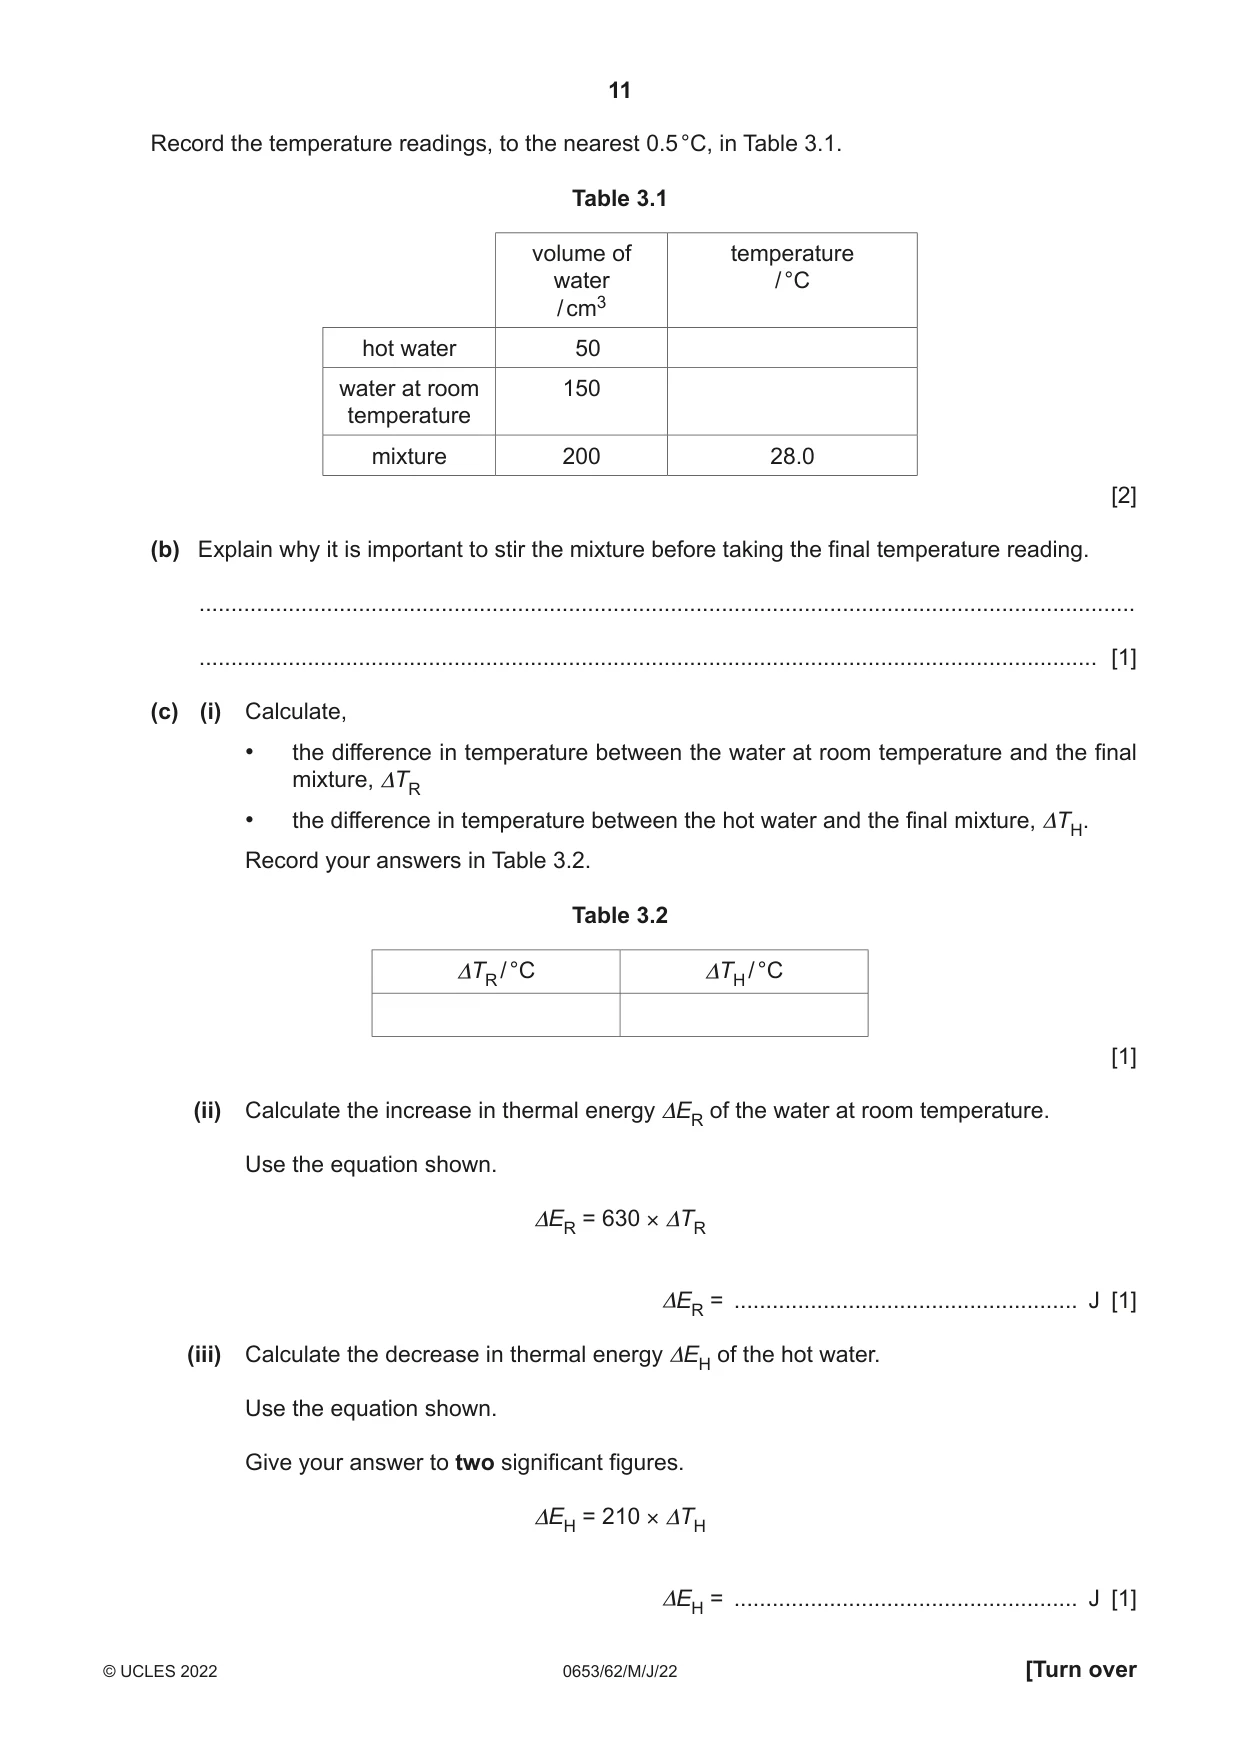
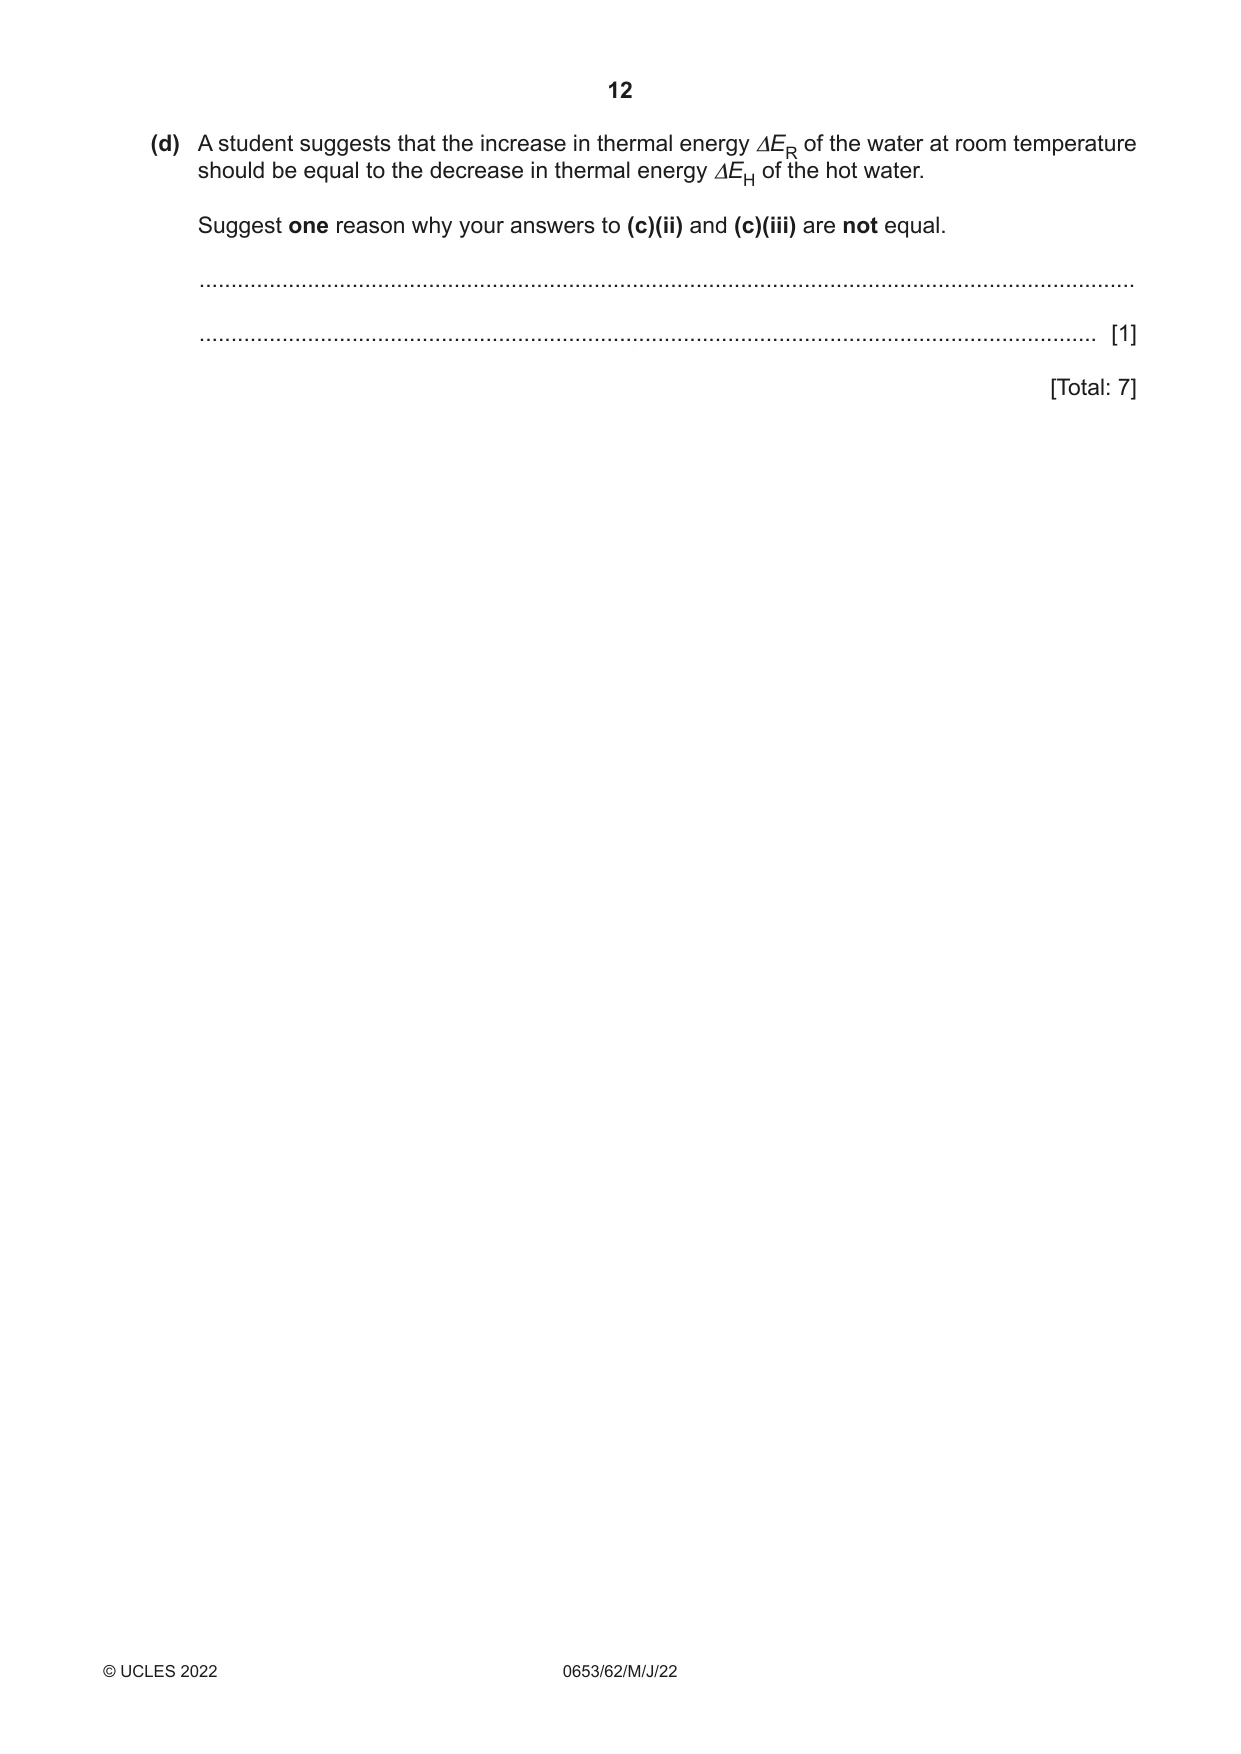
3 A student investigates thermal energy changes in water. (a) Procedure The student: • measures the temperature of 50 cm3 of hot water • measures the temperature of 150 cm3 of water at room temperature • pours the hot water into the water at room temperature as shown in Fig. 3.1 • stirs the mixture of water • measures the final temperature of the mixture. water at room hot water mixture temperature thermometer thermometer thermometer + 150 cm3 200 cm3 50 cm3 water water water Fig. 3.1 Fig. 3.2 shows the readings on the thermometer in the hot water and the thermometer in the water at room temperature. hot water water at room temperature °C °C 70 30 60 20 50 10 Fig. 3.2 Record the temperature readings, to the nearest 0.5 °C, in Table 3.1. Table 3.1 volume of temperature water / °C / cm3 hot water 50 water at room 150 temperature mixture 200 28.0 [2] (b) Explain why it is important to stir the mixture before taking the final temperature reading. ................................................................................................................................................... ............................................................................................................................................. [1] (c) (i) Calculate, • the difference in temperature between the water at room temperature and the final mixture, ΔTR • the difference in temperature between the hot water and the final mixture, ΔTH. Record your answers in Table 3.2. Table 3.2 ΔTR / °C ΔTH / °C [1] (ii) Calculate the increase in thermal energy ΔER of the water at room temperature. Use the equation shown. ΔER = 630 × ΔTR ΔER = ...................................................... J [1] (iii) Calculate the decrease in thermal energy ΔEH of the hot water. Use the equation shown. Give your answer to two significant figures. ΔEH = 210 × ΔTH ΔEH = ...................................................... J [1] (d) A student suggests that the increase in thermal energy ΔER of the water at room temperature should be equal to the decrease in thermal energy ΔEH of the hot water. Suggest one reason why your answers to (c)(ii) and (c)(iii) are not equal. ................................................................................................................................................... ............................................................................................................................................. [1] [Total: 7]
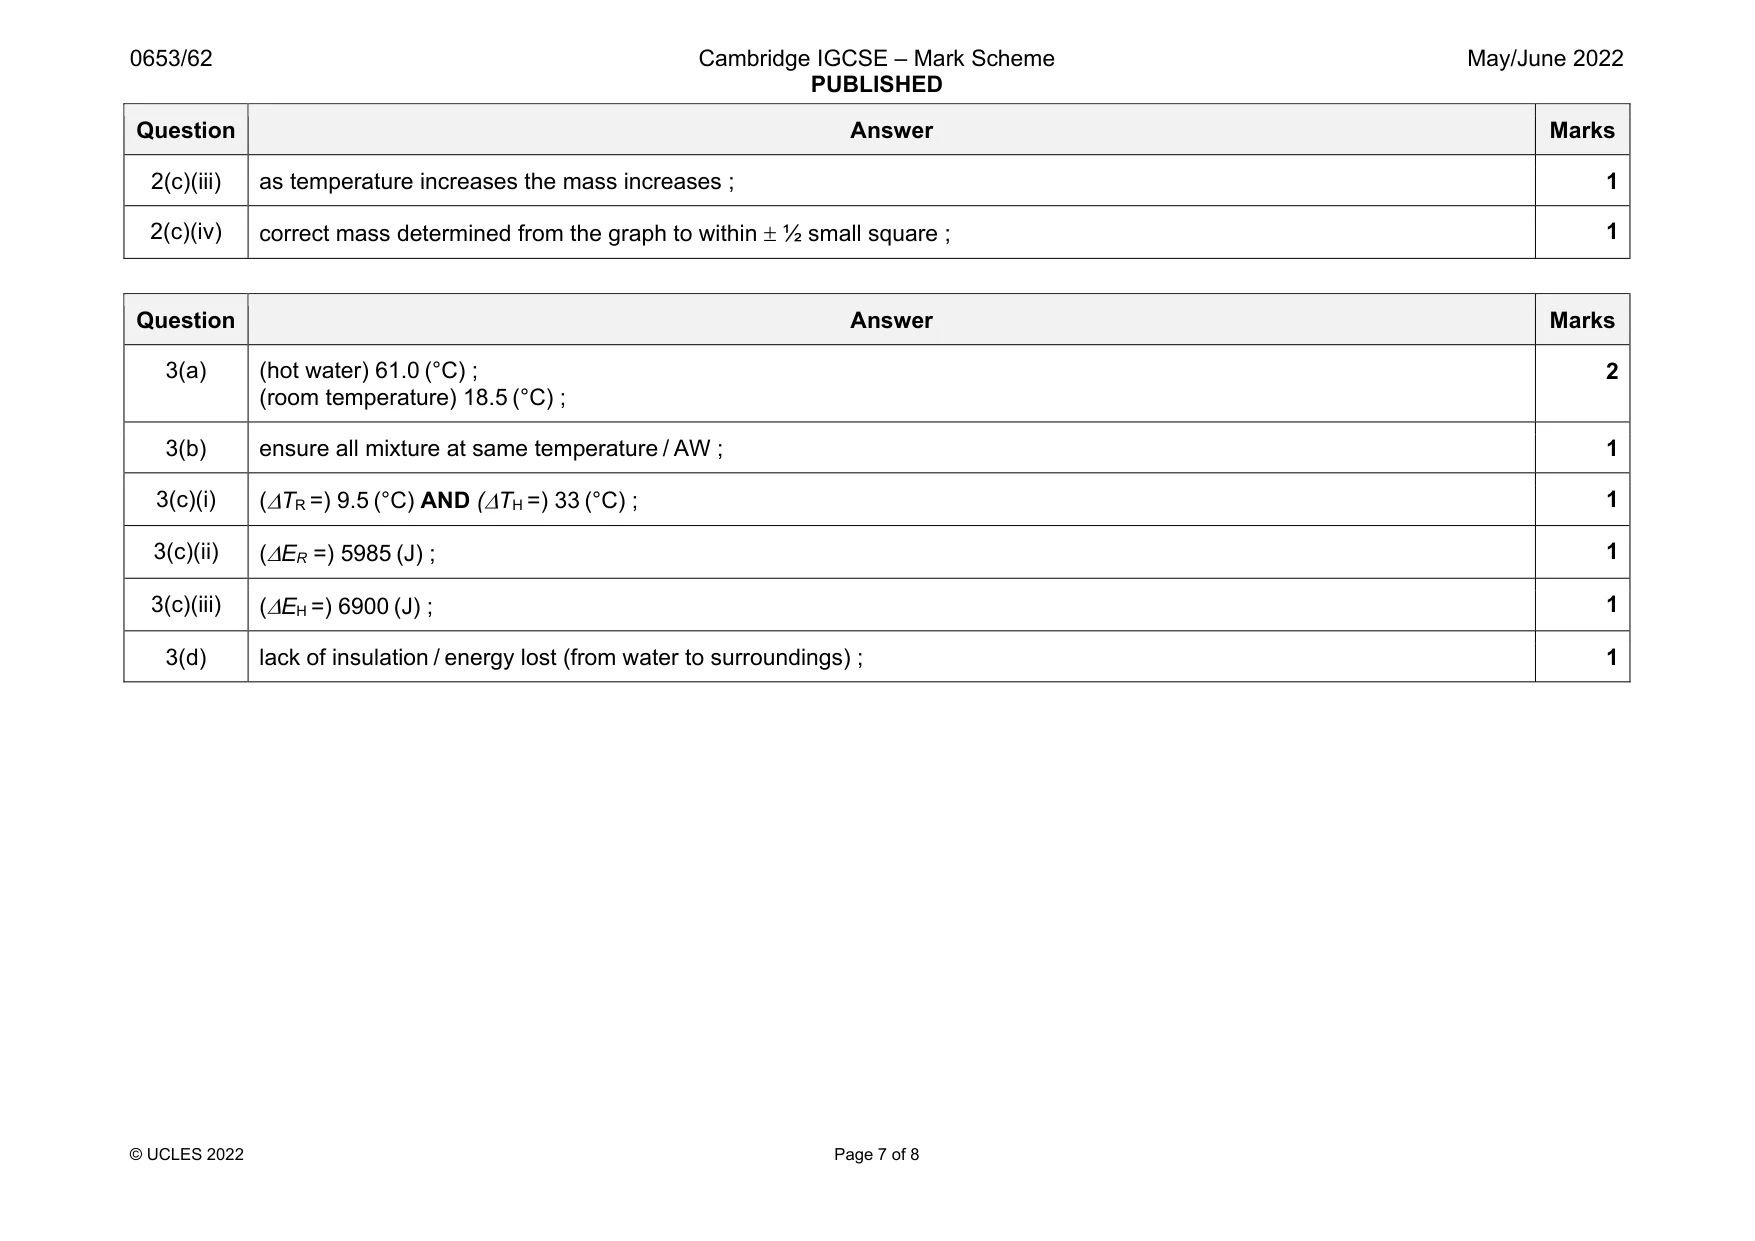
Mark scheme: 3(a) (hot water) 61.0 (°C) ; (room temperature) 18.5 (°C) ; 2 3(b) ensure all mixture at same temperature / AW ; 1 3(c)(i) (TR =) 9.5 (°C) AND (TH =) 33 (°C) ; 1 3(c)(ii) (ER =) 5985 (J) ; 1 3(c)(iii) (EH =) 6900 (J) ; 1 3(d) lack of insulation / energy lost (from water to surroundings) ; 1
Q4 · A door, hinged at one side
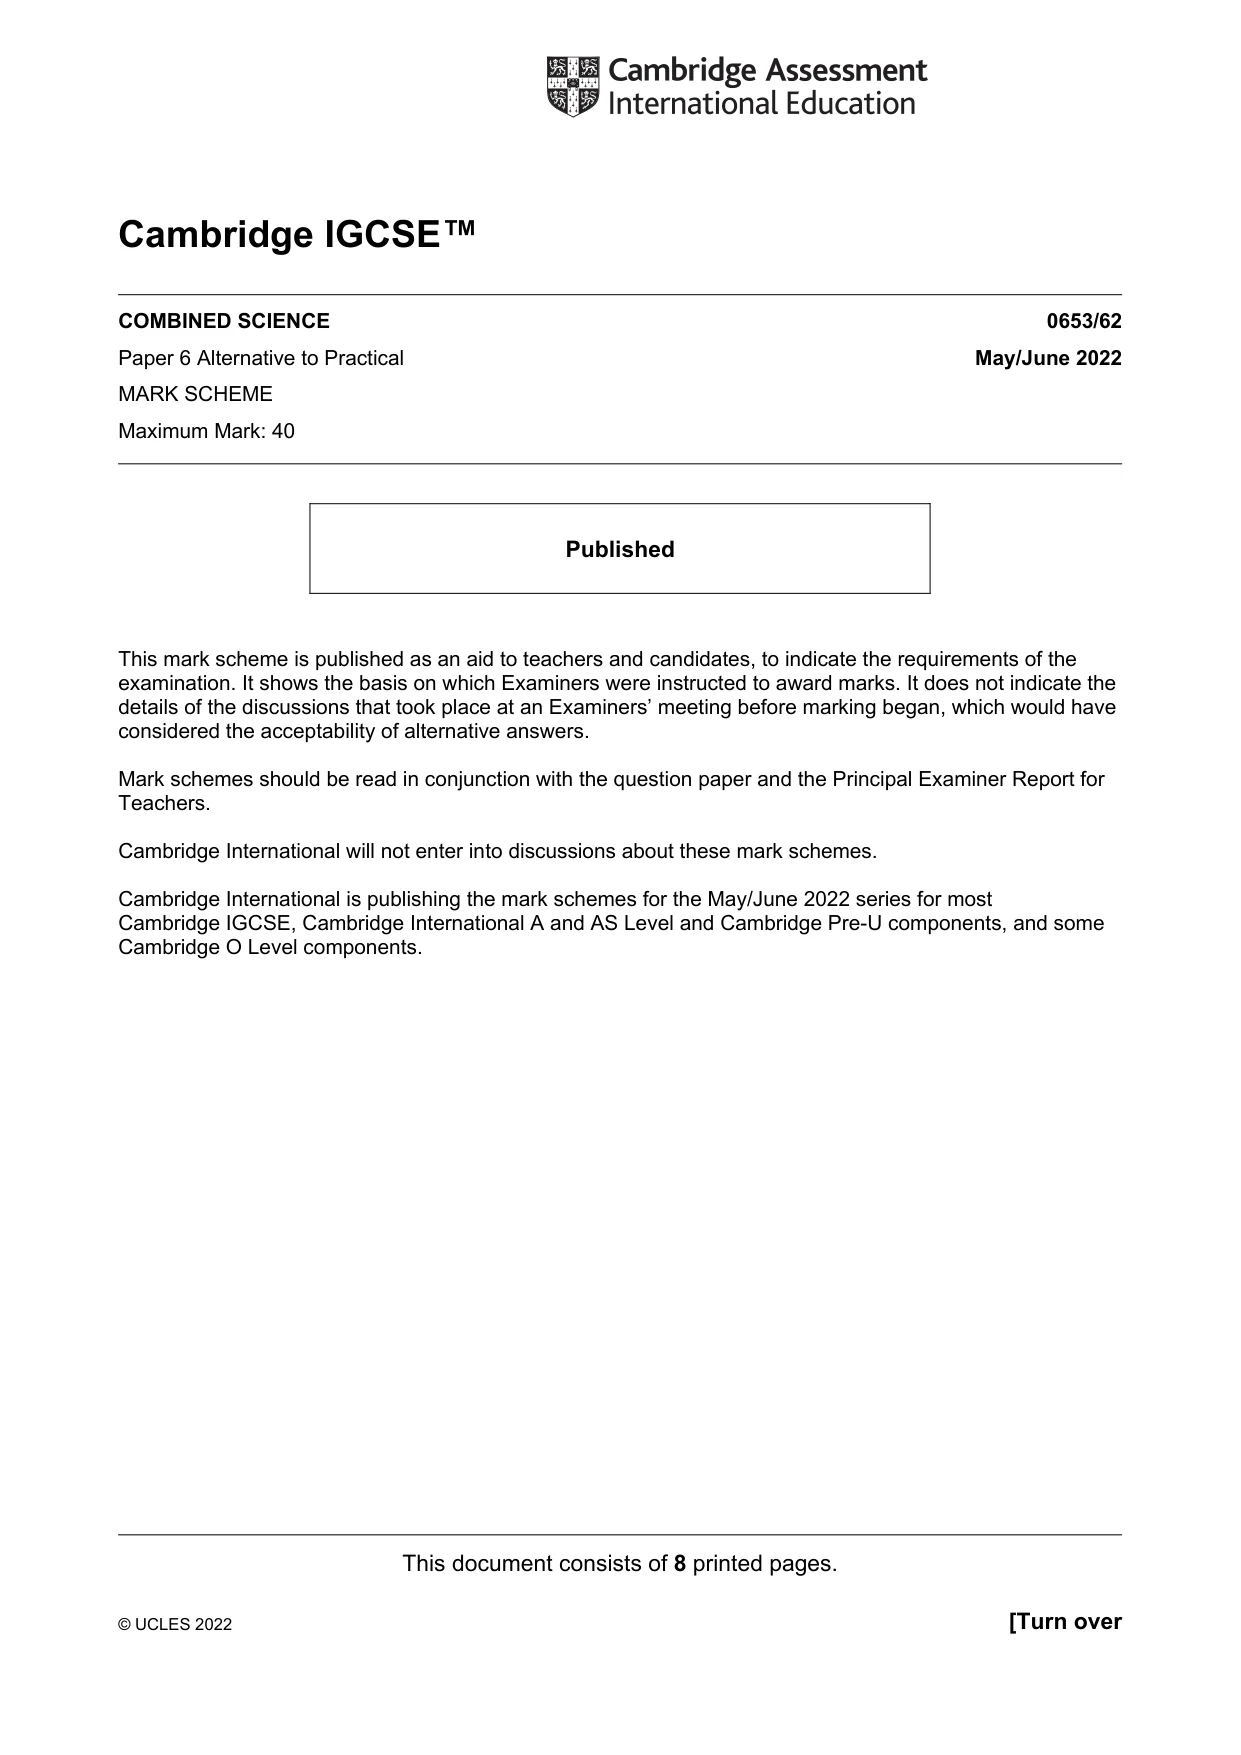
4 Fig. 4.1 shows a door, hinged at one side. The door can be pulled open by applying a force to the metal ring at any point along the bar AB. hinges which horizontal act as a pivot metal bar B A metal ring slides freely between A and B Fig. 4.1 Plan an investigation to find out how the size of the force needed to just open the door varies with the distance of the force away from B. You are given the apparatus in Fig. 4.1 and you may use any common laboratory apparatus. In your plan include: • the apparatus needed • a brief description of the method and an explanation of any safety precautions you will take • what you will measure and the variables you will control • a results table to record the measurements • how you will process your results to draw a conclusion. You are not required to include any results in your results table. You may include a labelled diagram if you wish. .......................................................................................................................................................... .......................................................................................................................................................... .......................................................................................................................................................... .......................................................................................................................................................... .......................................................................................................................................................... .......................................................................................................................................................... .......................................................................................................................................................... .......................................................................................................................................................... .......................................................................................................................................................... .......................................................................................................................................................... .......................................................................................................................................................... .......................................................................................................................................................... .......................................................................................................................................................... .................................................................................................................................................... [7]
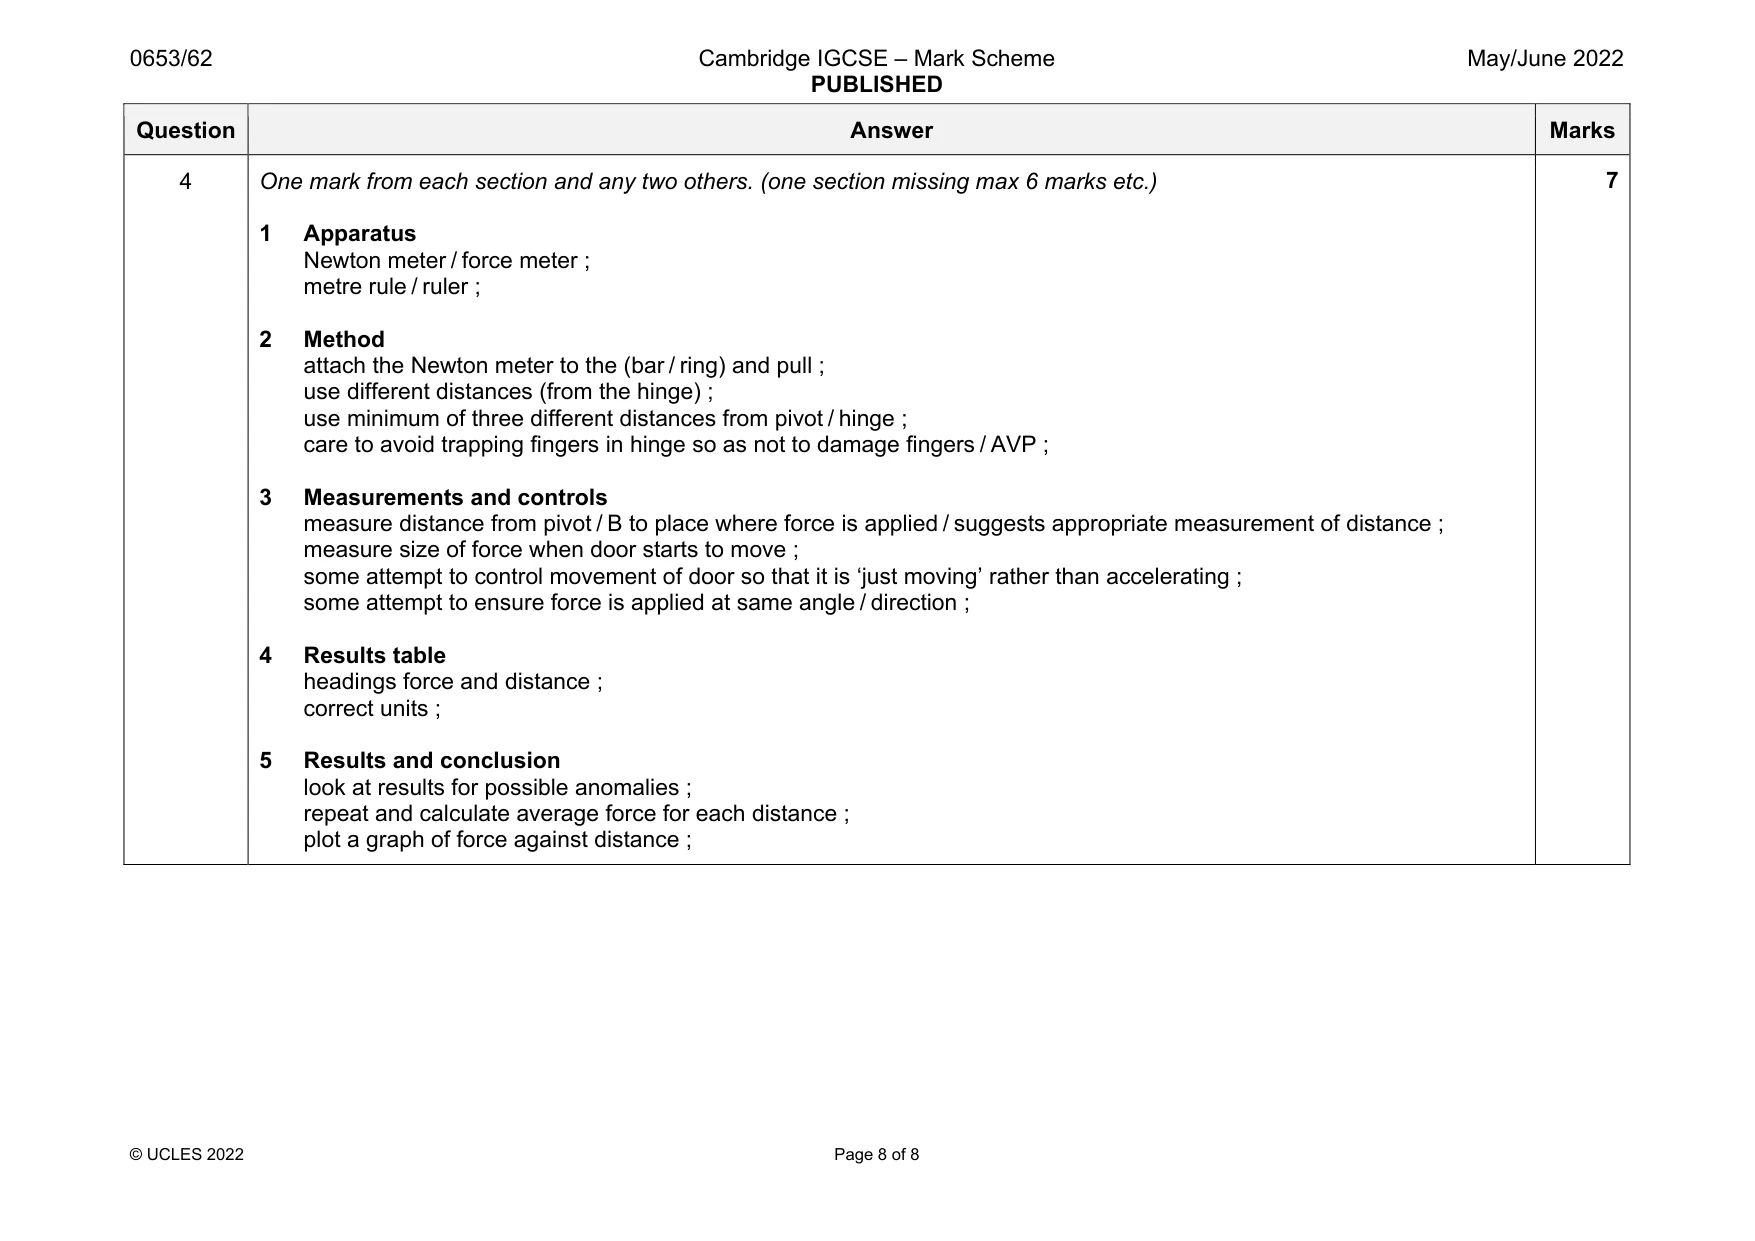
Mark scheme: 4 One mark from each section and any two others. (one section missing max 6 marks etc.) 1 Apparatus Newton meter / force meter ; metre rule / ruler ; 2 Method attach the Newton meter to the (bar / ring) and pull ; use different distances (from the hinge) ; use minimum of three different distances from pivot / hinge ; care to avoid trapping fingers in hinge so as not to damage fingers / AVP ; 3 Measurements and controls measure distance from pivot / B to place where force is applied / suggests appropriate measurement of distance ; measure size of force when door starts to move ; some attempt to control movement of door so that it is ‘just moving’ rather than accelerating ; some attempt to ensure force is applied at same angle / direction ; 4 Results table headings force and distance ; correct units ; 5 Results and conclusion look at results for possible anomalies ; repeat and calculate average force for each distance ; plot a graph of force against distance ;
What was in this paper
The subtopics covered by these 4 questions, and how many questions each got. Open one in a new tab to see every Cambridge question on it.
What you needed in this session
Cambridge’s own grade thresholds for 2022 May/June, Paper 6 · Variant 2. A higher threshold means an easier paper — the bar moves with how the cohort did.