Cambridge IGCSE Science - Combined 0653 — 2012 May/June Paper 6 · Variant 3
0653/63/M/J/12 · 60 marks · ≈68 min
The question paper and its mark scheme, free to read here and free to download. This is Cambridge’s own paper, exactly as it was sat.
Question paper20 pages


Mark scheme4 pages
Answers below. Sit the paper first if you are practising.
Paper as text
Question paper, page 1
This document consists of 16 printed pages and 4 blank pages. IB12 06_0653_63/FP © UCLES 2012 [Turn over *3625733199* For Examiner's Use 1 2 3 4 5 6 Total UNIVERSITY OF CAMBRIDGE INTERNATIONAL EXAMINATIONS International General Certificate of Secondary Education COMBINED SCIENCE 0653/63 Paper 6 Alternative to Practical May/June 2012 1 hour Candidates answer on the Question paper No Additional Materials are required. READ THESE INSTRUCTIONS FIRST Write your Centre number, candidate number and name on all the work you hand in. Write in dark blue or black pen. You may use a soft pencil for any diagrams, graphs, tables or rough working. Do not use staples, paper clips, highlighters, glue or correction fluid. DO NOT WRITE IN ANY BARCODES. Answer all questions. At the end of the examination, fasten all your work securely together. The number of marks is given in brackets [ ] at the end of each question or part question. www.XtremePapers.com
Question paper, page 2
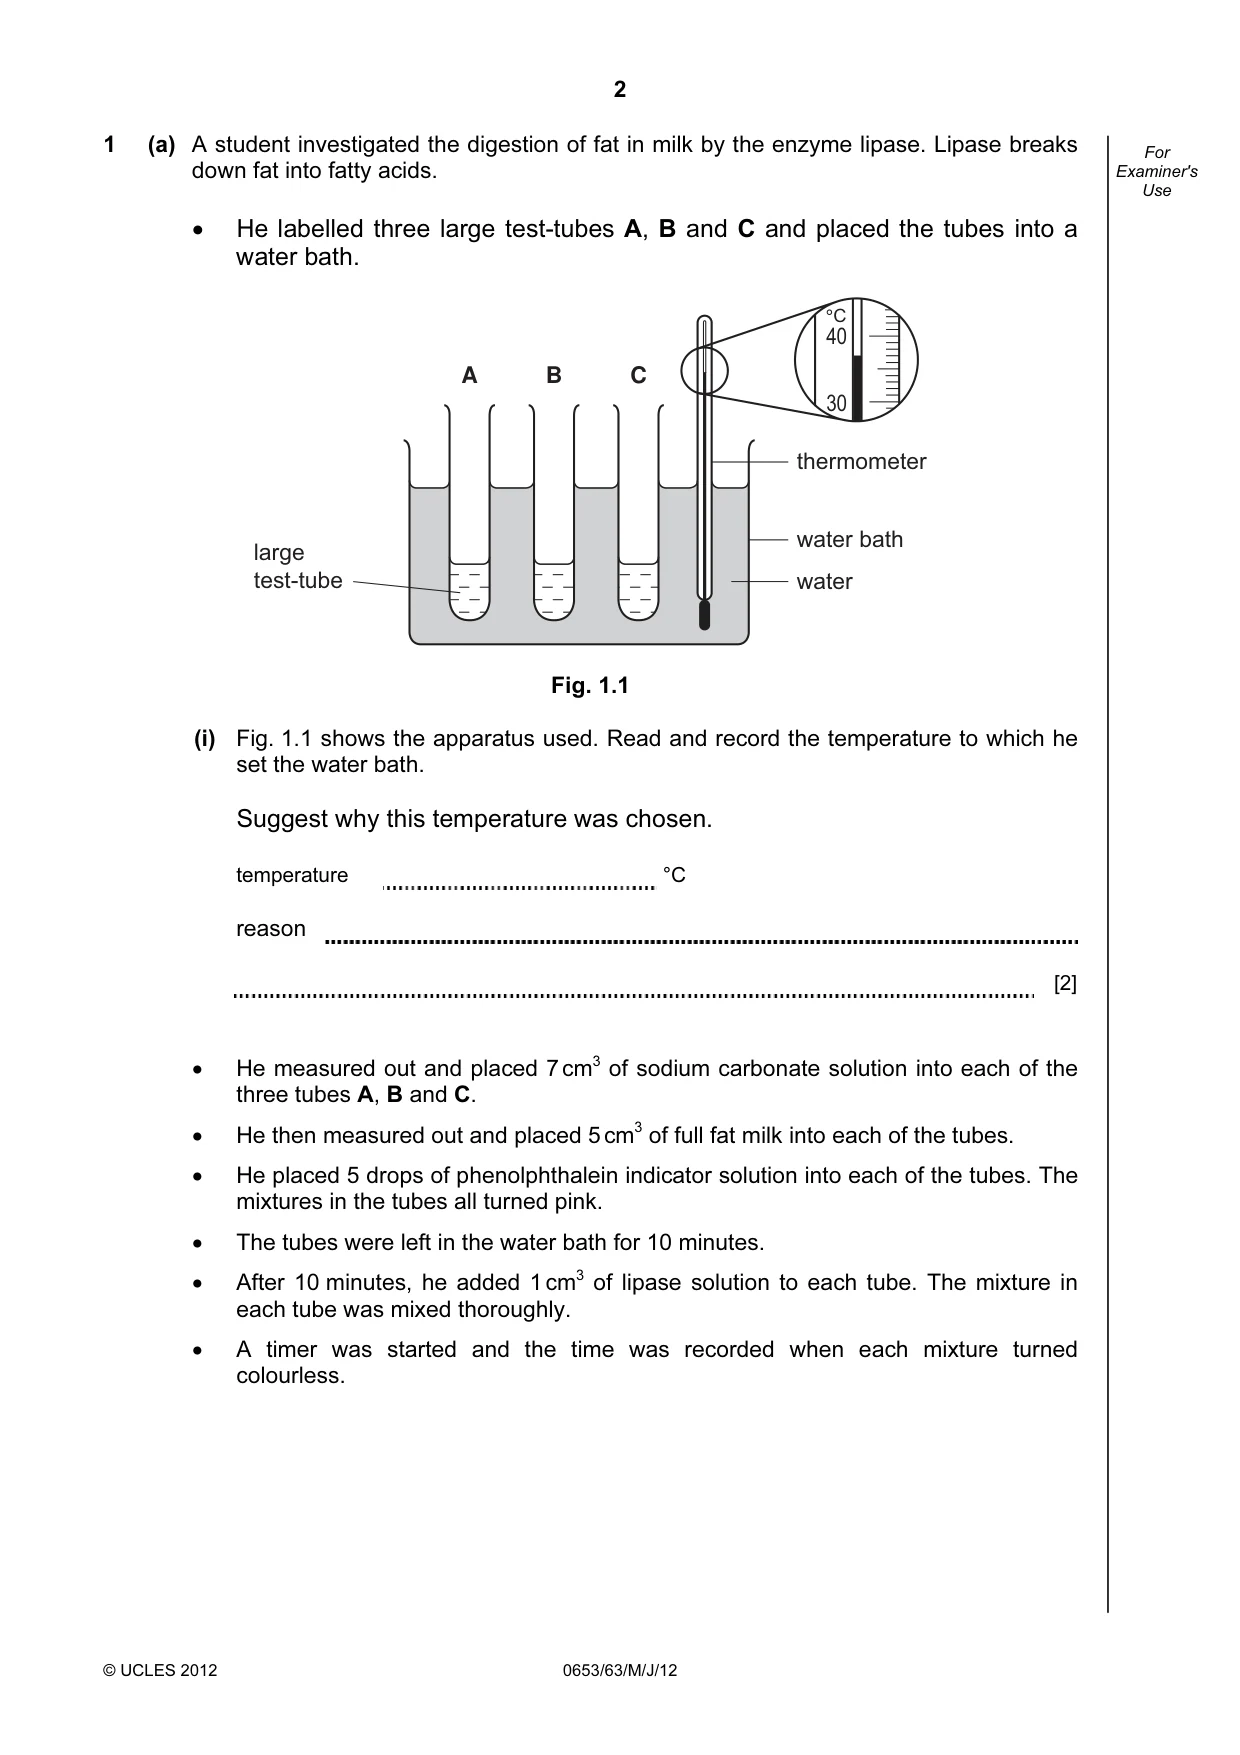
2 © UCLES 2012 0653/63/M/J/12 For Examiner's Use 1 (a) A student investigated the digestion of fat in milk by the enzyme lipase. Lipase breaks down fat into fatty acids. • He labelled three large test-tubes A, B and C and placed the tubes into a water bath. A B C large test-tube thermometer water bath water 40 30 °C Fig. 1.1 (i) Fig. 1.1 shows the apparatus used. Read and record the temperature to which he set the water bath. Suggest why this temperature was chosen. temperature °C reason [2] • He measured out and placed 7 cm3 of sodium carbonate solution into each of the three tubes A, B and C. • He then measured out and placed 5 cm3 of full fat milk into each of the tubes. • He placed 5 drops of phenolphthalein indicator solution into each of the tubes. The mixtures in the tubes all turned pink. • The tubes were left in the water bath for 10 minutes. • After 10 minutes, he added 1 cm3 of lipase solution to each tube. The mixture in each tube was mixed thoroughly. • A timer was started and the time was recorded when each mixture turned colourless.
Question paper, page 3
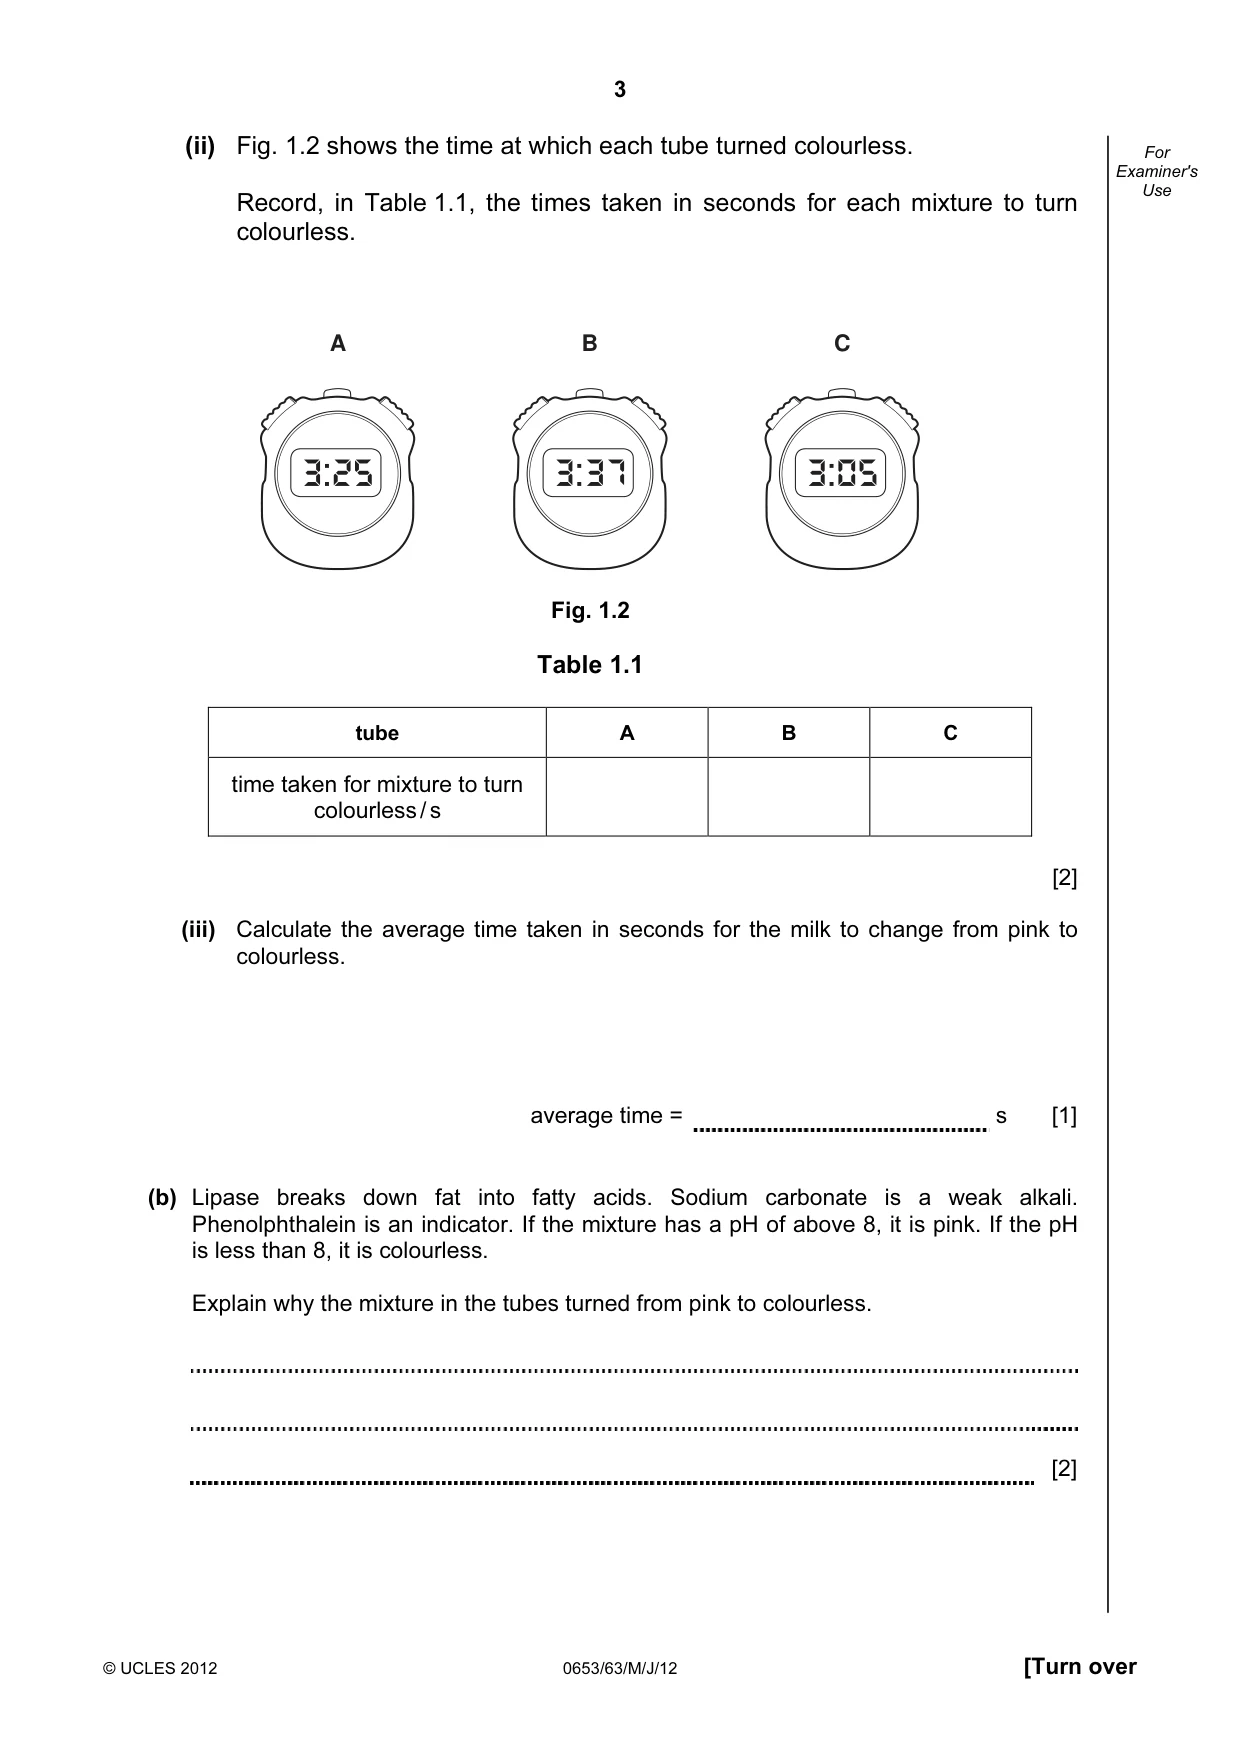
3 © UCLES 2012 0653/63/M/J/12 [Turn over For Examiner's Use (ii) Fig. 1.2 shows the time at which each tube turned colourless. Record, in Table 1.1, the times taken in seconds for each mixture to turn colourless. A B C Fig. 1.2 Table 1.1 tube A B C time taken for mixture to turn colourless / s [2] (iii) Calculate the average time taken in seconds for the milk to change from pink to colourless. average time = s [1] (b) Lipase breaks down fat into fatty acids. Sodium carbonate is a weak alkali. Phenolphthalein is an indicator. If the mixture has a pH of above 8, it is pink. If the pH is less than 8, it is colourless. Explain why the mixture in the tubes turned from pink to colourless. [2]
Question paper, page 4
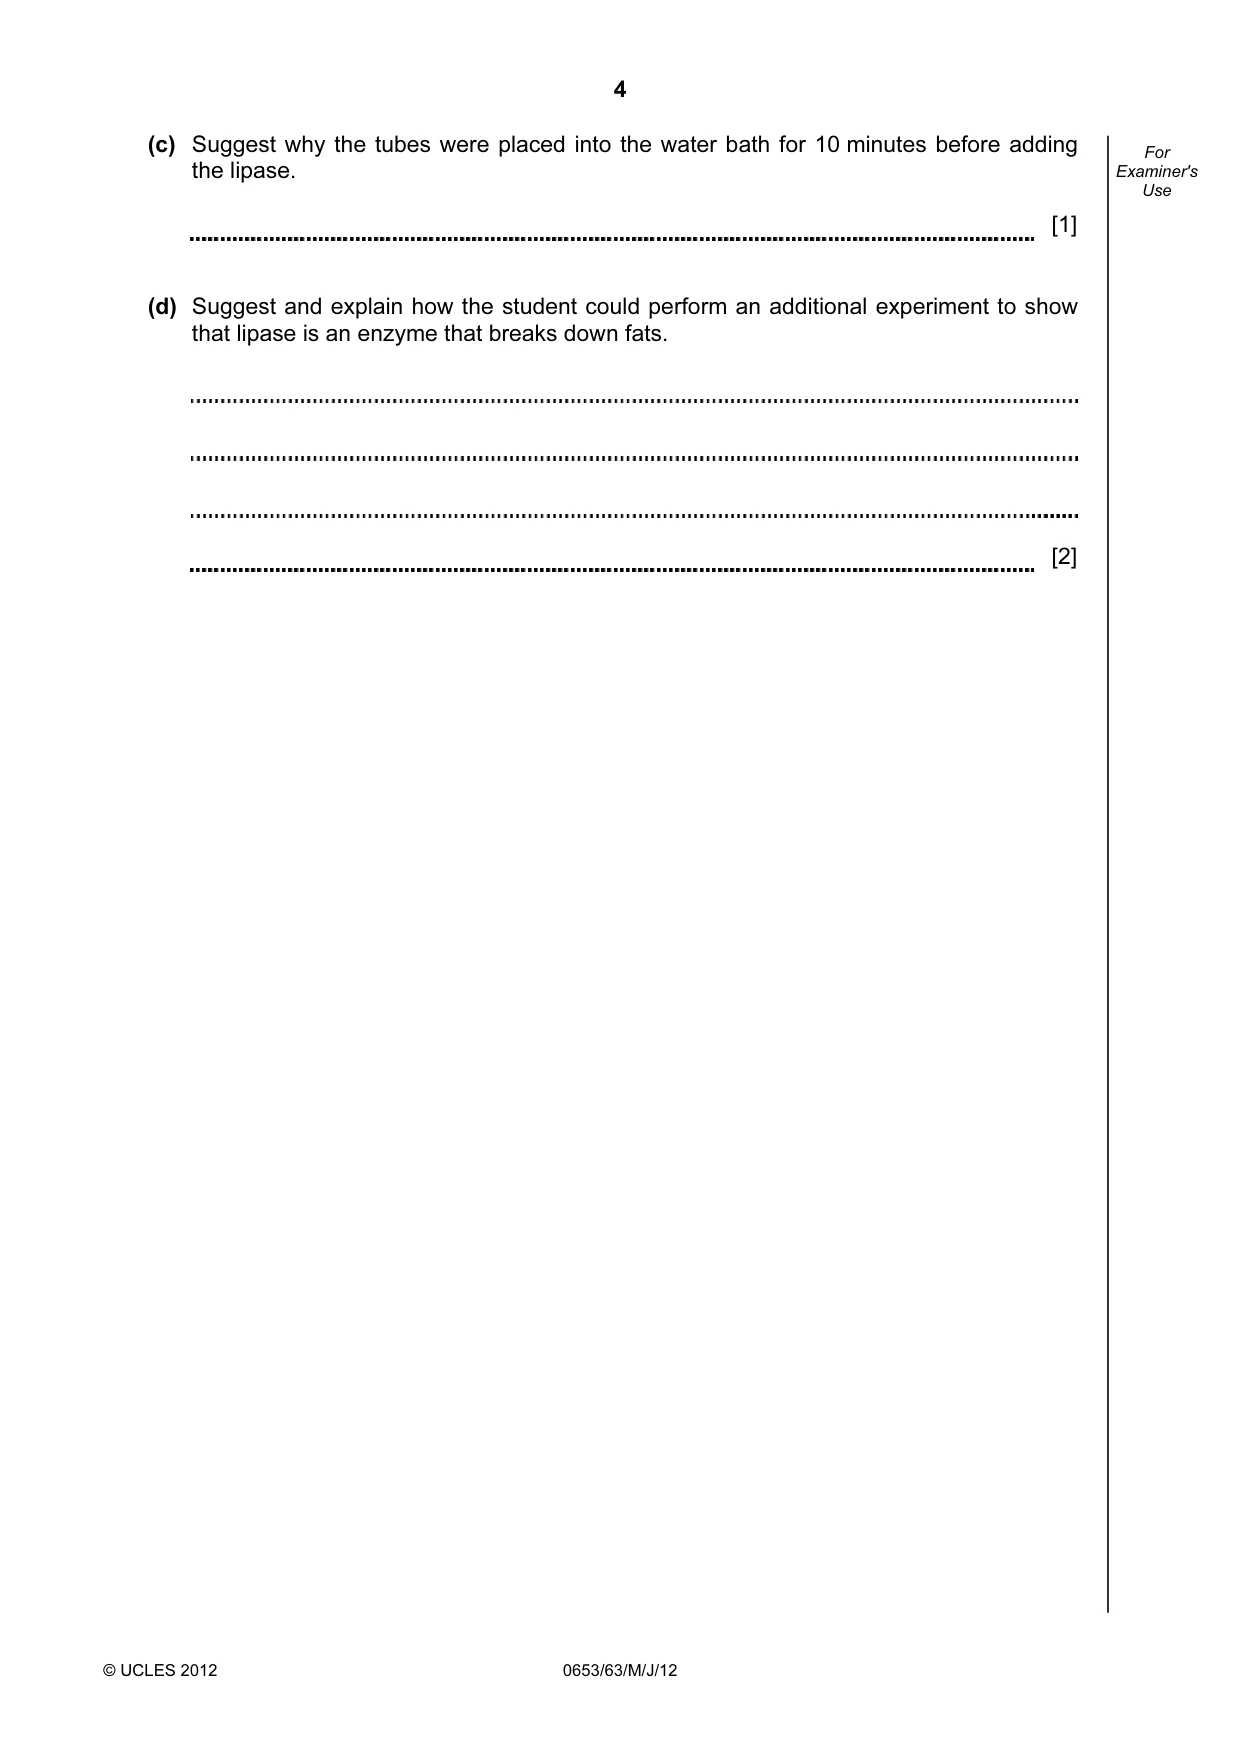
4 © UCLES 2012 0653/63/M/J/12 For Examiner's Use (c) Suggest why the tubes were placed into the water bath for 10 minutes before adding the lipase. [1] (d) Suggest and explain how the student could perform an additional experiment to show that lipase is an enzyme that breaks down fats. [2]
Question paper, page 5
5 © UCLES 2012 0653/63/M/J/12 [Turn over BLANK PAGE Please turn over for Question 2.
Question paper, page 6
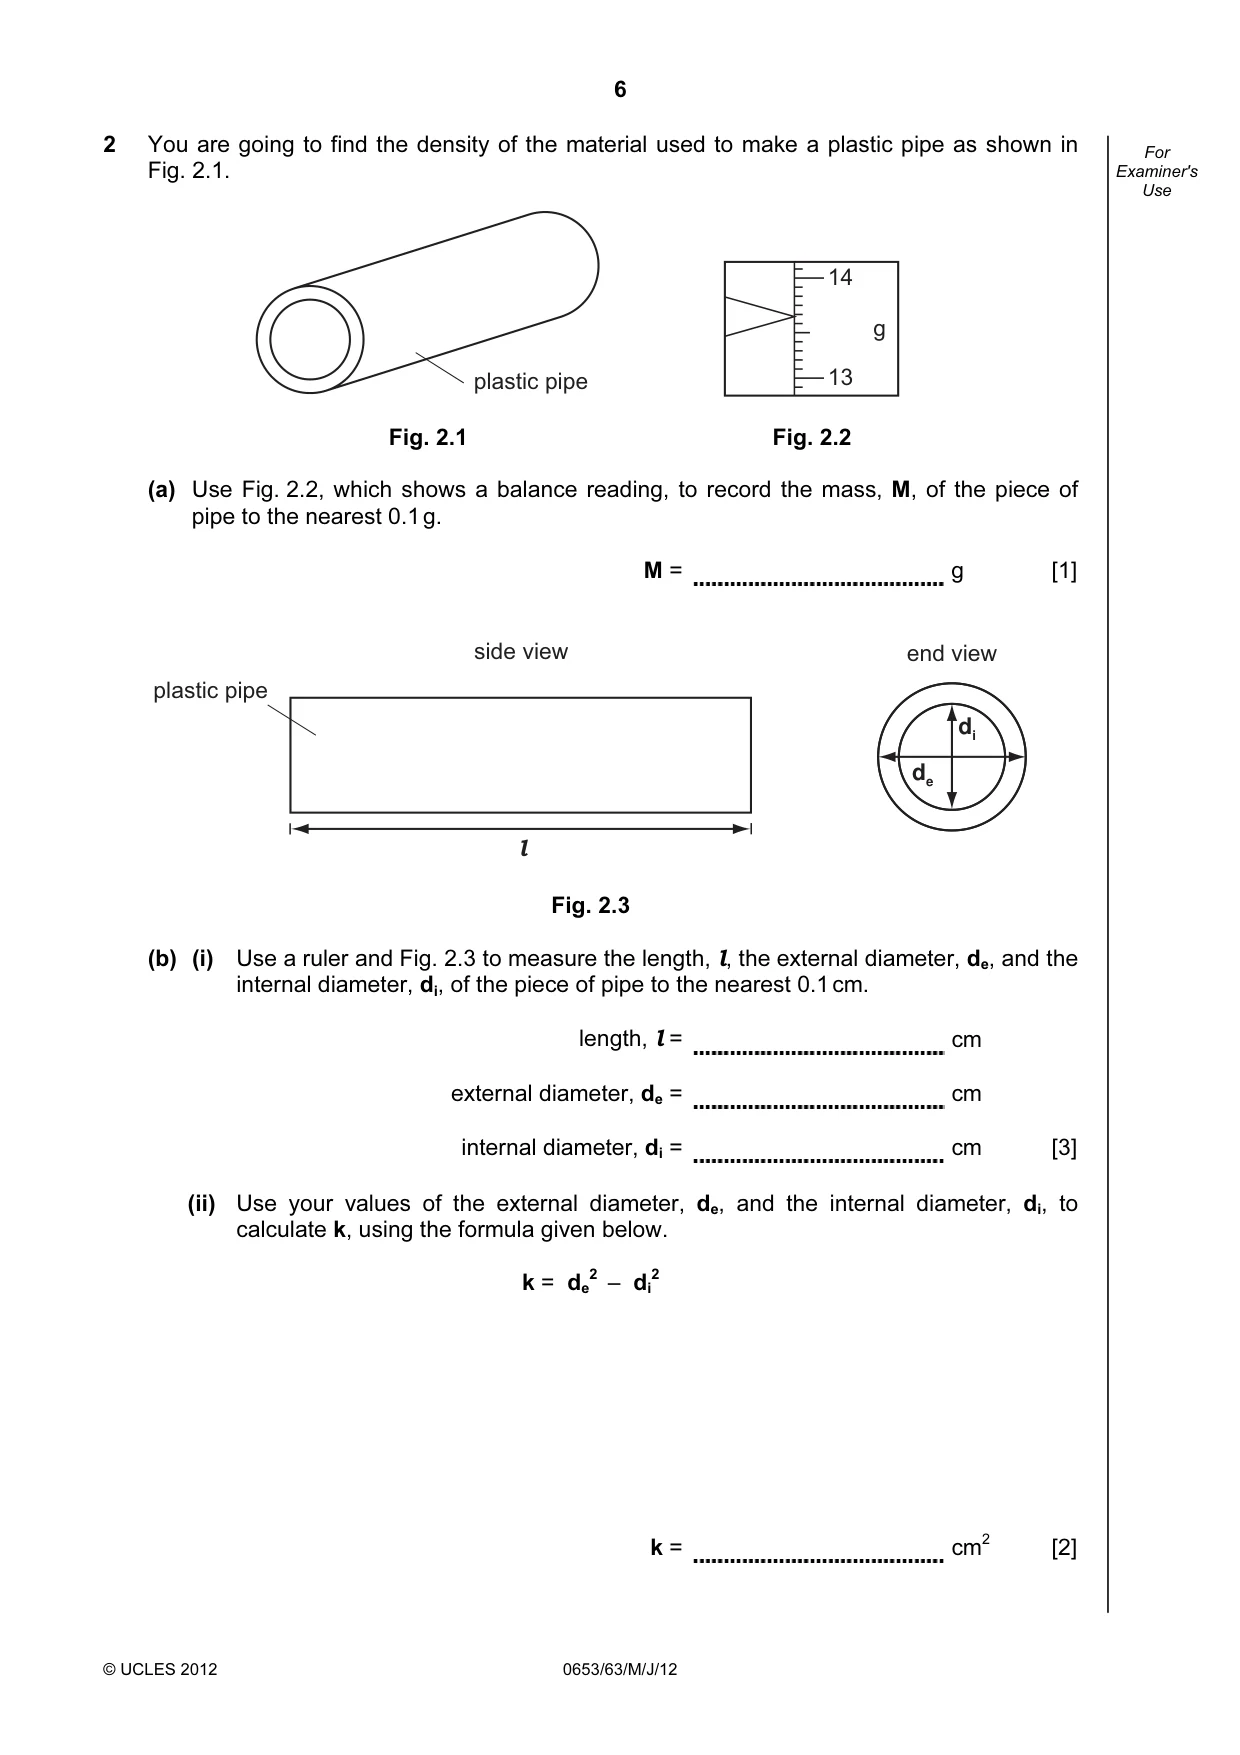
6 © UCLES 2012 0653/63/M/J/12 For Examiner's Use 2 You are going to find the density of the material used to make a plastic pipe as shown in Fig. 2.1. plastic pipe 14 13 g Fig. 2.1 Fig. 2.2 (a) Use Fig. 2.2, which shows a balance reading, to record the mass, M, of the piece of pipe to the nearest 0.1 g. M = g [1] l side view de di end view plastic pipe Fig. 2.3 (b) (i) Use a ruler and Fig. 2.3 to measure the length, l, the external diameter, de, and the internal diameter, di, of the piece of pipe to the nearest 0.1 cm. length, l = cm external diameter, de = cm internal diameter, di = cm [3] (ii) Use your values of the external diameter, de, and the internal diameter, di, to calculate k, using the formula given below. k = de 2 – di 2 k = cm2 [2]
Question paper, page 7
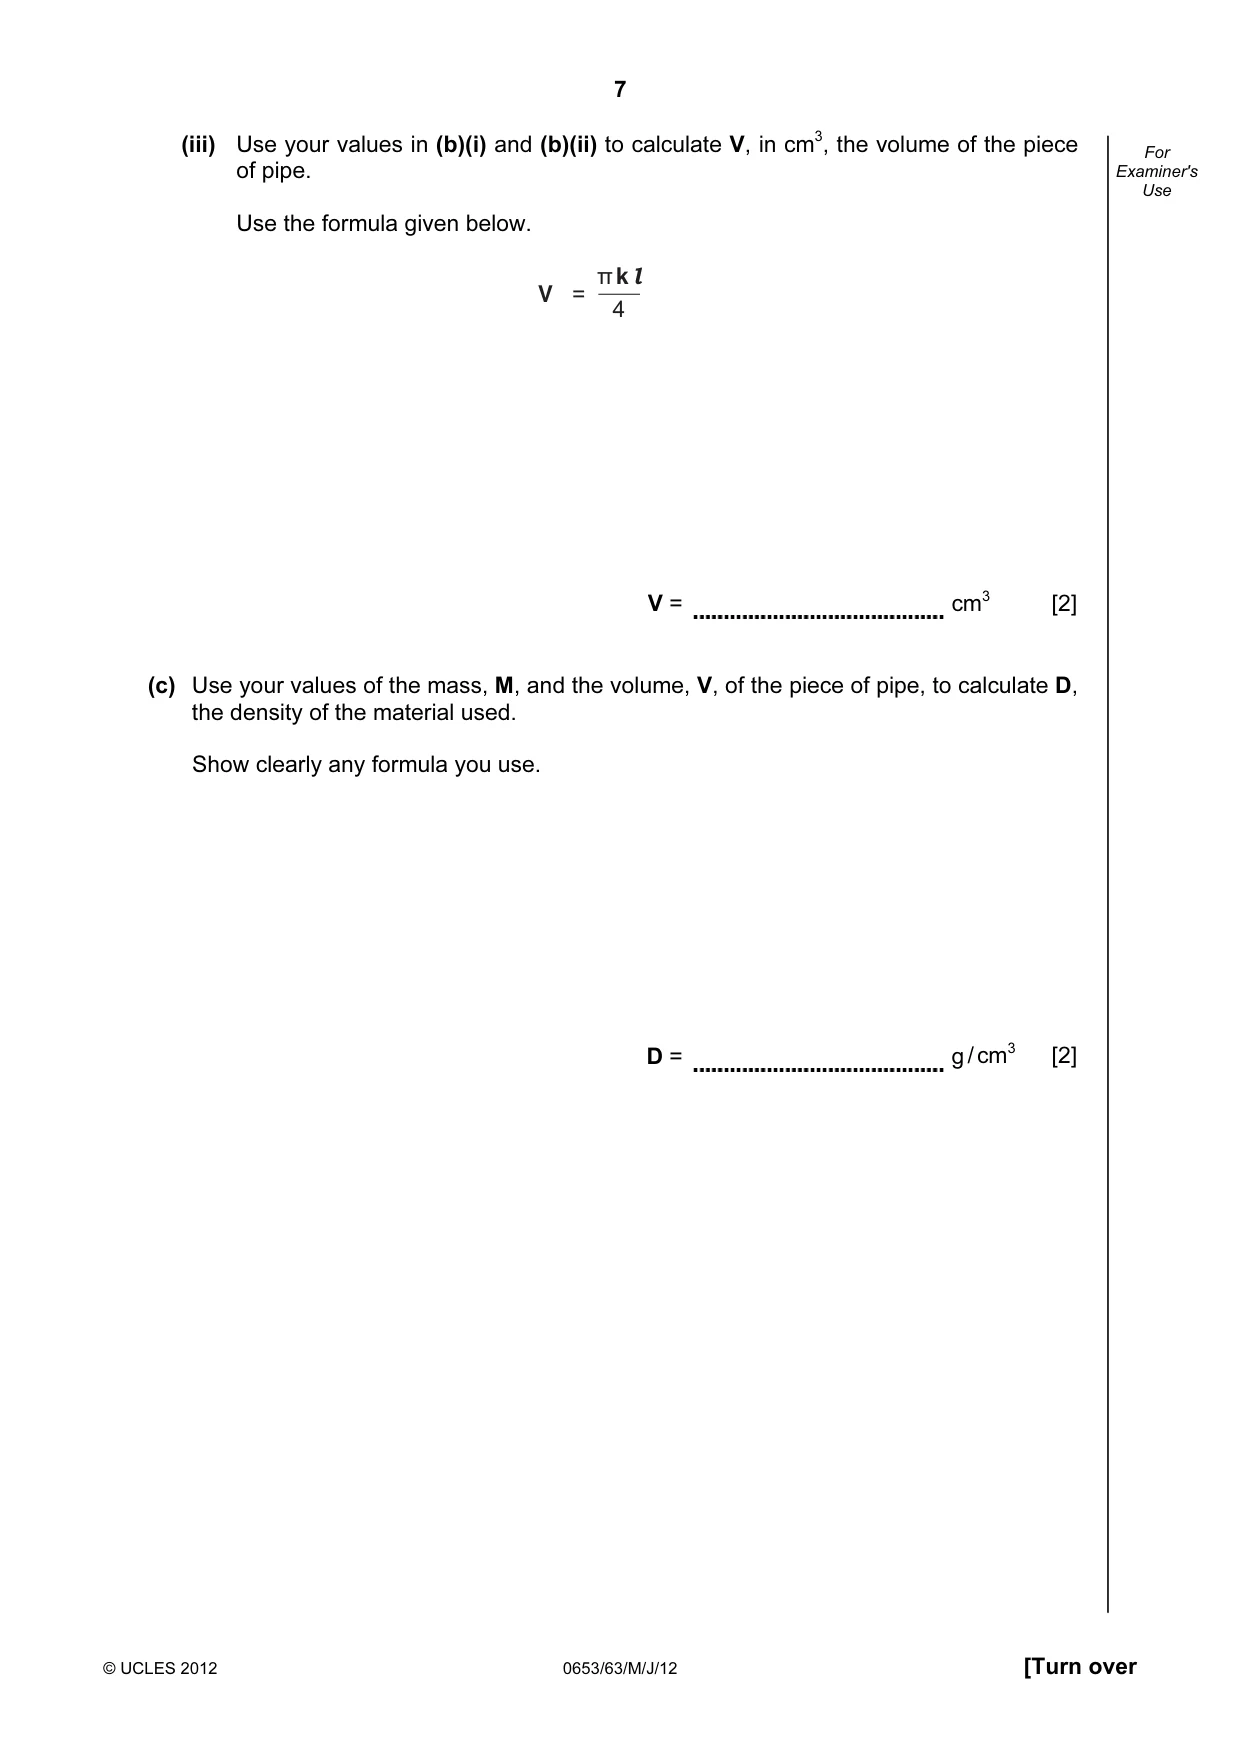
7 © UCLES 2012 0653/63/M/J/12 [Turn over For Examiner's Use (iii) Use your values in (b)(i) and (b)(ii) to calculate V, in cm3, the volume of the piece of pipe. Use the formula given below. π k l 4 V = V = cm3 [2] (c) Use your values of the mass, M, and the volume, V, of the piece of pipe, to calculate D, the density of the material used. Show clearly any formula you use. D = g / cm3 [2]
Question paper, page 8
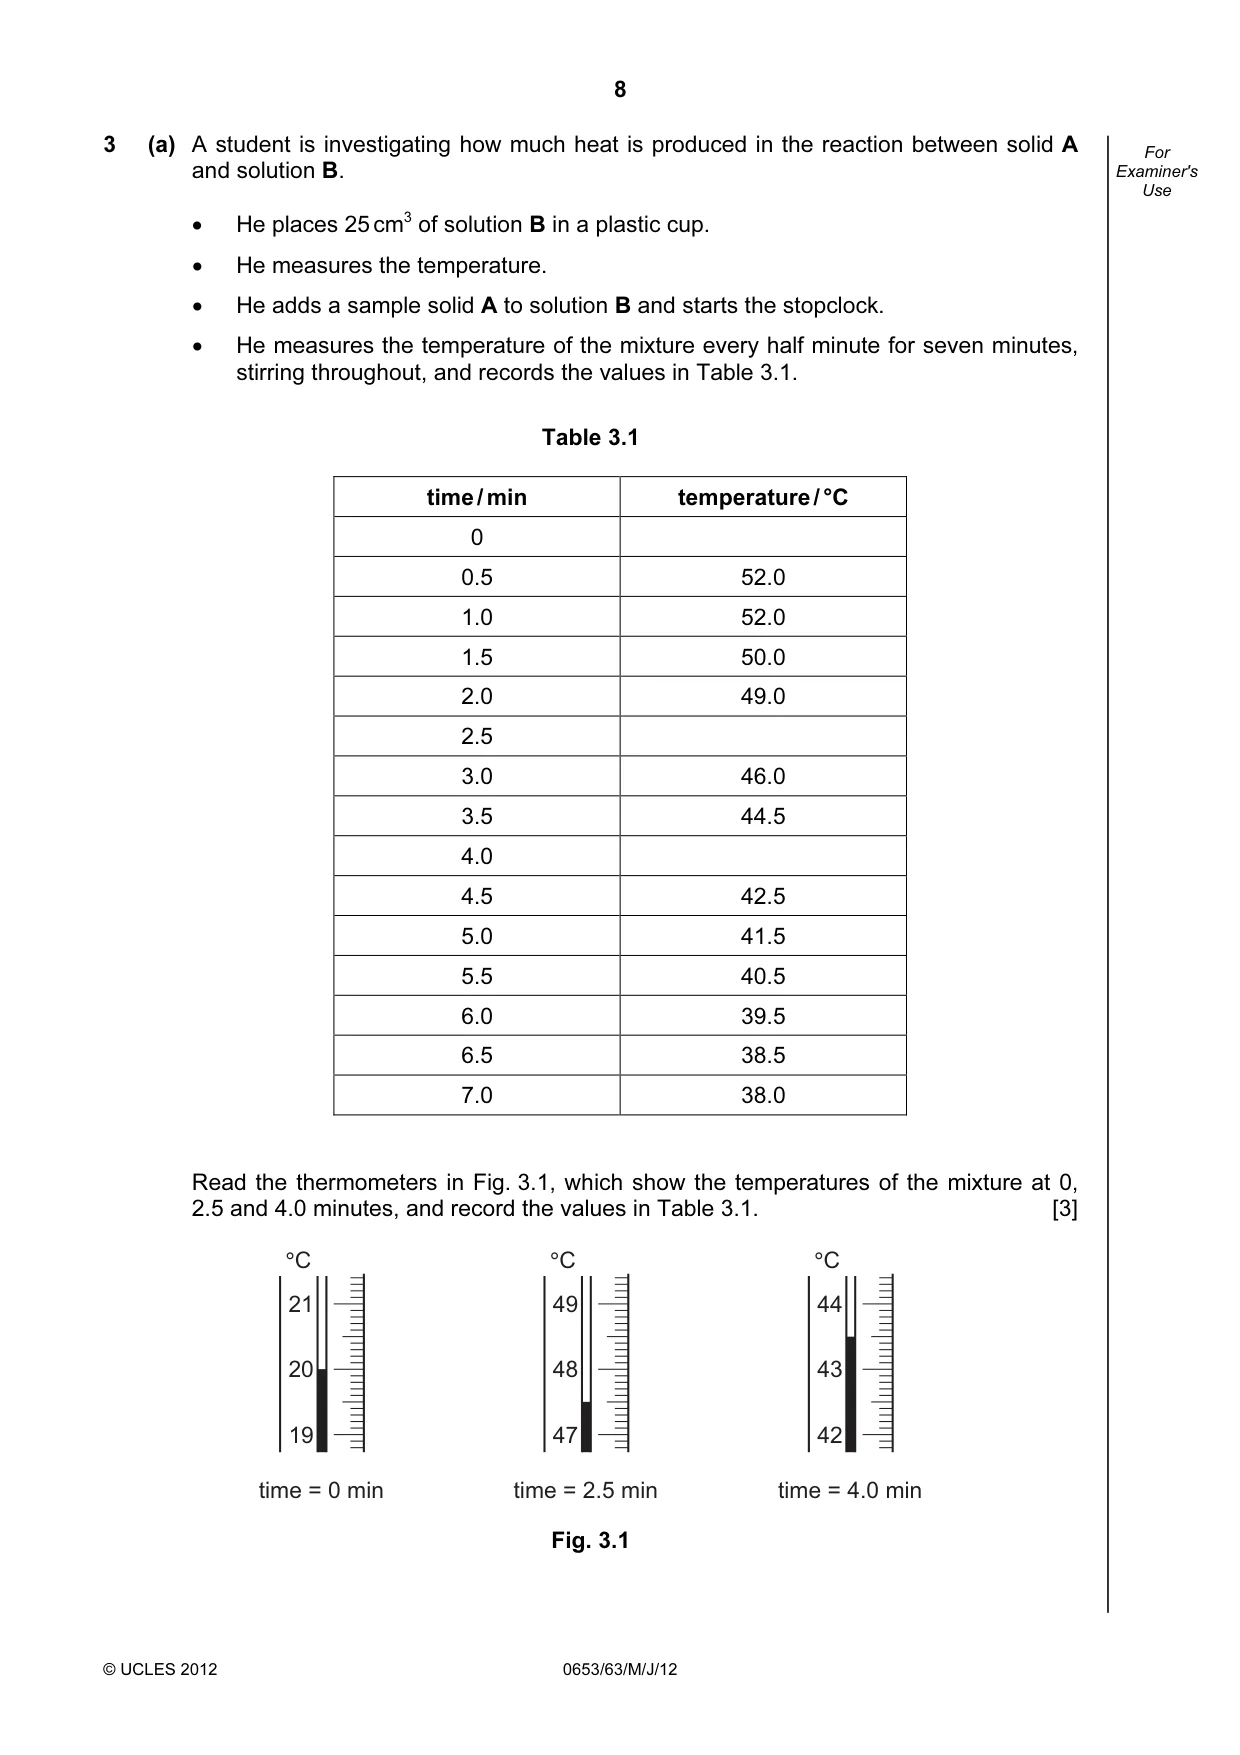
8 © UCLES 2012 0653/63/M/J/12 For Examiner's Use 3 (a) A student is investigating how much heat is produced in the reaction between solid A and solution B. • He places 25 cm3 of solution B in a plastic cup. • He measures the temperature. • He adds a sample solid A to solution B and starts the stopclock. • He measures the temperature of the mixture every half minute for seven minutes, stirring throughout, and records the values in Table 3.1. Table 3.1 time / min temperature / °C 0 0.5 52.0 1.0 52.0 1.5 50.0 2.0 49.0 2.5 3.0 46.0 3.5 44.5 4.0 4.5 42.5 5.0 41.5 5.5 40.5 6.0 39.5 6.5 38.5 7.0 38.0 Read the thermometers in Fig. 3.1, which show the temperatures of the mixture at 0, 2.5 and 4.0 minutes, and record the values in Table 3.1. [3] 21 20 19 °C time = 0 min 49 48 47 °C time = 2.5 min 44 43 42 °C time = 4.0 min Fig. 3.1
Question paper, page 9
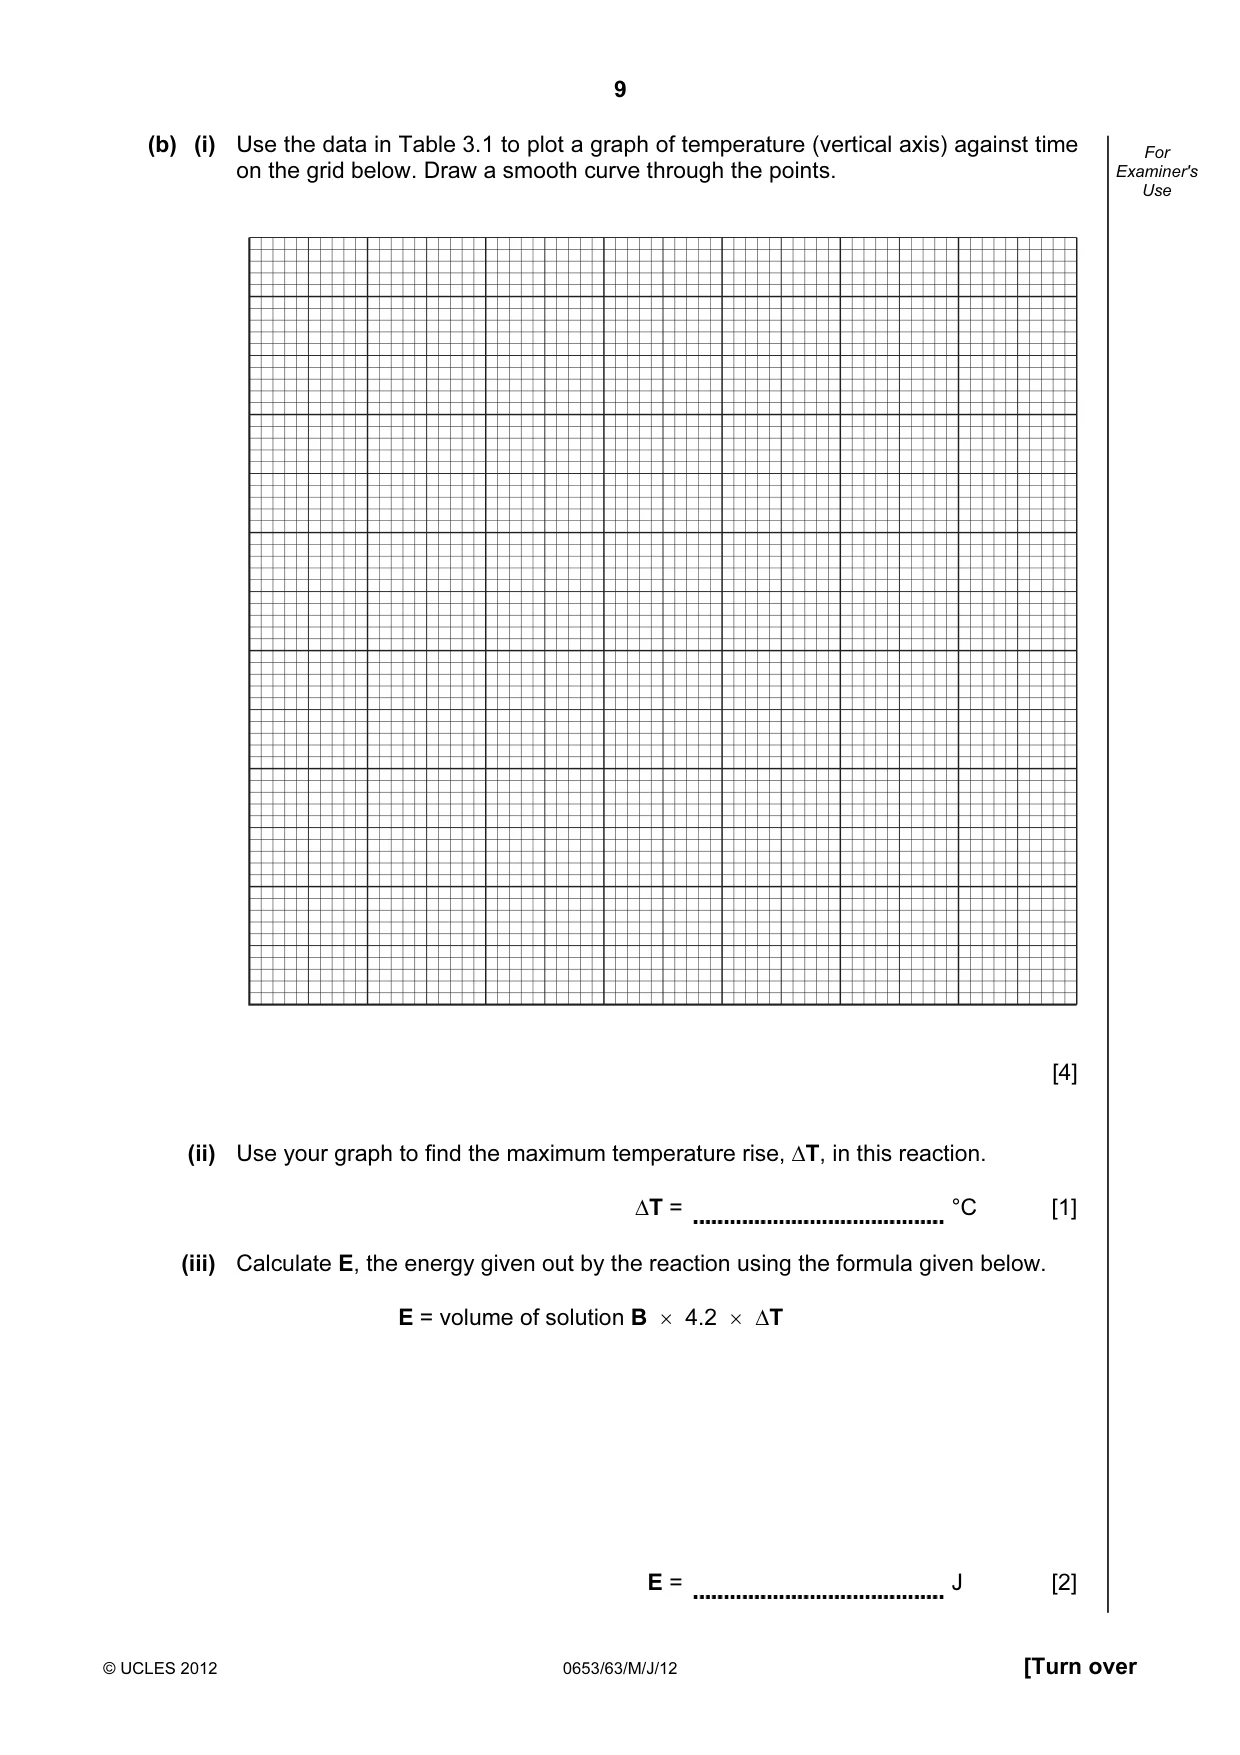
9 © UCLES 2012 0653/63/M/J/12 [Turn over For Examiner's Use (b) (i) Use the data in Table 3.1 to plot a graph of temperature (vertical axis) against time on the grid below. Draw a smooth curve through the points. [4] (ii) Use your graph to find the maximum temperature rise, ∆T, in this reaction. ∆T = °C [1] (iii) Calculate E, the energy given out by the reaction using the formula given below. E = volume of solution B × 4.2 × ∆T E = J [2]
Question paper, page 10
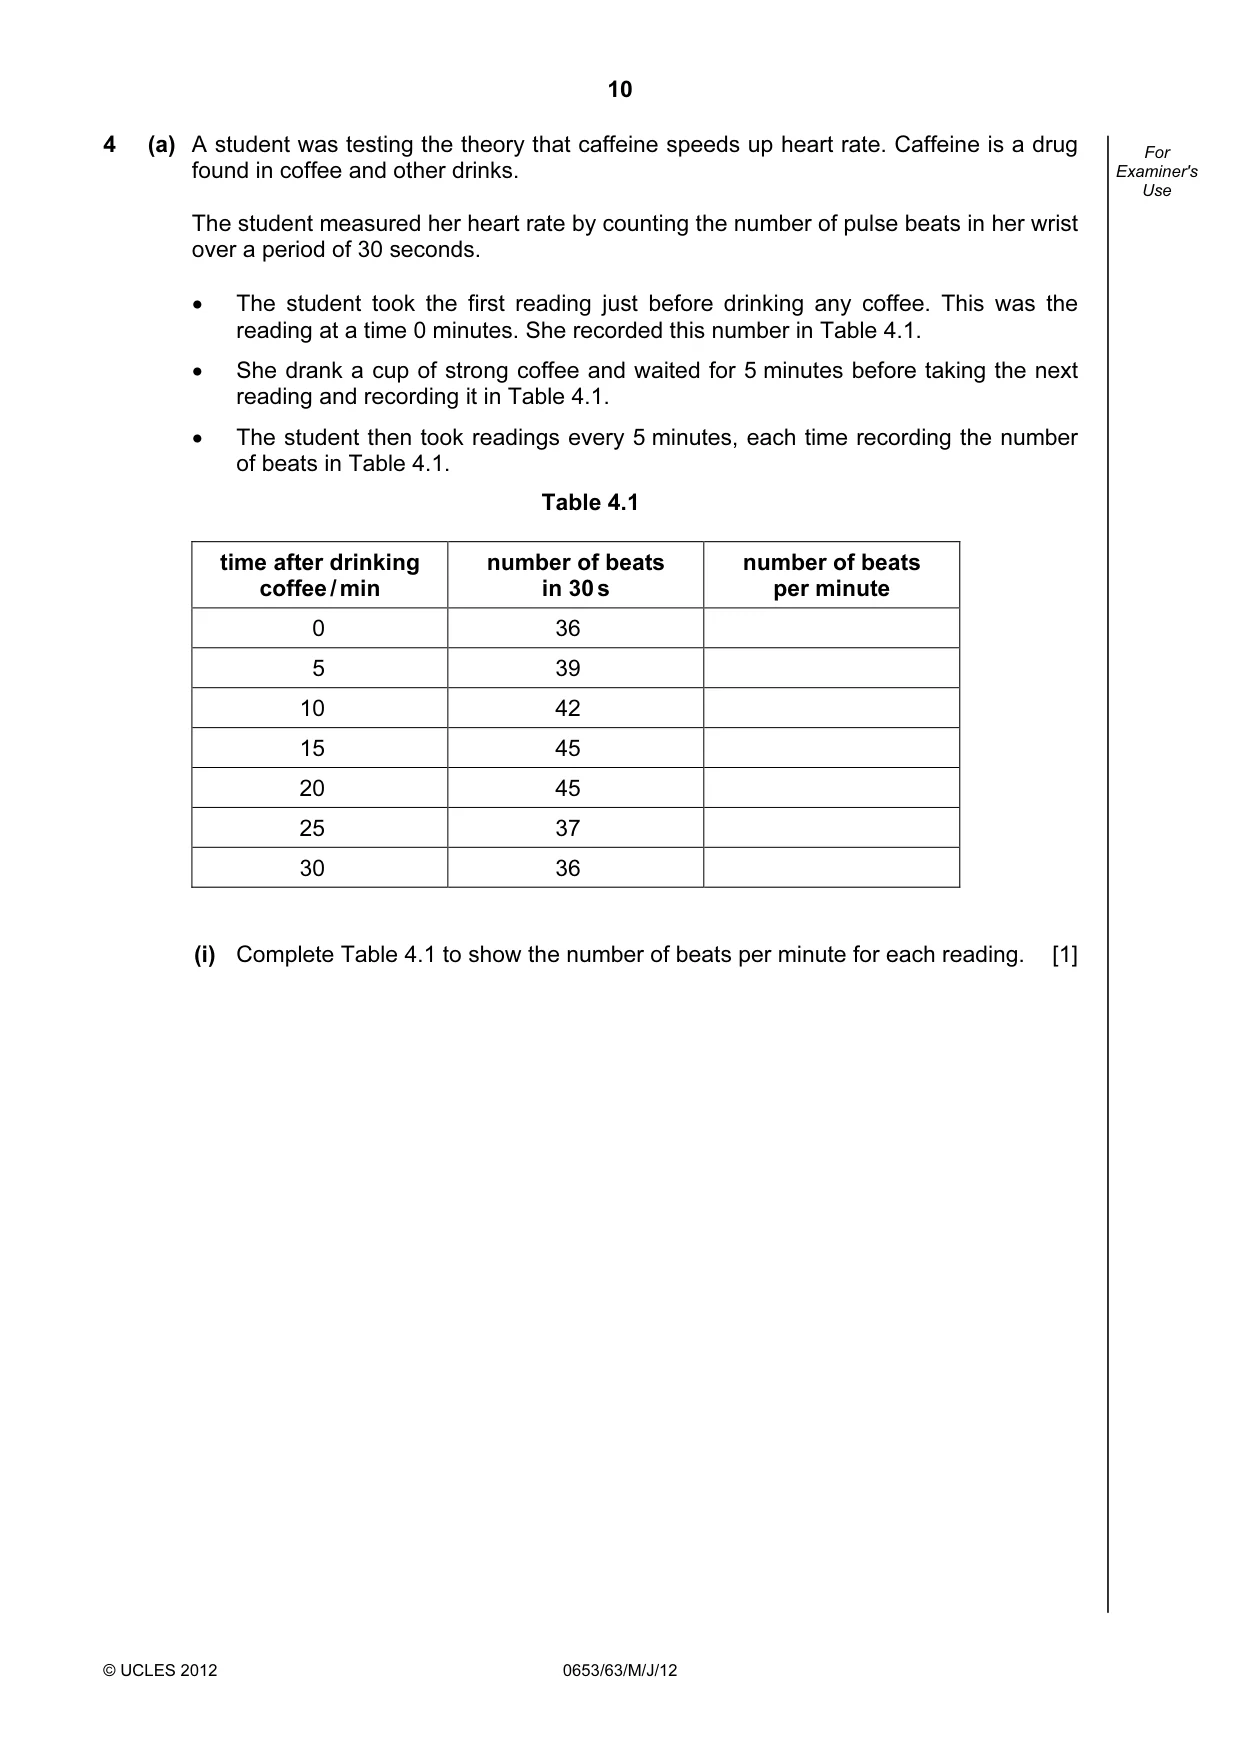
10 © UCLES 2012 0653/63/M/J/12 For Examiner's Use 4 (a) A student was testing the theory that caffeine speeds up heart rate. Caffeine is a drug found in coffee and other drinks. The student measured her heart rate by counting the number of pulse beats in her wrist over a period of 30 seconds. • The student took the first reading just before drinking any coffee. This was the reading at a time 0 minutes. She recorded this number in Table 4.1. • She drank a cup of strong coffee and waited for 5 minutes before taking the next reading and recording it in Table 4.1. • The student then took readings every 5 minutes, each time recording the number of beats in Table 4.1. Table 4.1 time after drinking coffee / min number of beats in 30 s number of beats per minute 0 36 5 39 10 42 15 45 20 45 25 37 30 36 (i) Complete Table 4.1 to show the number of beats per minute for each reading. [1]
Question paper, page 11
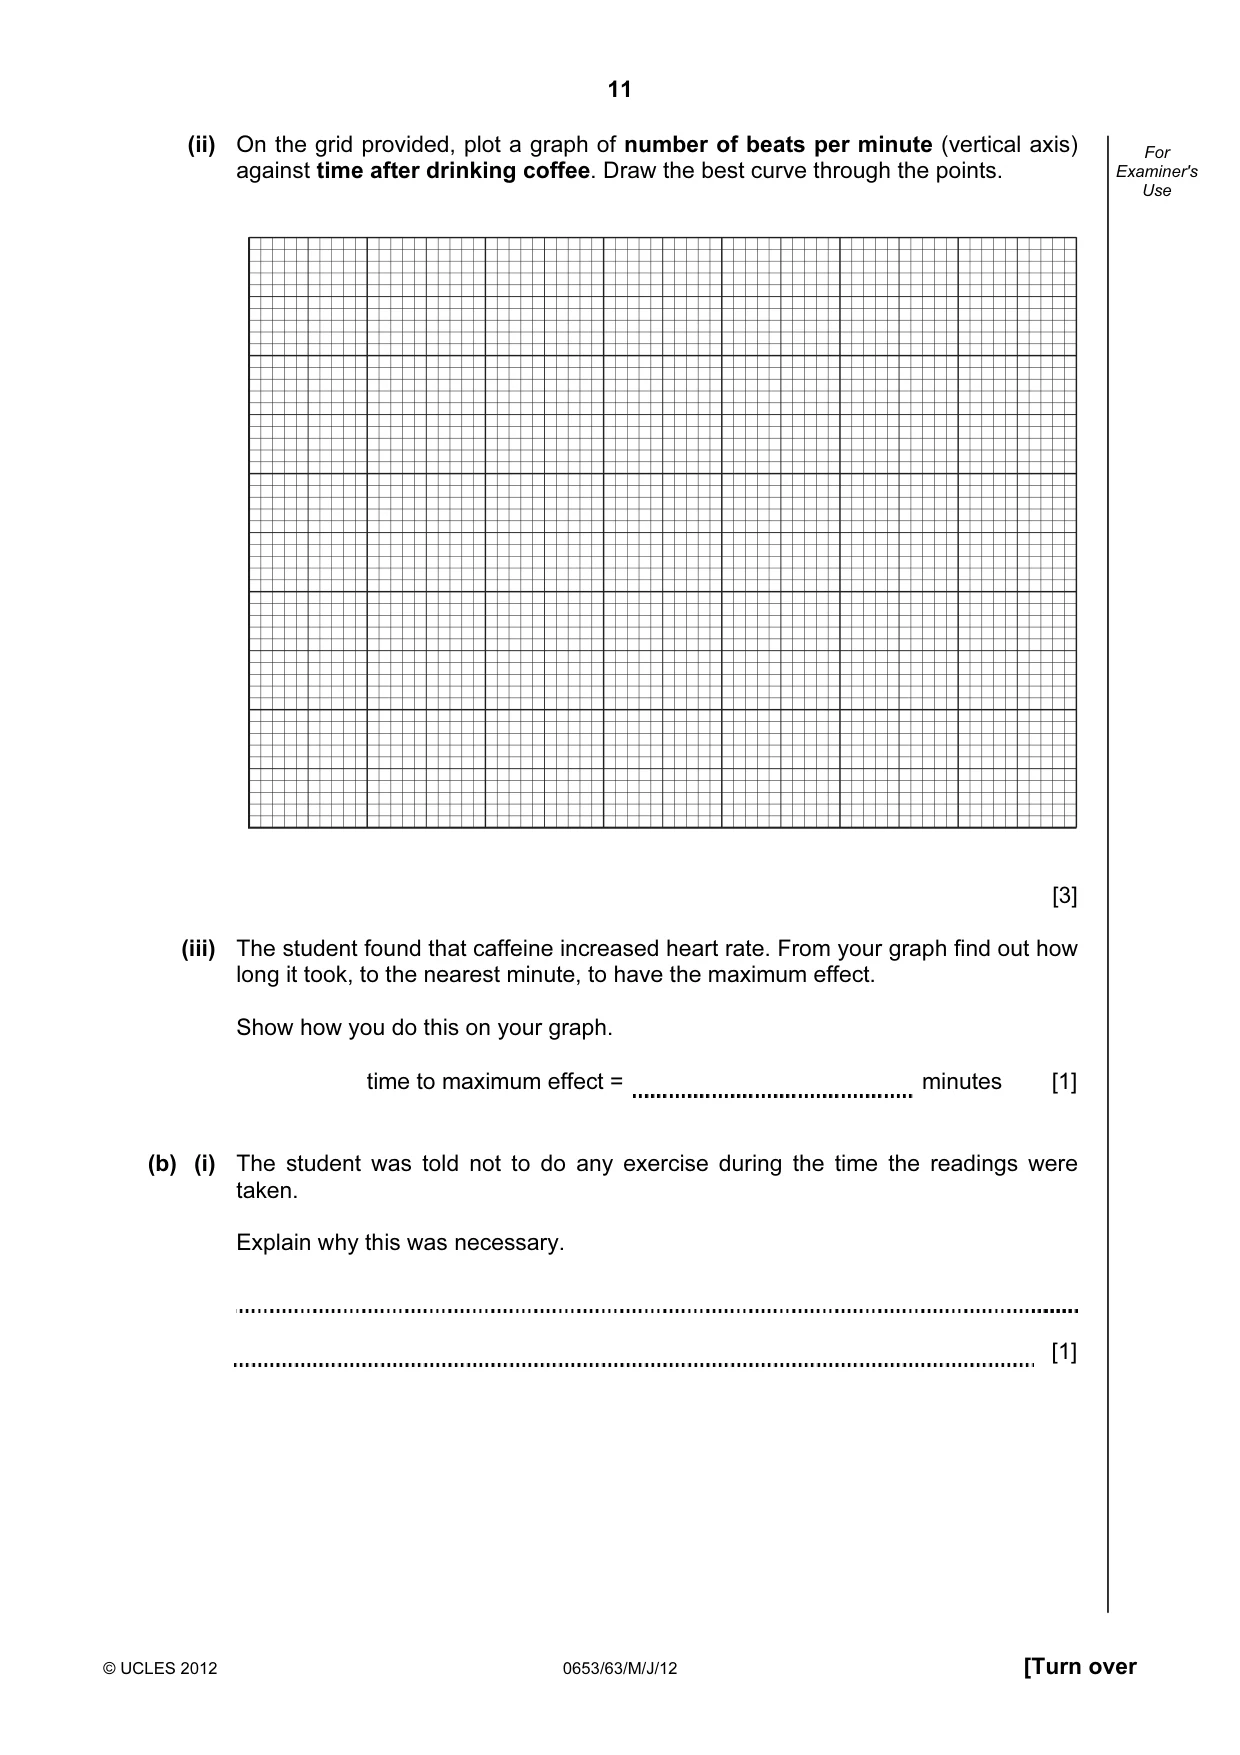
11 © UCLES 2012 0653/63/M/J/12 [Turn over For Examiner's Use (ii) On the grid provided, plot a graph of number of beats per minute (vertical axis) against time after drinking coffee. Draw the best curve through the points. [3] (iii) The student found that caffeine increased heart rate. From your graph find out how long it took, to the nearest minute, to have the maximum effect. Show how you do this on your graph. time to maximum effect = minutes [1] (b) (i) The student was told not to do any exercise during the time the readings were taken. Explain why this was necessary. [1]
Question paper, page 12
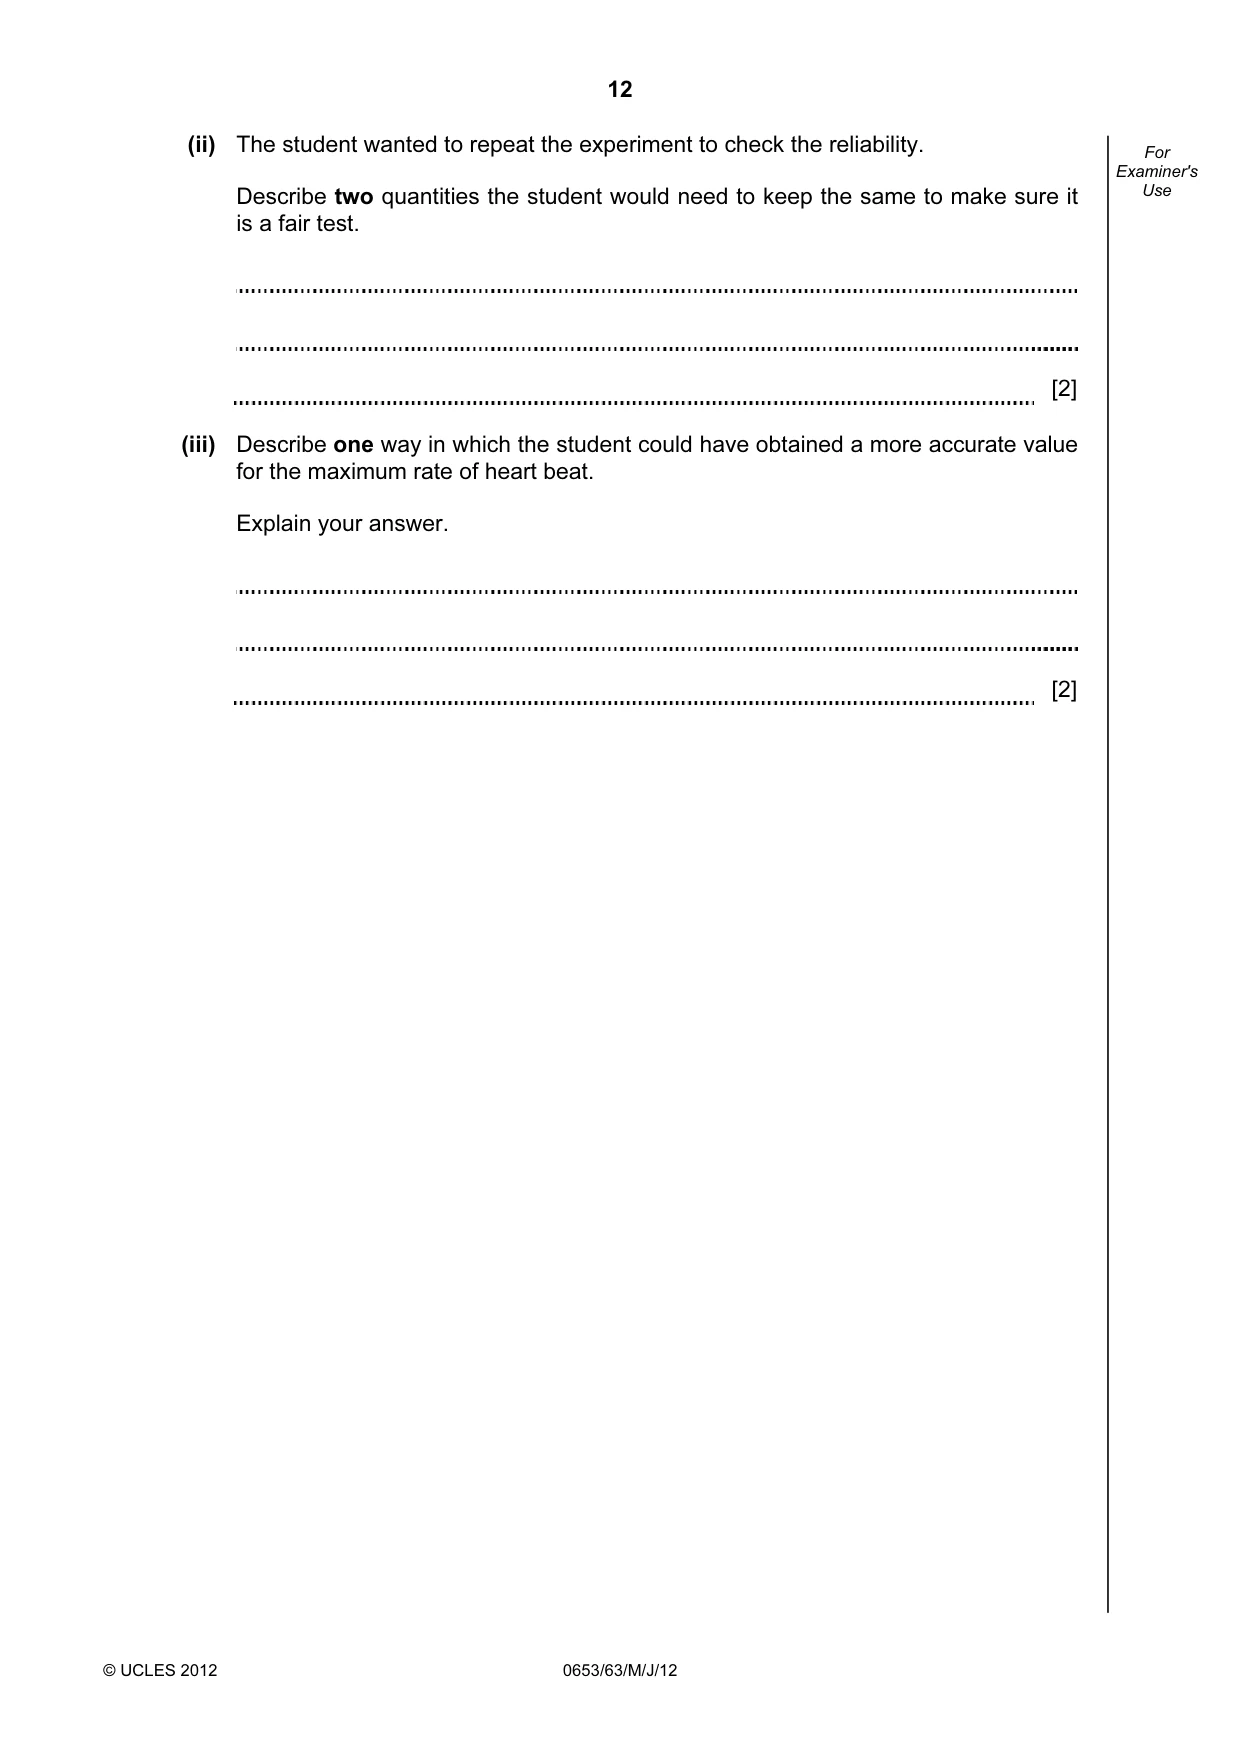
12 © UCLES 2012 0653/63/M/J/12 For Examiner's Use (ii) The student wanted to repeat the experiment to check the reliability. Describe two quantities the student would need to keep the same to make sure it is a fair test. [2] (iii) Describe one way in which the student could have obtained a more accurate value for the maximum rate of heart beat. Explain your answer. [2]
Question paper, page 13
13 © UCLES 2012 0653/63/M/J/12 [Turn over BLANK PAGE Please turn over for Question 5.
Question paper, page 14
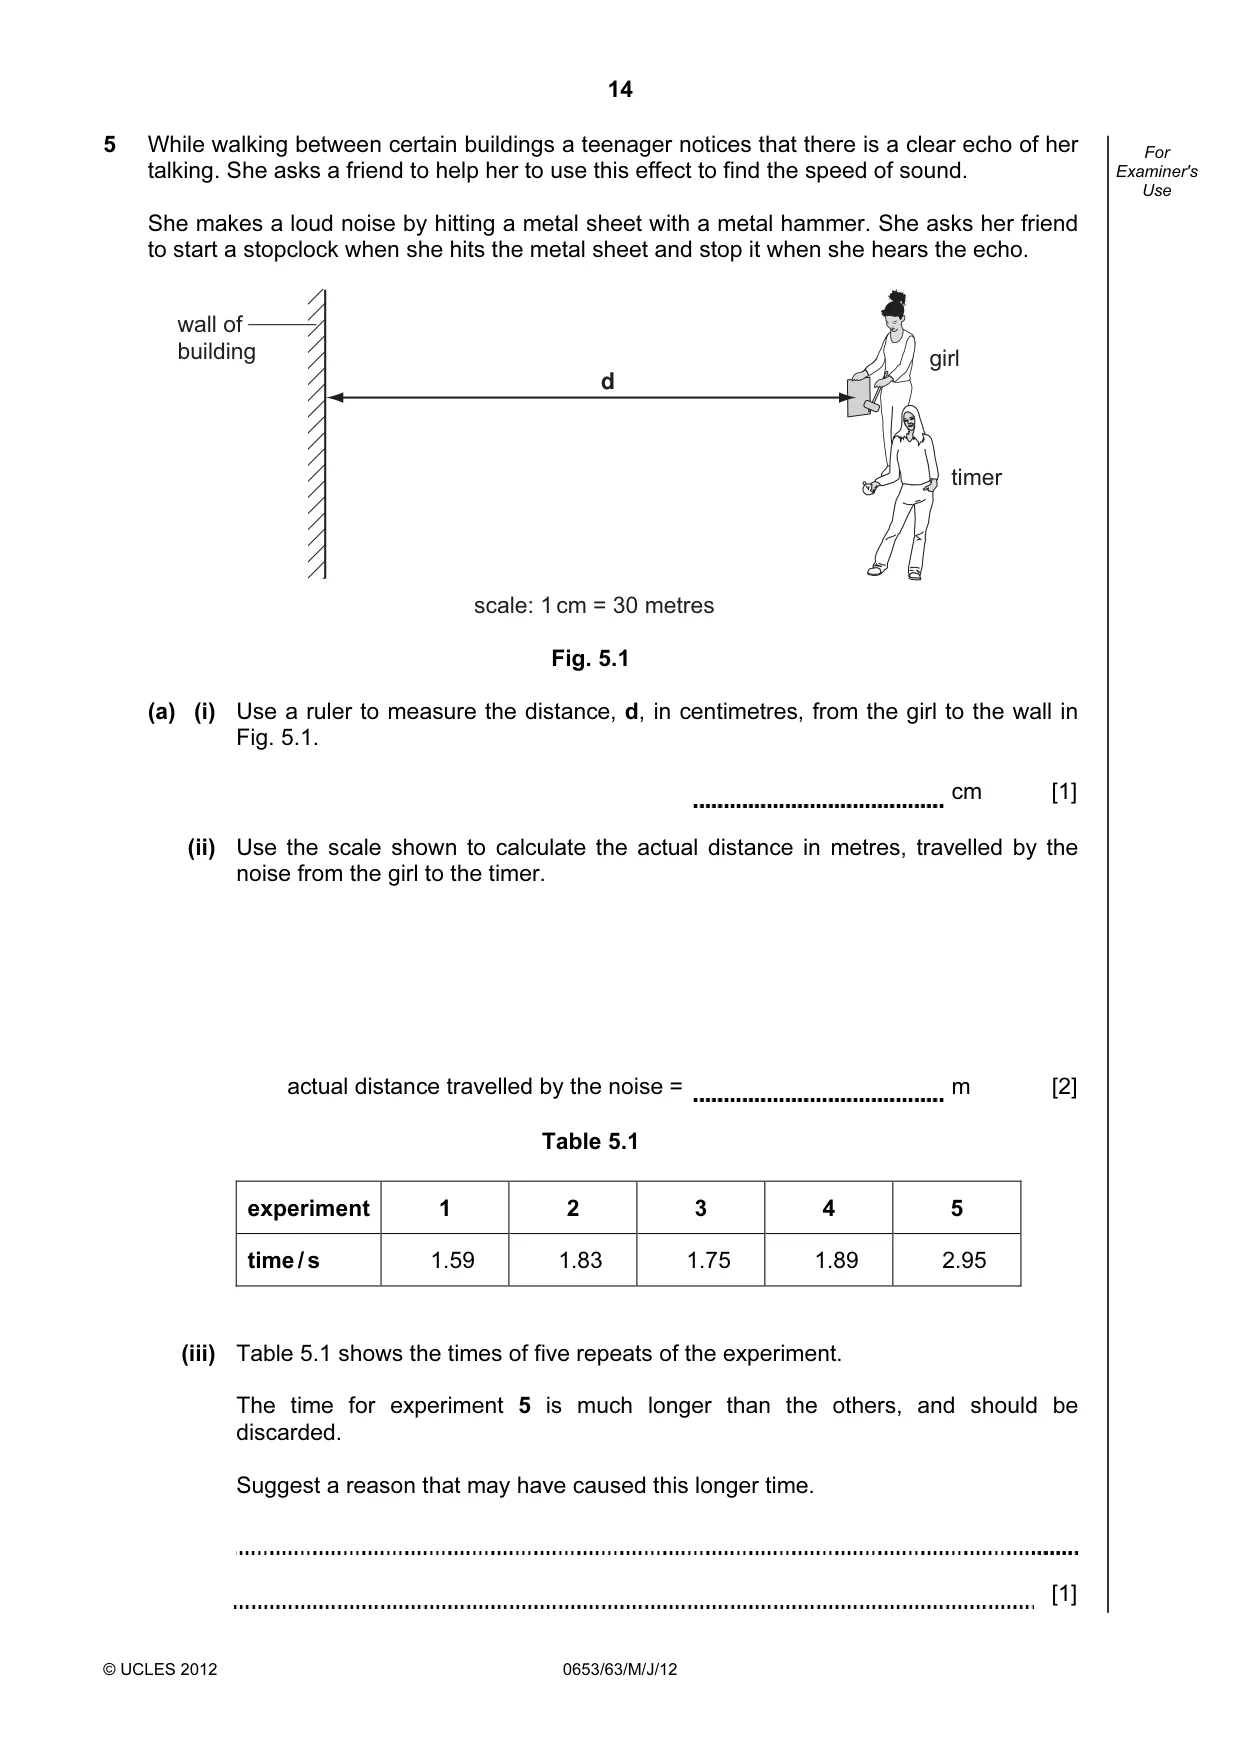
14 © UCLES 2012 0653/63/M/J/12 For Examiner's Use 5 While walking between certain buildings a teenager notices that there is a clear echo of her talking. She asks a friend to help her to use this effect to find the speed of sound. She makes a loud noise by hitting a metal sheet with a metal hammer. She asks her friend to start a stopclock when she hits the metal sheet and stop it when she hears the echo. wall of building girl timer d scale: 1 cm = 30 metres Fig. 5.1 (a) (i) Use a ruler to measure the distance, d, in centimetres, from the girl to the wall in Fig. 5.1. cm [1] (ii) Use the scale shown to calculate the actual distance in metres, travelled by the noise from the girl to the timer. actual distance travelled by the noise = m [2] Table 5.1 experiment 1 2 3 4 5 time / s 1.59 1.83 1.75 1.89 2.95 (iii) Table 5.1 shows the times of five repeats of the experiment. The time for experiment 5 is much longer than the others, and should be discarded. Suggest a reason that may have caused this longer time. [1]
Question paper, page 15
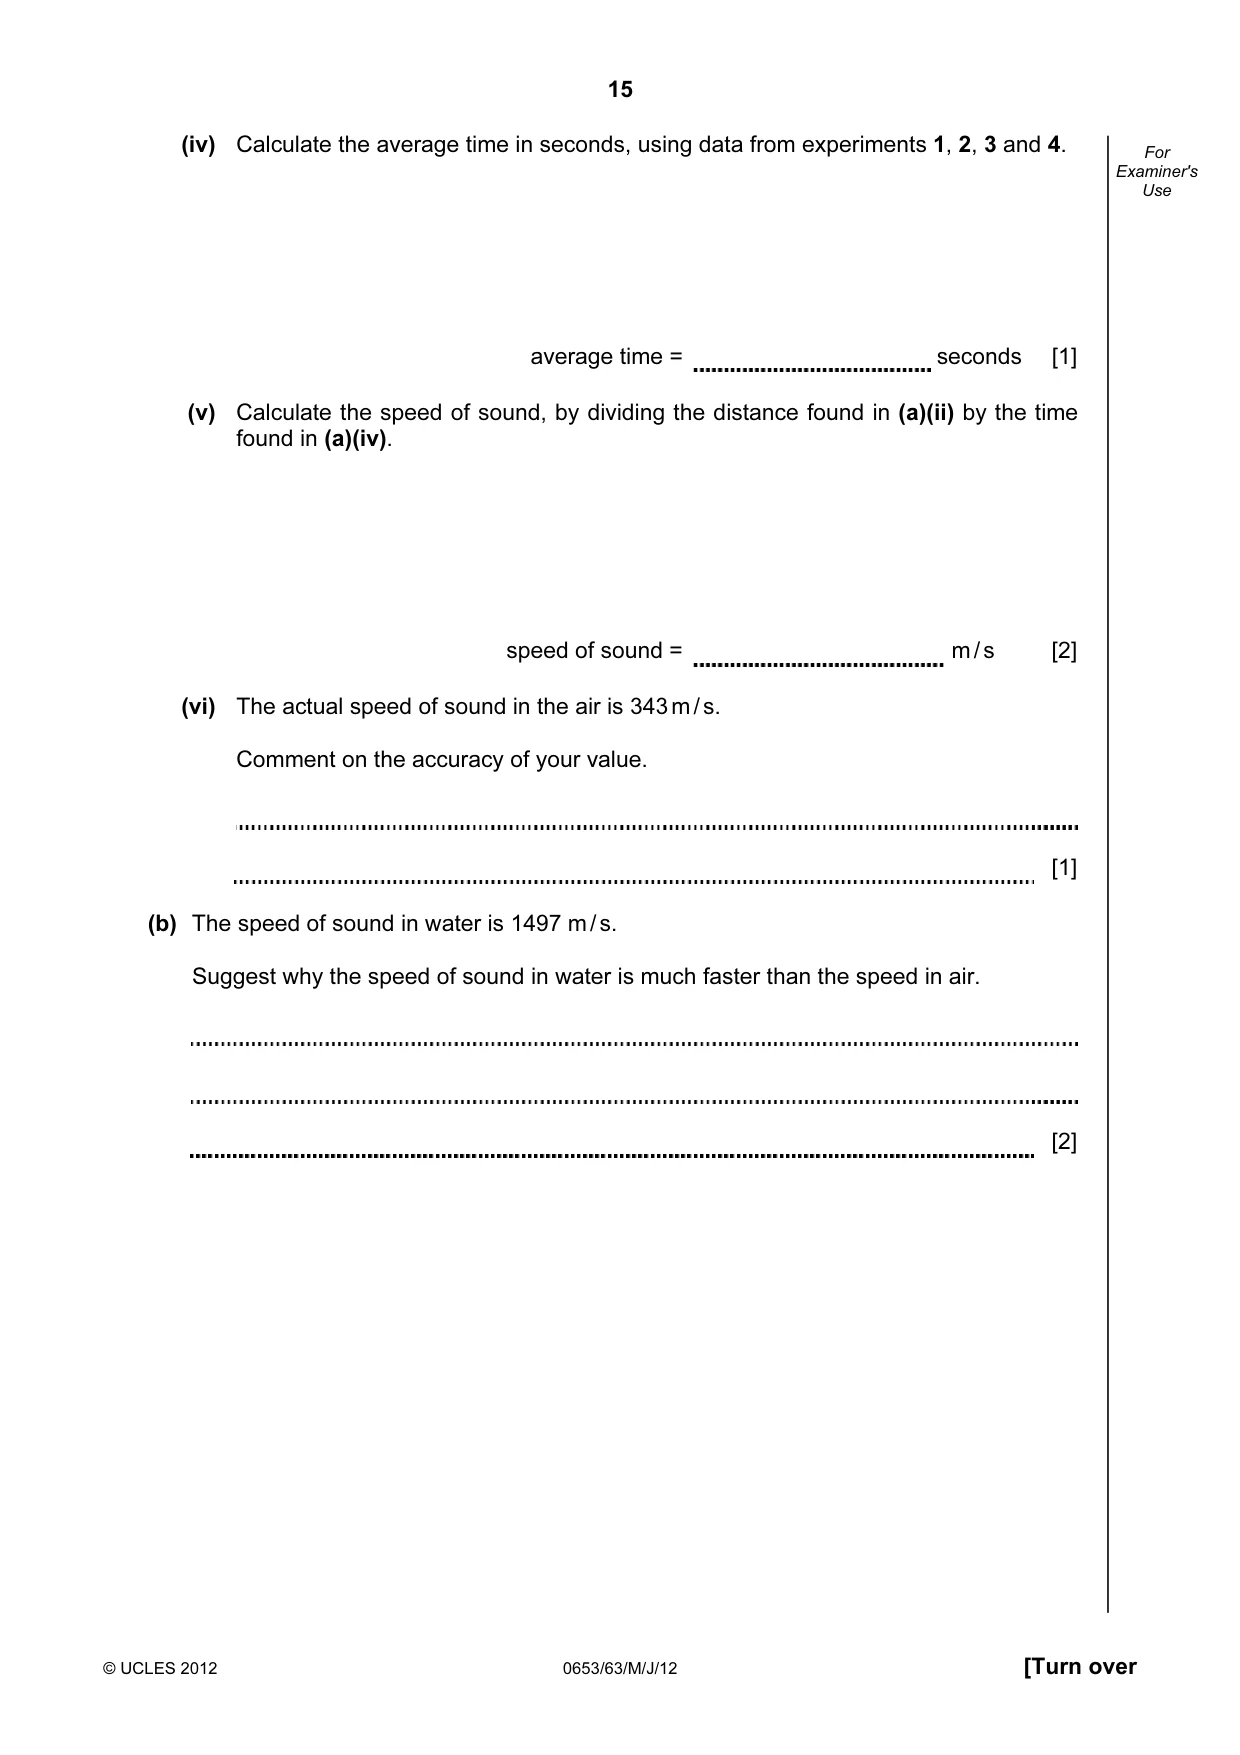
15 © UCLES 2012 0653/63/M/J/12 [Turn over For Examiner's Use (iv) Calculate the average time in seconds, using data from experiments 1, 2, 3 and 4. average time = seconds [1] (v) Calculate the speed of sound, by dividing the distance found in (a)(ii) by the time found in (a)(iv). speed of sound = m / s [2] (vi) The actual speed of sound in the air is 343 m / s. Comment on the accuracy of your value. [1] (b) The speed of sound in water is 1497 m / s. Suggest why the speed of sound in water is much faster than the speed in air. [2]
Question paper, page 16
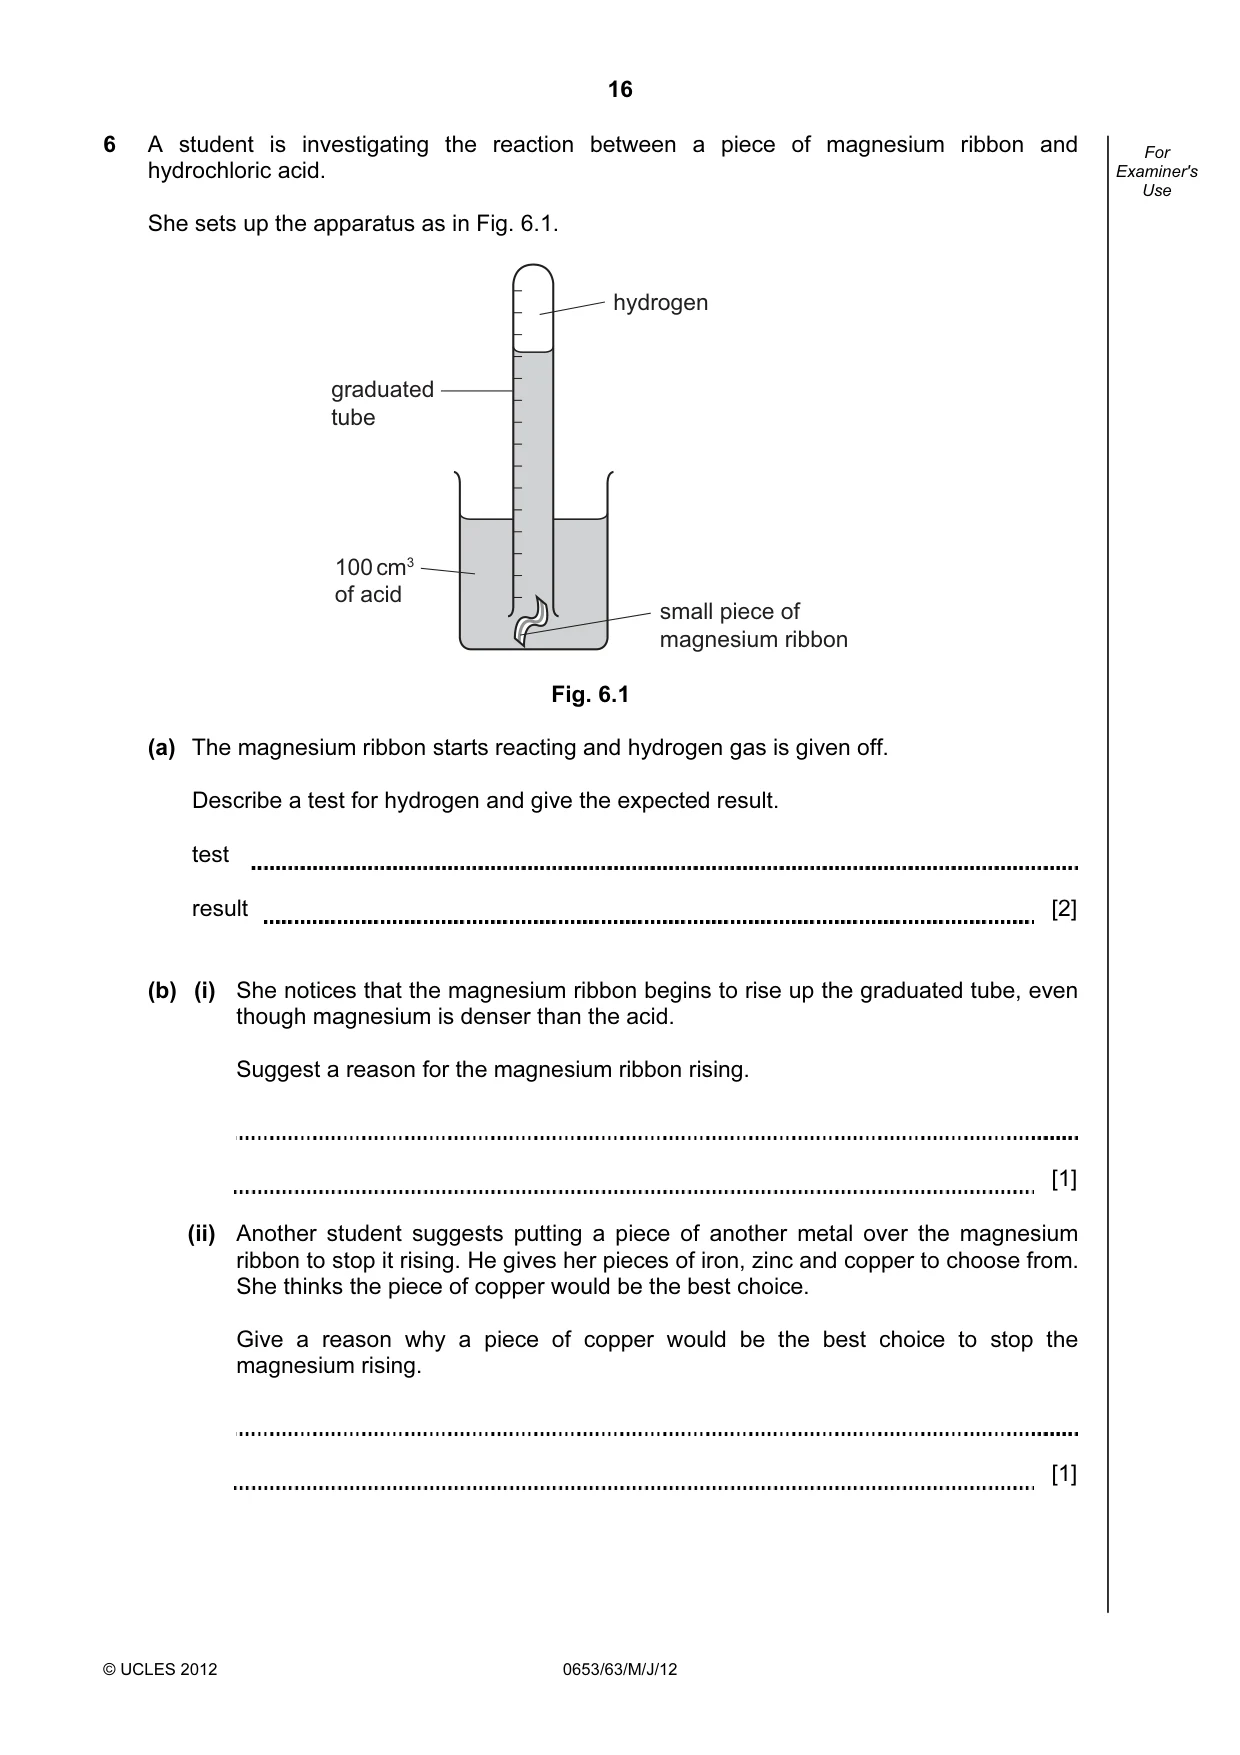
16 © UCLES 2012 0653/63/M/J/12 For Examiner's Use 6 A student is investigating the reaction between a piece of magnesium ribbon and hydrochloric acid. She sets up the apparatus as in Fig. 6.1. hydrogen graduated tube 100 cm3 of acid small piece of magnesium ribbon Fig. 6.1 (a) The magnesium ribbon starts reacting and hydrogen gas is given off. Describe a test for hydrogen and give the expected result. test result [2] (b) (i) She notices that the magnesium ribbon begins to rise up the graduated tube, even though magnesium is denser than the acid. Suggest a reason for the magnesium ribbon rising. [1] (ii) Another student suggests putting a piece of another metal over the magnesium ribbon to stop it rising. He gives her pieces of iron, zinc and copper to choose from. She thinks the piece of copper would be the best choice. Give a reason why a piece of copper would be the best choice to stop the magnesium rising. [1]
Question paper, page 17
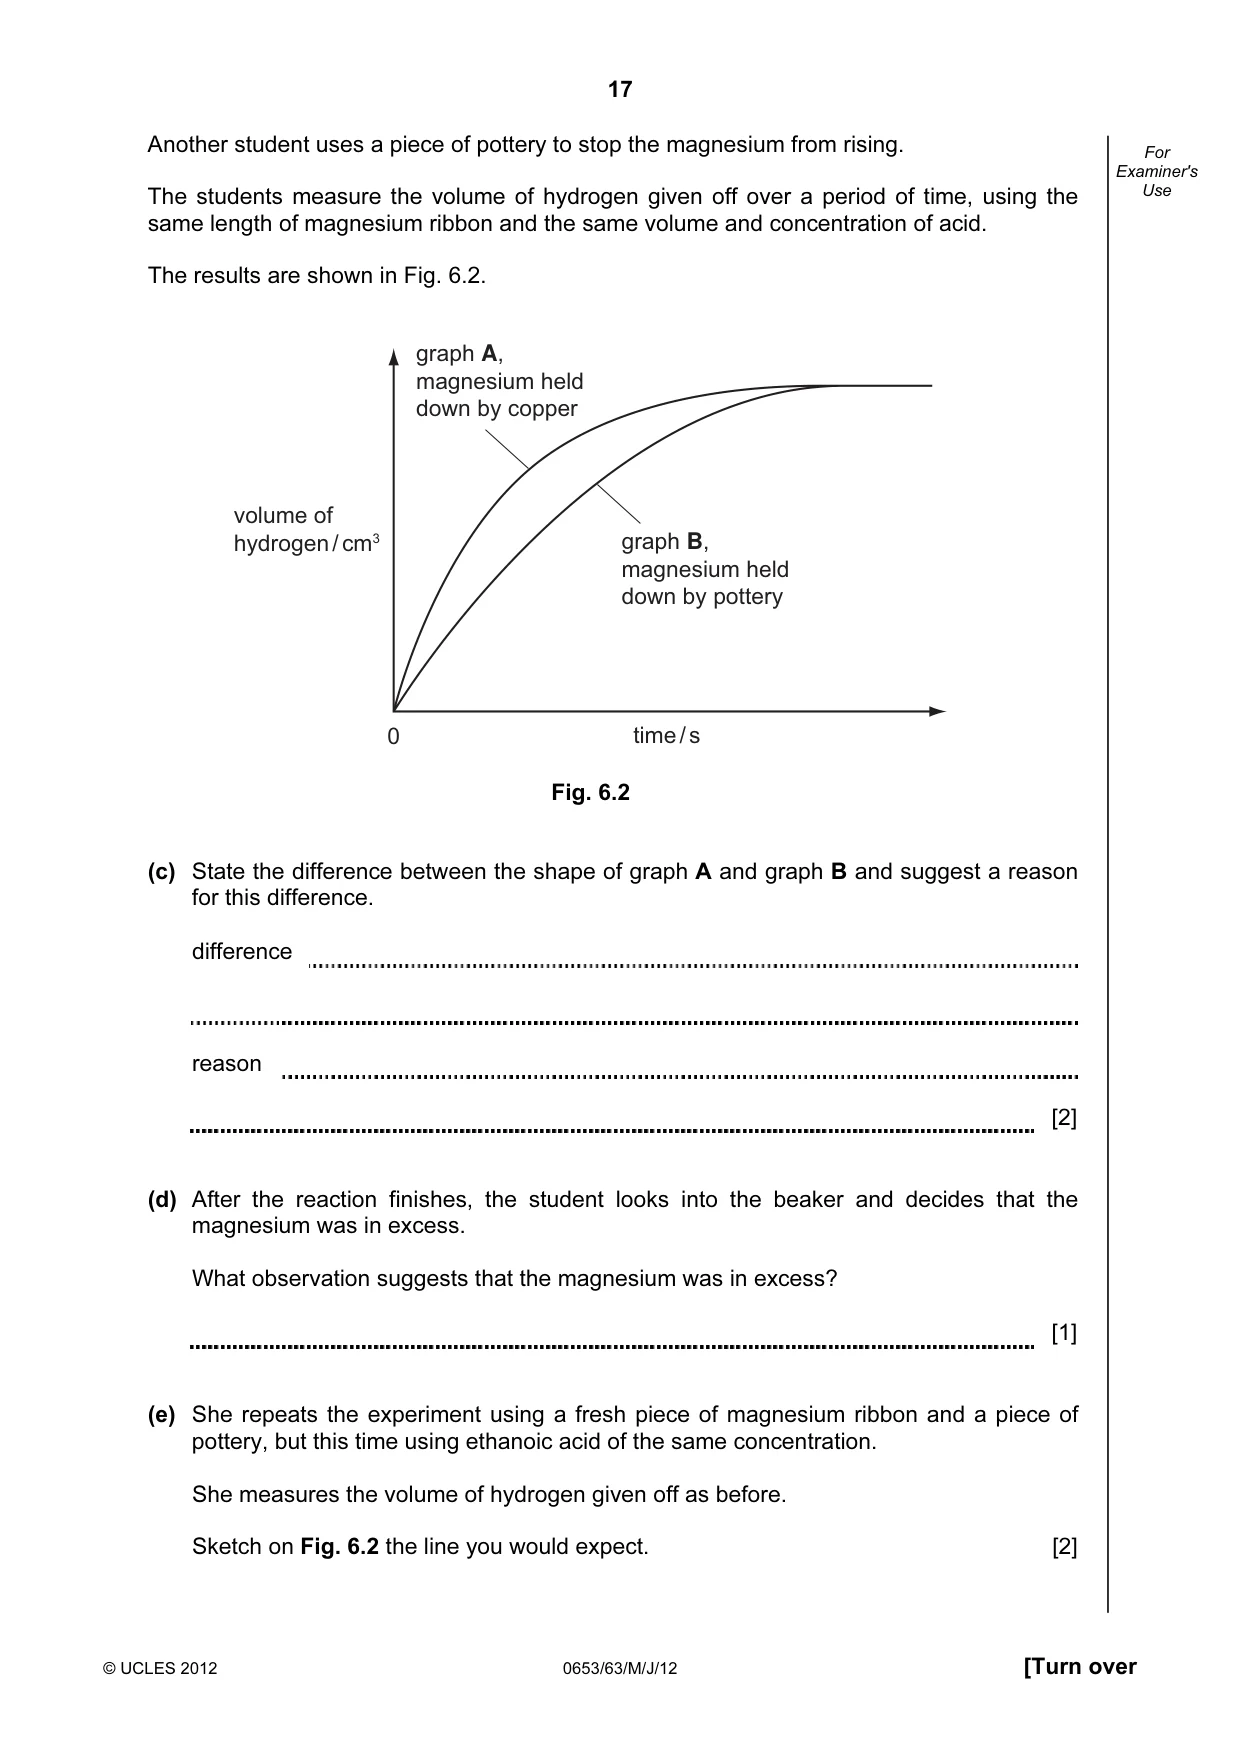
17 © UCLES 2012 0653/63/M/J/12 [Turn over For Examiner's Use Another student uses a piece of pottery to stop the magnesium from rising. The students measure the volume of hydrogen given off over a period of time, using the same length of magnesium ribbon and the same volume and concentration of acid. The results are shown in Fig. 6.2. time / s volume of hydrogen / cm3 graph A, magnesium held down by copper graph B, magnesium held down by pottery 0 Fig. 6.2 (c) State the difference between the shape of graph A and graph B and suggest a reason for this difference. difference reason [2] (d) After the reaction finishes, the student looks into the beaker and decides that the magnesium was in excess. What observation suggests that the magnesium was in excess? [1] (e) She repeats the experiment using a fresh piece of magnesium ribbon and a piece of pottery, but this time using ethanoic acid of the same concentration. She measures the volume of hydrogen given off as before. Sketch on Fig. 6.2 the line you would expect. [2]
Question paper, page 18
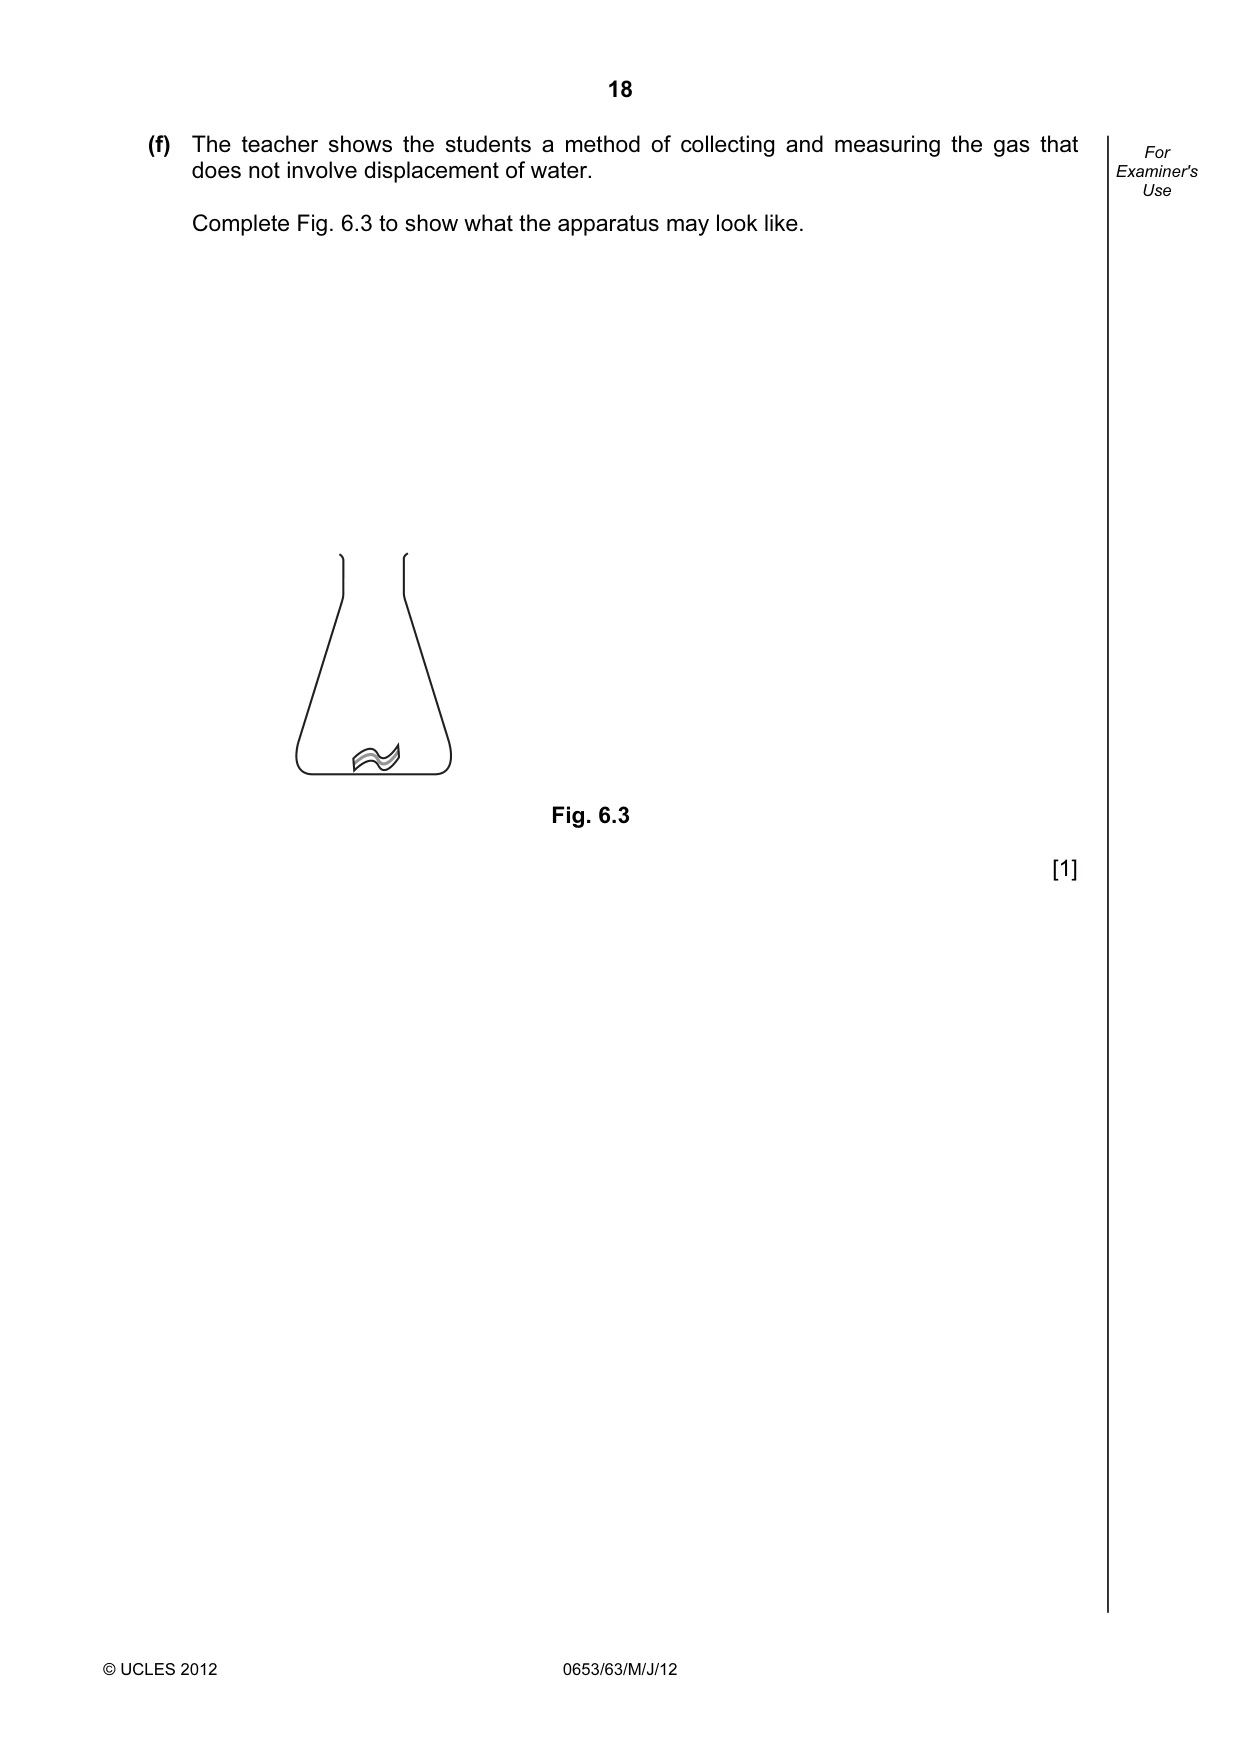
18 © UCLES 2012 0653/63/M/J/12 For Examiner's Use (f) The teacher shows the students a method of collecting and measuring the gas that does not involve displacement of water. Complete Fig. 6.3 to show what the apparatus may look like. Fig. 6.3 [1]
Question paper, page 19
19 © UCLES 2012 0653/63/M/J/12 BLANK PAGE
Question paper, page 20
20 Permission to reproduce items where third-party owned material protected by copyright is included has been sought and cleared where possible. Every reasonable effort has been made by the publisher (UCLES) to trace copyright holders, but if any items requiring clearance have unwittingly been included, the publisher will be pleased to make amends at the earliest possible opportunity. University of Cambridge International Examinations is part of the Cambridge Assessment Group. Cambridge Assessment is the brand name of University of Cambridge Local Examinations Syndicate (UCLES), which is itself a department of the University of Cambridge. © UCLES 2012 0653/63/M/J/12 BLANK PAGE
Mark scheme, page 1
UNIVERSITY OF CAMBRIDGE INTERNATIONAL EXAMINATIONS International General Certificate of Secondary Education MARK SCHEME for the May/June 2012 question paper for the guidance of teachers 0653 COMBINED SCIENCE 0653/63 Paper 6 (Alternative to Practical), maximum raw mark 60 This mark scheme is published as an aid to teachers and candidates, to indicate the requirements of the examination. It shows the basis on which Examiners were instructed to award marks. It does not indicate the details of the discussions that took place at an Examiners’ meeting before marking began, which would have considered the acceptability of alternative answers. Mark schemes must be read in conjunction with the question papers and the report on the examination. • Cambridge will not enter into discussions or correspondence in connection with these mark schemes. Cambridge is publishing the mark schemes for the May/June 2012 question papers for most IGCSE, GCE Advanced Level and Advanced Subsidiary Level syllabuses and some Ordinary Level syllabuses. www.XtremePapers.com
Mark scheme, page 2
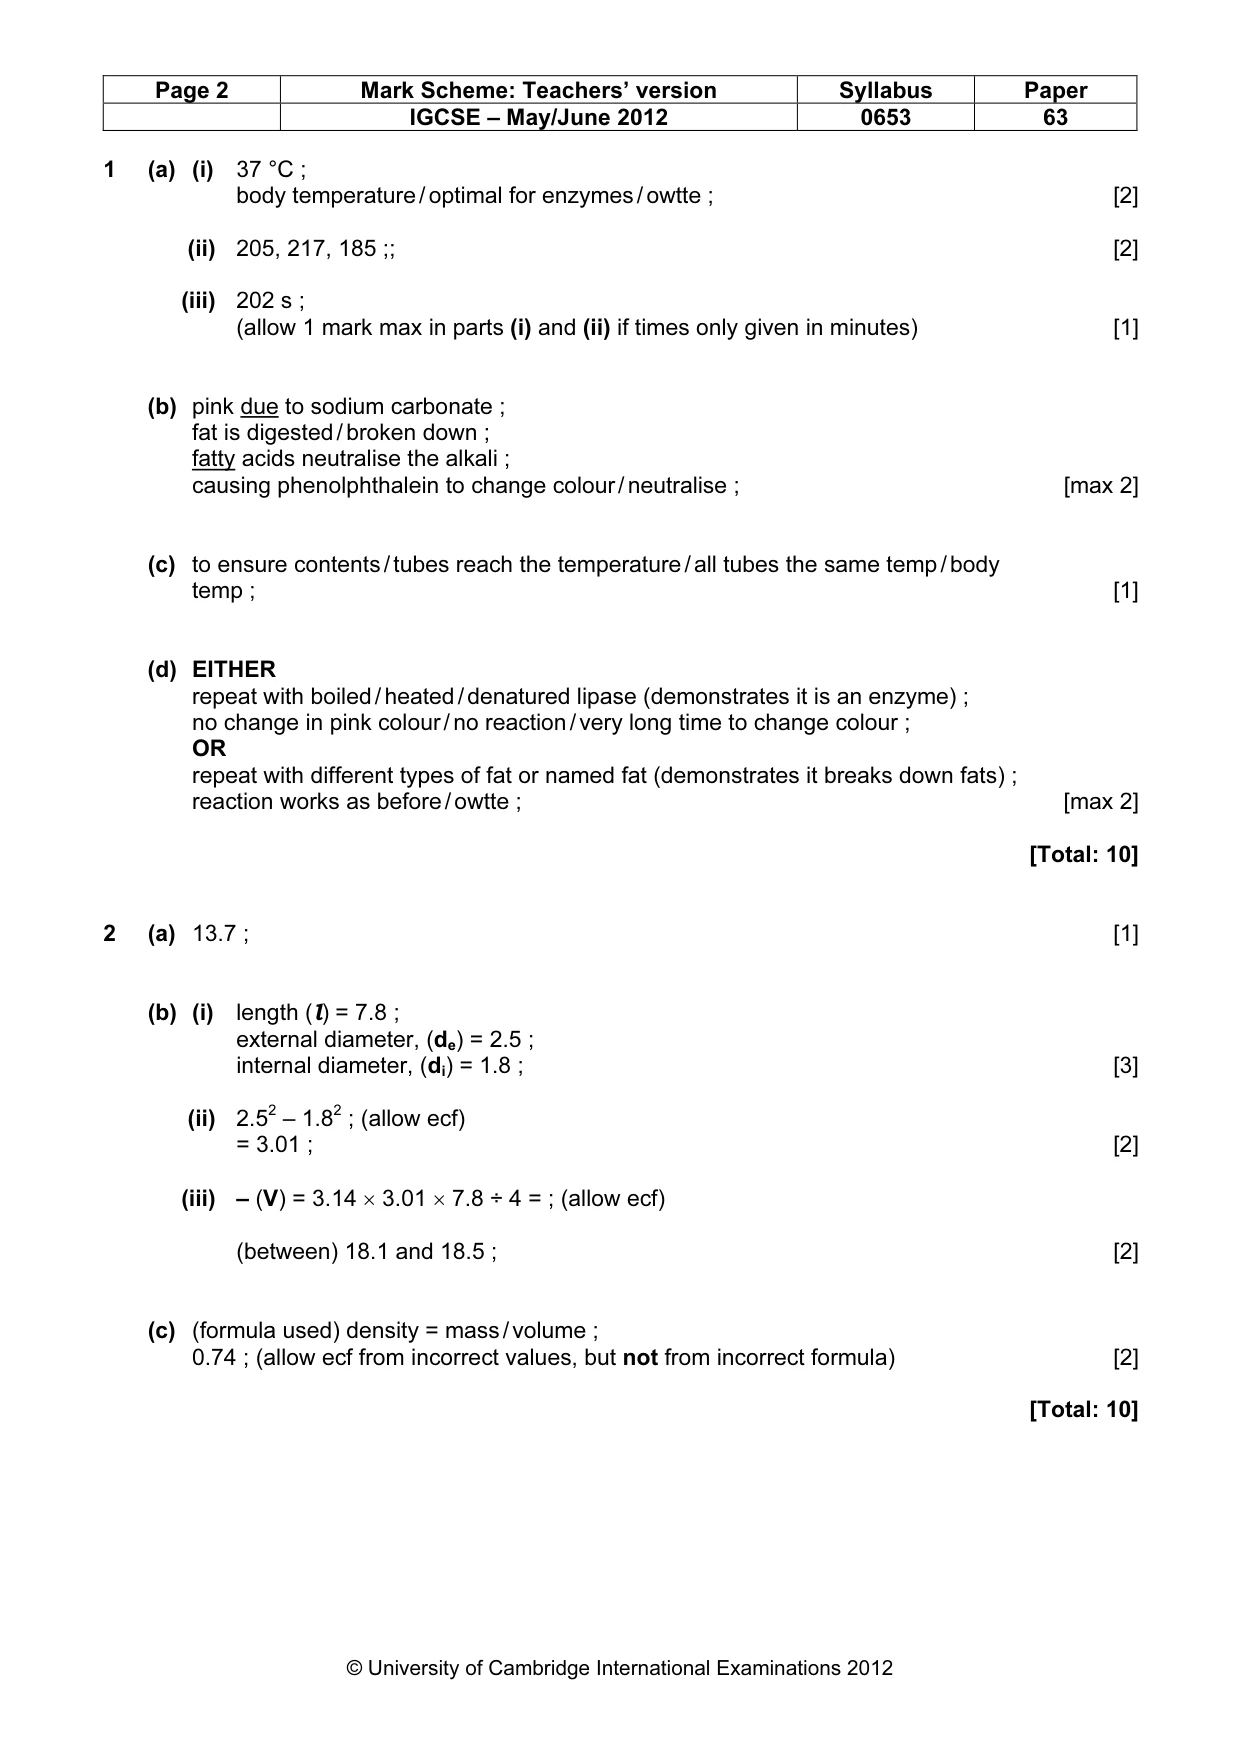
Page 2 Mark Scheme: Teachers’ version Syllabus Paper IGCSE – May/June 2012 0653 63 © University of Cambridge International Examinations 2012 1 (a) (i) 37 °C ; body temperature / optimal for enzymes / owtte ; [2] (ii) 205, 217, 185 ;; [2] (iii) 202 s ; (allow 1 mark max in parts (i) and (ii) if times only given in minutes) [1] (b) pink due to sodium carbonate ; fat is digested / broken down ; fatty acids neutralise the alkali ; causing phenolphthalein to change colour / neutralise ; [max 2] (c) to ensure contents / tubes reach the temperature / all tubes the same temp / body temp ; [1] (d) EITHER repeat with boiled / heated / denatured lipase (demonstrates it is an enzyme) ; no change in pink colour / no reaction / very long time to change colour ; OR repeat with different types of fat or named fat (demonstrates it breaks down fats) ; reaction works as before / owtte ; [max 2] [Total: 10] 2 (a) 13.7 ; [1] (b) (i) length (l) = 7.8 ; external diameter, (de) = 2.5 ; internal diameter, (di) = 1.8 ; [3] (ii) 2.52 – 1.82 ; (allow ecf) = 3.01 ; [2] (iii) – (V) = 3.14 × 3.01 × 7.8 ÷ 4 = ; (allow ecf) (between) 18.1 and 18.5 ; [2] (c) (formula used) density = mass / volume ; 0.74 ; (allow ecf from incorrect values, but not from incorrect formula) [2] [Total: 10]
Mark scheme, page 3
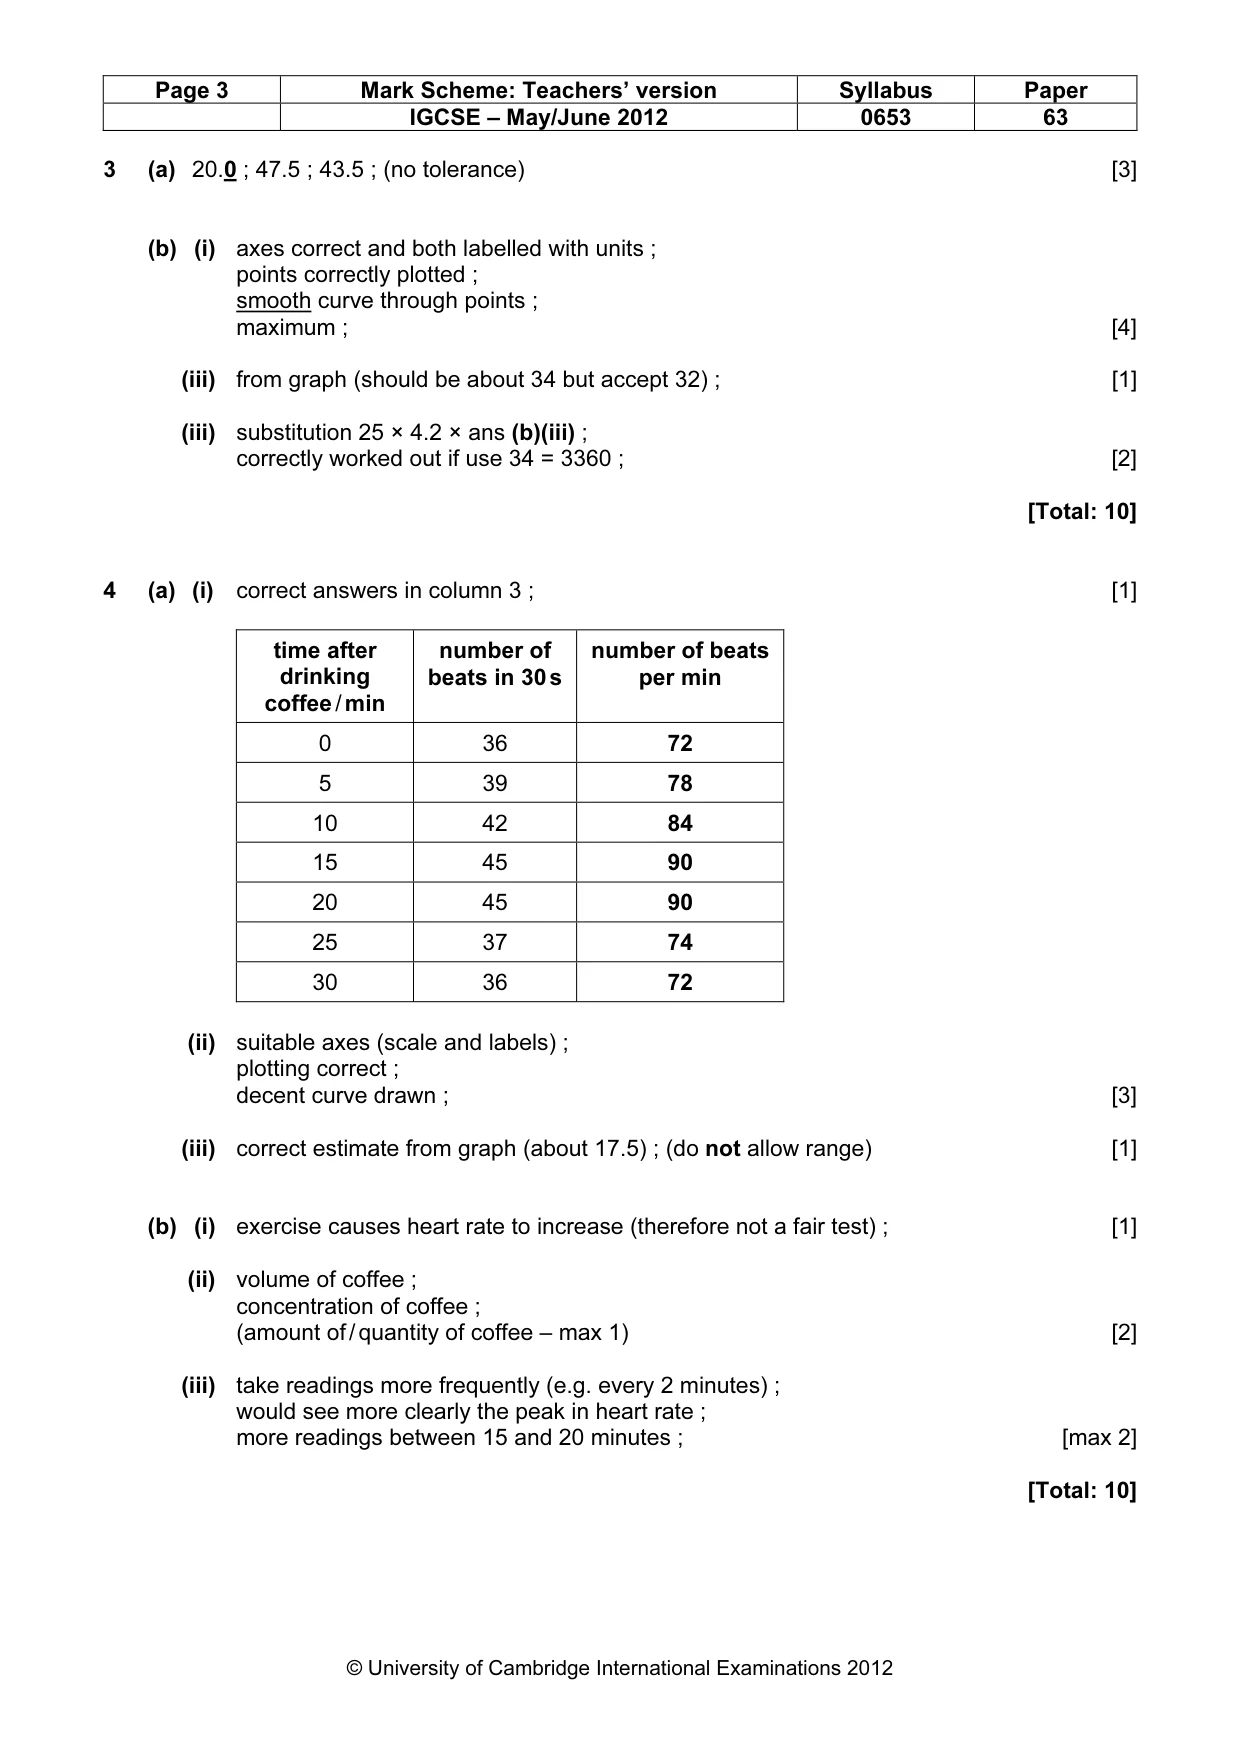
Page 3 Mark Scheme: Teachers’ version Syllabus Paper IGCSE – May/June 2012 0653 63 © University of Cambridge International Examinations 2012 3 (a) 20.0 ; 47.5 ; 43.5 ; (no tolerance) [3] (b) (i) axes correct and both labelled with units ; points correctly plotted ; smooth curve through points ; maximum ; [4] (iii) from graph (should be about 34 but accept 32) ; [1] (iii) substitution 25 × 4.2 × ans (b)(iii) ; correctly worked out if use 34 = 3360 ; [2] [Total: 10] 4 (a) (i) correct answers in column 3 ; [1] time after drinking coffee / min number of beats in 30 s number of beats per min 0 36 72 5 39 78 10 42 84 15 45 90 20 45 90 25 37 74 30 36 72 (ii) suitable axes (scale and labels) ; plotting correct ; decent curve drawn ; [3] (iii) correct estimate from graph (about 17.5) ; (do not allow range) [1] (b) (i) exercise causes heart rate to increase (therefore not a fair test) ; [1] (ii) volume of coffee ; concentration of coffee ; (amount of / quantity of coffee – max 1) [2] (iii) take readings more frequently (e.g. every 2 minutes) ; would see more clearly the peak in heart rate ; more readings between 15 and 20 minutes ; [max 2] [Total: 10]
Mark scheme, page 4
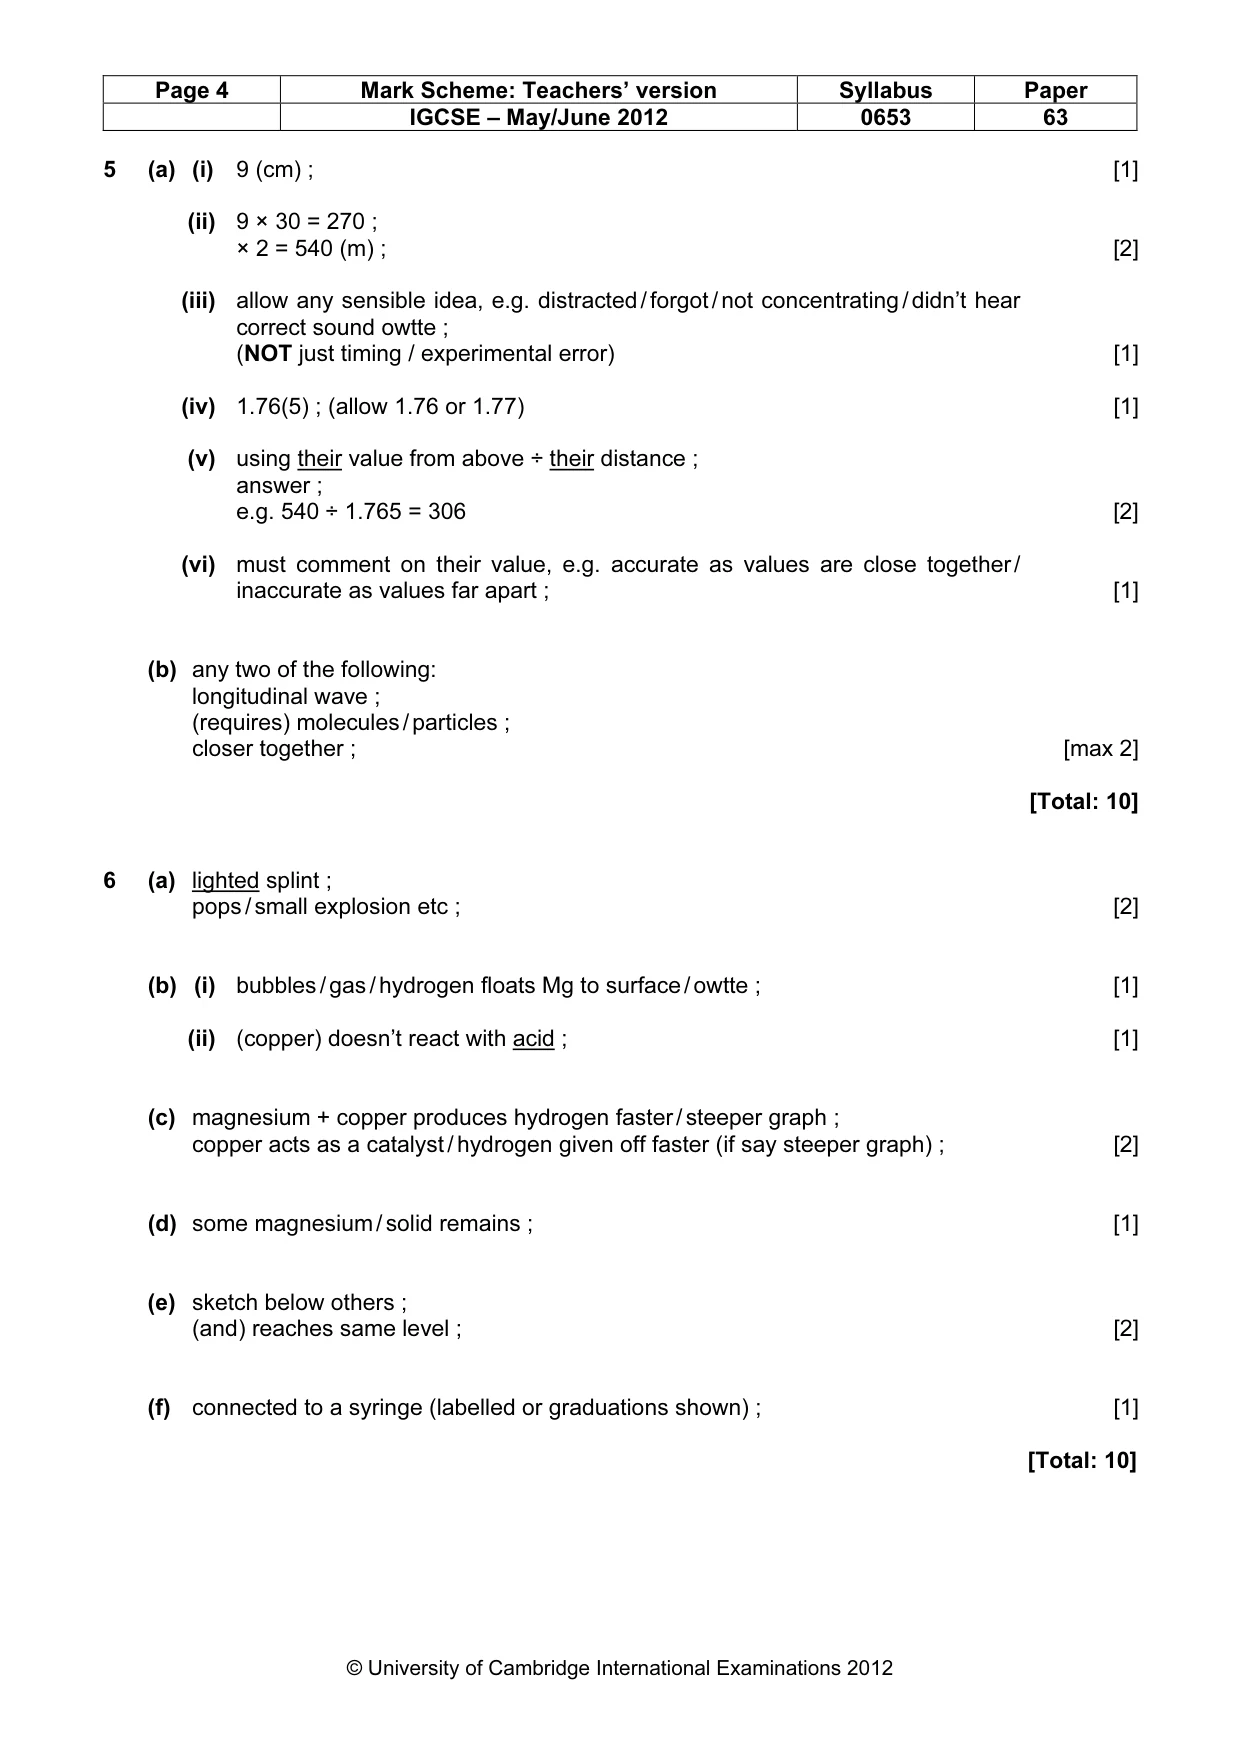
Page 4 Mark Scheme: Teachers’ version Syllabus Paper IGCSE – May/June 2012 0653 63 © University of Cambridge International Examinations 2012 5 (a) (i) 9 (cm) ; [1] (ii) 9 × 30 = 270 ; × 2 = 540 (m) ; [2] (iii) allow any sensible idea, e.g. distracted / forgot / not concentrating / didn’t hear correct sound owtte ; (NOT just timing / experimental error) [1] (iv) 1.76(5) ; (allow 1.76 or 1.77) [1] (v) using their value from above ÷ their distance ; answer ; e.g. 540 ÷ 1.765 = 306 [2] (vi) must comment on their value, e.g. accurate as values are close together / inaccurate as values far apart ; [1] (b) any two of the following: longitudinal wave ; (requires) molecules / particles ; closer together ; [max 2] [Total: 10] 6 (a) lighted splint ; pops / small explosion etc ; [2] (b) (i) bubbles / gas / hydrogen floats Mg to surface / owtte ; [1] (ii) (copper) doesn’t react with acid ; [1] (c) magnesium + copper produces hydrogen faster / steeper graph ; copper acts as a catalyst / hydrogen given off faster (if say steeper graph) ; [2] (d) some magnesium / solid remains ; [1] (e) sketch below others ; (and) reaches same level ; [2] (f) connected to a syringe (labelled or graduations shown) ; [1] [Total: 10]
What you needed in this session
Cambridge’s own grade thresholds for 2012 May/June, Paper 6 · Variant 3. A higher threshold means an easier paper — the bar moves with how the cohort did.