Cambridge IGCSE Science - Combined 0653 — 2011 Oct/Nov Paper 6 · Variant 3
0653/63/O/N/11 · 60 marks · ≈68 min
The question paper and its mark scheme, free to read here and free to download. This is Cambridge’s own paper, exactly as it was sat.
Question paper20 pages
Mark scheme4 pages
Answers below. Sit the paper first if you are practising.
Paper as text
Question paper, page 1
This document consists of 18 printed pages and 2 blank pages. IB11 11_0653_63/6RP © UCLES 2011 [Turn over *4118530406* For Examiner's Use 1 2 3 4 5 6 Total UNIVERSITY OF CAMBRIDGE INTERNATIONAL EXAMINATIONS International General Certificate of Secondary Education COMBINED SCIENCE 0653/63 Paper 6 Alternative to Practical October/November 2011 1 hour Candidates answer on the Question paper No Additional Materials are required. READ THESE INSTRUCTIONS FIRST Write your Centre number, candidate number and name on all the work you hand in. Write in dark blue or black pen. You may use a soft pencil for any diagrams, graphs, tables or rough working. Do not use staples, paper clips, highlighters, glue or correction fluid. DO NOT WRITE IN ANY BARCODES. Answer all questions. At the end of the examination, fasten all your work securely together. The number of marks is given in brackets [ ] at the end of each question or part question. www.XtremePapers.com
Question paper, page 2
2 © UCLES 2011 0653/63/O/N/11 BLANK PAGE
Question paper, page 3
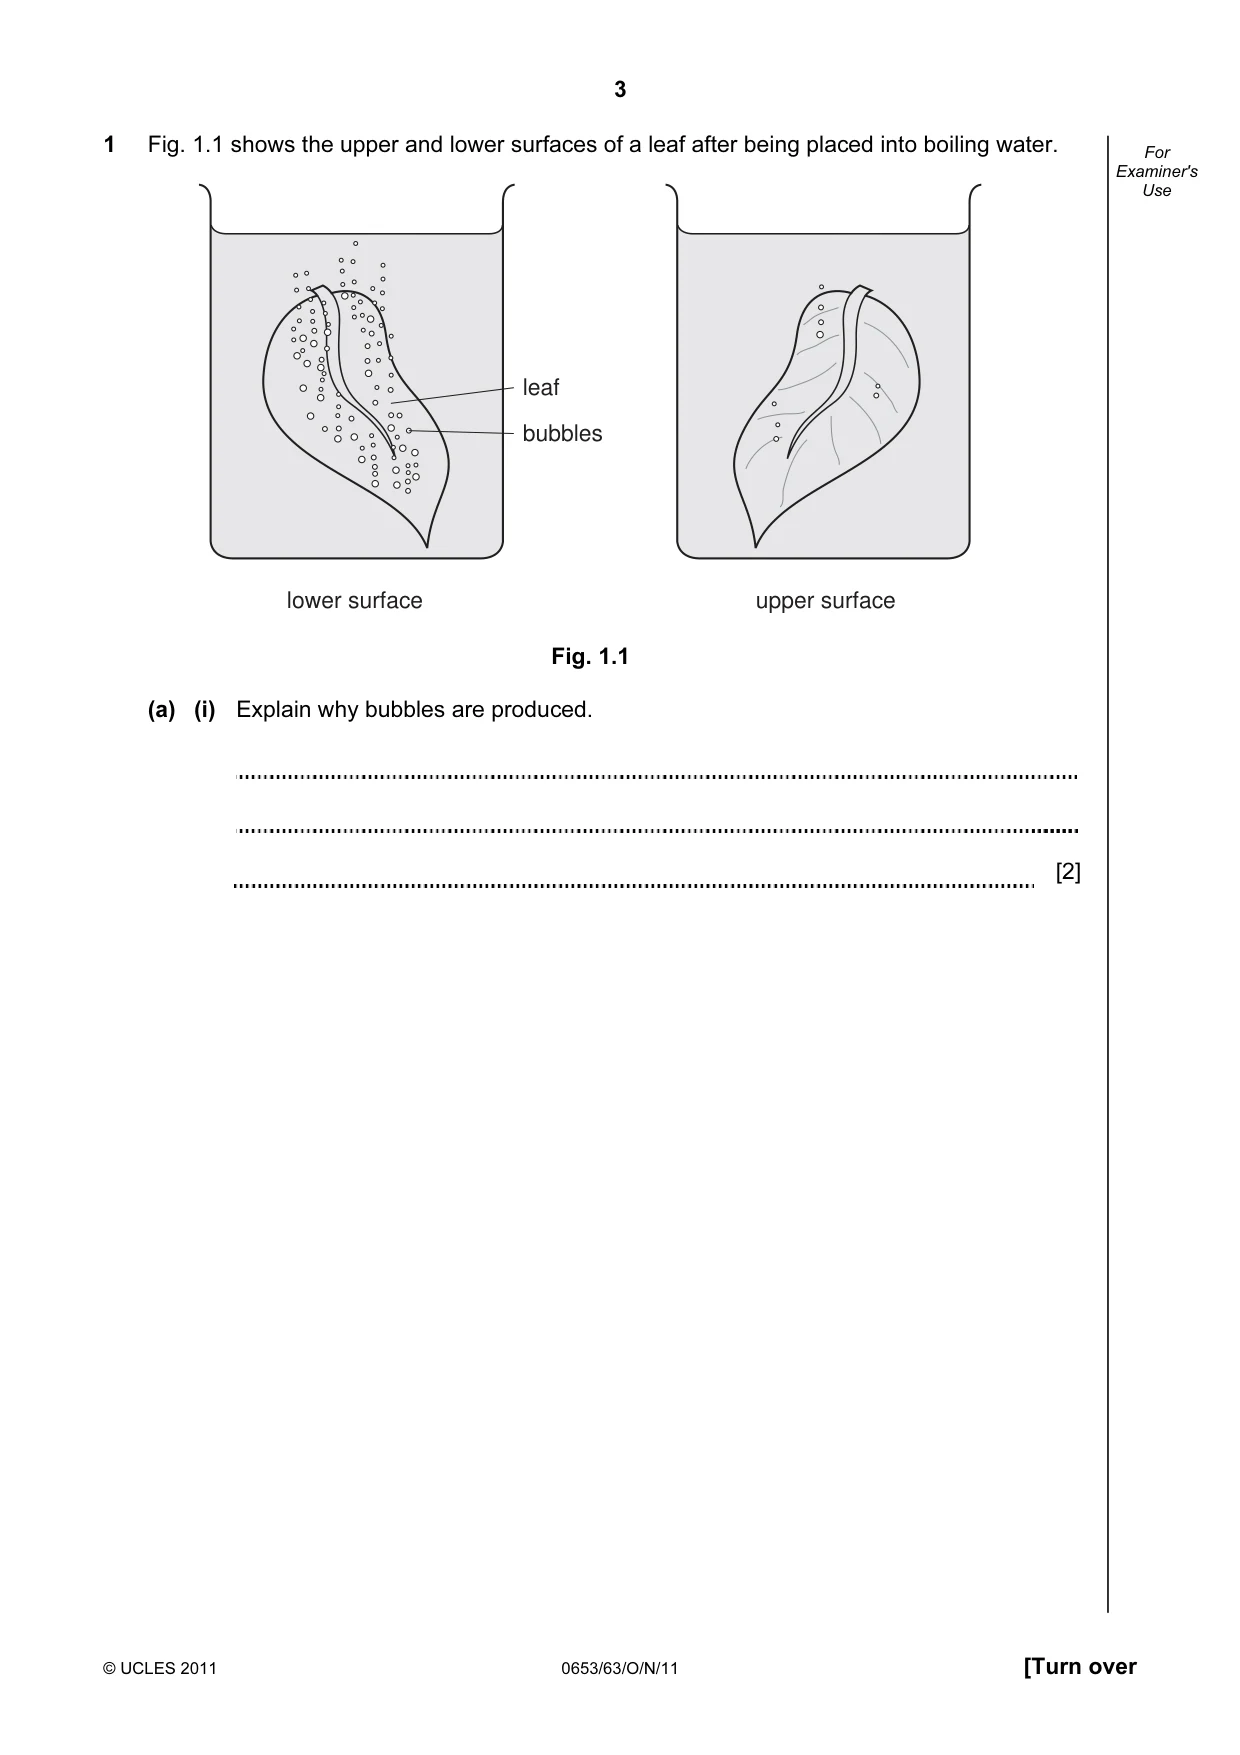
3 © UCLES 2011 0653/63/O/N/11 [Turn over For Examiner's Use 1 Fig. 1.1 shows the upper and lower surfaces of a leaf after being placed into boiling water. lower surface upper surface leaf bubbles Fig. 1.1 (a) (i) Explain why bubbles are produced. [2]
Question paper, page 4
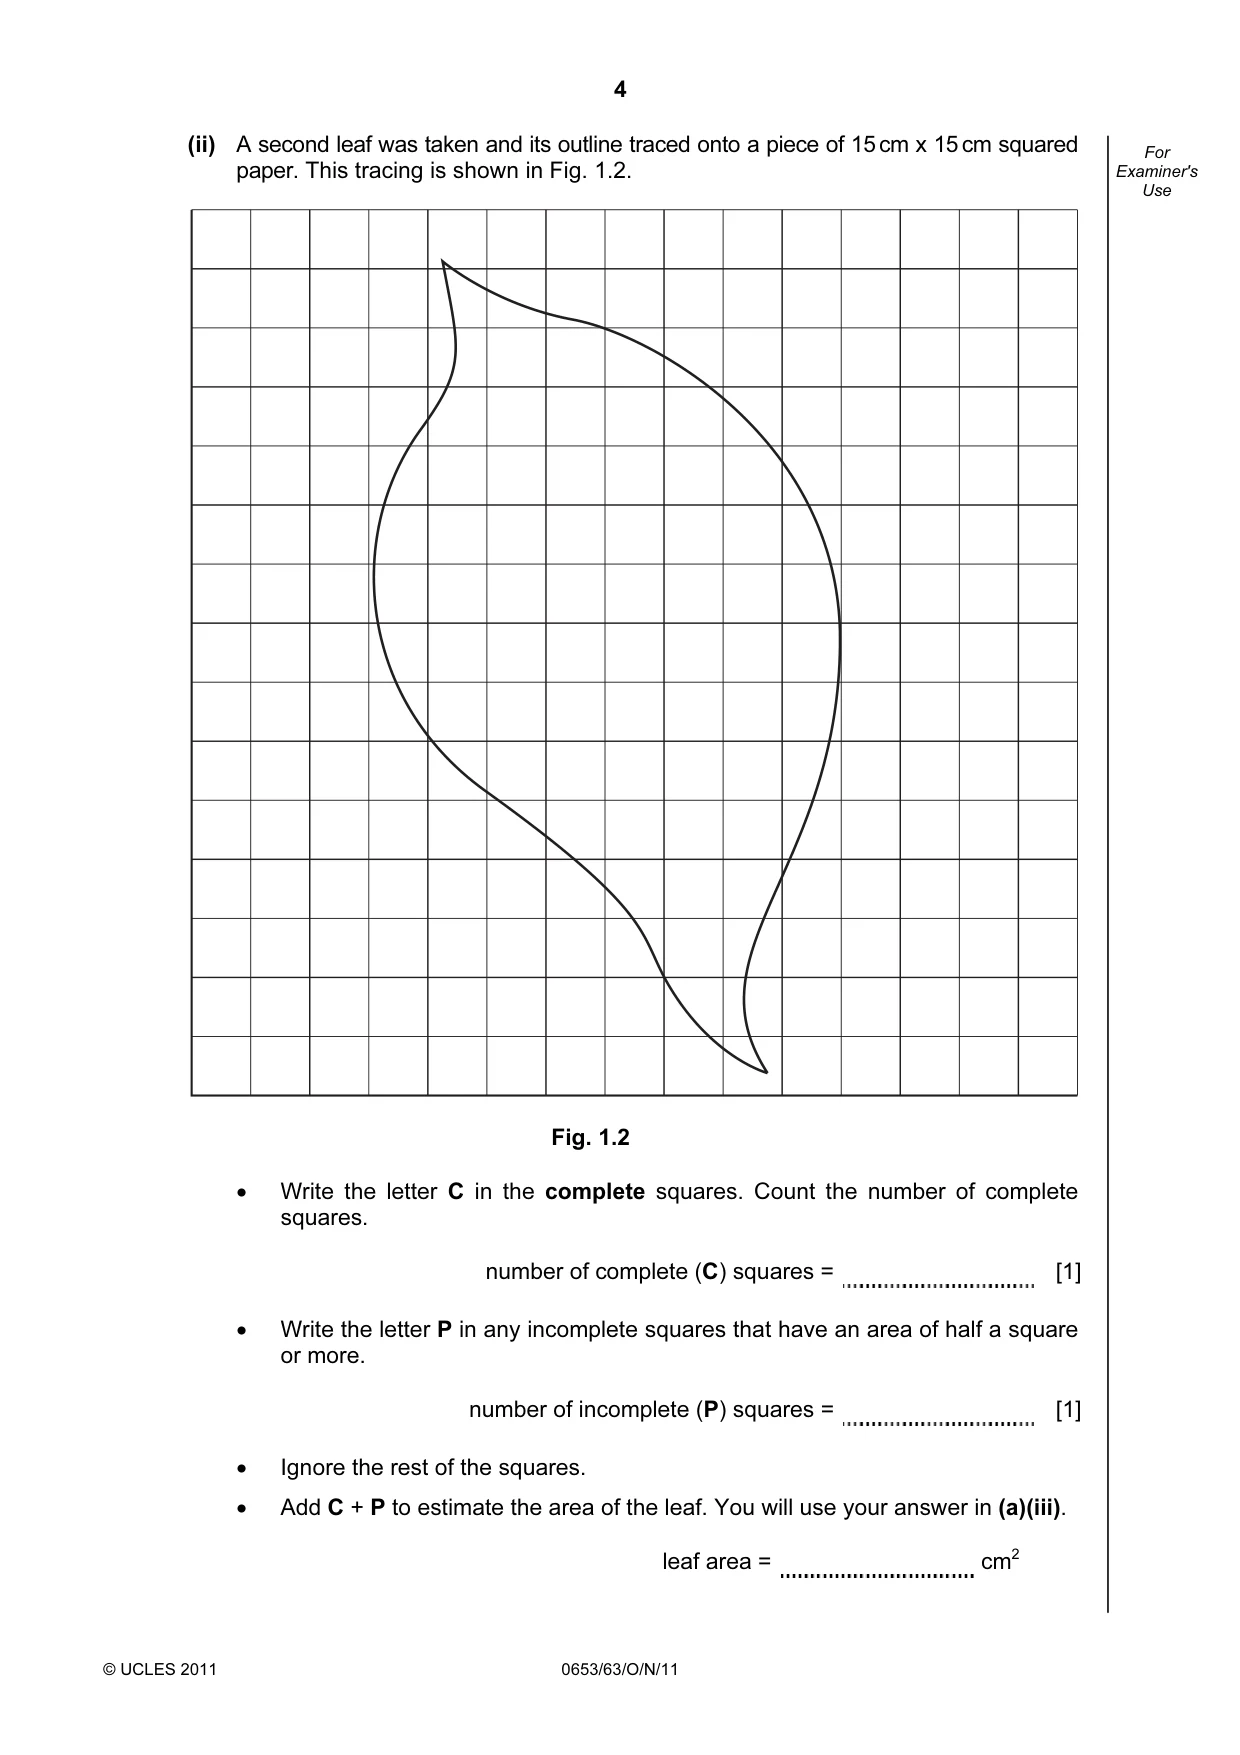
4 © UCLES 2011 0653/63/O/N/11 For Examiner's Use (ii) A second leaf was taken and its outline traced onto a piece of 15 cm x 15 cm squared paper. This tracing is shown in Fig. 1.2. Fig. 1.2 • Write the letter C in the complete squares. Count the number of complete squares. number of complete (C) squares = [1] • Write the letter P in any incomplete squares that have an area of half a square or more. number of incomplete (P) squares = [1] • Ignore the rest of the squares. • Add C + P to estimate the area of the leaf. You will use your answer in (a)(iii). leaf area = cm2
Question paper, page 5
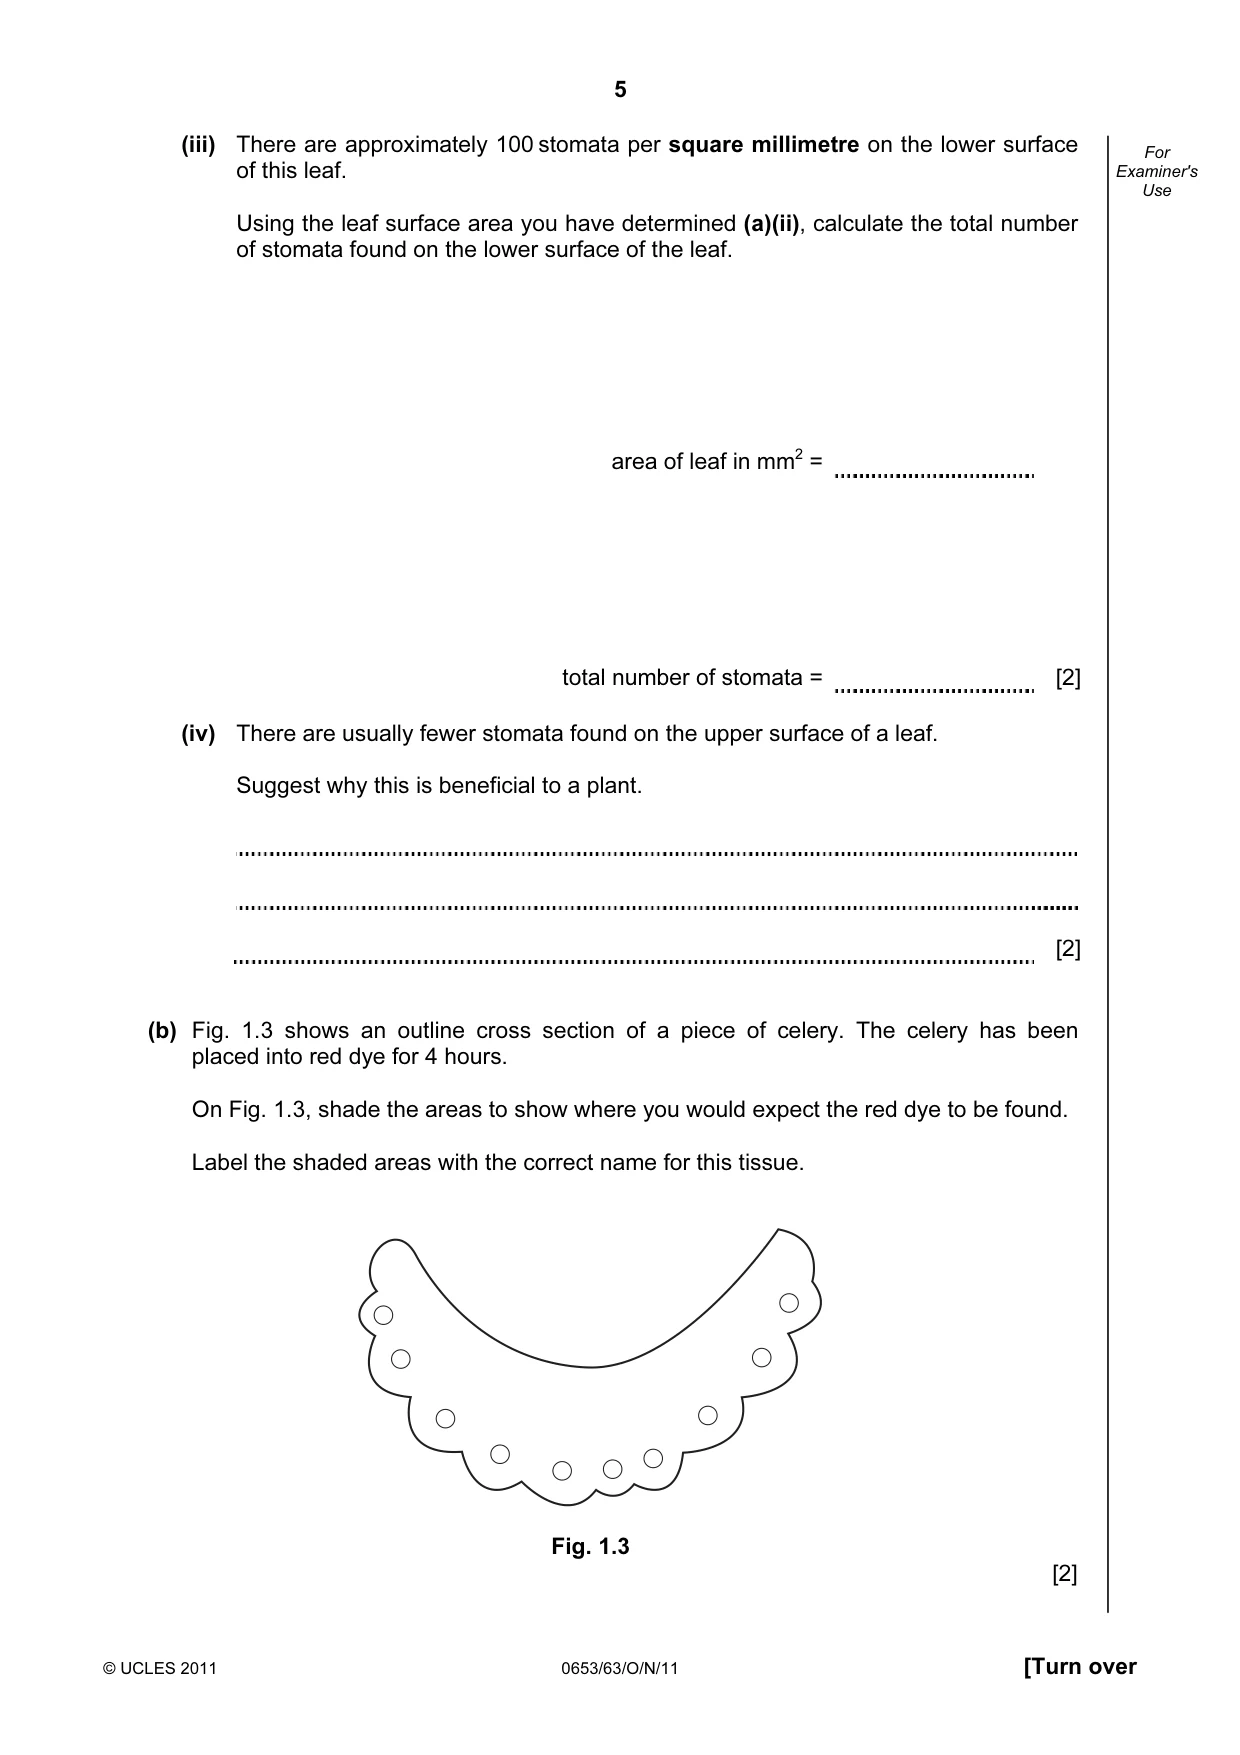
5 © UCLES 2011 0653/63/O/N/11 [Turn over For Examiner's Use (iii) There are approximately 100 stomata per square millimetre on the lower surface of this leaf. Using the leaf surface area you have determined (a)(ii), calculate the total number of stomata found on the lower surface of the leaf. area of leaf in mm2 = total number of stomata = [2] (iv) There are usually fewer stomata found on the upper surface of a leaf. Suggest why this is beneficial to a plant. [2] (b) Fig. 1.3 shows an outline cross section of a piece of celery. The celery has been placed into red dye for 4 hours. On Fig. 1.3, shade the areas to show where you would expect the red dye to be found. Label the shaded areas with the correct name for this tissue. Fig. 1.3 [2]
Question paper, page 6
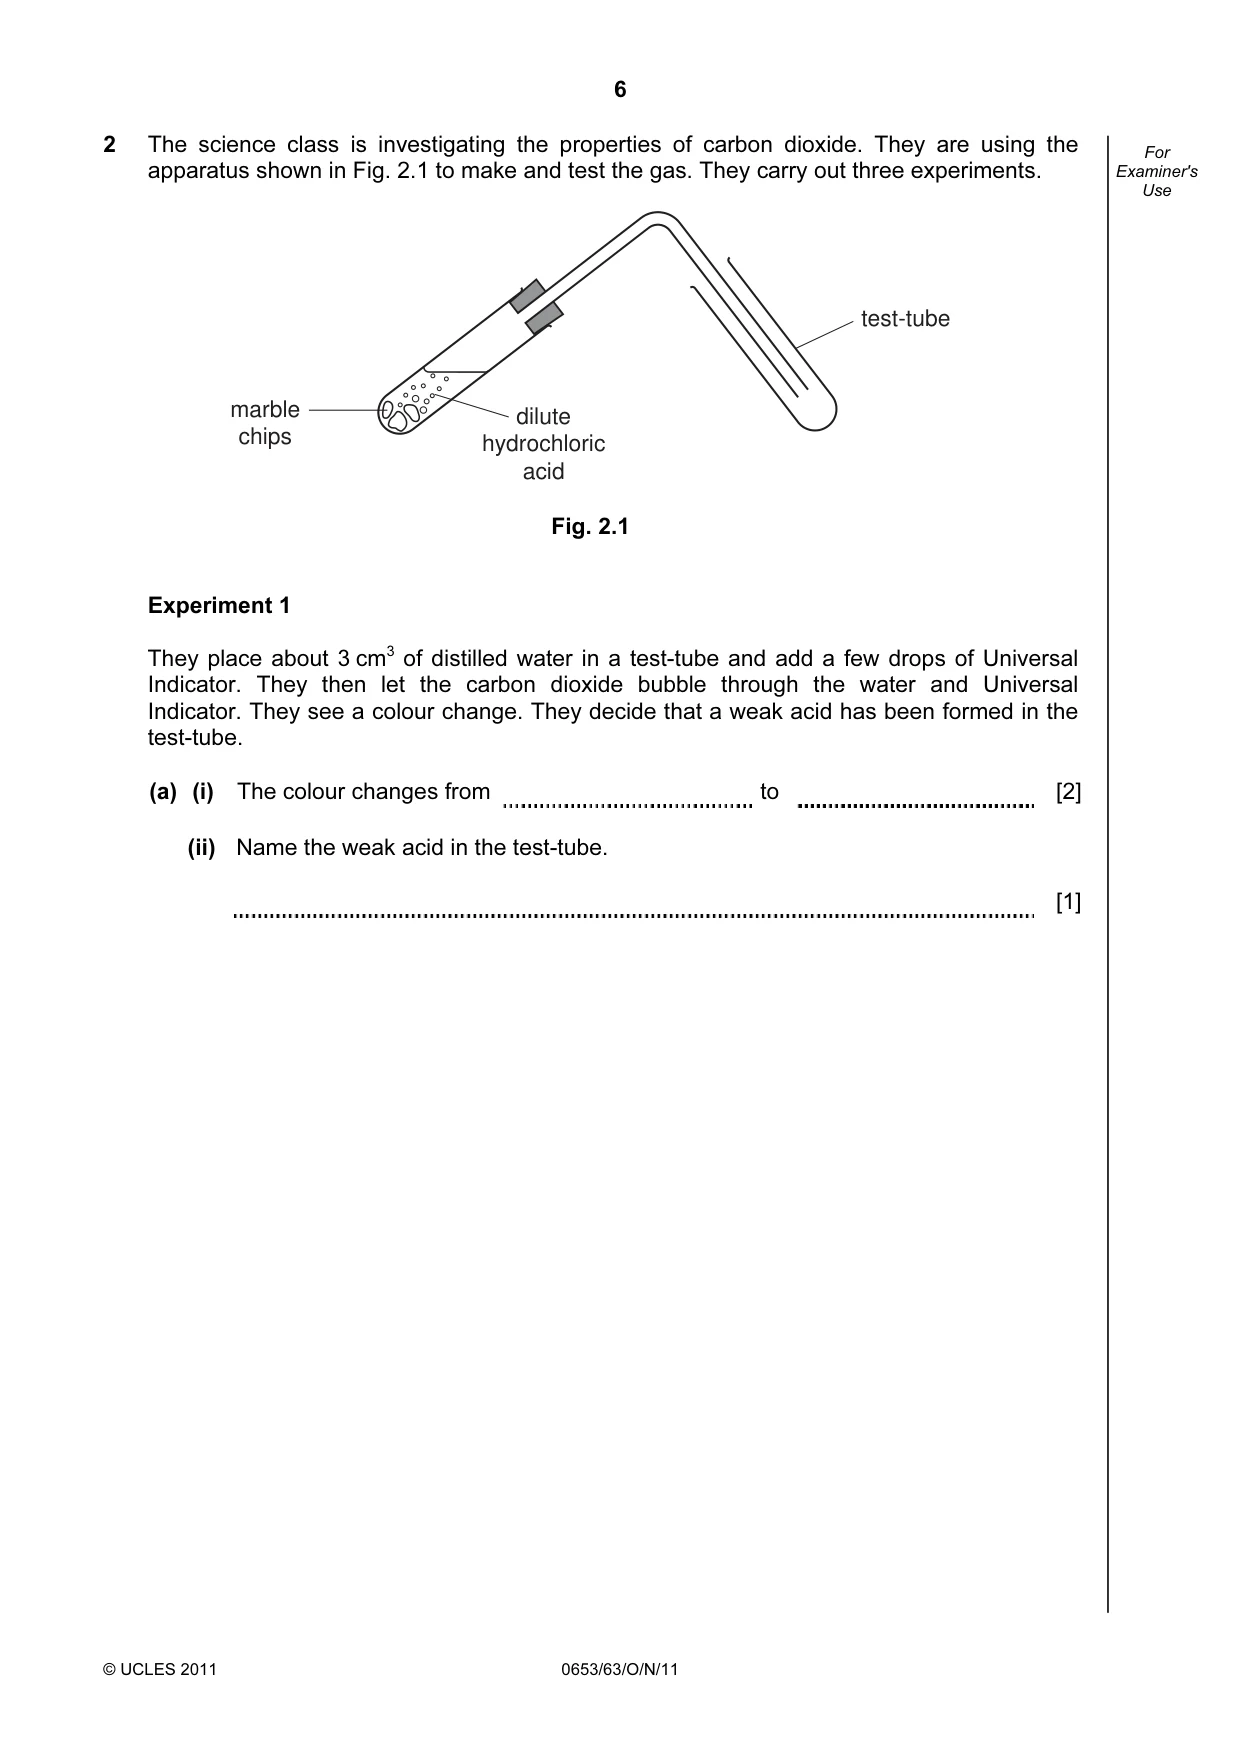
6 © UCLES 2011 0653/63/O/N/11 For Examiner's Use 2 The science class is investigating the properties of carbon dioxide. They are using the apparatus shown in Fig. 2.1 to make and test the gas. They carry out three experiments. dilute hydrochloric acid marble chips test-tube Fig. 2.1 Experiment 1 They place about 3 cm3 of distilled water in a test-tube and add a few drops of Universal Indicator. They then let the carbon dioxide bubble through the water and Universal Indicator. They see a colour change. They decide that a weak acid has been formed in the test-tube. (a) (i) The colour changes from to [2] (ii) Name the weak acid in the test-tube. [1]
Question paper, page 7
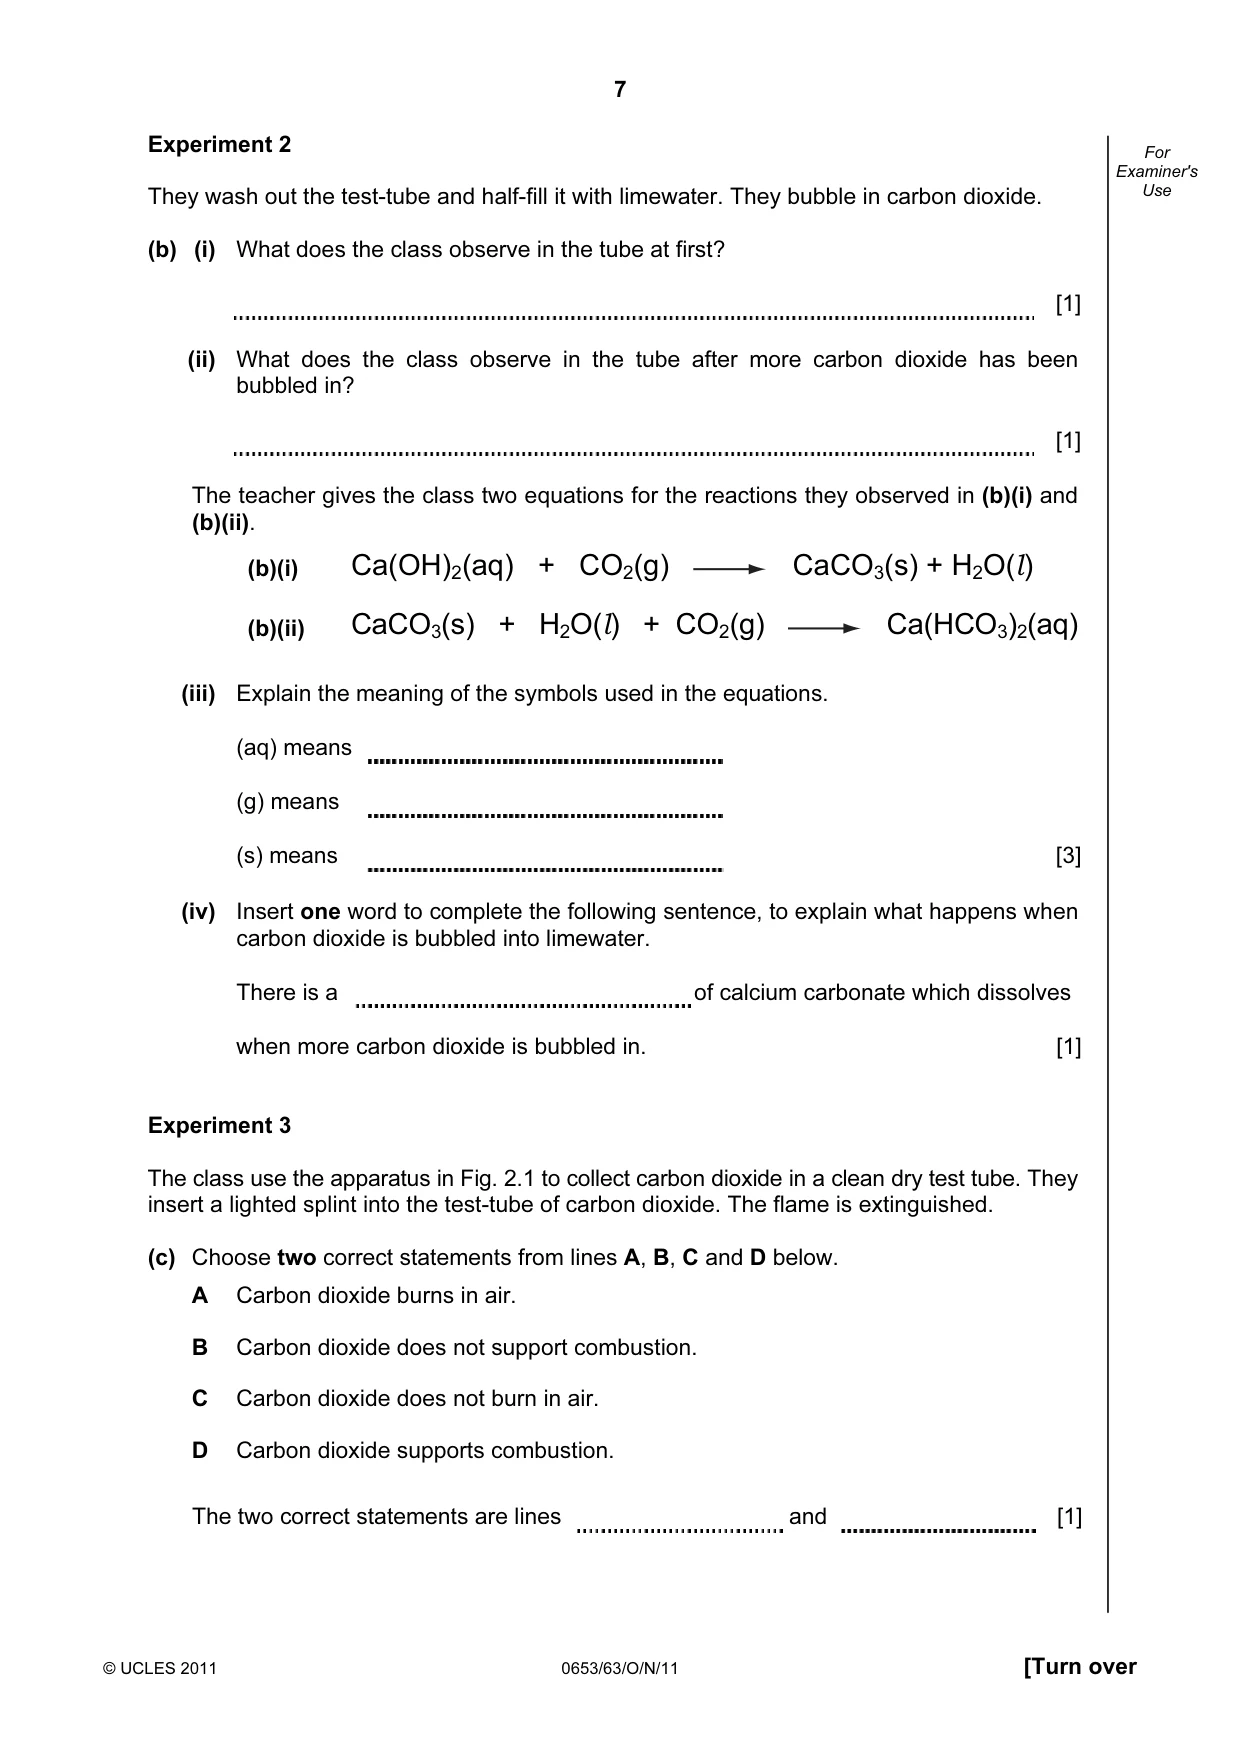
7 © UCLES 2011 0653/63/O/N/11 [Turn over For Examiner's Use Experiment 2 They wash out the test-tube and half-fill it with limewater. They bubble in carbon dioxide. (b) (i) What does the class observe in the tube at first? [1] (ii) What does the class observe in the tube after more carbon dioxide has been bubbled in? [1] The teacher gives the class two equations for the reactions they observed in (b)(i) and (b)(ii). (b)(i) Ca(OH)2(aq) + CO2(g) CaCO3(s) + H2O(l) (b)(ii) CaCO3(s) + H2O(l) + CO2(g) Ca(HCO3)2(aq) (iii) Explain the meaning of the symbols used in the equations. (aq) means (g) means (s) means [3] (iv) Insert one word to complete the following sentence, to explain what happens when carbon dioxide is bubbled into limewater. There is a of calcium carbonate which dissolves when more carbon dioxide is bubbled in. [1] Experiment 3 The class use the apparatus in Fig. 2.1 to collect carbon dioxide in a clean dry test tube. They insert a lighted splint into the test-tube of carbon dioxide. The flame is extinguished. (c) Choose two correct statements from lines A, B, C and D below. A Carbon dioxide burns in air. B Carbon dioxide does not support combustion. C Carbon dioxide does not burn in air. D Carbon dioxide supports combustion. The two correct statements are lines and [1]
Question paper, page 8
8 © UCLES 2011 0653/63/O/N/11 BLANK PAGE
Question paper, page 9
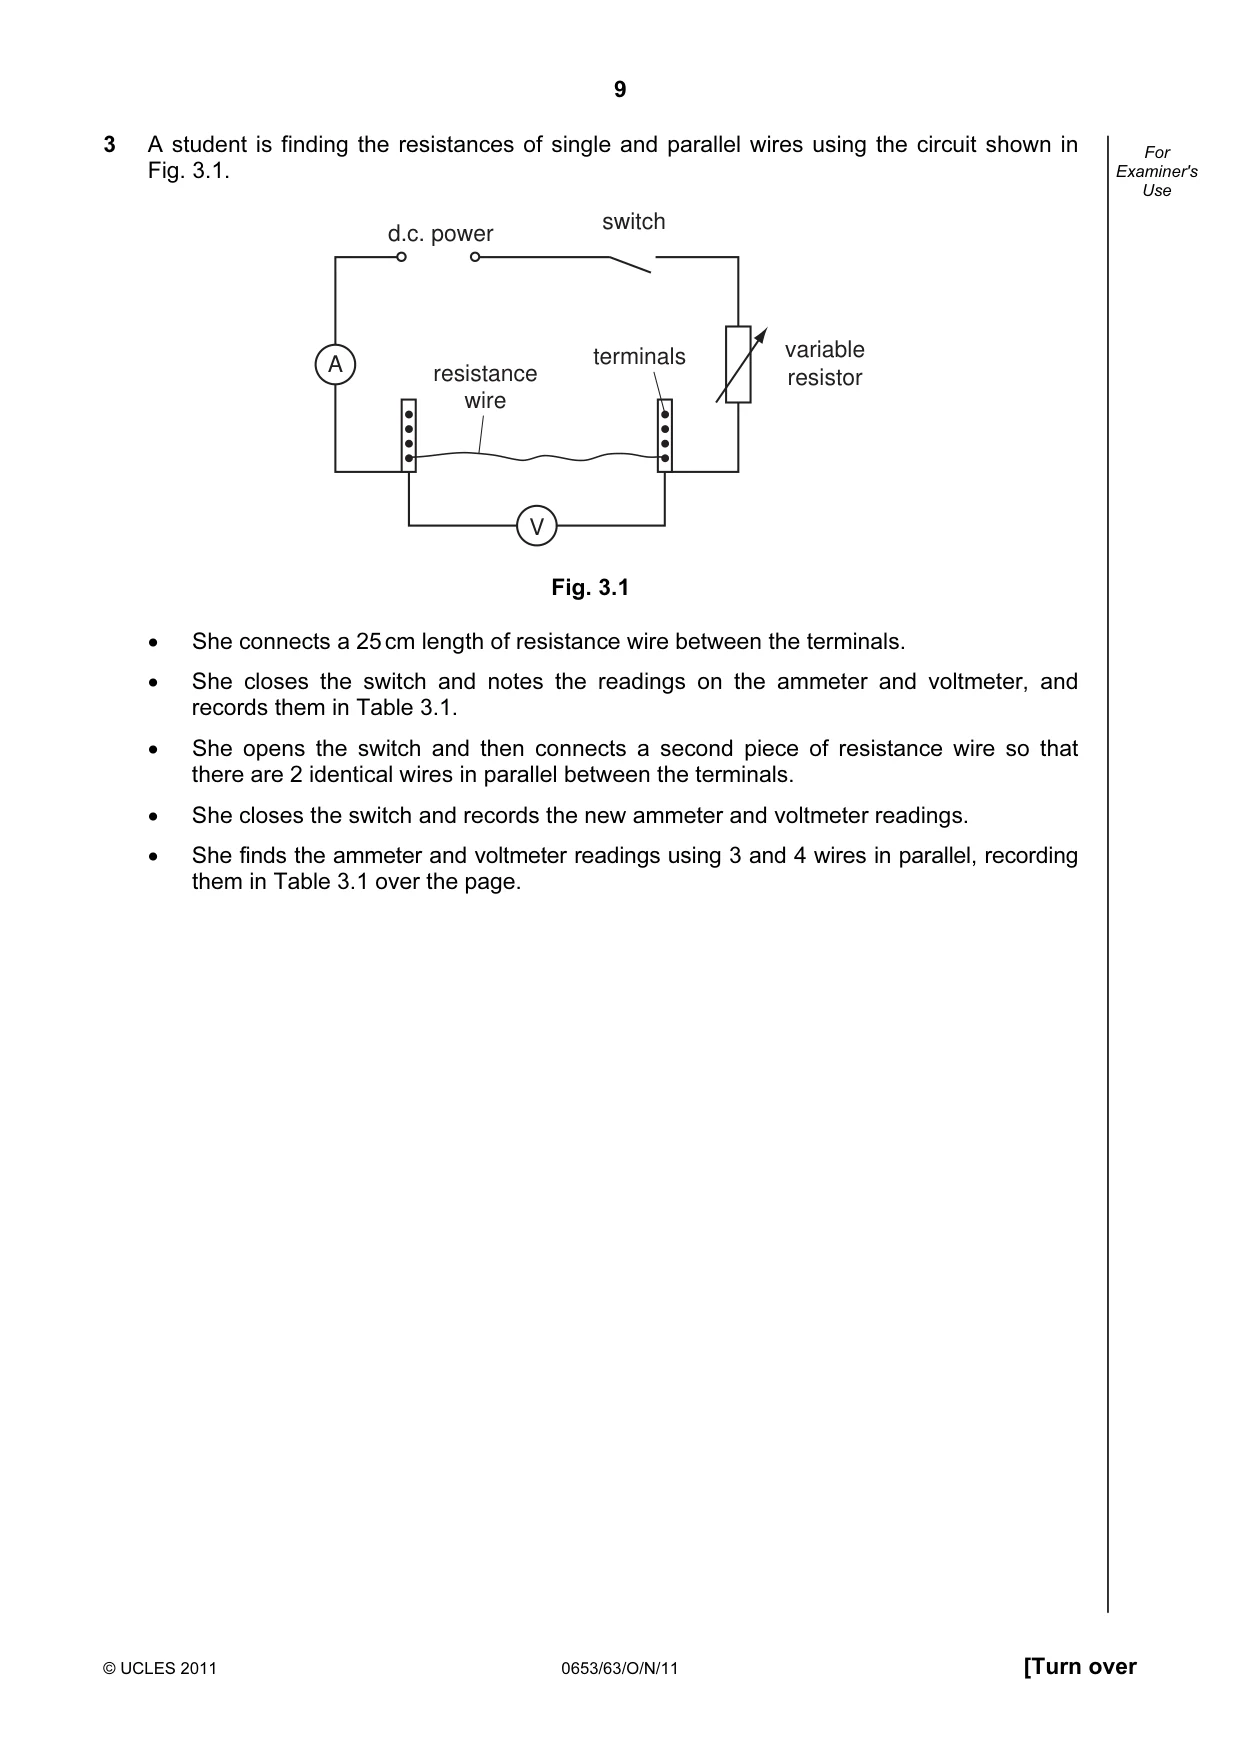
9 © UCLES 2011 0653/63/O/N/11 [Turn over For Examiner's Use 3 A student is finding the resistances of single and parallel wires using the circuit shown in Fig. 3.1. V A d.c. power switch variable resistor resistance wire terminals Fig. 3.1 • She connects a 25 cm length of resistance wire between the terminals. • She closes the switch and notes the readings on the ammeter and voltmeter, and records them in Table 3.1. • She opens the switch and then connects a second piece of resistance wire so that there are 2 identical wires in parallel between the terminals. • She closes the switch and records the new ammeter and voltmeter readings. • She finds the ammeter and voltmeter readings using 3 and 4 wires in parallel, recording them in Table 3.1 over the page.
Question paper, page 10
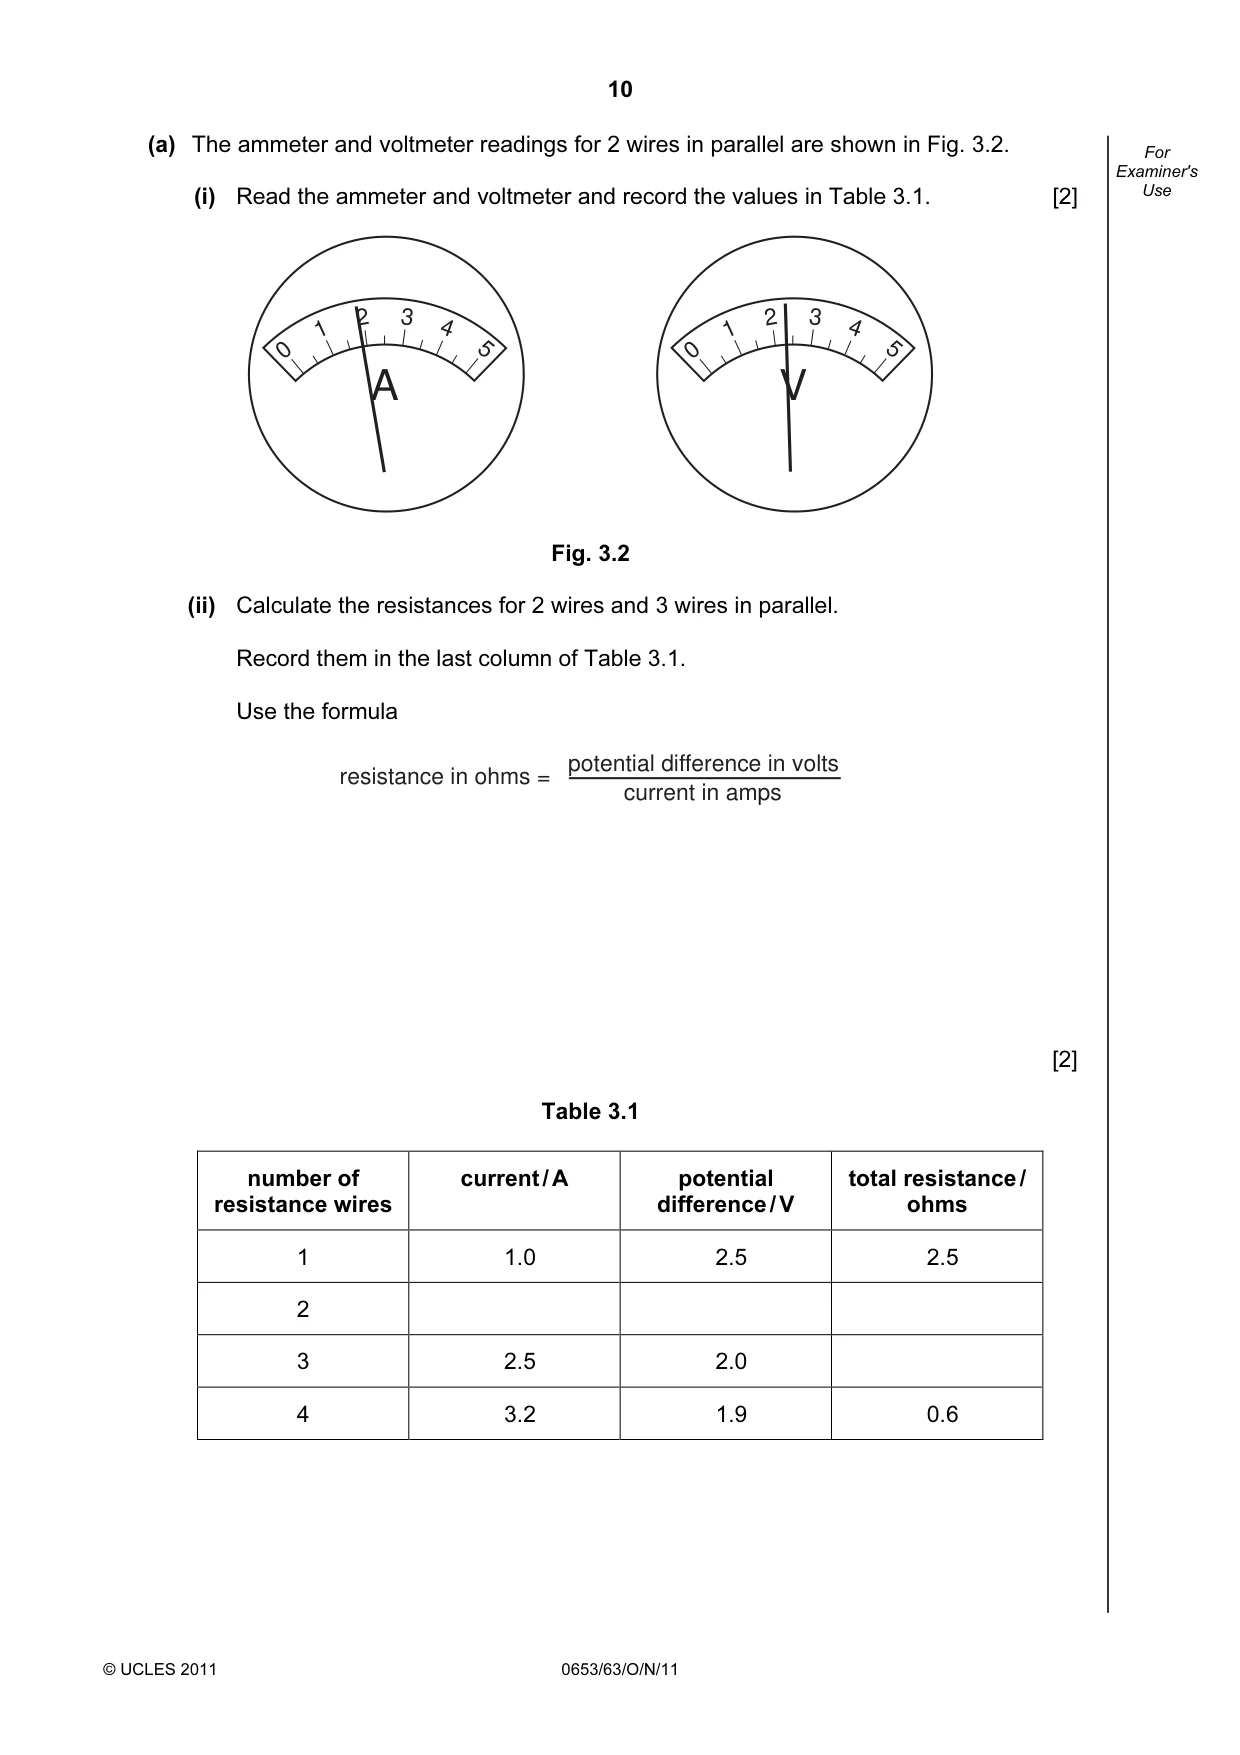
10 © UCLES 2011 0653/63/O/N/11 For Examiner's Use (a) The ammeter and voltmeter readings for 2 wires in parallel are shown in Fig. 3.2. (i) Read the ammeter and voltmeter and record the values in Table 3.1. [2] 5 0 A 1 2 3 4 5 0 V 1 2 3 4 Fig. 3.2 (ii) Calculate the resistances for 2 wires and 3 wires in parallel. Record them in the last column of Table 3.1. Use the formula current in amps potential difference in volts resistance in ohms = [2] Table 3.1 number of resistance wires current / A potential difference / V total resistance / ohms 1 1.0 2.5 2.5 2 3 2.5 2.0 4 3.2 1.9 0.6
Question paper, page 11
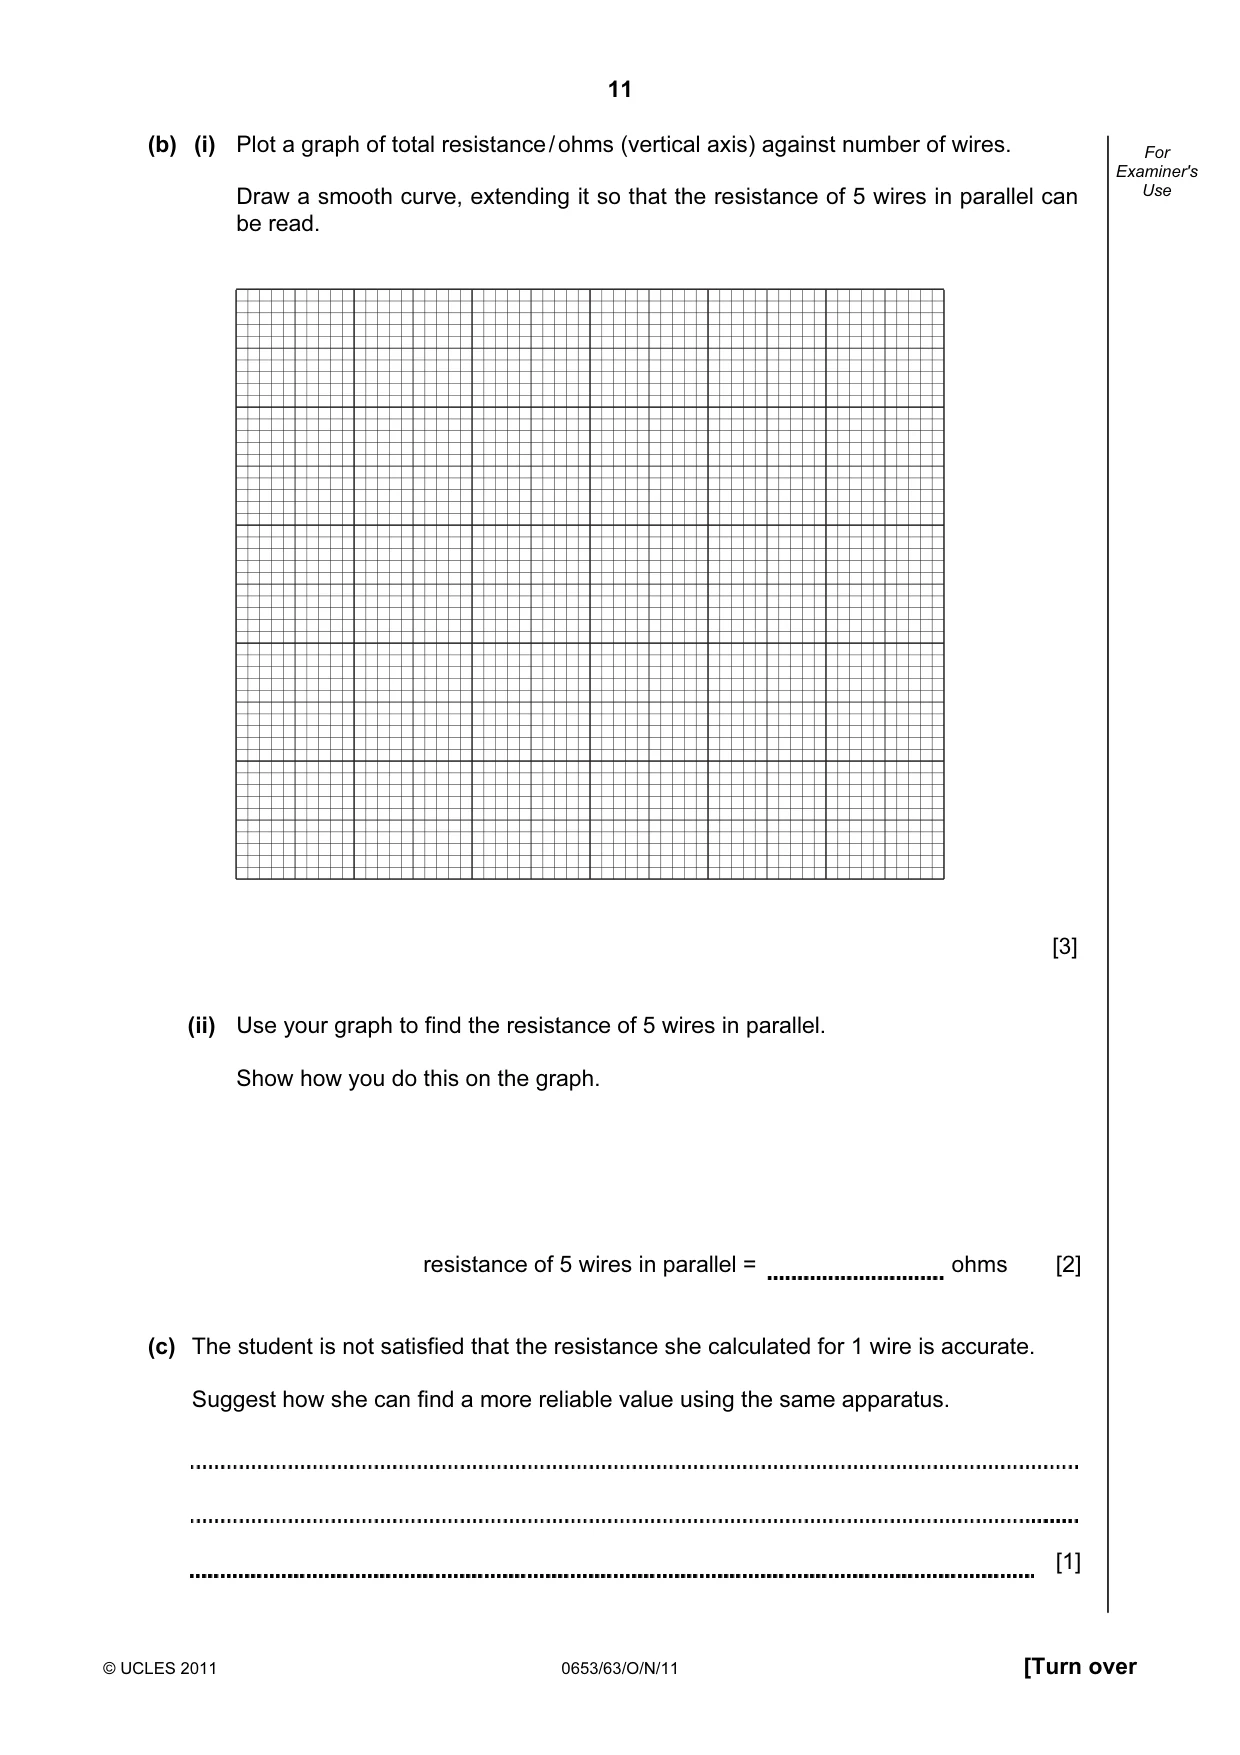
11 © UCLES 2011 0653/63/O/N/11 [Turn over For Examiner's Use (b) (i) Plot a graph of total resistance / ohms (vertical axis) against number of wires. Draw a smooth curve, extending it so that the resistance of 5 wires in parallel can be read. [3] (ii) Use your graph to find the resistance of 5 wires in parallel. Show how you do this on the graph. resistance of 5 wires in parallel = ohms [2] (c) The student is not satisfied that the resistance she calculated for 1 wire is accurate. Suggest how she can find a more reliable value using the same apparatus. [1]
Question paper, page 12
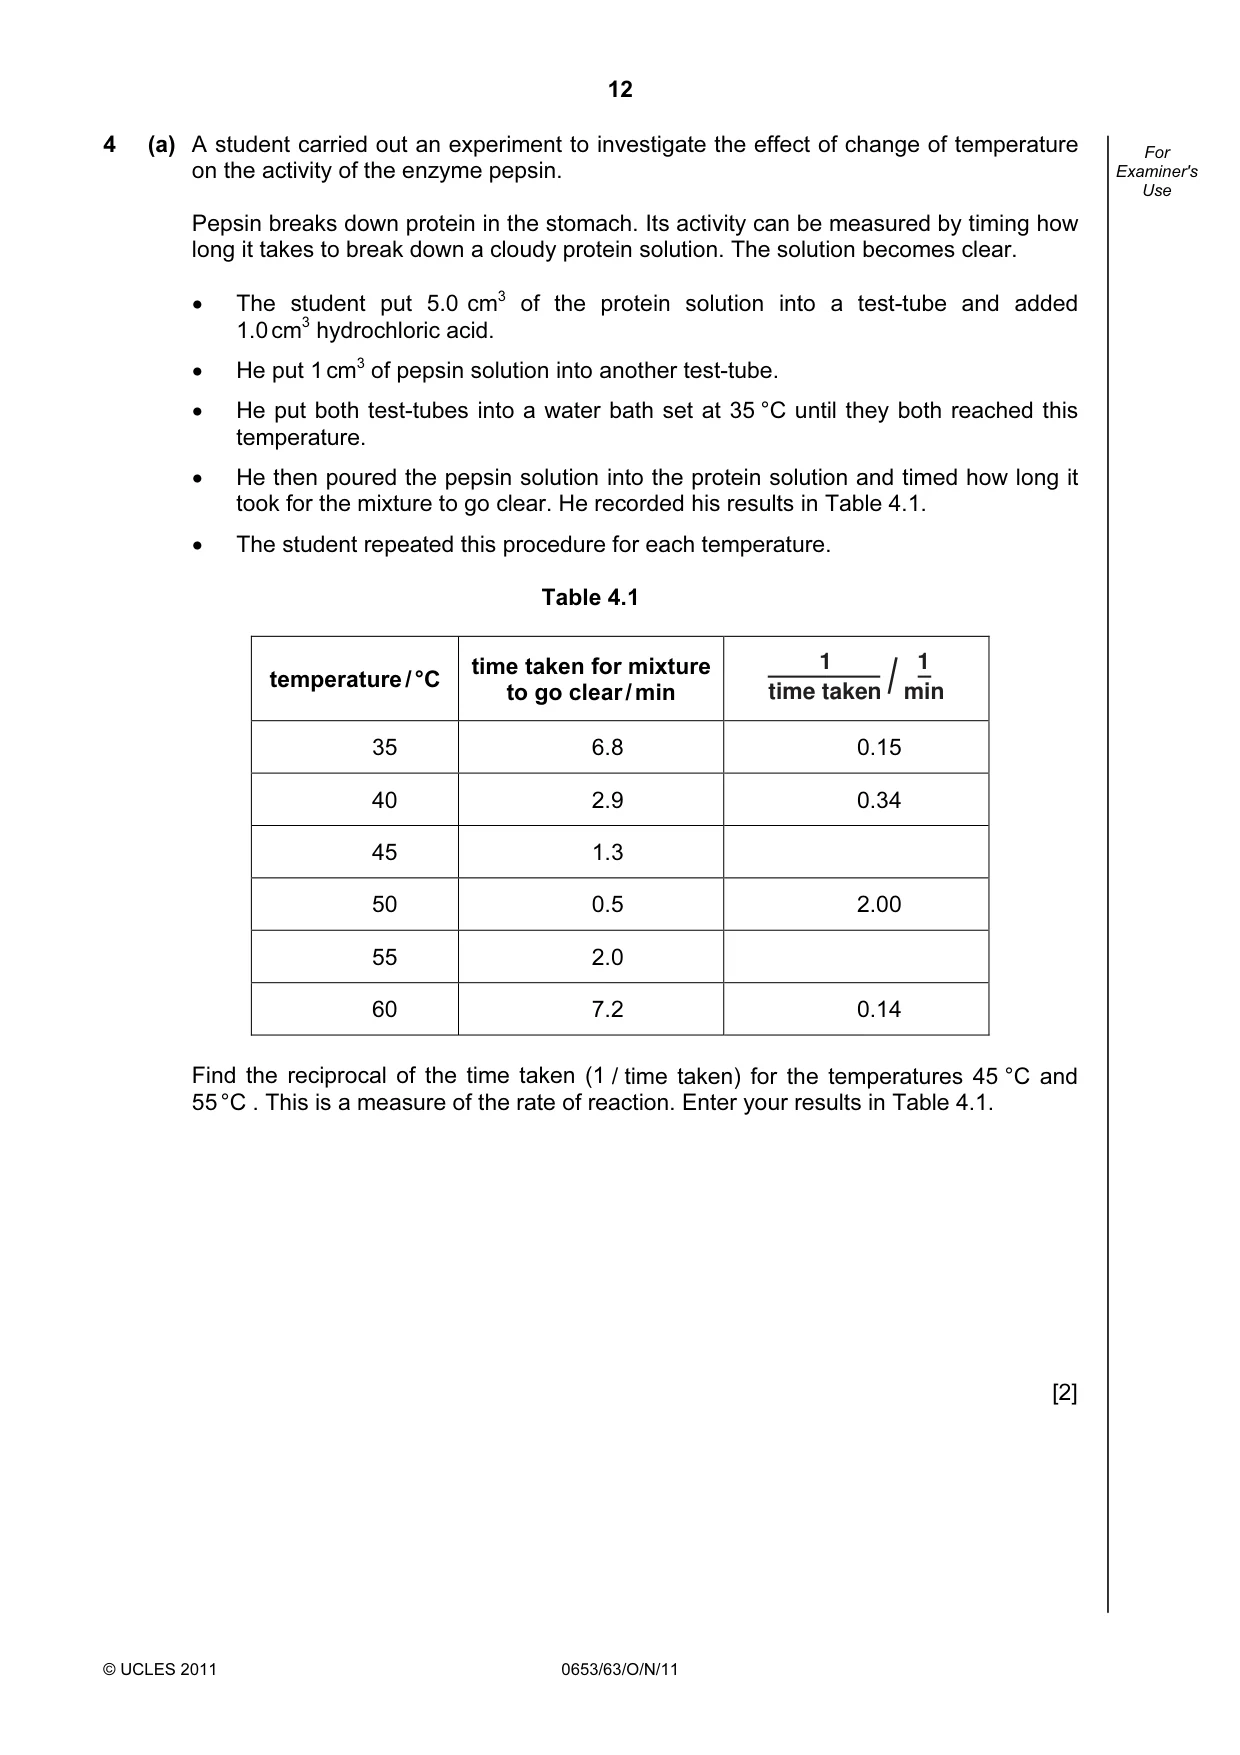
12 © UCLES 2011 0653/63/O/N/11 For Examiner's Use 4 (a) A student carried out an experiment to investigate the effect of change of temperature on the activity of the enzyme pepsin. Pepsin breaks down protein in the stomach. Its activity can be measured by timing how long it takes to break down a cloudy protein solution. The solution becomes clear. • The student put 5.0 cm3 of the protein solution into a test-tube and added 1.0 cm3 hydrochloric acid. • He put 1 cm3 of pepsin solution into another test-tube. • He put both test-tubes into a water bath set at 35 °C until they both reached this temperature. • He then poured the pepsin solution into the protein solution and timed how long it took for the mixture to go clear. He recorded his results in Table 4.1. • The student repeated this procedure for each temperature. Table 4.1 temperature / °C time taken for mixture to go clear / min time taken 1 min 1 35 6.8 0.15 40 2.9 0.34 45 1.3 50 0.5 2.00 55 2.0 60 7.2 0.14 Find the reciprocal of the time taken (1 / time taken) for the temperatures 45 °C and 55 °C . This is a measure of the rate of reaction. Enter your results in Table 4.1. [2]
Question paper, page 13
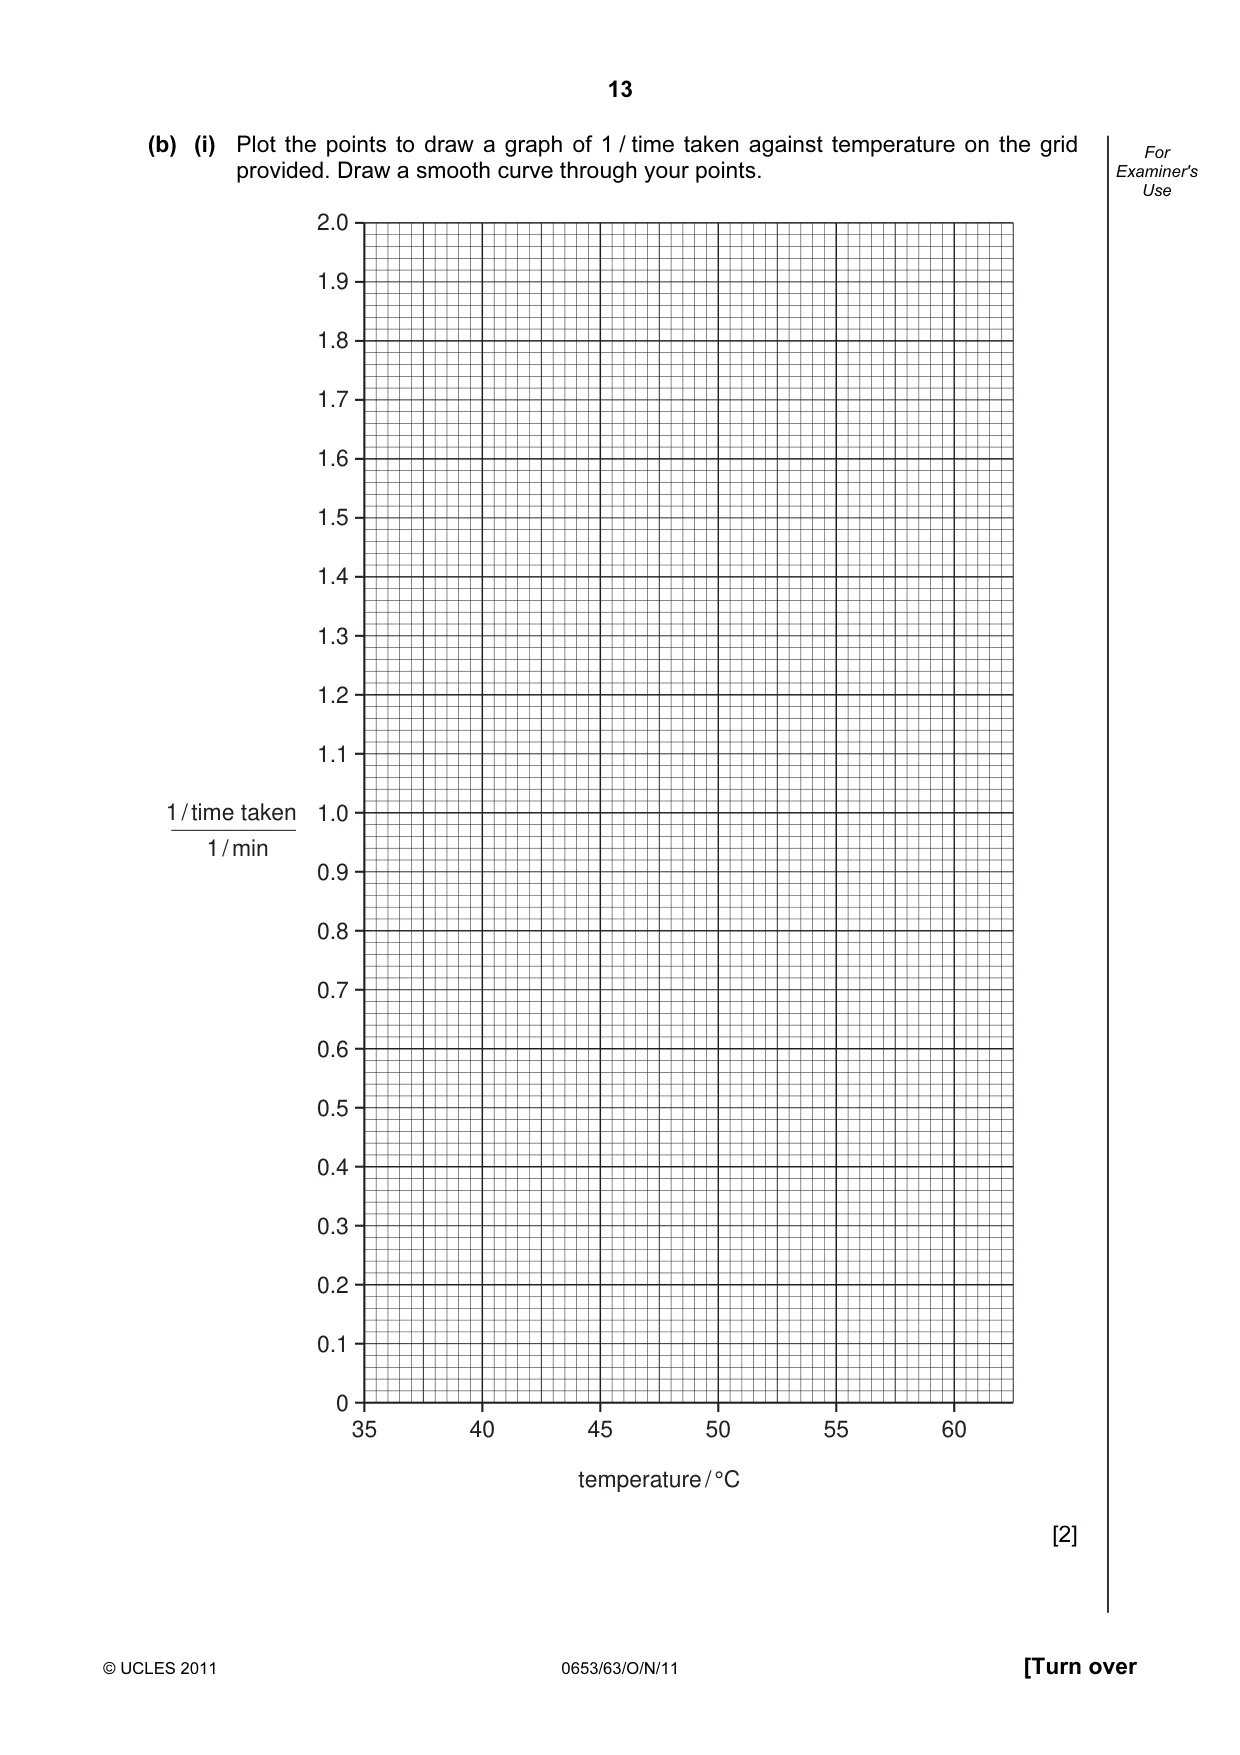
13 © UCLES 2011 0653/63/O/N/11 [Turn over For Examiner's Use (b) (i) Plot the points to draw a graph of 1 / time taken against temperature on the grid provided. Draw a smooth curve through your points. 35 40 45 50 55 60 2.0 1.9 1.8 1.7 1.6 1.5 1.4 1.3 1.2 1.1 1.0 0.9 0.8 0.7 0.6 0.5 0.4 0.3 0.2 0.1 0 temperature / °C 1 / time taken 1 / min [2]
Question paper, page 14
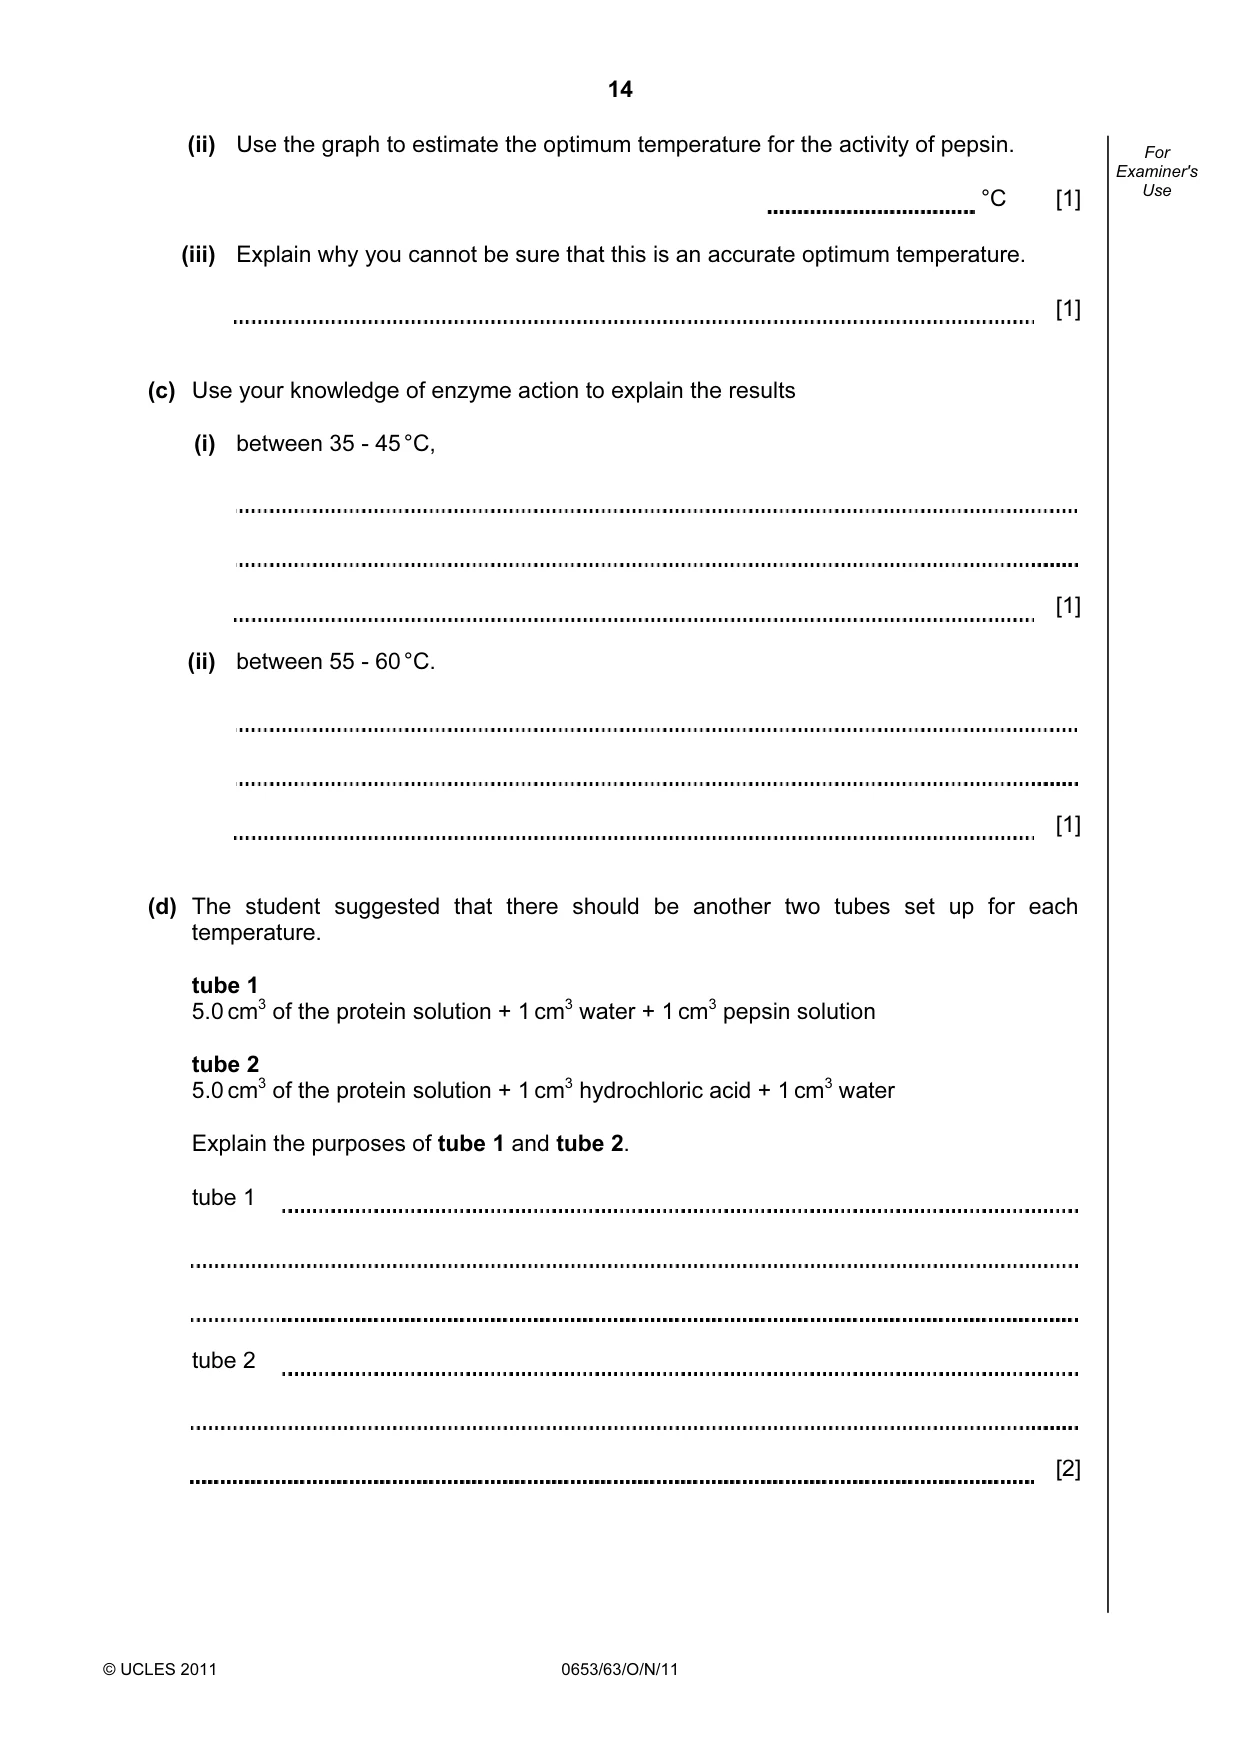
14 © UCLES 2011 0653/63/O/N/11 For Examiner's Use (ii) Use the graph to estimate the optimum temperature for the activity of pepsin. °C [1] (iii) Explain why you cannot be sure that this is an accurate optimum temperature. [1] (c) Use your knowledge of enzyme action to explain the results (i) between 35 - 45 °C, [1] (ii) between 55 - 60 °C. [1] (d) The student suggested that there should be another two tubes set up for each temperature. tube 1 5.0 cm3 of the protein solution + 1 cm3 water + 1 cm3 pepsin solution tube 2 5.0 cm3 of the protein solution + 1 cm3 hydrochloric acid + 1 cm3 water Explain the purposes of tube 1 and tube 2. tube 1 tube 2 [2]
Question paper, page 15
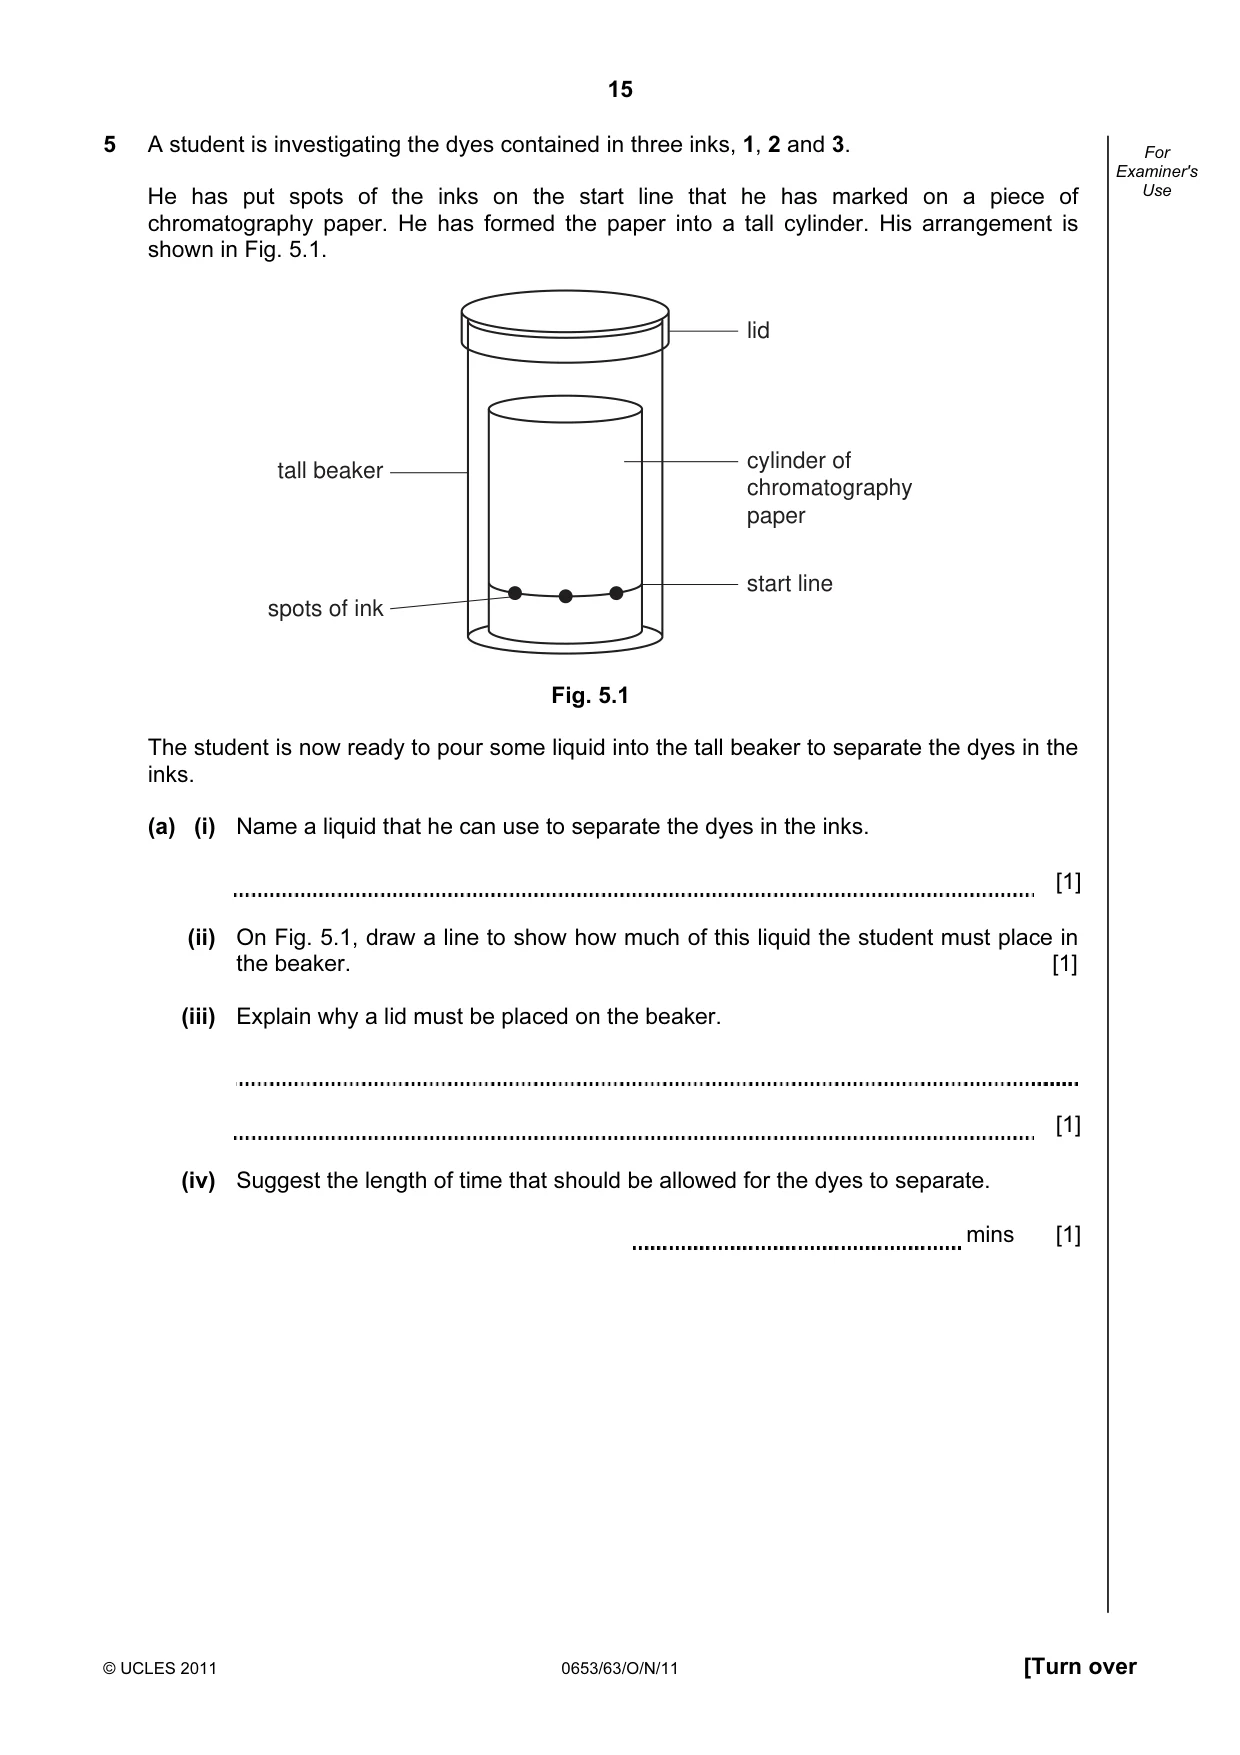
15 © UCLES 2011 0653/63/O/N/11 [Turn over For Examiner's Use 5 A student is investigating the dyes contained in three inks, 1, 2 and 3. He has put spots of the inks on the start line that he has marked on a piece of chromatography paper. He has formed the paper into a tall cylinder. His arrangement is shown in Fig. 5.1. start line cylinder of chromatography paper spots of ink lid tall beaker Fig. 5.1 The student is now ready to pour some liquid into the tall beaker to separate the dyes in the inks. (a) (i) Name a liquid that he can use to separate the dyes in the inks. [1] (ii) On Fig. 5.1, draw a line to show how much of this liquid the student must place in the beaker. [1] (iii) Explain why a lid must be placed on the beaker. [1] (iv) Suggest the length of time that should be allowed for the dyes to separate. mins [1]
Question paper, page 16
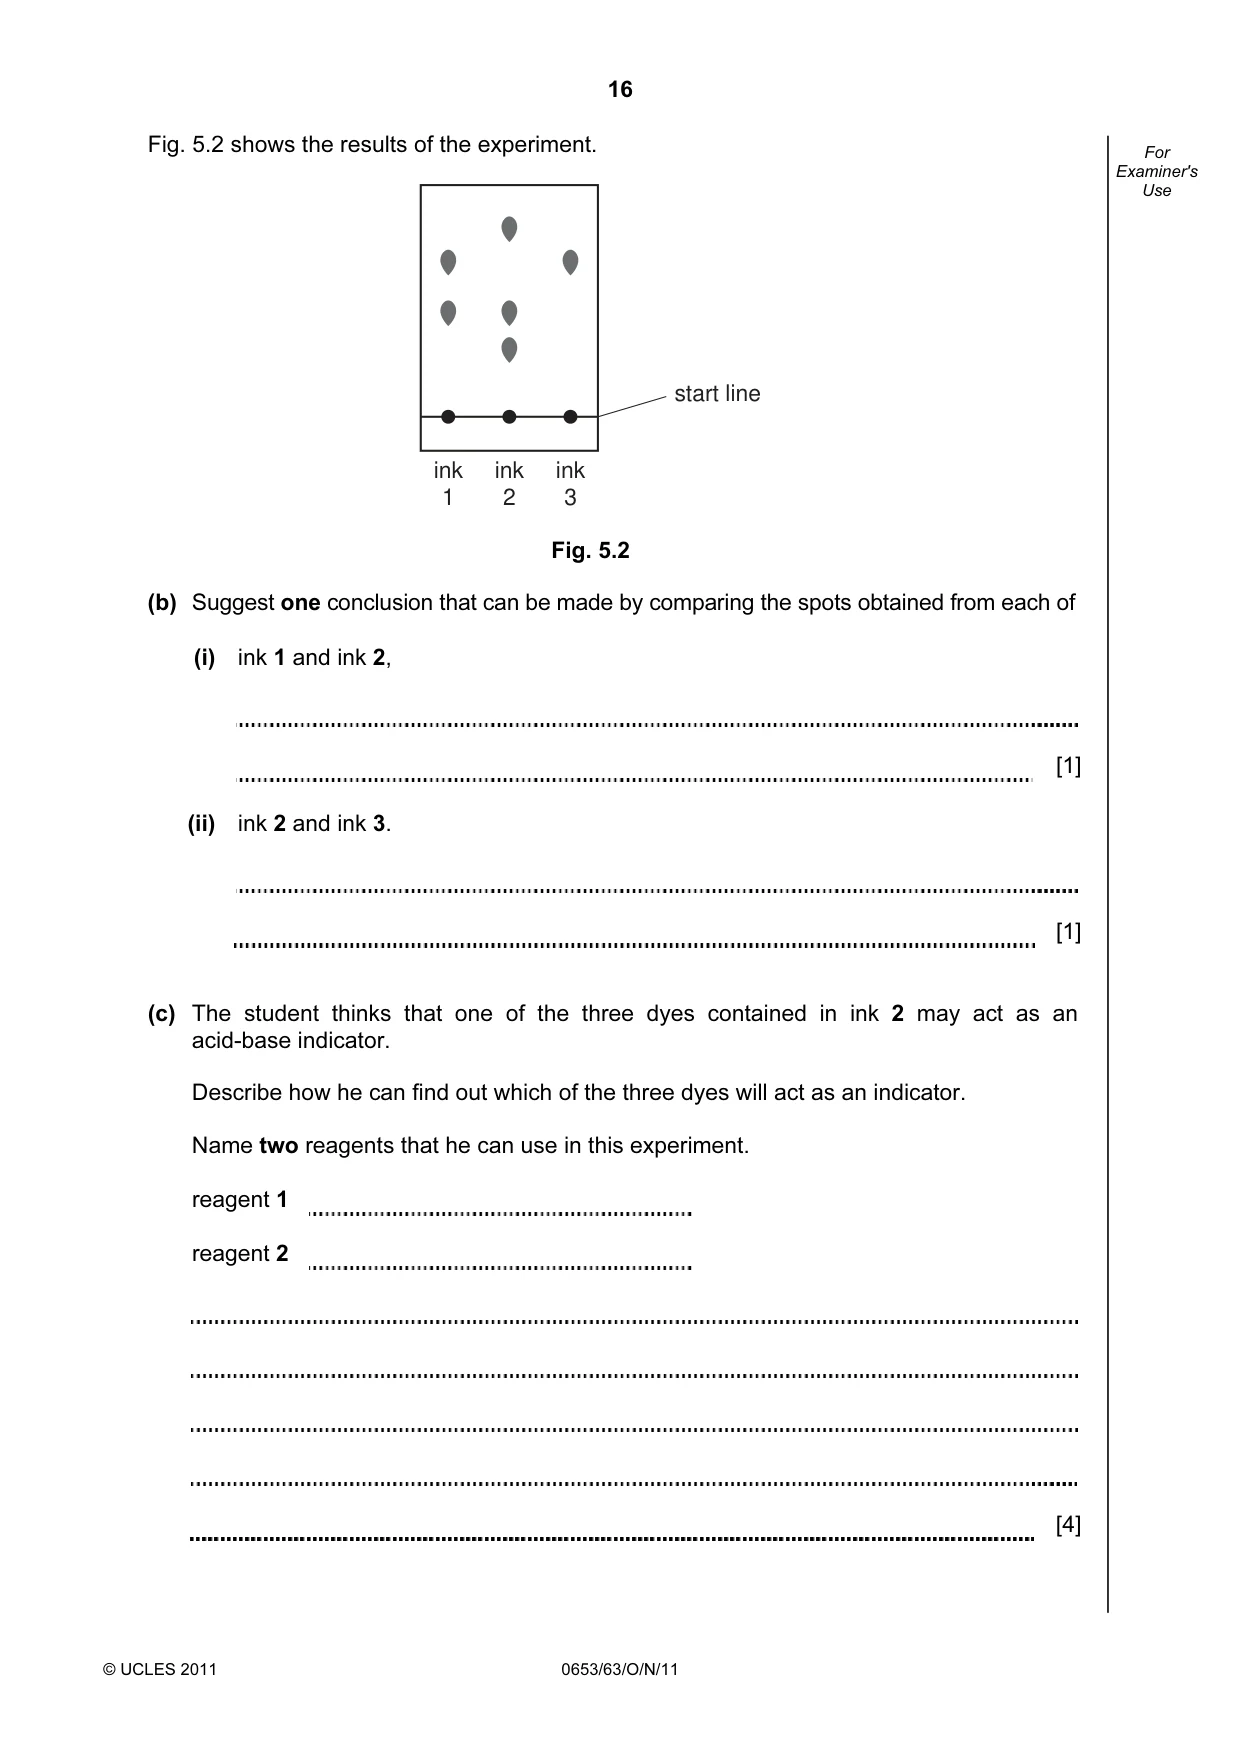
16 © UCLES 2011 0653/63/O/N/11 For Examiner's Use Fig. 5.2 shows the results of the experiment. ink 1 ink 2 ink 3 start line Fig. 5.2 (b) Suggest one conclusion that can be made by comparing the spots obtained from each of (i) ink 1 and ink 2, [1] (ii) ink 2 and ink 3. [1] (c) The student thinks that one of the three dyes contained in ink 2 may act as an acid-base indicator. Describe how he can find out which of the three dyes will act as an indicator. Name two reagents that he can use in this experiment. reagent 1 reagent 2 [4]
Question paper, page 17
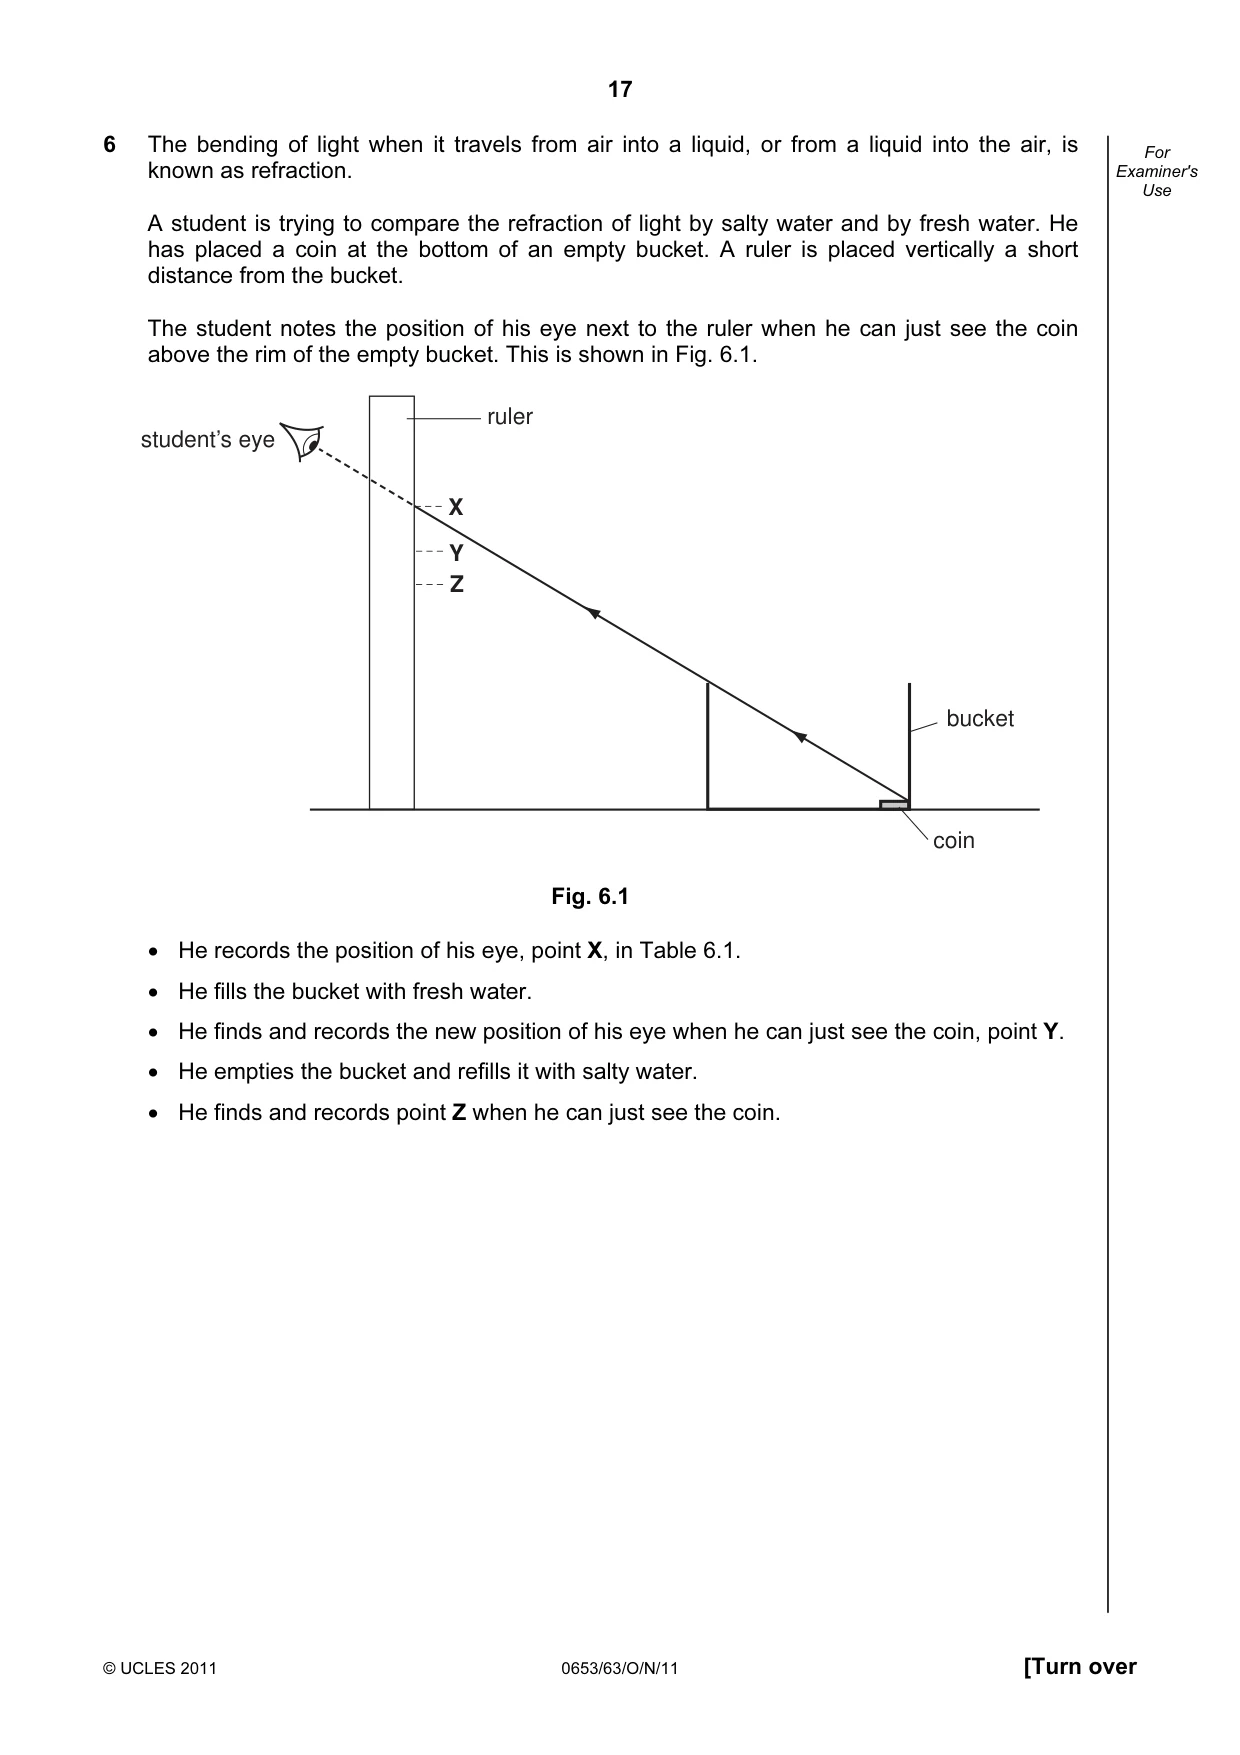
17 © UCLES 2011 0653/63/O/N/11 [Turn over For Examiner's Use 6 The bending of light when it travels from air into a liquid, or from a liquid into the air, is known as refraction. A student is trying to compare the refraction of light by salty water and by fresh water. He has placed a coin at the bottom of an empty bucket. A ruler is placed vertically a short distance from the bucket. The student notes the position of his eye next to the ruler when he can just see the coin above the rim of the empty bucket. This is shown in Fig. 6.1. coin bucket student’s eye ruler X Y Z Fig. 6.1 • He records the position of his eye, point X, in Table 6.1. • He fills the bucket with fresh water. • He finds and records the new position of his eye when he can just see the coin, point Y. • He empties the bucket and refills it with salty water. • He finds and records point Z when he can just see the coin.
Question paper, page 18
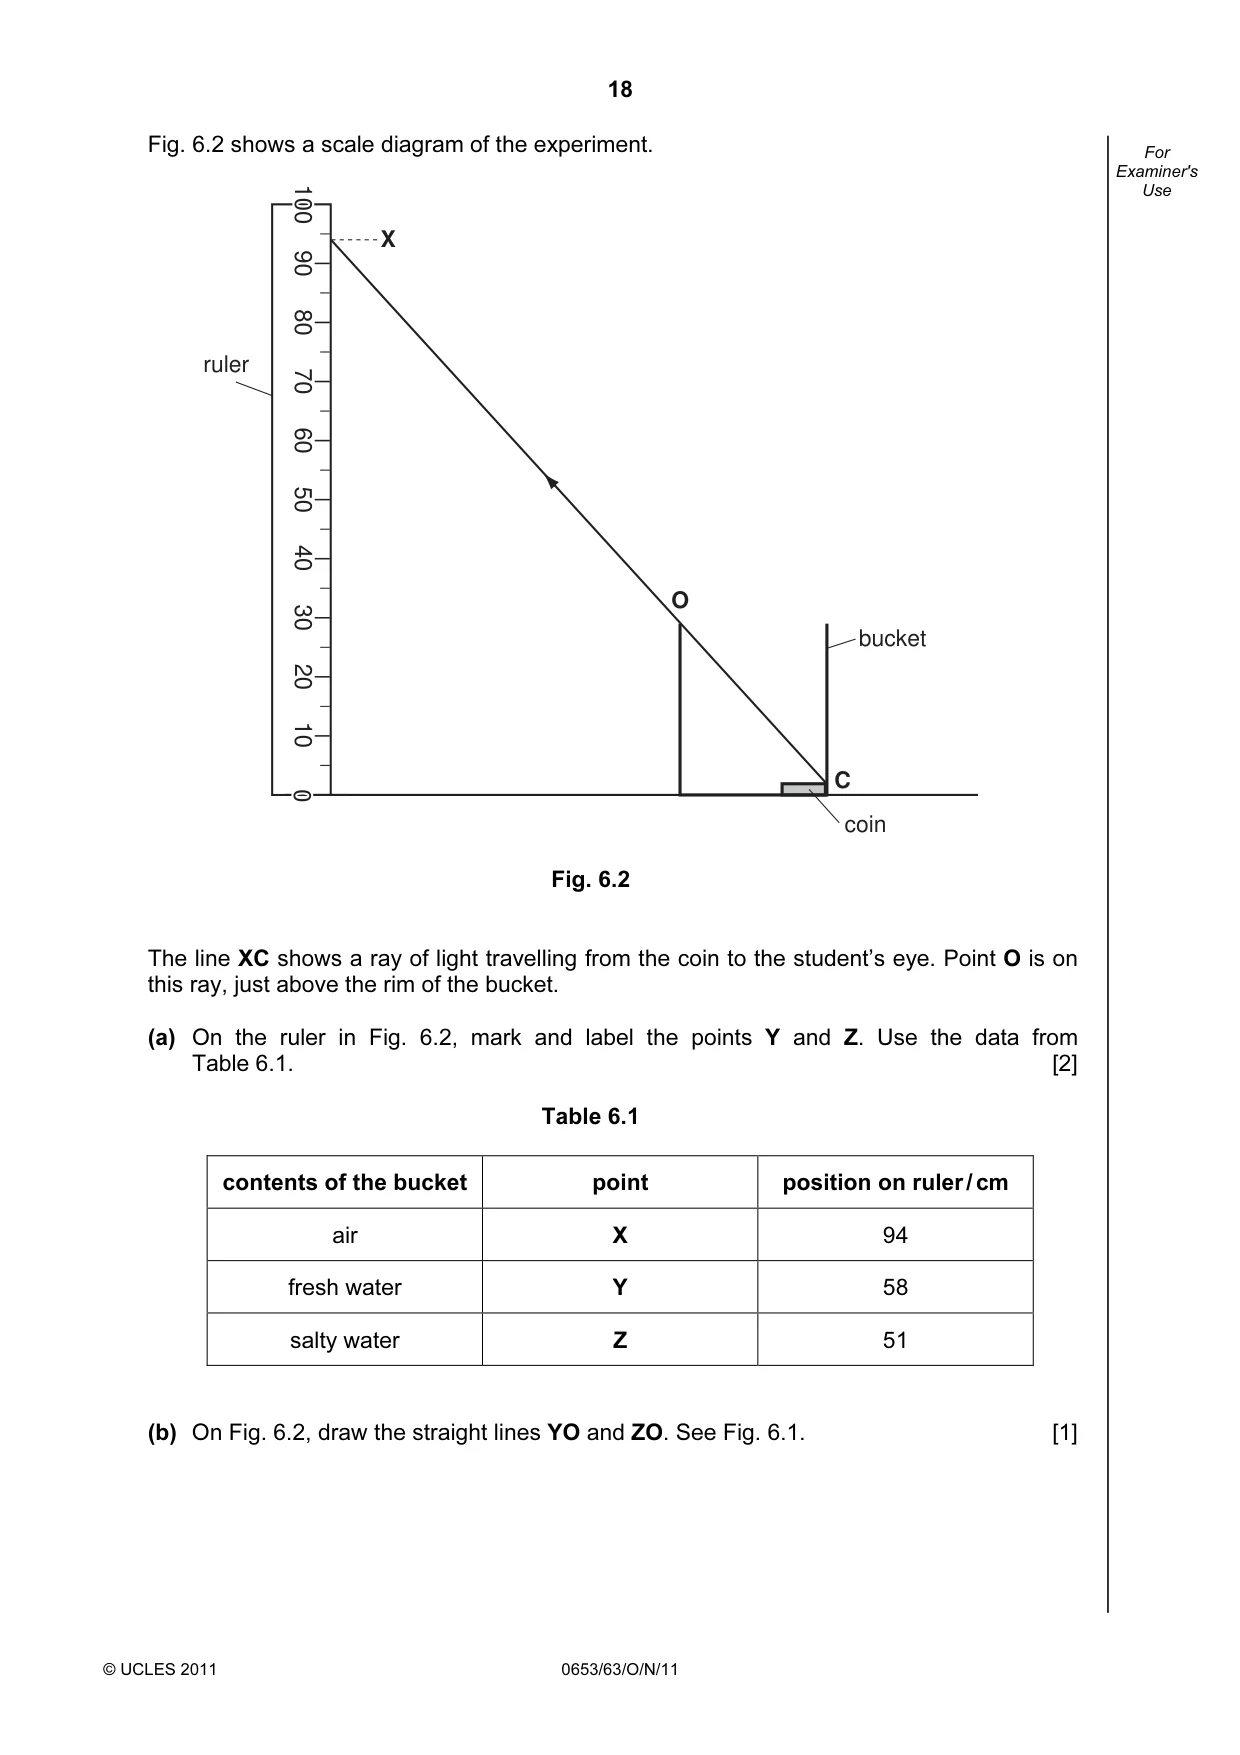
18 © UCLES 2011 0653/63/O/N/11 For Examiner's Use Fig. 6.2 shows a scale diagram of the experiment. ruler bucket coin X C O 0 100 100 10 20 30 40 50 60 70 80 90 100 0 Fig. 6.2 The line XC shows a ray of light travelling from the coin to the student’s eye. Point O is on this ray, just above the rim of the bucket. (a) On the ruler in Fig. 6.2, mark and label the points Y and Z. Use the data from Table 6.1. [2] Table 6.1 contents of the bucket point position on ruler / cm air X 94 fresh water Y 58 salty water Z 51 (b) On Fig. 6.2, draw the straight lines YO and ZO. See Fig. 6.1. [1]
Question paper, page 19
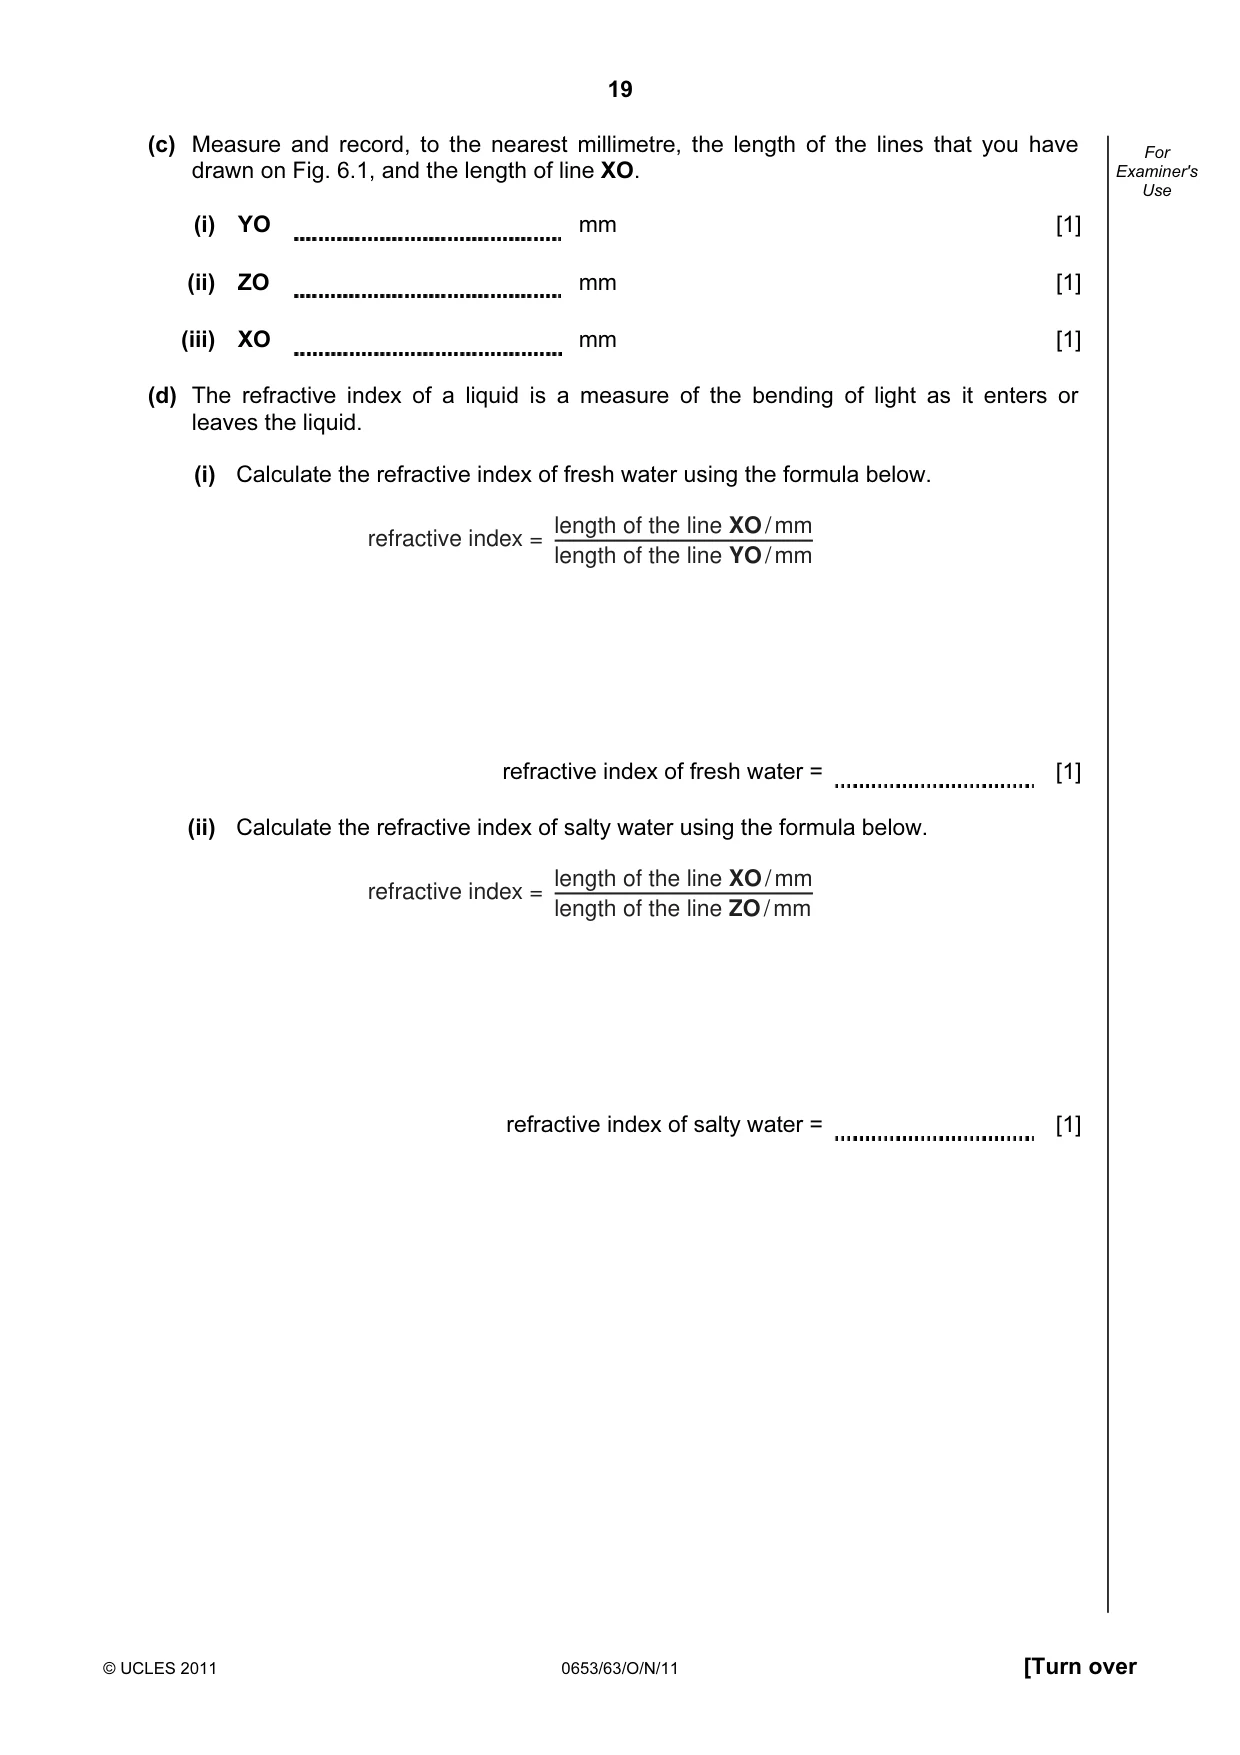
19 © UCLES 2011 0653/63/O/N/11 [Turn over For Examiner's Use (c) Measure and record, to the nearest millimetre, the length of the lines that you have drawn on Fig. 6.1, and the length of line XO. (i) YO mm [1] (ii) ZO mm [1] (iii) XO mm [1] (d) The refractive index of a liquid is a measure of the bending of light as it enters or leaves the liquid. (i) Calculate the refractive index of fresh water using the formula below. length of the line YO / mm length of the line XO / mm refractive index = refractive index of fresh water = [1] (ii) Calculate the refractive index of salty water using the formula below. length of the line ZO / mm length of the line XO / mm refractive index = refractive index of salty water = [1]
Question paper, page 20
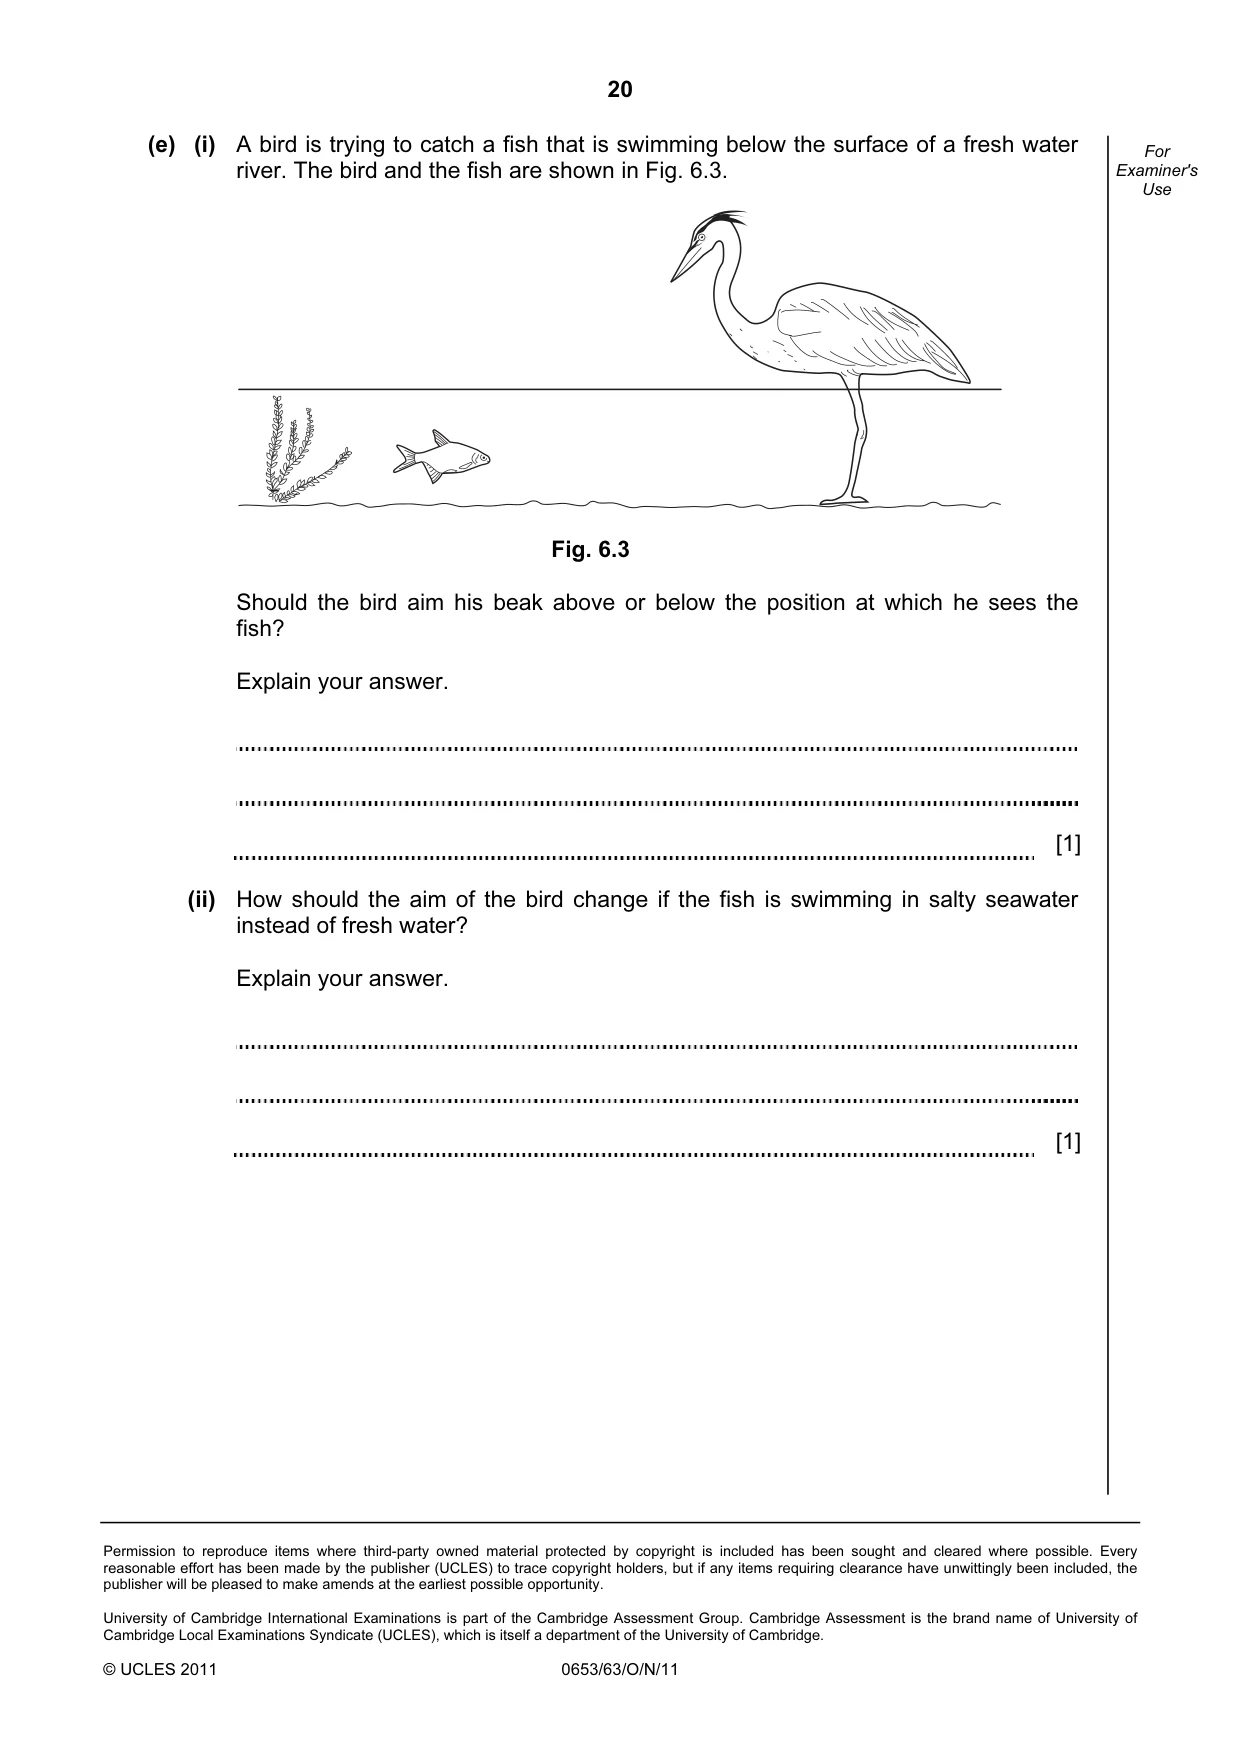
20 Permission to reproduce items where third-party owned material protected by copyright is included has been sought and cleared where possible. Every reasonable effort has been made by the publisher (UCLES) to trace copyright holders, but if any items requiring clearance have unwittingly been included, the publisher will be pleased to make amends at the earliest possible opportunity. University of Cambridge International Examinations is part of the Cambridge Assessment Group. Cambridge Assessment is the brand name of University of Cambridge Local Examinations Syndicate (UCLES), which is itself a department of the University of Cambridge. © UCLES 2011 0653/63/O/N/11 For Examiner's Use (e) (i) A bird is trying to catch a fish that is swimming below the surface of a fresh water river. The bird and the fish are shown in Fig. 6.3. Fig. 6.3 Should the bird aim his beak above or below the position at which he sees the fish? Explain your answer. [1] (ii) How should the aim of the bird change if the fish is swimming in salty seawater instead of fresh water? Explain your answer. [1]
Mark scheme, page 1
UNIVERSITY OF CAMBRIDGE INTERNATIONAL EXAMINATIONS International General Certificate of Secondary Education MARK SCHEME for the October/November 2011 question paper for the guidance of teachers 0653 COMBINED SCIENCE 0653/63 Paper 6 (Alternative to Practical), maximum raw mark 60 This mark scheme is published as an aid to teachers and candidates, to indicate the requirements of the examination. It shows the basis on which Examiners were instructed to award marks. It does not indicate the details of the discussions that took place at an Examiners’ meeting before marking began, which would have considered the acceptability of alternative answers. Mark schemes must be read in conjunction with the question papers and the report on the examination. • Cambridge will not enter into discussions or correspondence in connection with these mark schemes. Cambridge is publishing the mark schemes for the October/November 2011 question papers for most IGCSE, GCE Advanced Level and Advanced Subsidiary Level syllabuses and some Ordinary Level syllabuses. www.XtremePapers.com
Mark scheme, page 2
Page 2 Mark Scheme: Teachers’ version Syllabus Paper IGCSE – October/November 2011 0653 63 © University of Cambridge International Examinations 2011 1 (a) (i) stomata / pores ; expanding gas , air / oxygen / CO2 ; [max 2] (ii) C – between 42 and 45 ; P – between 20 and 24 ; [2] (iii) total no. of squares for C e.g. 42 multiplied by 100 ; total no. of squares for P e.g. 20 multiplied by 100 ; [2] (iv) warmer ; in direct sun ; more wind movement ; less humid ; more water loss ; more wilting ; [max 2] (b) all bundles indicated by shading ; xylem ; [2] [Total: 10] 2 (a) (i) green ; to yellow / orange ; [2] (ii) carbonic acid ; (allow H2CO3) [1] (b) (i) turns white / white precipitate / milky / cloudy / owtte ; [1] (ii) white / milkiness disappears / owtte (reject dissolves / reacts) ; [1] (iii) (aq) = aqueous / dissolved ; (g) = gas / gaseous ; (s) = solid ; [3] (iv) precipitate ; [1] (c) B and C ; [1] [Total: 10]
Mark scheme, page 3
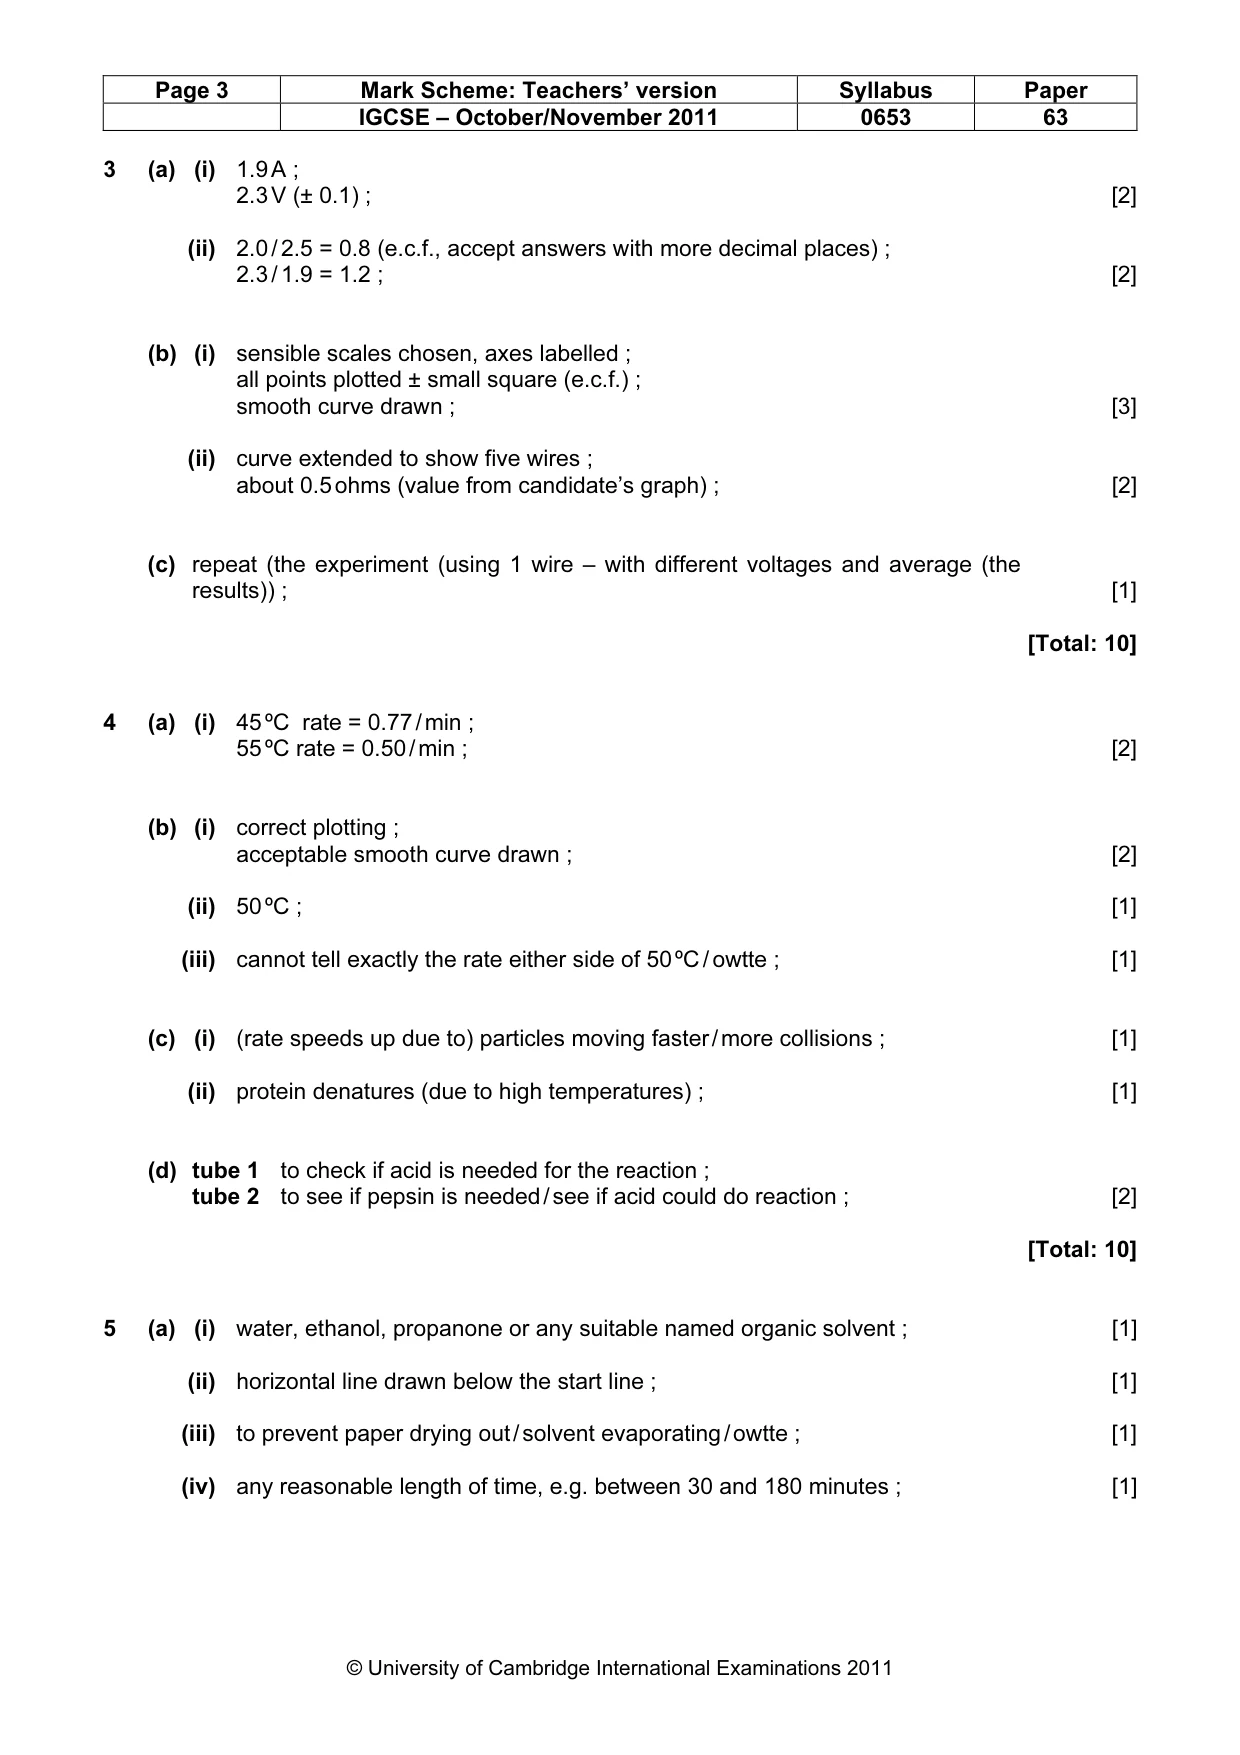
Page 3 Mark Scheme: Teachers’ version Syllabus Paper IGCSE – October/November 2011 0653 63 © University of Cambridge International Examinations 2011 3 (a) (i) 1.9 A ; 2.3 V (± 0.1) ; [2] (ii) 2.0 / 2.5 = 0.8 (e.c.f., accept answers with more decimal places) ; 2.3 / 1.9 = 1.2 ; [2] (b) (i) sensible scales chosen, axes labelled ; all points plotted ± small square (e.c.f.) ; smooth curve drawn ; [3] (ii) curve extended to show five wires ; about 0.5 ohms (value from candidate’s graph) ; [2] (c) repeat (the experiment (using 1 wire – with different voltages and average (the results)) ; [1] [Total: 10] 4 (a) (i) 45 ºC rate = 0.77 / min ; 55 ºC rate = 0.50 / min ; [2] (b) (i) correct plotting ; acceptable smooth curve drawn ; [2] (ii) 50 ºC ; [1] (iii) cannot tell exactly the rate either side of 50 ºC / owtte ; [1] (c) (i) (rate speeds up due to) particles moving faster / more collisions ; [1] (ii) protein denatures (due to high temperatures) ; [1] (d) tube 1 to check if acid is needed for the reaction ; tube 2 to see if pepsin is needed / see if acid could do reaction ; [2] [Total: 10] 5 (a) (i) water, ethanol, propanone or any suitable named organic solvent ; [1] (ii) horizontal line drawn below the start line ; [1] (iii) to prevent paper drying out / solvent evaporating / owtte ; [1] (iv) any reasonable length of time, e.g. between 30 and 180 minutes ; [1]
Mark scheme, page 4
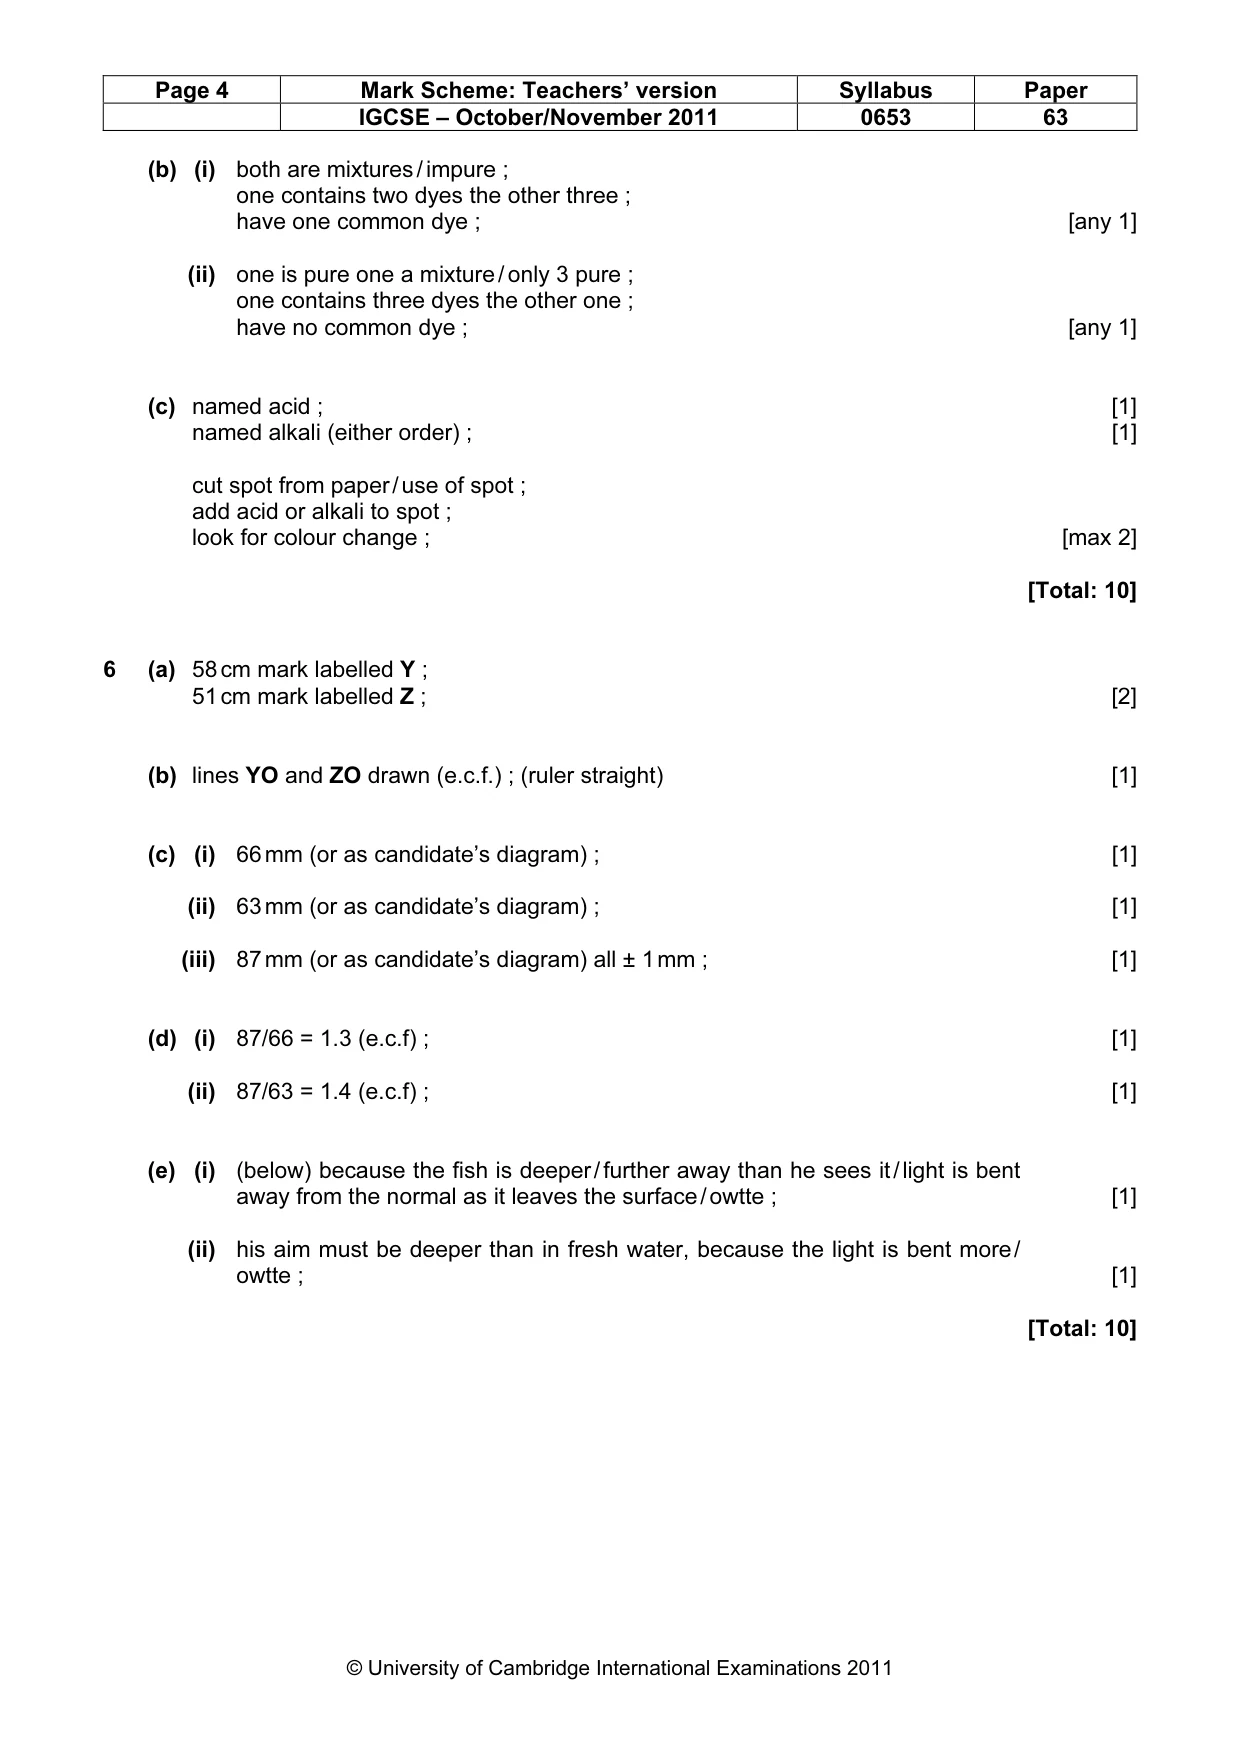
Page 4 Mark Scheme: Teachers’ version Syllabus Paper IGCSE – October/November 2011 0653 63 © University of Cambridge International Examinations 2011 (b) (i) both are mixtures / impure ; one contains two dyes the other three ; have one common dye ; [any 1] (ii) one is pure one a mixture / only 3 pure ; one contains three dyes the other one ; have no common dye ; [any 1] (c) named acid ; [1] named alkali (either order) ; [1] cut spot from paper / use of spot ; add acid or alkali to spot ; look for colour change ; [max 2] [Total: 10] 6 (a) 58 cm mark labelled Y ; 51 cm mark labelled Z ; [2] (b) lines YO and ZO drawn (e.c.f.) ; (ruler straight) [1] (c) (i) 66 mm (or as candidate’s diagram) ; [1] (ii) 63 mm (or as candidate’s diagram) ; [1] (iii) 87 mm (or as candidate’s diagram) all ± 1 mm ; [1] (d) (i) 87/66 = 1.3 (e.c.f) ; [1] (ii) 87/63 = 1.4 (e.c.f) ; [1] (e) (i) (below) because the fish is deeper / further away than he sees it / light is bent away from the normal as it leaves the surface / owtte ; [1] (ii) his aim must be deeper than in fresh water, because the light is bent more / owtte ; [1] [Total: 10]
What you needed in this session
Cambridge’s own grade thresholds for 2011 Oct/Nov, Paper 6 · Variant 3. A higher threshold means an easier paper — the bar moves with how the cohort did.