Cambridge IGCSE Mathematics 0580 — 2018 Oct/Nov Paper 3 · Variant 1
0580/31/O/N/18 · 9 questions · 104 marks · ≈117 min
The question paper and its mark scheme, free to read here and free to download. This is Cambridge’s own paper, exactly as it was sat.
Question paper16 pages
Mark scheme6 pages
Answers below. Sit the paper first if you are practising.
Questions as text
Q1 · Lena owns a café
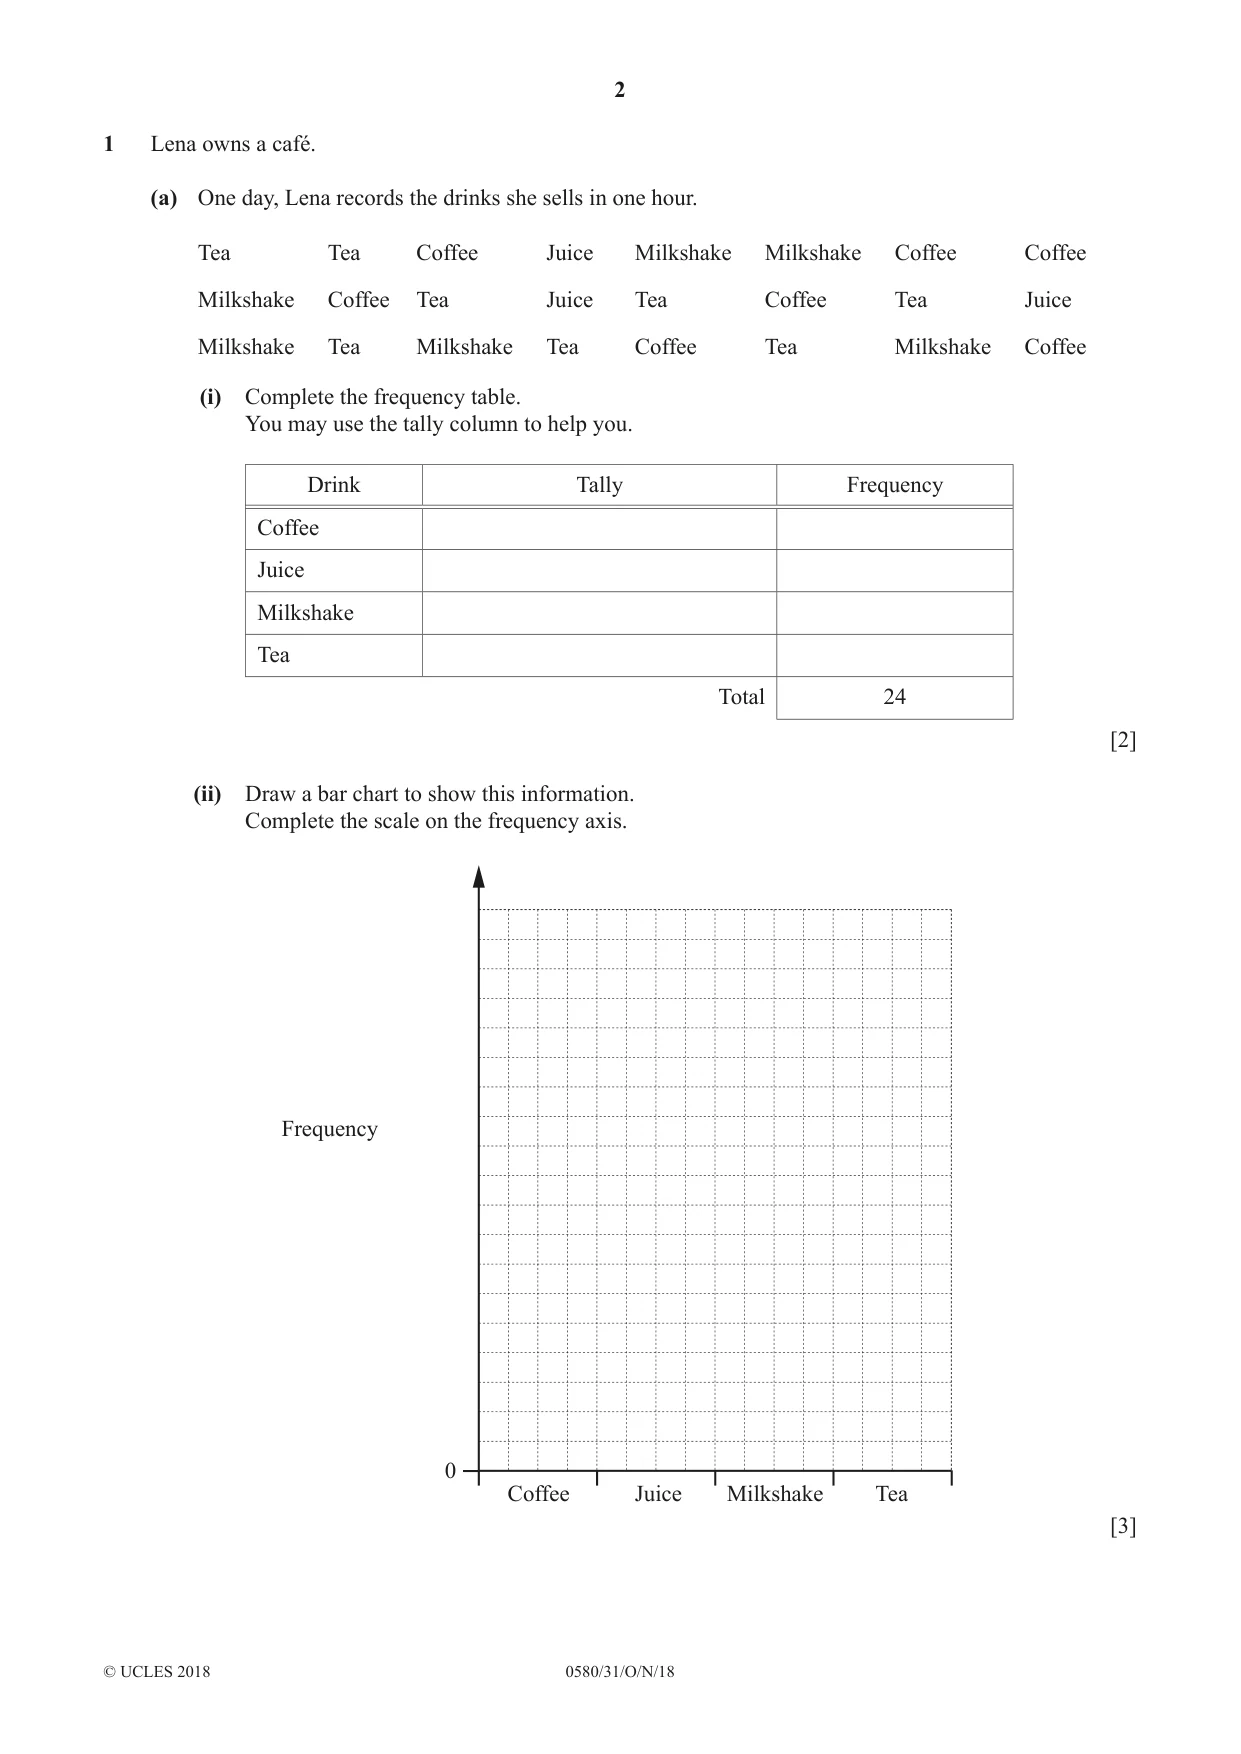
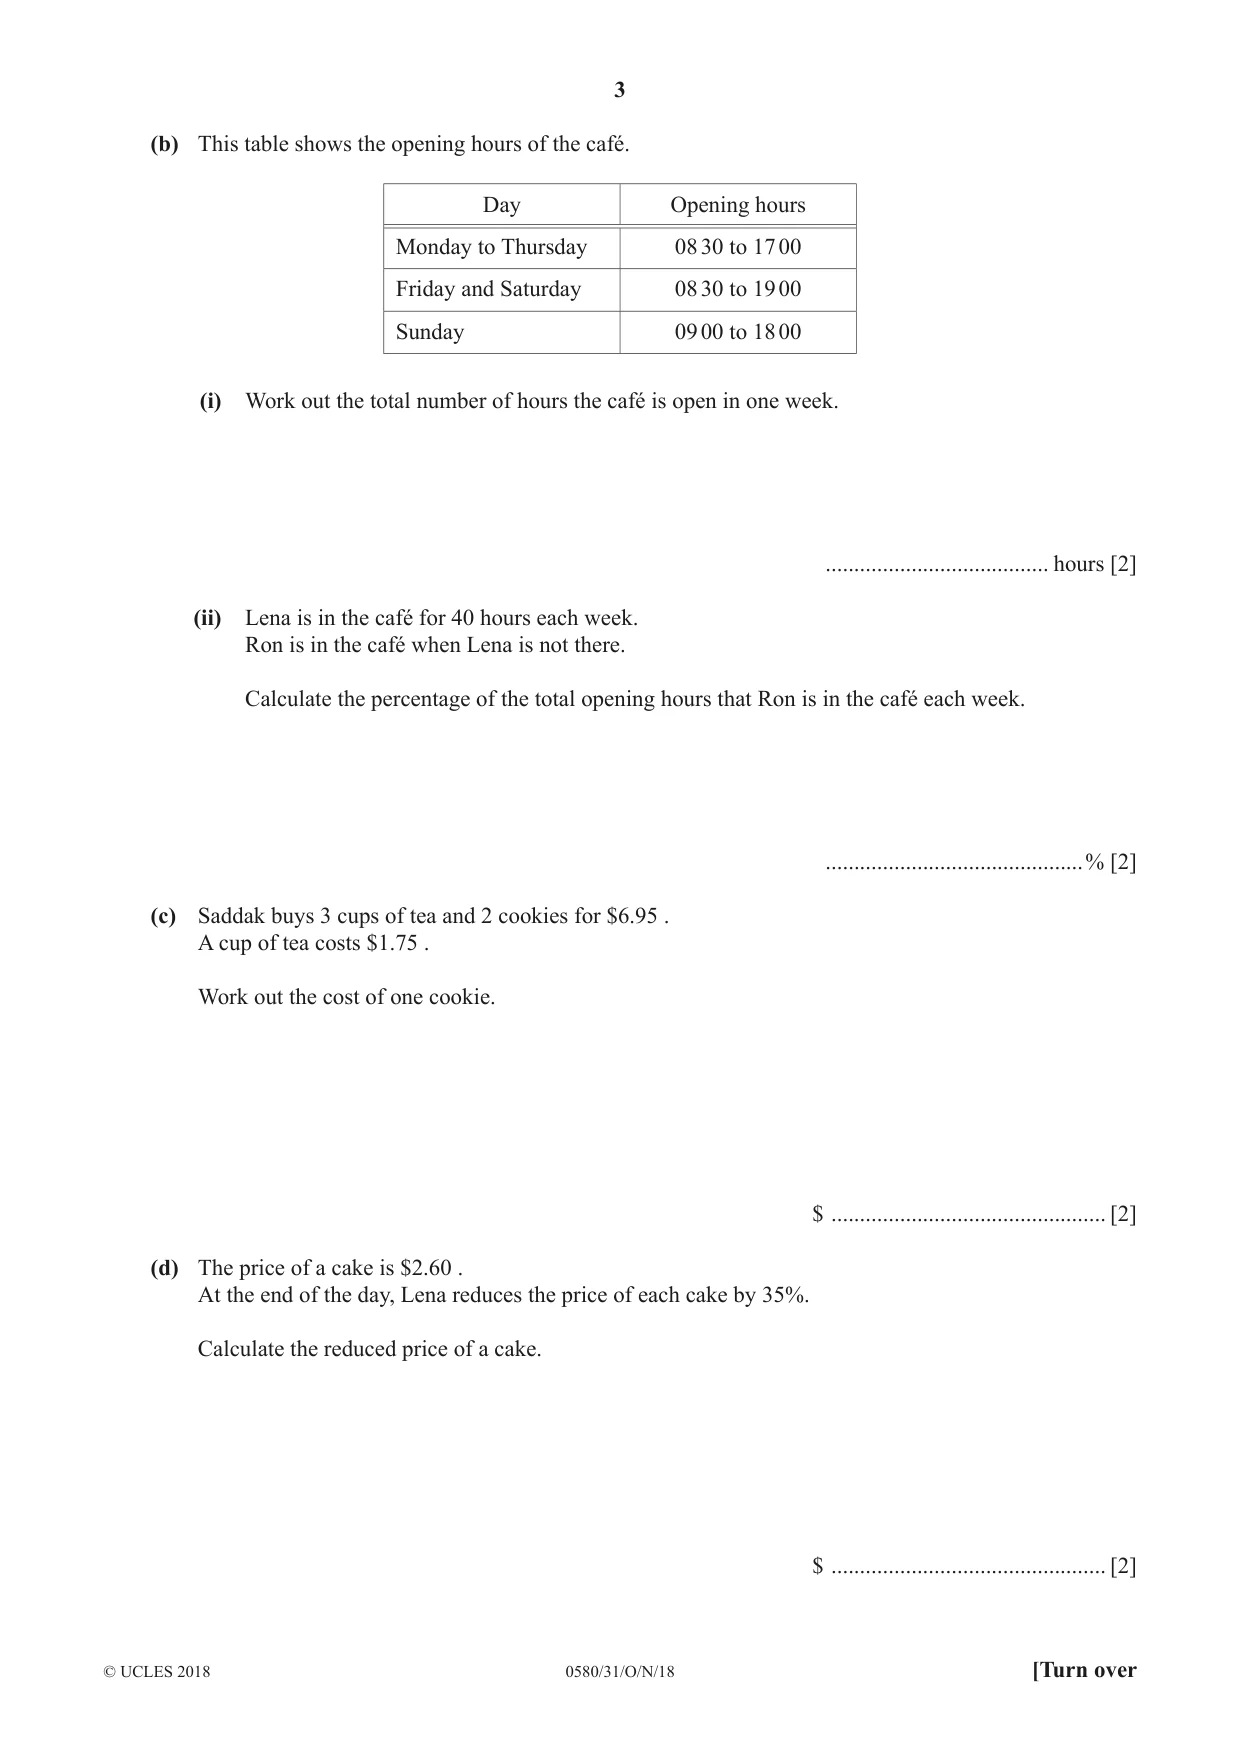
1 Lena owns a café. (a) One day, Lena records the drinks she sells in one hour. Tea Tea Coffee Juice Milkshake Milkshake Coffee Coffee Milkshake Coffee Tea Juice Tea Coffee Tea Juice Milkshake Tea Milkshake Tea Coffee Tea Milkshake Coffee (i) Complete the frequency table. You may use the tally column to help you. Drink Tally Frequency Coffee Juice Milkshake Tea Total 24 [2] (ii) Draw a bar chart to show this information. Complete the scale on the frequency axis. Frequency 0 Coffee Juice Milkshake Tea [3] (b) This table shows the opening hours of the café. Day Opening hours Monday to Thursday 08 30 to 17 00 Friday and Saturday 08 30 to 19 00 Sunday 09 00 to 18 00 (i) Work out the total number of hours the café is open in one week. ....................................... hours [2] (ii) Lena is in the café for 40 hours each week. Ron is in the café when Lena is not there. Calculate the percentage of the total opening hours that Ron is in the café each week. .............................................% [2] (c) Saddak buys 3 cups of tea and 2 cookies for $6.95 . A cup of tea costs $1.75 . Work out the cost of one cookie. $ ................................................ [2] (d) The price of a cake is $2.60 . At the end of the day, Lena reduces the price of each cake by 35%. Calculate the reduced price of a cake. $ ................................................ [2]
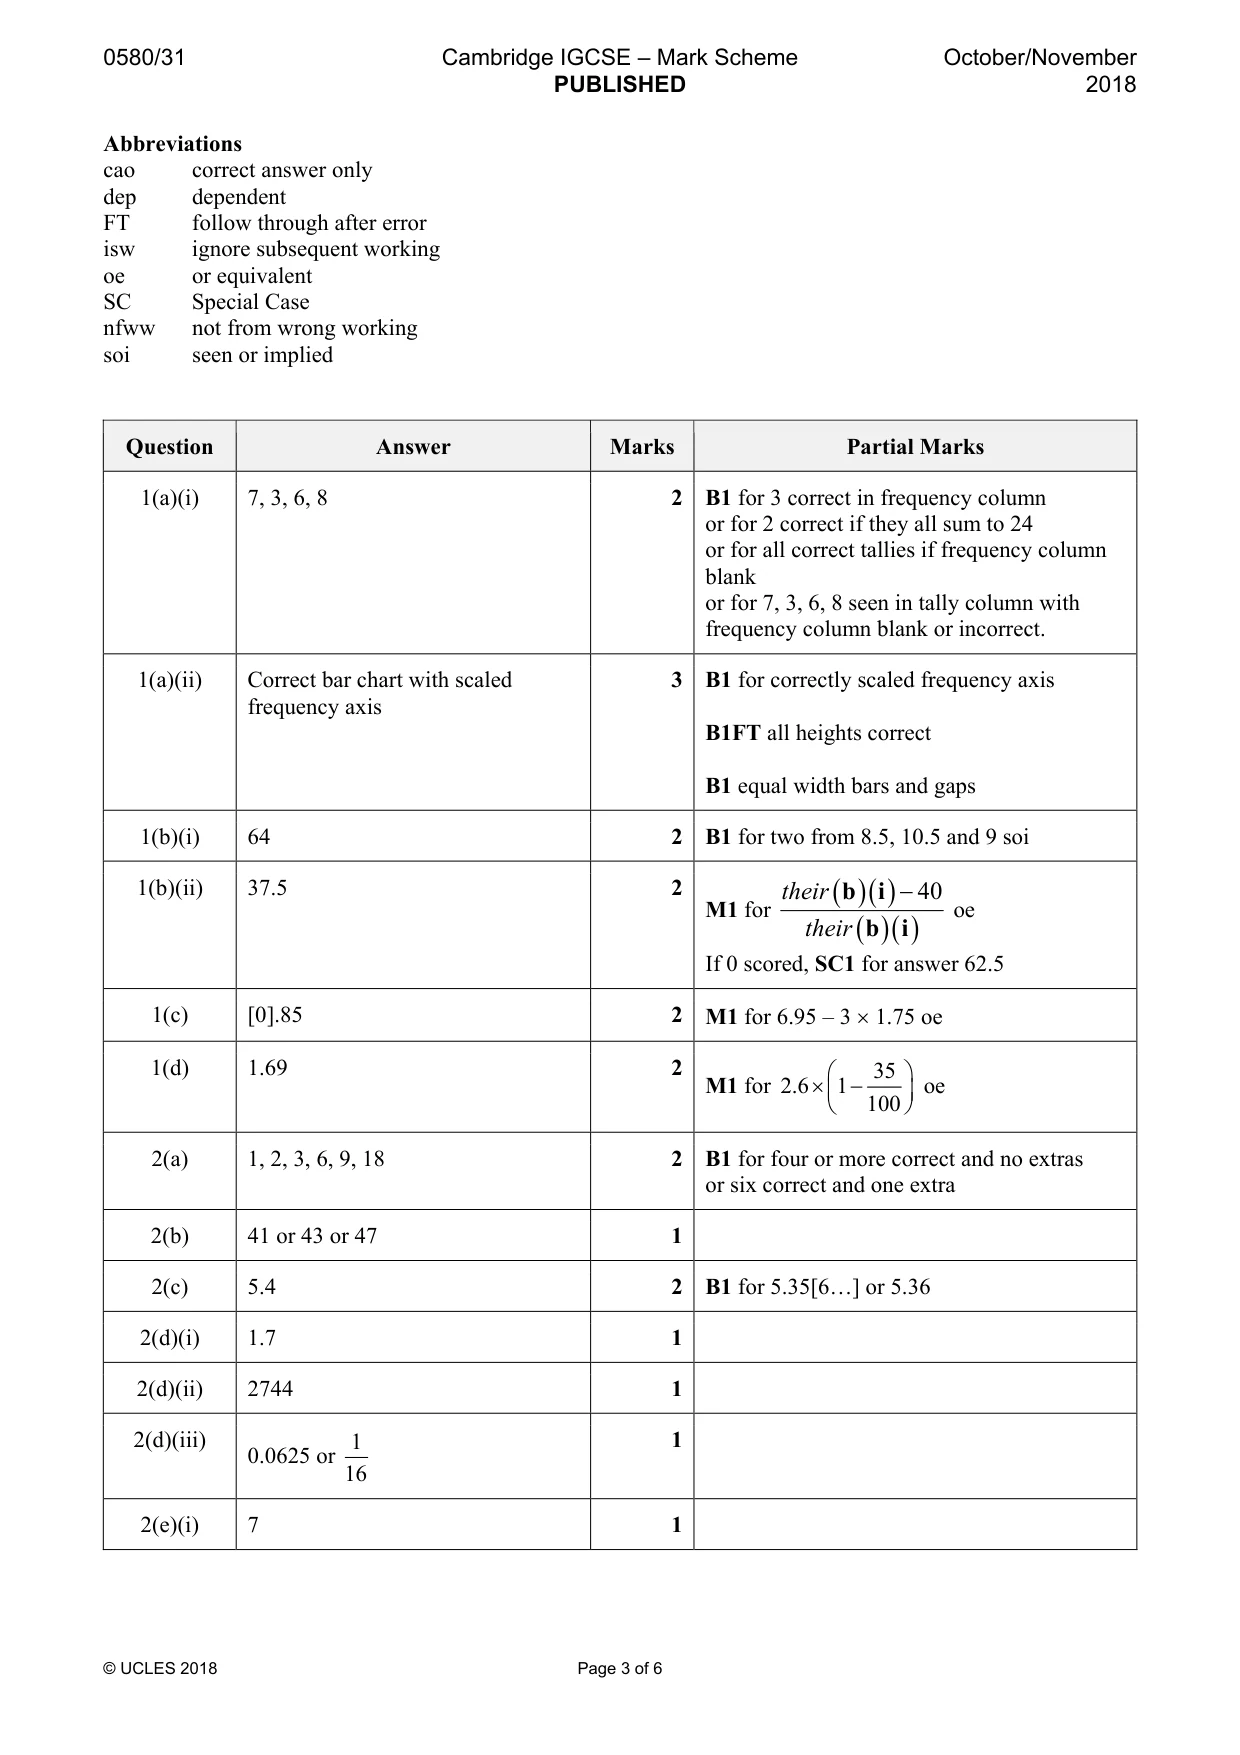
Mark scheme: Question Answer Marks Partial Marks 1(a)(i) 7, 3, 6, 8 2 B1 for 3 correct in frequency column or for 2 correct if they all sum to 24 or for all correct tallies if frequency column blank or for 7, 3, 6, 8 seen in tally column with frequency column blank or incorrect. 1(a)(ii) Correct bar chart with scaled 3 B1 for correctly scaled frequency axis frequency axis B1FT all heights correct B1 equal width bars and gaps 1(b)(i) 64 2 B1 for two from 8.5, 10.5 and 9 soi 1(b)(ii) 37.5 2 their ( b )( i ) − 40 M1 for oe their ( b )( i ) If 0 scored, SC1 for answer 62.5 1(c) [0].85 2 M1 for 6.95 – 3 × 1.75 oe 1(d) 1.69 2 35 M1 for 2.6 × 1 − oe 100
Q2 · Write down all the factors of 18
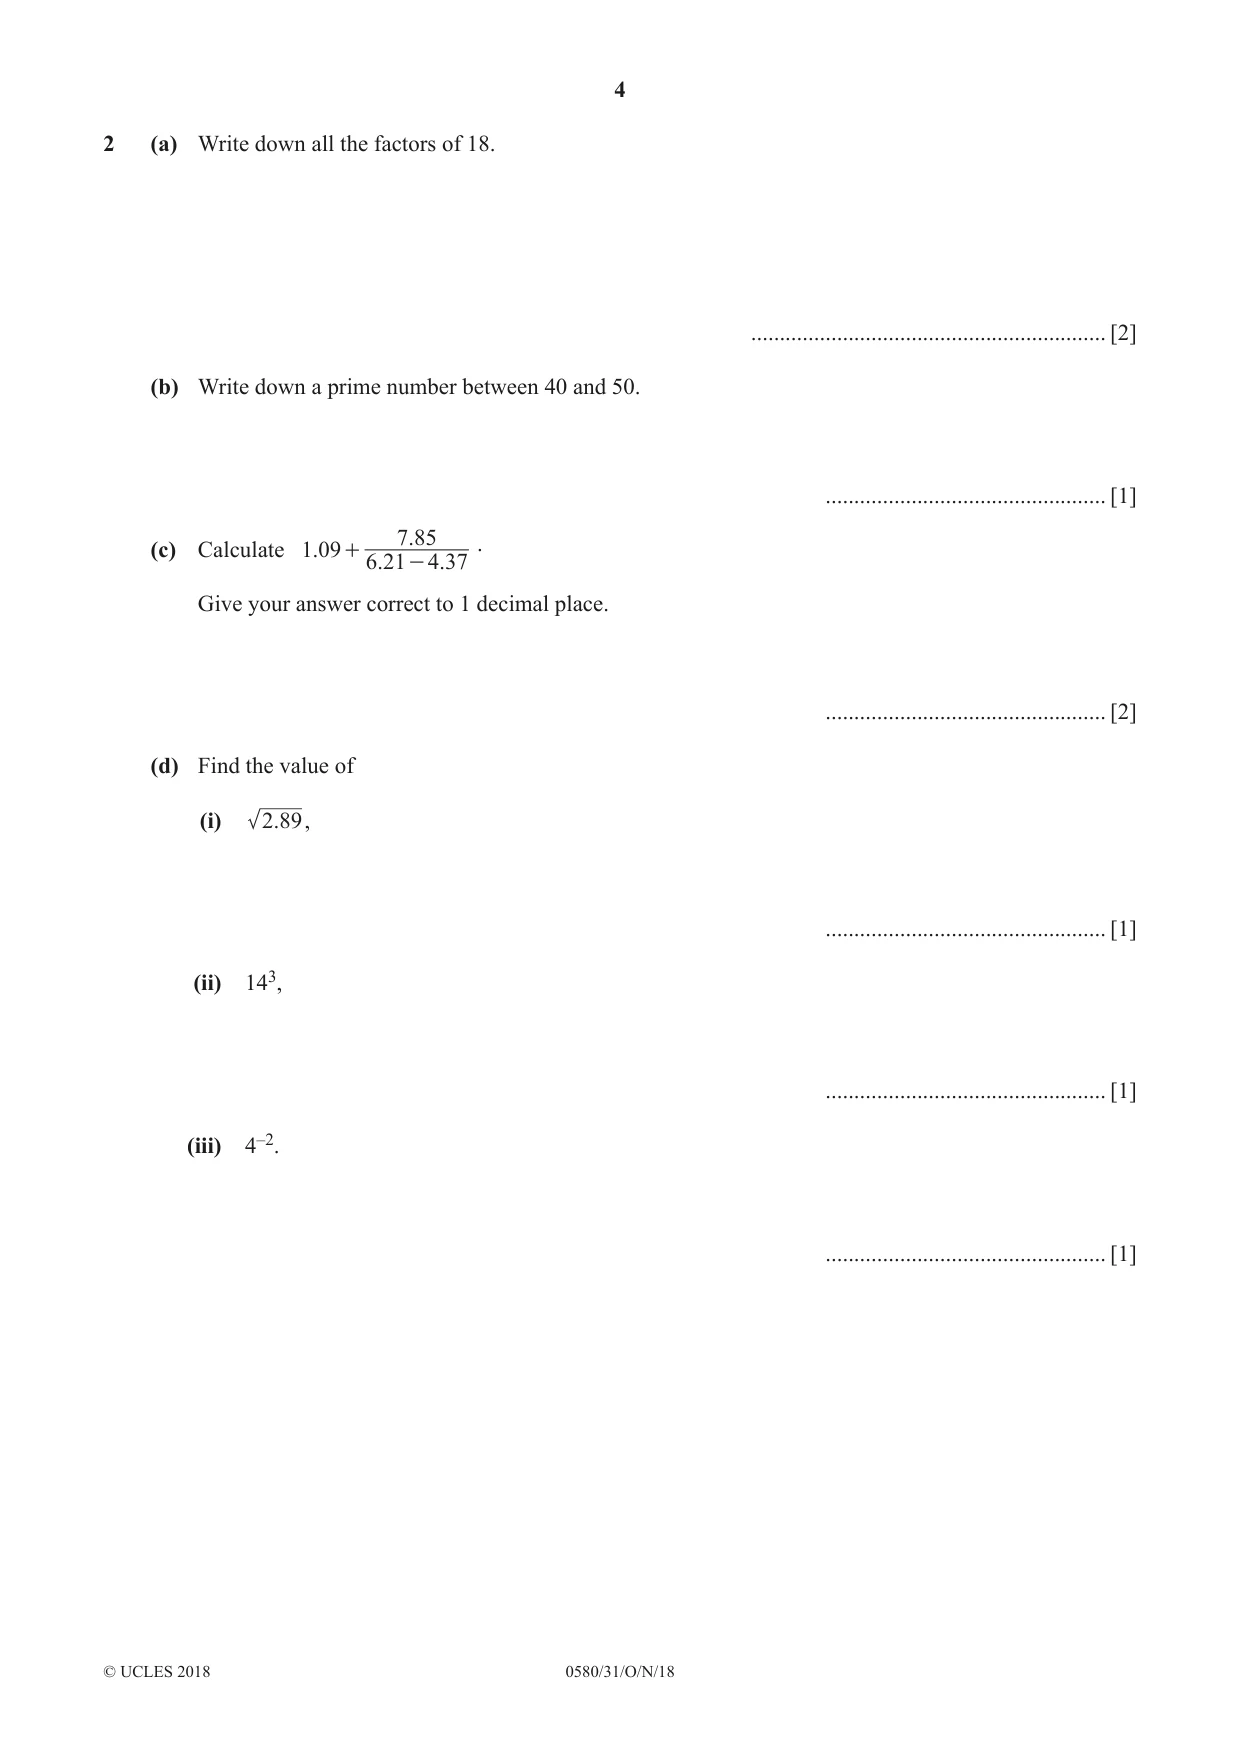
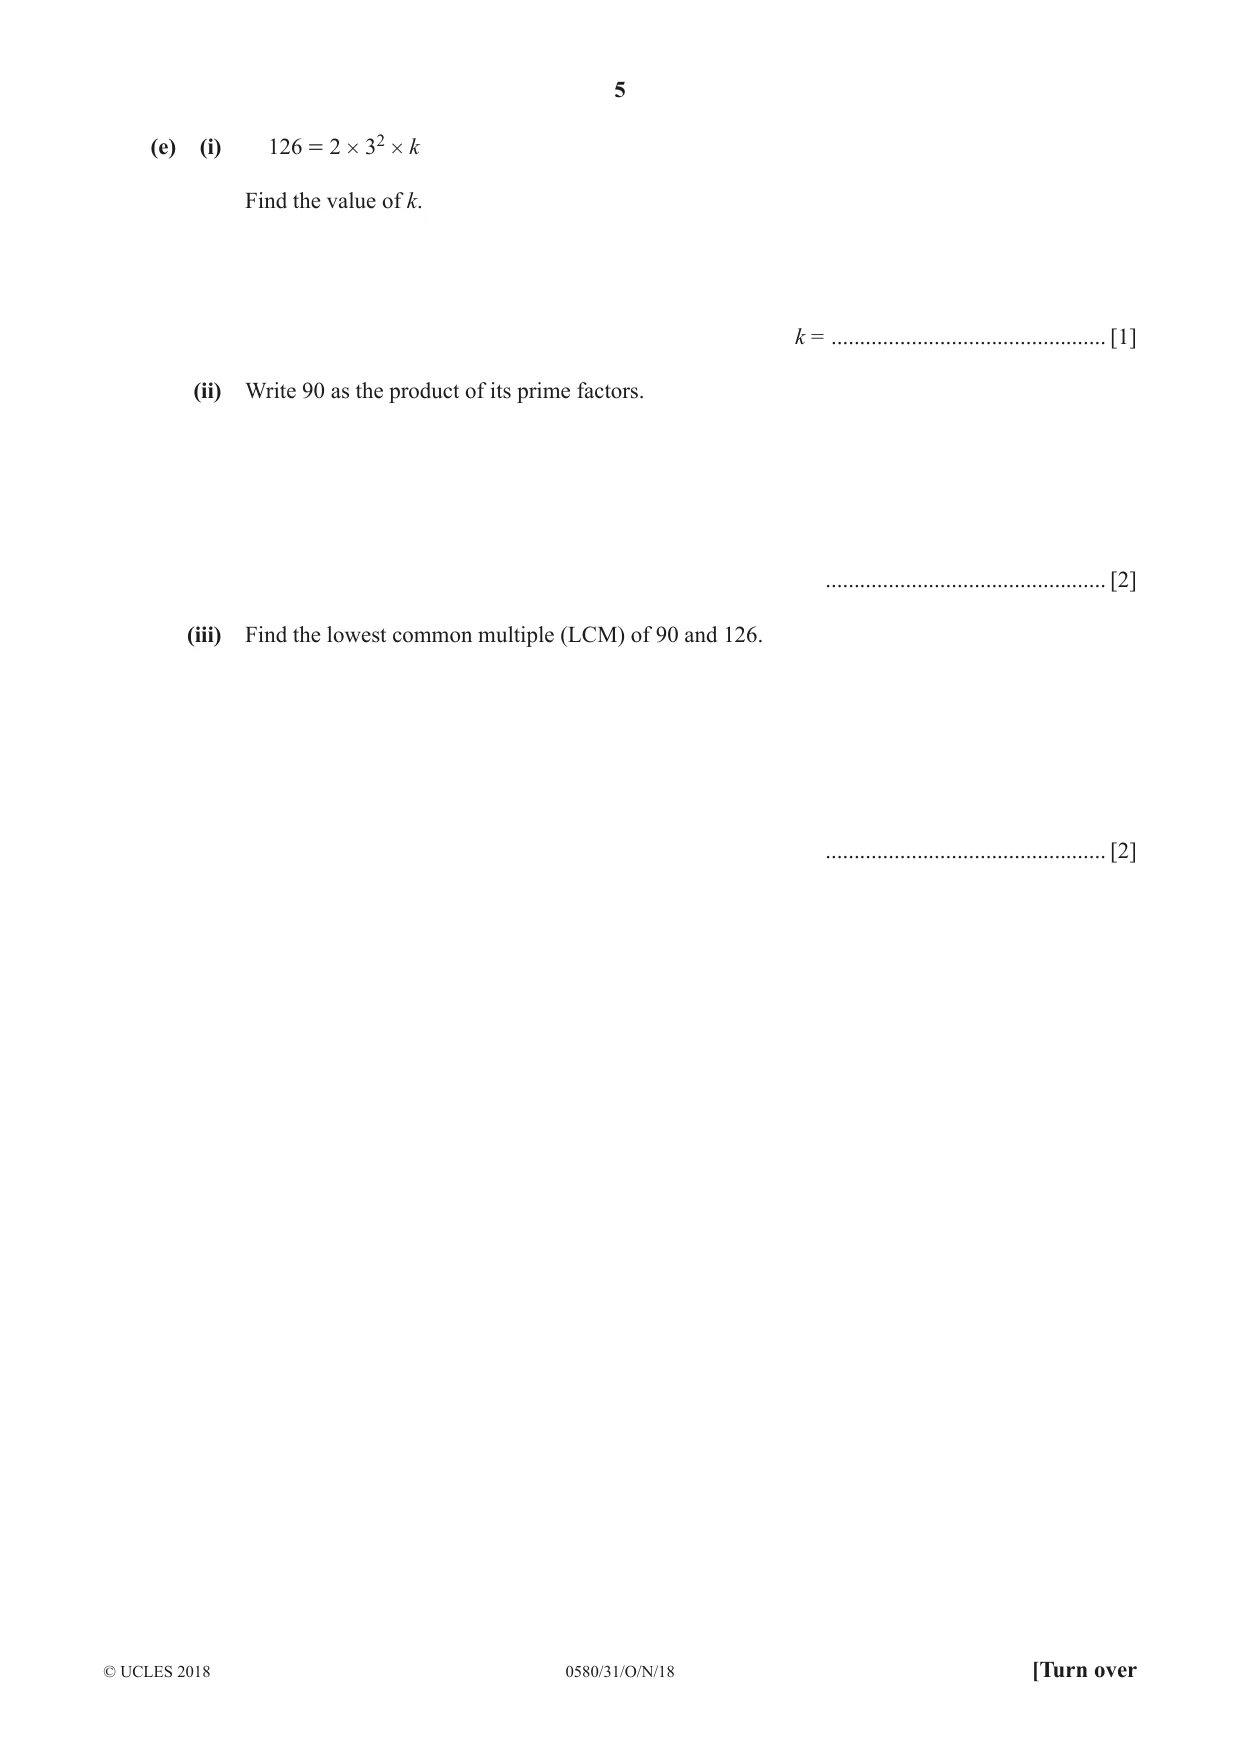
2 (a) Write down all the factors of 18. .............................................................. [2] (b) Write down a prime number between 40 and 50. ................................................. [1] 7. 85 . (c) Calculate 1.09 + 6.21 - 4.37 Give your answer correct to 1 decimal place. ................................................. [2] (d) Find the value of (i) .2 89, ................................................. [1] (ii) 143, ................................................. [1] (iii) 4–2. ................................................. [1] (e) (i) 126 = 2 # 32 # k Find the value of k. k = ................................................ [1] (ii) Write 90 as the product of its prime factors. ................................................. [2] (iii) Find the lowest common multiple (LCM) of 90 and 126. ................................................. [2]
Mark scheme: 2(a) 1, 2, 3, 6, 9, 18 2 B1 for four or more correct and no extras or six correct and one extra 2(b) 41 or 43 or 47 1 2(c) 5.4 2 B1 for 5.35[6…] or 5.36 2(d)(i) 1.7 1 2(d)(ii) 2744 1 2(d)(iii) 1 1 0.0625 or 16 2(e)(i) 7 1 2(e)(ii) 2 × 32 × 5 or 2 × 3 × 3 × 5 2 M1 for a complete factor tree or 2, 3, 3, 5 clearly identified as factors or B1 for a correct product that equals 90 2(e)(iii) 630 2 B1 for 630k, where k ⩾ 2 or for list of multiples of 90 and 126 to at least 630
Q3 · The table gives some information about the numbers of visitors at a leisure centre one day
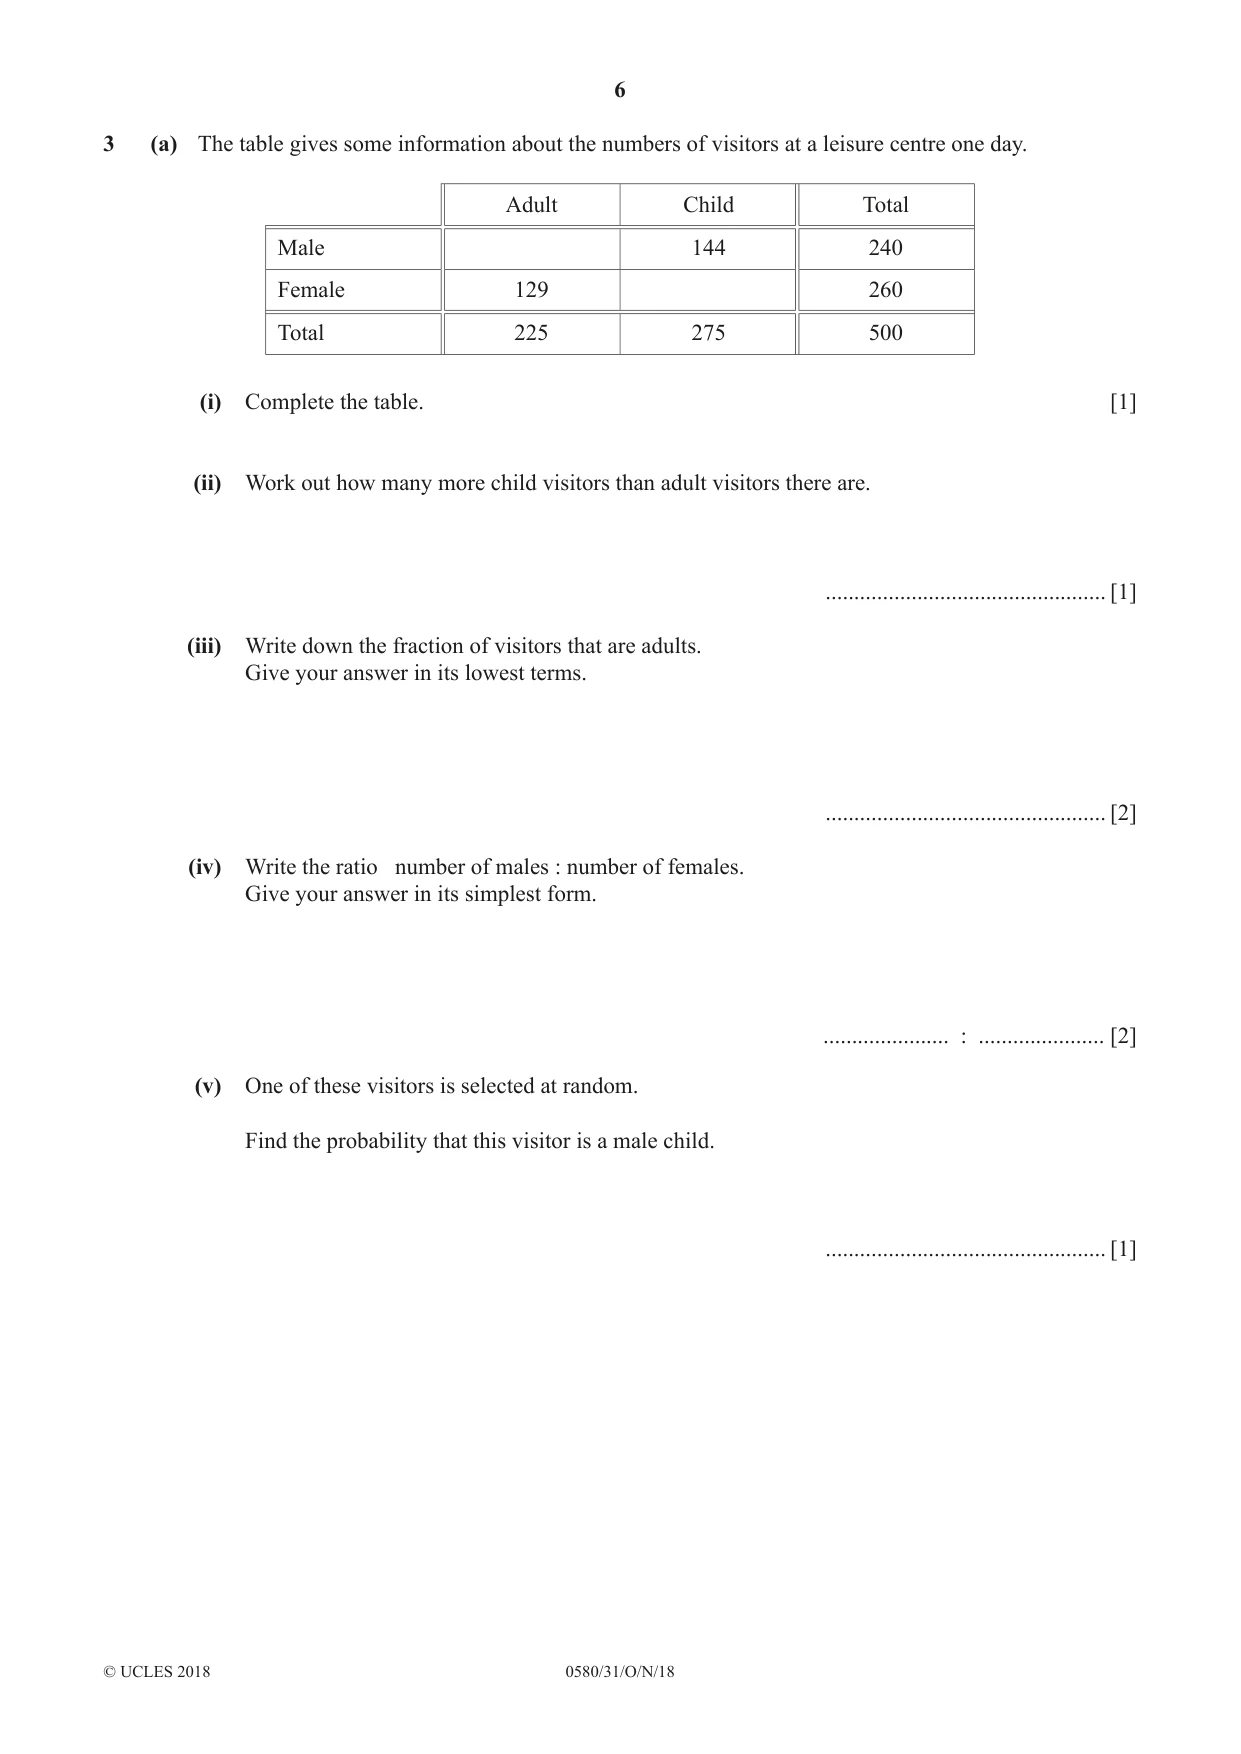
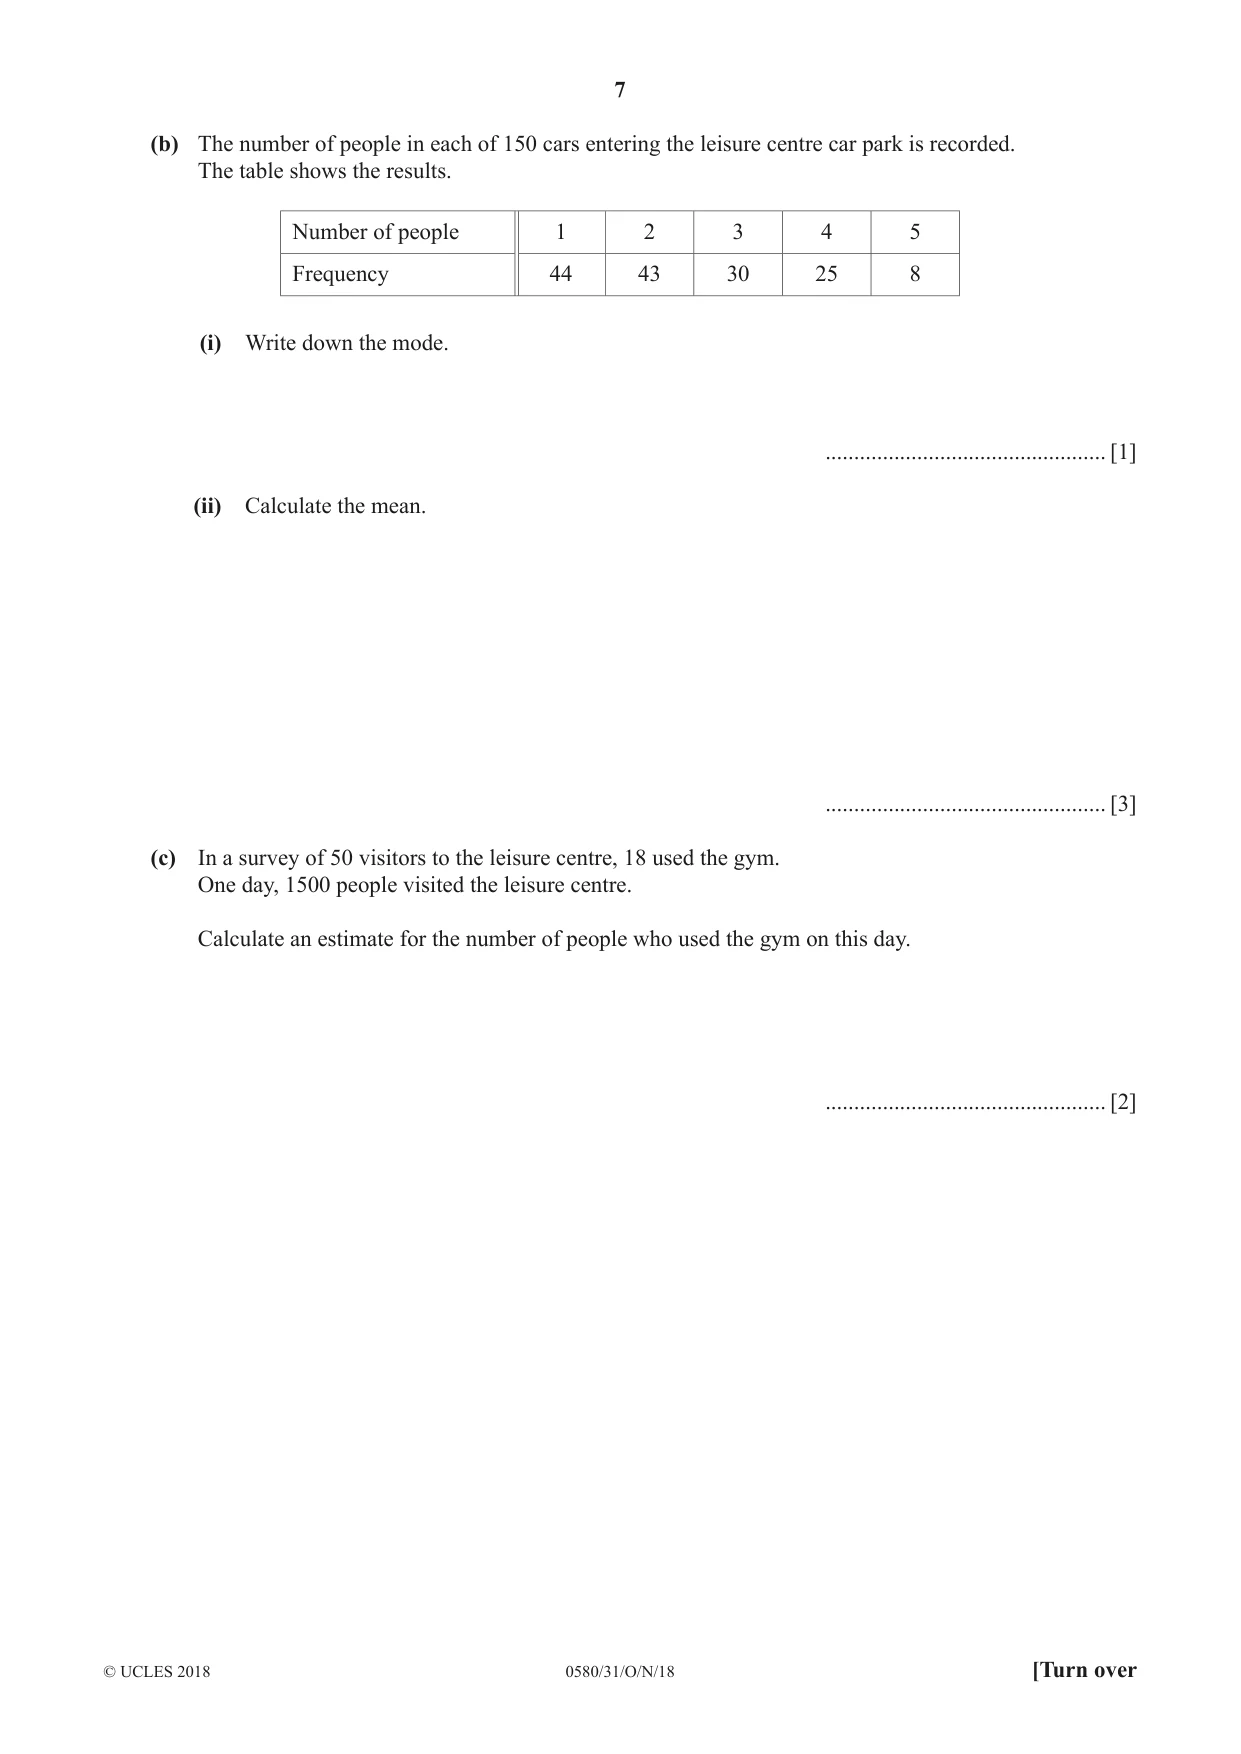
3 (a) The table gives some information about the numbers of visitors at a leisure centre one day. Adult Child Total Male 144 240 Female 129 260 Total 225 275 500 (i) Complete the table. [1] (ii) Work out how many more child visitors than adult visitors there are. ................................................. [1] (iii) Write down the fraction of visitors that are adults. Give your answer in its lowest terms. ................................................. [2] (iv) Write the ratio number of males : number of females. Give your answer in its simplest form. ...................... : ...................... [2] (v) One of these visitors is selected at random. Find the probability that this visitor is a male child. ................................................. [1] (b) The number of people in each of 150 cars entering the leisure centre car park is recorded. The table shows the results. Number of people 1 2 3 4 5 Frequency 44 43 30 25 8 (i) Write down the mode. ................................................. [1] (ii) Calculate the mean. ................................................. [3] (c) In a survey of 50 visitors to the leisure centre, 18 used the gym. One day, 1500 people visited the leisure centre. Calculate an estimate for the number of people who used the gym on this day. ................................................. [2]
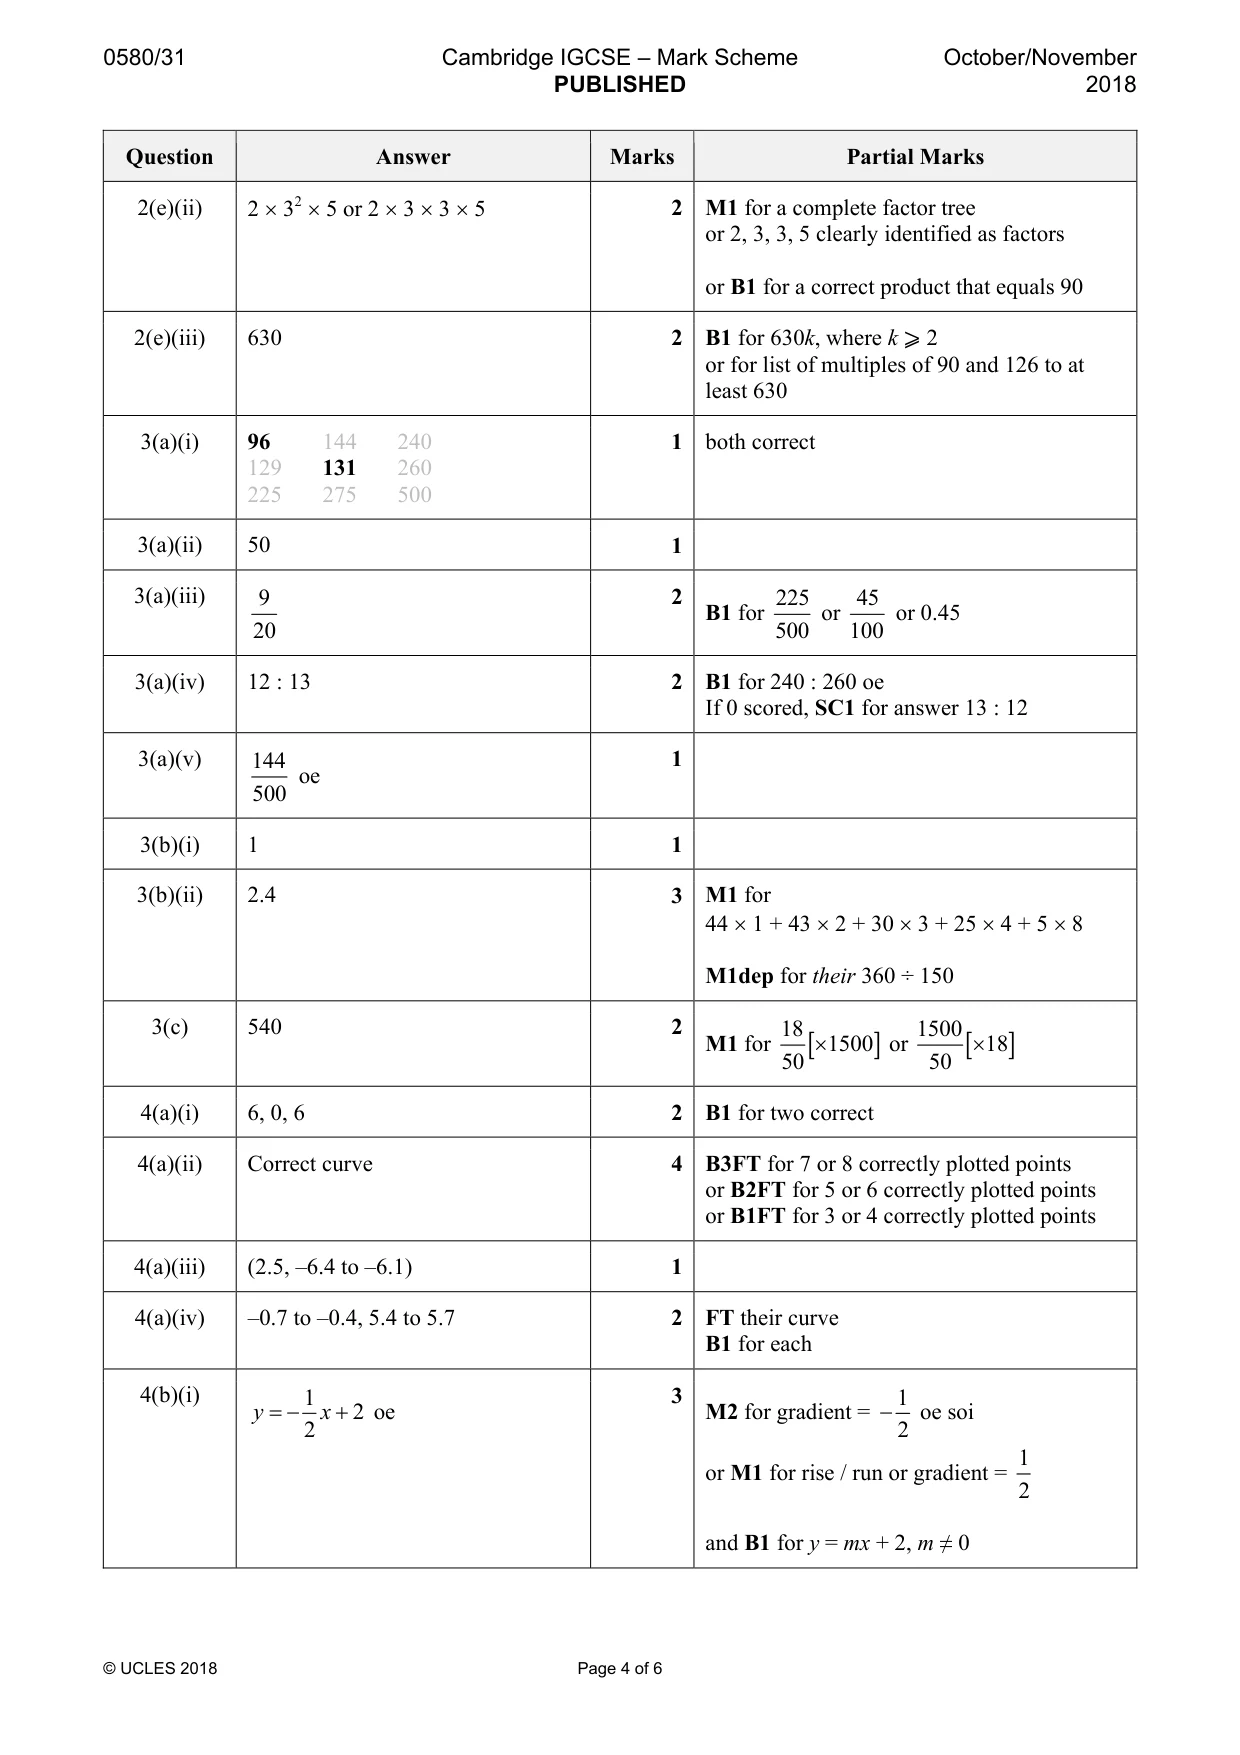
Mark scheme: 3(a)(i) 96 144 240 1 both correct 129 131 260 225 275 500 3(a)(ii) 50 1 3(a)(iii) 9 2 225 45 B1 for or or 0.45 20 500 100 3(a)(iv) 12 : 13 2 B1 for 240 : 260 oe If 0 scored, SC1 for answer 13 : 12 3(a)(v) 144 1 oe 500 3(b)(i) 1 1 3(b)(ii) 2.4 3 M1 for 44 × 1 + 43 × 2 + 30 × 3 + 25 × 4 + 5 × 8 M1dep for their 360 ÷ 150 3(c) 540 2 18 1500 M1 for [× 1500 ] or [× 18] 50 50
Q4 · Complete the table of values for y = x 2 - 5x
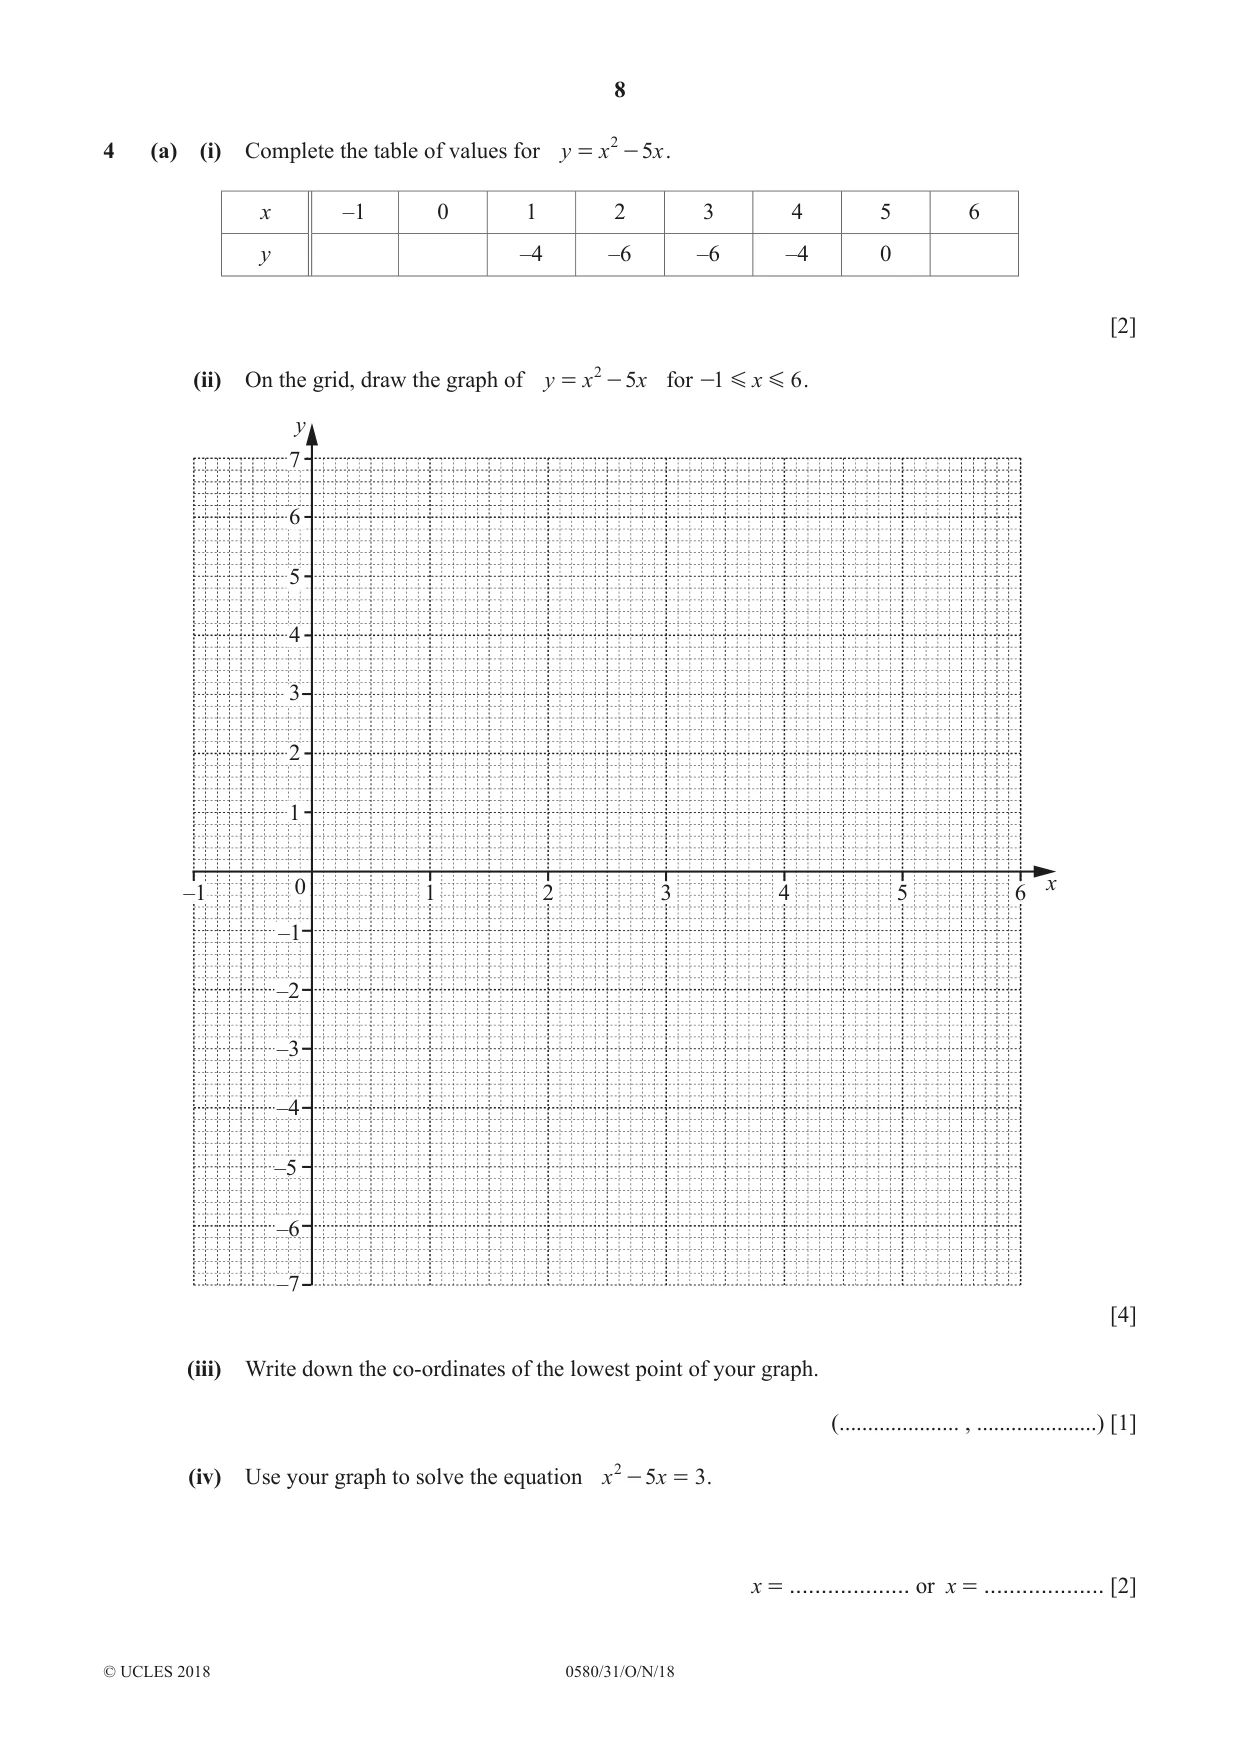
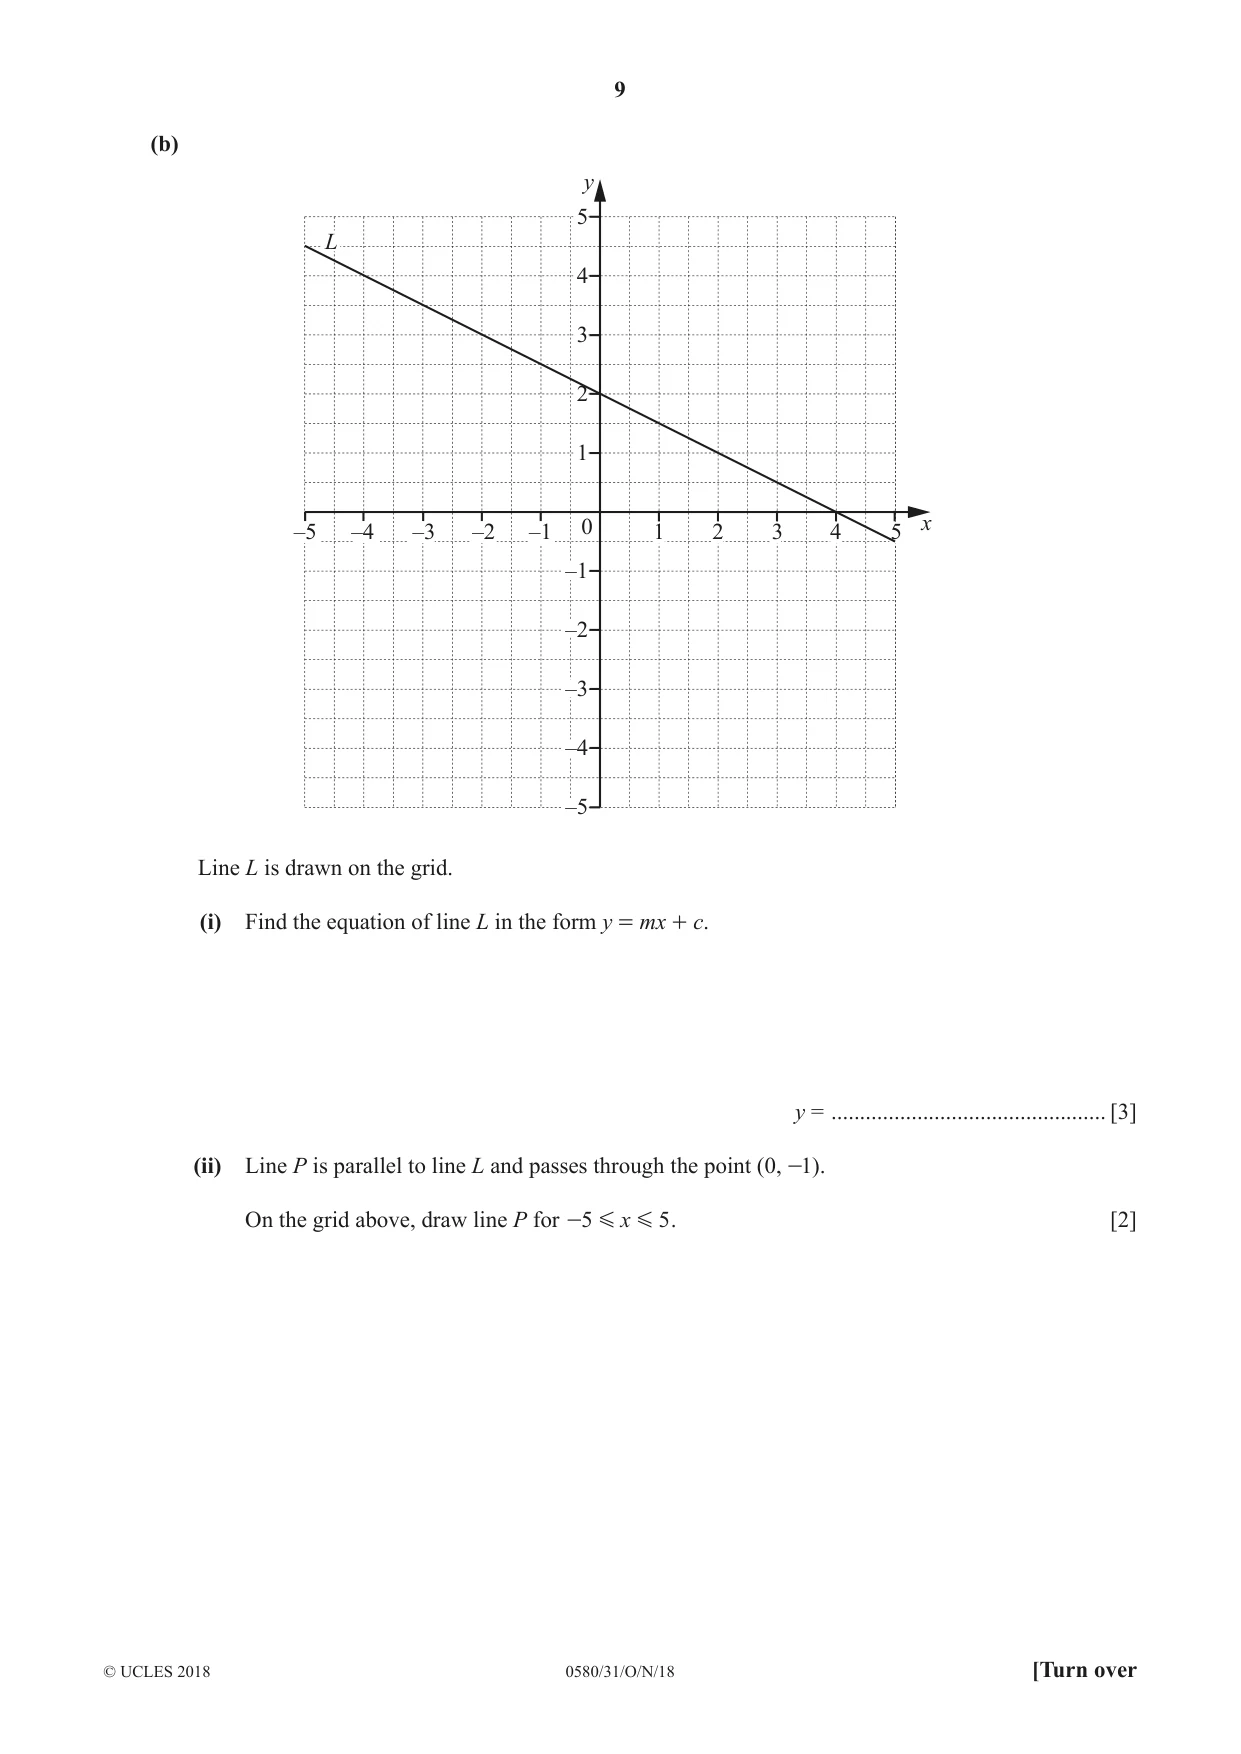
4 (a) (i) Complete the table of values for y = x 2 - 5x . x –1 0 1 2 3 4 5 6 y –4 –6 –6 –4 0 [2] (ii) On the grid, draw the graph of y = x 2 - 5x for -1 G x G 6 . y 7 6 5 4 3 2 1 0 x –1 1 2 3 4 5 6 –1 –2 –3 –4 –5 –6 –7 [4] (iii) Write down the co-ordinates of the lowest point of your graph. (..................... , .....................) [1] (iv) Use your graph to solve the equation x 2 - 5x = 3 . x = ................... or x = ................... [2] (b) y 5 L 4 3 2 1 –5 –4 –3 –2 –1 0 1 2 3 4 5 x –1 –2 –3 –4 –5 Line L is drawn on the grid. (i) Find the equation of line L in the form y = mx + c. y = ................................................ [3] (ii) Line P is parallel to line L and passes through the point (0, -1). On the grid above, draw line P for -5 G x G 5 . [2]
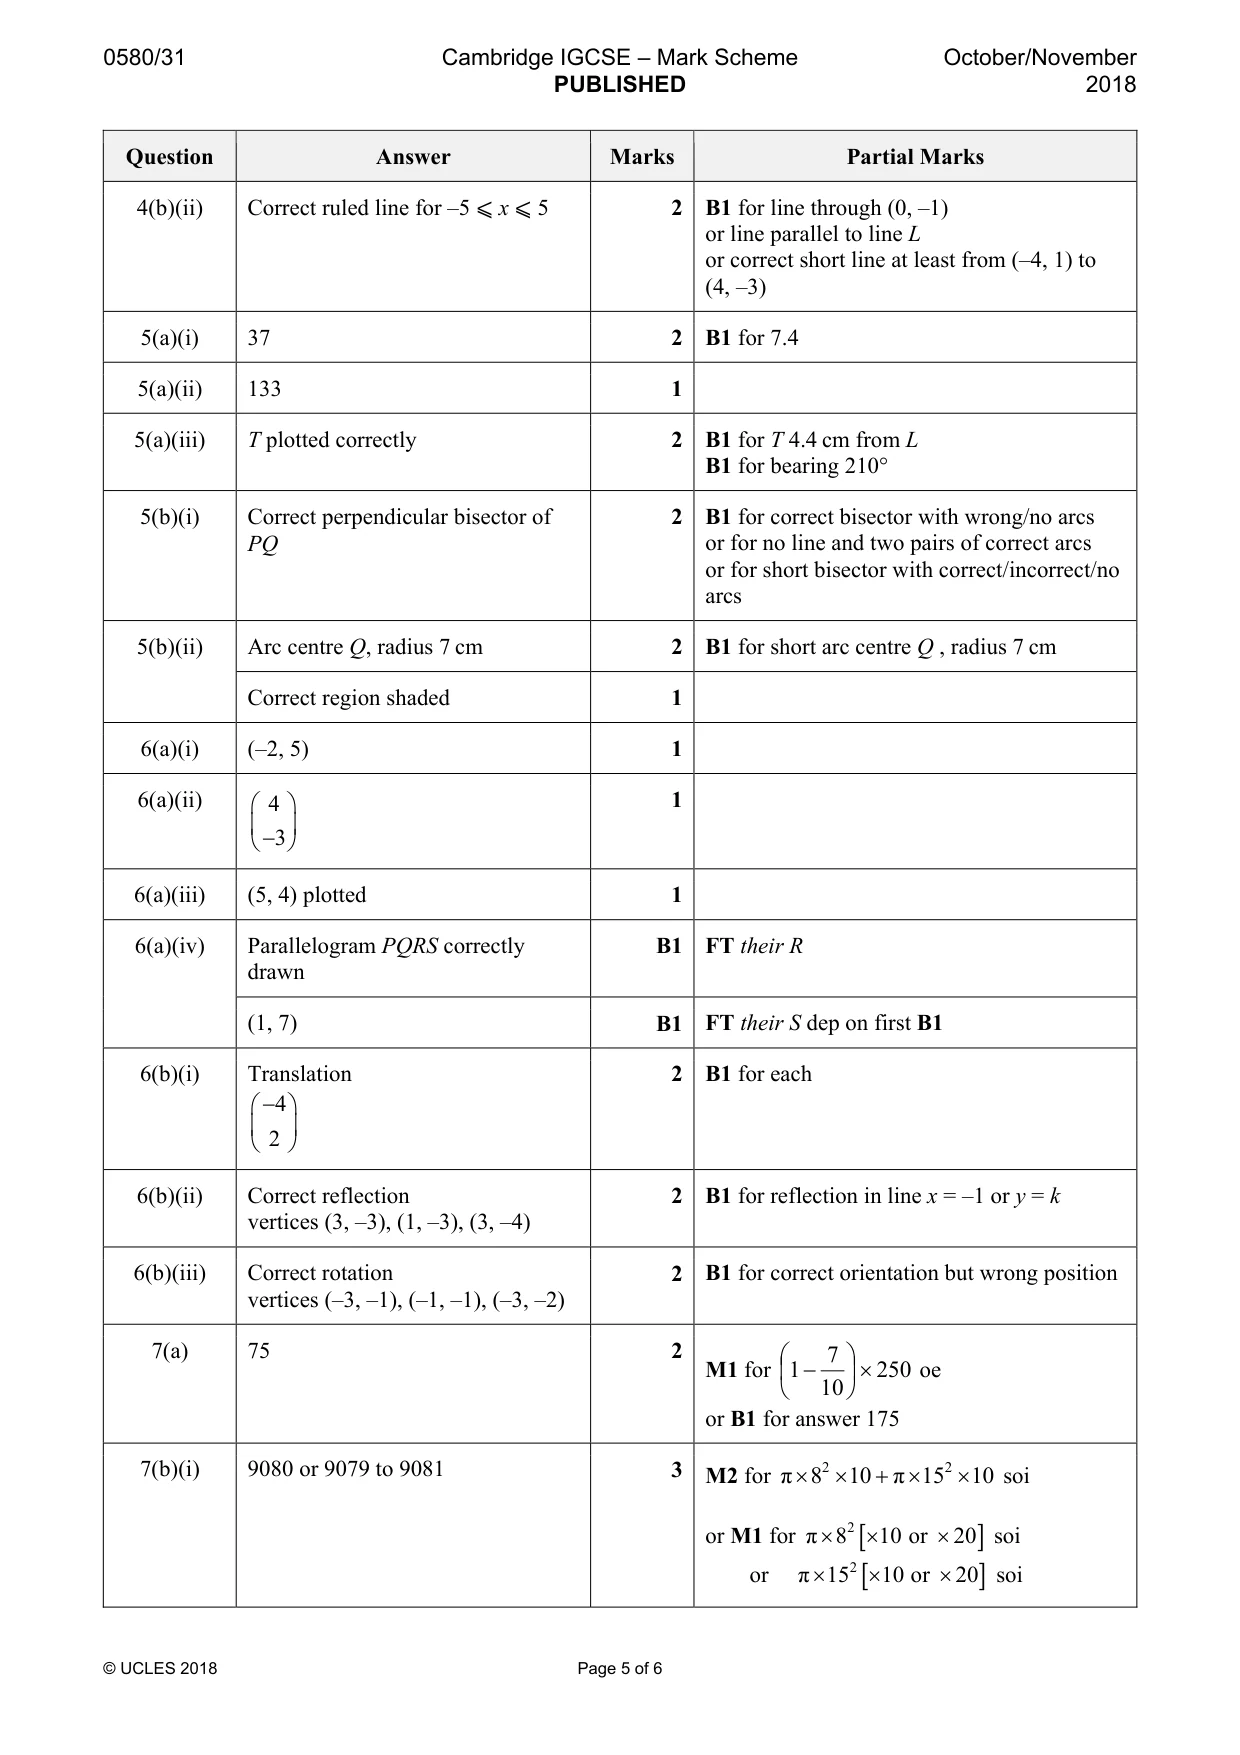
Mark scheme: 4(a)(i) 6, 0, 6 2 B1 for two correct 4(a)(ii) Correct curve 4 B3FT for 7 or 8 correctly plotted points or B2FT for 5 or 6 correctly plotted points or B1FT for 3 or 4 correctly plotted points 4(a)(iii) (2.5, –6.4 to –6.1) 1 4(a)(iv) –0.7 to –0.4, 5.4 to 5.7 2 FT their curve B1 for each 4(b)(i) 1 3 1 y = − x + 2 oe M2 for gradient = − oe soi 2 2 1 or M1 for rise / run or gradient = 2 and B1 for y = mx + 2, m ≠ 0 4(b)(ii) Correct ruled line for –5 ⩽ x ⩽ 5 2 B1 for line through (0, –1) or line parallel to line L or correct short line at least from (–4, 1) to (4, –3)
Q5 · The scale drawing shows the positions of a lighthouse L and a ship S
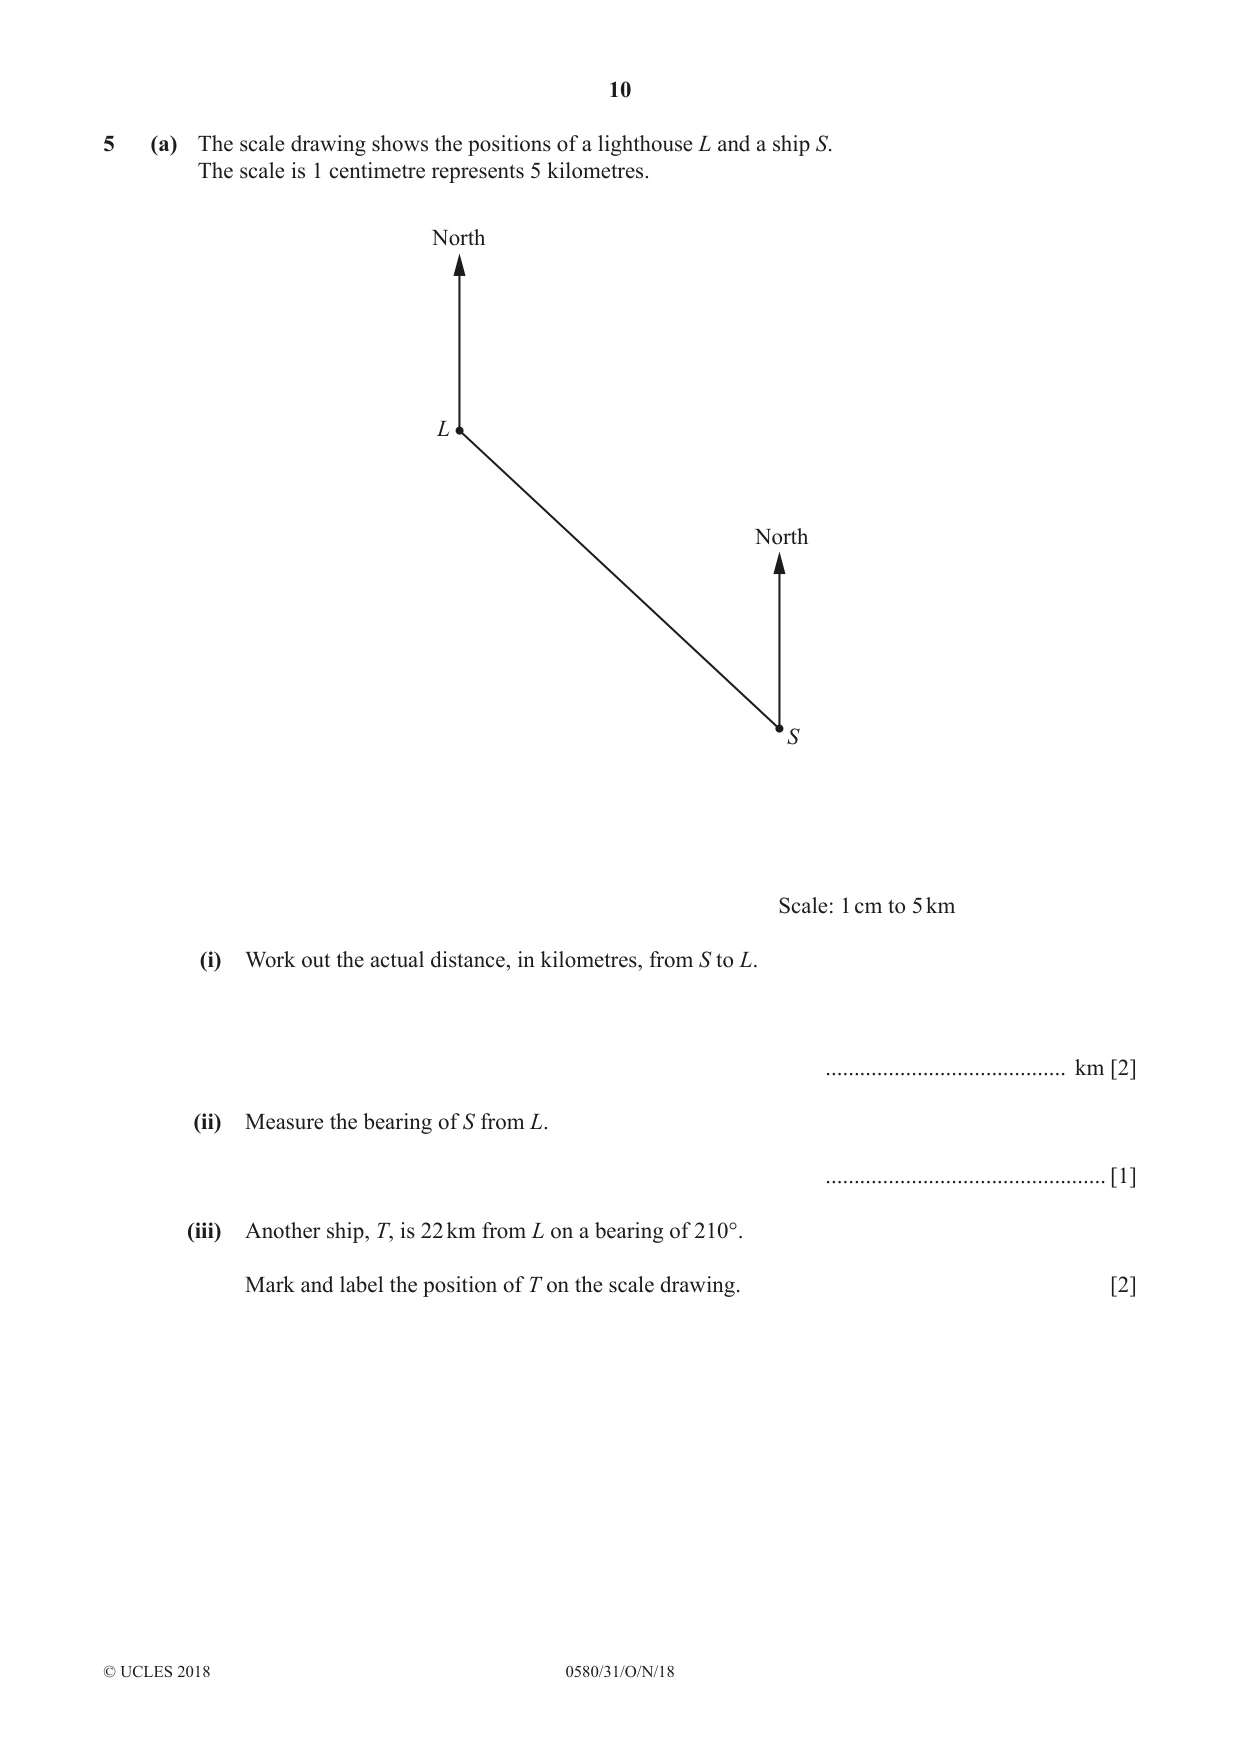
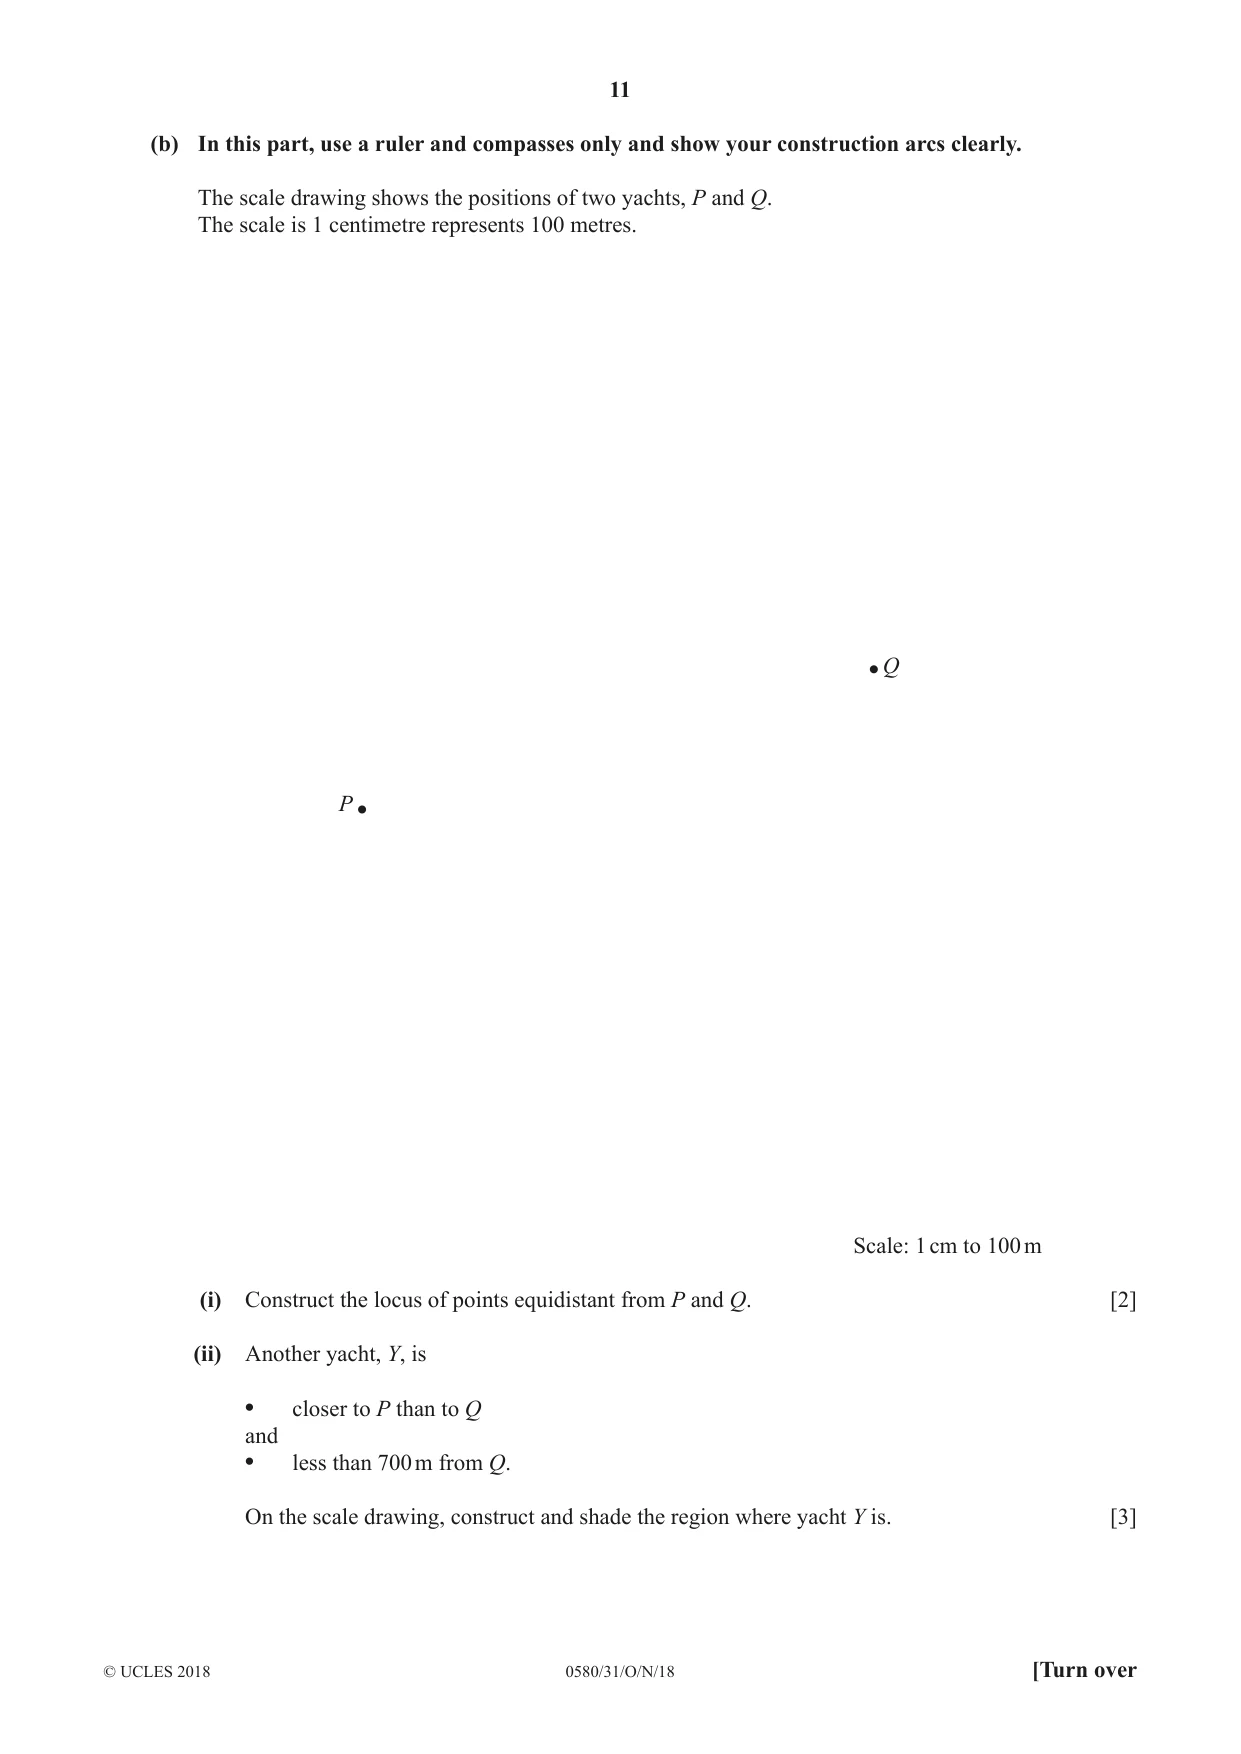
5 (a) The scale drawing shows the positions of a lighthouse L and a ship S. The scale is 1 centimetre represents 5 kilometres. North L North S Scale: 1 cm to 5 km (i) Work out the actual distance, in kilometres, from S to L. .......................................... km [2] (ii) Measure the bearing of S from L. ................................................. [1] (iii) Another ship, T, is 22 km from L on a bearing of 210°. Mark and label the position of T on the scale drawing. [2] (b) In this part, use a ruler and compasses only and show your construction arcs clearly. The scale drawing shows the positions of two yachts, P and Q. The scale is 1 centimetre represents 100 metres. Q P Scale: 1 cm to 100 m (i) Construct the locus of points equidistant from P and Q. [2] (ii) Another yacht, Y, is • closer to P than to Q and • less than 700 m from Q. On the scale drawing, construct and shade the region where yacht Y is. [3]
Mark scheme: 5(a)(i) 37 2 B1 for 7.4 5(a)(ii) 133 1 5(a)(iii) T plotted correctly 2 B1 for T 4.4 cm from L B1 for bearing 210° 5(b)(i) Correct perpendicular bisector of 2 B1 for correct bisector with wrong/no arcs PQ or for no line and two pairs of correct arcs or for short bisector with correct/incorrect/no arcs 5(b)(ii) Arc centre Q, radius 7 cm 2 B1 for short arc centre Q , radius 7 cm Correct region shaded 1
Q6 · Y 8 7 6 P 5 4 3 2 Q 1 x –4 –3 –2 –1 0 1 2 3 4 5 6 (i) Write down the co-ordinates of…
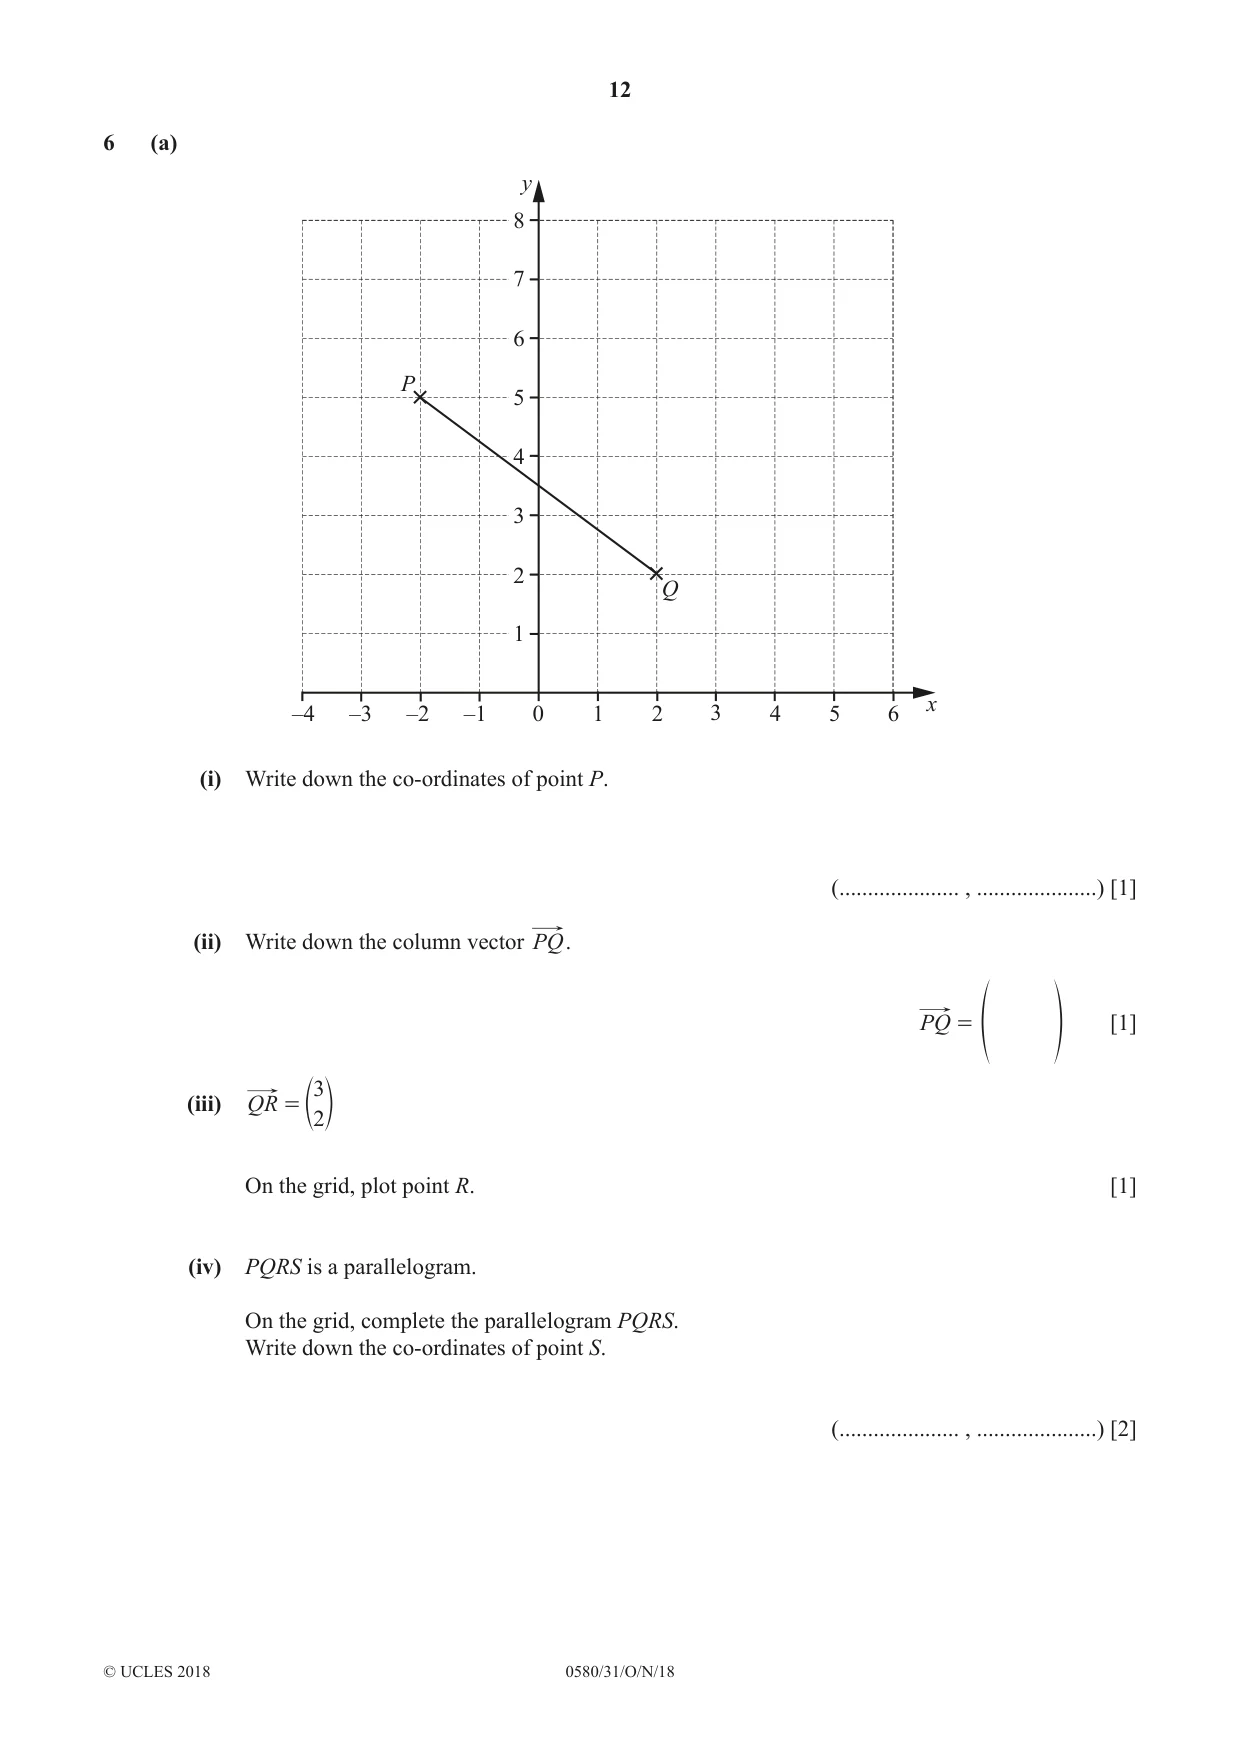
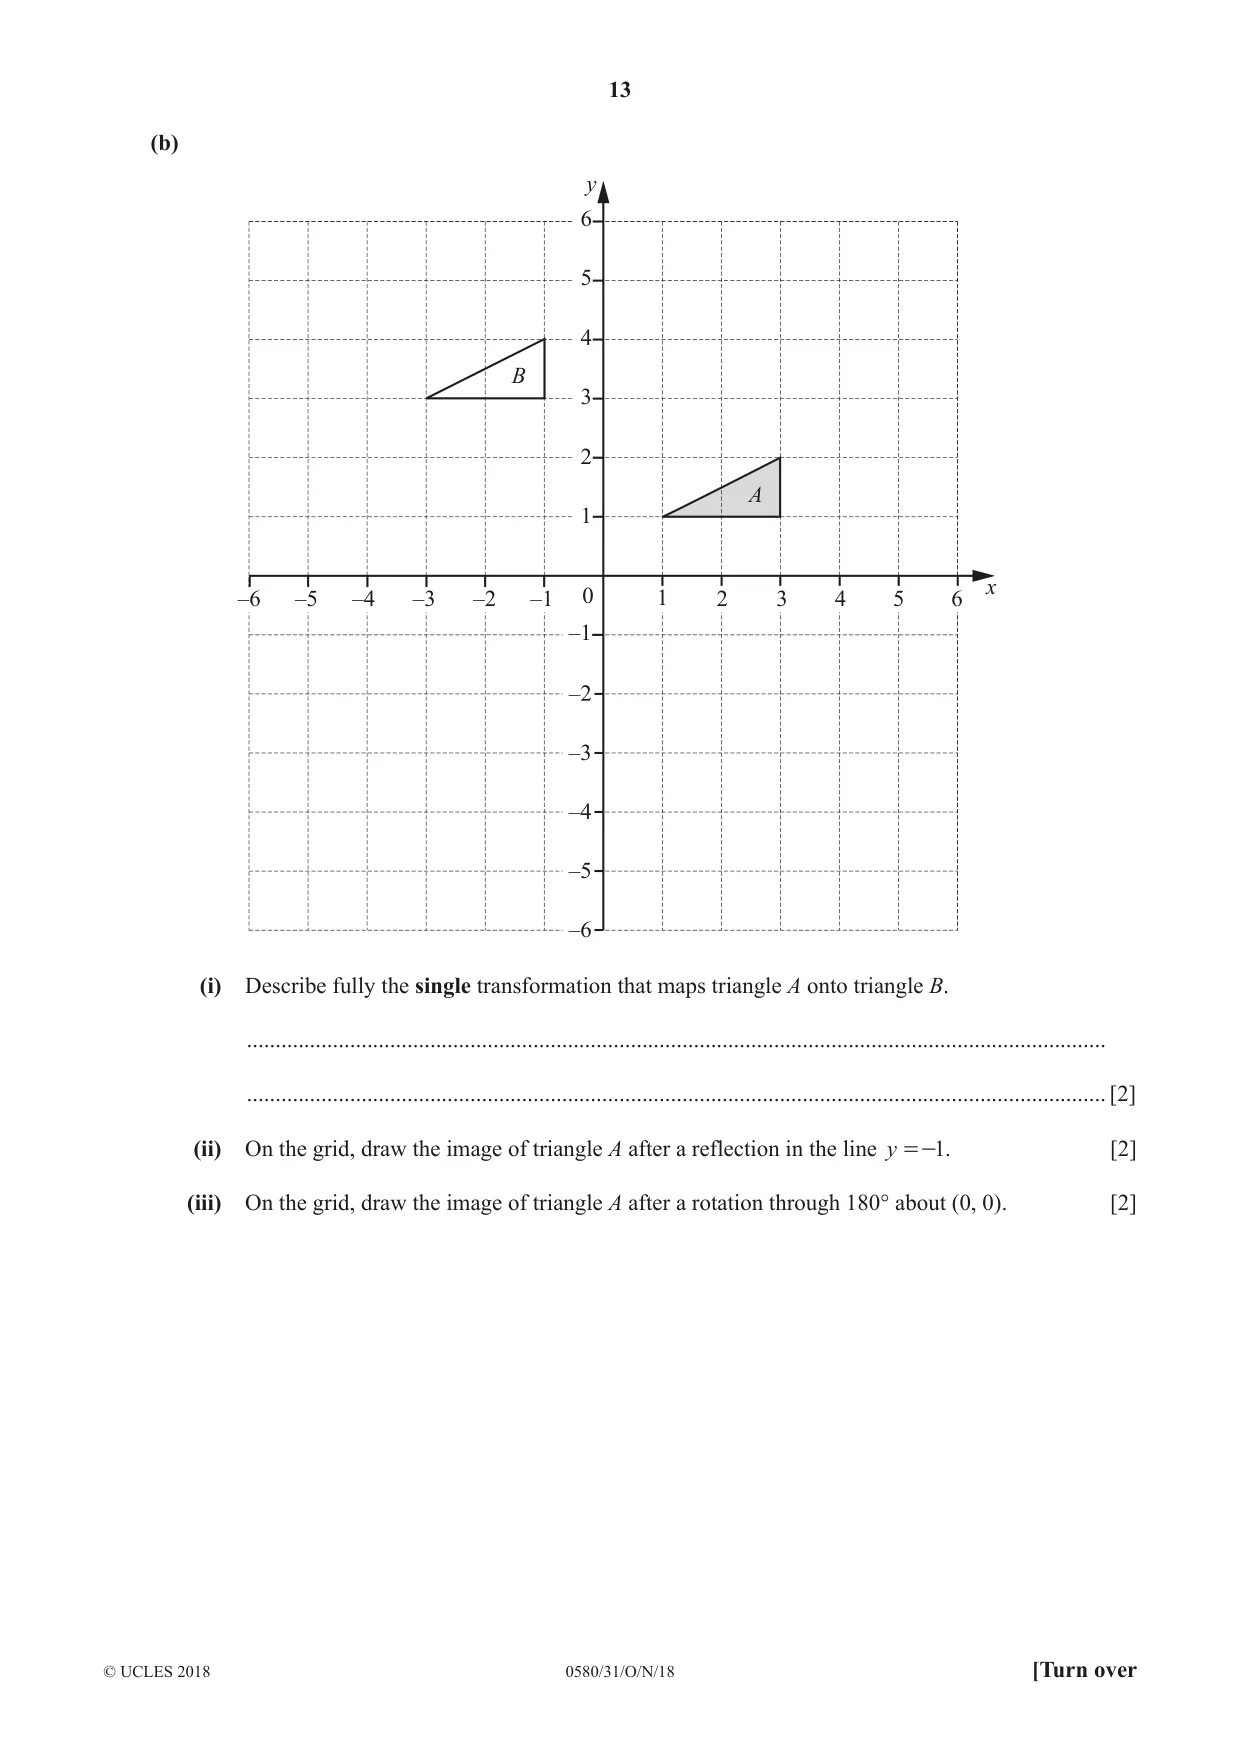
6 (a) y 8 7 6 P 5 4 3 2 Q 1 x –4 –3 –2 –1 0 1 2 3 4 5 6 (i) Write down the co-ordinates of point P. (..................... , .....................) [1] (ii) Write down the column vector PQ. PQ = [1] f p 3 (iii) QR = e2o On the grid, plot point R. [1] (iv) PQRS is a parallelogram. On the grid, complete the parallelogram PQRS. Write down the co-ordinates of point S. (..................... , .....................) [2] (b) y 6 5 4 B 3 2 A 1 x –6 –5 –4 –3 –2 –1 0 1 2 3 4 5 6 –1 –2 –3 –4 –5 –6 (i) Describe fully the single transformation that maps triangle A onto triangle B. ...................................................................................................................................................... ...................................................................................................................................................... [2] (ii) On the grid, draw the image of triangle A after a reflection in the line y =-1. [2] (iii) On the grid, draw the image of triangle A after a rotation through 180° about (0, 0). [2]
Mark scheme: 6(a)(i) (–2, 5) 1 6(a)(ii) 4 1 −3 6(a)(iii) (5, 4) plotted 1 6(a)(iv) Parallelogram PQRS correctly B1 FT their R drawn (1, 7) B1 FT their S dep on first B1 6(b)(i) Translation 2 B1 for each −4 2 6(b)(ii) Correct reflection 2 B1 for reflection in line x = –1 or y = k vertices (3, –3), (1, –3), (3, –4) 6(b)(iii) Correct rotation 2 B1 for correct orientation but wrong position vertices (–3, –1), (–1, –1), (–3, –2)
Q7 · Nora makes a birthday cake
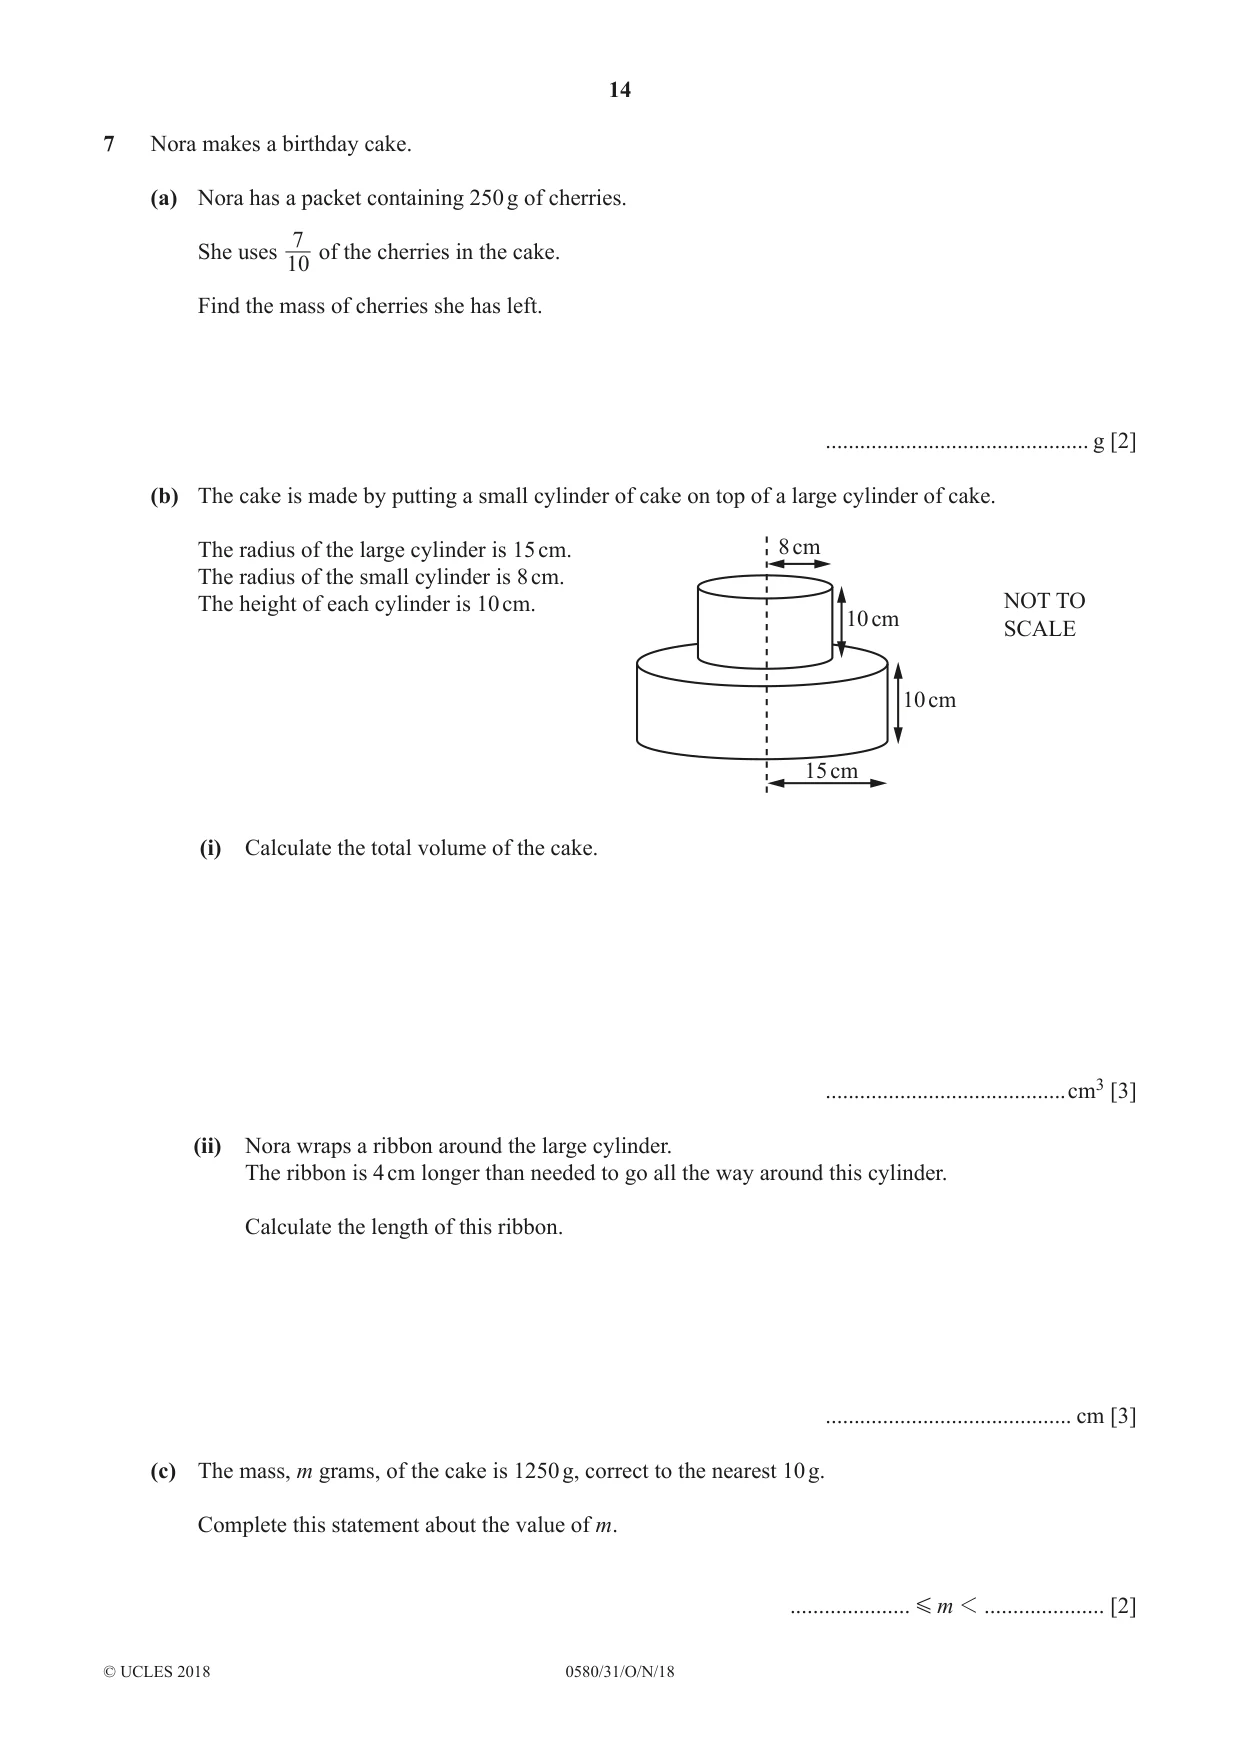
7 Nora makes a birthday cake. (a) Nora has a packet containing 250 g of cherries. 7 She uses of the cherries in the cake. 10 Find the mass of cherries she has left. .............................................. g [2] (b) The cake is made by putting a small cylinder of cake on top of a large cylinder of cake. The radius of the large cylinder is 15 cm. 8 cm The radius of the small cylinder is 8 cm. The height of each cylinder is 10 cm. NOT TO 10 cm SCALE 10 cm 15 cm (i) Calculate the total volume of the cake. ..........................................cm3 [3] (ii) Nora wraps a ribbon around the large cylinder. The ribbon is 4 cm longer than needed to go all the way around this cylinder. Calculate the length of this ribbon. ........................................... cm [3] (c) The mass, m grams, of the cake is 1250 g, correct to the nearest 10 g. Complete this statement about the value of m. ..................... G m 1 ..................... [2]
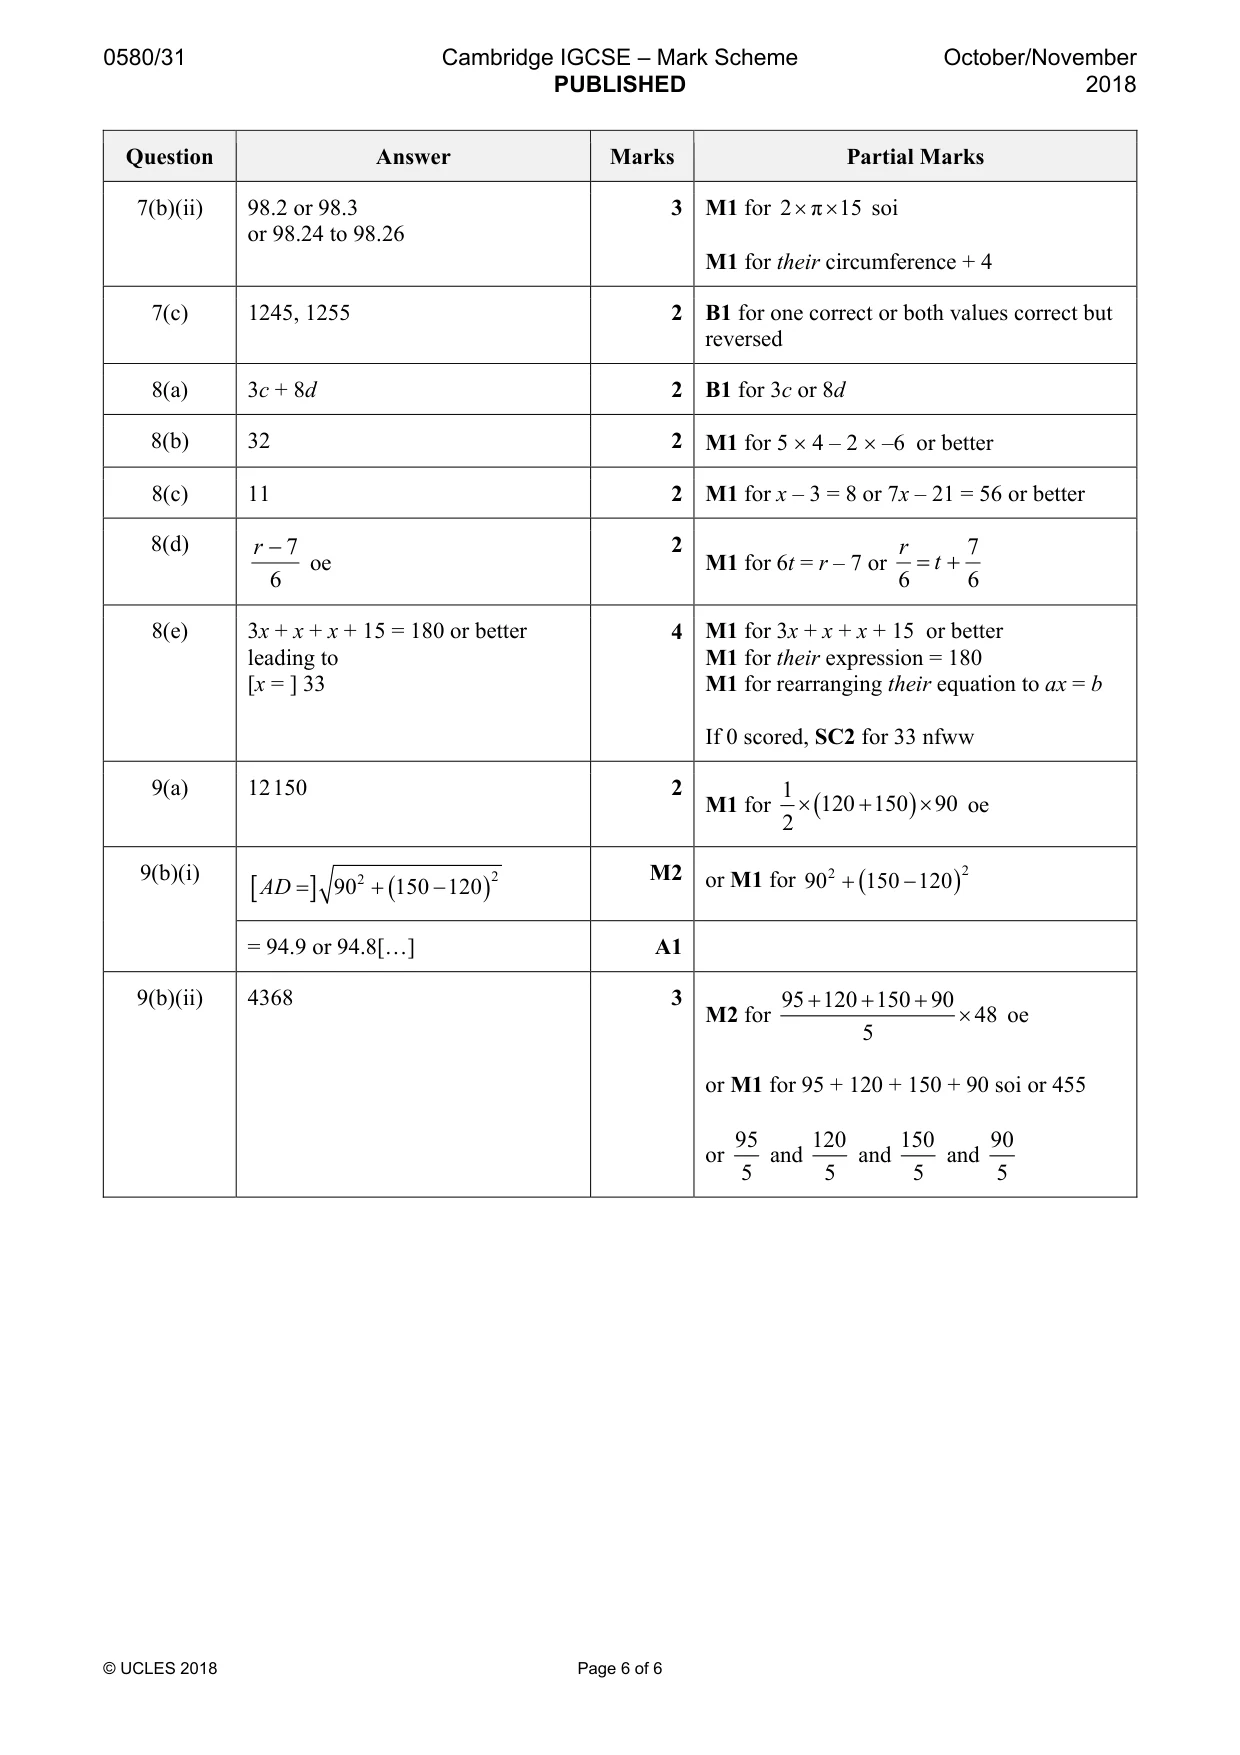
Mark scheme: 7(a) 75 2 7 M1 for − 1 × 250 oe 10 or B1 for answer 175 7(b)(i) 9080 or 9079 to 9081 3 M2 for π × 82 × 10 + π × 152 × 10 soi or M1 for π × 8 2 [× 10 or × 20 ] soi or π × 15 2 [× 10 or × 20 ] soi 7(b)(ii) 98.2 or 98.3 3 M1 for 2 × π × 15 soi or 98.24 to 98.26 M1 for their circumference + 4 7(c) 1245, 1255 2 B1 for one correct or both values correct but reversed
Question 8
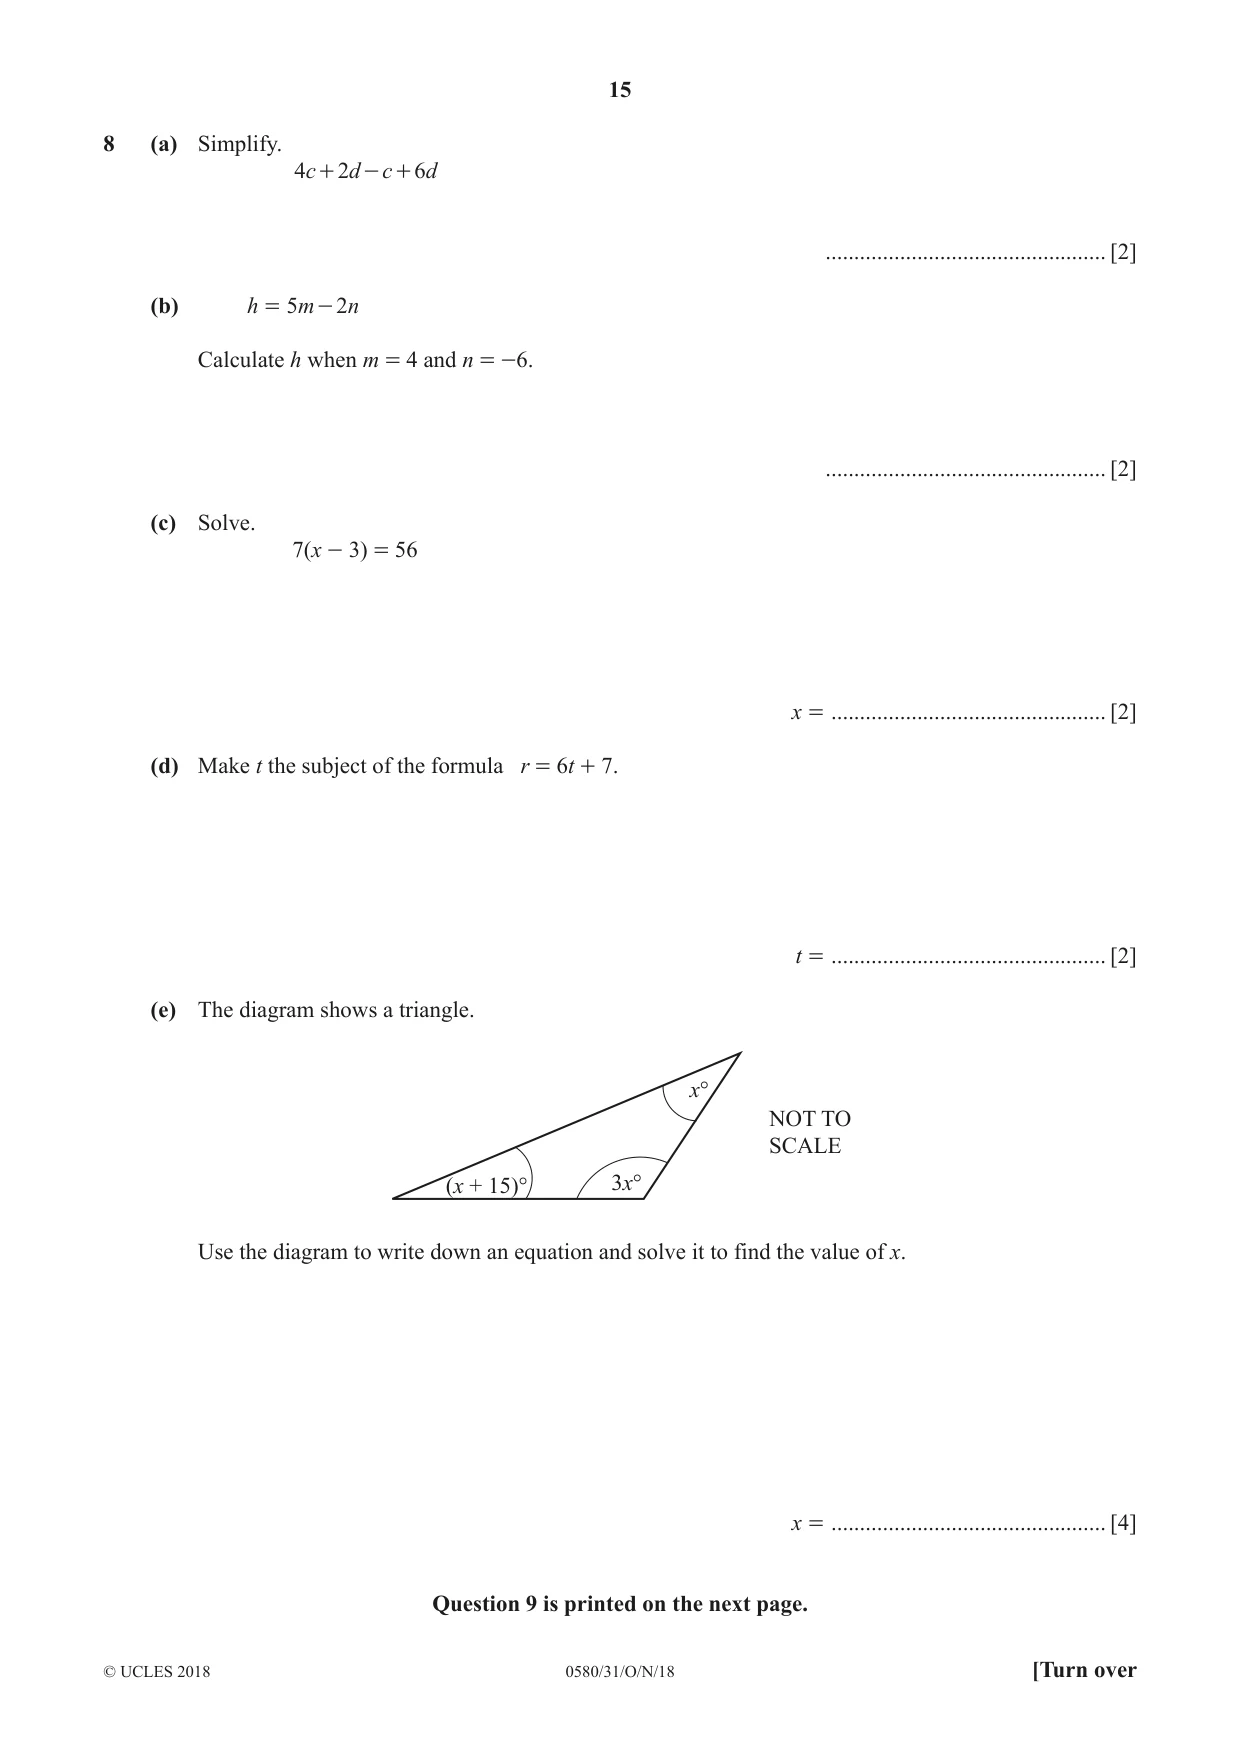
8 (a) Simplify. 4c + 2d - c + 6 d ................................................. [2] (b) h = 5m - 2n Calculate h when m = 4 and n = -6. ................................................. [2] (c) Solve. 7(x - 3) = 56 x = ................................................ [2] (d) Make t the subject of the formula r = 6t + 7. t = ................................................ [2] (e) The diagram shows a triangle. x° NOT TO SCALE (x + 15)° 3x° Use the diagram to write down an equation and solve it to find the value of x. x = ................................................ [4] Question 9 is printed on the next page.
Mark scheme: 8(a) 3c + 8d 2 B1 for 3c or 8d 8(b) 32 2 M1 for 5 × 4 – 2 × –6 or better 8(c) 11 2 M1 for x – 3 = 8 or 7x – 21 = 56 or better 8(d) r − 7 2 r 7 oe M1 for 6t = r – 7 or = t + 6 6 6 8(e) 3x + x + x + 15 = 180 or better 4 M1 for 3x + x + x + 15 or better leading to M1 for their expression = 180 [x = ] 33 M1 for rearranging their equation to ax = b If 0 scored, SC2 for 33 nfww
Q9 · 120 m D C NOT TO 90 m SCALE A B 150 m The diagram shows a field in the shape of a…
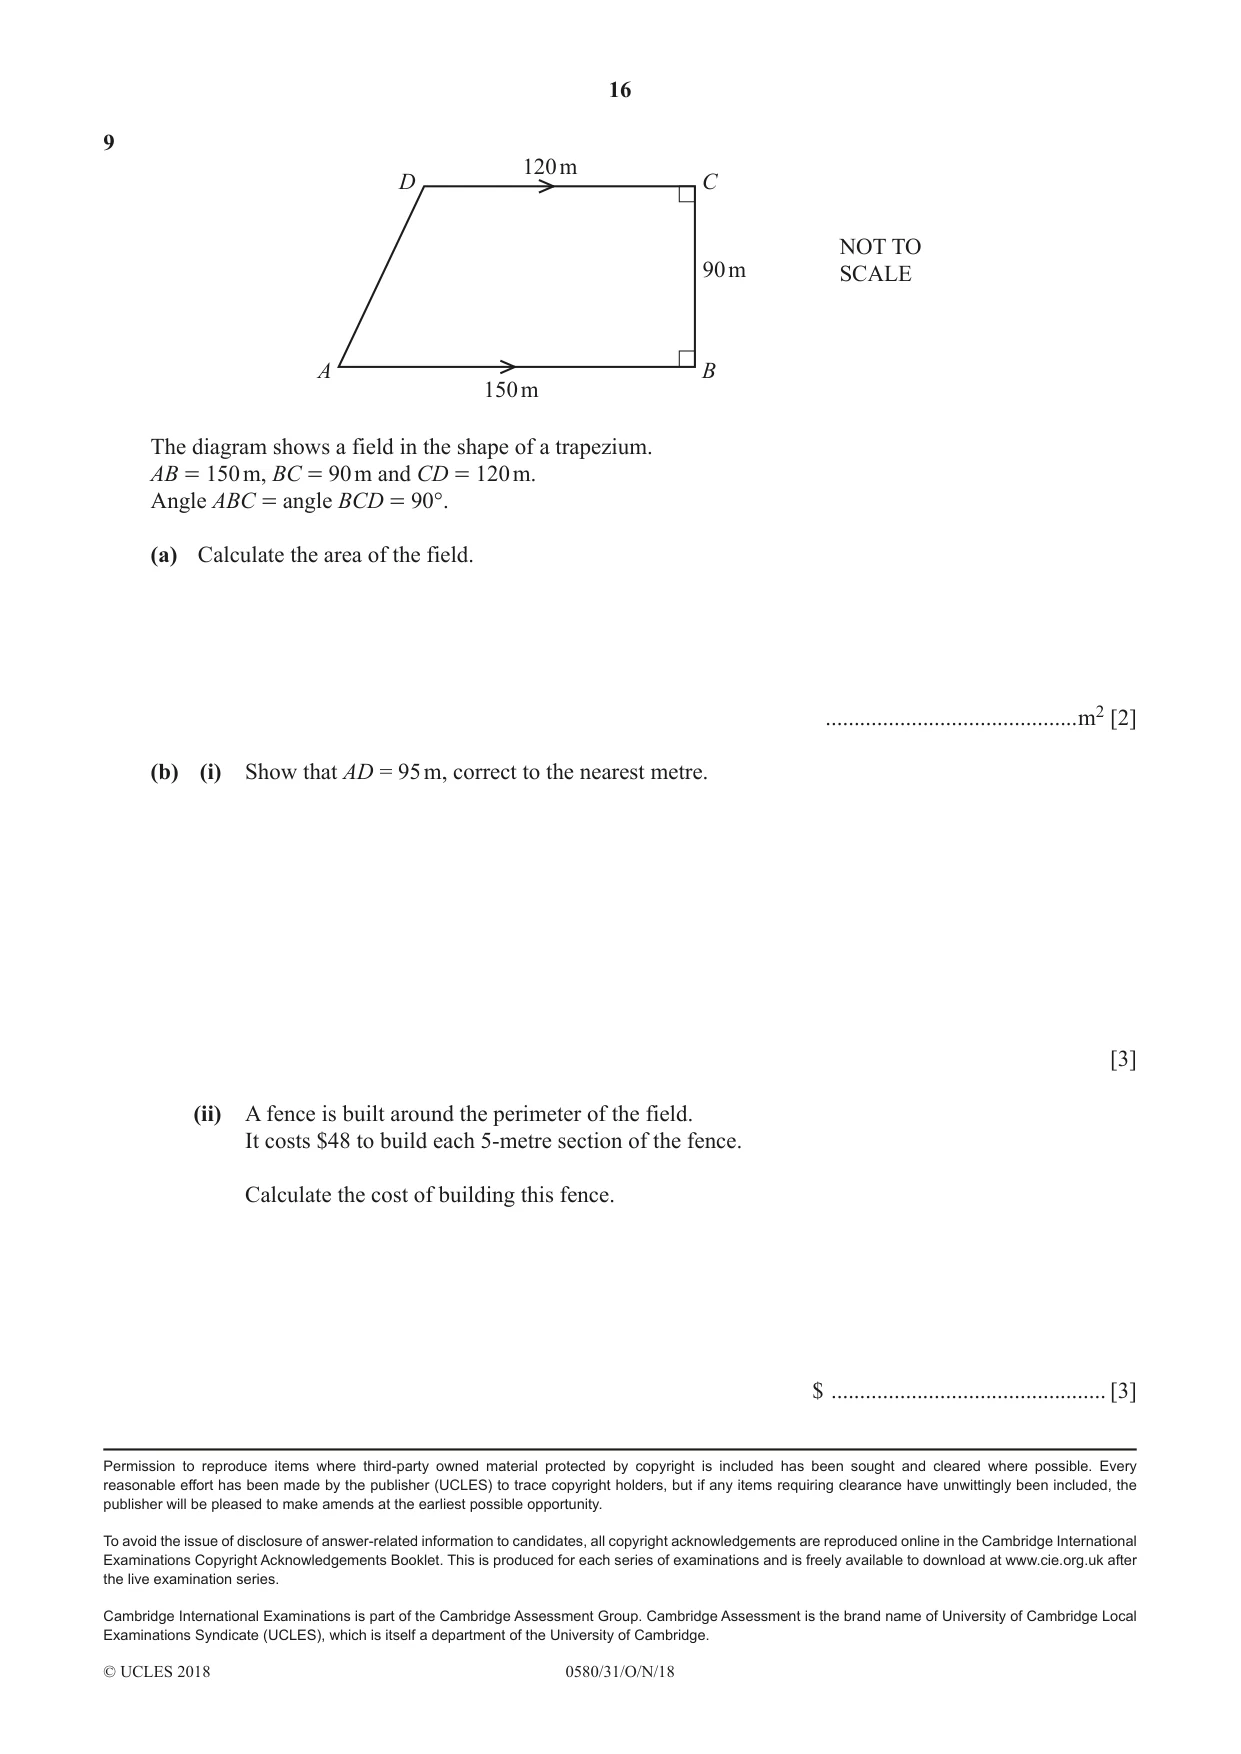
9 120 m D C NOT TO 90 m SCALE A B 150 m The diagram shows a field in the shape of a trapezium. AB = 150 m, BC = 90 m and CD = 120 m. Angle ABC = angle BCD = 90°. (a) Calculate the area of the field. ............................................m2 [2] (b) (i) Show that AD = 95 m, correct to the nearest metre. [3] (ii) A fence is built around the perimeter of the field. It costs $48 to build each 5-metre section of the fence. Calculate the cost of building this fence. $ ................................................ [3]
Mark scheme: 9(a) 12 150 2 1 M1 for × (120 + 150 ) × 90 oe 2 or M1 for 90 2 + (150 − 120 ) 2 2 + (150 − 120 ) 2 M29(b)(i) [ AD = ] 90 = 94.9 or 94.8[…] A1 9(b)(ii) 4368 3 95 + 120 + 150 + 90 M2 for × 48 oe 5 or M1 for 95 + 120 + 150 + 90 soi or 455 95 120 150 90 or and and and 5 5 5 5
What was in this paper
The subtopics covered by these 9 questions, and how many questions each got. Open one in a new tab to see every Cambridge question on it.
What you needed in this session
Cambridge’s own grade thresholds for 2018 Oct/Nov, Paper 3 · Variant 1. A higher threshold means an easier paper — the bar moves with how the cohort did.