Cambridge IGCSE Geography 0460 — 2019 Oct/Nov Paper 1 · Variant 1
0460/11/O/N/19 · 75 marks · ≈84 min
The question paper and its mark scheme, free to read here and free to download. This is Cambridge’s own paper, exactly as it was sat.
Question paper28 pages

Mark scheme18 pages
Answers below. Sit the paper first if you are practising.
Paper as text
Question paper, page 1
This document consists of 28 printed pages and 1 Insert. DC (SC/SW) 164089/5 © UCLES 2019 [Turn over Cambridge Assessment International Education Cambridge International General Certificate of Secondary Education * 3 8 0 4 1 0 2 9 7 7 * GEOGRAPHY 0460/11 Paper 1 October/November 2019 1 hour 45 minutes Candidates answer on the Question Paper. Additional Materials: Ruler Protractor Calculator READ THESE INSTRUCTIONS FIRST Write your centre number, candidate number and name in the spaces provided. Write in dark blue or black pen. You may use an HB pencil for any diagrams or graphs. Do not use staples, paper clips, glue or correction fluid. DO NOT WRITE IN ANY BARCODES. Write your answer to each question in the space provided. If additional space is required, you should use the lined pages at the end of this booklet. The question number(s) must be clearly shown. Answer three questions, one from each section. The Insert contains Figs. 2.1 and 2.2 for Question 2, Figs. 3.2, 3.3 and 3.4 for Question 3, and Figs. 6.1 and 6.2 for Question 6. The Insert is not required by the Examiner. Sketch maps and diagrams should be drawn whenever they serve to illustrate an answer. At the end of the examination, fasten all your work securely together. The number of marks is given in brackets [ ] at the end of each question or part question. Definitions MEDCs – More Economically Developed Countries LEDCs – Less Economically Developed Countries This syllabus is regulated for use in England, Wales and Northern Ireland as a Cambridge International Level 1/Level 2 Certificate.
Question paper, page 2
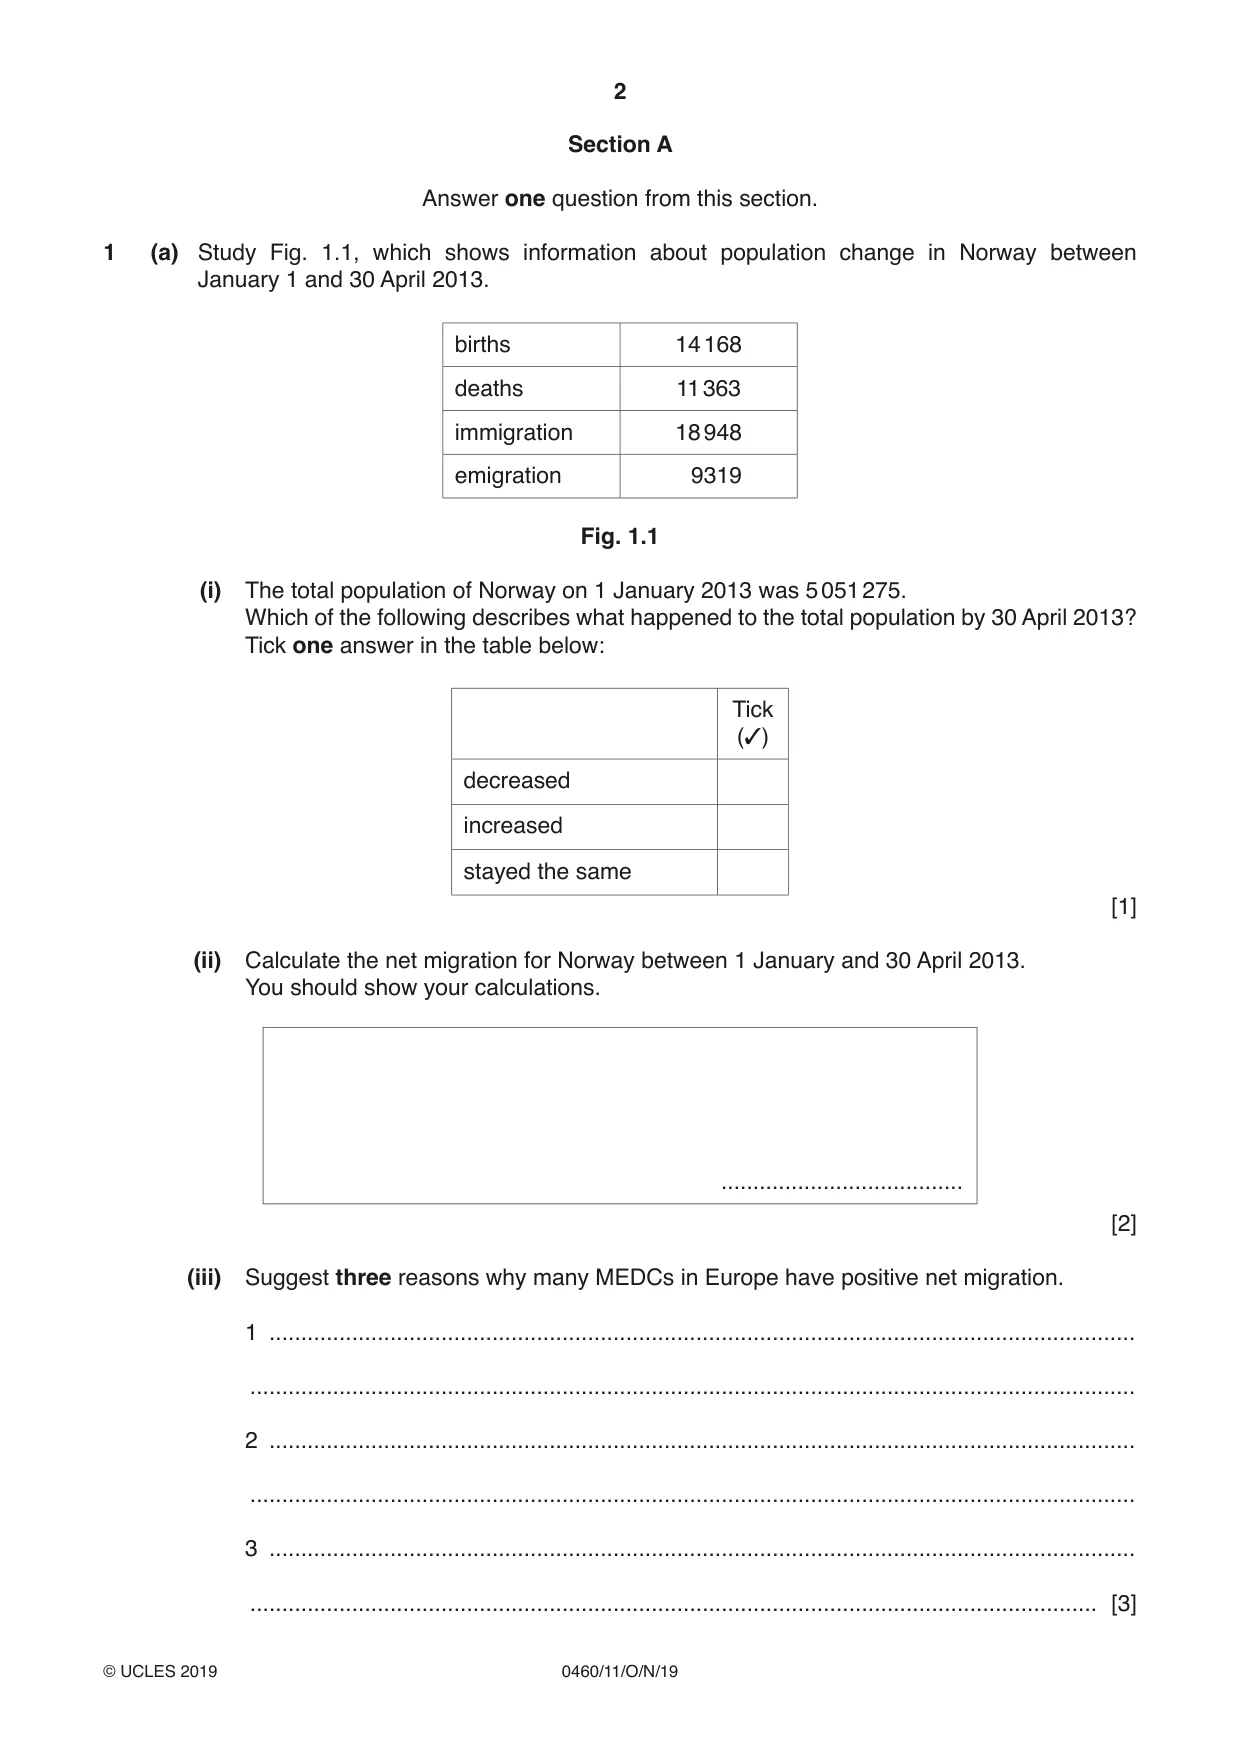
2 0460/11/O/N/19 © UCLES 2019 Section A Answer one question from this section. 1 (a) Study Fig. 1.1, which shows information about population change in Norway between January 1 and 30 April 2013. births 14 168 deaths 11 363 immigration 18 948 emigration 9319 Fig. 1.1 (i) The total population of Norway on 1 January 2013 was 5 051 275. Which of the following describes what happened to the total population by 30 April 2013? Tick one answer in the table below: Tick (✓) decreased increased stayed the same [1] (ii) Calculate the net migration for Norway between 1 January and 30 April 2013. You should show your calculations. … [2] (iii) Suggest three reasons why many MEDCs in Europe have positive net migration. 1 … … 2 … … 3 … … [3]
Question paper, page 3
3 0460/11/O/N/19 © UCLES 2019 [Turn over (iv) Describe the difficulties faced by international migrants moving to and living in a new country. … … … … … … … … [4]
Question paper, page 4
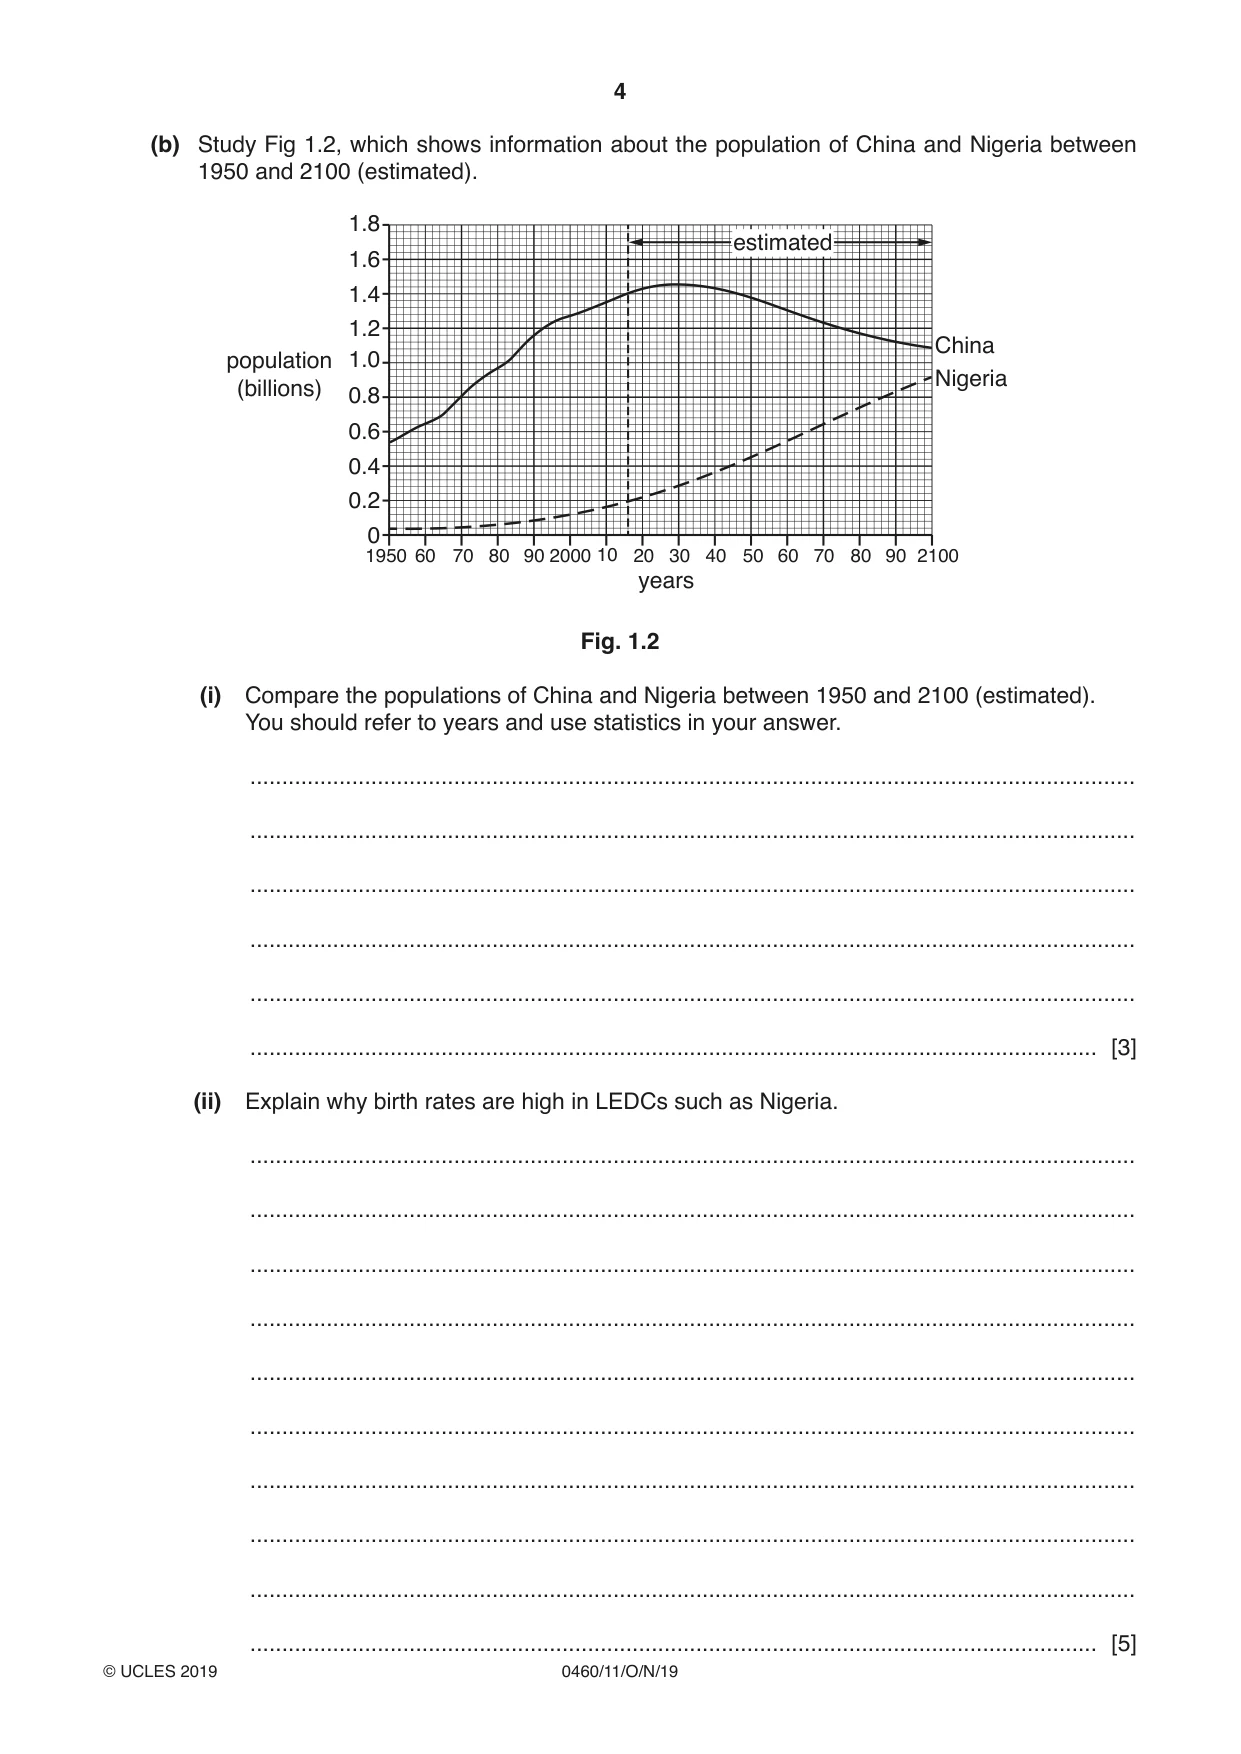
4 0460/11/O/N/19 © UCLES 2019 (b) Study Fig 1.2, which shows information about the population of China and Nigeria between 1950 and 2100 (estimated). 1950 2000 60 70 80 90 2100 60 50 40 30 20 years 10 70 80 90 population (billions) 0 0.2 0.4 0.6 0.8 1.2 1.4 1.6 1.8 1.0 estimated China Nigeria Fig. 1.2 (i) Compare the populations of China and Nigeria between 1950 and 2100 (estimated). You should refer to years and use statistics in your answer. … … … … … … [3] (ii) Explain why birth rates are high in LEDCs such as Nigeria. … … … … … … … … … … [5]
Question paper, page 5
5 0460/11/O/N/19 © UCLES 2019 [Turn over (c) For an example of international migration you have studied, describe the positive and negative impacts on the destination country. Name of destination country … … … … … … … … … … … … … … … … … … … … … … … … … [7] [Total: 25]
Question paper, page 6
6 0460/11/O/N/19 © UCLES 2019 2 (a) Study Fig. 2.1 (Insert), which is a photograph of an area in southern Africa. (i) Which of the following best describes the type of area shown in Fig. 2.1? Tick one answer in the table below: Tick (✓) rural suburban urban [1] (ii) Using evidence from Fig. 2.1 only, describe two features of the settlement in the area. 1 … … 2 … … [2] (iii) Describe the likely service provision in areas such as that shown in Fig. 2.1. … … … … … … [3]
Question paper, page 7
7 0460/11/O/N/19 © UCLES 2019 [Turn over (iv) In any country there is a hierarchy of settlements and services. Explain the meaning of this statement. You may use a diagram or diagrams. … … … … … … … … [4]
Question paper, page 8
8 0460/11/O/N/19 © UCLES 2019 (b) Study Fig. 2.2 (Insert), which is a photograph showing an area in Almeria, Spain (an MEDC). (i) Describe the main features of the settlement shown in Fig. 2.2. … … … … … … [3] (ii) Suggest reasons for the location of the settlement shown in Fig. 2.2. … … … … … … … … … … [5]
Question paper, page 9
9 0460/11/O/N/19 © UCLES 2019 [Turn over (c) For a named settlement you have studied, explain why the population size has changed. Name of settlement … … … … … … … … … … … … … … … … … … … … … … … … … [7] [Total: 25]
Question paper, page 10
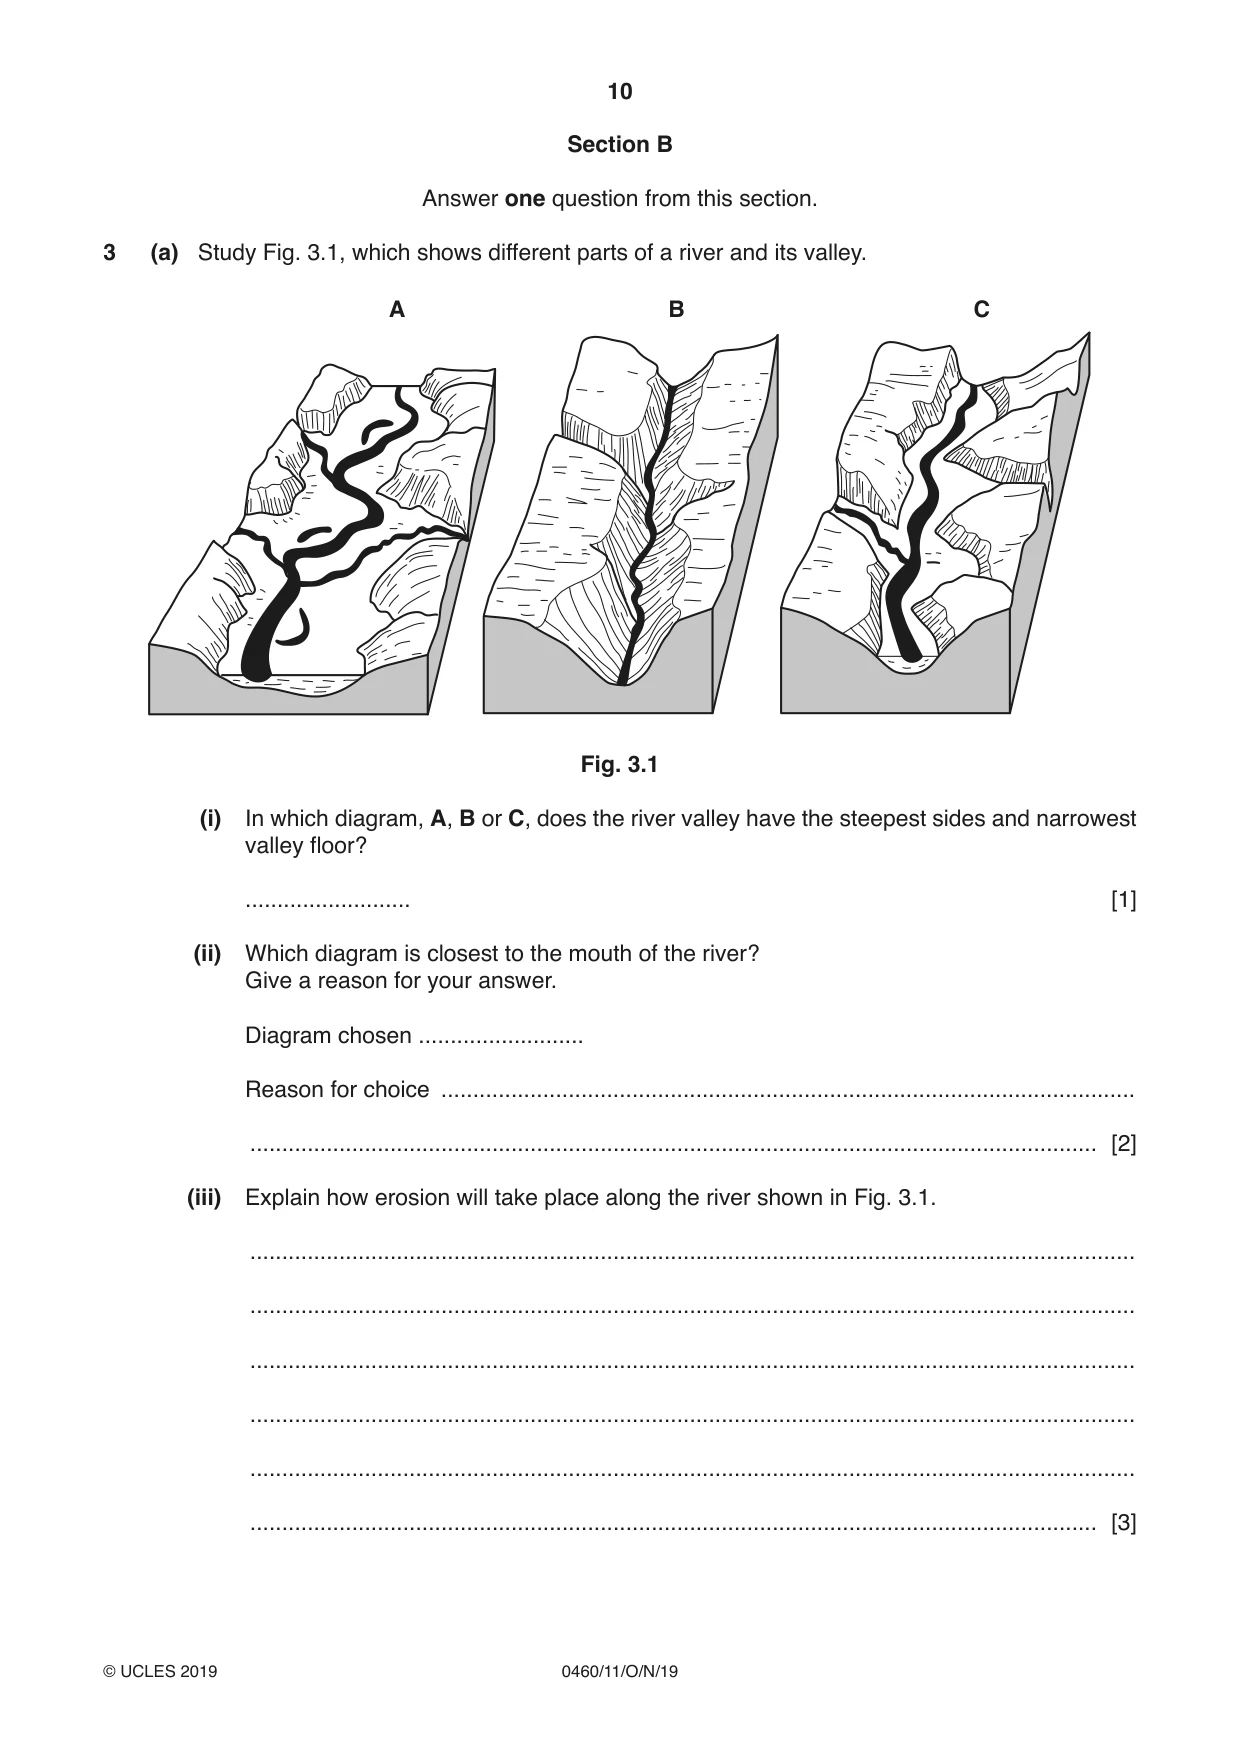
10 0460/11/O/N/19 © UCLES 2019 Section B Answer one question from this section. 3 (a) Study Fig. 3.1, which shows different parts of a river and its valley. A B C Fig. 3.1 (i) In which diagram, A, B or C, does the river valley have the steepest sides and narrowest valley floor? … [1] (ii) Which diagram is closest to the mouth of the river? Give a reason for your answer. Diagram chosen … Reason for choice … … [2] (iii) Explain how erosion will take place along the river shown in Fig. 3.1. … … … … … … [3]
Question paper, page 11
11 0460/11/O/N/19 © UCLES 2019 [Turn over (iv) Explain why deposition is likely to take place in the area shown in A in Fig. 3.1. … … … … … … … … [4] (b) Study Figs. 3.2, 3.3 and 3.4 (Insert), which are photographs of three different rivers. (i) Using evidence from Figs. 3.2, 3.3 and 3.4 only, describe three different benefits of living near a river. 1 … … 2 … … 3 … … [3] (ii) Explain why living on a delta or near a river may be hazardous for people. … … … … … … … … … … [5]
Question paper, page 12
12 0460/11/O/N/19 © UCLES 2019 (c) Explain how a delta is formed. Include a fully labelled diagram or diagrams. … … … … … … … … … … … … … [7] [Total: 25]
Question paper, page 13
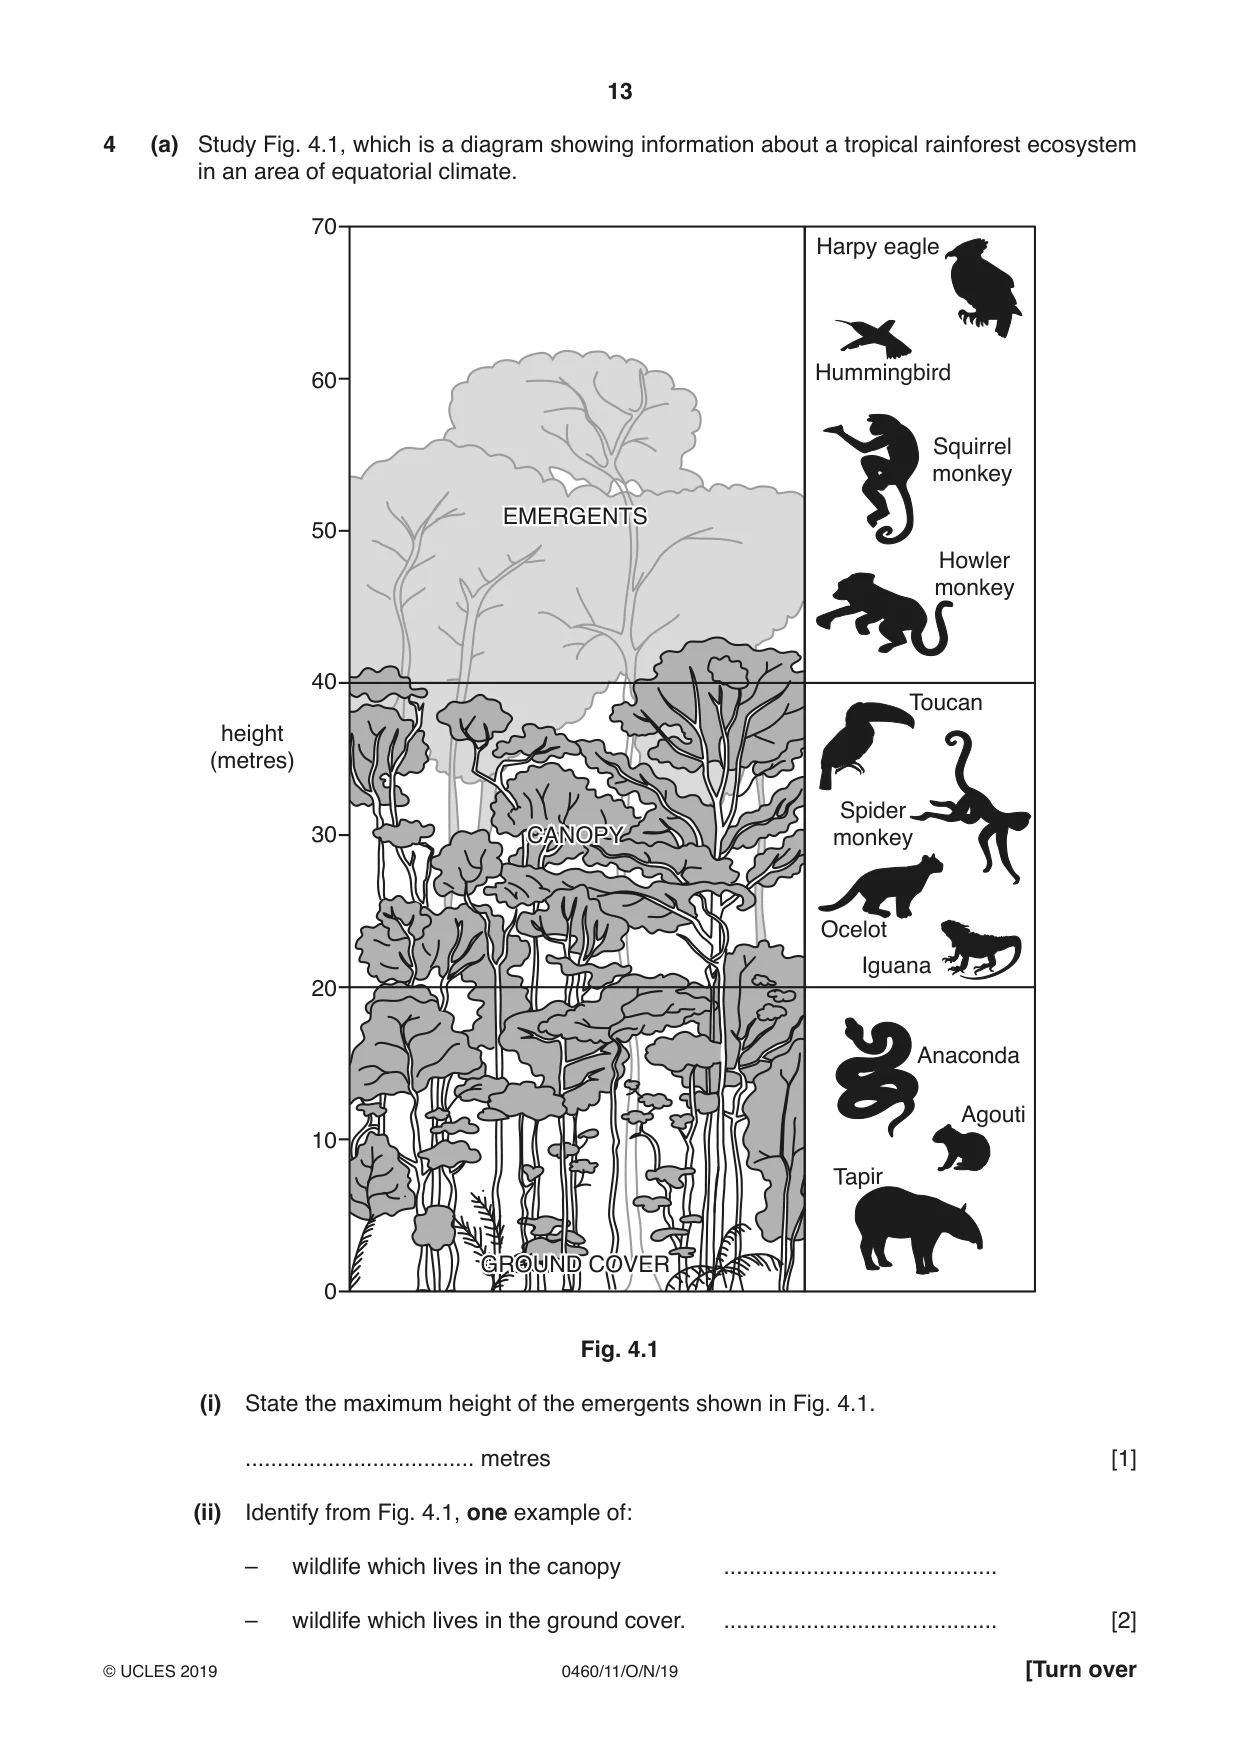
13 0460/11/O/N/19 © UCLES 2019 [Turn over 4 (a) Study Fig. 4.1, which is a diagram showing information about a tropical rainforest ecosystem in an area of equatorial climate. 70 60 50 30 40 height (metres) EMERGENTS CANOPY GROUND COVER 20 10 0 Harpy eagle Hummingbird Squirrel monkey Howler monkey Toucan Spider monkey Iguana Anaconda Agouti Tapir Ocelot Fig. 4.1 (i) State the maximum height of the emergents shown in Fig. 4.1. … metres [1] (ii) Identify from Fig. 4.1, one example of: – wildlife which lives in the canopy … – wildlife which lives in the ground cover. … [2]
Question paper, page 14
14 0460/11/O/N/19 © UCLES 2019 (iii) Suggest reasons why some animals live in the canopy but others live in the ground cover in a tropical rainforest. … … … … … … [3] (iv) Explain why the equatorial climate is hot and wet. … … … … … … … … … … [4]
Question paper, page 15
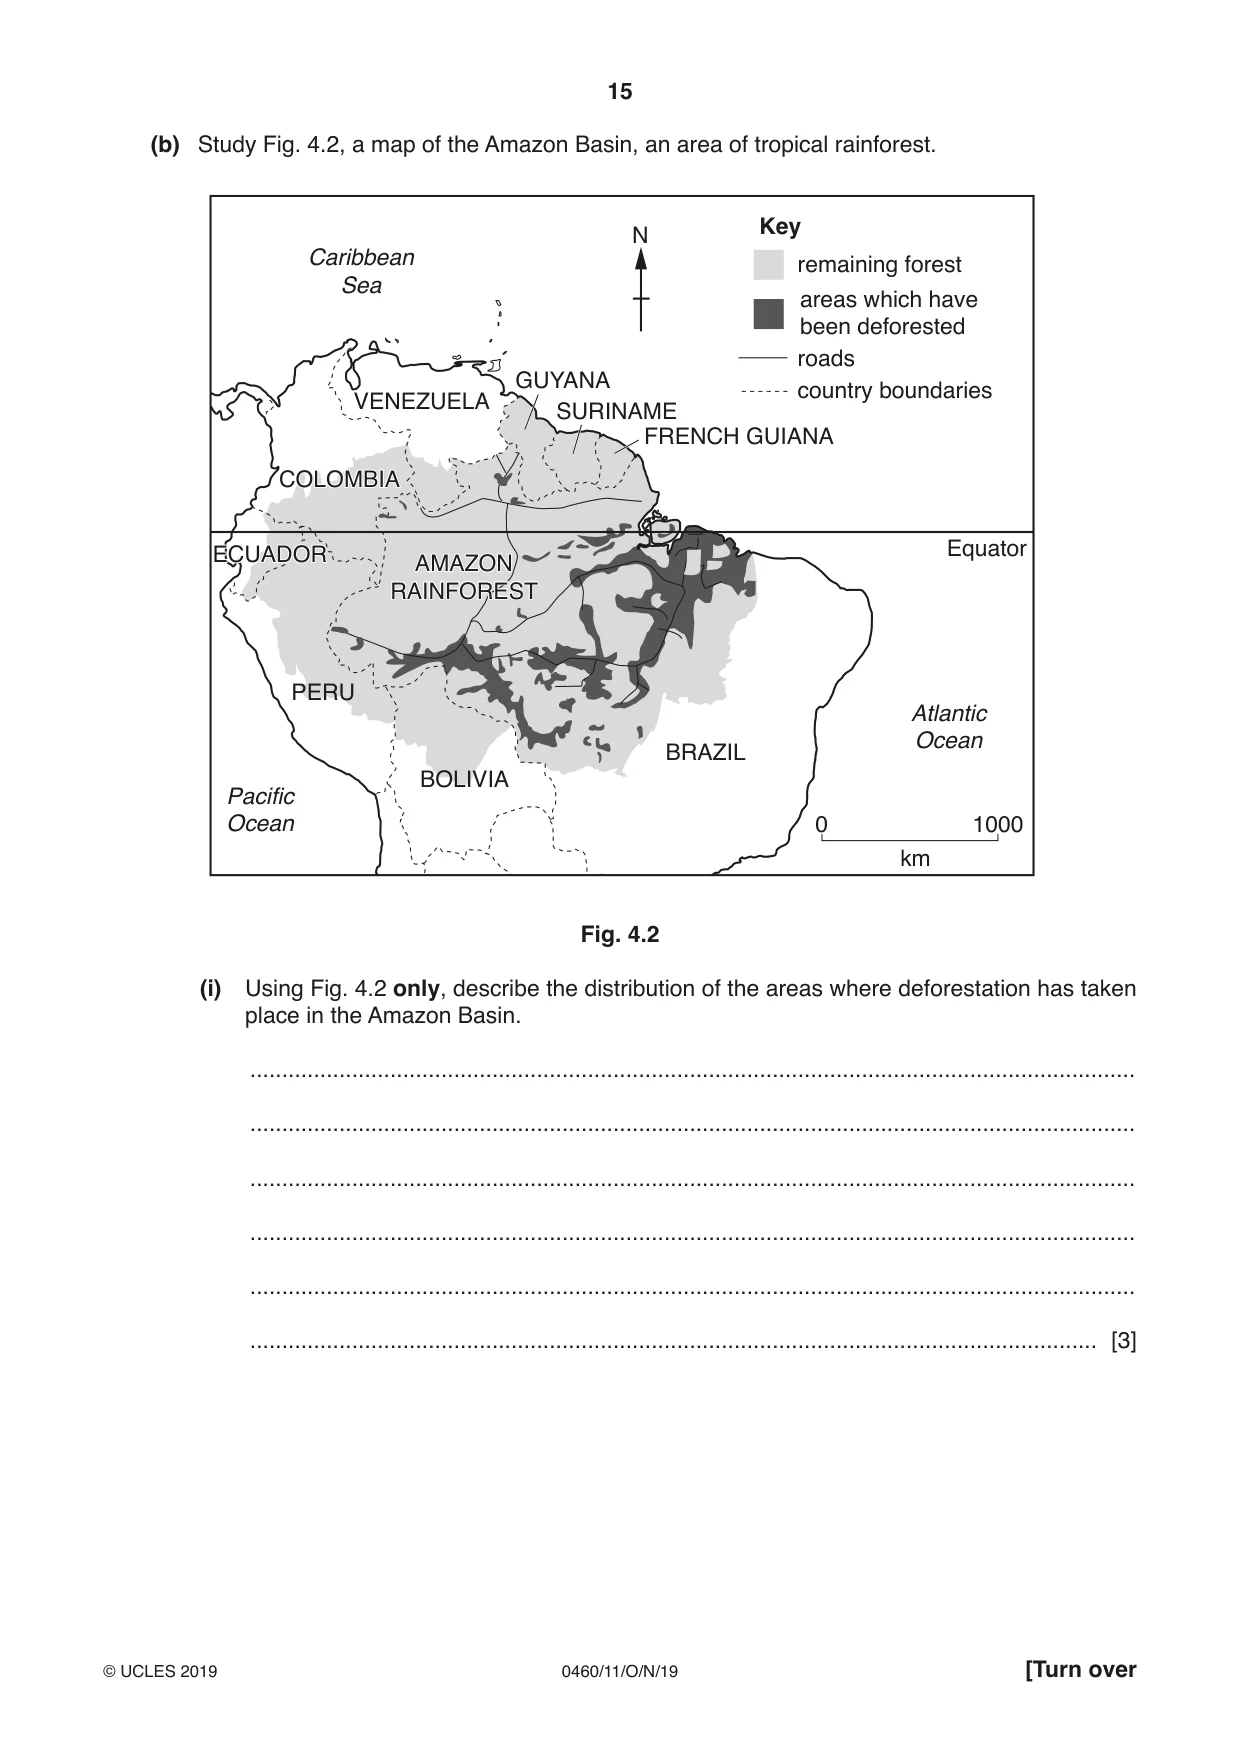
15 0460/11/O/N/19 © UCLES 2019 [Turn over (b) Study Fig. 4.2, a map of the Amazon Basin, an area of tropical rainforest. remaining forest roads country boundaries Equator Atlantic Ocean Pacific Ocean Caribbean Sea Key areas which have been deforested N 0 1000 km VENEZUELA COLOMBIA ECUADOR PERU BOLIVIA BRAZIL GUYANA SURINAME FRENCH GUIANA AMAZON RAINFOREST Fig. 4.2 (i) Using Fig. 4.2 only, describe the distribution of the areas where deforestation has taken place in the Amazon Basin. … … … … … … [3]
Question paper, page 16
16 0460/11/O/N/19 © UCLES 2019 (ii) Explain why deforestation of tropical rainforests has taken place. … … … … … … … … … … [5]
Question paper, page 17
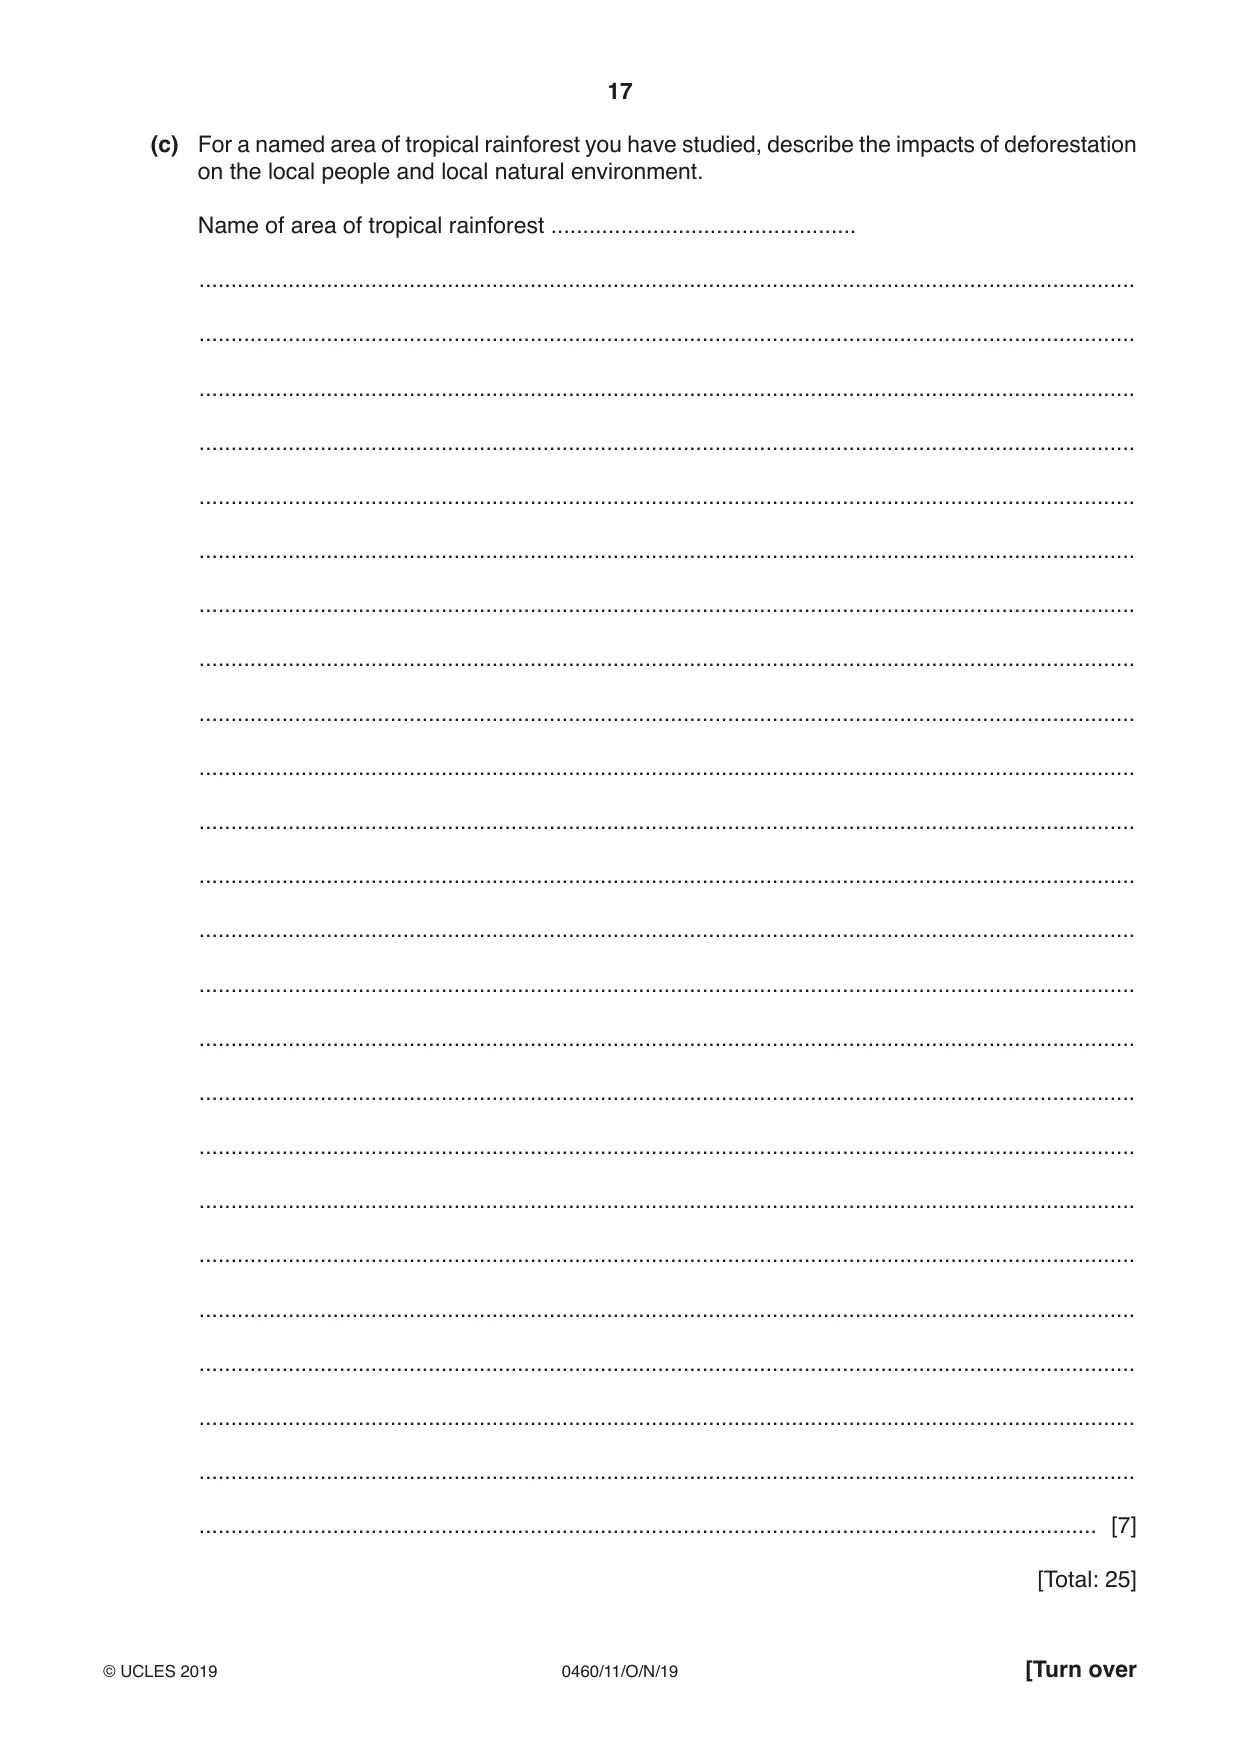
17 0460/11/O/N/19 © UCLES 2019 [Turn over (c) For a named area of tropical rainforest you have studied, describe the impacts of deforestation on the local people and local natural environment. Name of area of tropical rainforest … … … … … … … … … … … … … … … … … … … … … … … … … [7] [Total: 25]
Question paper, page 18
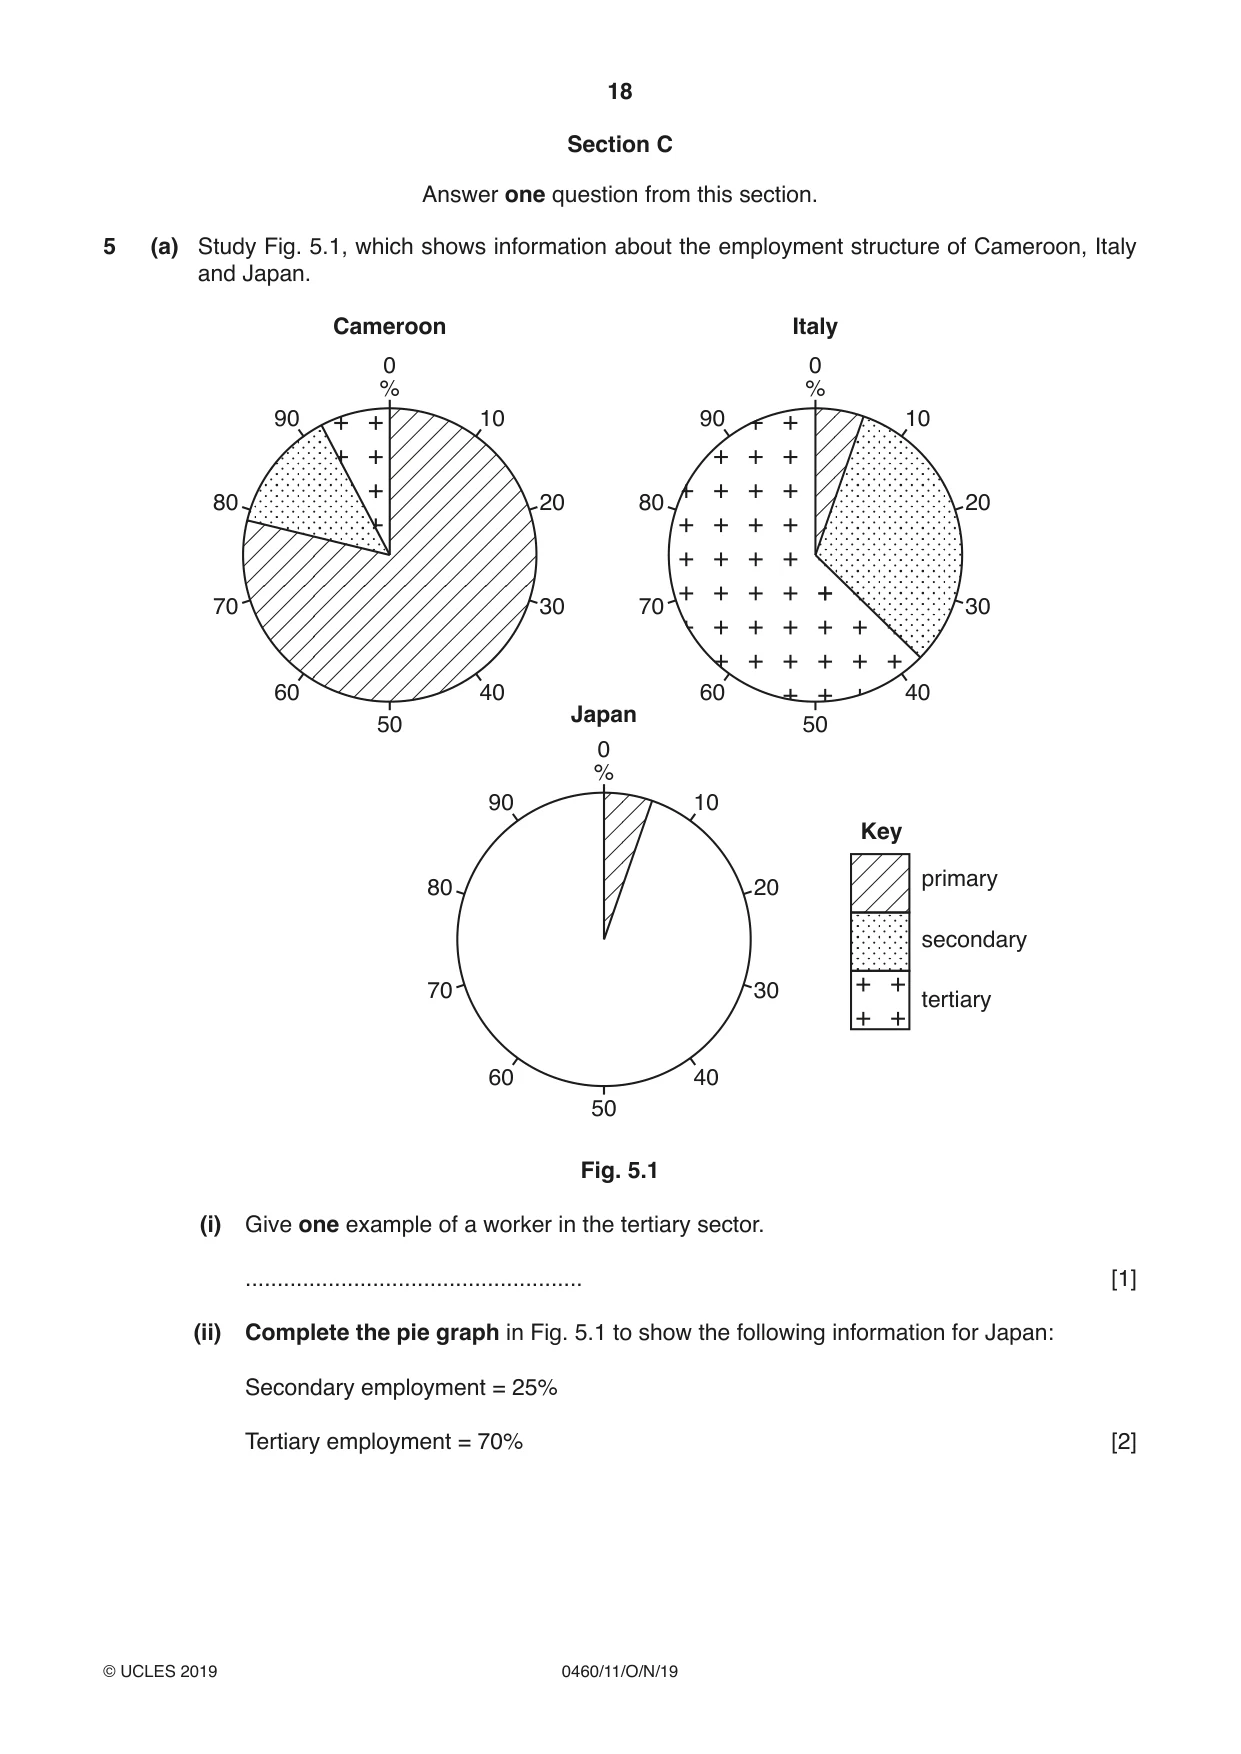
18 0460/11/O/N/19 © UCLES 2019 Section C Answer one question from this section. 5 (a) Study Fig. 5.1, which shows information about the employment structure of Cameroon, Italy and Japan. 0 % 50 90 10 60 40 20 80 30 70 Cameroon 0 % 50 90 10 60 40 20 80 30 70 Italy 0 % 50 90 10 60 40 20 80 30 70 Japan primary secondary tertiary Key Fig. 5.1 (i) Give one example of a worker in the tertiary sector. … [1] (ii) Complete the pie graph in Fig. 5.1 to show the following information for Japan: Secondary employment = 25% Tertiary employment = 70% [2]
Question paper, page 19
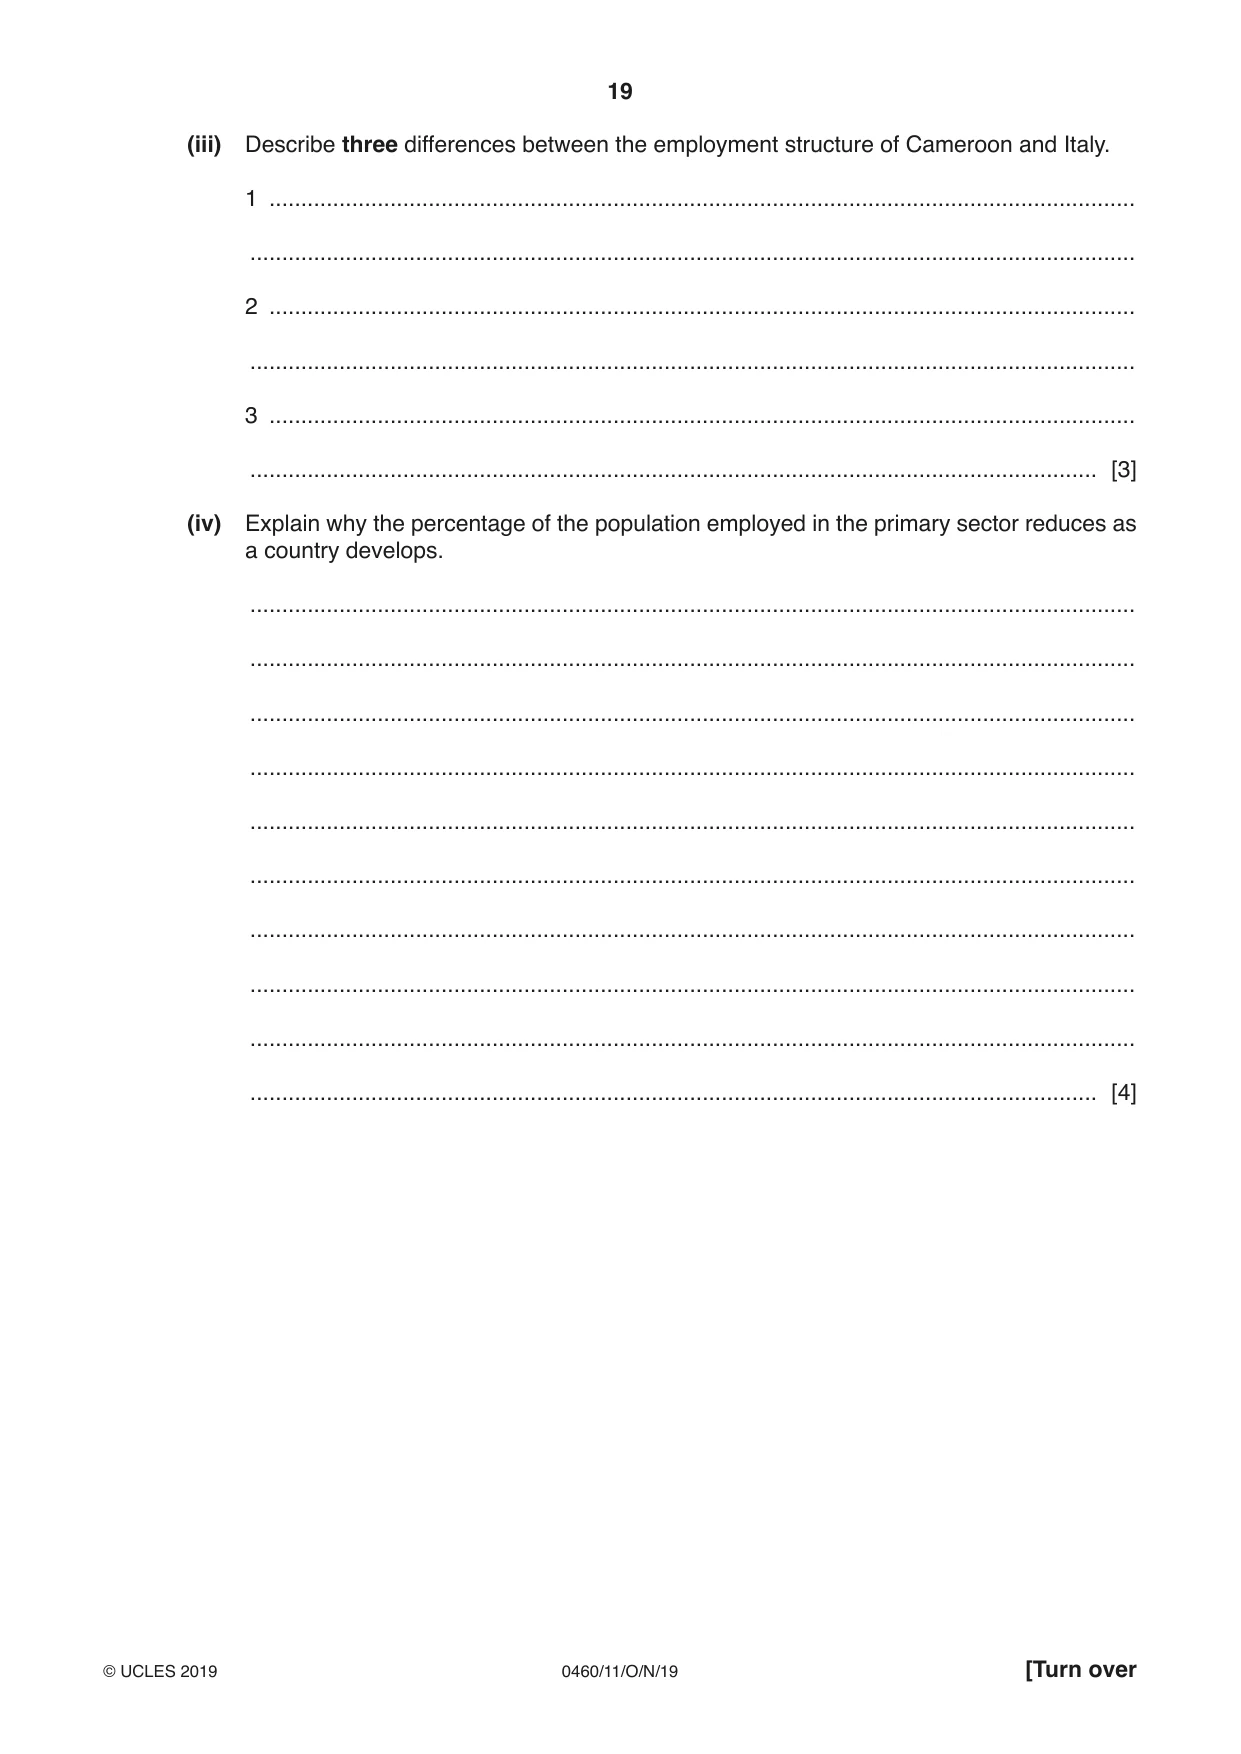
19 0460/11/O/N/19 © UCLES 2019 [Turn over (iii) Describe three differences between the employment structure of Cameroon and Italy. 1 … … 2 … … 3 … … [3] (iv) Explain why the percentage of the population employed in the primary sector reduces as a country develops. … … … … … … … … … … [4]
Question paper, page 20
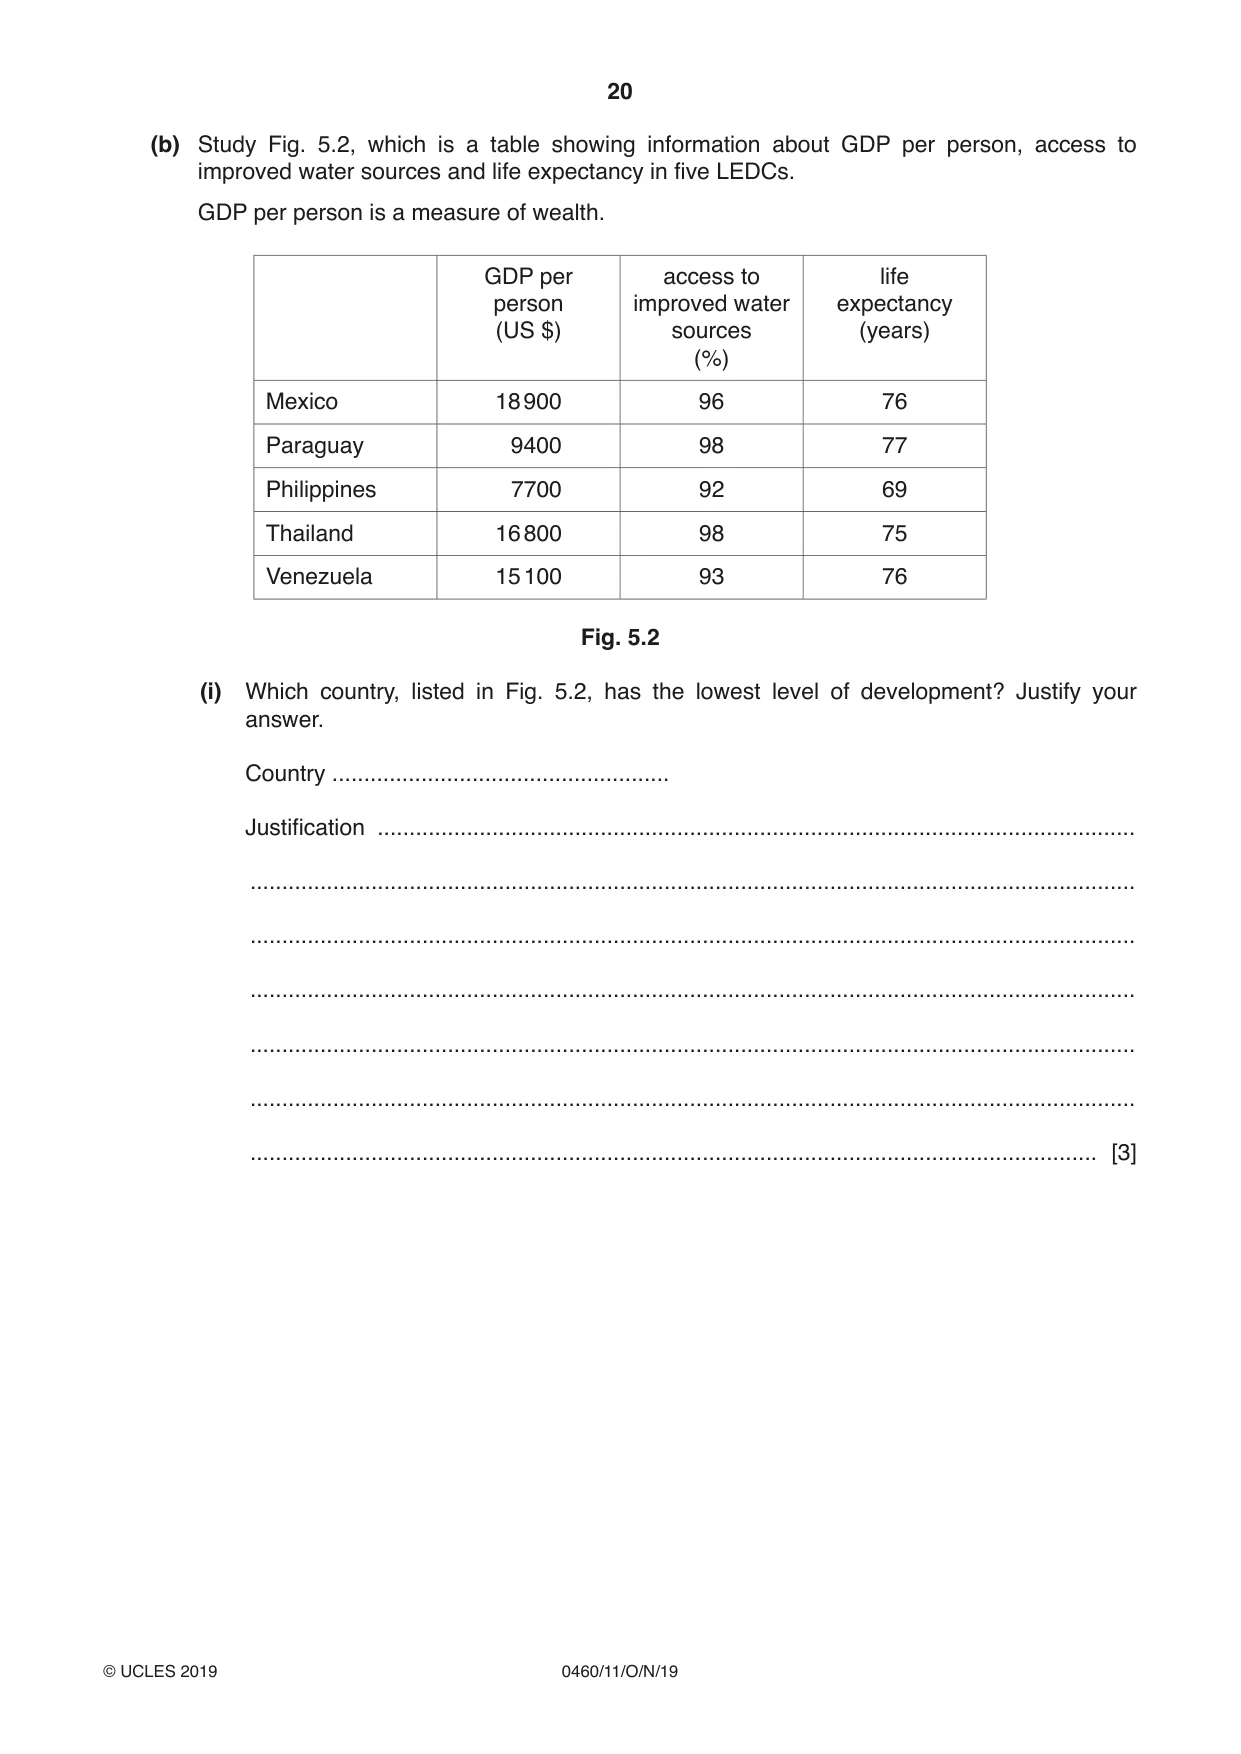
20 0460/11/O/N/19 © UCLES 2019 (b) Study Fig. 5.2, which is a table showing information about GDP per person, access to improved water sources and life expectancy in five LEDCs. GDP per person is a measure of wealth. GDP per person (US $) access to improved water sources (%) life expectancy (years) Mexico 18 900 96 76 Paraguay 9400 98 77 Philippines 7700 92 69 Thailand 16 800 98 75 Venezuela 15 100 93 76 Fig. 5.2 (i) Which country, listed in Fig. 5.2, has the lowest level of development? Justify your answer. Country … Justification … … … … … … … [3]
Question paper, page 21
21 0460/11/O/N/19 © UCLES 2019 [Turn over (ii) Explain why there is a relationship between GDP per person and life expectancy. … … … … … … … … … … … … [5]
Question paper, page 22
22 0460/11/O/N/19 © UCLES 2019 (c) For a named country or area you have studied, describe and explain the importance of different sources of energy. Name of country or area … … … … … … … … … … … … … … … … … … … … … … … … … [7] [Total: 25]
Question paper, page 23
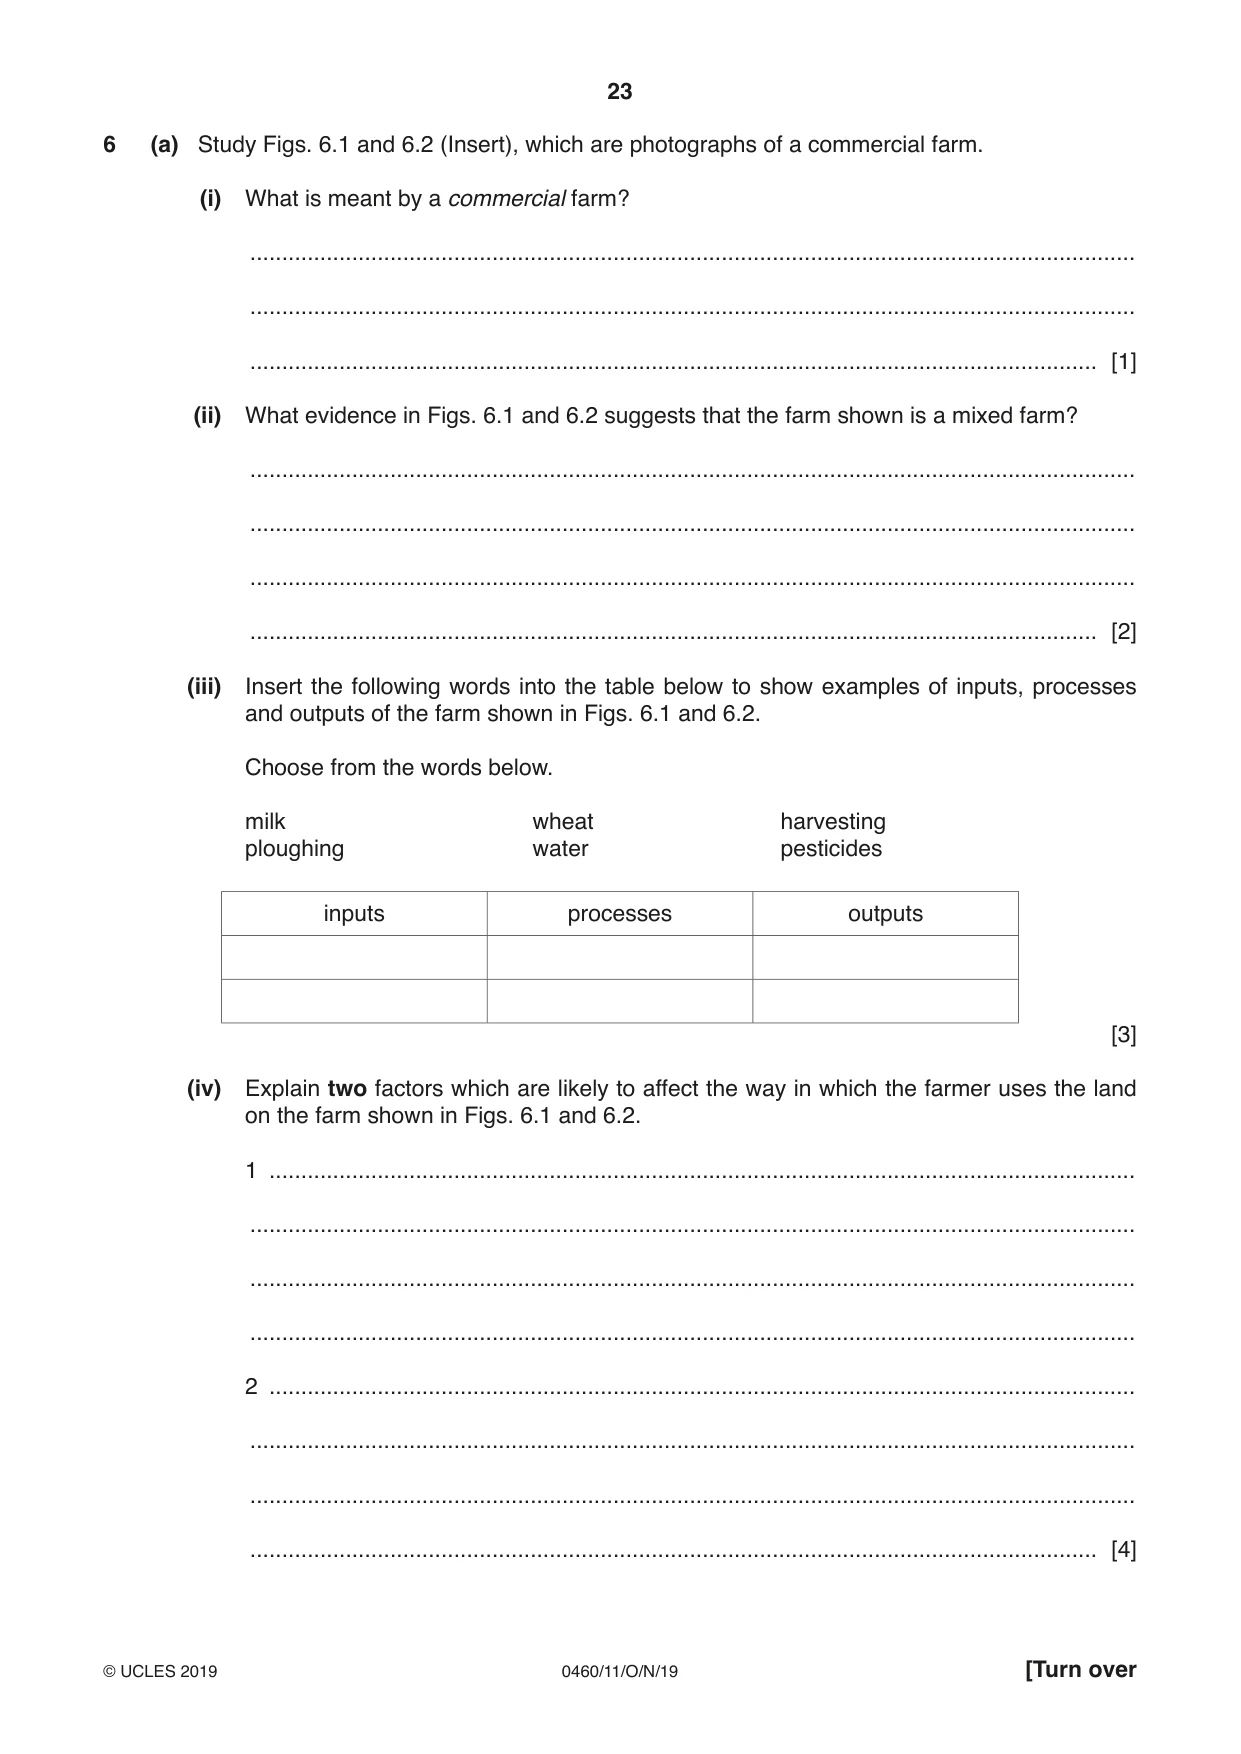
23 0460/11/O/N/19 © UCLES 2019 [Turn over 6 (a) Study Figs. 6.1 and 6.2 (Insert), which are photographs of a commercial farm. (i) What is meant by a commercial farm? … … … [1] (ii) What evidence in Figs. 6.1 and 6.2 suggests that the farm shown is a mixed farm? … … … … [2] (iii) Insert the following words into the table below to show examples of inputs, processes and outputs of the farm shown in Figs. 6.1 and 6.2. Choose from the words below. milk wheat harvesting ploughing water pesticides inputs processes outputs [3] (iv) Explain two factors which are likely to affect the way in which the farmer uses the land on the farm shown in Figs. 6.1 and 6.2. 1 … … … … 2 … … … … [4]
Question paper, page 24
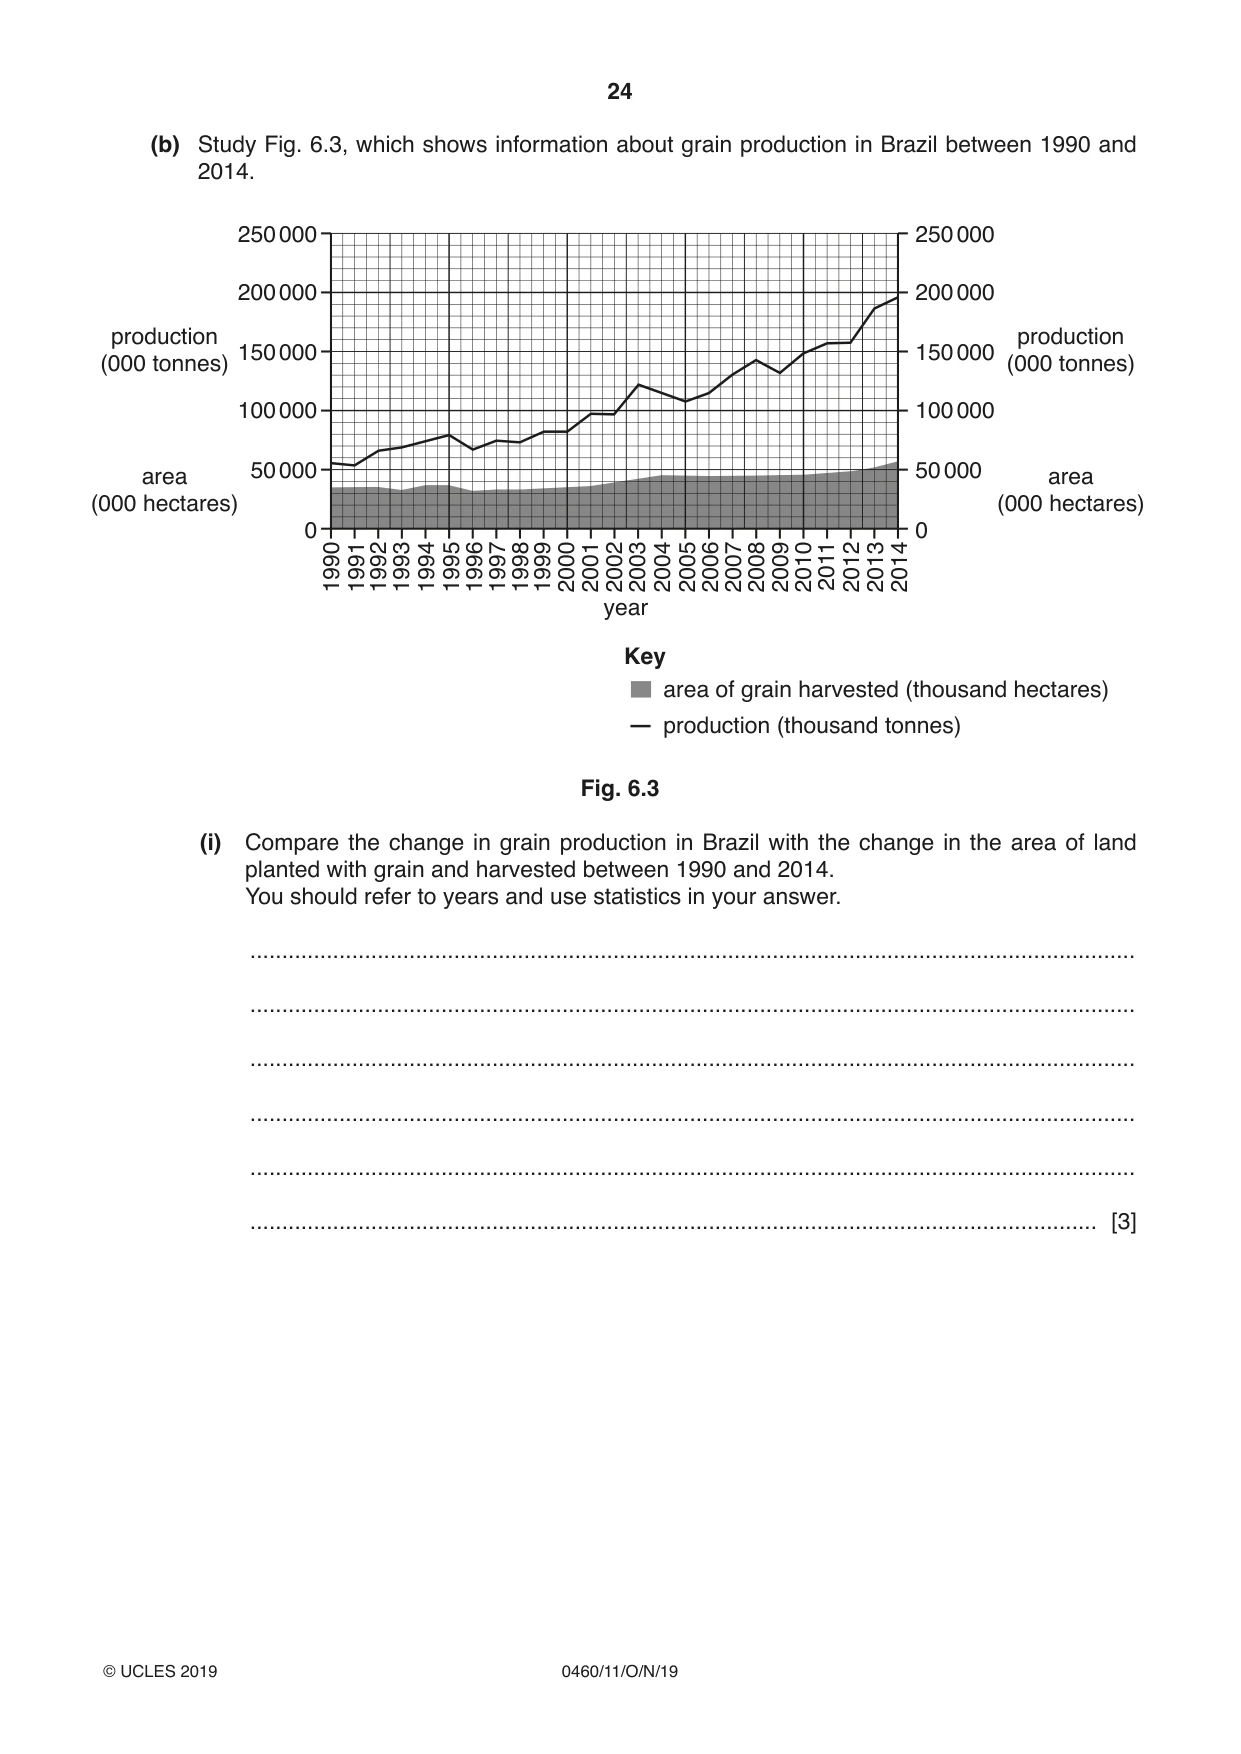
24 0460/11/O/N/19 © UCLES 2019 (b) Study Fig. 6.3, which shows information about grain production in Brazil between 1990 and 2014. area of grain harvested (thousand hectares) production (thousand tonnes) Key 250 000 200 000 150 000 production (000 tonnes) production (000 tonnes) area (000 hectares) area (000 hectares) 100 000 50 000 0 250 000 200 000 150 000 100 000 50 000 0 1990 1991 1992 1993 1994 1995 1996 1997 1998 1999 2000 2001 2002 2003 2004 2010 2011 2012 2013 2014 2005 2006 2007 2008 2009 year Fig. 6.3 (i) Compare the change in grain production in Brazil with the change in the area of land planted with grain and harvested between 1990 and 2014. You should refer to years and use statistics in your answer. … … … … … … [3]
Question paper, page 25
25 0460/11/O/N/19 © UCLES 2019 [Turn over (ii) Suggest how farmers were able to increase the production of grain in Brazil between 1990 and 2014. … … … … … … … … … … [5]
Question paper, page 26
26 0460/11/O/N/19 © UCLES 2019 (c) For a named country or region you have studied, explain why there are food shortages. Name of country or region … … … … … … … … … … … … … … … … … … … … … … … … … [7] [Total: 25]
Question paper, page 27
27 0460/11/O/N/19 © UCLES 2019 Additional Pages If you use the following lined pages to complete the answer(s) to any question(s), the question number(s) must be clearly shown. … … … … … … … … … … … … … … … … … … … … … … … … … …
Question paper, page 28
28 0460/11/O/N/19 © UCLES 2019 Permission to reproduce items where third-party owned material protected by copyright is included has been sought and cleared where possible. Every reasonable effort has been made by the publisher (UCLES) to trace copyright holders, but if any items requiring clearance have unwittingly been included, the publisher will be pleased to make amends at the earliest possible opportunity. To avoid the issue of disclosure of answer-related information to candidates, all copyright acknowledgements are reproduced online in the Cambridge Assessment International Education Copyright Acknowledgements Booklet. This is produced for each series of examinations and is freely available to download at www.cambridgeinternational.org after the live examination series. Cambridge Assessment International Education is part of the Cambridge Assessment Group. Cambridge Assessment is the brand name of the University of Cambridge Local Examinations Syndicate (UCLES), which itself is a department of the University of Cambridge. … … … … … … … … … … … … … … … … … … … … … … … …
Mark scheme, page 1
This syllabus is regulated for use in England, Wales and Northern Ireland as a Cambridge International Level 1/Level 2 Certificate. This document consists of 18 printed pages. © UCLES 2019 [Turn over Cambridge Assessment International Education Cambridge International General Certificate of Secondary Education GEOGRAPHY 0460/11 Paper 1 October/November 2019 MARK SCHEME Maximum Mark: 75 Published This mark scheme is published as an aid to teachers and candidates, to indicate the requirements of the examination. It shows the basis on which Examiners were instructed to award marks. It does not indicate the details of the discussions that took place at an Examiners’ meeting before marking began, which would have considered the acceptability of alternative answers. Mark schemes should be read in conjunction with the question paper and the Principal Examiner Report for Teachers. Cambridge International will not enter into discussions about these mark schemes. Cambridge International is publishing the mark schemes for the October/November 2019 series for most Cambridge IGCSE™, Cambridge International A and AS Level components and some Cambridge O Level components.
Mark scheme, page 2
0460/11 Cambridge IGCSE – Mark Scheme PUBLISHED October/November 2019 © UCLES 2019 Page 2 of 18 Generic Marking Principles These general marking principles must be applied by all examiners when marking candidate answers. They should be applied alongside the specific content of the mark scheme or generic level descriptors for a question. Each question paper and mark scheme will also comply with these marking principles. GENERIC MARKING PRINCIPLE 1: Marks must be awarded in line with: • the specific content of the mark scheme or the generic level descriptors for the question • the specific skills defined in the mark scheme or in the generic level descriptors for the question • the standard of response required by a candidate as exemplified by the standardisation scripts. GENERIC MARKING PRINCIPLE 2: Marks awarded are always whole marks (not half marks, or other fractions). GENERIC MARKING PRINCIPLE 3: Marks must be awarded positively: • marks are awarded for correct/valid answers, as defined in the mark scheme. However, credit is given for valid answers which go beyond the scope of the syllabus and mark scheme, referring to your Team Leader as appropriate • marks are awarded when candidates clearly demonstrate what they know and can do • marks are not deducted for errors • marks are not deducted for omissions • answers should only be judged on the quality of spelling, punctuation and grammar when these features are specifically assessed by the question as indicated by the mark scheme. The meaning, however, should be unambiguous. GENERIC MARKING PRINCIPLE 4: Rules must be applied consistently e.g. in situations where candidates have not followed instructions or in the application of generic level descriptors. GENERIC MARKING PRINCIPLE 5: Marks should be awarded using the full range of marks defined in the mark scheme for the question (however; the use of the full mark range may be limited according to the quality of the candidate responses seen). GENERIC MARKING PRINCIPLE 6: Marks awarded are based solely on the requirements as defined in the mark scheme. Marks should not be awarded with grade thresholds or grade descriptors in mind.
Mark scheme, page 3
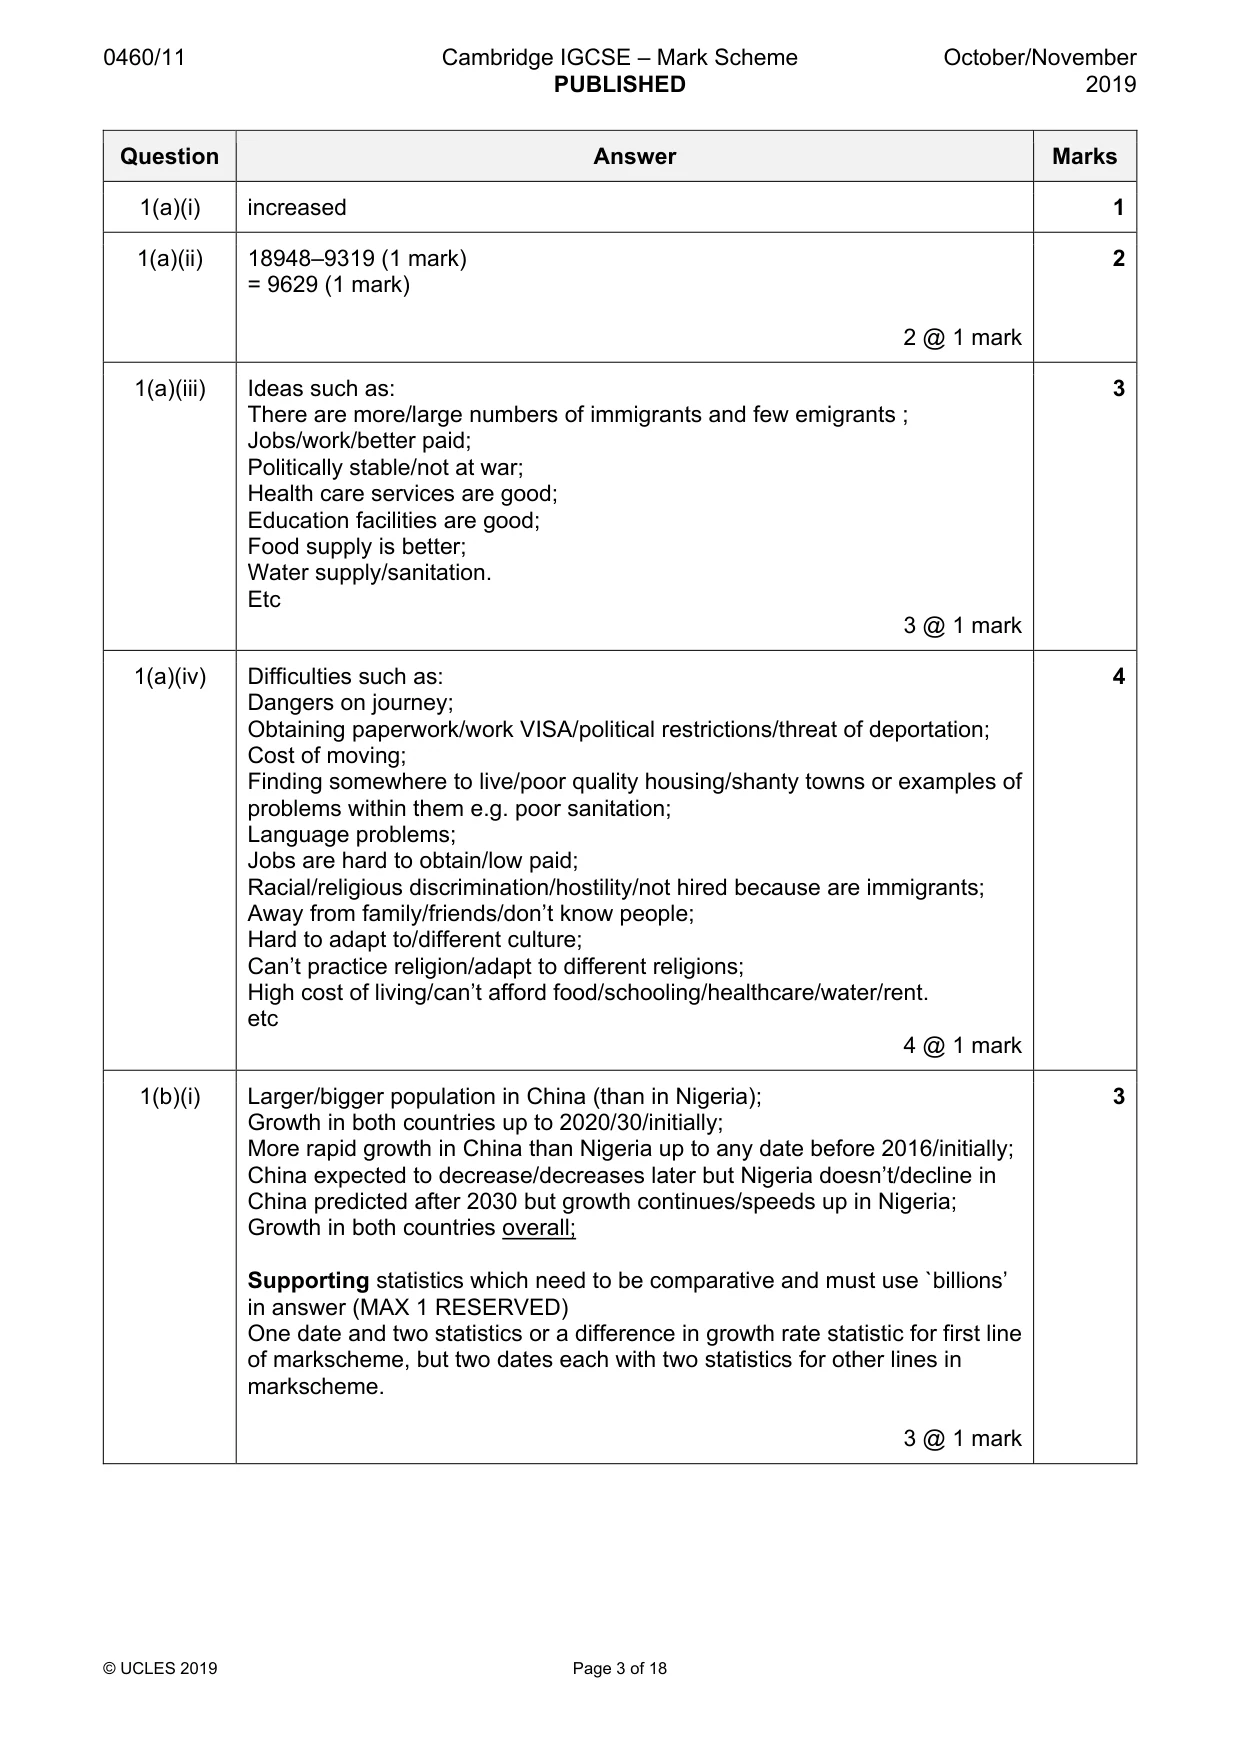
0460/11 Cambridge IGCSE – Mark Scheme PUBLISHED October/November 2019 © UCLES 2019 Page 3 of 18 Question Answer Marks 1(a)(i) increased 1 1(a)(ii) 18948–9319 (1 mark) = 9629 (1 mark) 2 @ 1 mark 2 1(a)(iii) Ideas such as: There are more/large numbers of immigrants and few emigrants ; Jobs/work/better paid; Politically stable/not at war; Health care services are good; Education facilities are good; Food supply is better; Water supply/sanitation. Etc 3 @ 1 mark 3 1(a)(iv) Difficulties such as: Dangers on journey; Obtaining paperwork/work VISA/political restrictions/threat of deportation; Cost of moving; Finding somewhere to live/poor quality housing/shanty towns or examples of problems within them e.g. poor sanitation; Language problems; Jobs are hard to obtain/low paid; Racial/religious discrimination/hostility/not hired because are immigrants; Away from family/friends/don’t know people; Hard to adapt to/different culture; Can’t practice religion/adapt to different religions; High cost of living/can’t afford food/schooling/healthcare/water/rent. etc 4 @ 1 mark 4 1(b)(i) Larger/bigger population in China (than in Nigeria); Growth in both countries up to 2020/30/initially; More rapid growth in China than Nigeria up to any date before 2016/initially; China expected to decrease/decreases later but Nigeria doesn’t/decline in China predicted after 2030 but growth continues/speeds up in Nigeria; Growth in both countries overall; Supporting statistics which need to be comparative and must use `billions’ in answer (MAX 1 RESERVED) One date and two statistics or a difference in growth rate statistic for first line of markscheme, but two dates each with two statistics for other lines in markscheme. 3 @ 1 mark 3
Mark scheme, page 4
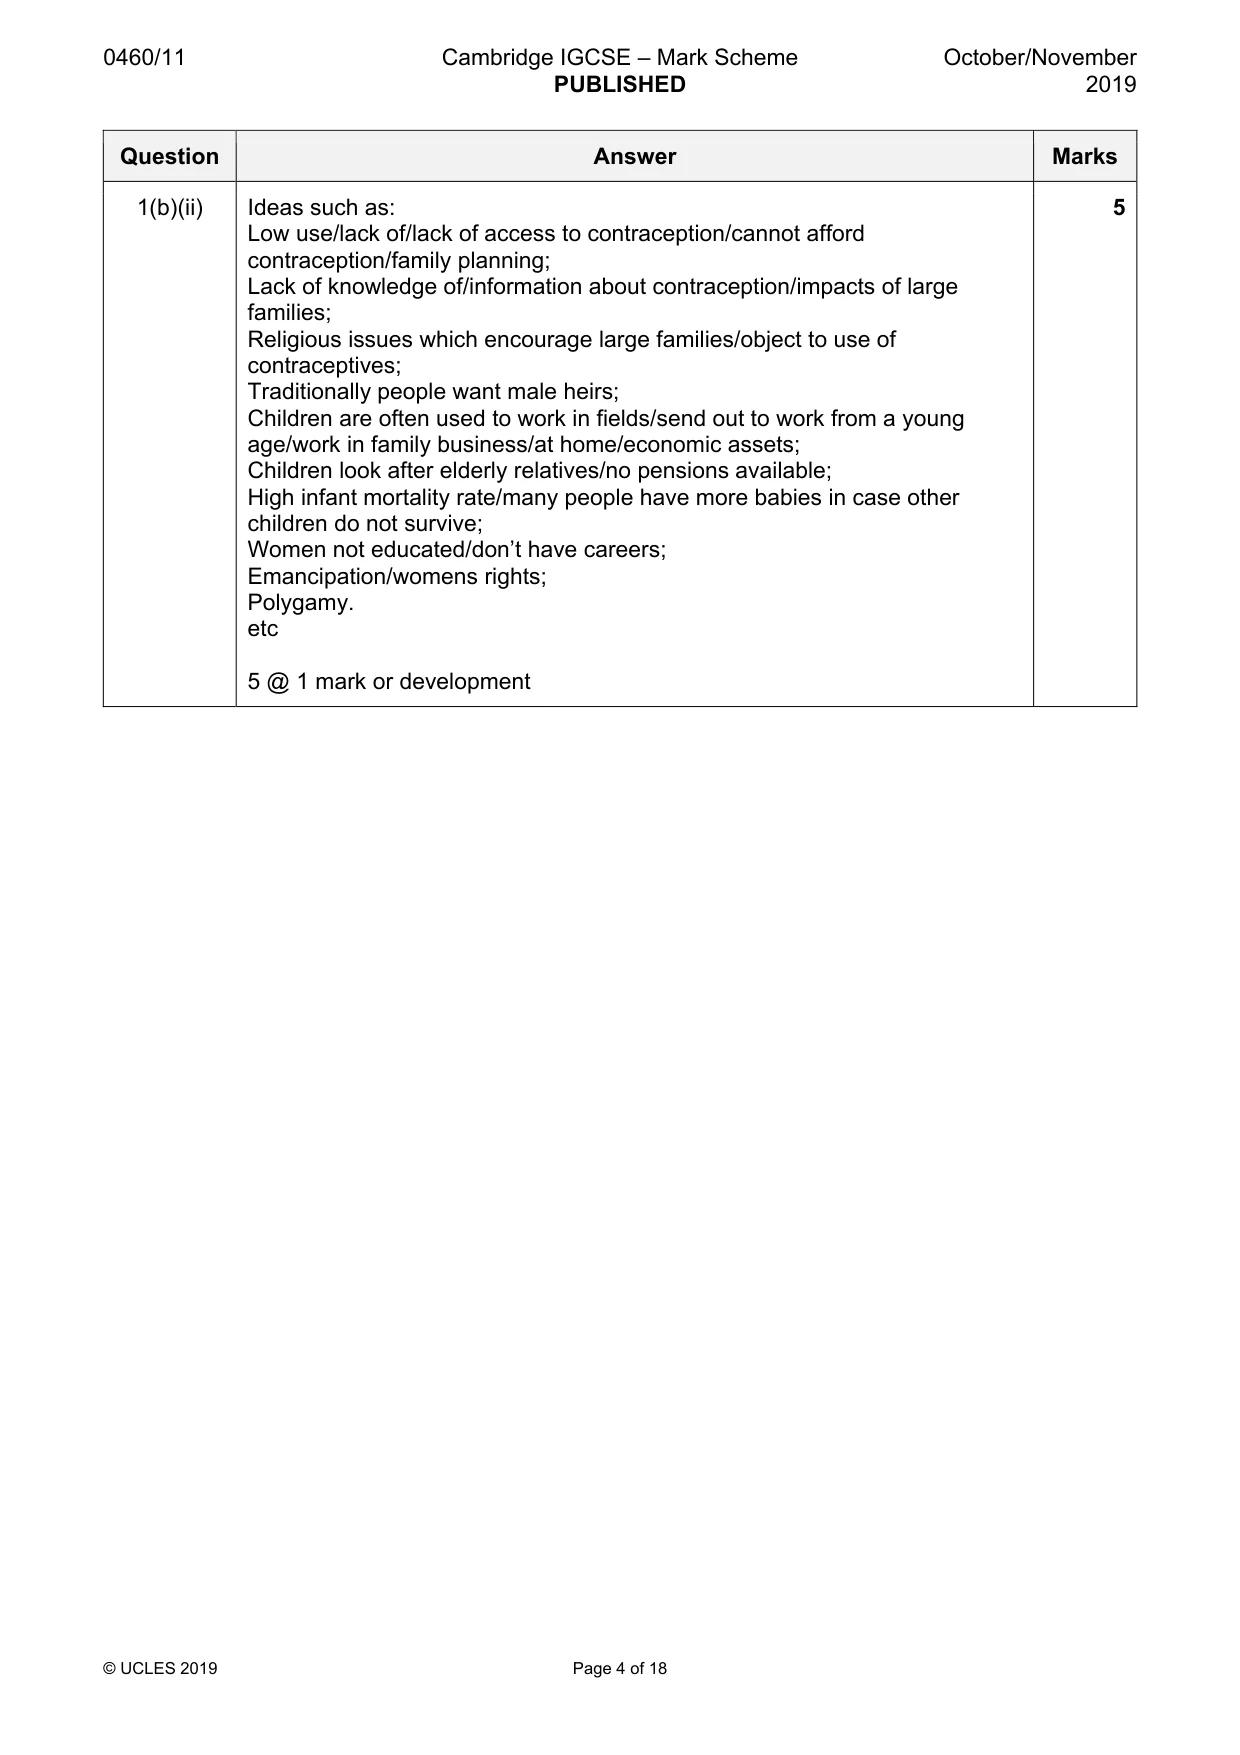
0460/11 Cambridge IGCSE – Mark Scheme PUBLISHED October/November 2019 © UCLES 2019 Page 4 of 18 Question Answer Marks 1(b)(ii) Ideas such as: Low use/lack of/lack of access to contraception/cannot afford contraception/family planning; Lack of knowledge of/information about contraception/impacts of large families; Religious issues which encourage large families/object to use of contraceptives; Traditionally people want male heirs; Children are often used to work in fields/send out to work from a young age/work in family business/at home/economic assets; Children look after elderly relatives/no pensions available; High infant mortality rate/many people have more babies in case other children do not survive; Women not educated/don’t have careers; Emancipation/womens rights; Polygamy. etc 5 @ 1 mark or development 5
Mark scheme, page 5
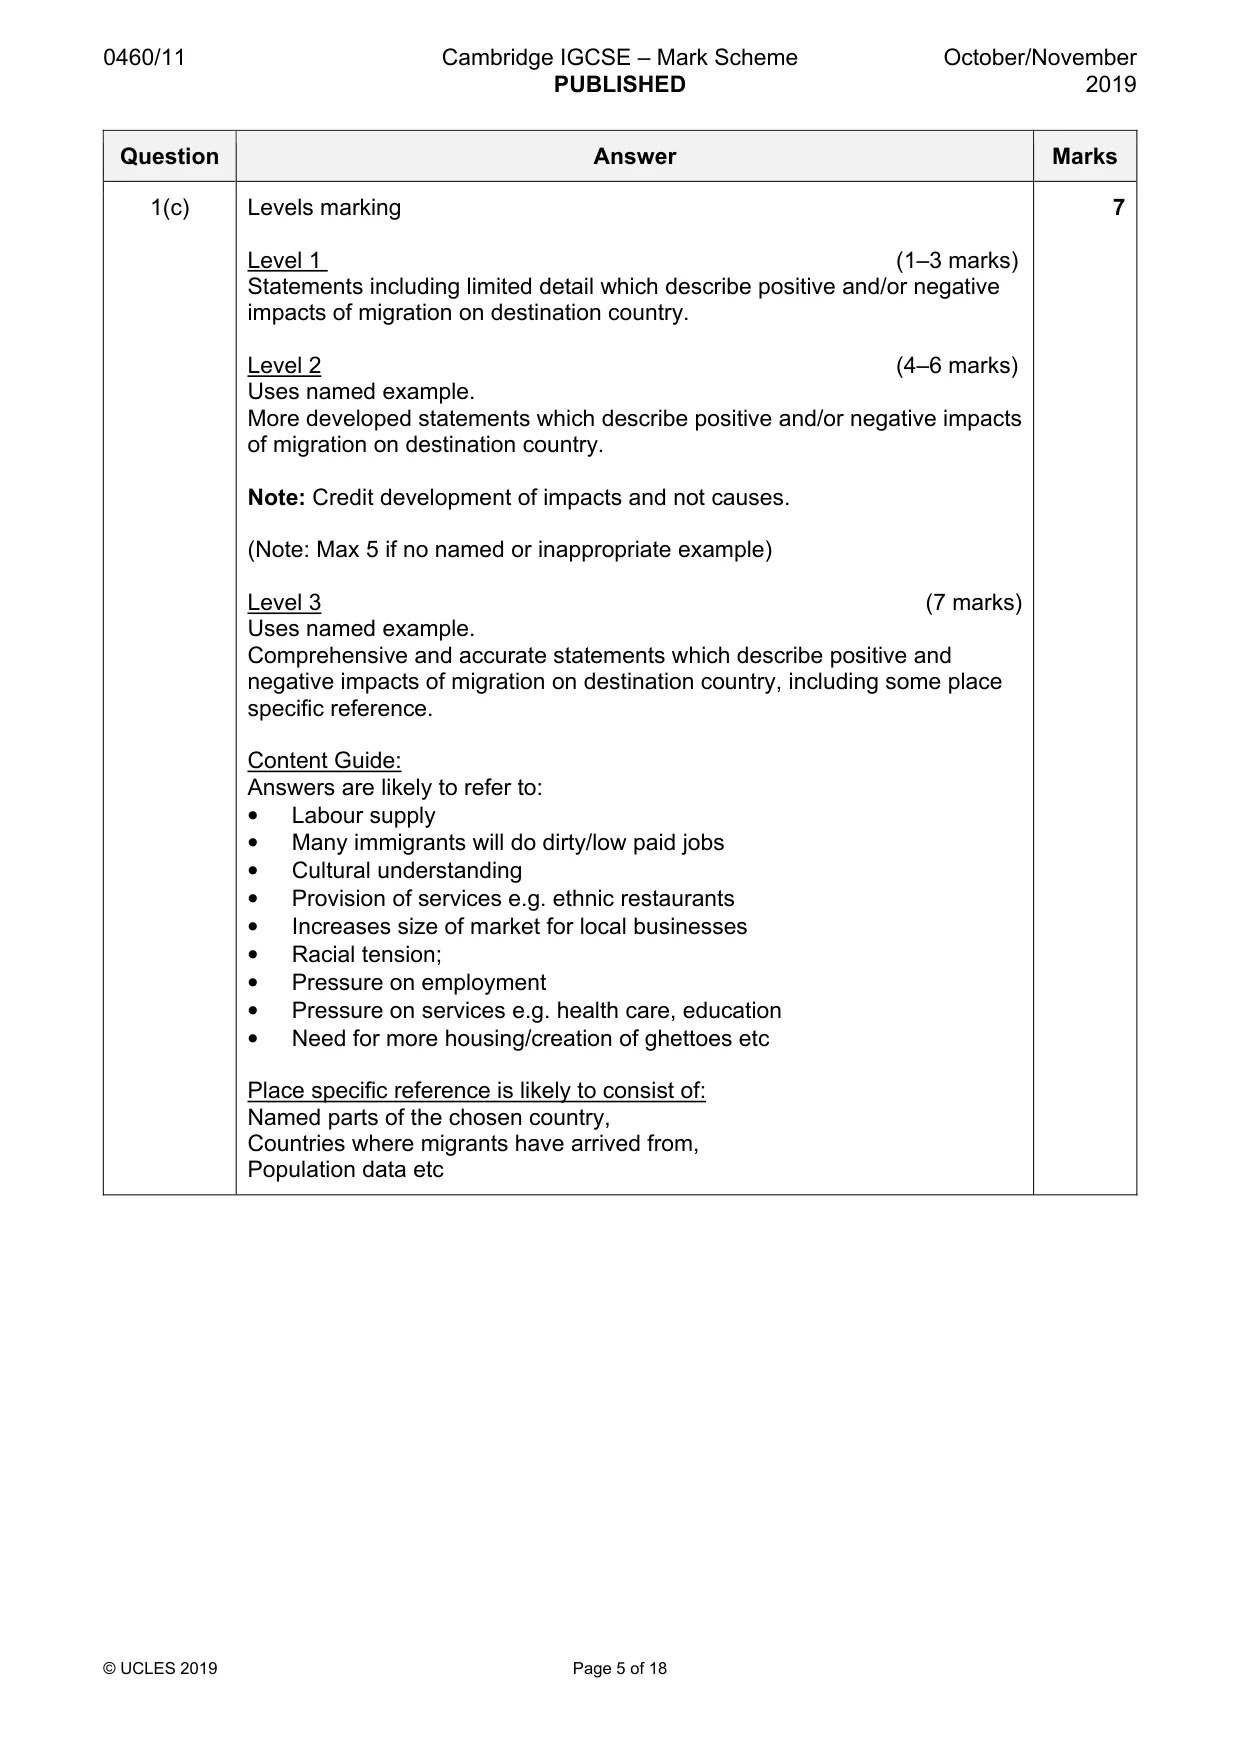
0460/11 Cambridge IGCSE – Mark Scheme PUBLISHED October/November 2019 © UCLES 2019 Page 5 of 18 Question Answer Marks 1(c) Levels marking Level 1 (1–3 marks) Statements including limited detail which describe positive and/or negative impacts of migration on destination country. Level 2 (4–6 marks) Uses named example. More developed statements which describe positive and/or negative impacts of migration on destination country. Note: Credit development of impacts and not causes. (Note: Max 5 if no named or inappropriate example) Level 3 (7 marks) Uses named example. Comprehensive and accurate statements which describe positive and negative impacts of migration on destination country, including some place specific reference. Content Guide: Answers are likely to refer to: • Labour supply • Many immigrants will do dirty/low paid jobs • Cultural understanding • Provision of services e.g. ethnic restaurants • Increases size of market for local businesses • Racial tension; • Pressure on employment • Pressure on services e.g. health care, education • Need for more housing/creation of ghettoes etc Place specific reference is likely to consist of: Named parts of the chosen country, Countries where migrants have arrived from, Population data etc 7
Mark scheme, page 6
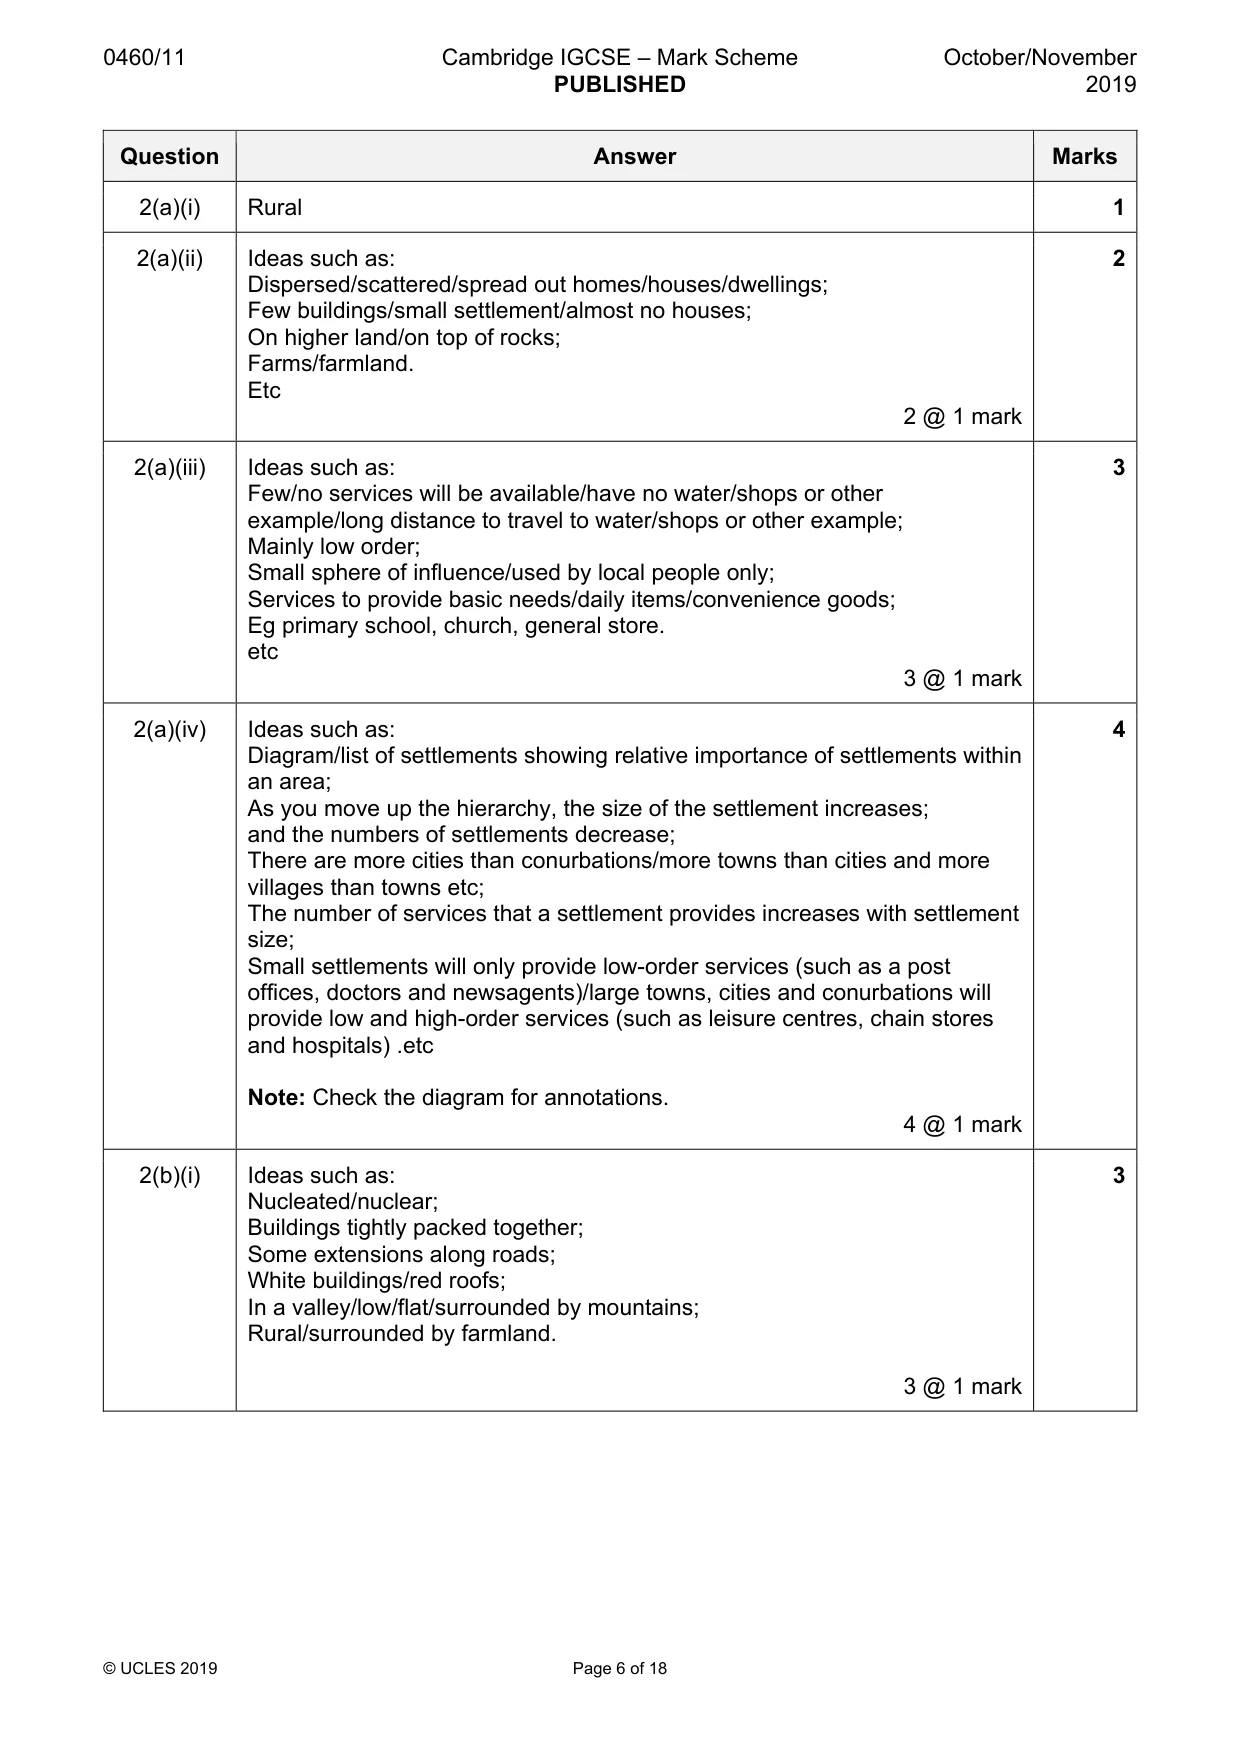
0460/11 Cambridge IGCSE – Mark Scheme PUBLISHED October/November 2019 © UCLES 2019 Page 6 of 18 Question Answer Marks 2(a)(i) Rural 1 2(a)(ii) Ideas such as: Dispersed/scattered/spread out homes/houses/dwellings; Few buildings/small settlement/almost no houses; On higher land/on top of rocks; Farms/farmland. Etc 2 @ 1 mark 2 2(a)(iii) Ideas such as: Few/no services will be available/have no water/shops or other example/long distance to travel to water/shops or other example; Mainly low order; Small sphere of influence/used by local people only; Services to provide basic needs/daily items/convenience goods; Eg primary school, church, general store. etc 3 @ 1 mark 3 2(a)(iv) Ideas such as: Diagram/list of settlements showing relative importance of settlements within an area; As you move up the hierarchy, the size of the settlement increases; and the numbers of settlements decrease; There are more cities than conurbations/more towns than cities and more villages than towns etc; The number of services that a settlement provides increases with settlement size; Small settlements will only provide low-order services (such as a post offices, doctors and newsagents)/large towns, cities and conurbations will provide low and high-order services (such as leisure centres, chain stores and hospitals) .etc Note: Check the diagram for annotations. 4 @ 1 mark 4 2(b)(i) Ideas such as: Nucleated/nuclear; Buildings tightly packed together; Some extensions along roads; White buildings/red roofs; In a valley/low/flat/surrounded by mountains; Rural/surrounded by farmland. 3 @ 1 mark 3
Mark scheme, page 7
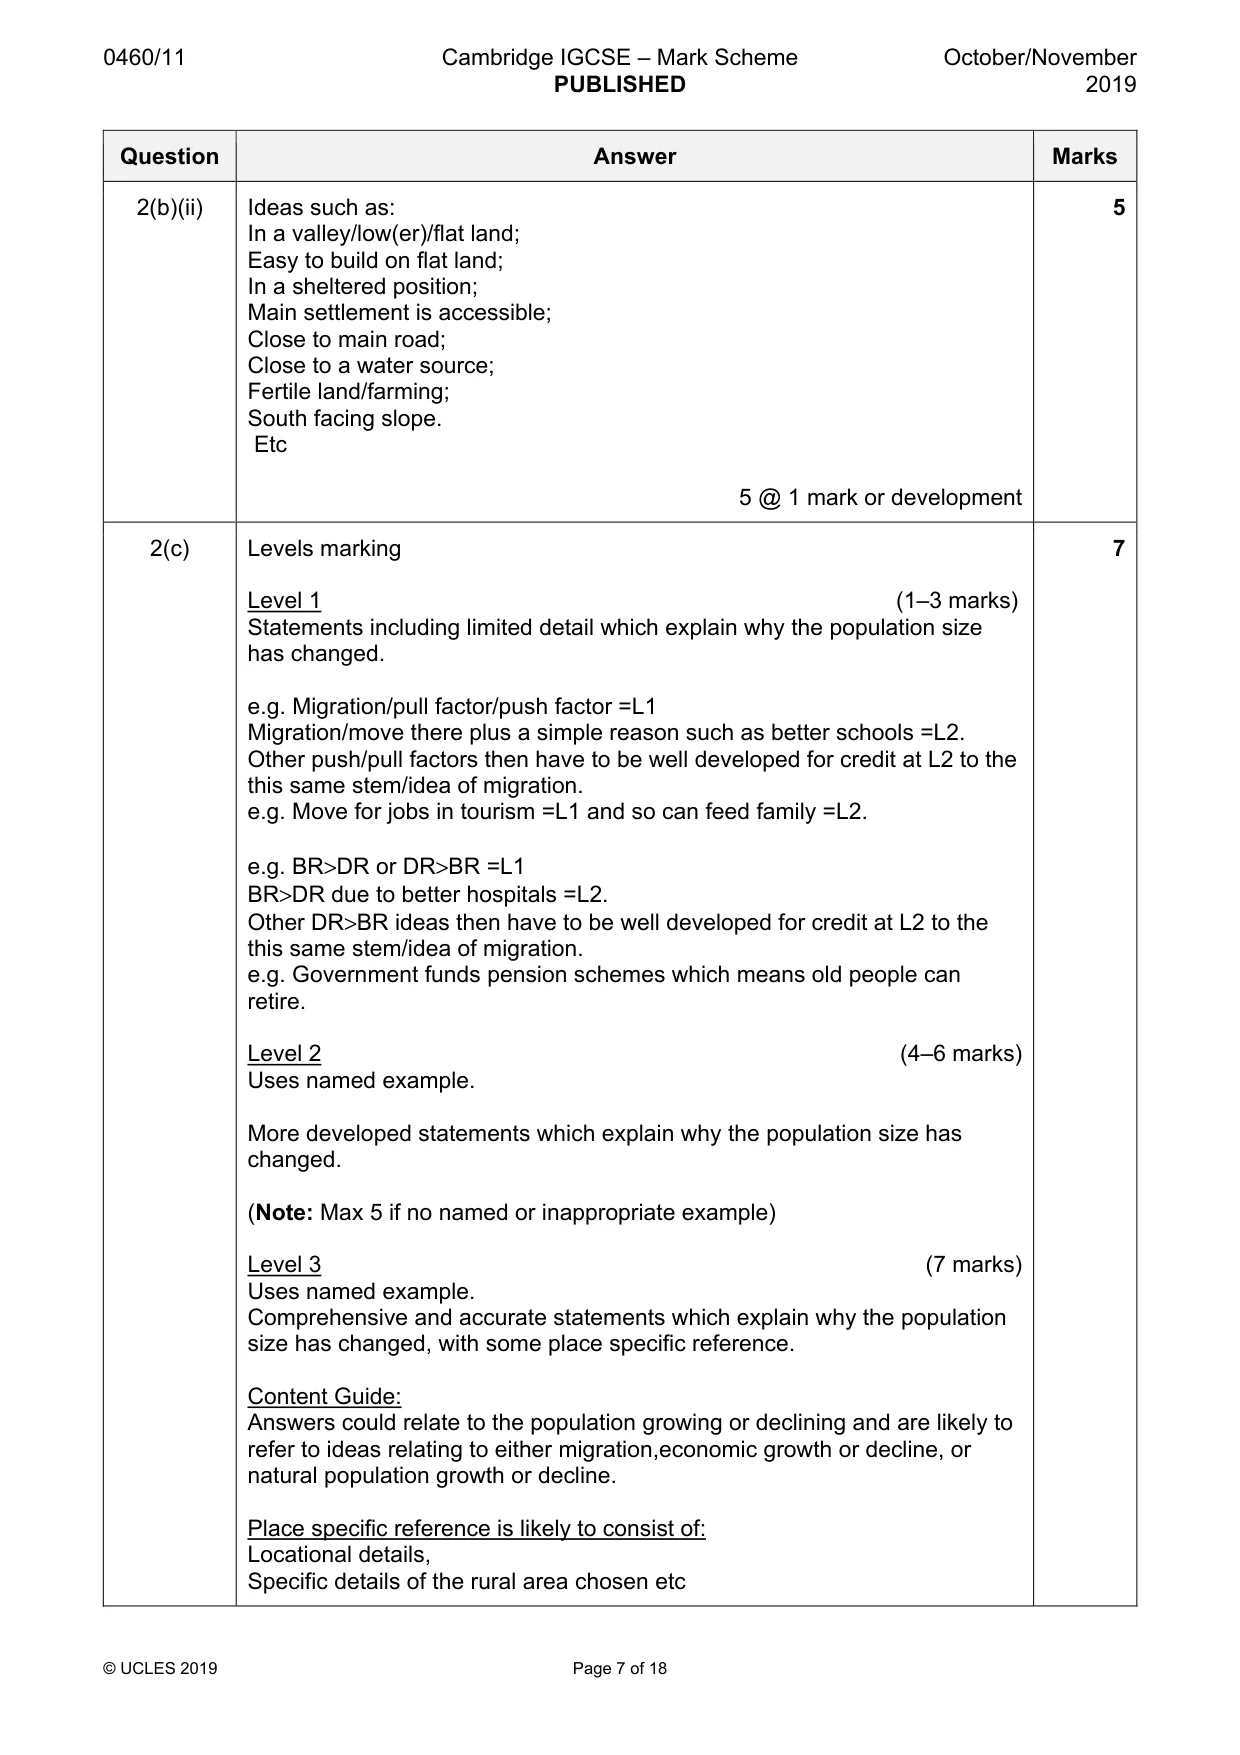
0460/11 Cambridge IGCSE – Mark Scheme PUBLISHED October/November 2019 © UCLES 2019 Page 7 of 18 Question Answer Marks 2(b)(ii) Ideas such as: In a valley/low(er)/flat land; Easy to build on flat land; In a sheltered position; Main settlement is accessible; Close to main road; Close to a water source; Fertile land/farming; South facing slope. Etc 5 @ 1 mark or development 5 2(c) Levels marking Level 1 (1–3 marks) Statements including limited detail which explain why the population size has changed. e.g. Migration/pull factor/push factor =L1 Migration/move there plus a simple reason such as better schools =L2. Other push/pull factors then have to be well developed for credit at L2 to the this same stem/idea of migration. e.g. Move for jobs in tourism =L1 and so can feed family =L2. e.g. BR>DR or DR>BR =L1 BR>DR due to better hospitals =L2. Other DR>BR ideas then have to be well developed for credit at L2 to the this same stem/idea of migration. e.g. Government funds pension schemes which means old people can retire. Level 2 (4–6 marks) Uses named example. More developed statements which explain why the population size has changed. (Note: Max 5 if no named or inappropriate example) Level 3 (7 marks) Uses named example. Comprehensive and accurate statements which explain why the population size has changed, with some place specific reference. Content Guide: Answers could relate to the population growing or declining and are likely to refer to ideas relating to either migration,economic growth or decline, or natural population growth or decline. Place specific reference is likely to consist of: Locational details, Specific details of the rural area chosen etc 7
Mark scheme, page 8
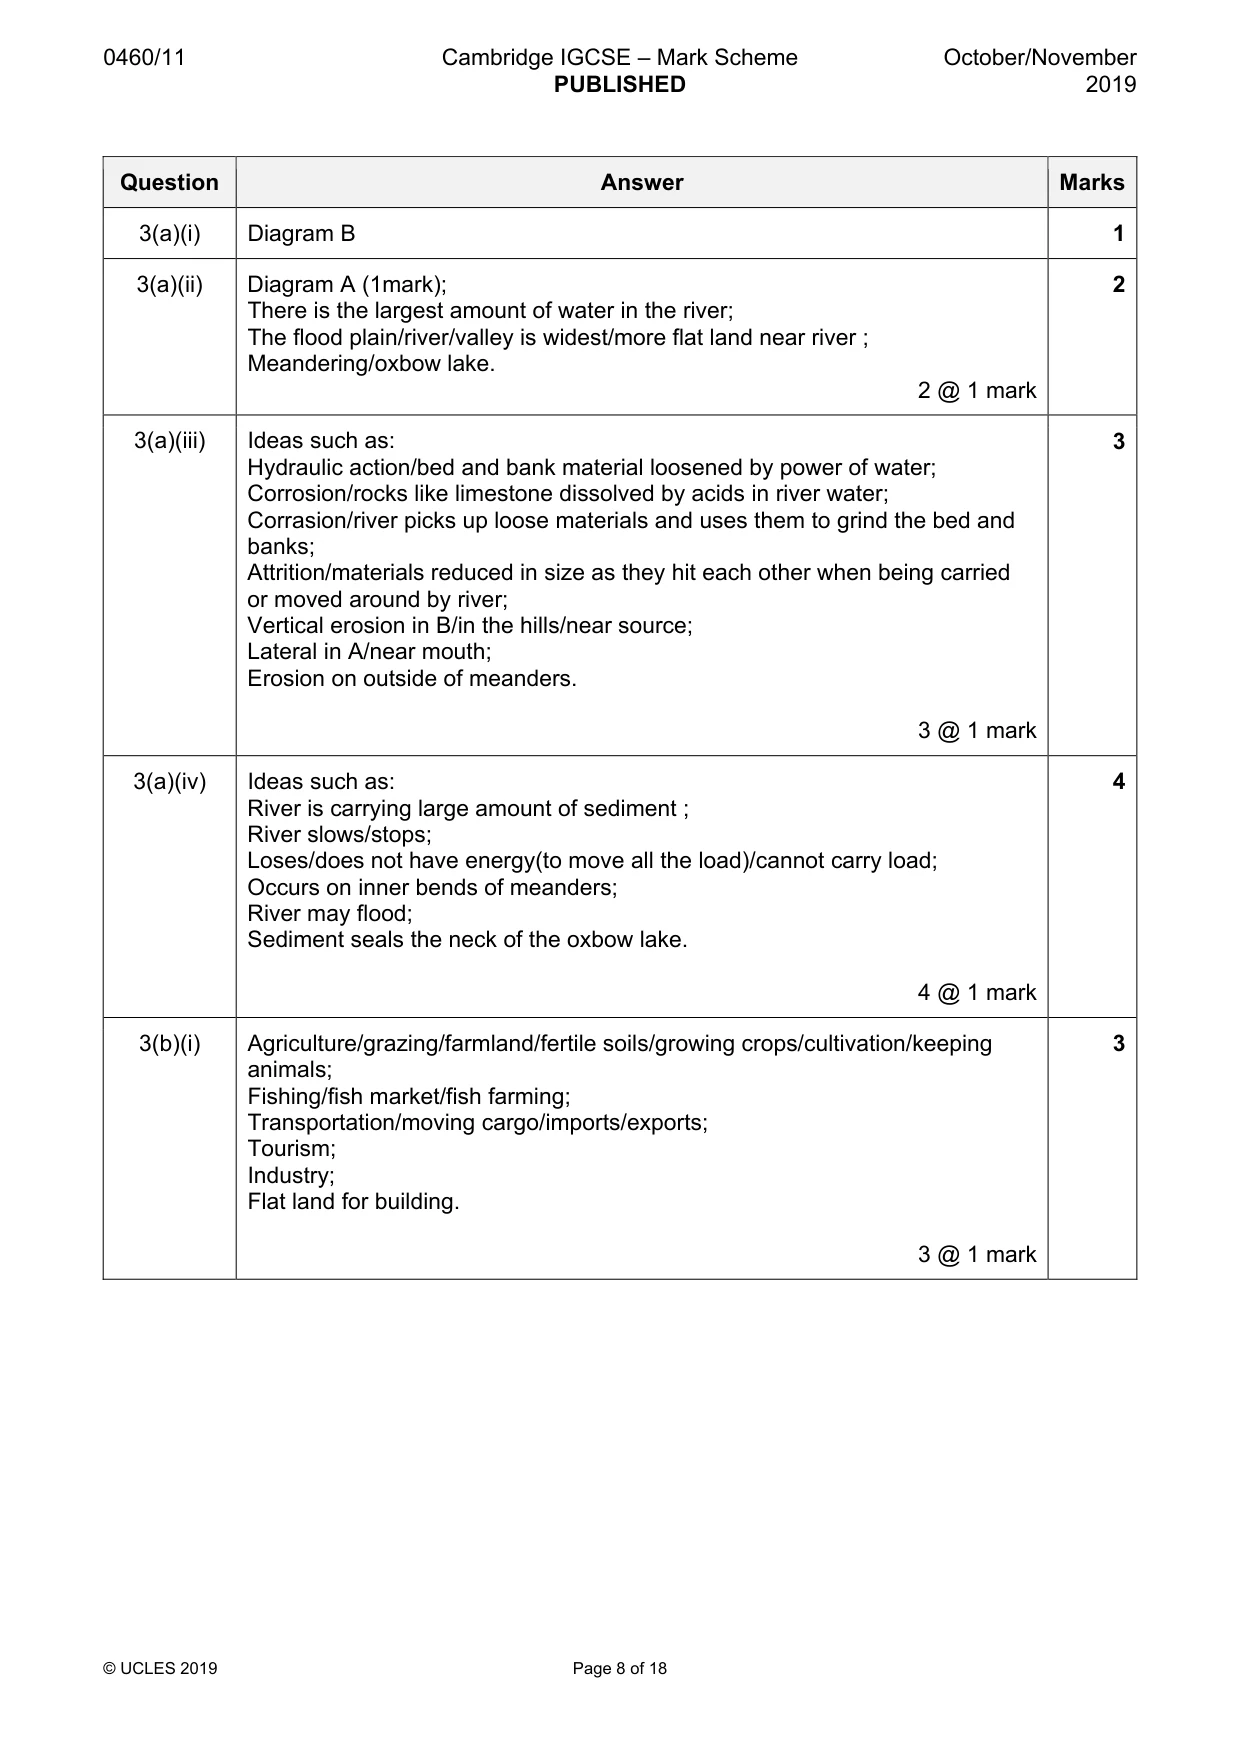
0460/11 Cambridge IGCSE – Mark Scheme PUBLISHED October/November 2019 © UCLES 2019 Page 8 of 18 Question Answer Marks 3(a)(i) Diagram B 1 3(a)(ii) Diagram A (1mark); There is the largest amount of water in the river; The flood plain/river/valley is widest/more flat land near river ; Meandering/oxbow lake. 2 @ 1 mark 2 3(a)(iii) Ideas such as: Hydraulic action/bed and bank material loosened by power of water; Corrosion/rocks like limestone dissolved by acids in river water; Corrasion/river picks up loose materials and uses them to grind the bed and banks; Attrition/materials reduced in size as they hit each other when being carried or moved around by river; Vertical erosion in B/in the hills/near source; Lateral in A/near mouth; Erosion on outside of meanders. 3 @ 1 mark 3 3(a)(iv) Ideas such as: River is carrying large amount of sediment ; River slows/stops; Loses/does not have energy(to move all the load)/cannot carry load; Occurs on inner bends of meanders; River may flood; Sediment seals the neck of the oxbow lake. 4 @ 1 mark 4 3(b)(i) Agriculture/grazing/farmland/fertile soils/growing crops/cultivation/keeping animals; Fishing/fish market/fish farming; Transportation/moving cargo/imports/exports; Tourism; Industry; Flat land for building. 3 @ 1 mark 3
Mark scheme, page 9
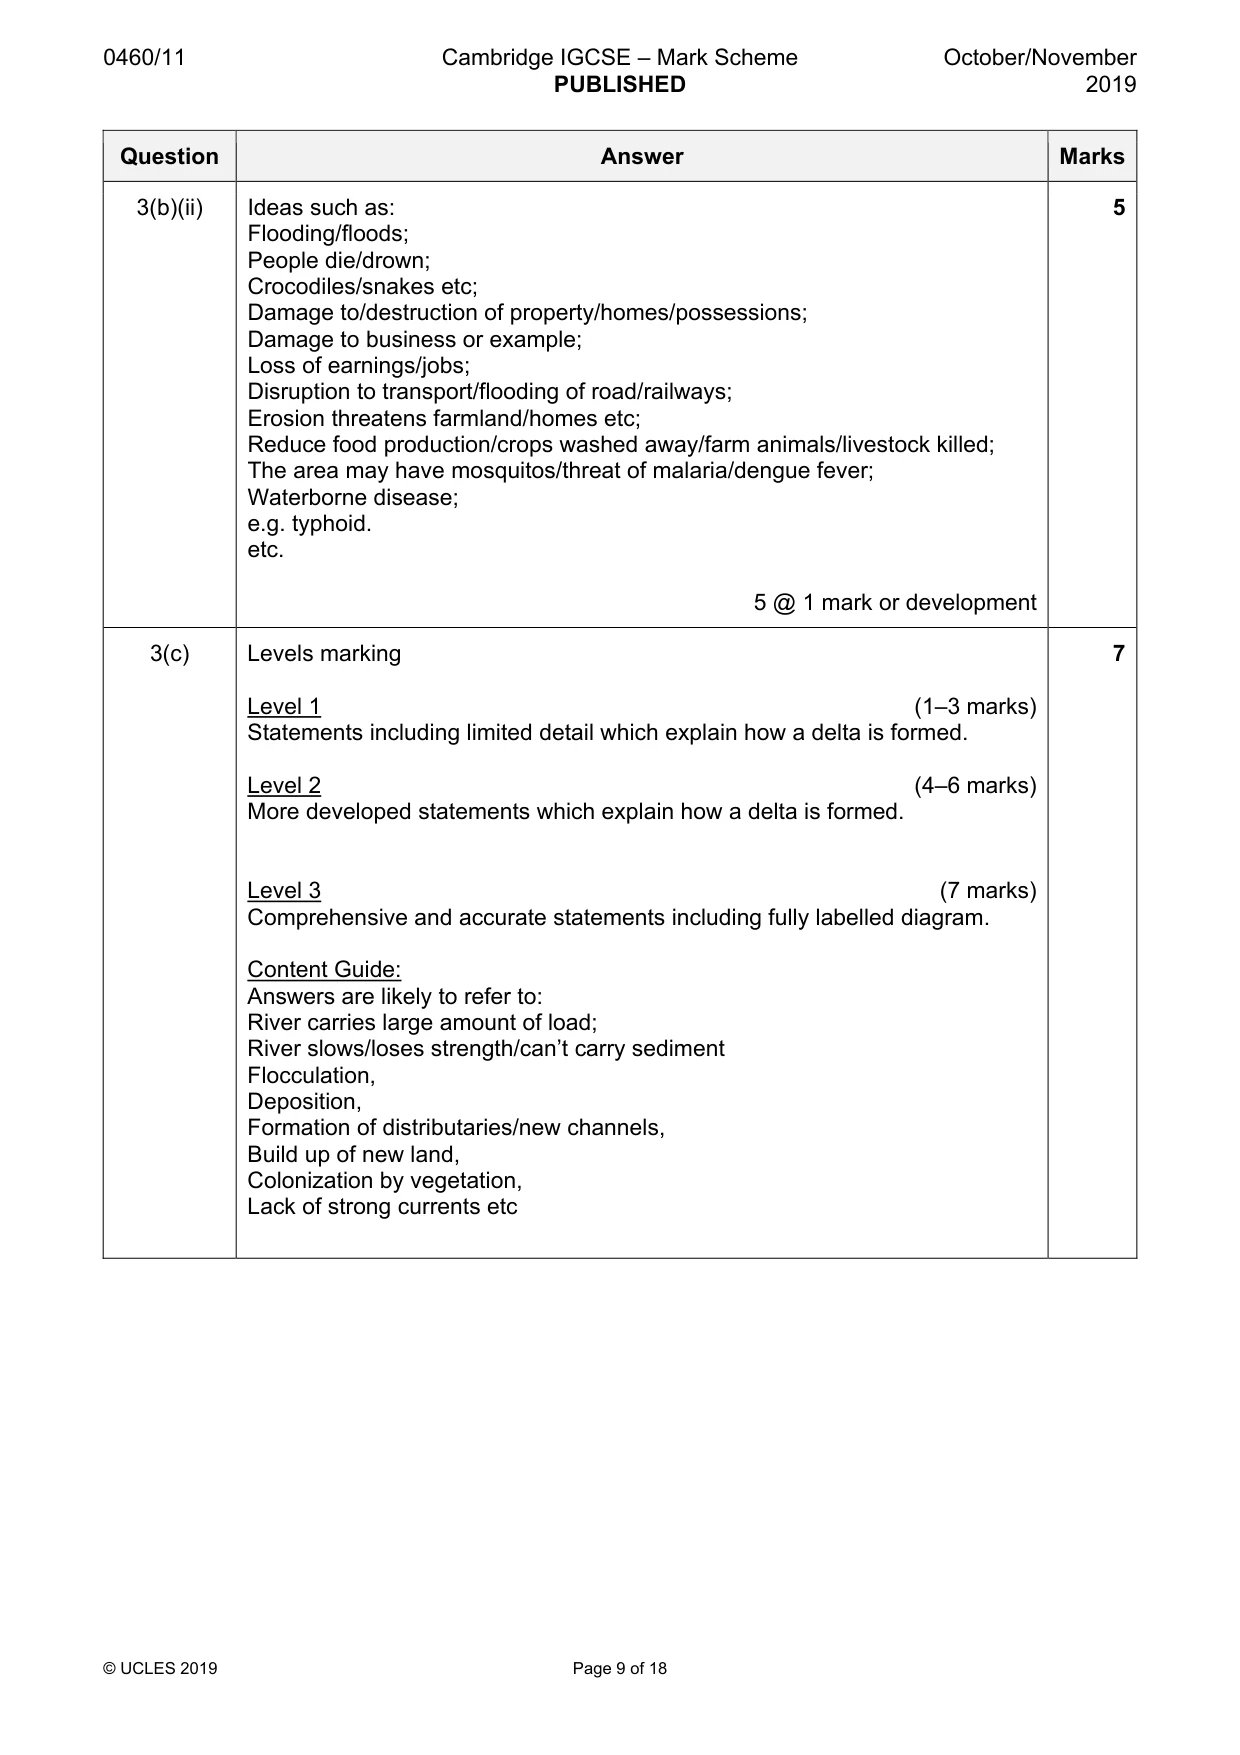
0460/11 Cambridge IGCSE – Mark Scheme PUBLISHED October/November 2019 © UCLES 2019 Page 9 of 18 Question Answer Marks 3(b)(ii) Ideas such as: Flooding/floods; People die/drown; Crocodiles/snakes etc; Damage to/destruction of property/homes/possessions; Damage to business or example; Loss of earnings/jobs; Disruption to transport/flooding of road/railways; Erosion threatens farmland/homes etc; Reduce food production/crops washed away/farm animals/livestock killed; The area may have mosquitos/threat of malaria/dengue fever; Waterborne disease; e.g. typhoid. etc. 5 @ 1 mark or development 5 3(c) Levels marking Level 1 (1–3 marks) Statements including limited detail which explain how a delta is formed. Level 2 (4–6 marks) More developed statements which explain how a delta is formed. Level 3 (7 marks) Comprehensive and accurate statements including fully labelled diagram. Content Guide: Answers are likely to refer to: River carries large amount of load; River slows/loses strength/can’t carry sediment Flocculation, Deposition, Formation of distributaries/new channels, Build up of new land, Colonization by vegetation, Lack of strong currents etc 7
Mark scheme, page 10
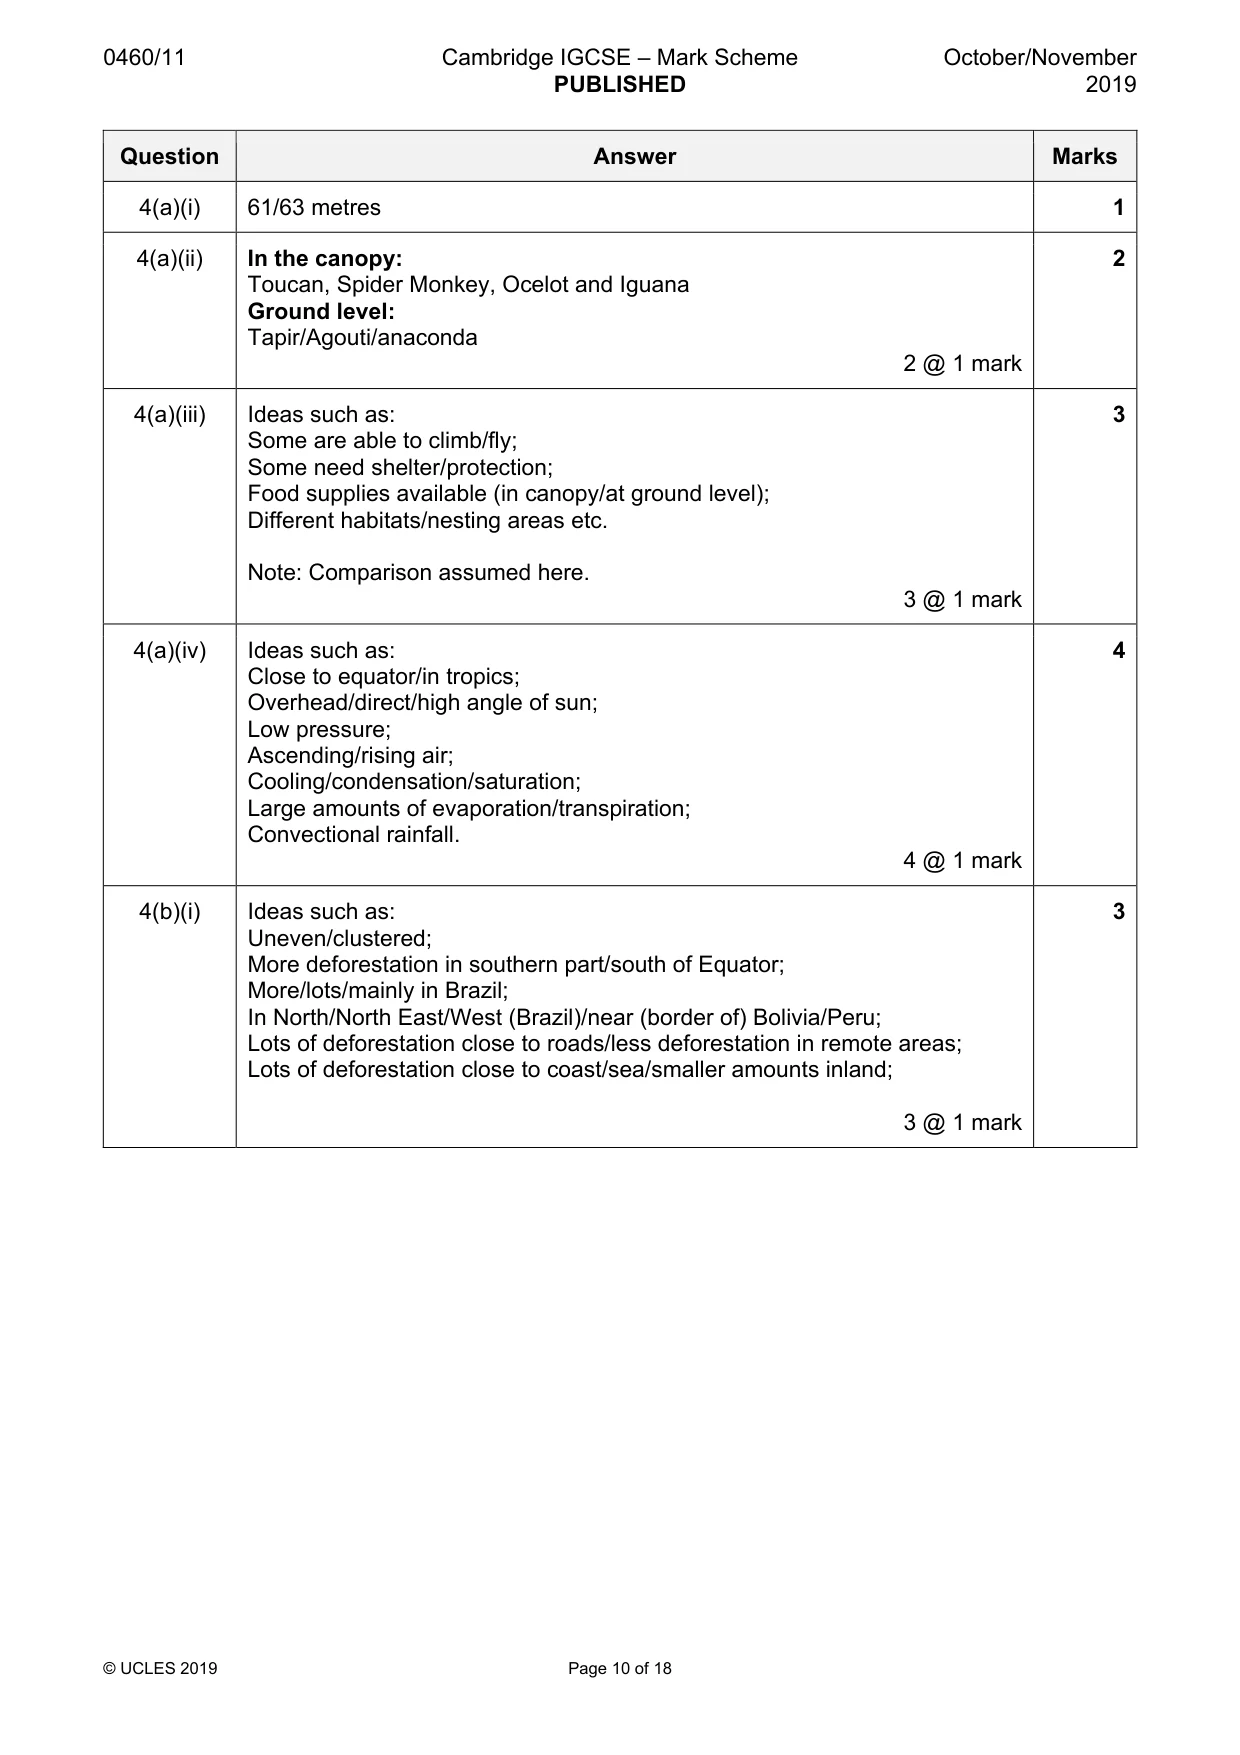
0460/11 Cambridge IGCSE – Mark Scheme PUBLISHED October/November 2019 © UCLES 2019 Page 10 of 18 Question Answer Marks 4(a)(i) 61/63 metres 1 4(a)(ii) In the canopy: Toucan, Spider Monkey, Ocelot and Iguana Ground level: Tapir/Agouti/anaconda 2 @ 1 mark 2 4(a)(iii) Ideas such as: Some are able to climb/fly; Some need shelter/protection; Food supplies available (in canopy/at ground level); Different habitats/nesting areas etc. Note: Comparison assumed here. 3 @ 1 mark 3 4(a)(iv) Ideas such as: Close to equator/in tropics; Overhead/direct/high angle of sun; Low pressure; Ascending/rising air; Cooling/condensation/saturation; Large amounts of evaporation/transpiration; Convectional rainfall. 4 @ 1 mark 4 4(b)(i) Ideas such as: Uneven/clustered; More deforestation in southern part/south of Equator; More/lots/mainly in Brazil; In North/North East/West (Brazil)/near (border of) Bolivia/Peru; Lots of deforestation close to roads/less deforestation in remote areas; Lots of deforestation close to coast/sea/smaller amounts inland; 3 @ 1 mark 3
Mark scheme, page 11
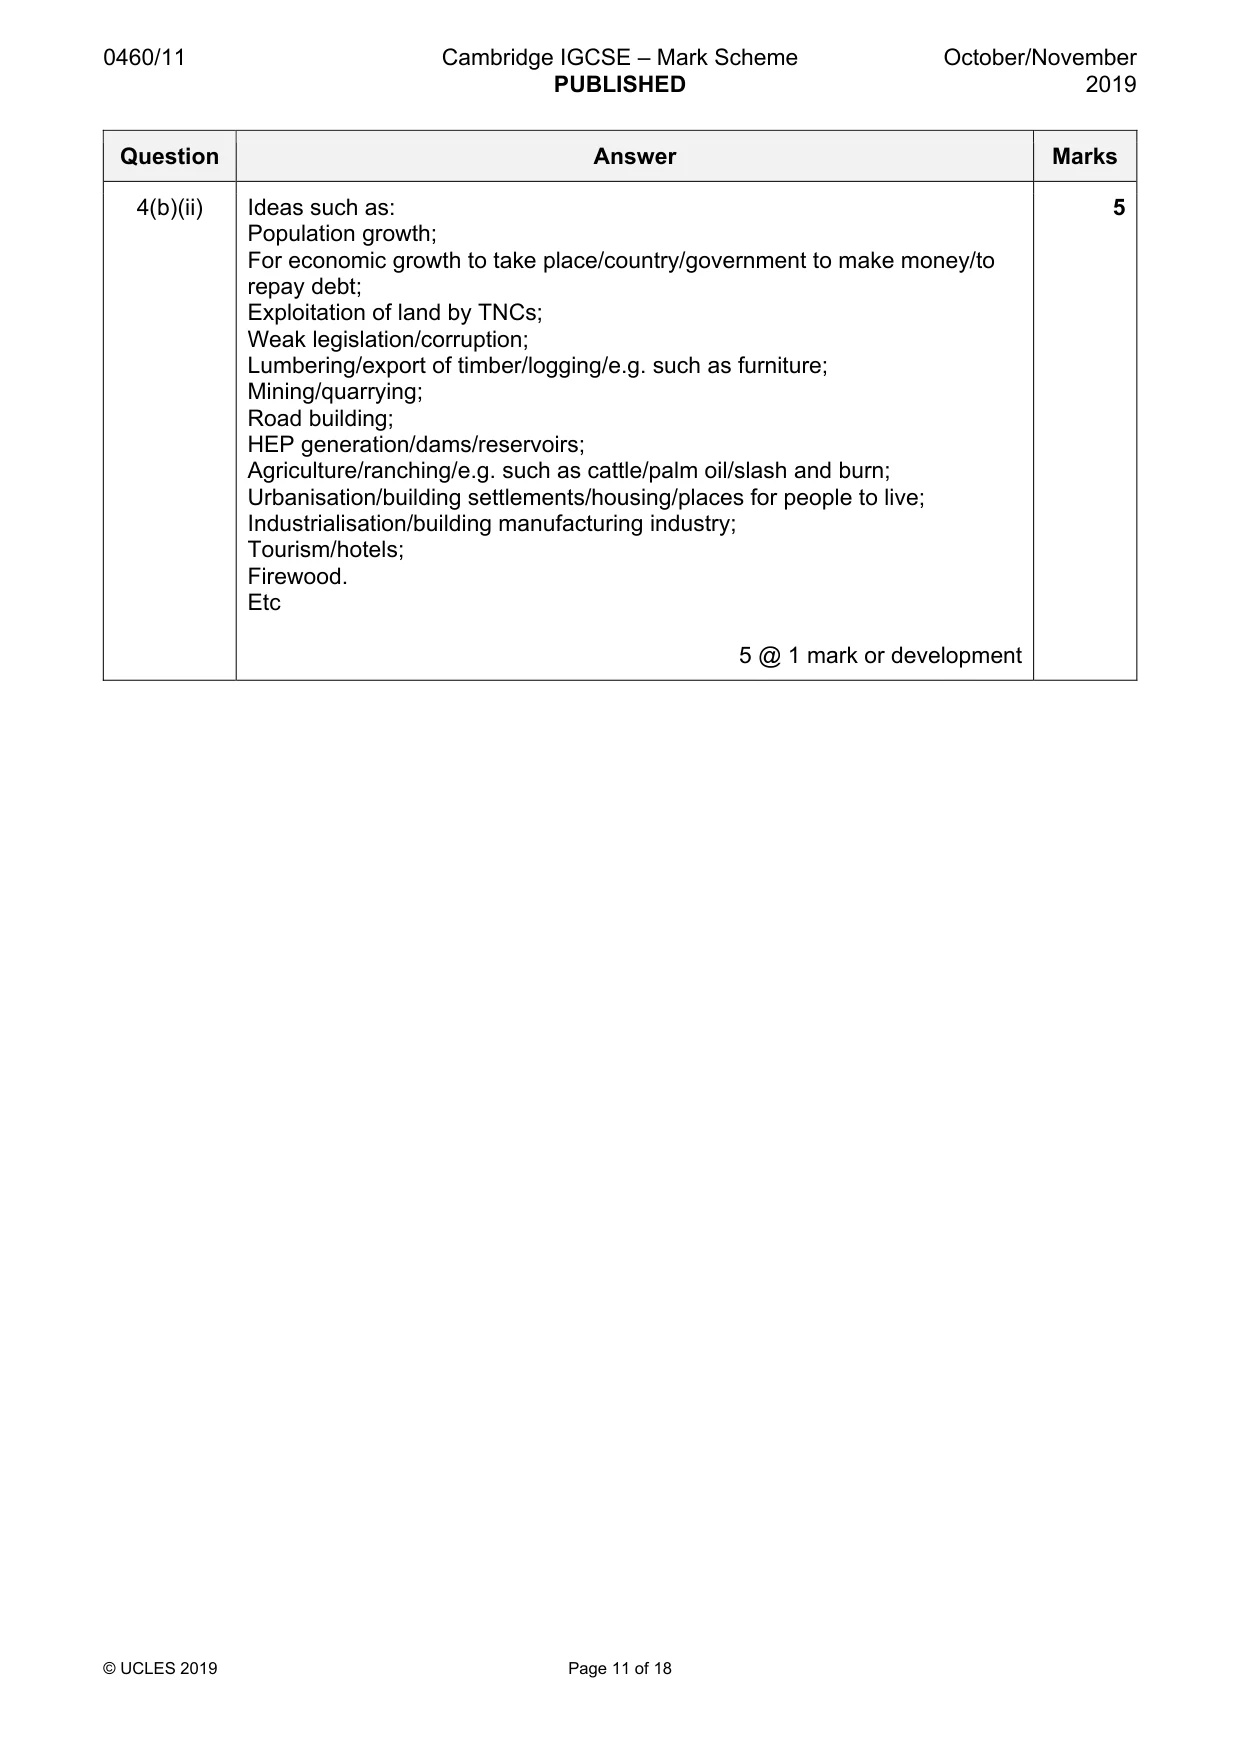
0460/11 Cambridge IGCSE – Mark Scheme PUBLISHED October/November 2019 © UCLES 2019 Page 11 of 18 Question Answer Marks 4(b)(ii) Ideas such as: Population growth; For economic growth to take place/country/government to make money/to repay debt; Exploitation of land by TNCs; Weak legislation/corruption; Lumbering/export of timber/logging/e.g. such as furniture; Mining/quarrying; Road building; HEP generation/dams/reservoirs; Agriculture/ranching/e.g. such as cattle/palm oil/slash and burn; Urbanisation/building settlements/housing/places for people to live; Industrialisation/building manufacturing industry; Tourism/hotels; Firewood. Etc 5 @ 1 mark or development 5
Mark scheme, page 12
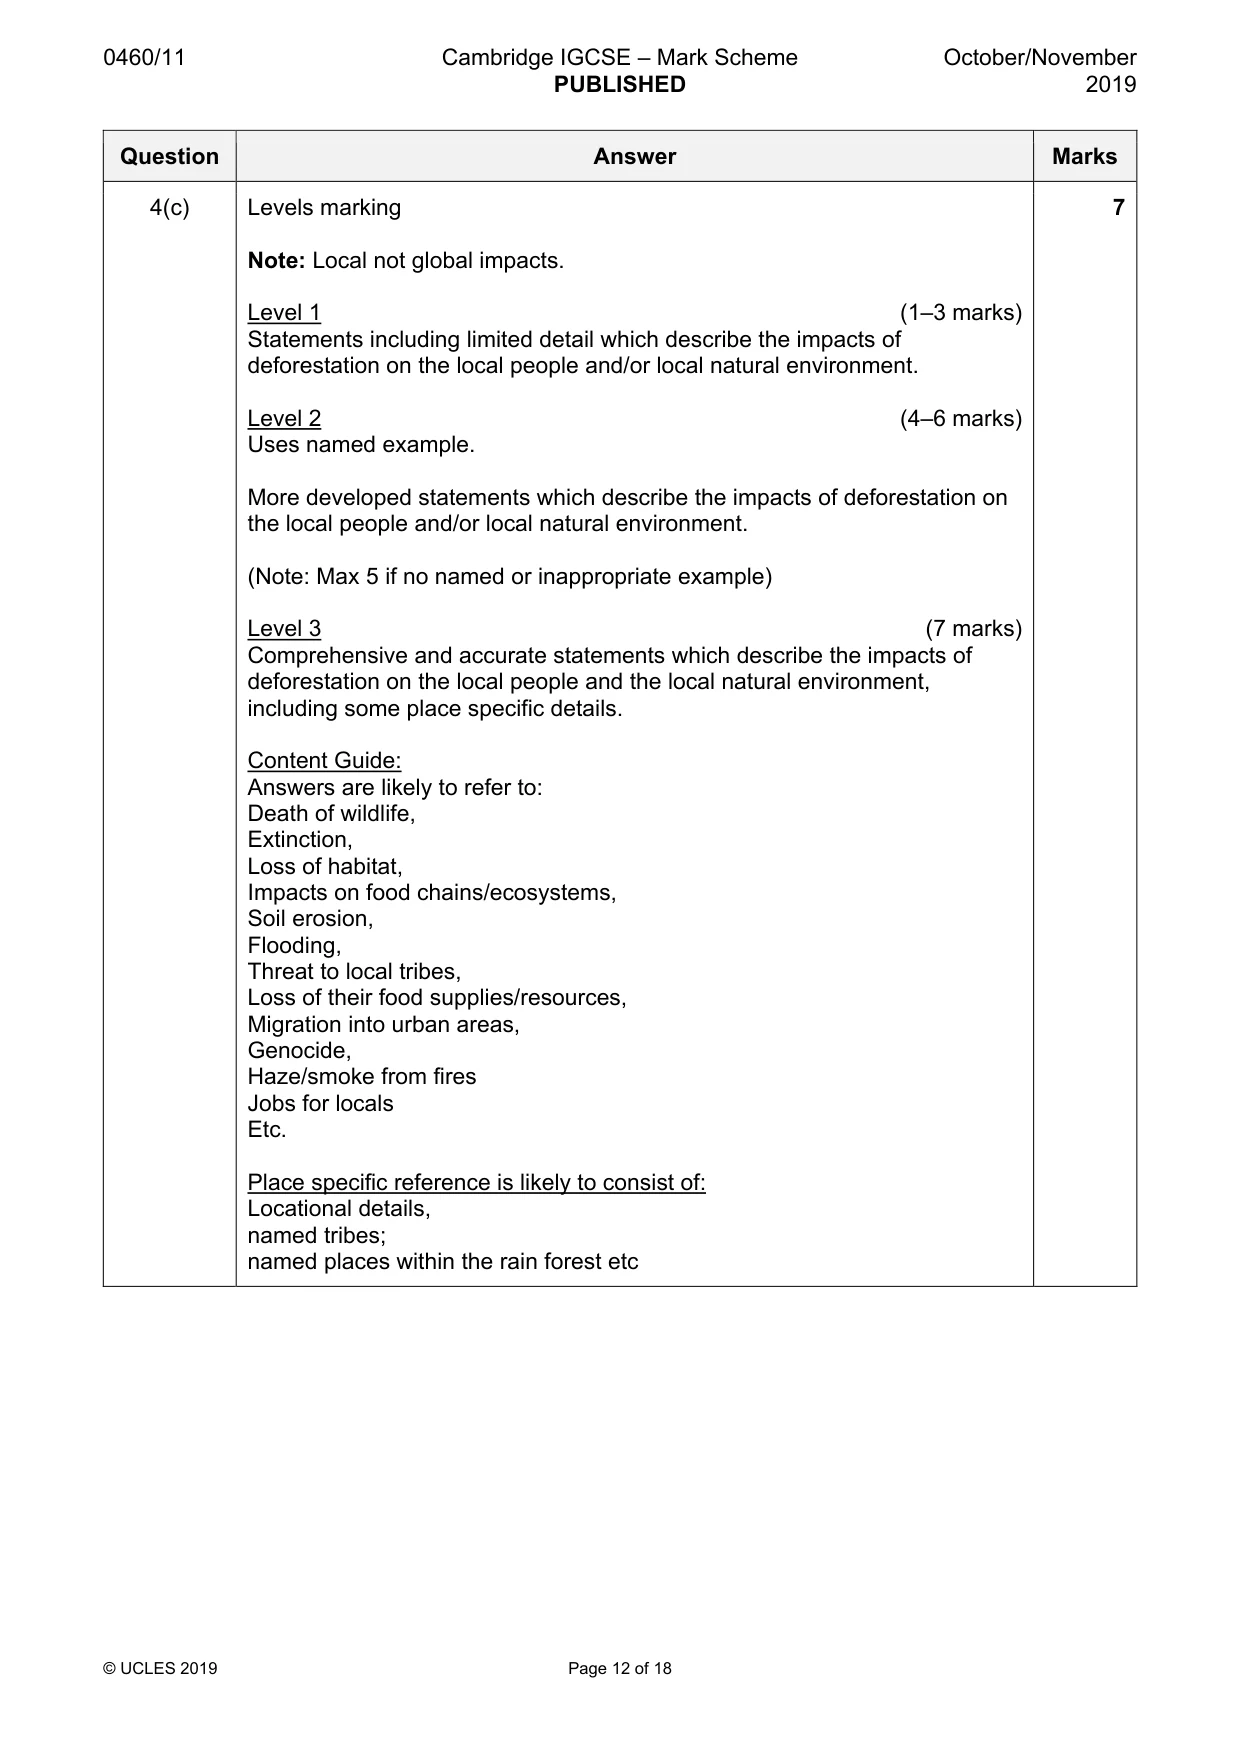
0460/11 Cambridge IGCSE – Mark Scheme PUBLISHED October/November 2019 © UCLES 2019 Page 12 of 18 Question Answer Marks 4(c) Levels marking Note: Local not global impacts. Level 1 (1–3 marks) Statements including limited detail which describe the impacts of deforestation on the local people and/or local natural environment. Level 2 (4–6 marks) Uses named example. More developed statements which describe the impacts of deforestation on the local people and/or local natural environment. (Note: Max 5 if no named or inappropriate example) Level 3 (7 marks) Comprehensive and accurate statements which describe the impacts of deforestation on the local people and the local natural environment, including some place specific details. Content Guide: Answers are likely to refer to: Death of wildlife, Extinction, Loss of habitat, Impacts on food chains/ecosystems, Soil erosion, Flooding, Threat to local tribes, Loss of their food supplies/resources, Migration into urban areas, Genocide, Haze/smoke from fires Jobs for locals Etc. Place specific reference is likely to consist of: Locational details, named tribes; named places within the rain forest etc 7
Mark scheme, page 13
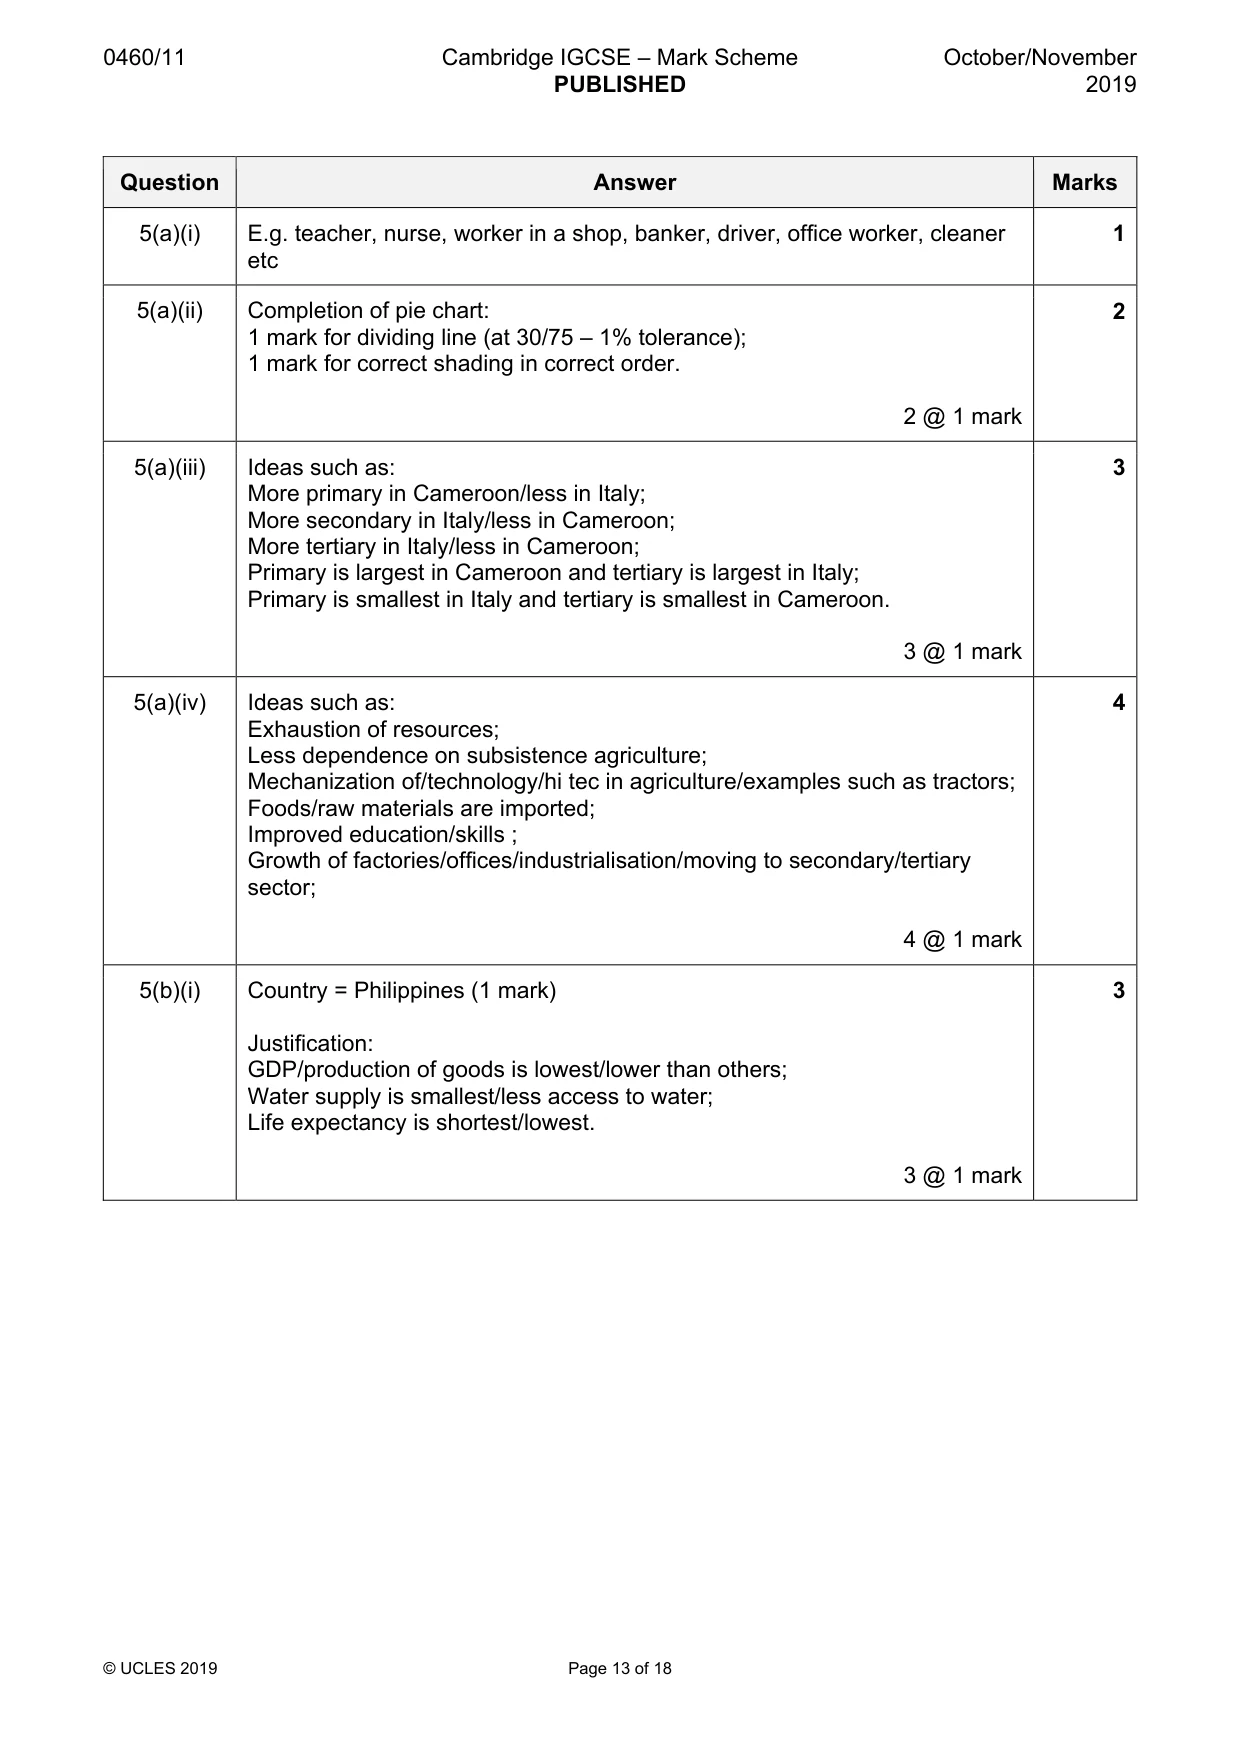
0460/11 Cambridge IGCSE – Mark Scheme PUBLISHED October/November 2019 © UCLES 2019 Page 13 of 18 Question Answer Marks 5(a)(i) E.g. teacher, nurse, worker in a shop, banker, driver, office worker, cleaner etc 1 5(a)(ii) Completion of pie chart: 1 mark for dividing line (at 30/75 – 1% tolerance); 1 mark for correct shading in correct order. 2 @ 1 mark 2 5(a)(iii) Ideas such as: More primary in Cameroon/less in Italy; More secondary in Italy/less in Cameroon; More tertiary in Italy/less in Cameroon; Primary is largest in Cameroon and tertiary is largest in Italy; Primary is smallest in Italy and tertiary is smallest in Cameroon. 3 @ 1 mark 3 5(a)(iv) Ideas such as: Exhaustion of resources; Less dependence on subsistence agriculture; Mechanization of/technology/hi tec in agriculture/examples such as tractors; Foods/raw materials are imported; Improved education/skills ; Growth of factories/offices/industrialisation/moving to secondary/tertiary sector; 4 @ 1 mark 4 5(b)(i) Country = Philippines (1 mark) Justification: GDP/production of goods is lowest/lower than others; Water supply is smallest/less access to water; Life expectancy is shortest/lowest. 3 @ 1 mark 3
Mark scheme, page 14
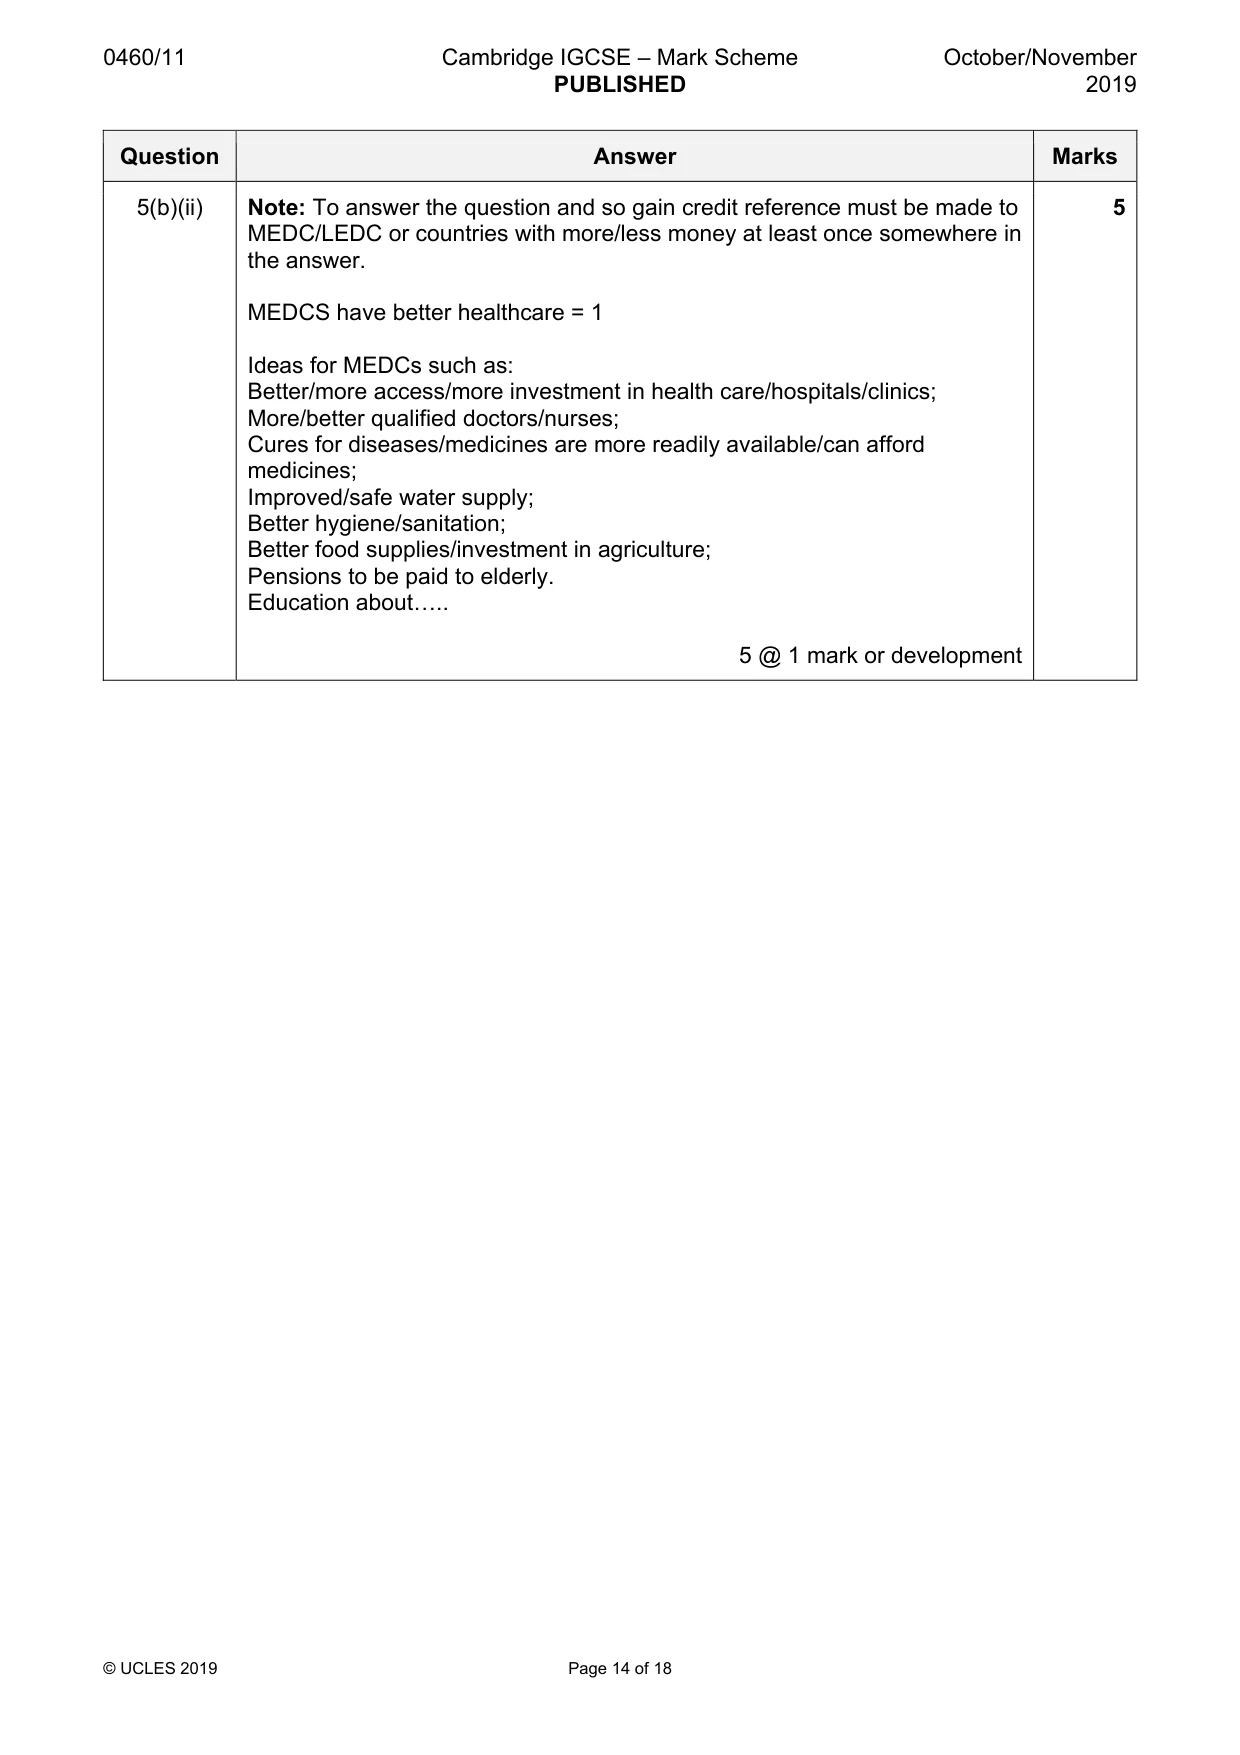
0460/11 Cambridge IGCSE – Mark Scheme PUBLISHED October/November 2019 © UCLES 2019 Page 14 of 18 Question Answer Marks 5(b)(ii) Note: To answer the question and so gain credit reference must be made to MEDC/LEDC or countries with more/less money at least once somewhere in the answer. MEDCS have better healthcare = 1 Ideas for MEDCs such as: Better/more access/more investment in health care/hospitals/clinics; More/better qualified doctors/nurses; Cures for diseases/medicines are more readily available/can afford medicines; Improved/safe water supply; Better hygiene/sanitation; Better food supplies/investment in agriculture; Pensions to be paid to elderly. Education about«.. 5 @ 1 mark or development 5
Mark scheme, page 15
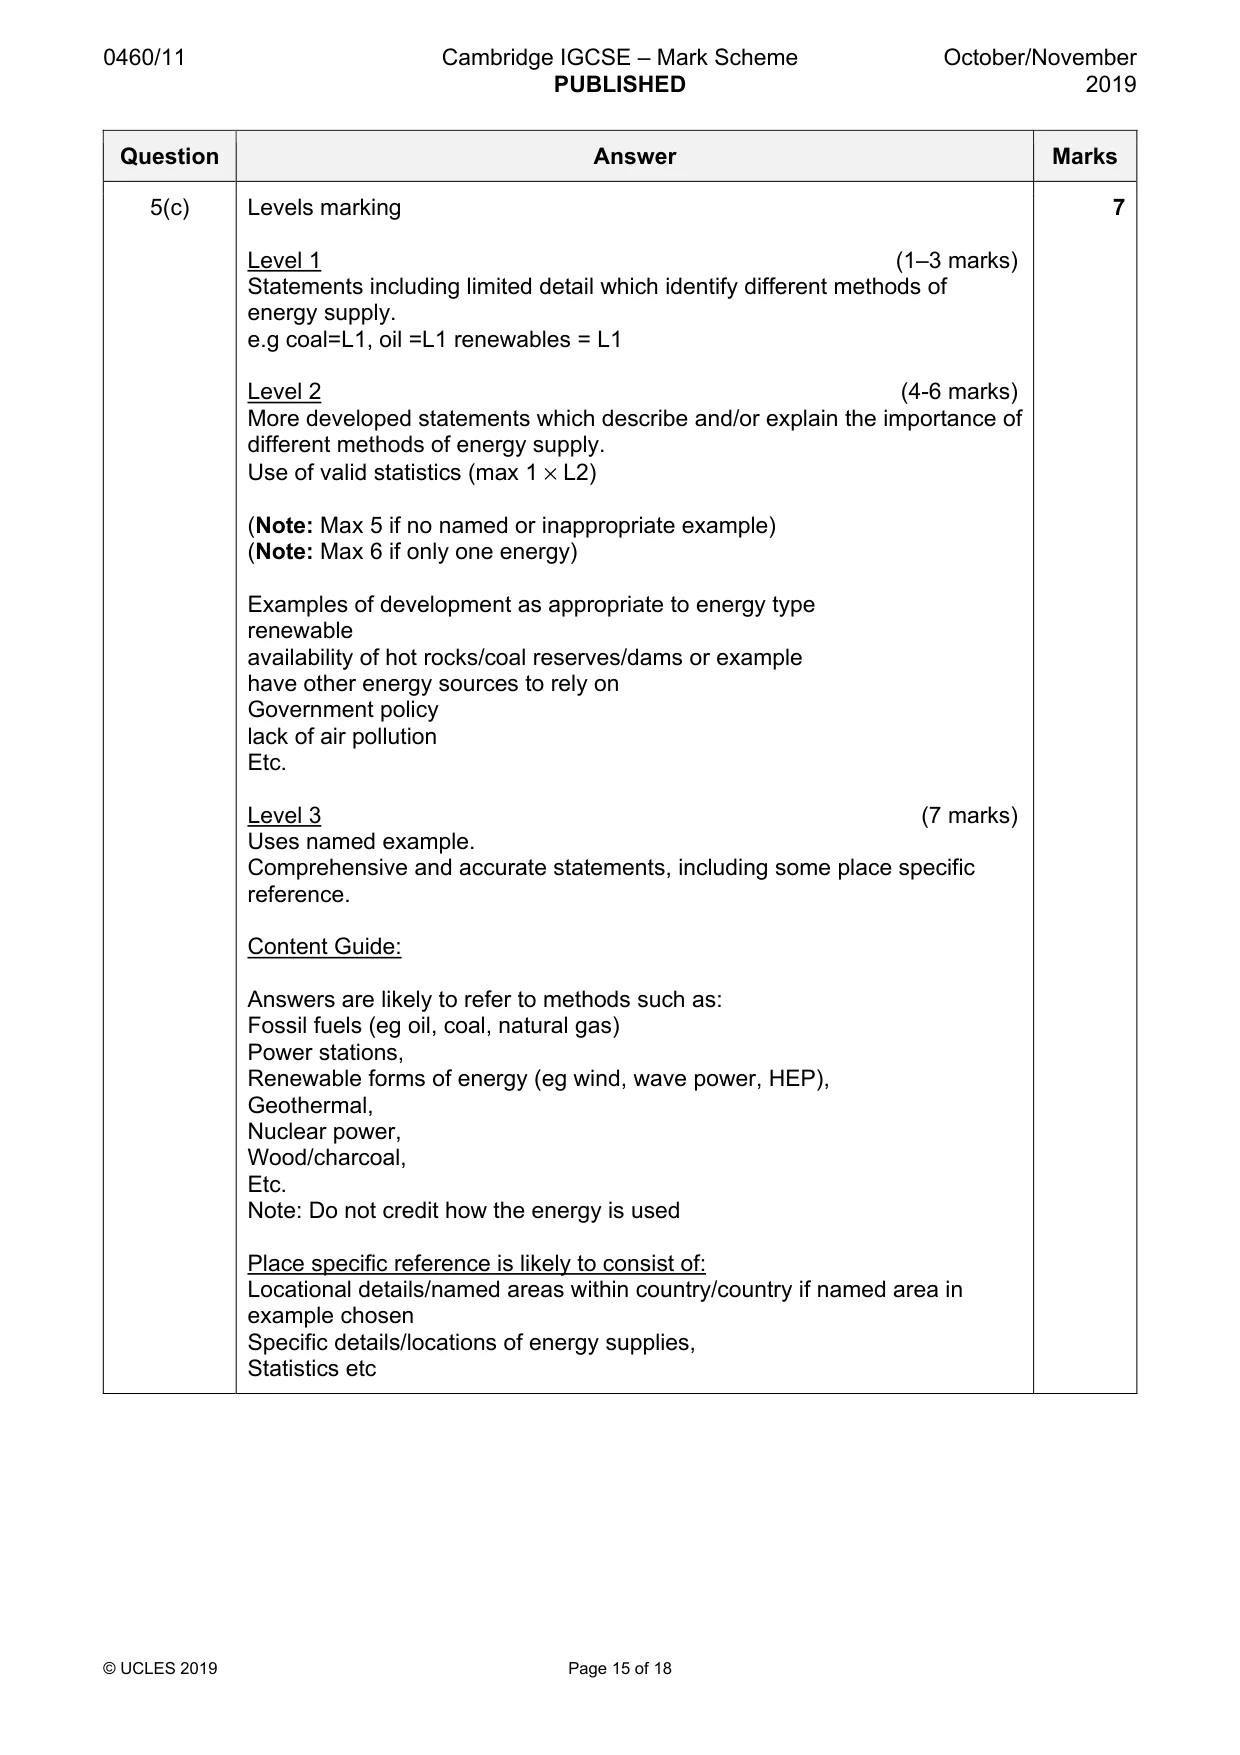
0460/11 Cambridge IGCSE – Mark Scheme PUBLISHED October/November 2019 © UCLES 2019 Page 15 of 18 Question Answer Marks 5(c) Levels marking Level 1 (1–3 marks) Statements including limited detail which identify different methods of energy supply. e.g coal=L1, oil =L1 renewables = L1 Level 2 (4-6 marks) More developed statements which describe and/or explain the importance of different methods of energy supply. Use of valid statistics (max 1 × L2) (Note: Max 5 if no named or inappropriate example) (Note: Max 6 if only one energy) Examples of development as appropriate to energy type renewable availability of hot rocks/coal reserves/dams or example have other energy sources to rely on Government policy lack of air pollution Etc. Level 3 (7 marks) Uses named example. Comprehensive and accurate statements, including some place specific reference. Content Guide: Answers are likely to refer to methods such as: Fossil fuels (eg oil, coal, natural gas) Power stations, Renewable forms of energy (eg wind, wave power, HEP), Geothermal, Nuclear power, Wood/charcoal, Etc. Note: Do not credit how the energy is used Place specific reference is likely to consist of: Locational details/named areas within country/country if named area in example chosen Specific details/locations of energy supplies, Statistics etc 7
Mark scheme, page 16
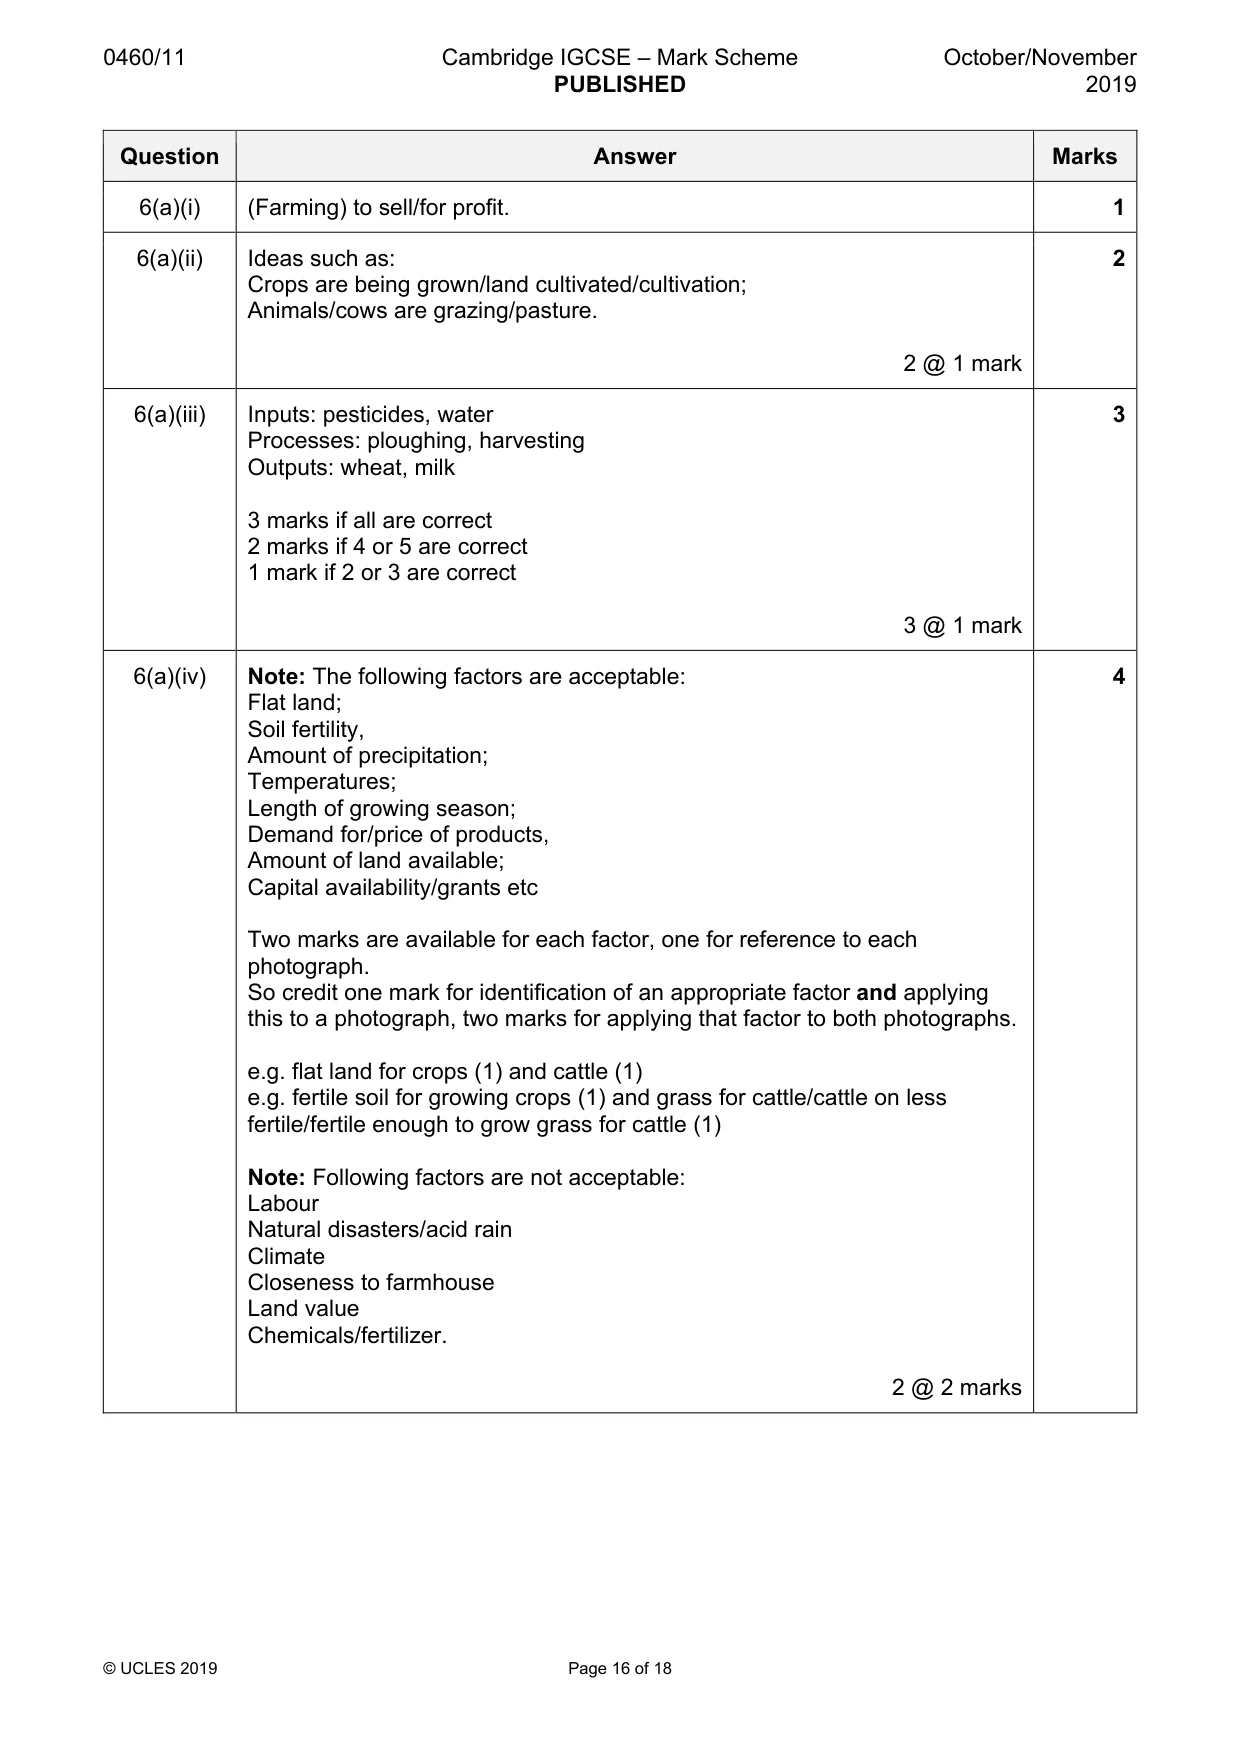
0460/11 Cambridge IGCSE – Mark Scheme PUBLISHED October/November 2019 © UCLES 2019 Page 16 of 18 Question Answer Marks 6(a)(i) (Farming) to sell/for profit. 1 6(a)(ii) Ideas such as: Crops are being grown/land cultivated/cultivation; Animals/cows are grazing/pasture. 2 @ 1 mark 2 6(a)(iii) Inputs: pesticides, water Processes: ploughing, harvesting Outputs: wheat, milk 3 marks if all are correct 2 marks if 4 or 5 are correct 1 mark if 2 or 3 are correct 3 @ 1 mark 3 6(a)(iv) Note: The following factors are acceptable: Flat land; Soil fertility, Amount of precipitation; Temperatures; Length of growing season; Demand for/price of products, Amount of land available; Capital availability/grants etc Two marks are available for each factor, one for reference to each photograph. So credit one mark for identification of an appropriate factor and applying this to a photograph, two marks for applying that factor to both photographs. e.g. flat land for crops (1) and cattle (1) e.g. fertile soil for growing crops (1) and grass for cattle/cattle on less fertile/fertile enough to grow grass for cattle (1) Note: Following factors are not acceptable: Labour Natural disasters/acid rain Climate Closeness to farmhouse Land value Chemicals/fertilizer. 2 @ 2 marks 4
Mark scheme, page 17
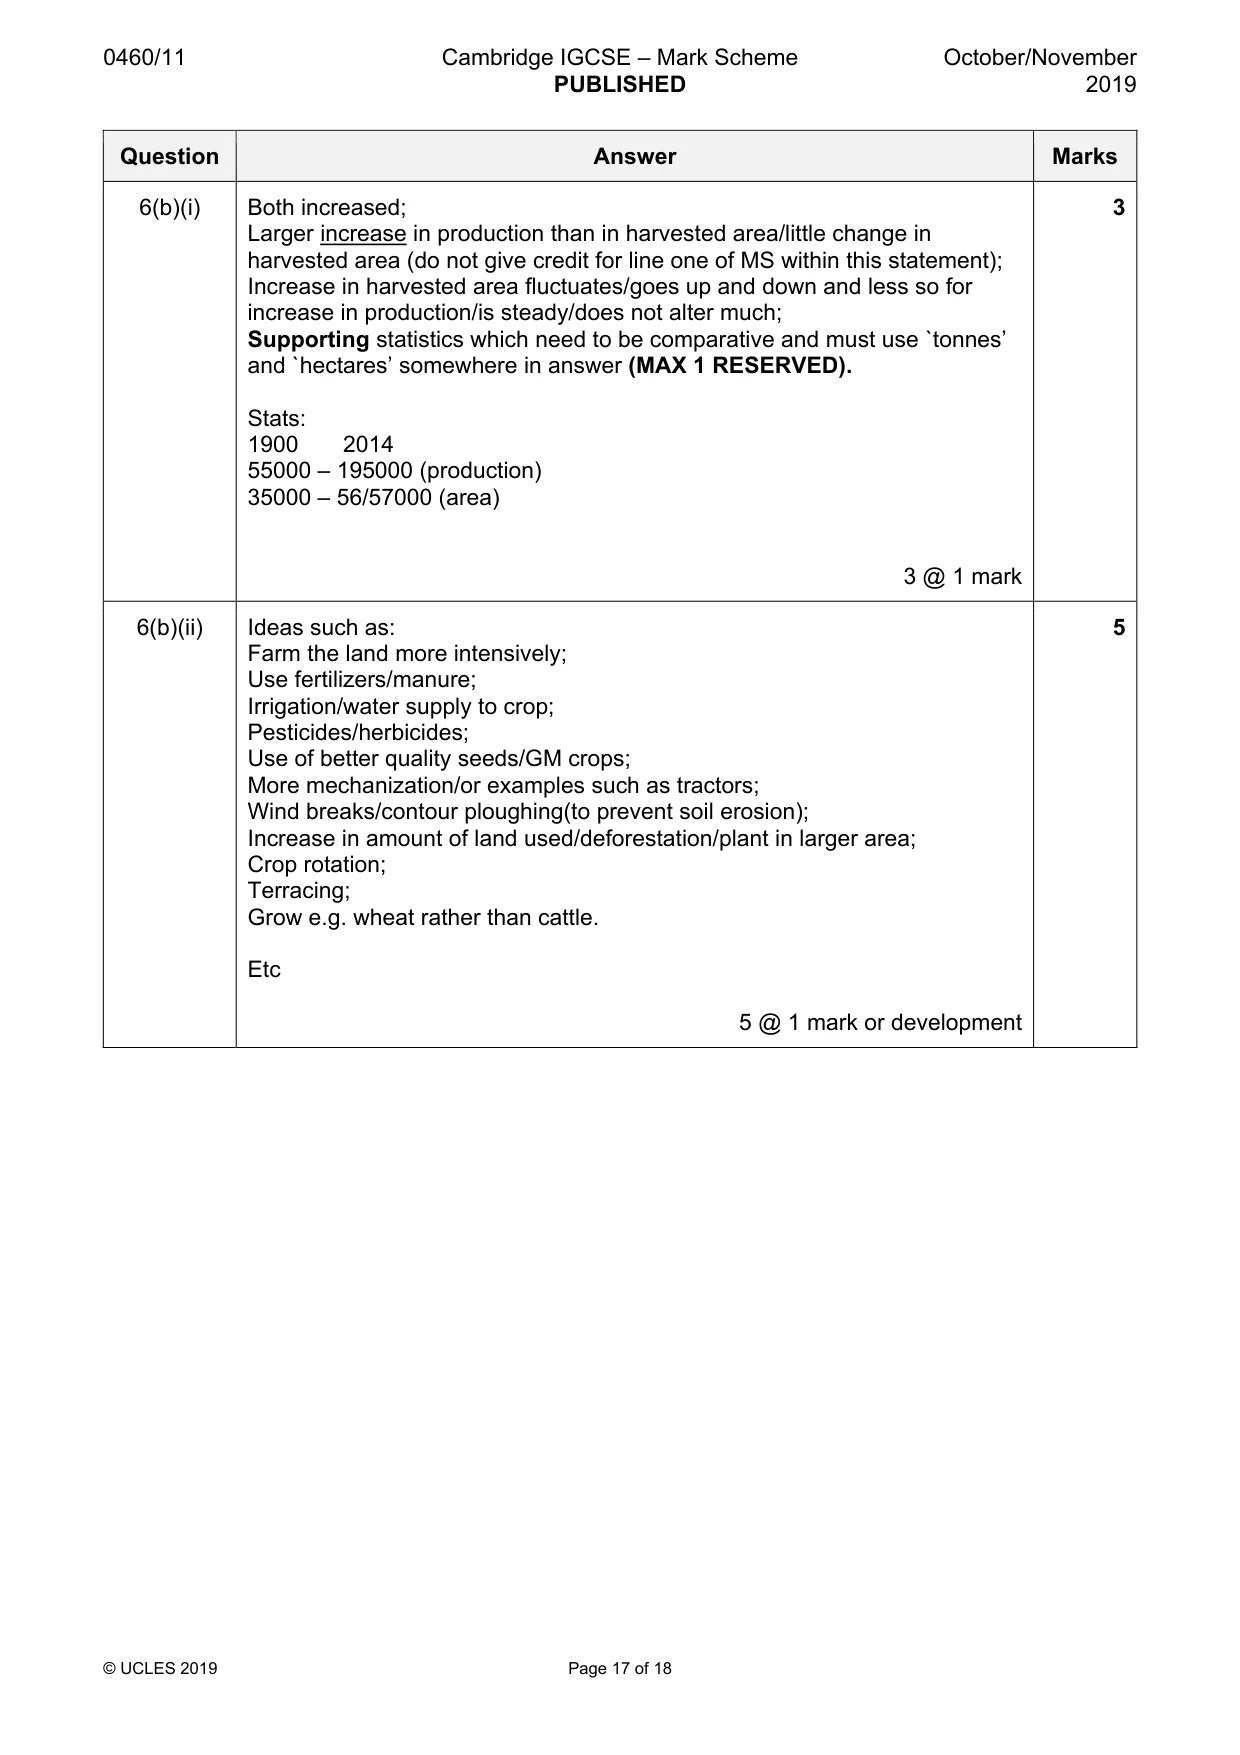
0460/11 Cambridge IGCSE – Mark Scheme PUBLISHED October/November 2019 © UCLES 2019 Page 17 of 18 Question Answer Marks 6(b)(i) Both increased; Larger increase in production than in harvested area/little change in harvested area (do not give credit for line one of MS within this statement); Increase in harvested area fluctuates/goes up and down and less so for increase in production/is steady/does not alter much; Supporting statistics which need to be comparative and must use `tonnes’ and `hectares’ somewhere in answer (MAX 1 RESERVED). Stats: 1900 2014 55000 – 195000 (production) 35000 – 56/57000 (area) 3 @ 1 mark 3 6(b)(ii) Ideas such as: Farm the land more intensively; Use fertilizers/manure; Irrigation/water supply to crop; Pesticides/herbicides; Use of better quality seeds/GM crops; More mechanization/or examples such as tractors; Wind breaks/contour ploughing(to prevent soil erosion); Increase in amount of land used/deforestation/plant in larger area; Crop rotation; Terracing; Grow e.g. wheat rather than cattle. Etc 5 @ 1 mark or development 5
Mark scheme, page 18
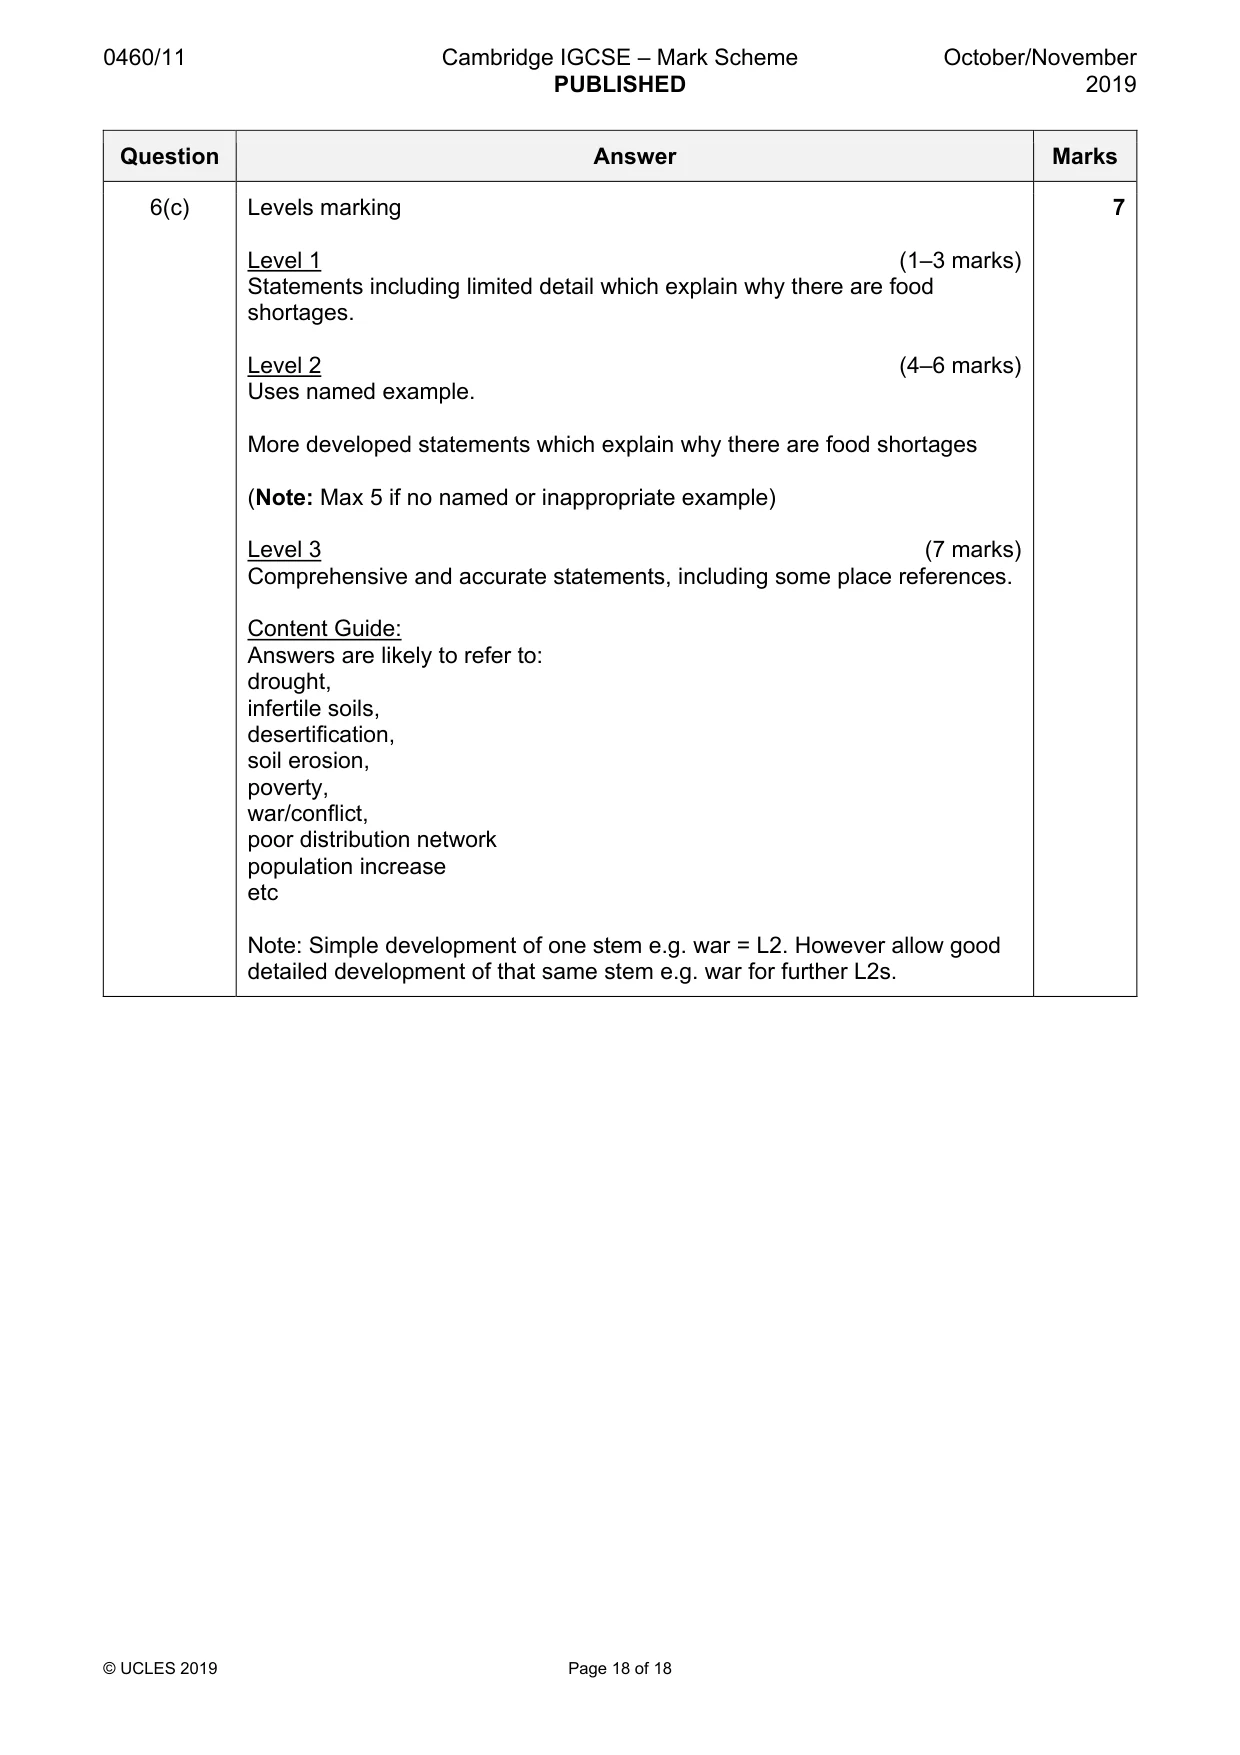
0460/11 Cambridge IGCSE – Mark Scheme PUBLISHED October/November 2019 © UCLES 2019 Page 18 of 18 Question Answer Marks 6(c) Levels marking Level 1 (1–3 marks) Statements including limited detail which explain why there are food shortages. Level 2 (4–6 marks) Uses named example. More developed statements which explain why there are food shortages (Note: Max 5 if no named or inappropriate example) Level 3 (7 marks) Comprehensive and accurate statements, including some place references. Content Guide: Answers are likely to refer to: drought, infertile soils, desertification, soil erosion, poverty, war/conflict, poor distribution network population increase etc Note: Simple development of one stem e.g. war = L2. However allow good detailed development of that same stem e.g. war for further L2s. 7
What you needed in this session
Cambridge’s own grade thresholds for 2019 Oct/Nov, Paper 1 · Variant 1. A higher threshold means an easier paper — the bar moves with how the cohort did.