Cambridge IGCSE Geography 0460 — 2019 Oct/Nov Paper 1 · Variant 2
0460/12/O/N/19 · 75 marks · ≈84 min
The question paper and its mark scheme, free to read here and free to download. This is Cambridge’s own paper, exactly as it was sat.
Question paper32 pages




Mark scheme19 pages
Answers below. Sit the paper first if you are practising.
Paper as text
Question paper, page 1
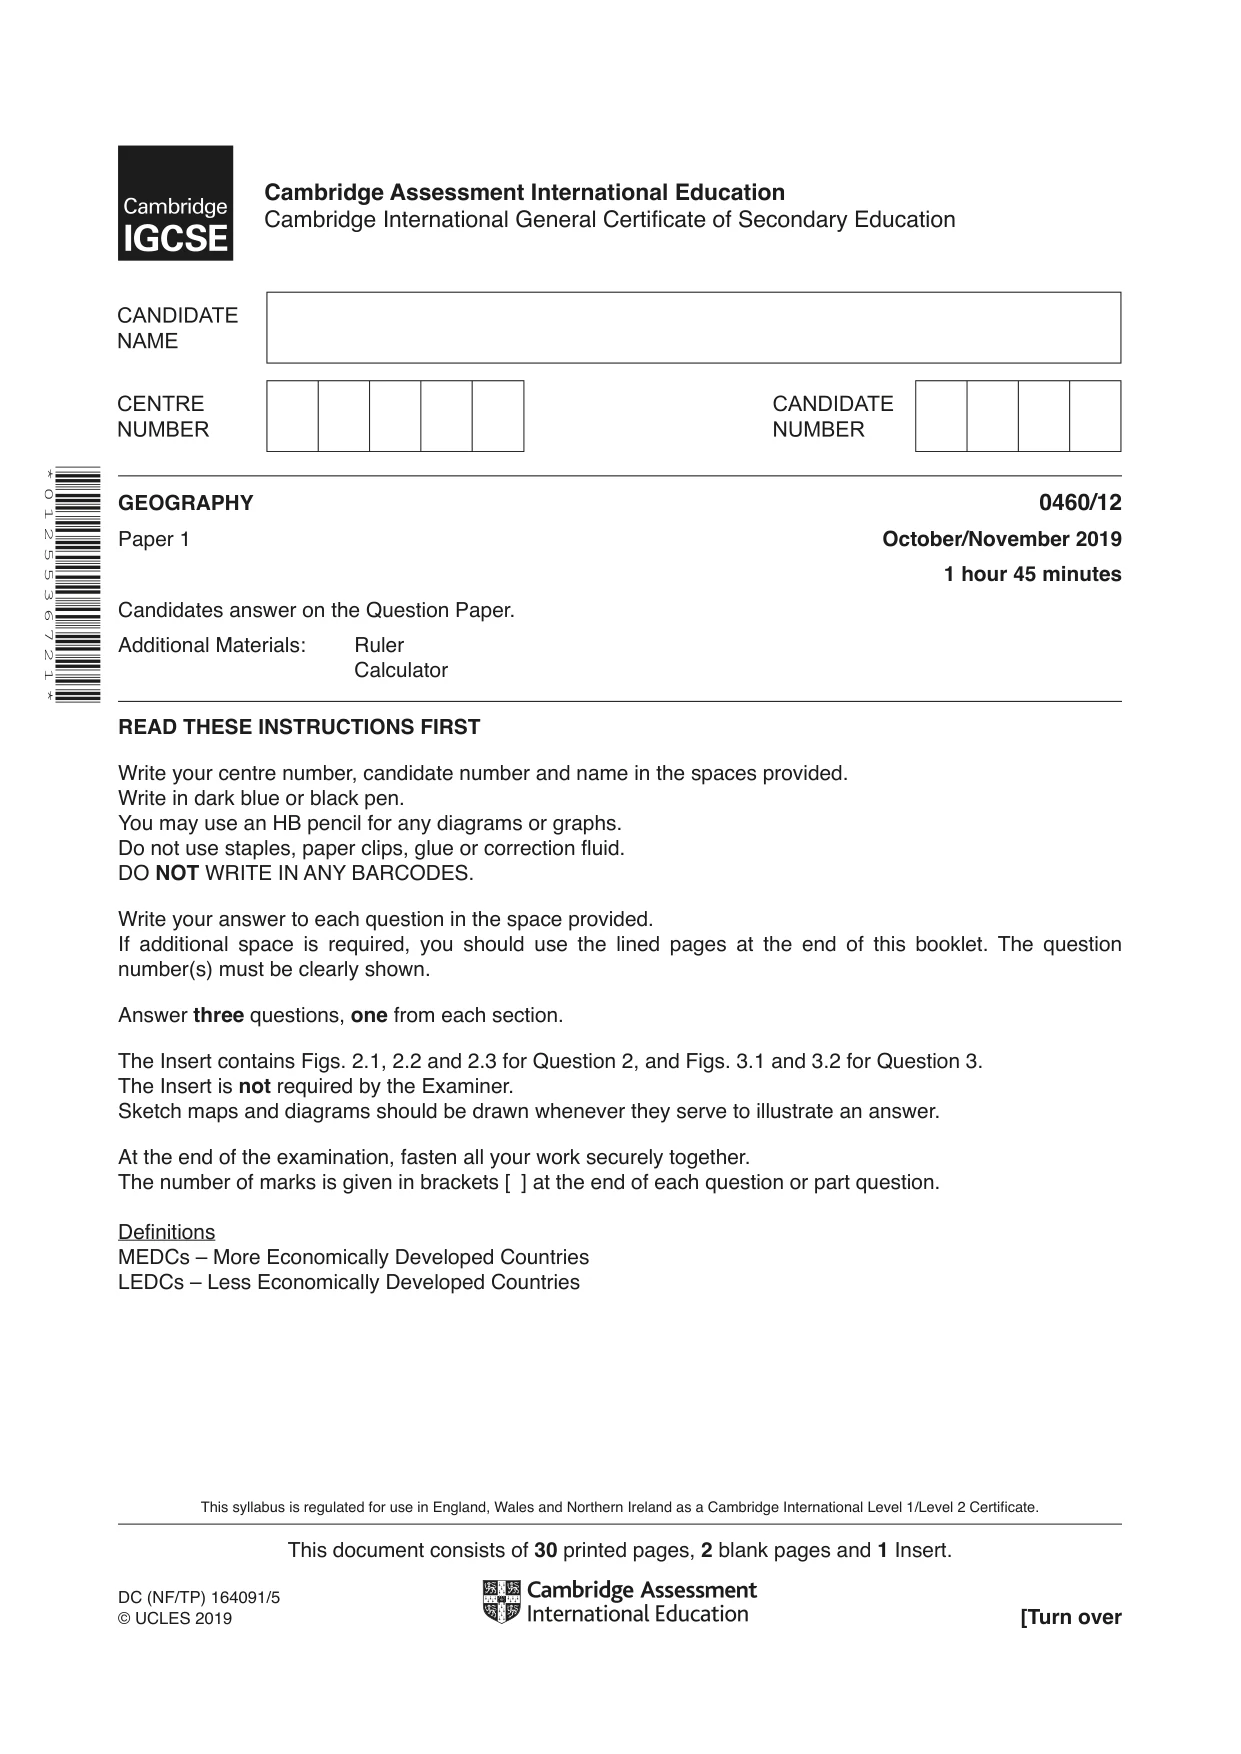
Cambridge Assessment International Education Cambridge International General Certificate of Secondary Education * 0 1 2 5 5 3 6 7 2 1 * This syllabus is regulated for use in England, Wales and Northern Ireland as a Cambridge International Level 1/Level 2 Certificate. This document consists of 30 printed pages, 2 blank pages and 1 Insert. DC (NF/TP) 164091/5 © UCLES 2019 [Turn over GEOGRAPHY 0460/12 Paper 1 October/November 2019 1 hour 45 minutes Candidates answer on the Question Paper. Additional Materials: Ruler Calculator READ THESE INSTRUCTIONS FIRST Write your centre number, candidate number and name in the spaces provided. Write in dark blue or black pen. You may use an HB pencil for any diagrams or graphs. Do not use staples, paper clips, glue or correction fluid. DO NOT WRITE IN ANY BARCODES. Write your answer to each question in the space provided. If additional space is required, you should use the lined pages at the end of this booklet. The question number(s) must be clearly shown. Answer three questions, one from each section. The Insert contains Figs. 2.1, 2.2 and 2.3 for Question 2, and Figs. 3.1 and 3.2 for Question 3. The Insert is not required by the Examiner. Sketch maps and diagrams should be drawn whenever they serve to illustrate an answer. At the end of the examination, fasten all your work securely together. The number of marks is given in brackets [ ] at the end of each question or part question. Definitions MEDCs – More Economically Developed Countries LEDCs – Less Economically Developed Countries
Question paper, page 2
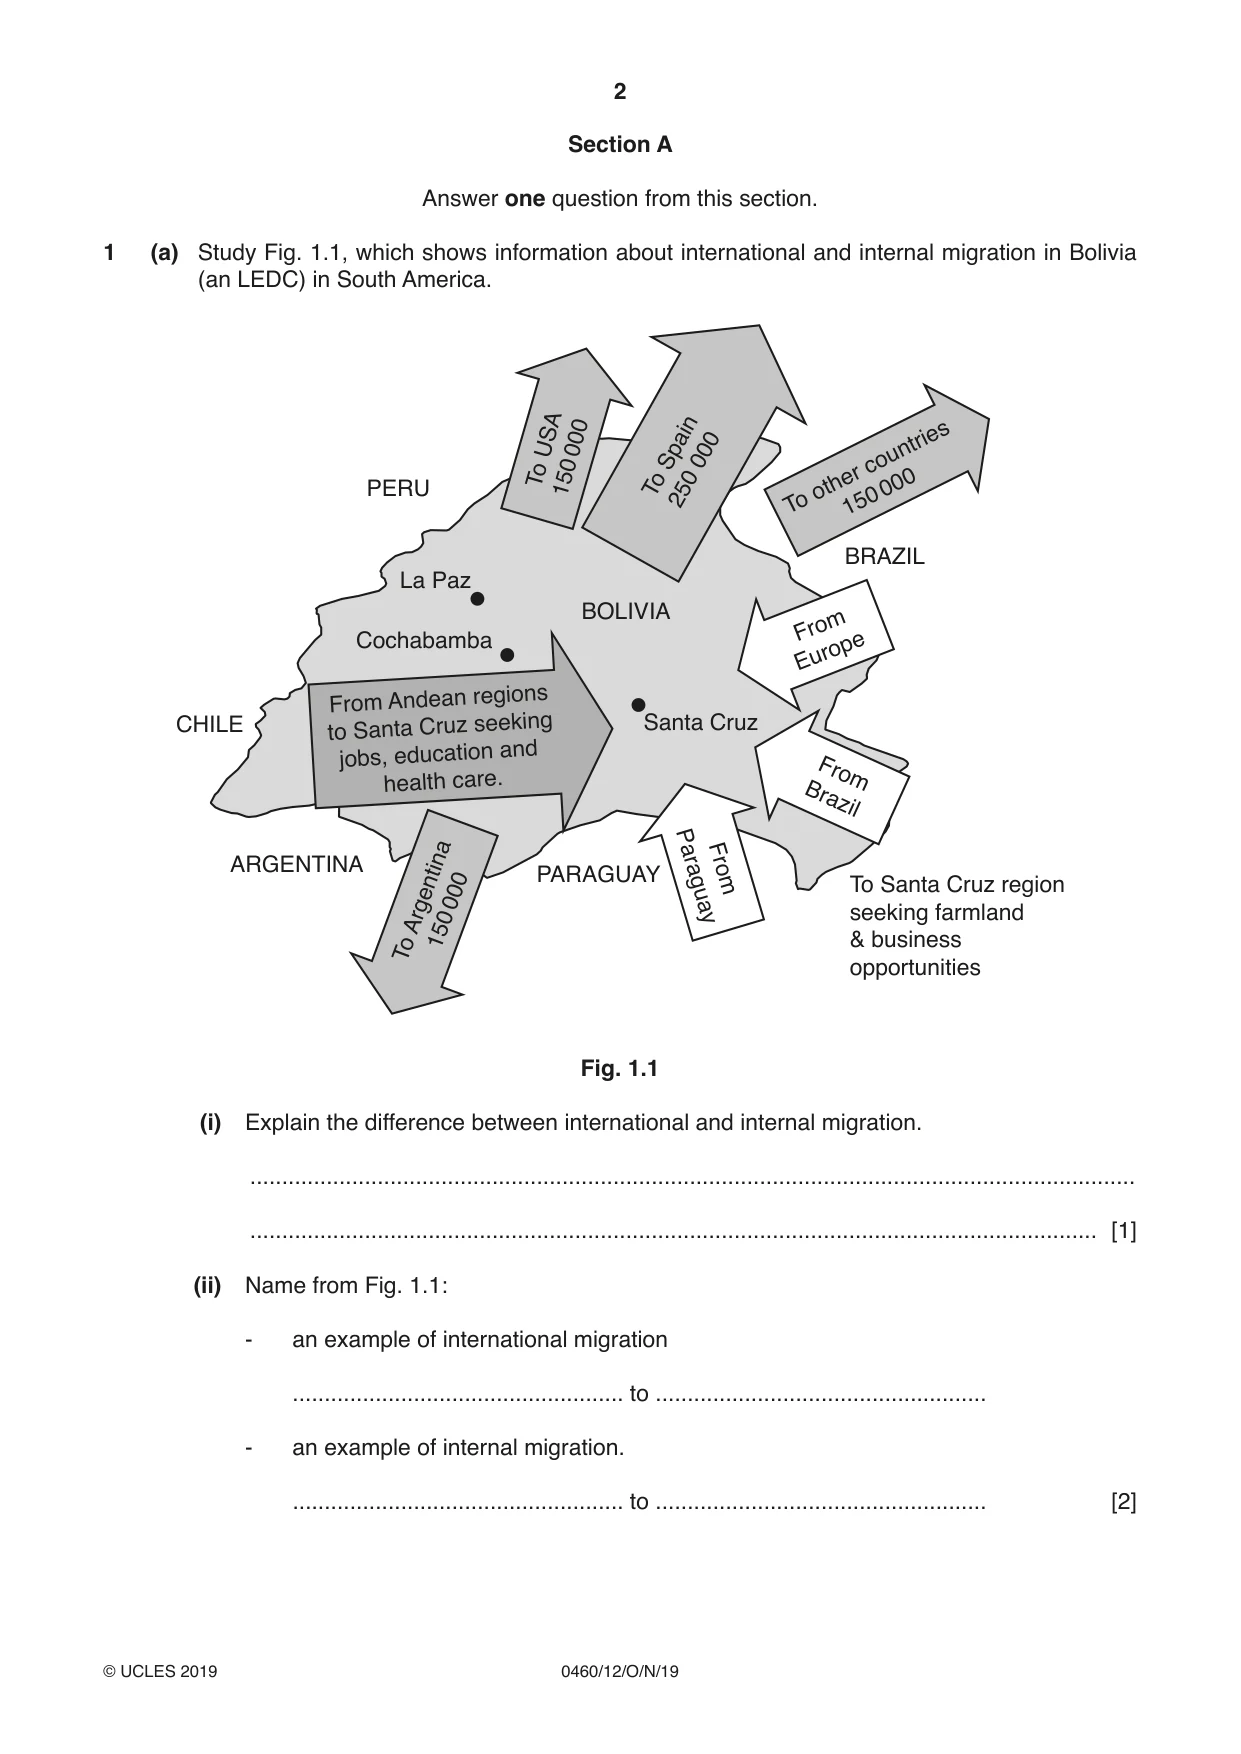
2 0460/12/O/N/19 © UCLES 2019 Section A Answer one question from this section. 1 (a) Study Fig. 1.1, which shows information about international and internal migration in Bolivia (an LEDC) in South America. ARGENTINA PARAGUAY BOLIVIA BRAZIL PERU CHILE To Argentina 150 000 From Andean regions to Santa Cruz seeking jobs, education and health care. To USA 150 000 To Spain 250 000 From Europe From Brazil From Paraguay To other countries 150 000 To Santa Cruz region seeking farmland & business opportunities Santa Cruz Cochabamba La Paz Fig. 1.1 (i) Explain the difference between international and internal migration. … … [1] (ii) Name from Fig. 1.1: - an example of international migration … to … - an example of internal migration. … to … [2]
Question paper, page 3
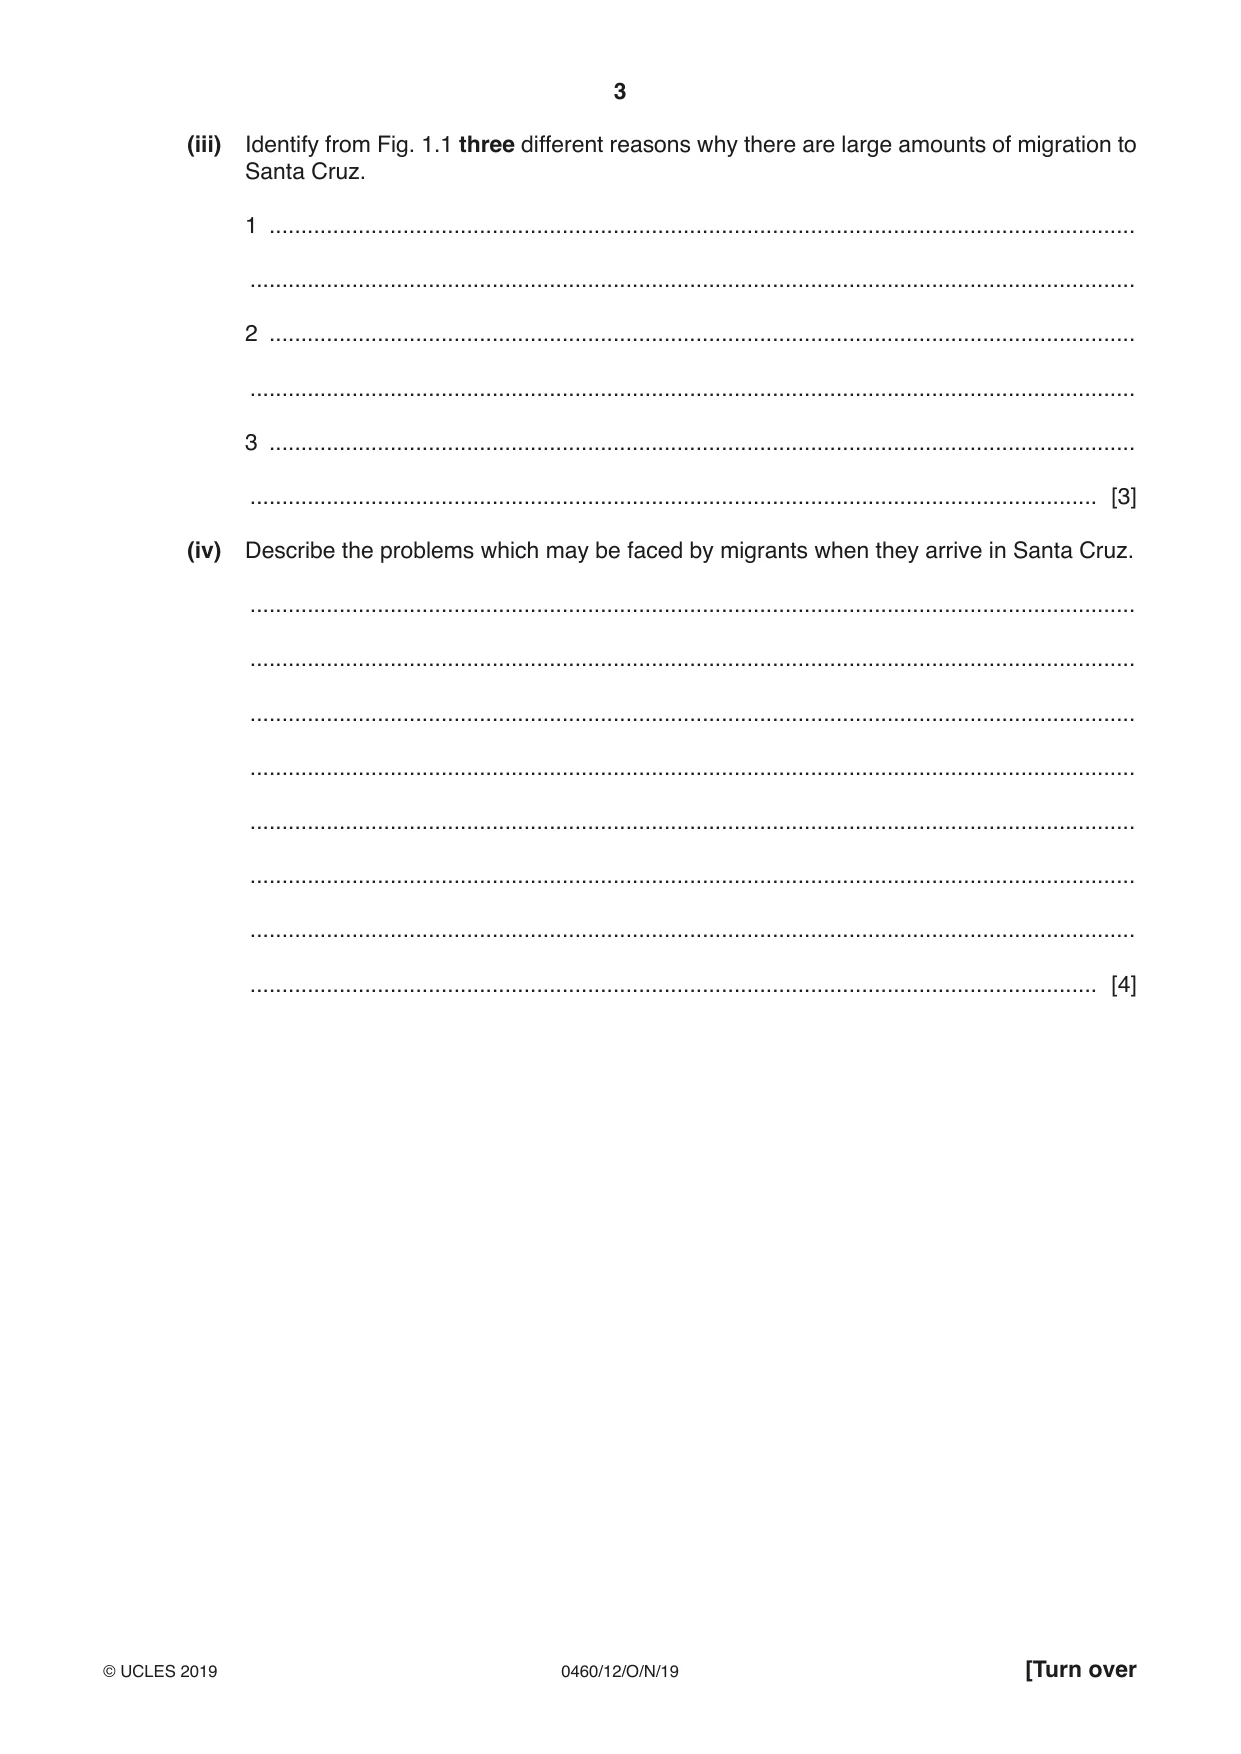
3 0460/12/O/N/19 © UCLES 2019 [Turn over (iii) Identify from Fig. 1.1 three different reasons why there are large amounts of migration to Santa Cruz. 1 … … 2 … … 3 … … [3] (iv) Describe the problems which may be faced by migrants when they arrive in Santa Cruz. … … … … … … … … [4]
Question paper, page 4
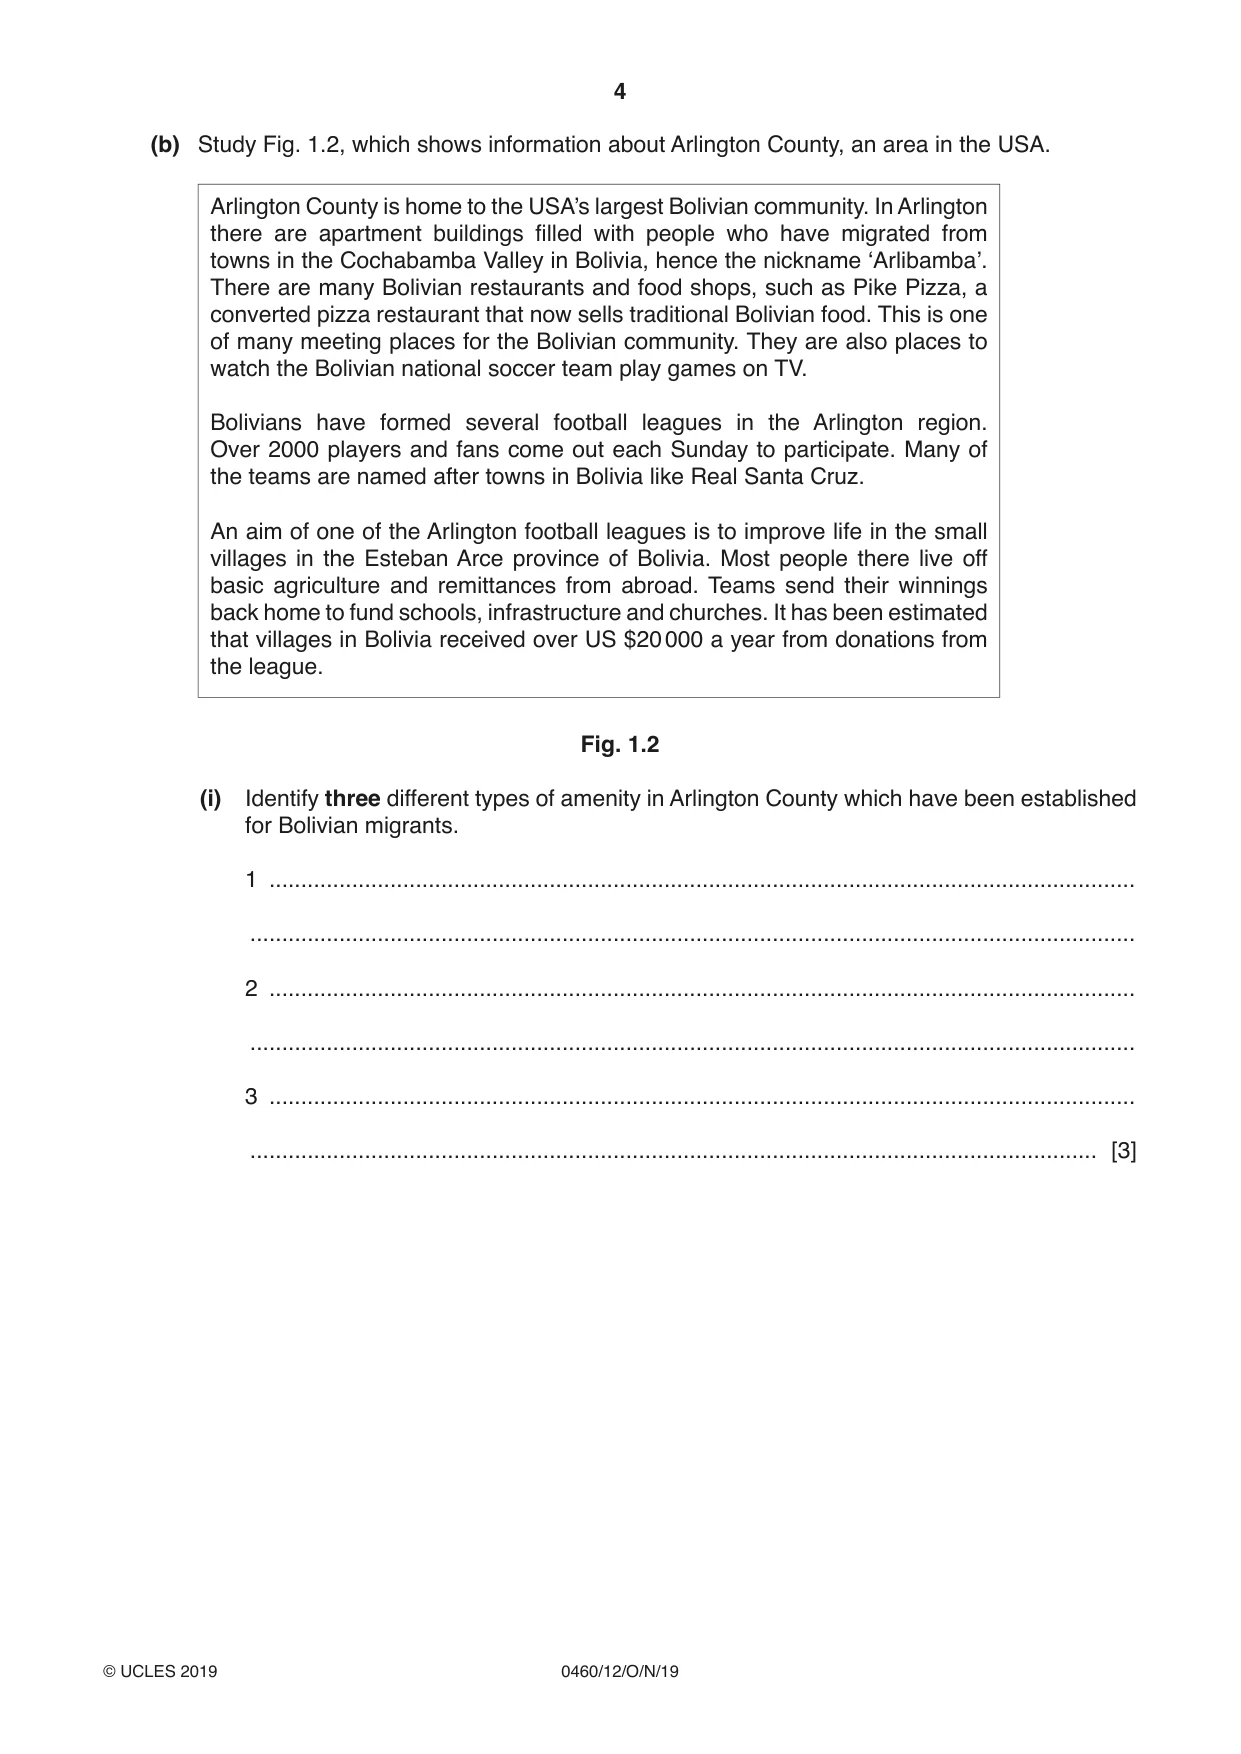
4 0460/12/O/N/19 © UCLES 2019 (b) Study Fig. 1.2, which shows information about Arlington County, an area in the USA. Arlington County is home to the USA’s largest Bolivian community. In Arlington there are apartment buildings filled with people who have migrated from towns in the Cochabamba Valley in Bolivia, hence the nickname ‘Arlibamba’. There are many Bolivian restaurants and food shops, such as Pike Pizza, a converted pizza restaurant that now sells traditional Bolivian food. This is one of many meeting places for the Bolivian community. They are also places to watch the Bolivian national soccer team play games on TV. Bolivians have formed several football leagues in the Arlington region. Over 2000 players and fans come out each Sunday to participate. Many of the teams are named after towns in Bolivia like Real Santa Cruz. An aim of one of the Arlington football leagues is to improve life in the small villages in the Esteban Arce province of Bolivia. Most people there live off basic agriculture and remittances from abroad. Teams send their winnings back home to fund schools, infrastructure and churches. It has been estimated that villages in Bolivia received over US $20 000 a year from donations from the league. Fig. 1.2 (i) Identify three different types of amenity in Arlington County which have been established for Bolivian migrants. 1 … … 2 … … 3 … … [3]
Question paper, page 5
5 0460/12/O/N/19 © UCLES 2019 [Turn over (ii) Explain how migration to the USA is likely to have affected small villages in Bolivia and the people who still live there. … … … … … … … … … … … … [5]
Question paper, page 6
6 0460/12/O/N/19 © UCLES 2019 (c) For an example of a country you have studied, explain why natural population growth rates are high. Name of country … … … … … … … … … … … … … … … … … … … … … … … … … [7] [Total: 25]
Question paper, page 7
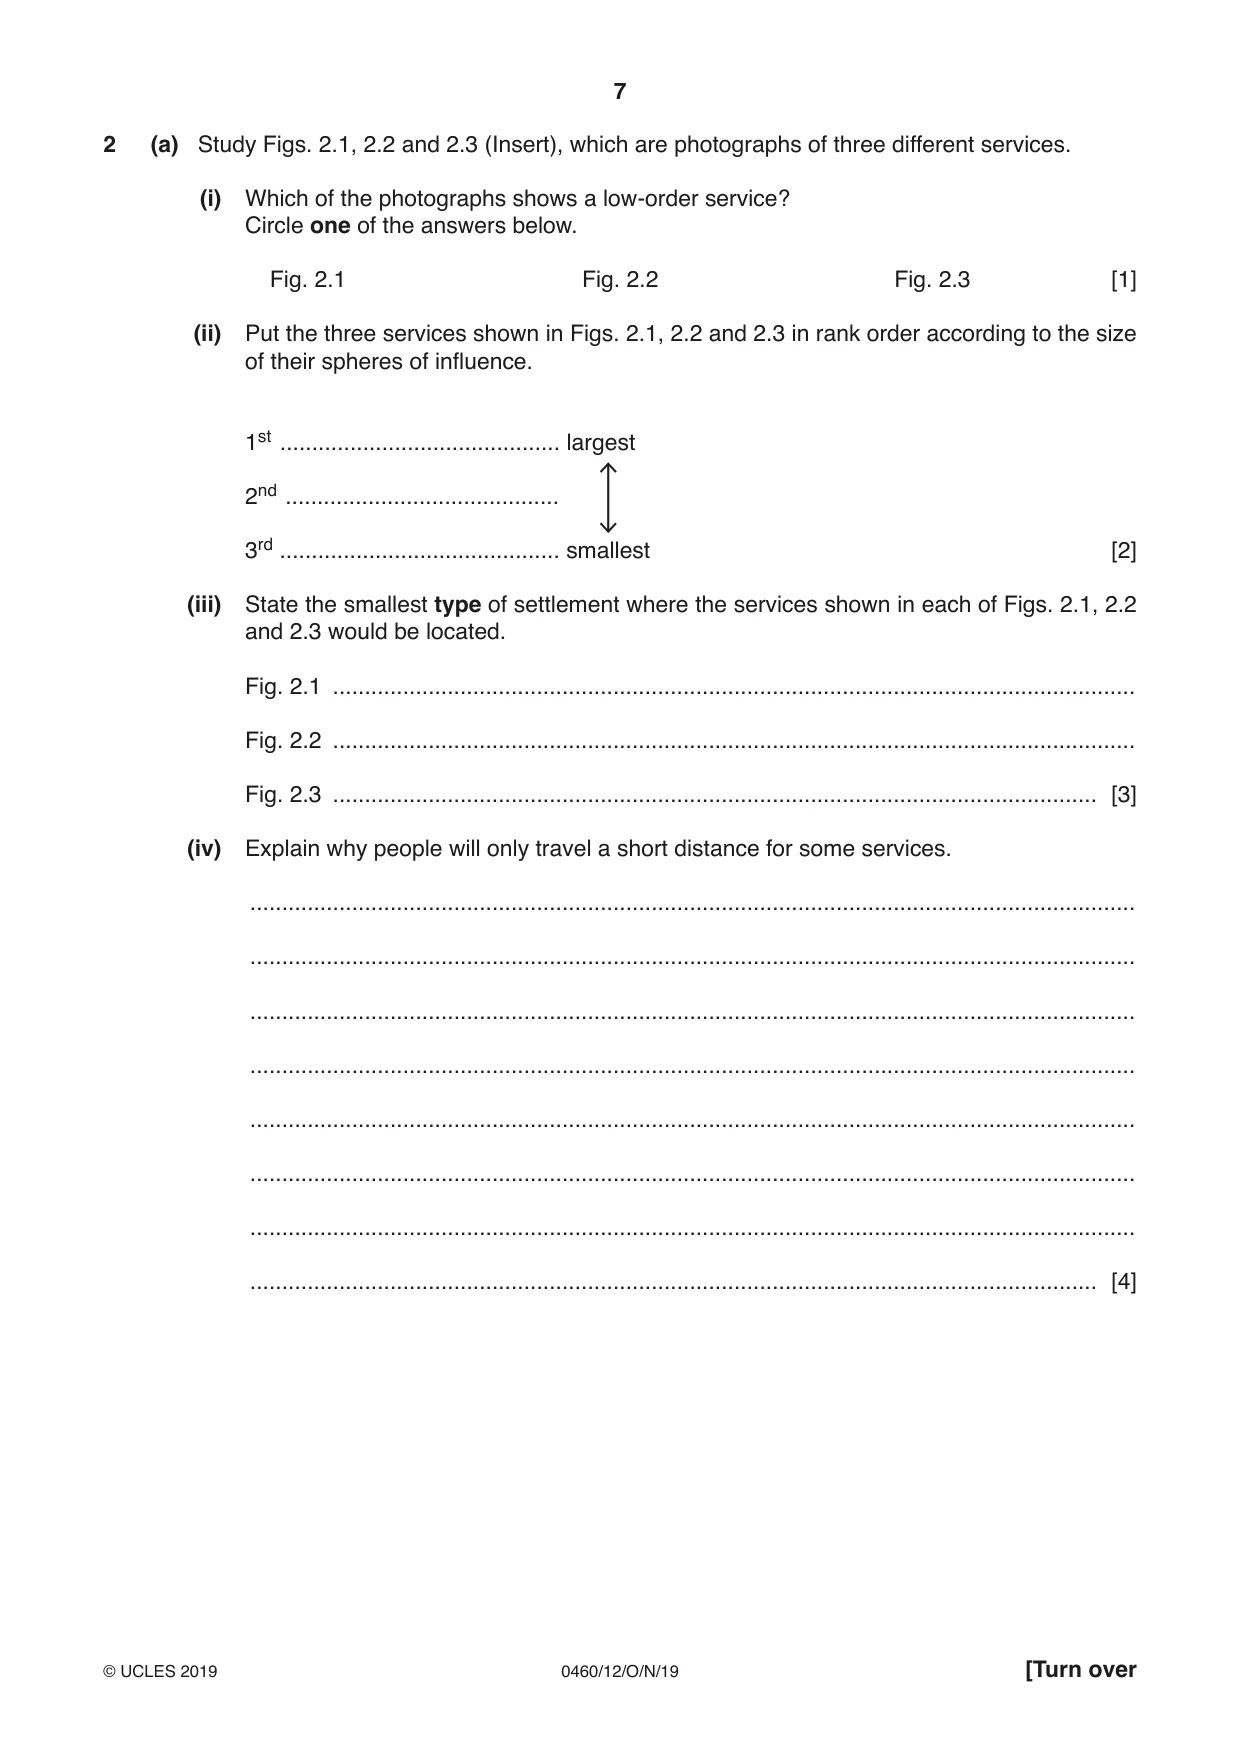
7 0460/12/O/N/19 © UCLES 2019 [Turn over 2 (a) Study Figs. 2.1, 2.2 and 2.3 (Insert), which are photographs of three different services. (i) Which of the photographs shows a low-order service? Circle one of the answers below. Fig. 2.1 Fig. 2.2 Fig. 2.3 [1] (ii) Put the three services shown in Figs. 2.1, 2.2 and 2.3 in rank order according to the size of their spheres of influence. 1st … largest 2nd … 3rd … smallest [2] (iii) State the smallest type of settlement where the services shown in each of Figs. 2.1, 2.2 and 2.3 would be located. Fig. 2.1 … Fig. 2.2 … Fig. 2.3 … [3] (iv) Explain why people will only travel a short distance for some services. … … … … … … … … [4]
Question paper, page 8
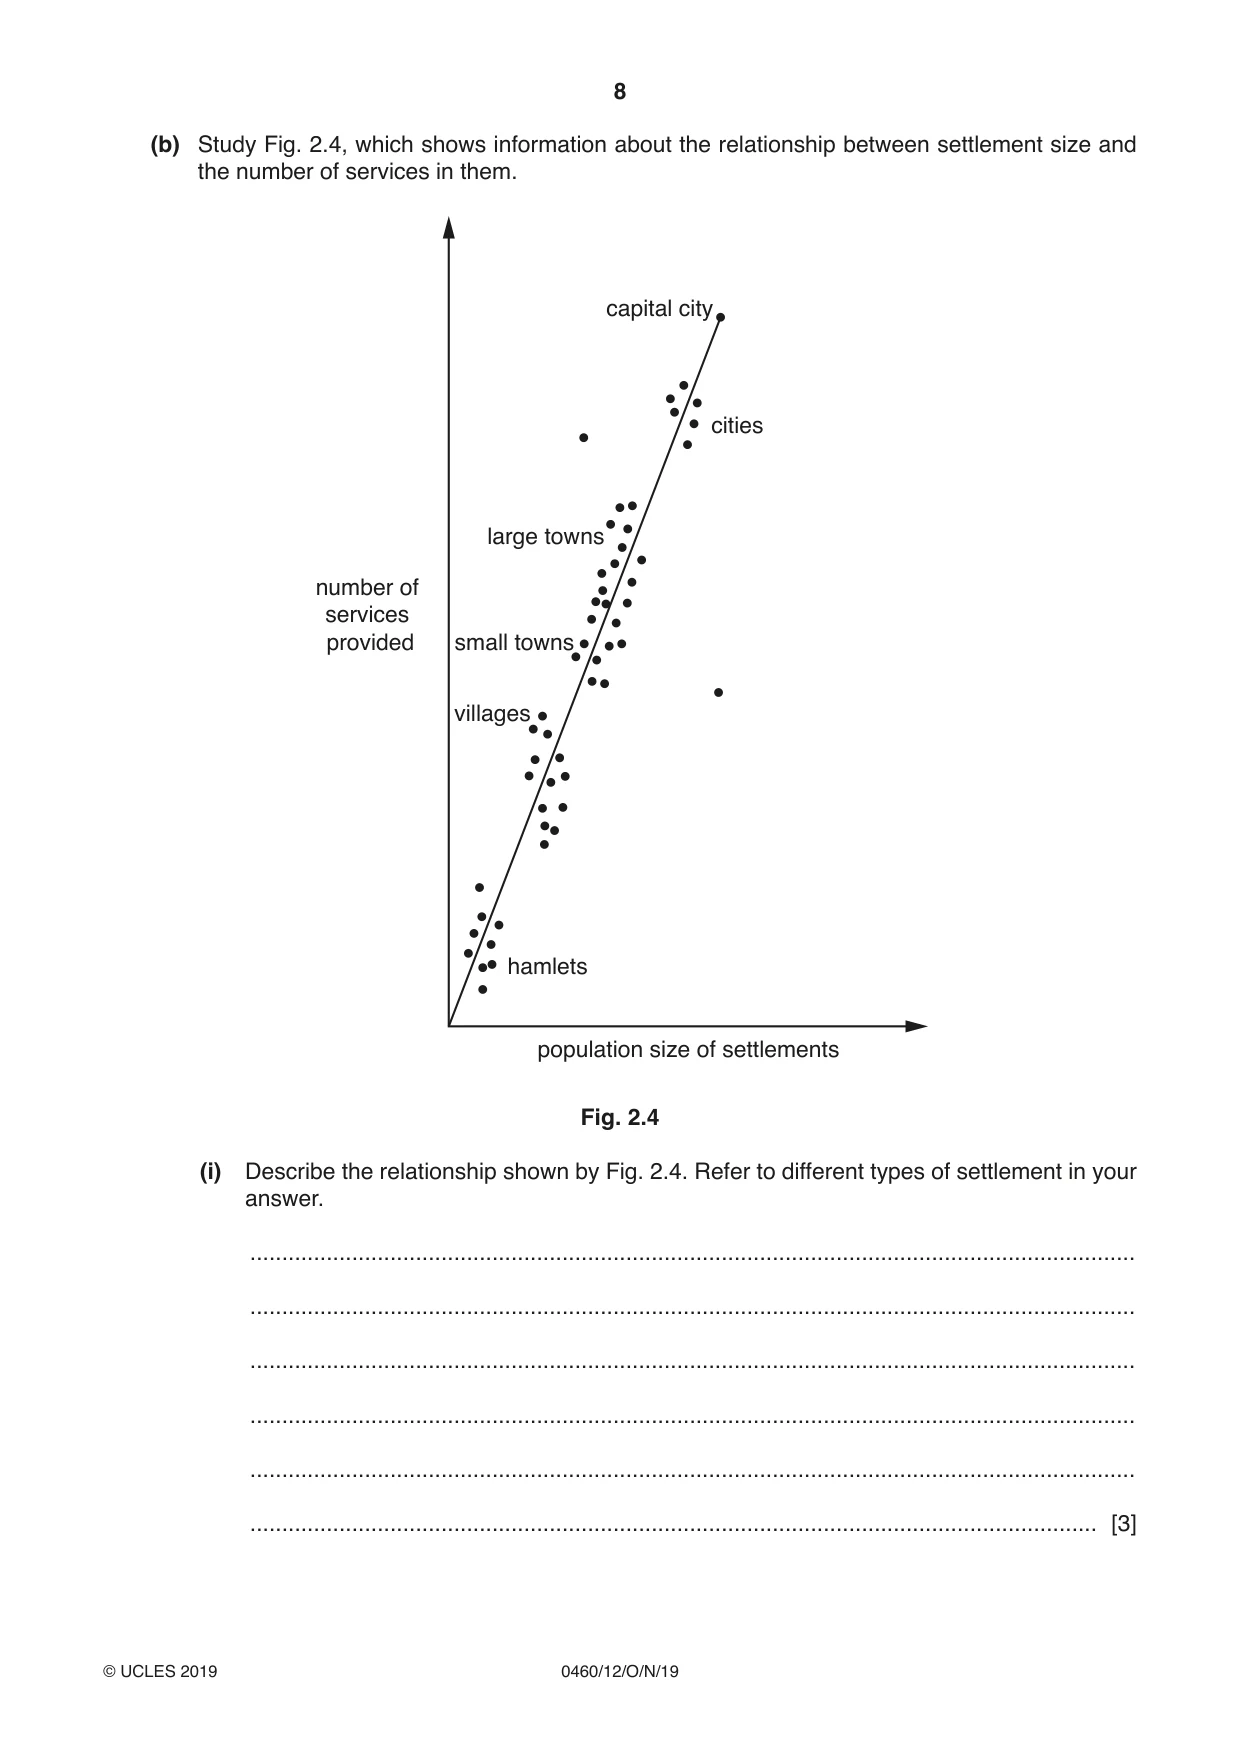
8 0460/12/O/N/19 © UCLES 2019 (b) Study Fig. 2.4, which shows information about the relationship between settlement size and the number of services in them. cities hamlets villages small towns large towns capital city population size of settlements number of services provided Fig. 2.4 (i) Describe the relationship shown by Fig. 2.4. Refer to different types of settlement in your answer. … … … … … … [3]
Question paper, page 9
9 0460/12/O/N/19 © UCLES 2019 [Turn over (ii) Explain why there is a relationship between settlement size and the number of services provided. … … … … … … … … … … … … … [5]
Question paper, page 10
10 0460/12/O/N/19 © UCLES 2019 (c) For a named urban area, describe the causes of a problem faced by the residents and explain how the authorities in that urban area are attempting to solve it. Name of urban area … … … … … … … … … … … … … … … … … … … … … … … … … … [7] [Total: 25]
Question paper, page 11
11 0460/12/O/N/19 © UCLES 2019 [Turn over Section B Answer one question from this section. 3 (a) Study Fig. 3.1 (Insert), which is a photograph of a Stevenson screen. (i) Which of the following weather instruments is kept in a Stevenson screen? Circle one of the answers below. anemometer barometer rain gauge wind vane [1] (ii) Some instruments kept in a Stevenson screen are digital. Give two advantages of using digital weather instruments rather than traditional ones. 1 … … 2 … … [2] (iii) Describe three features of a Stevenson screen which ensure that the information collected is reliable. 1 … … 2 … … 3 … … [3] (iv) State two factors which should be considered when deciding on the site of a Stevenson screen. For each factor explain why it is important. 1 … … … … 2 … … … … [4]
Question paper, page 12
12 0460/12/O/N/19 © UCLES 2019 (b) Study Fig. 3.2 (Insert), which is a photograph of an instrument used in a weather station. (i) Name the instrument shown in Fig. 3.2 and explain how it is used to collect weather data. Name of instrument … How it is used … … … … … [3] (ii) Explain how a student could observe and record cloud types and amounts at his school over a period of one week. … … … … … … … … … … [5]
Question paper, page 13
13 0460/12/O/N/19 © UCLES 2019 [Turn over (c) For a named coastal area you have studied, describe the impacts of a tropical storm. Name of coastal area … … … … … … … … … … … … … … … … … … … … … … … … … … [7] [Total: 25]
Question paper, page 14
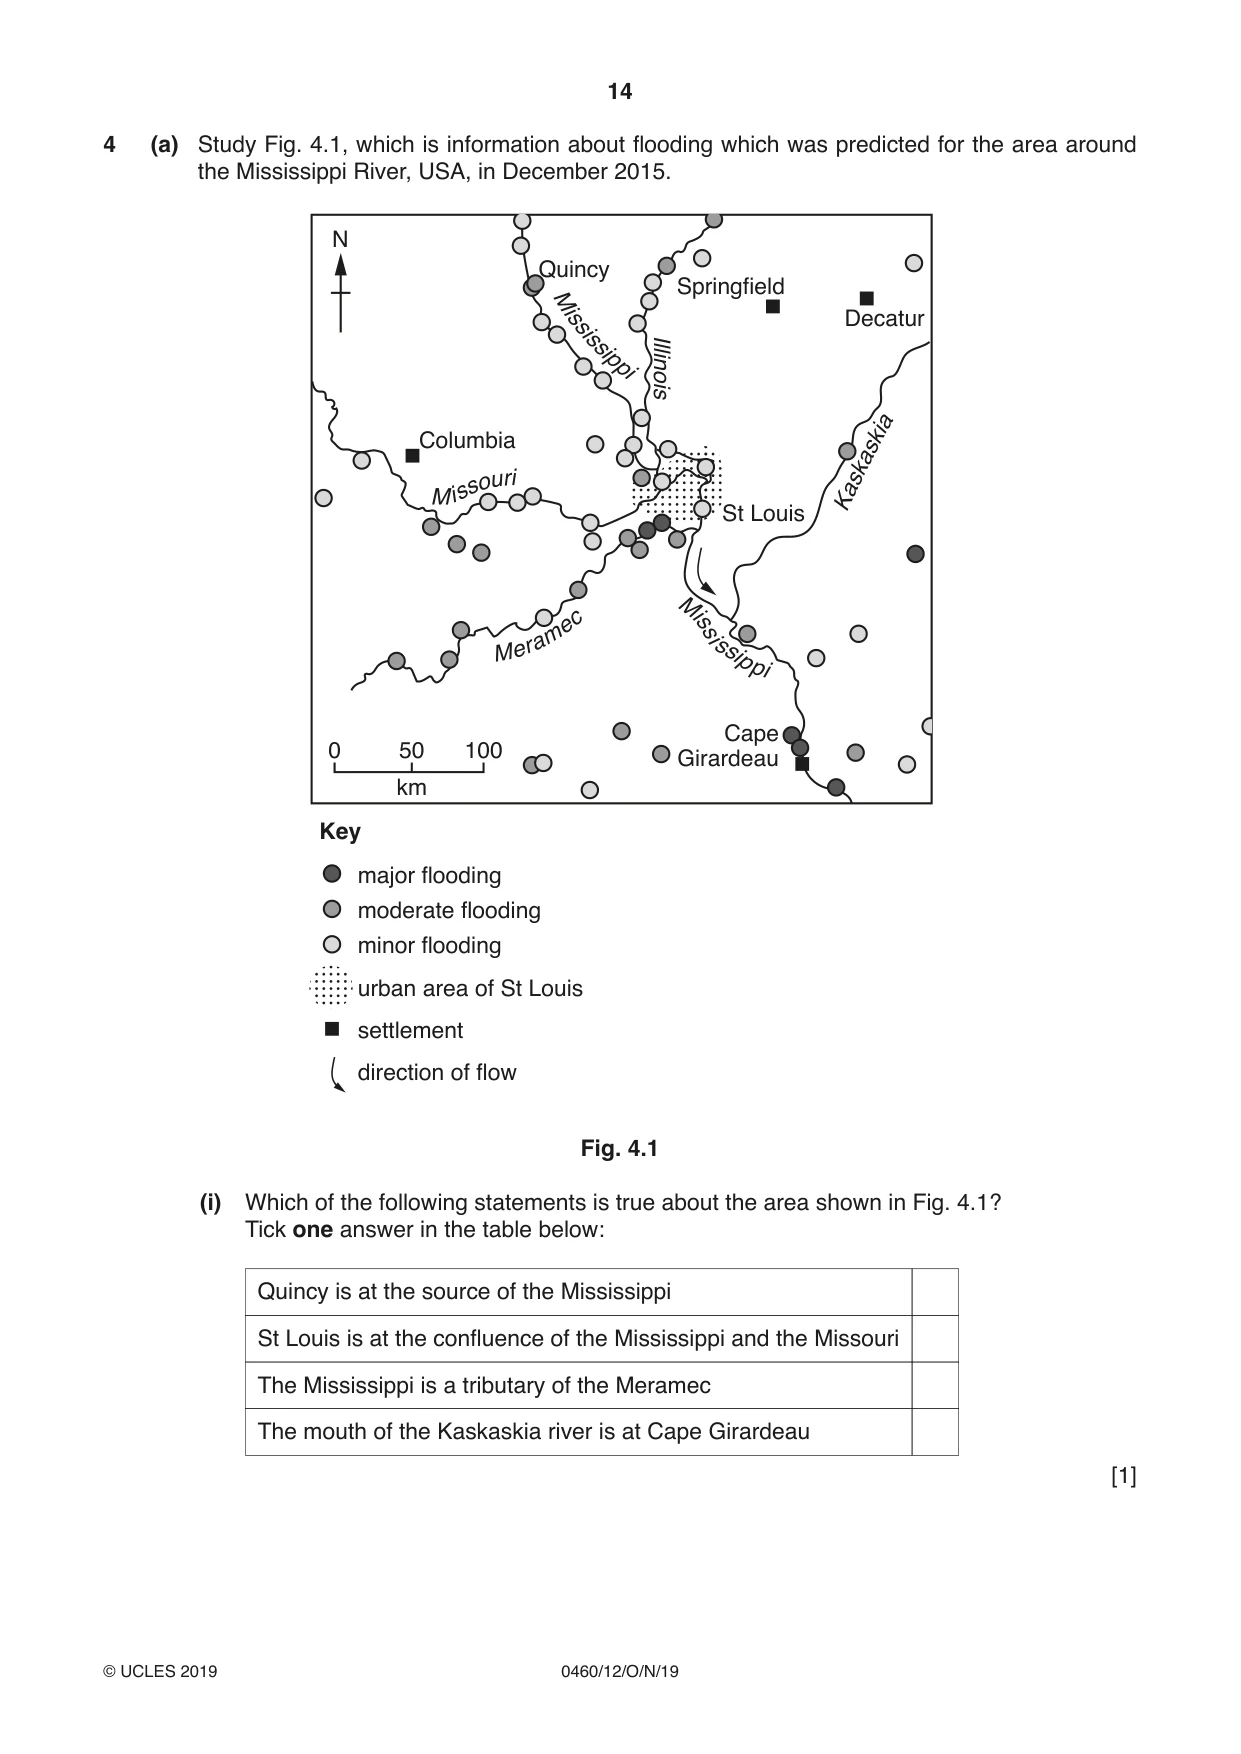
14 0460/12/O/N/19 © UCLES 2019 4 (a) Study Fig. 4.1, which is information about flooding which was predicted for the area around the Mississippi River, USA, in December 2015. N 0 50 100 km Illinois M i s s i ss ip pi Kask aski a M e r a m e c M i s s o u ri Columbia Quincy Cape Girardeau Springfield Decatur St Louis Key major flooding moderate flooding minor flooding urban area of St Louis settlement direction of flow M is si ss ip pi Fig. 4.1 (i) Which of the following statements is true about the area shown in Fig. 4.1? Tick one answer in the table below: Quincy is at the source of the Mississippi St Louis is at the confluence of the Mississippi and the Missouri The Mississippi is a tributary of the Meramec The mouth of the Kaskaskia river is at Cape Girardeau [1]
Question paper, page 15
15 0460/12/O/N/19 © UCLES 2019 [Turn over (ii) Suggest two reasons why most of the major flooding predicted was at Cape Girardeau. 1 … … 2 … … [2] (iii) Describe three likely impacts of flooding in the rural areas between St Louis and Cape Girardeau. 1 … … 2 … … 3 … … [3] (iv) Suggest how the urban area of St Louis could be protected from flooding. … … … … … … … … [4]
Question paper, page 16
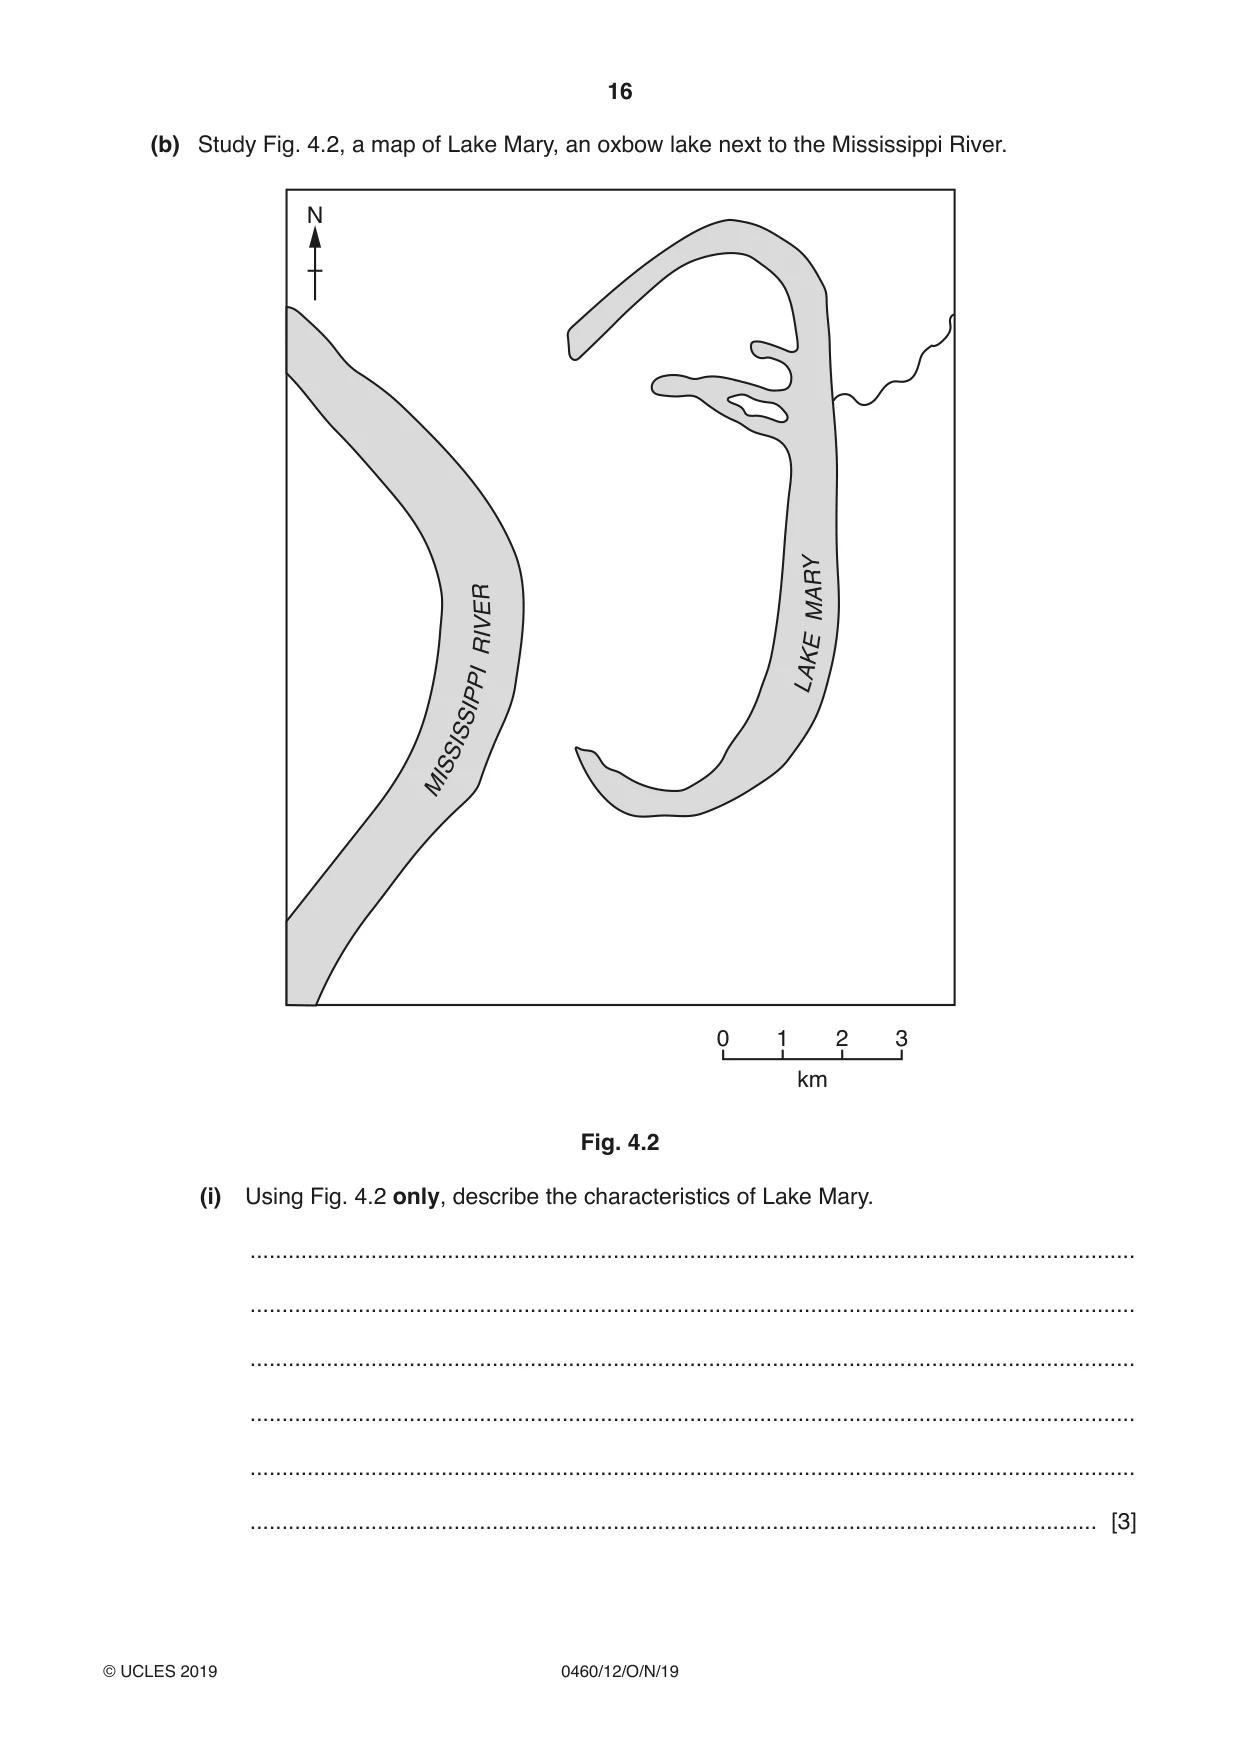
16 0460/12/O/N/19 © UCLES 2019 (b) Study Fig. 4.2, a map of Lake Mary, an oxbow lake next to the Mississippi River. 0 1 2 3 km N MI SS IS SI P PI RI V E R L AKE M A RY Fig. 4.2 (i) Using Fig. 4.2 only, describe the characteristics of Lake Mary. … … … … … … [3]
Question paper, page 17
17 0460/12/O/N/19 © UCLES 2019 [Turn over (ii) Explain how an oxbow lake is formed. You may include a labelled diagram or diagrams. … … … … … … … … … … [5]
Question paper, page 18
18 0460/12/O/N/19 © UCLES 2019 (c) For a named river you have studied, describe the benefits of living on or close to its flood plain or delta. Name of river … … … … … … … … … … … … … … … … … … … … … … … … … … [7] [Total: 25]
Question paper, page 19
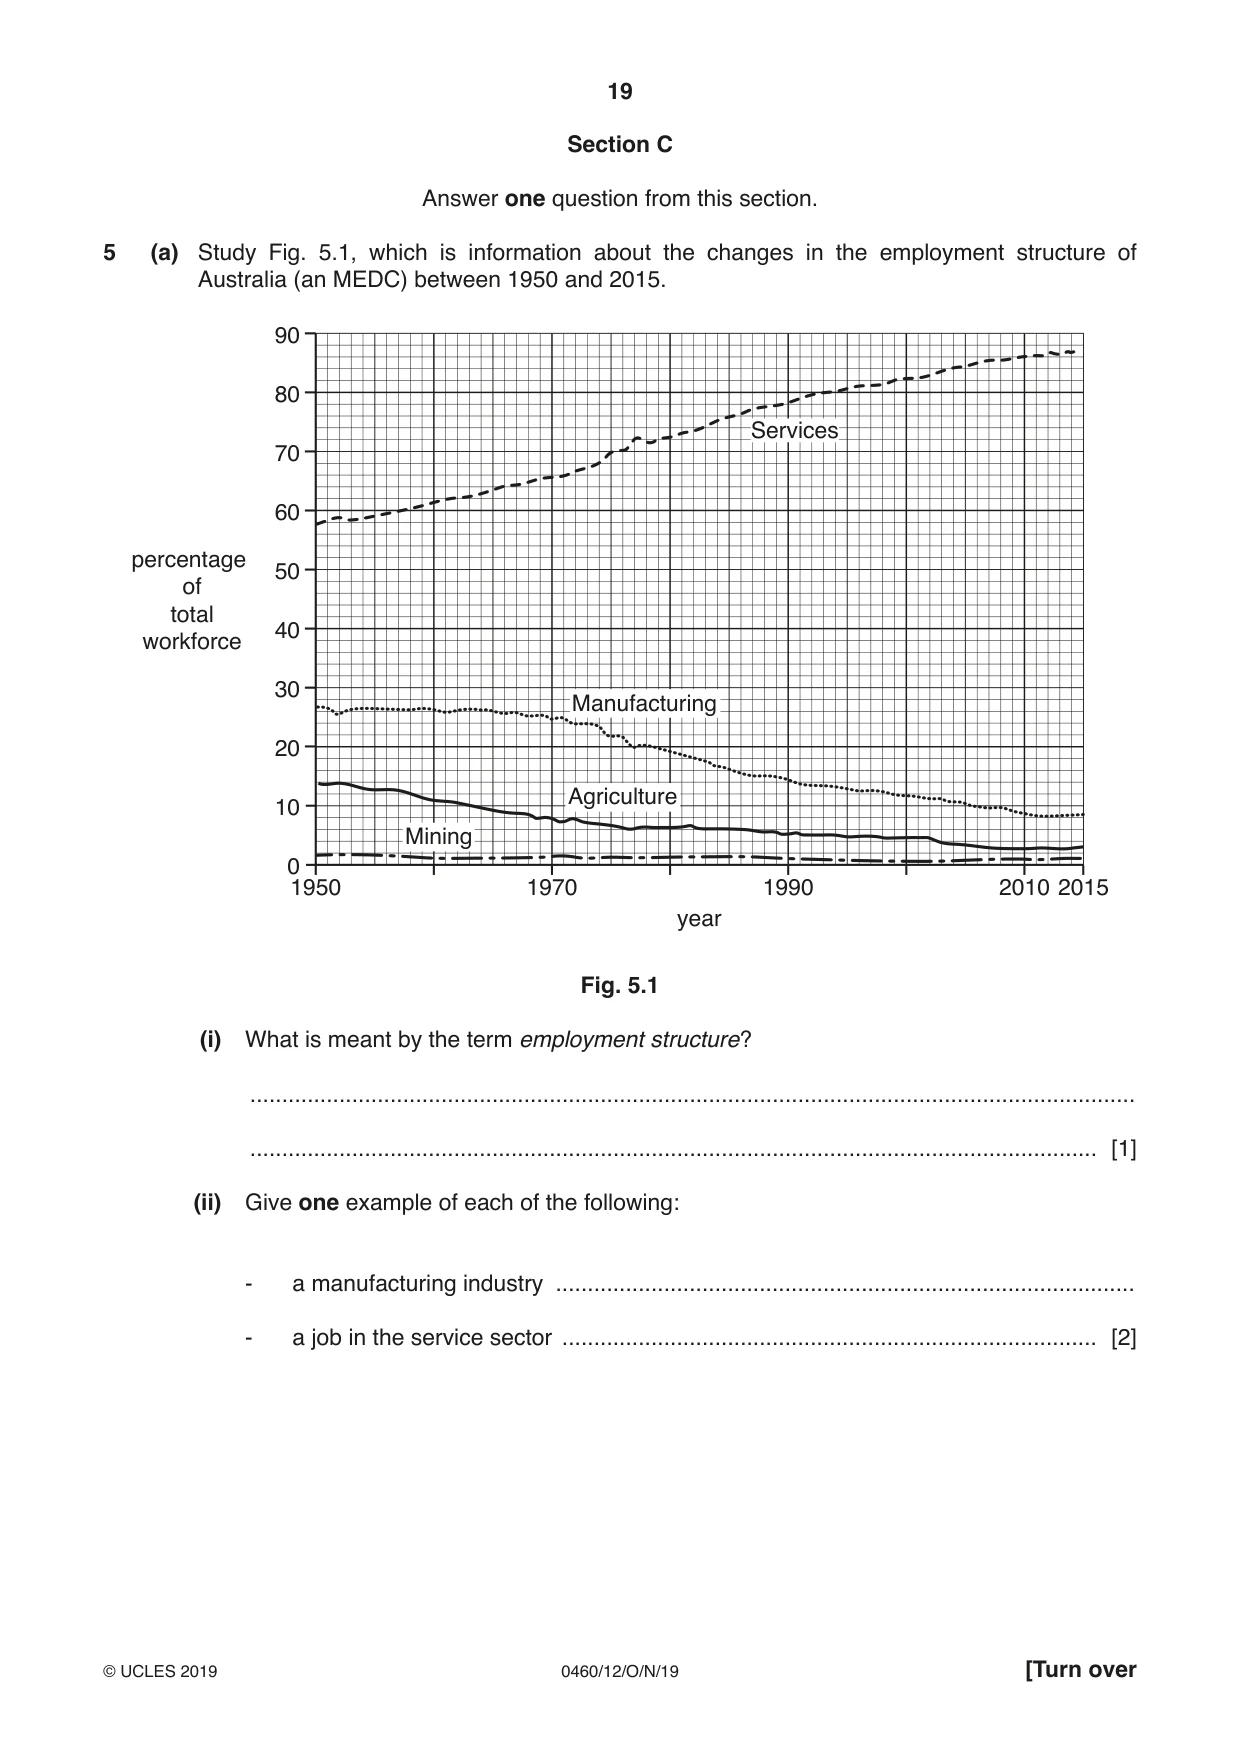
19 0460/12/O/N/19 © UCLES 2019 [Turn over Section C Answer one question from this section. 5 (a) Study Fig. 5.1, which is information about the changes in the employment structure of Australia (an MEDC) between 1950 and 2015. Services Manufacturing Mining Agriculture percentage of total workforce 90 80 70 60 50 40 30 20 10 0 1950 1970 1990 year 2010 2015 Fig. 5.1 (i) What is meant by the term employment structure? … … [1] (ii) Give one example of each of the following: - a manufacturing industry … - a job in the service sector … [2]
Question paper, page 20
20 0460/12/O/N/19 © UCLES 2019 (iii) Describe the main changes which have taken place in Australia’s employment structure between 1950 and 2015. … … … … … … [3] (iv) Suggest reasons for the changes which have taken place in Australia’s employment structure between 1950 and 2015. … … … … … … … … [4]
Question paper, page 21
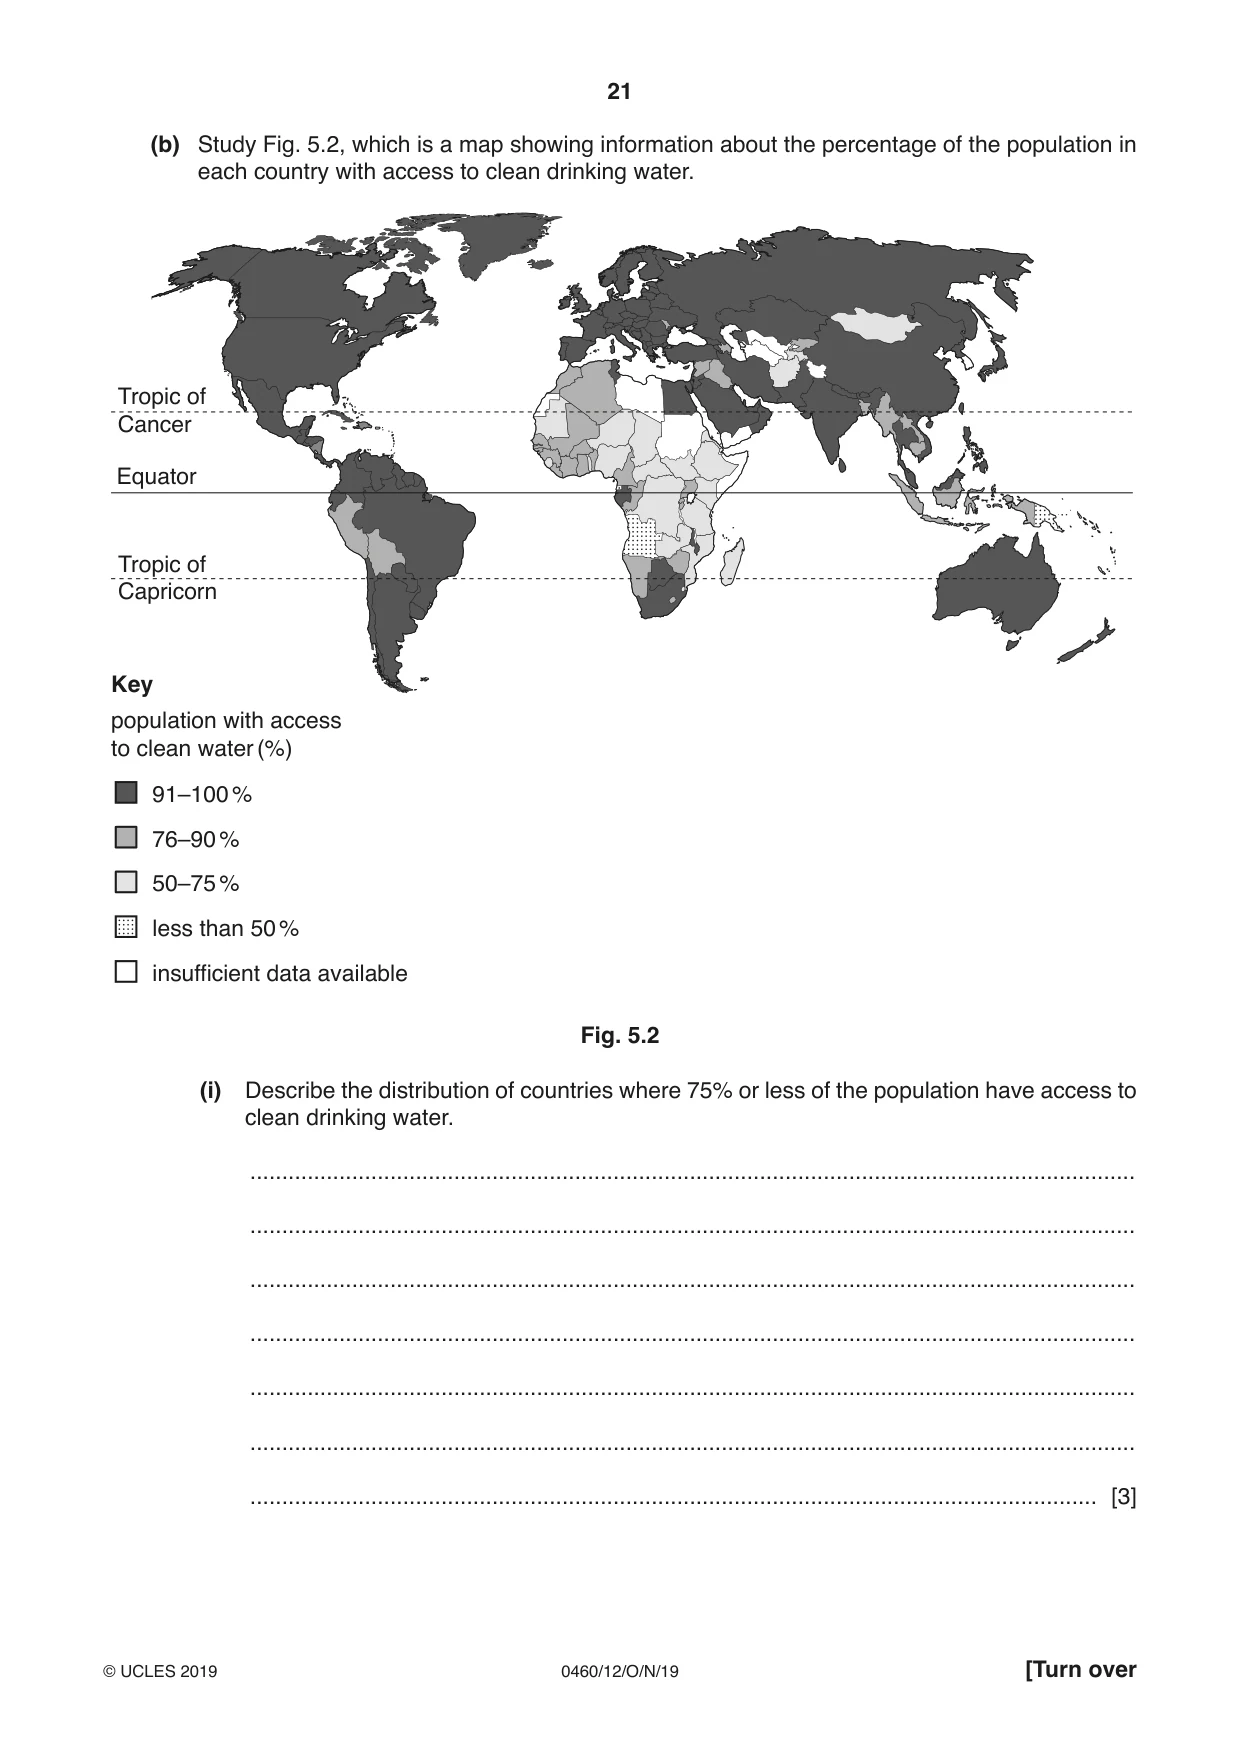
21 0460/12/O/N/19 © UCLES 2019 [Turn over (b) Study Fig. 5.2, which is a map showing information about the percentage of the population in each country with access to clean drinking water. Equator Tropic of Capricorn Tropic of Cancer population with access to clean water (%) Key 91–100 % 76–90 % 50–75 % less than 50 % insufficient data available Fig. 5.2 (i) Describe the distribution of countries where 75% or less of the population have access to clean drinking water. … … … … … … … [3]
Question paper, page 22
22 0460/12/O/N/19 © UCLES 2019 (ii) Explain how poor water supply may affect the development of a country. … … … … … … … … … … [5]
Question paper, page 23
23 0460/12/O/N/19 © UCLES 2019 [Turn over (c) Energy is another important resource. For a named country or area you have studied, describe and explain the importance of different sources of energy. Name of country or area … … … … … … … … … … … … … … … … … … … … … … … … … [7] [Total: 25]
Question paper, page 24
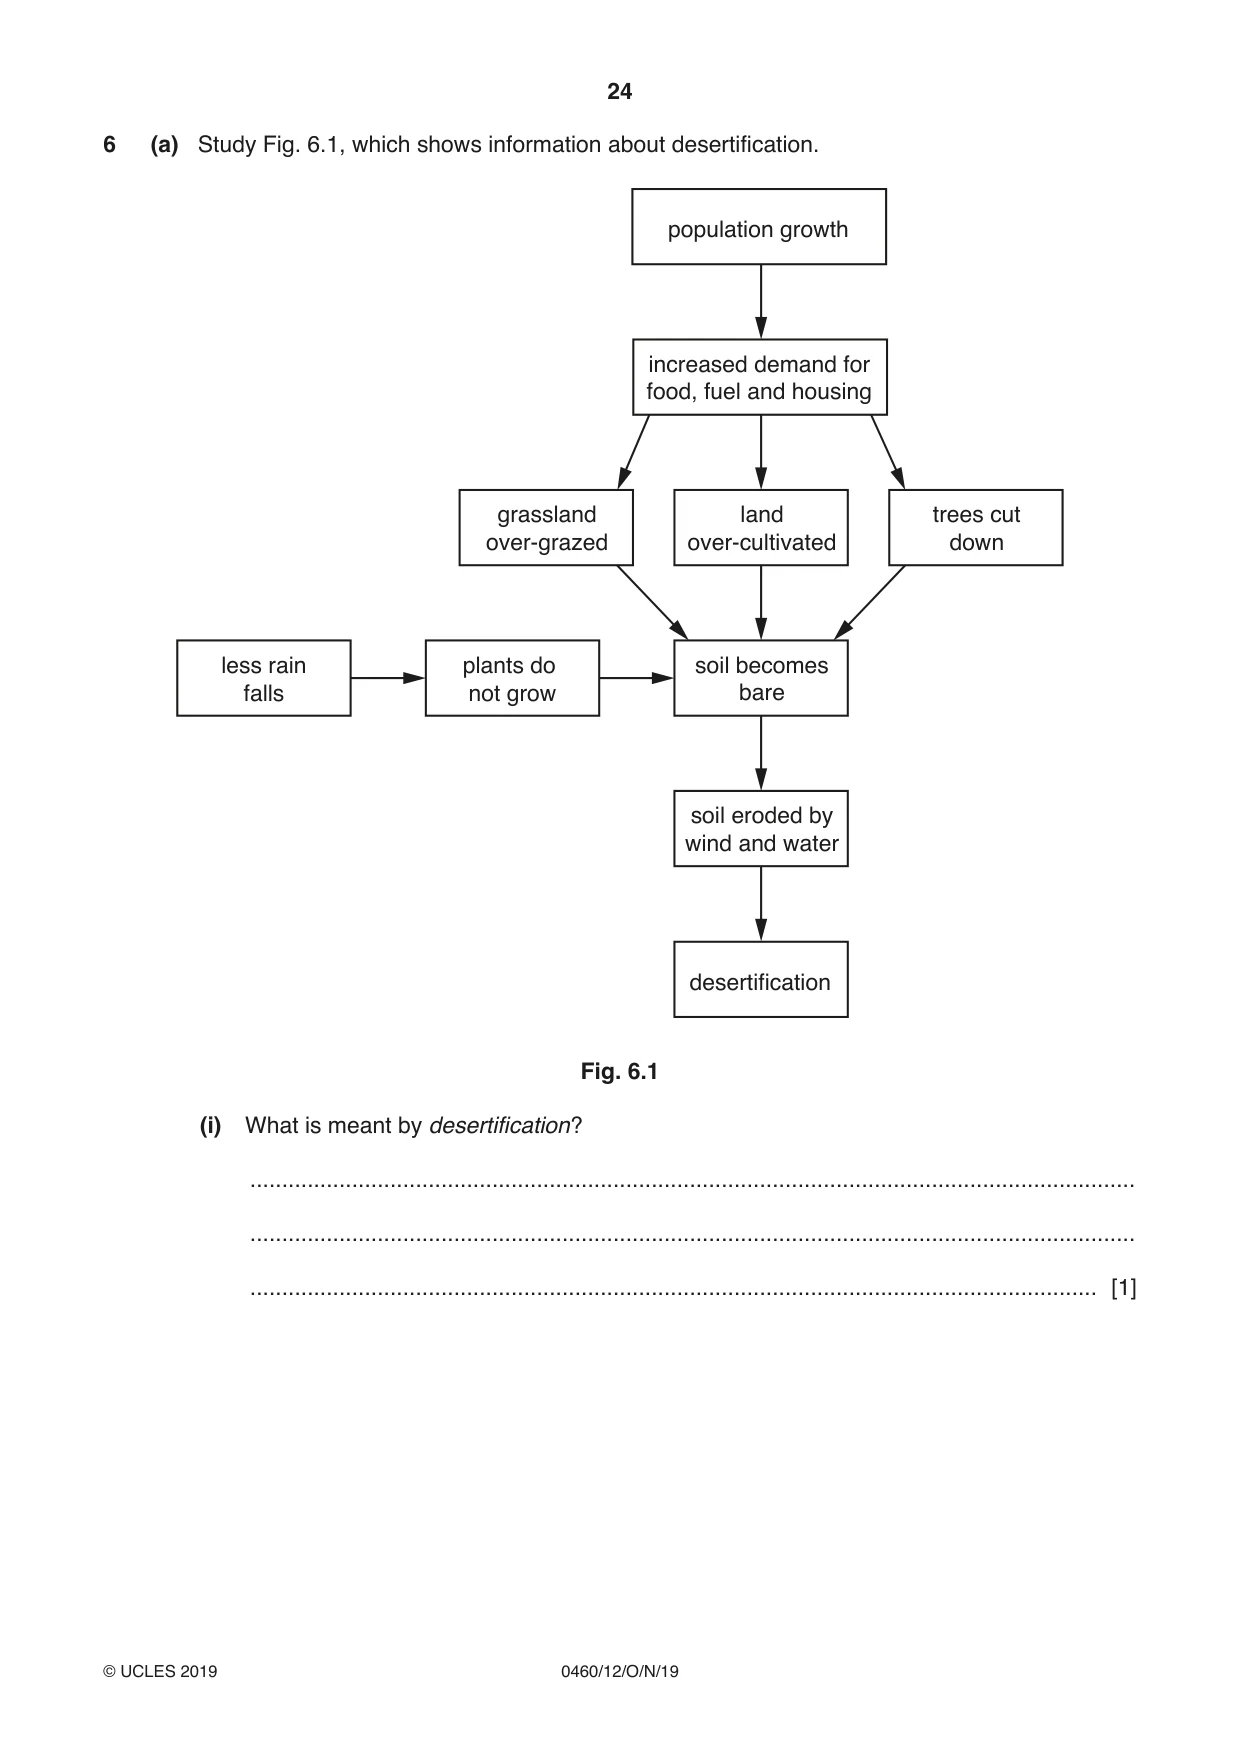
24 0460/12/O/N/19 © UCLES 2019 6 (a) Study Fig. 6.1, which shows information about desertification. increased demand for food, fuel and housing soil becomes bare plants do not grow less rain falls soil eroded by wind and water land over-cultivated trees cut down grassland over-grazed population growth desertification Fig. 6.1 (i) What is meant by desertification? … … … [1]
Question paper, page 25
25 0460/12/O/N/19 © UCLES 2019 [Turn over (ii) Using information from Fig. 6.1 only, explain how the following can cause desertification. A Climate change … … … … [2] B Population growth … … … … … … [3] (iii) State two methods which people in rural areas of LEDCs could use to reduce desertification. For each of your chosen methods, explain why you think it will be successful. 1 … … … … 2 … … … … … [4]
Question paper, page 26
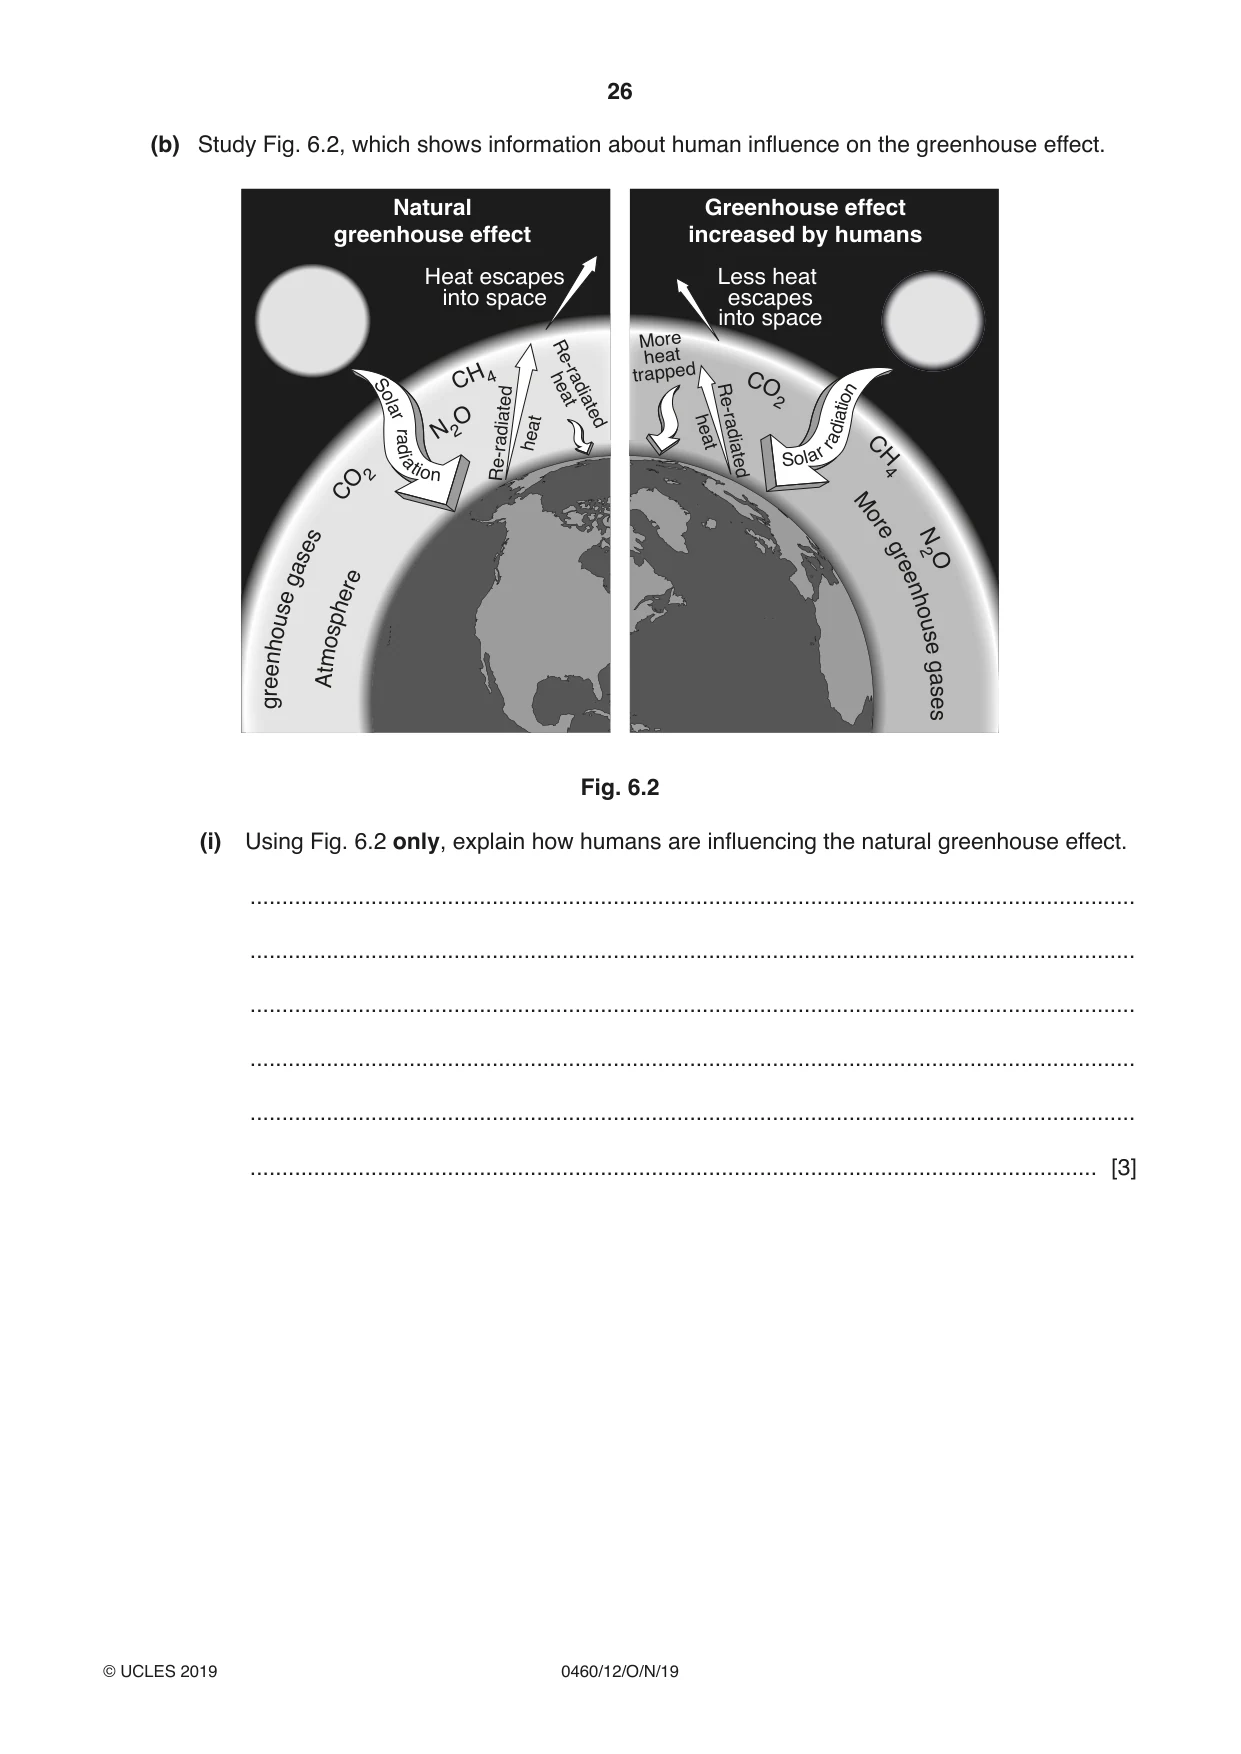
26 0460/12/O/N/19 © UCLES 2019 (b) Study Fig. 6.2, which shows information about human influence on the greenhouse effect. Natural greenhouse effect Greenhouse effect increased by humans Heat escapes into space Less heat escapes into space gr ee nh ou se g as es C H4 C H4 N2 O N2 O C O2 C O2 At m os ph er e M or e gr ee nh ou se g as es r a d i a t i o n S o l a r S o l a r r a d iat i o n Re-radiated Re-radiated heat heat More heat trapped Re-radiated heat Fig. 6.2 (i) Using Fig. 6.2 only, explain how humans are influencing the natural greenhouse effect. … … … … … … [3]
Question paper, page 27
27 0460/12/O/N/19 © UCLES 2019 [Turn over (ii) Explain why greenhouse gases are building up in the atmosphere. … … … … … … … … … … [5]
Question paper, page 28
28 0460/12/O/N/19 © UCLES 2019 (c) Describe the problems caused by the increase in the greenhouse effect (global warming). You should refer to named areas affected. … … … … … … … … … … … … … … … … … … … … … … … … … … [7] [Total: 25]
Question paper, page 29
29 0460/12/O/N/19 © UCLES 2019 Additional Pages If you use the following lined pages to complete the answer(s) to any question(s), the question number(s) must be clearly shown. … … … … … … … … … … … … … … … … … … … … … … … … … …
Question paper, page 30
30 0460/12/O/N/19 © UCLES 2019 … … … … … … … … … … … … … … … … … … … … … … … … … … … …
Question paper, page 31
31 0460/12/O/N/19 © UCLES 2019 BLANK PAGE
Question paper, page 32
32 0460/12/O/N/19 © UCLES 2019 Permission to reproduce items where third-party owned material protected by copyright is included has been sought and cleared where possible. Every reasonable effort has been made by the publisher (UCLES) to trace copyright holders, but if any items requiring clearance have unwittingly been included, the publisher will be pleased to make amends at the earliest possible opportunity. To avoid the issue of disclosure of answer-related information to candidates, all copyright acknowledgements are reproduced online in the Cambridge Assessment International Education Copyright Acknowledgements Booklet. This is produced for each series of examinations and is freely available to download at www.cambridgeinternational.org after the live examination series. Cambridge Assessment International Education is part of the Cambridge Assessment Group. Cambridge Assessment is the brand name of the University of Cambridge Local Examinations Syndicate (UCLES), which itself is a department of the University of Cambridge. BLANK PAGE
Mark scheme, page 1
This syllabus is regulated for use in England, Wales and Northern Ireland as a Cambridge International Level 1/Level 2 Certificate. This document consists of 19 printed pages. © UCLES 2019 [Turn over Cambridge Assessment International Education Cambridge International General Certificate of Secondary Education GEOGRAPHY 0460/12 Paper 1 October/November 2019 MARK SCHEME Maximum Mark: 75 Published This mark scheme is published as an aid to teachers and candidates, to indicate the requirements of the examination. It shows the basis on which Examiners were instructed to award marks. It does not indicate the details of the discussions that took place at an Examiners’ meeting before marking began, which would have considered the acceptability of alternative answers. Mark schemes should be read in conjunction with the question paper and the Principal Examiner Report for Teachers. Cambridge International will not enter into discussions about these mark schemes. Cambridge International is publishing the mark schemes for the October/November 2019 series for most Cambridge IGCSE™, Cambridge International A and AS Level components and some Cambridge O Level components.
Mark scheme, page 2
0460/12 Cambridge IGCSE – Mark Scheme PUBLISHED October/November 2019 © UCLES 2019 Page 2 of 19 Generic Marking Principles These general marking principles must be applied by all examiners when marking candidate answers. They should be applied alongside the specific content of the mark scheme or generic level descriptors for a question. Each question paper and mark scheme will also comply with these marking principles. GENERIC MARKING PRINCIPLE 1: Marks must be awarded in line with: • the specific content of the mark scheme or the generic level descriptors for the question • the specific skills defined in the mark scheme or in the generic level descriptors for the question • the standard of response required by a candidate as exemplified by the standardisation scripts. GENERIC MARKING PRINCIPLE 2: Marks awarded are always whole marks (not half marks, or other fractions). GENERIC MARKING PRINCIPLE 3: Marks must be awarded positively: • marks are awarded for correct/valid answers, as defined in the mark scheme. However, credit is given for valid answers which go beyond the scope of the syllabus and mark scheme, referring to your Team Leader as appropriate • marks are awarded when candidates clearly demonstrate what they know and can do • marks are not deducted for errors • marks are not deducted for omissions • answers should only be judged on the quality of spelling, punctuation and grammar when these features are specifically assessed by the question as indicated by the mark scheme. The meaning, however, should be unambiguous. GENERIC MARKING PRINCIPLE 4: Rules must be applied consistently e.g. in situations where candidates have not followed instructions or in the application of generic level descriptors. GENERIC MARKING PRINCIPLE 5: Marks should be awarded using the full range of marks defined in the mark scheme for the question (however; the use of the full mark range may be limited according to the quality of the candidate responses seen). GENERIC MARKING PRINCIPLE 6: Marks awarded are based solely on the requirements as defined in the mark scheme. Marks should not be awarded with grade thresholds or grade descriptors in mind.
Mark scheme, page 3
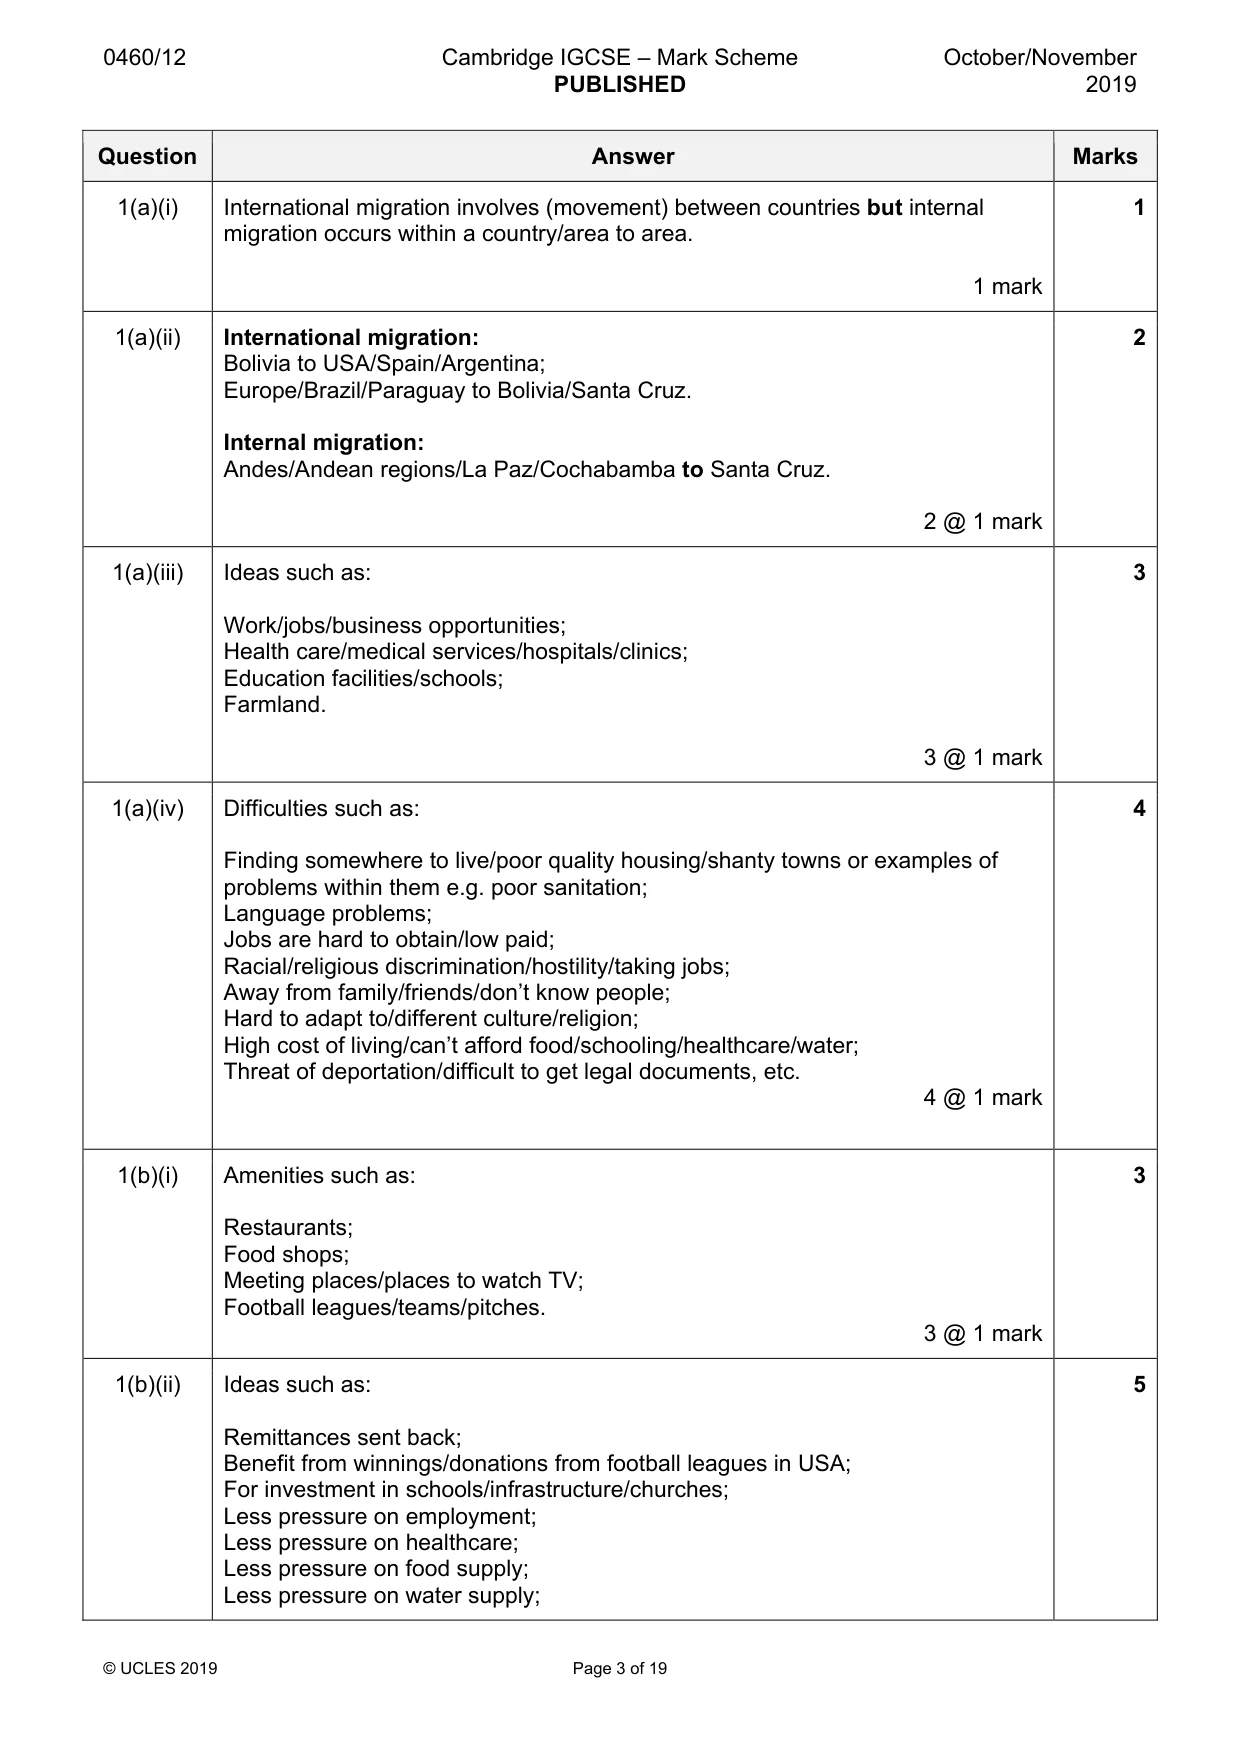
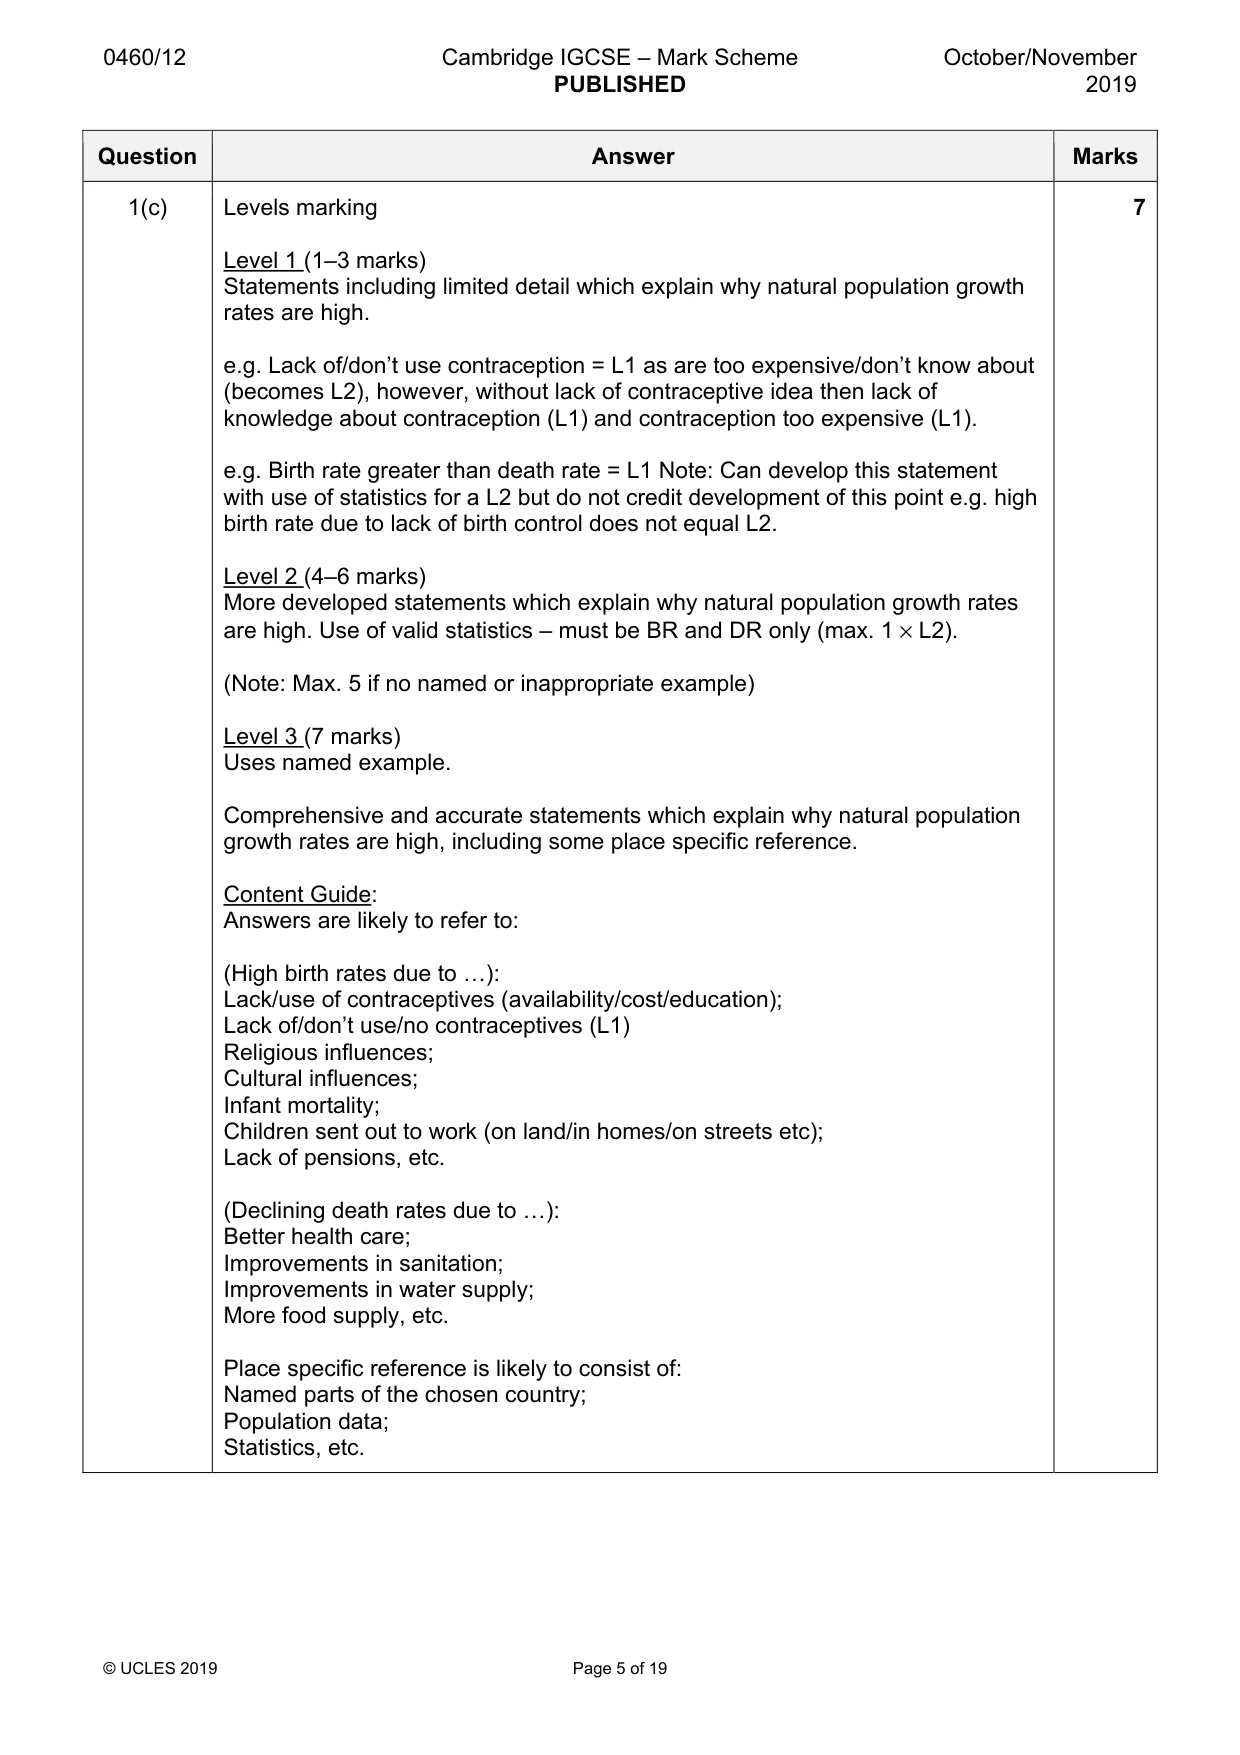
0460/12 Cambridge IGCSE – Mark Scheme PUBLISHED October/November 2019 © UCLES 2019 Page 3 of 19 Question Answer Marks 1(a)(i) International migration involves (movement) between countries but internal migration occurs within a country/area to area. 1 mark 1 1(a)(ii) International migration: Bolivia to USA/Spain/Argentina; Europe/Brazil/Paraguay to Bolivia/Santa Cruz. Internal migration: Andes/Andean regions/La Paz/Cochabamba to Santa Cruz. 2 @ 1 mark 2 1(a)(iii) Ideas such as: Work/jobs/business opportunities; Health care/medical services/hospitals/clinics; Education facilities/schools; Farmland. 3 @ 1 mark 3 1(a)(iv) Difficulties such as: Finding somewhere to live/poor quality housing/shanty towns or examples of problems within them e.g. poor sanitation; Language problems; Jobs are hard to obtain/low paid; Racial/religious discrimination/hostility/taking jobs; Away from family/friends/don’t know people; Hard to adapt to/different culture/religion; High cost of living/can’t afford food/schooling/healthcare/water; Threat of deportation/difficult to get legal documents, etc. 4 @ 1 mark 4 1(b)(i) Amenities such as: Restaurants; Food shops; Meeting places/places to watch TV; Football leagues/teams/pitches. 3 @ 1 mark 3 1(b)(ii) Ideas such as: Remittances sent back; Benefit from winnings/donations from football leagues in USA; For investment in schools/infrastructure/churches; Less pressure on employment; Less pressure on healthcare; Less pressure on food supply; Less pressure on water supply; 5
Mark scheme, page 4
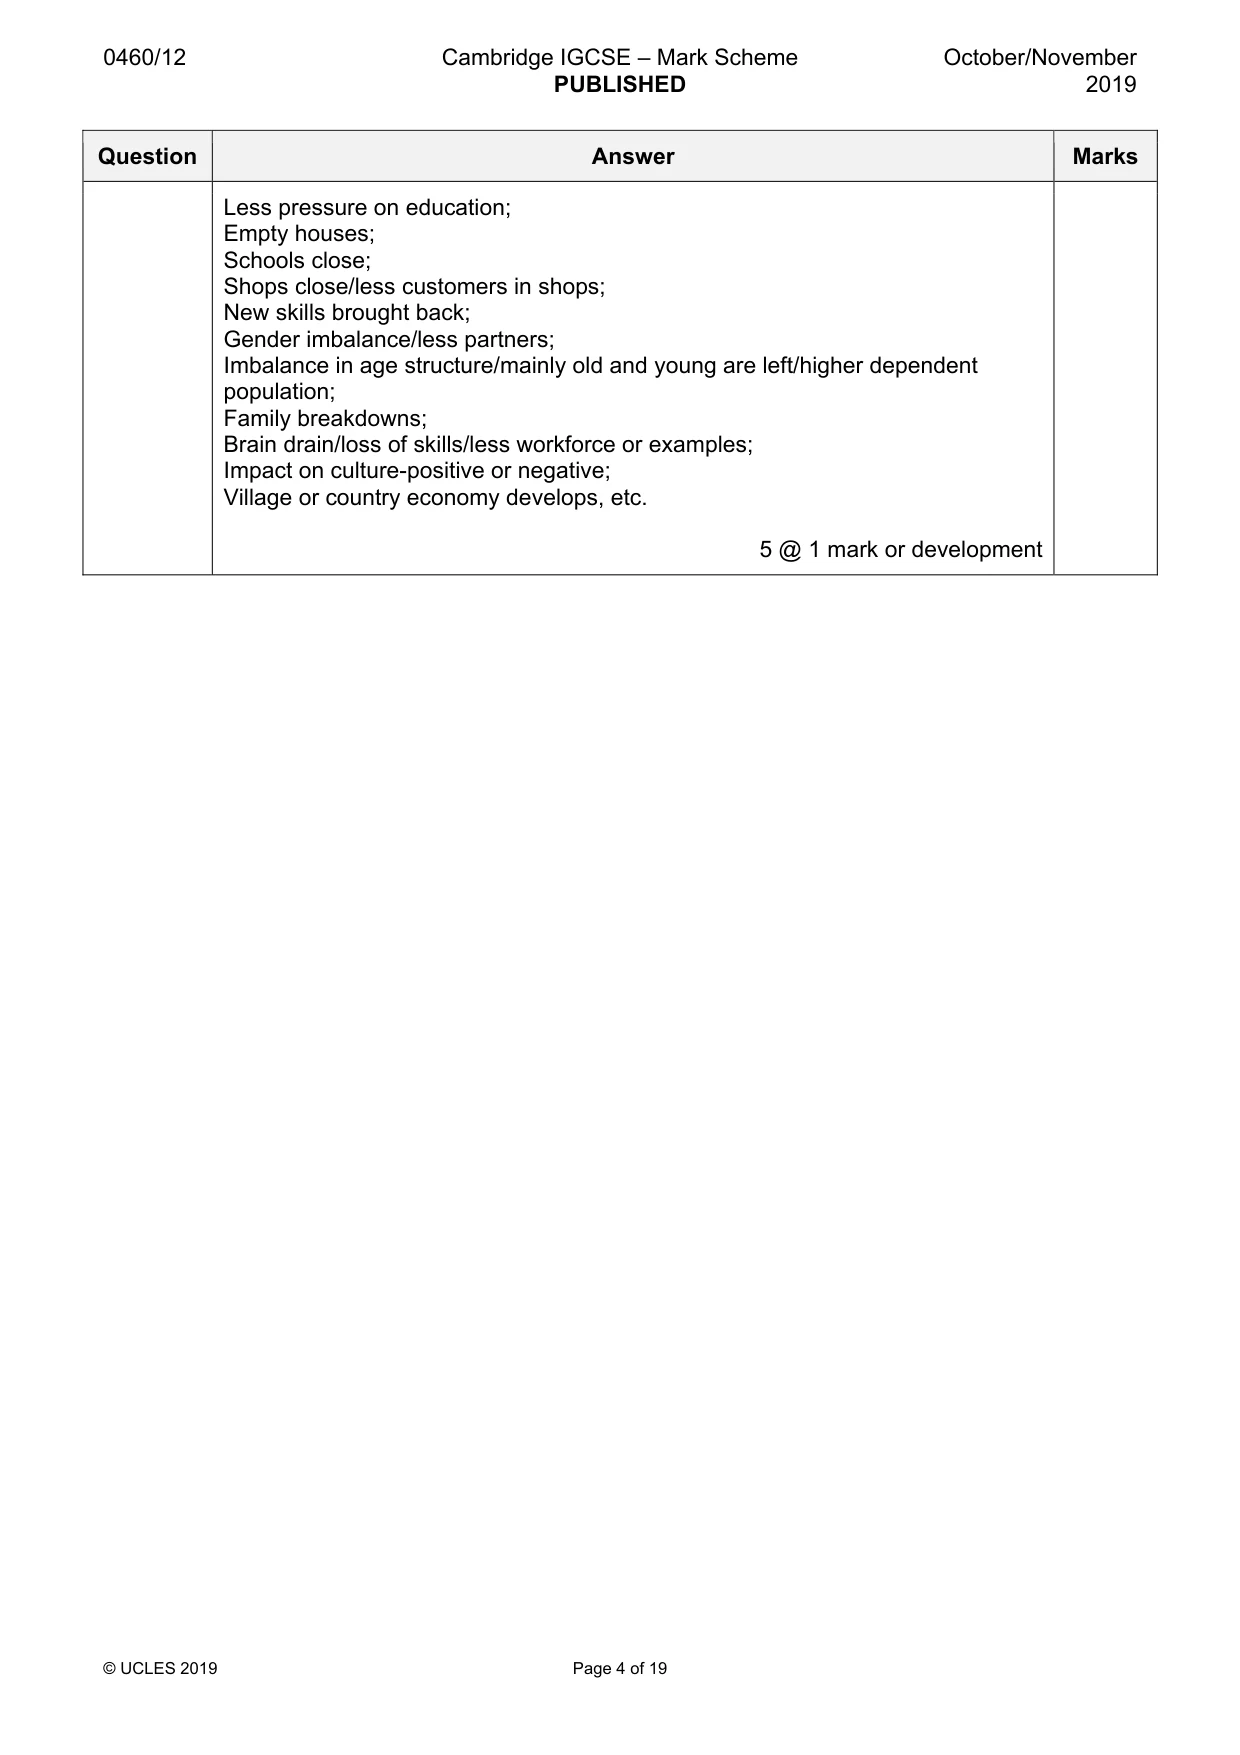
0460/12 Cambridge IGCSE – Mark Scheme PUBLISHED October/November 2019 © UCLES 2019 Page 4 of 19 Question Answer Marks Less pressure on education; Empty houses; Schools close; Shops close/less customers in shops; New skills brought back; Gender imbalance/less partners; Imbalance in age structure/mainly old and young are left/higher dependent population; Family breakdowns; Brain drain/loss of skills/less workforce or examples; Impact on culture-positive or negative; Village or country economy develops, etc. 5 @ 1 mark or development
Mark scheme, page 5
0460/12 Cambridge IGCSE – Mark Scheme PUBLISHED October/November 2019 © UCLES 2019 Page 5 of 19 Question Answer Marks 1(c) Levels marking Level 1 (1–3 marks) Statements including limited detail which explain why natural population growth rates are high. e.g. Lack of/don’t use contraception = L1 as are too expensive/don’t know about (becomes L2), however, without lack of contraceptive idea then lack of knowledge about contraception (L1) and contraception too expensive (L1). e.g. Birth rate greater than death rate = L1 Note: Can develop this statement with use of statistics for a L2 but do not credit development of this point e.g. high birth rate due to lack of birth control does not equal L2. Level 2 (4–6 marks) More developed statements which explain why natural population growth rates are high. Use of valid statistics – must be BR and DR only (max. 1 × L2). (Note: Max. 5 if no named or inappropriate example) Level 3 (7 marks) Uses named example. Comprehensive and accurate statements which explain why natural population growth rates are high, including some place specific reference. Content Guide: Answers are likely to refer to: (High birth rates due to «): Lack/use of contraceptives (availability/cost/education); Lack of/don’t use/no contraceptives (L1) Religious influences; Cultural influences; Infant mortality; Children sent out to work (on land/in homes/on streets etc); Lack of pensions, etc. (Declining death rates due to «): Better health care; Improvements in sanitation; Improvements in water supply; More food supply, etc. Place specific reference is likely to consist of: Named parts of the chosen country; Population data; Statistics, etc. 7
Mark scheme, page 6
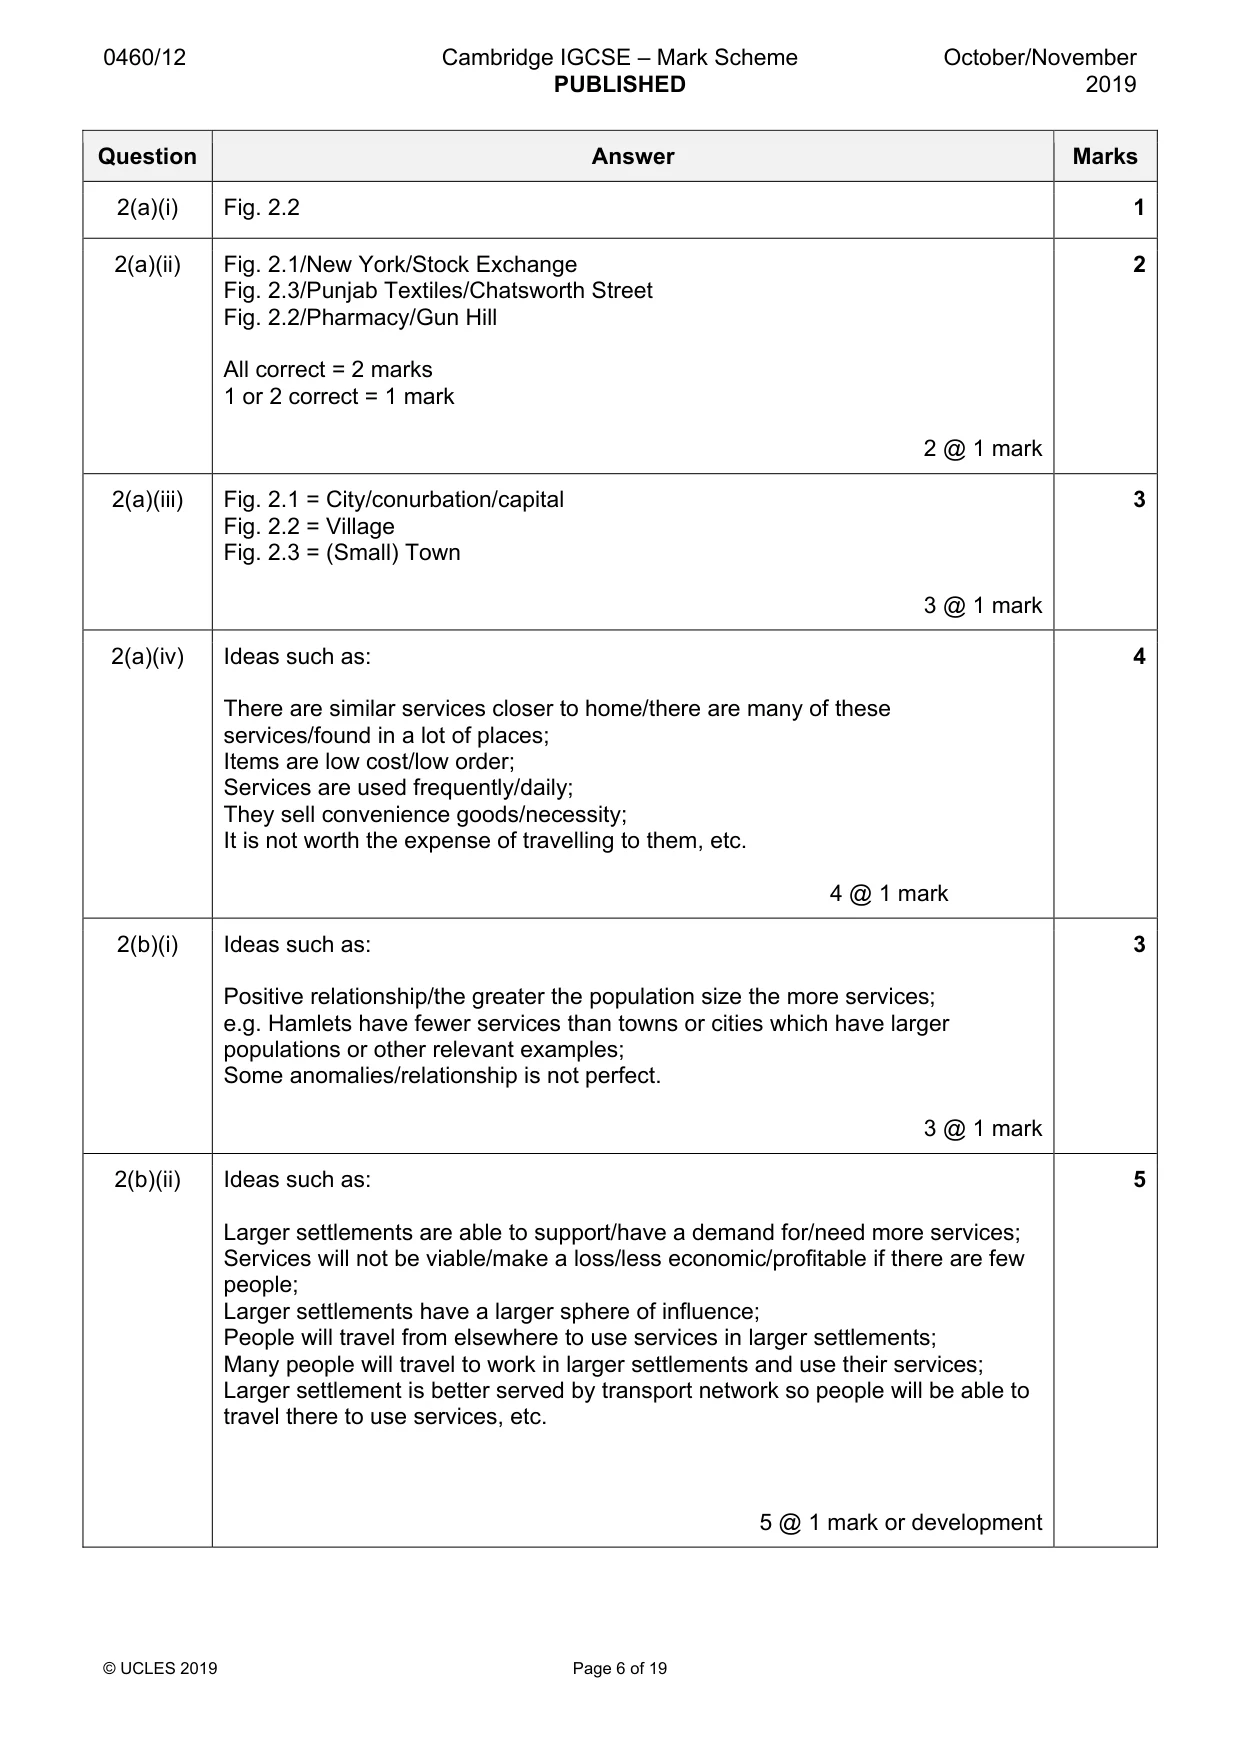
0460/12 Cambridge IGCSE – Mark Scheme PUBLISHED October/November 2019 © UCLES 2019 Page 6 of 19 Question Answer Marks 2(a)(i) Fig. 2.2 1 2(a)(ii) Fig. 2.1/New York/Stock Exchange Fig. 2.3/Punjab Textiles/Chatsworth Street Fig. 2.2/Pharmacy/Gun Hill All correct = 2 marks 1 or 2 correct = 1 mark 2 @ 1 mark 2 2(a)(iii) Fig. 2.1 = City/conurbation/capital Fig. 2.2 = Village Fig. 2.3 = (Small) Town 3 @ 1 mark 3 2(a)(iv) Ideas such as: There are similar services closer to home/there are many of these services/found in a lot of places; Items are low cost/low order; Services are used frequently/daily; They sell convenience goods/necessity; It is not worth the expense of travelling to them, etc. 4 @ 1 mark 4 2(b)(i) Ideas such as: Positive relationship/the greater the population size the more services; e.g. Hamlets have fewer services than towns or cities which have larger populations or other relevant examples; Some anomalies/relationship is not perfect. 3 @ 1 mark 3 2(b)(ii) Ideas such as: Larger settlements are able to support/have a demand for/need more services; Services will not be viable/make a loss/less economic/profitable if there are few people; Larger settlements have a larger sphere of influence; People will travel from elsewhere to use services in larger settlements; Many people will travel to work in larger settlements and use their services; Larger settlement is better served by transport network so people will be able to travel there to use services, etc. 5 @ 1 mark or development 5
Mark scheme, page 7
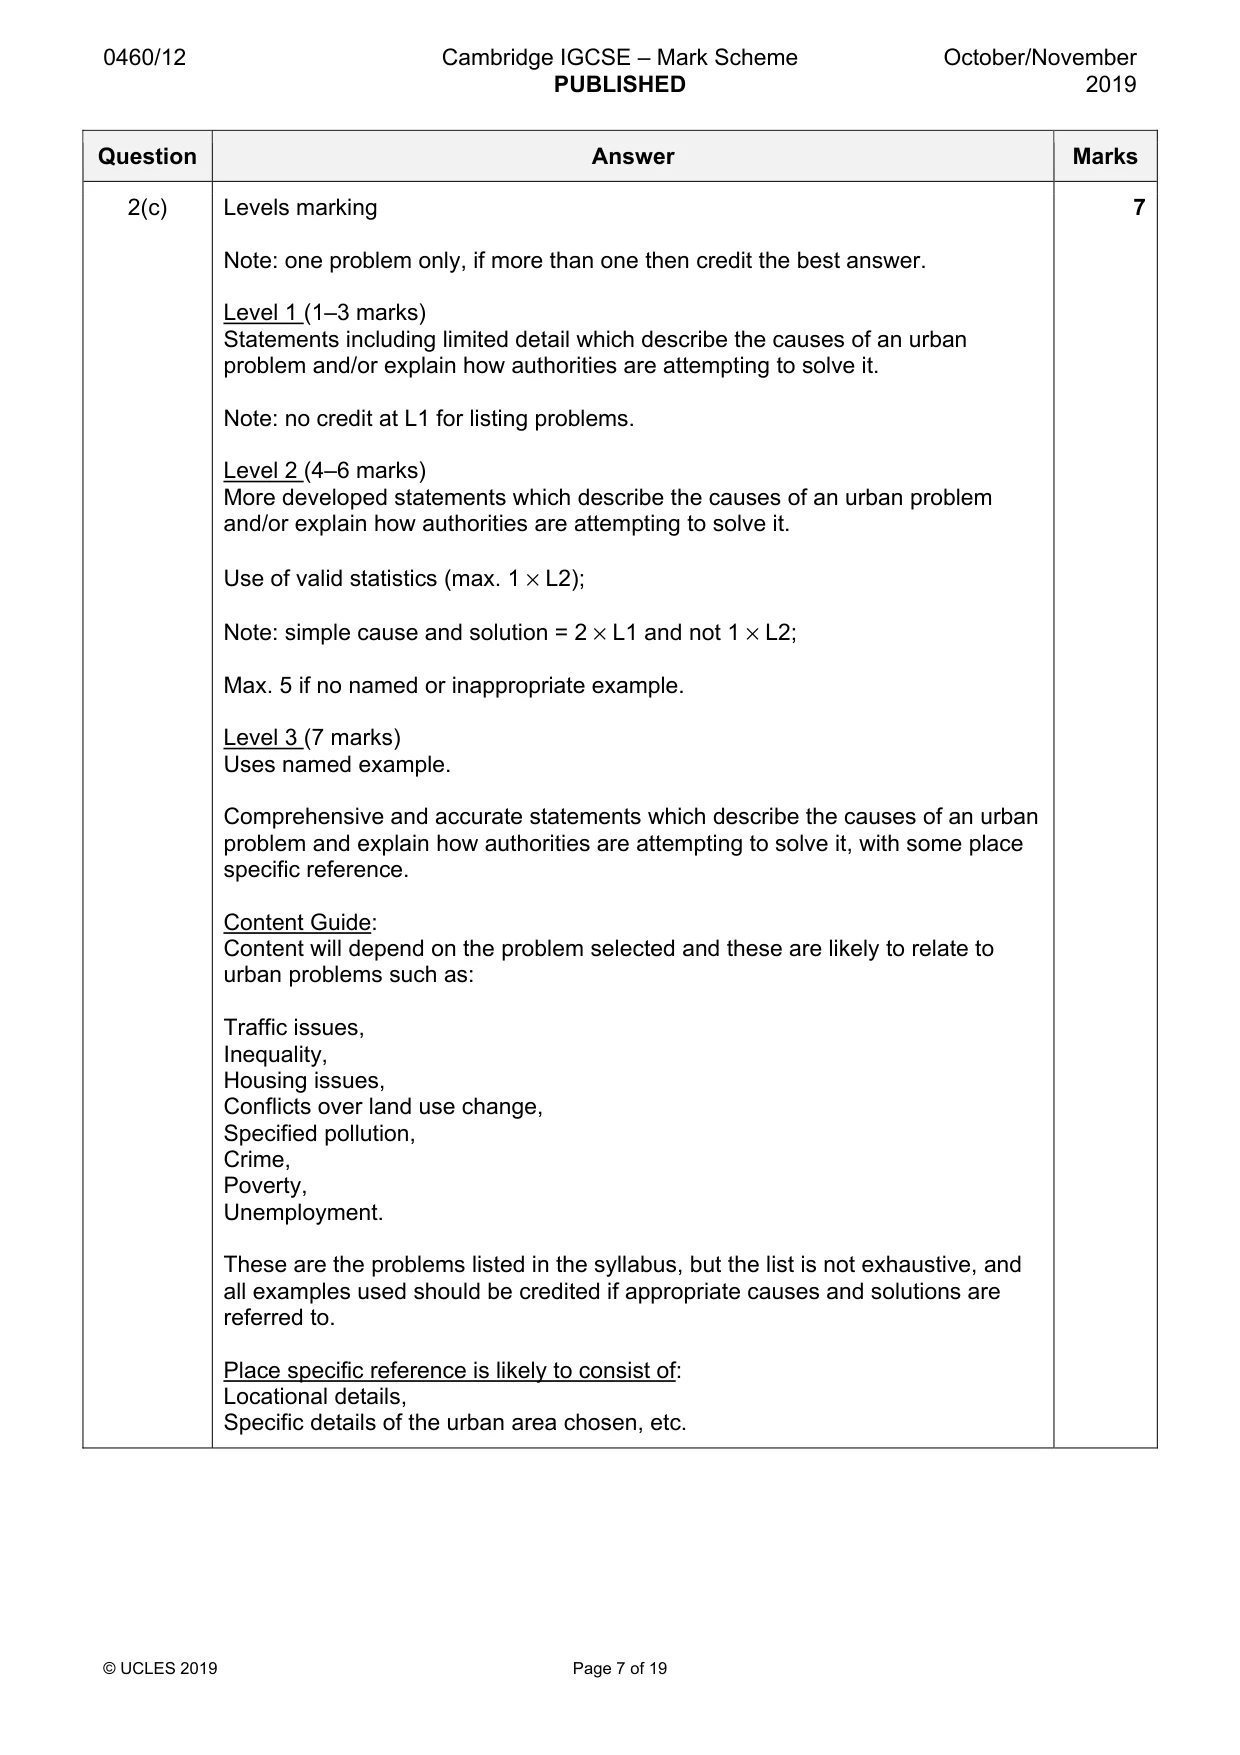
0460/12 Cambridge IGCSE – Mark Scheme PUBLISHED October/November 2019 © UCLES 2019 Page 7 of 19 Question Answer Marks 2(c) Levels marking Note: one problem only, if more than one then credit the best answer. Level 1 (1–3 marks) Statements including limited detail which describe the causes of an urban problem and/or explain how authorities are attempting to solve it. Note: no credit at L1 for listing problems. Level 2 (4–6 marks) More developed statements which describe the causes of an urban problem and/or explain how authorities are attempting to solve it. Use of valid statistics (max. 1 × L2); Note: simple cause and solution = 2 × L1 and not 1 × L2; Max. 5 if no named or inappropriate example. Level 3 (7 marks) Uses named example. Comprehensive and accurate statements which describe the causes of an urban problem and explain how authorities are attempting to solve it, with some place specific reference. Content Guide: Content will depend on the problem selected and these are likely to relate to urban problems such as: Traffic issues, Inequality, Housing issues, Conflicts over land use change, Specified pollution, Crime, Poverty, Unemployment. These are the problems listed in the syllabus, but the list is not exhaustive, and all examples used should be credited if appropriate causes and solutions are referred to. Place specific reference is likely to consist of: Locational details, Specific details of the urban area chosen, etc. 7
Mark scheme, page 8
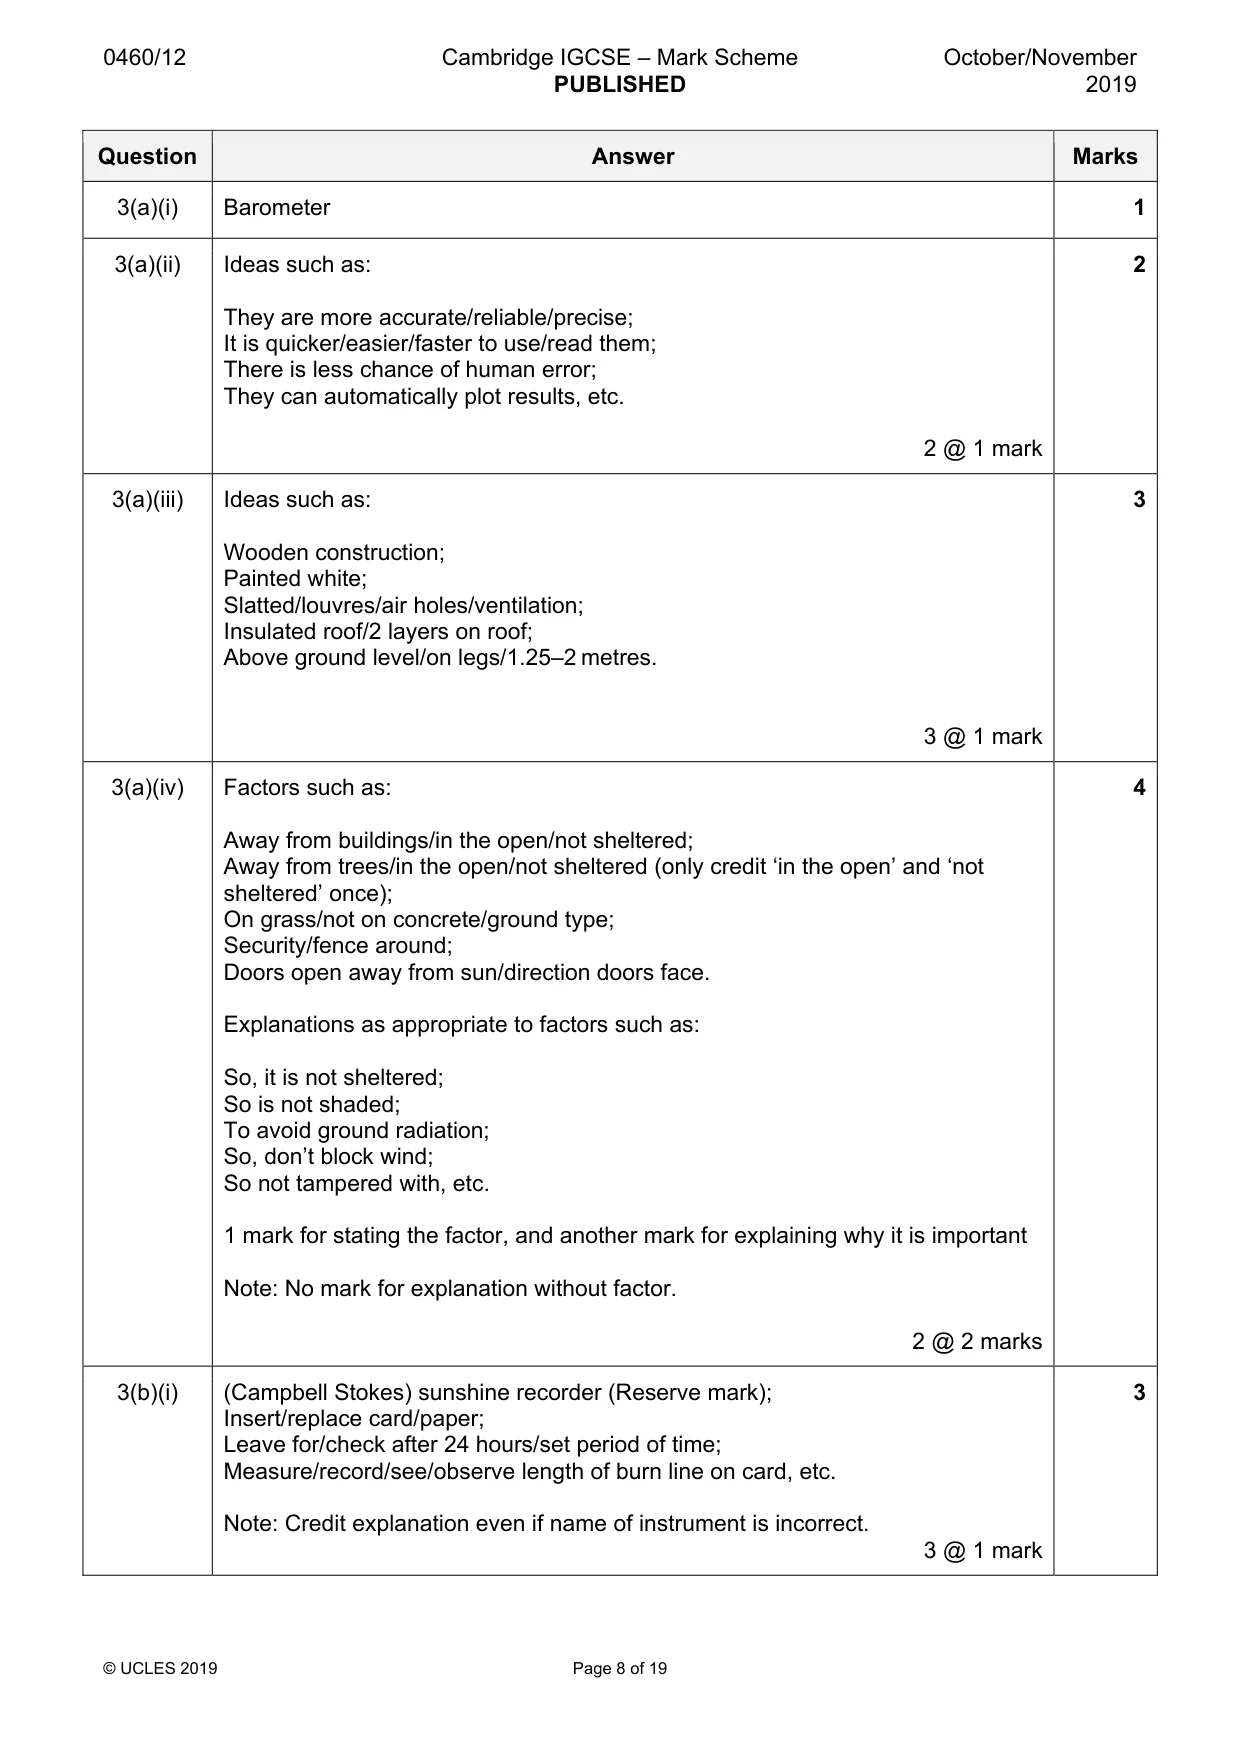
0460/12 Cambridge IGCSE – Mark Scheme PUBLISHED October/November 2019 © UCLES 2019 Page 8 of 19 Question Answer Marks 3(a)(i) Barometer 1 3(a)(ii) Ideas such as: They are more accurate/reliable/precise; It is quicker/easier/faster to use/read them; There is less chance of human error; They can automatically plot results, etc. 2 @ 1 mark 2 3(a)(iii) Ideas such as: Wooden construction; Painted white; Slatted/louvres/air holes/ventilation; Insulated roof/2 layers on roof; Above ground level/on legs/1.25–2 metres. 3 @ 1 mark 3 3(a)(iv) Factors such as: Away from buildings/in the open/not sheltered; Away from trees/in the open/not sheltered (only credit ‘in the open’ and ‘not sheltered’ once); On grass/not on concrete/ground type; Security/fence around; Doors open away from sun/direction doors face. Explanations as appropriate to factors such as: So, it is not sheltered; So is not shaded; To avoid ground radiation; So, don’t block wind; So not tampered with, etc. 1 mark for stating the factor, and another mark for explaining why it is important Note: No mark for explanation without factor. 2 @ 2 marks 4 3(b)(i) (Campbell Stokes) sunshine recorder (Reserve mark); Insert/replace card/paper; Leave for/check after 24 hours/set period of time; Measure/record/see/observe length of burn line on card, etc. Note: Credit explanation even if name of instrument is incorrect. 3 @ 1 mark 3
Mark scheme, page 9
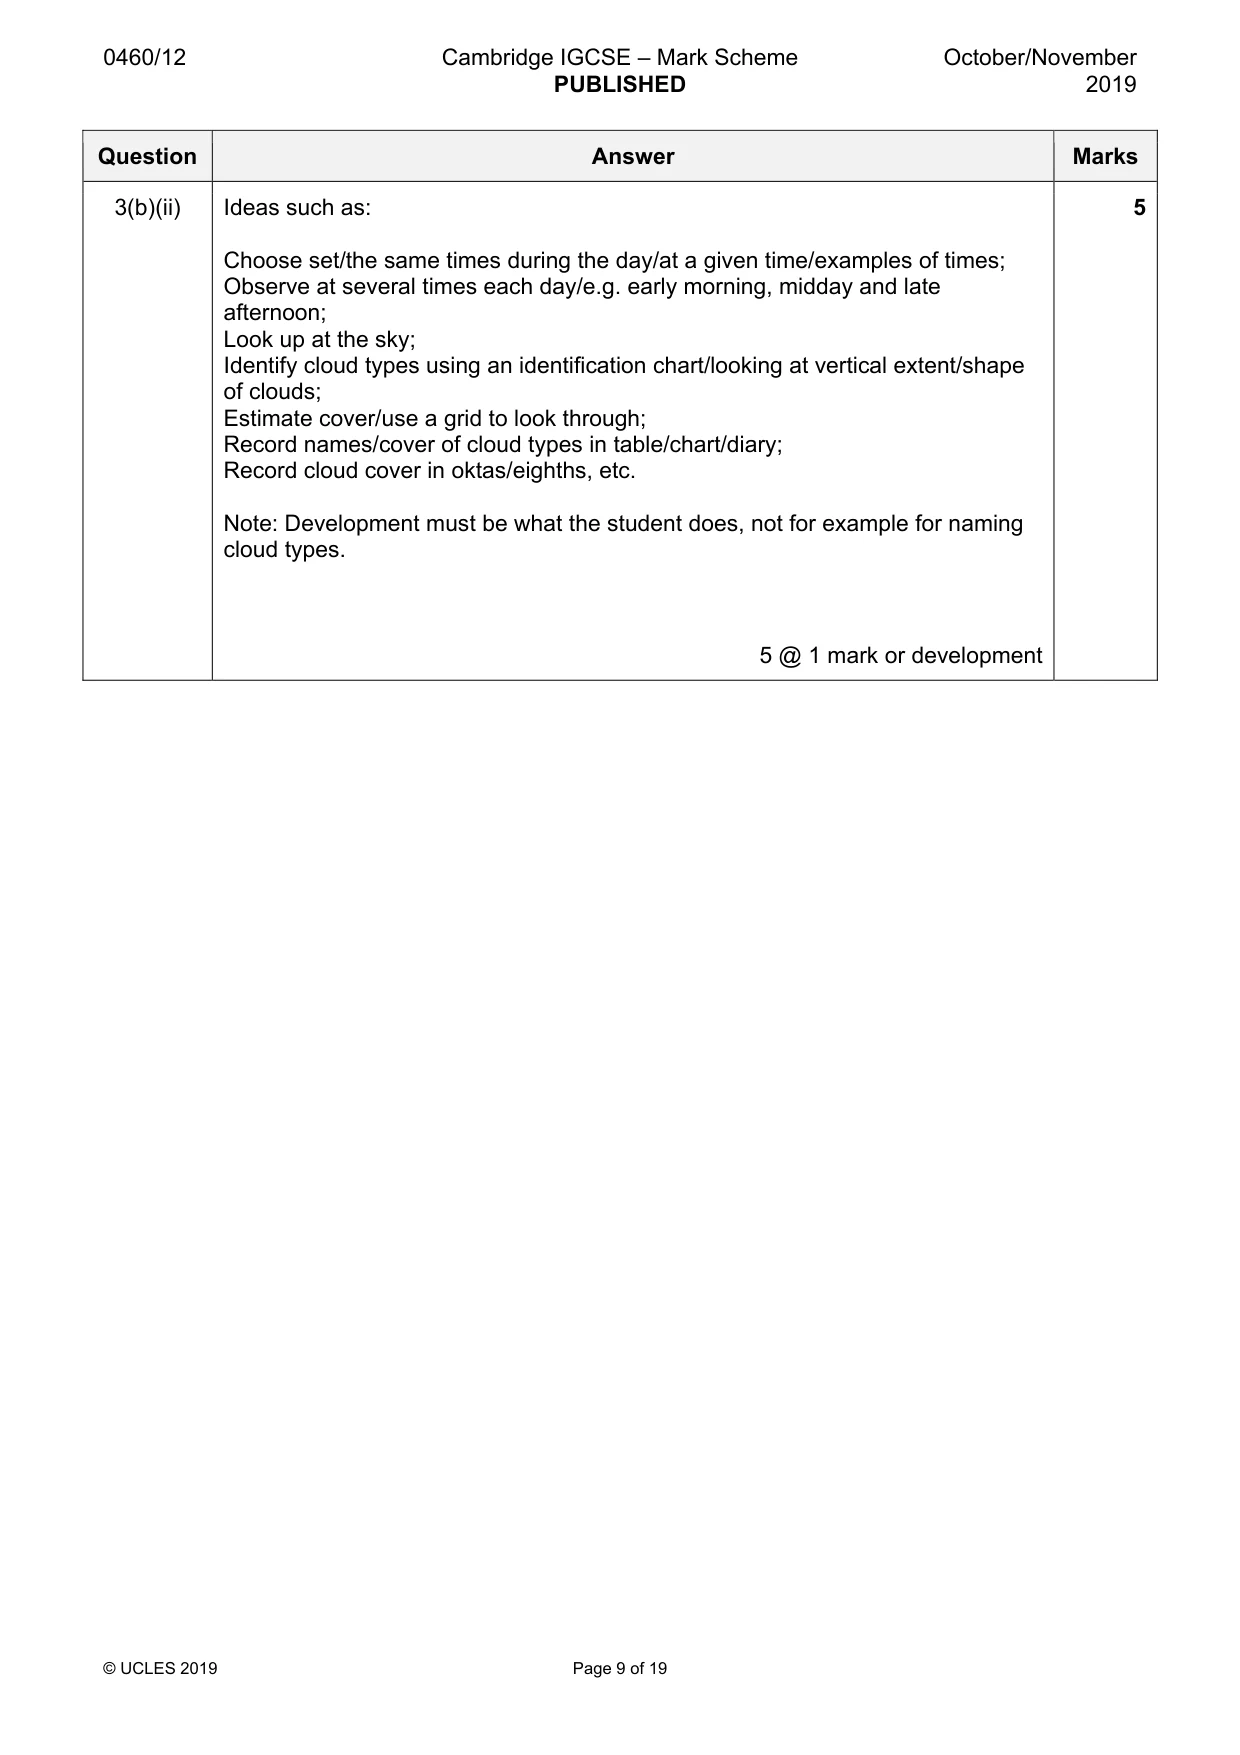
0460/12 Cambridge IGCSE – Mark Scheme PUBLISHED October/November 2019 © UCLES 2019 Page 9 of 19 Question Answer Marks 3(b)(ii) Ideas such as: Choose set/the same times during the day/at a given time/examples of times; Observe at several times each day/e.g. early morning, midday and late afternoon; Look up at the sky; Identify cloud types using an identification chart/looking at vertical extent/shape of clouds; Estimate cover/use a grid to look through; Record names/cover of cloud types in table/chart/diary; Record cloud cover in oktas/eighths, etc. Note: Development must be what the student does, not for example for naming cloud types. 5 @ 1 mark or development 5
Mark scheme, page 10
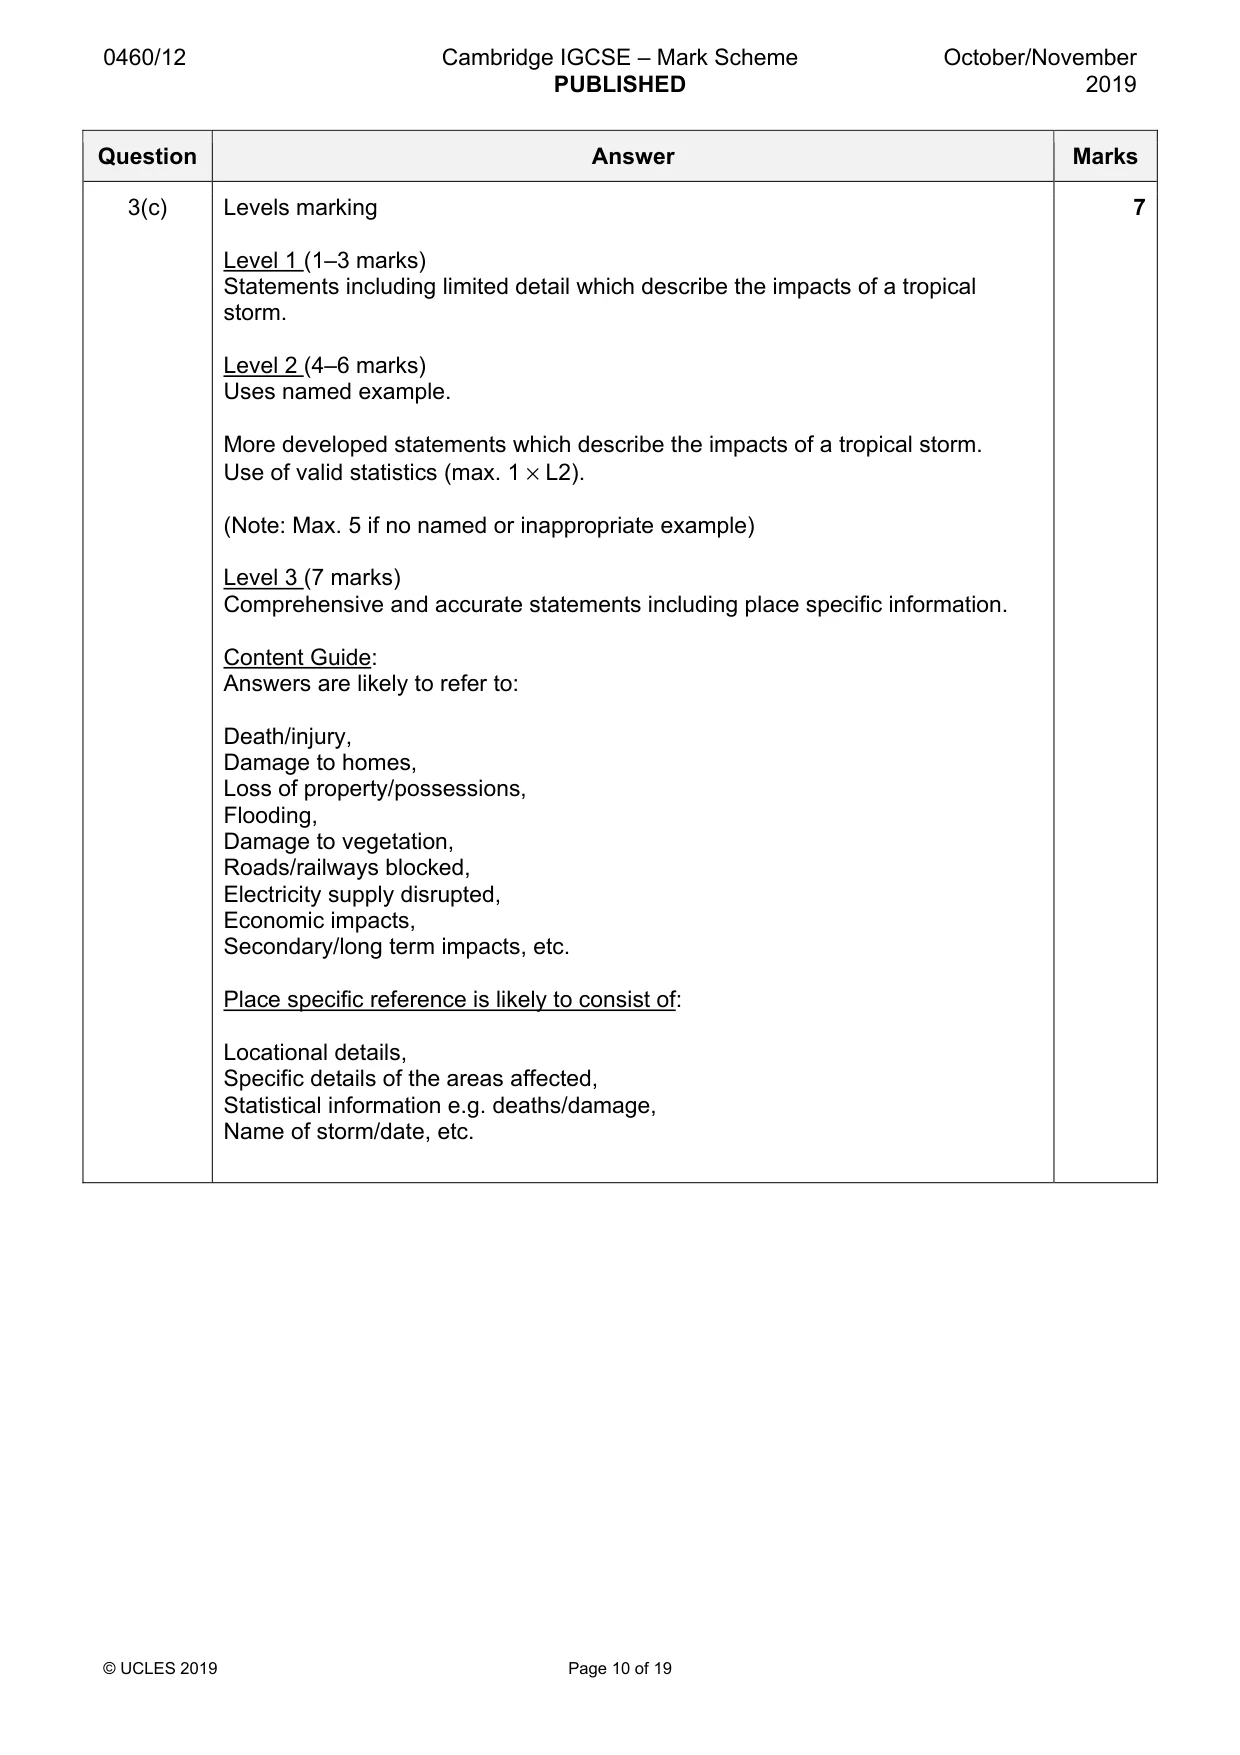
0460/12 Cambridge IGCSE – Mark Scheme PUBLISHED October/November 2019 © UCLES 2019 Page 10 of 19 Question Answer Marks 3(c) Levels marking Level 1 (1–3 marks) Statements including limited detail which describe the impacts of a tropical storm. Level 2 (4–6 marks) Uses named example. More developed statements which describe the impacts of a tropical storm. Use of valid statistics (max. 1 × L2). (Note: Max. 5 if no named or inappropriate example) Level 3 (7 marks) Comprehensive and accurate statements including place specific information. Content Guide: Answers are likely to refer to: Death/injury, Damage to homes, Loss of property/possessions, Flooding, Damage to vegetation, Roads/railways blocked, Electricity supply disrupted, Economic impacts, Secondary/long term impacts, etc. Place specific reference is likely to consist of: Locational details, Specific details of the areas affected, Statistical information e.g. deaths/damage, Name of storm/date, etc. 7
Mark scheme, page 11
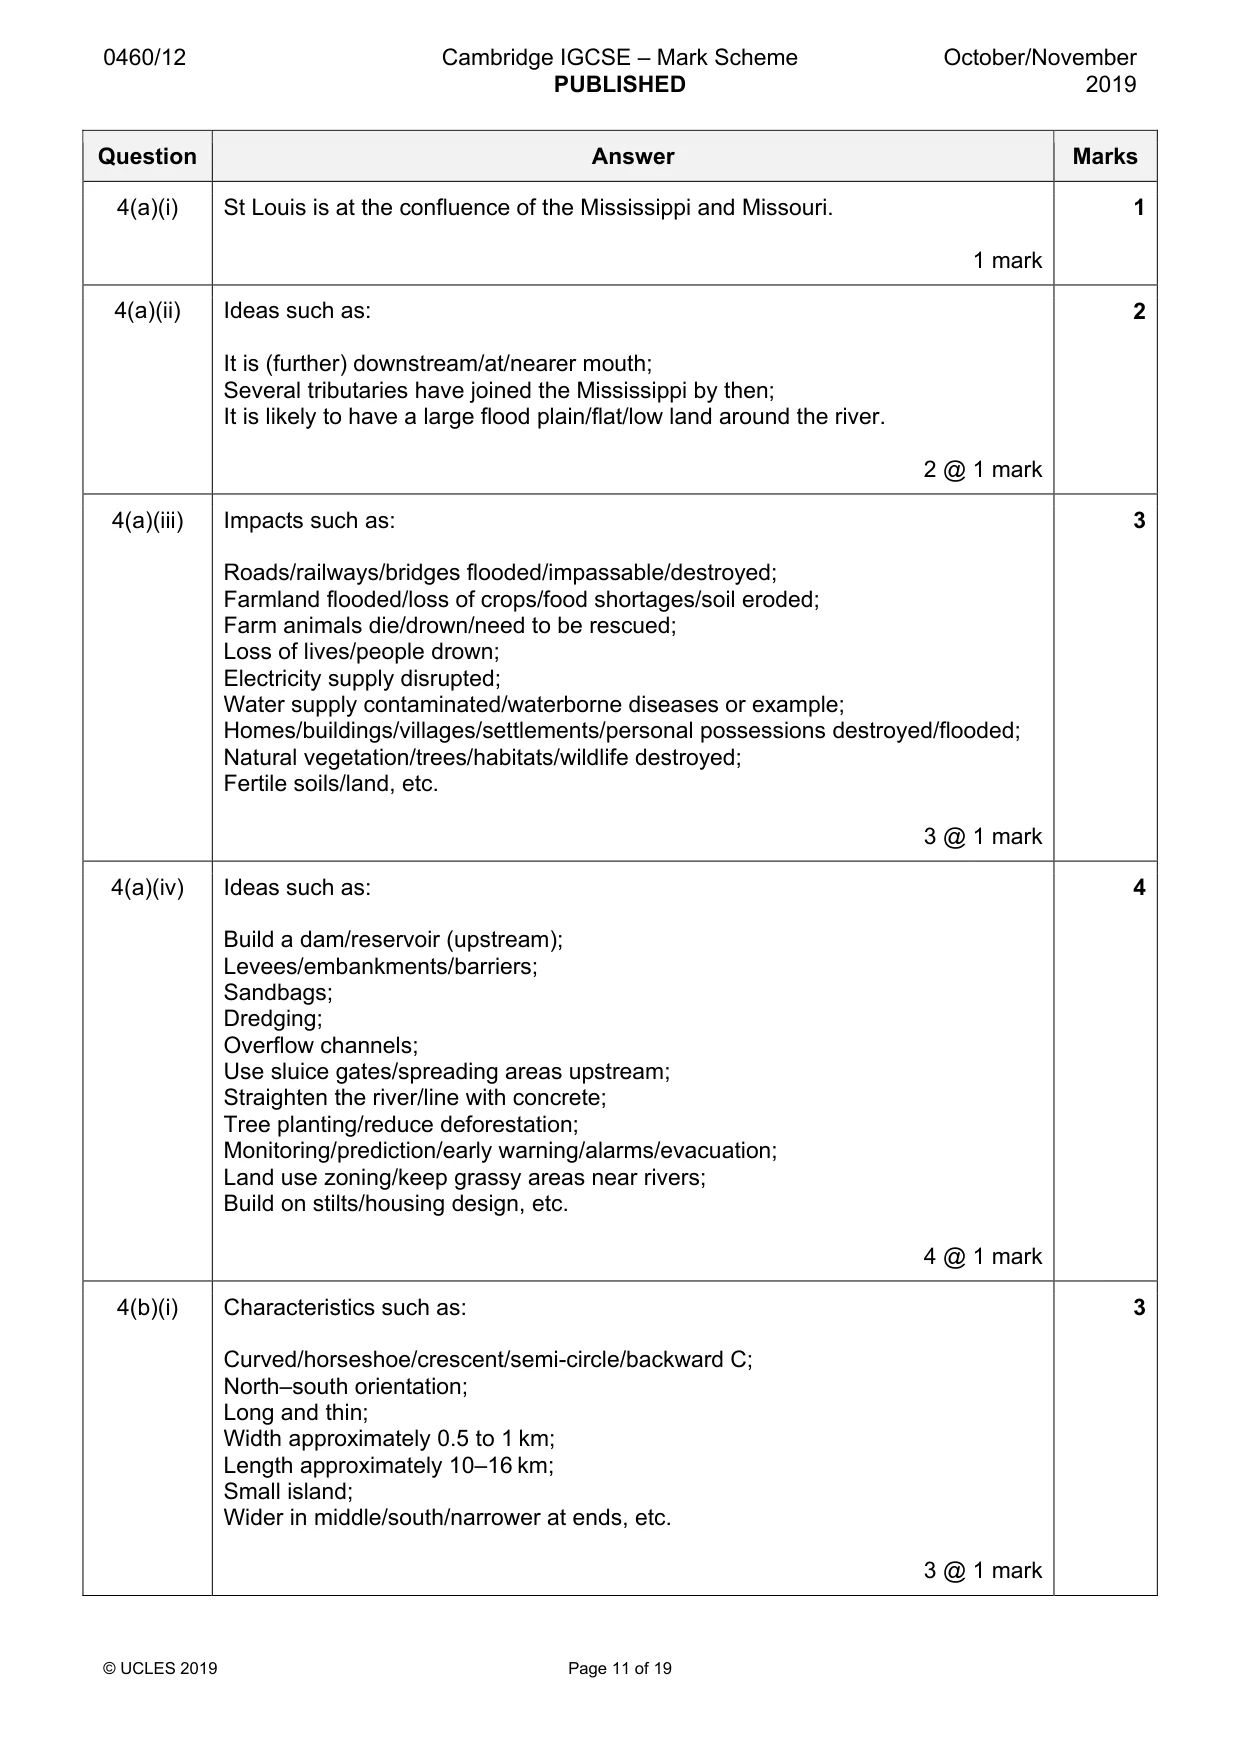
0460/12 Cambridge IGCSE – Mark Scheme PUBLISHED October/November 2019 © UCLES 2019 Page 11 of 19 Question Answer Marks 4(a)(i) St Louis is at the confluence of the Mississippi and Missouri. 1 mark 1 4(a)(ii) Ideas such as: It is (further) downstream/at/nearer mouth; Several tributaries have joined the Mississippi by then; It is likely to have a large flood plain/flat/low land around the river. 2 @ 1 mark 2 4(a)(iii) Impacts such as: Roads/railways/bridges flooded/impassable/destroyed; Farmland flooded/loss of crops/food shortages/soil eroded; Farm animals die/drown/need to be rescued; Loss of lives/people drown; Electricity supply disrupted; Water supply contaminated/waterborne diseases or example; Homes/buildings/villages/settlements/personal possessions destroyed/flooded; Natural vegetation/trees/habitats/wildlife destroyed; Fertile soils/land, etc. 3 @ 1 mark 3 4(a)(iv) Ideas such as: Build a dam/reservoir (upstream); Levees/embankments/barriers; Sandbags; Dredging; Overflow channels; Use sluice gates/spreading areas upstream; Straighten the river/line with concrete; Tree planting/reduce deforestation; Monitoring/prediction/early warning/alarms/evacuation; Land use zoning/keep grassy areas near rivers; Build on stilts/housing design, etc. 4 @ 1 mark 4 4(b)(i) Characteristics such as: Curved/horseshoe/crescent/semi-circle/backward C; North–south orientation; Long and thin; Width approximately 0.5 to 1 km; Length approximately 10–16 km; Small island; Wider in middle/south/narrower at ends, etc. 3 @ 1 mark 3
Mark scheme, page 12
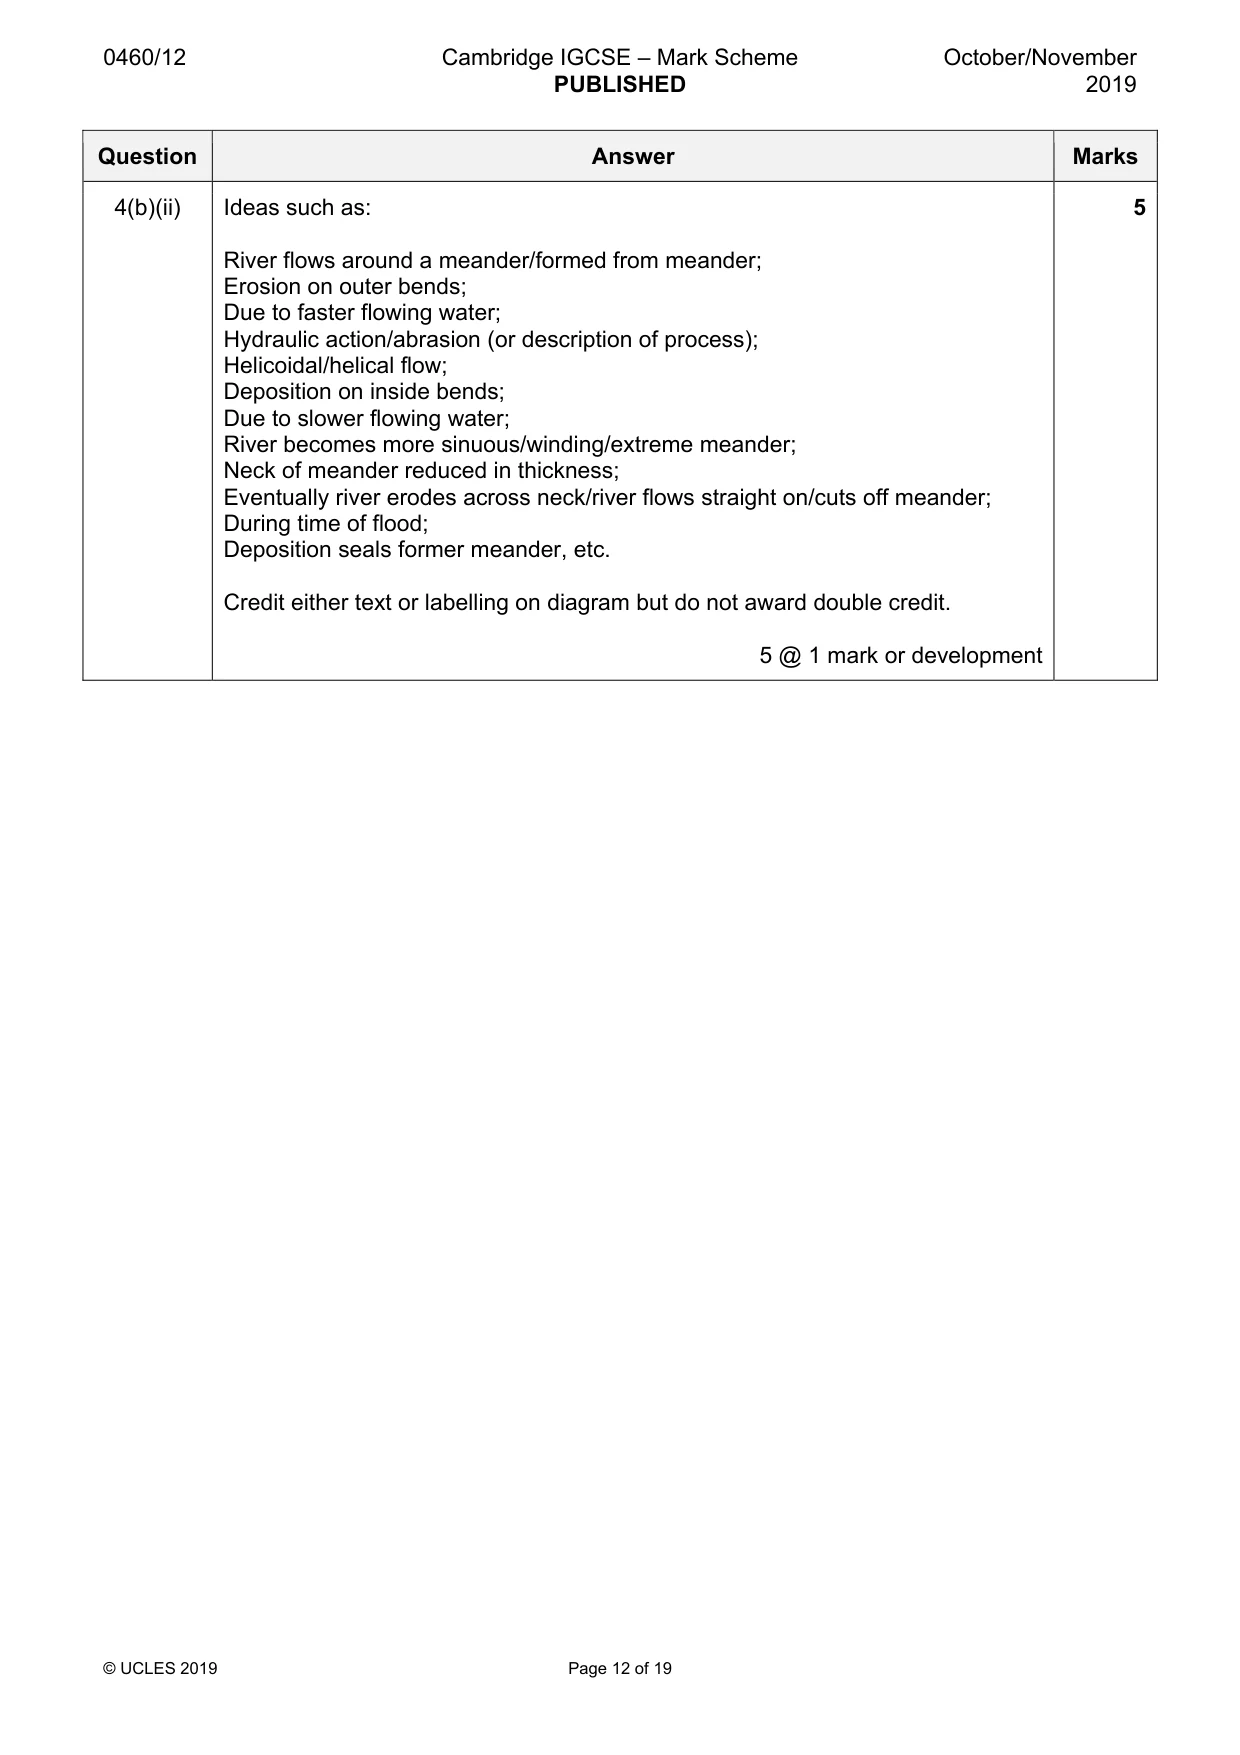
0460/12 Cambridge IGCSE – Mark Scheme PUBLISHED October/November 2019 © UCLES 2019 Page 12 of 19 Question Answer Marks 4(b)(ii) Ideas such as: River flows around a meander/formed from meander; Erosion on outer bends; Due to faster flowing water; Hydraulic action/abrasion (or description of process); Helicoidal/helical flow; Deposition on inside bends; Due to slower flowing water; River becomes more sinuous/winding/extreme meander; Neck of meander reduced in thickness; Eventually river erodes across neck/river flows straight on/cuts off meander; During time of flood; Deposition seals former meander, etc. Credit either text or labelling on diagram but do not award double credit. 5 @ 1 mark or development 5
Mark scheme, page 13
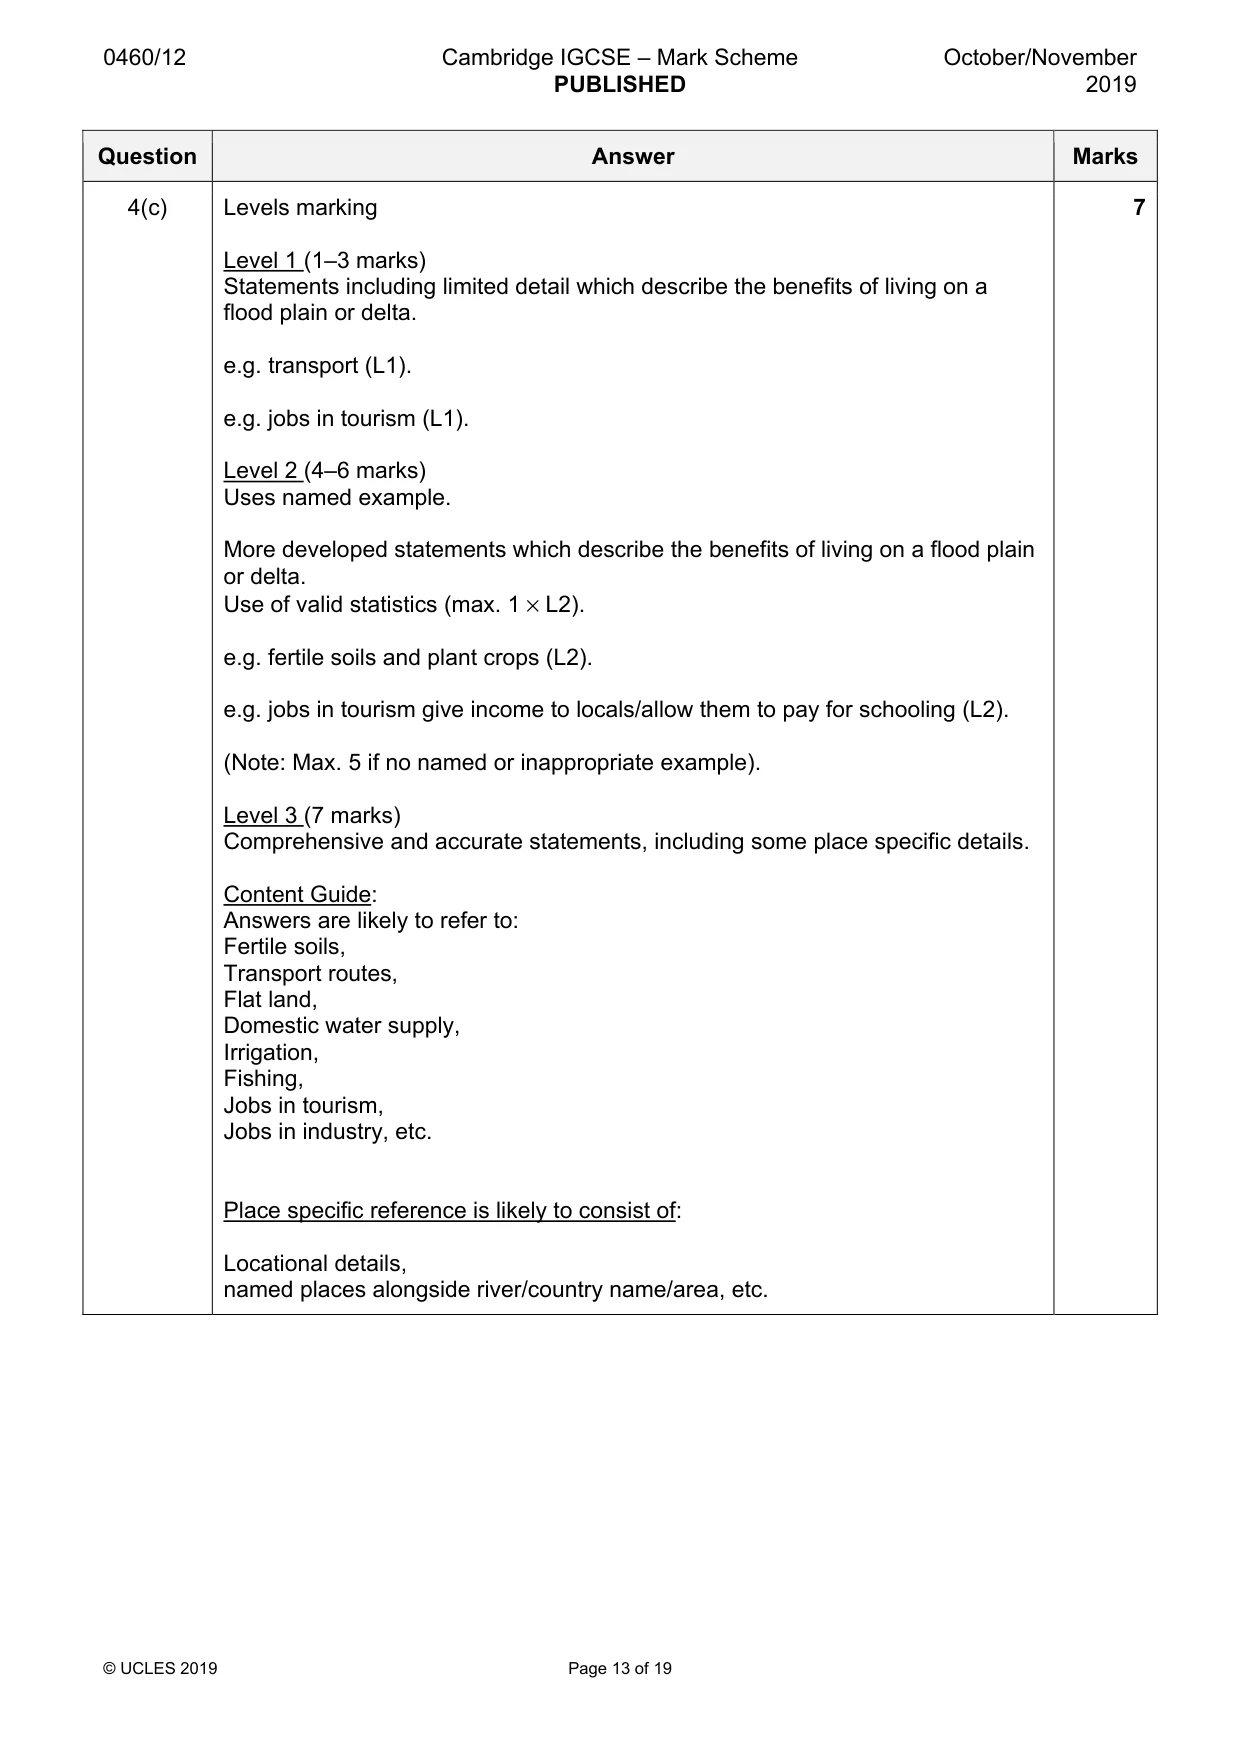
0460/12 Cambridge IGCSE – Mark Scheme PUBLISHED October/November 2019 © UCLES 2019 Page 13 of 19 Question Answer Marks 4(c) Levels marking Level 1 (1–3 marks) Statements including limited detail which describe the benefits of living on a flood plain or delta. e.g. transport (L1). e.g. jobs in tourism (L1). Level 2 (4–6 marks) Uses named example. More developed statements which describe the benefits of living on a flood plain or delta. Use of valid statistics (max. 1 × L2). e.g. fertile soils and plant crops (L2). e.g. jobs in tourism give income to locals/allow them to pay for schooling (L2). (Note: Max. 5 if no named or inappropriate example). Level 3 (7 marks) Comprehensive and accurate statements, including some place specific details. Content Guide: Answers are likely to refer to: Fertile soils, Transport routes, Flat land, Domestic water supply, Irrigation, Fishing, Jobs in tourism, Jobs in industry, etc. Place specific reference is likely to consist of: Locational details, named places alongside river/country name/area, etc. 7
Mark scheme, page 14
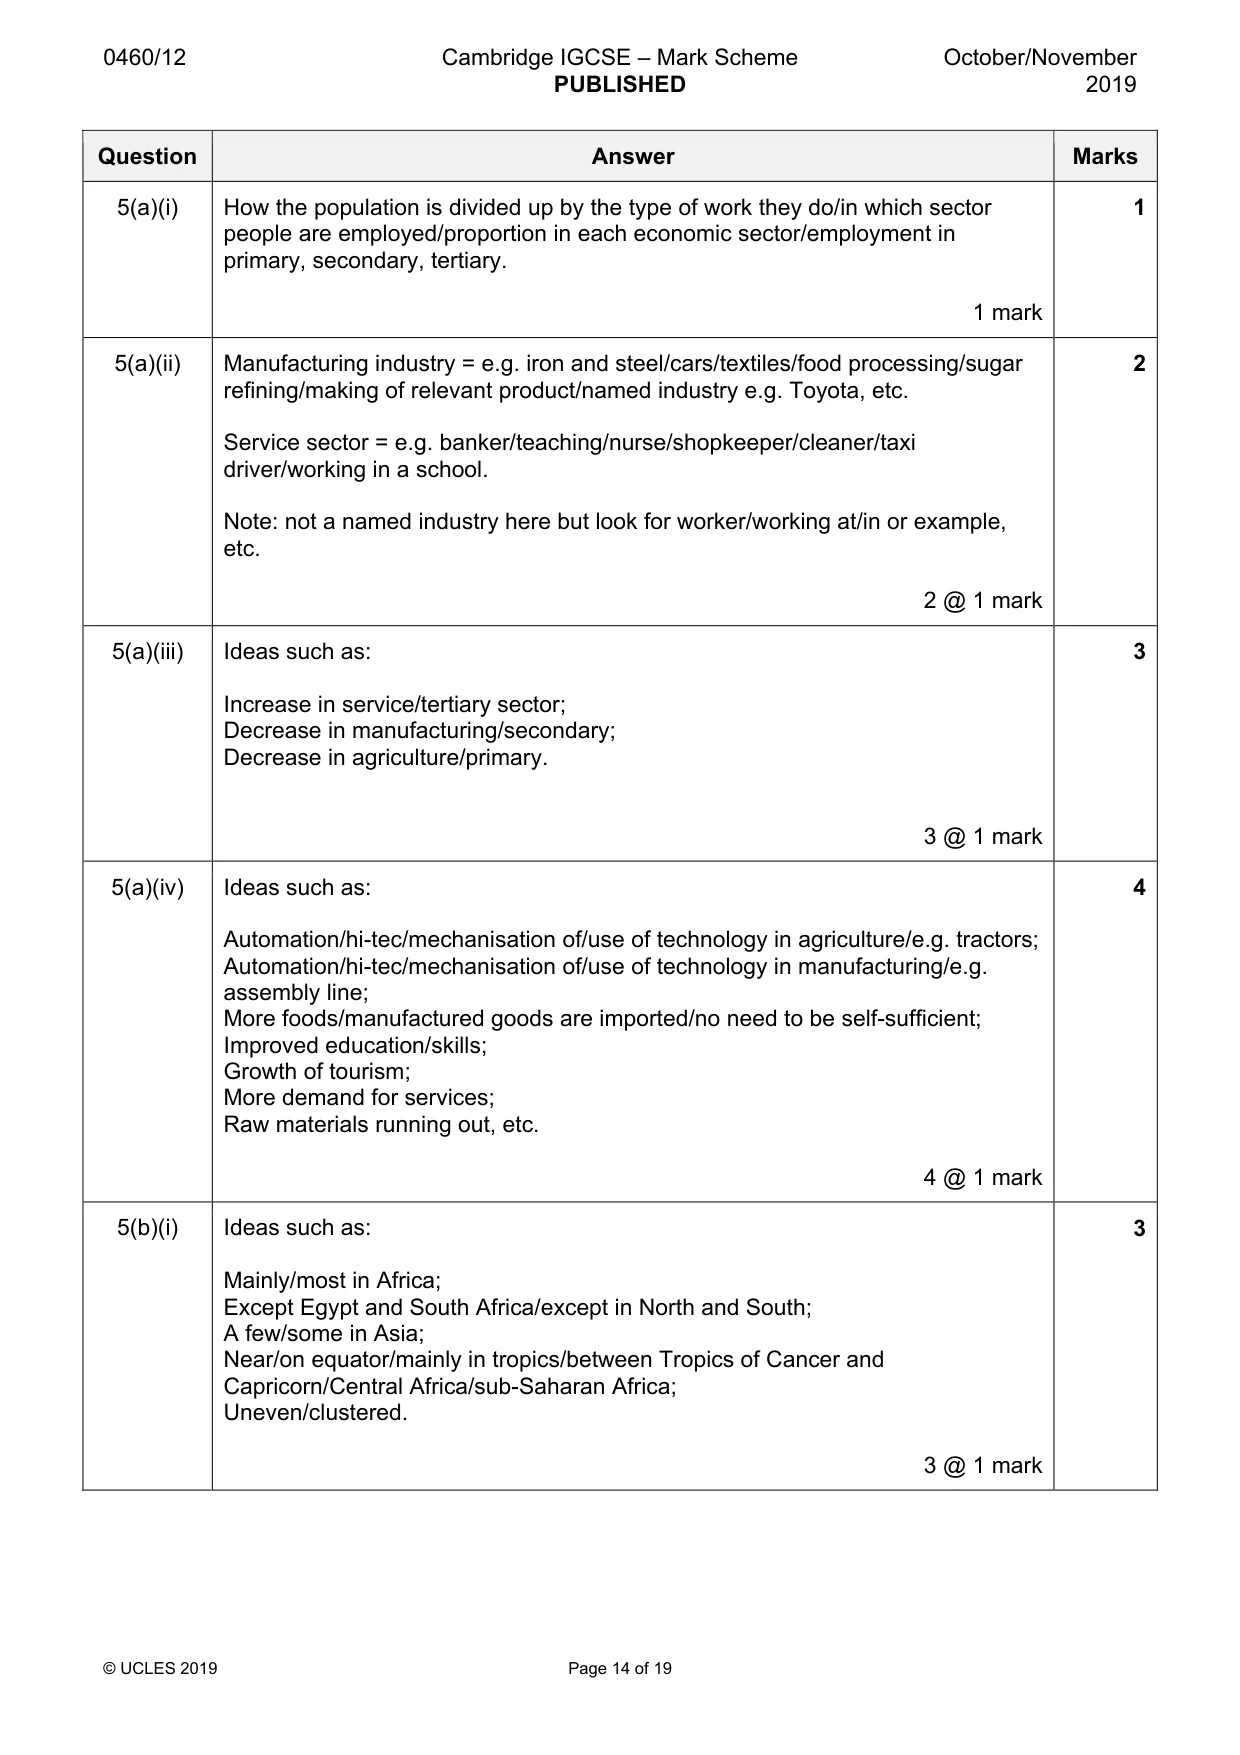
0460/12 Cambridge IGCSE – Mark Scheme PUBLISHED October/November 2019 © UCLES 2019 Page 14 of 19 Question Answer Marks 5(a)(i) How the population is divided up by the type of work they do/in which sector people are employed/proportion in each economic sector/employment in primary, secondary, tertiary. 1 mark 1 5(a)(ii) Manufacturing industry = e.g. iron and steel/cars/textiles/food processing/sugar refining/making of relevant product/named industry e.g. Toyota, etc. Service sector = e.g. banker/teaching/nurse/shopkeeper/cleaner/taxi driver/working in a school. Note: not a named industry here but look for worker/working at/in or example, etc. 2 @ 1 mark 2 5(a)(iii) Ideas such as: Increase in service/tertiary sector; Decrease in manufacturing/secondary; Decrease in agriculture/primary. 3 @ 1 mark 3 5(a)(iv) Ideas such as: Automation/hi-tec/mechanisation of/use of technology in agriculture/e.g. tractors; Automation/hi-tec/mechanisation of/use of technology in manufacturing/e.g. assembly line; More foods/manufactured goods are imported/no need to be self-sufficient; Improved education/skills; Growth of tourism; More demand for services; Raw materials running out, etc. 4 @ 1 mark 4 5(b)(i) Ideas such as: Mainly/most in Africa; Except Egypt and South Africa/except in North and South; A few/some in Asia; Near/on equator/mainly in tropics/between Tropics of Cancer and Capricorn/Central Africa/sub-Saharan Africa; Uneven/clustered. 3 @ 1 mark 3
Mark scheme, page 15
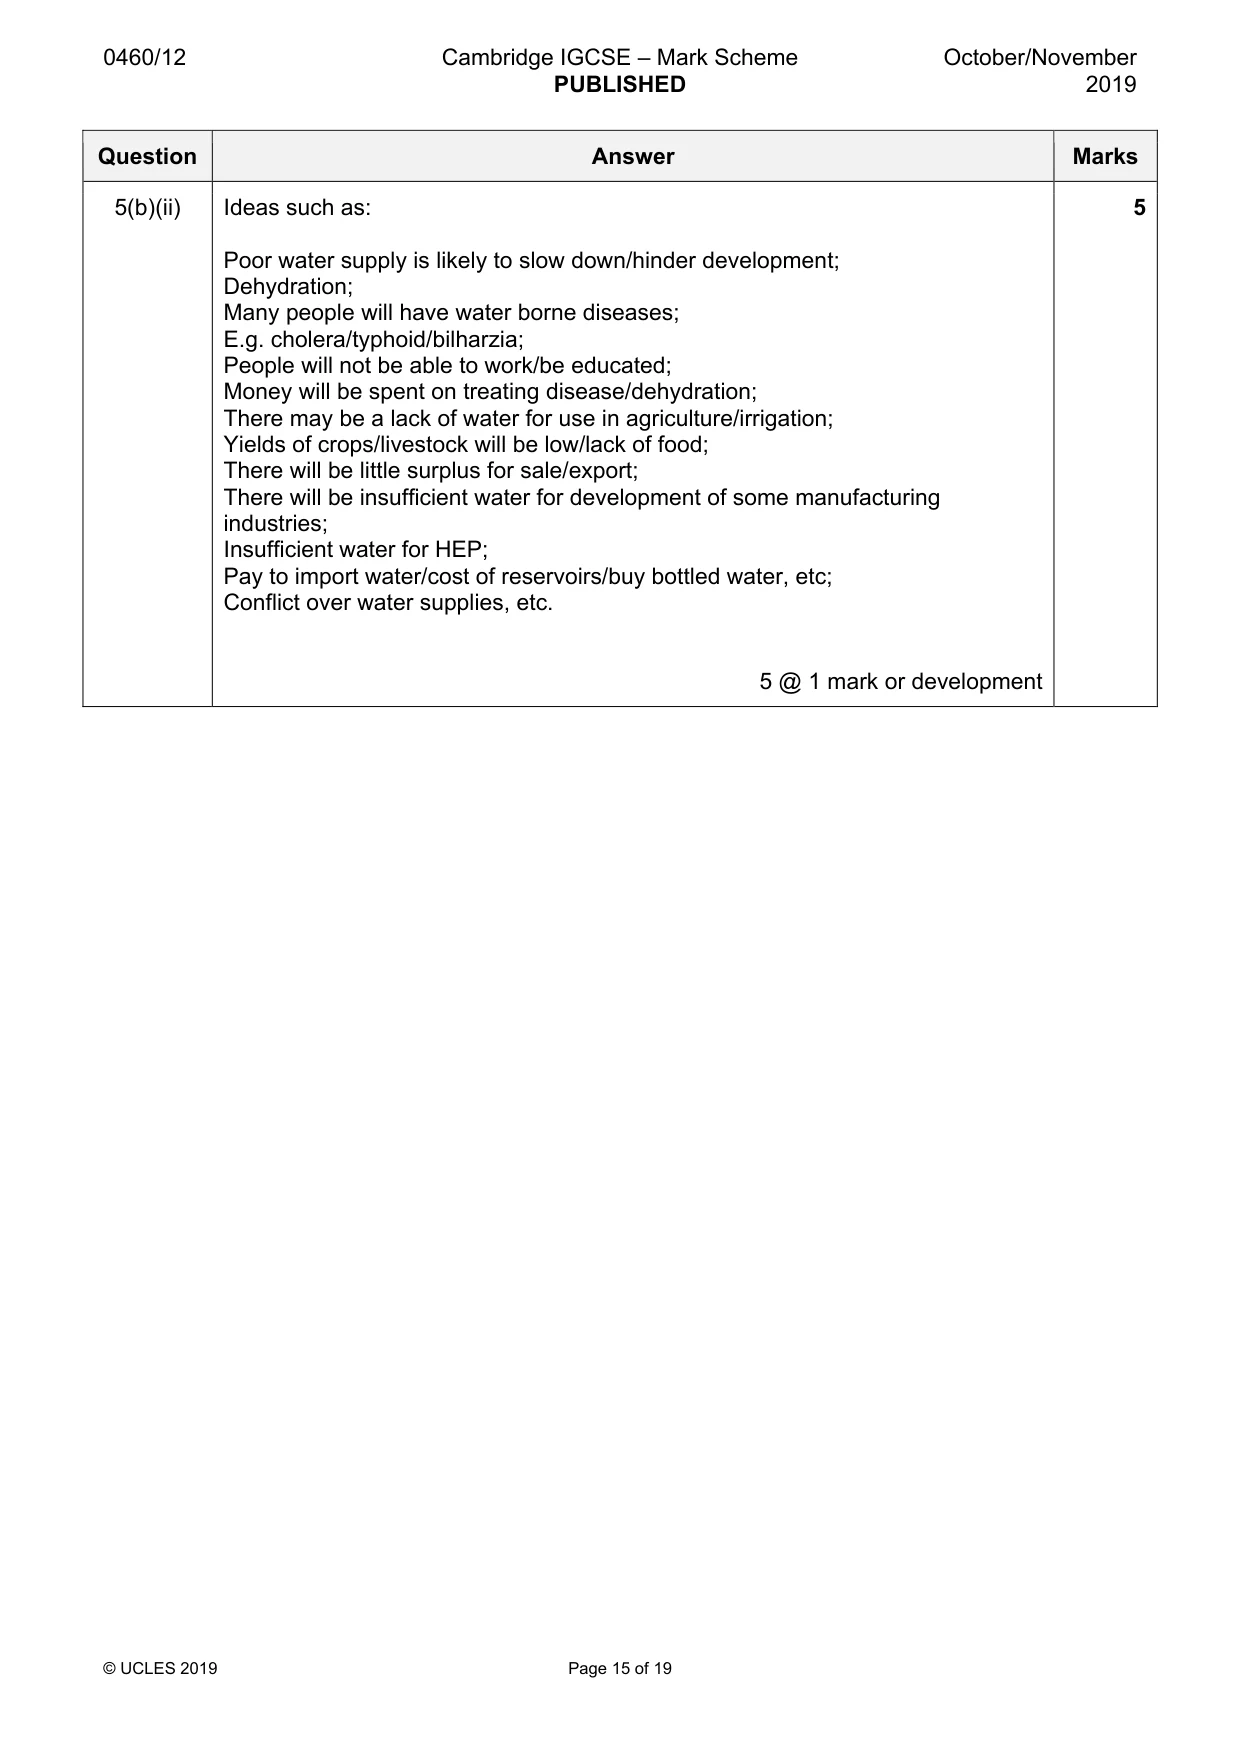
0460/12 Cambridge IGCSE – Mark Scheme PUBLISHED October/November 2019 © UCLES 2019 Page 15 of 19 Question Answer Marks 5(b)(ii) Ideas such as: Poor water supply is likely to slow down/hinder development; Dehydration; Many people will have water borne diseases; E.g. cholera/typhoid/bilharzia; People will not be able to work/be educated; Money will be spent on treating disease/dehydration; There may be a lack of water for use in agriculture/irrigation; Yields of crops/livestock will be low/lack of food; There will be little surplus for sale/export; There will be insufficient water for development of some manufacturing industries; Insufficient water for HEP; Pay to import water/cost of reservoirs/buy bottled water, etc; Conflict over water supplies, etc. 5 @ 1 mark or development 5
Mark scheme, page 16
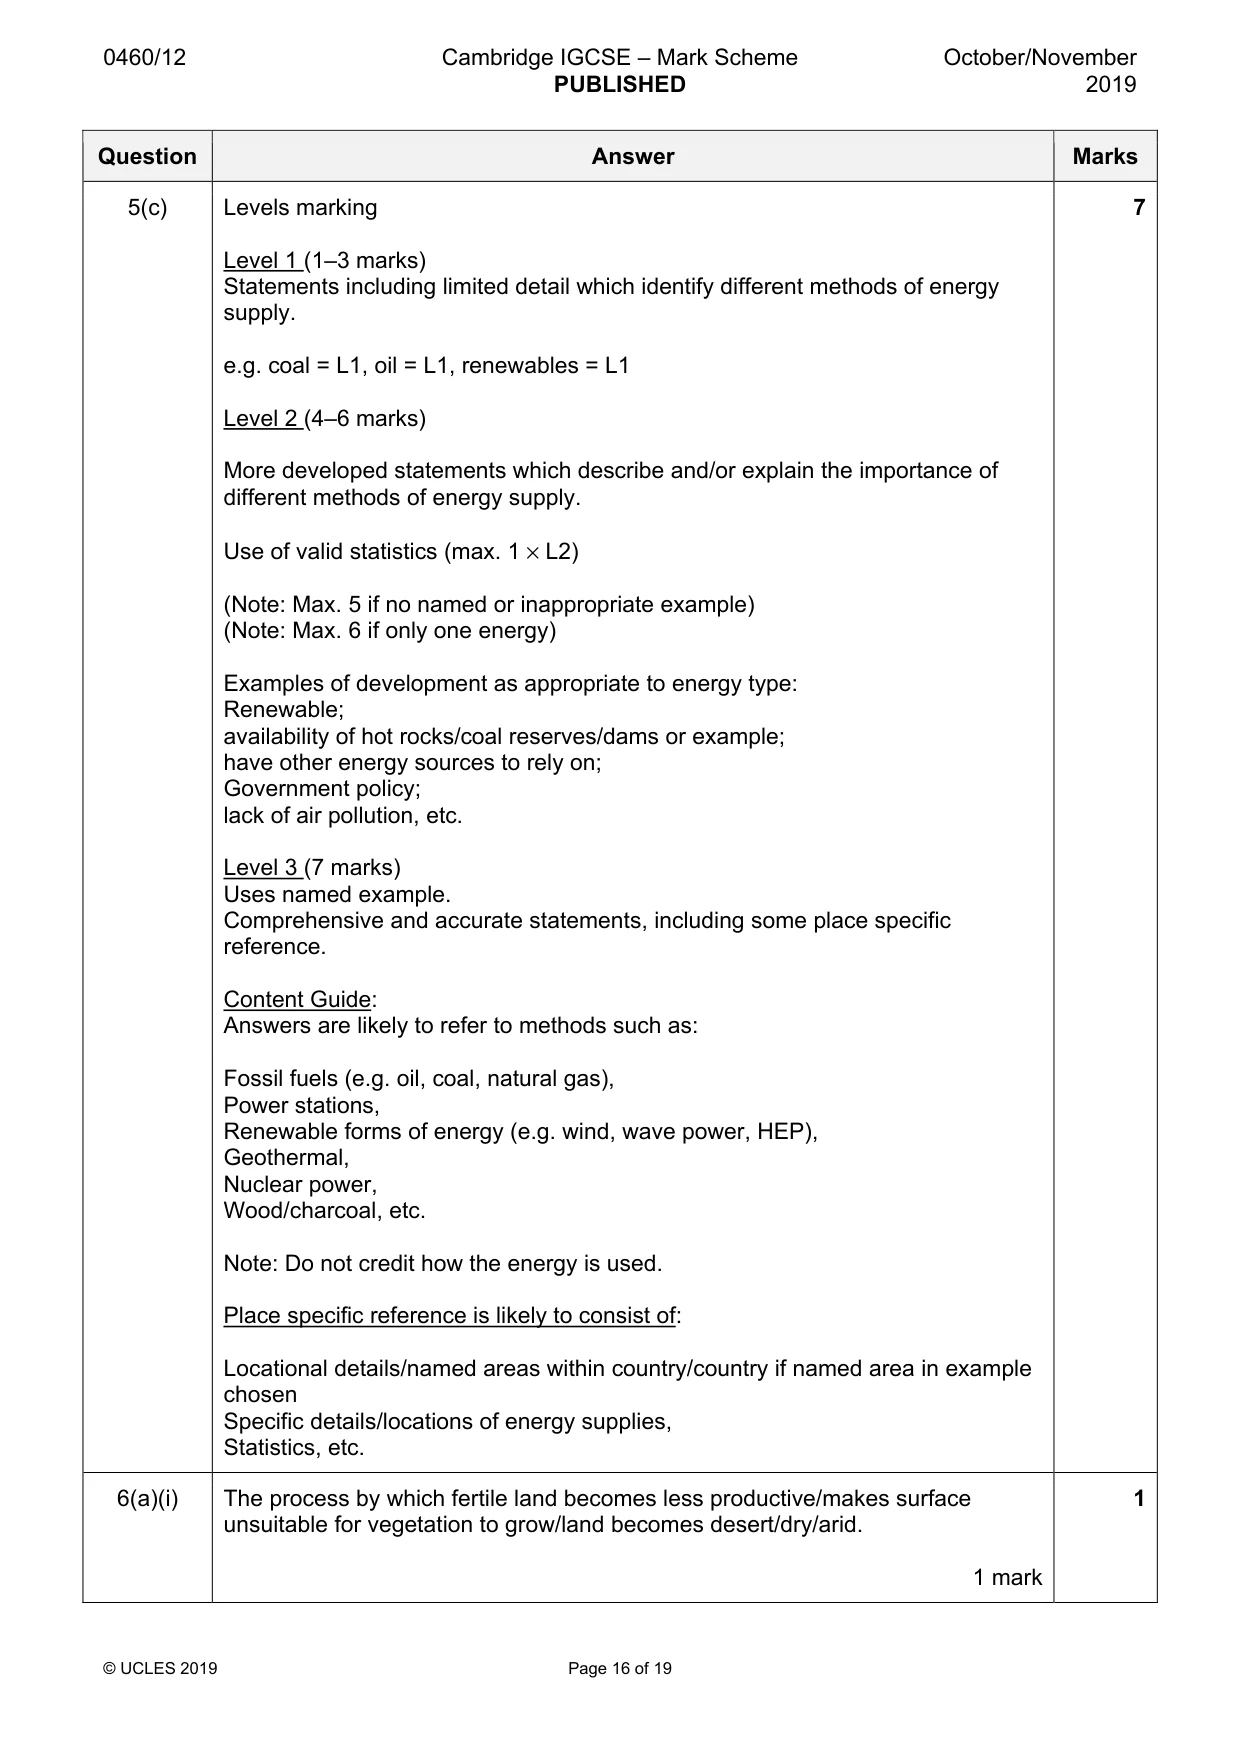
0460/12 Cambridge IGCSE – Mark Scheme PUBLISHED October/November 2019 © UCLES 2019 Page 16 of 19 Question Answer Marks 5(c) Levels marking Level 1 (1–3 marks) Statements including limited detail which identify different methods of energy supply. e.g. coal = L1, oil = L1, renewables = L1 Level 2 (4–6 marks) More developed statements which describe and/or explain the importance of different methods of energy supply. Use of valid statistics (max. 1 × L2) (Note: Max. 5 if no named or inappropriate example) (Note: Max. 6 if only one energy) Examples of development as appropriate to energy type: Renewable; availability of hot rocks/coal reserves/dams or example; have other energy sources to rely on; Government policy; lack of air pollution, etc. Level 3 (7 marks) Uses named example. Comprehensive and accurate statements, including some place specific reference. Content Guide: Answers are likely to refer to methods such as: Fossil fuels (e.g. oil, coal, natural gas), Power stations, Renewable forms of energy (e.g. wind, wave power, HEP), Geothermal, Nuclear power, Wood/charcoal, etc. Note: Do not credit how the energy is used. Place specific reference is likely to consist of: Locational details/named areas within country/country if named area in example chosen Specific details/locations of energy supplies, Statistics, etc. 7 6(a)(i) The process by which fertile land becomes less productive/makes surface unsuitable for vegetation to grow/land becomes desert/dry/arid. 1 mark 1
Mark scheme, page 17
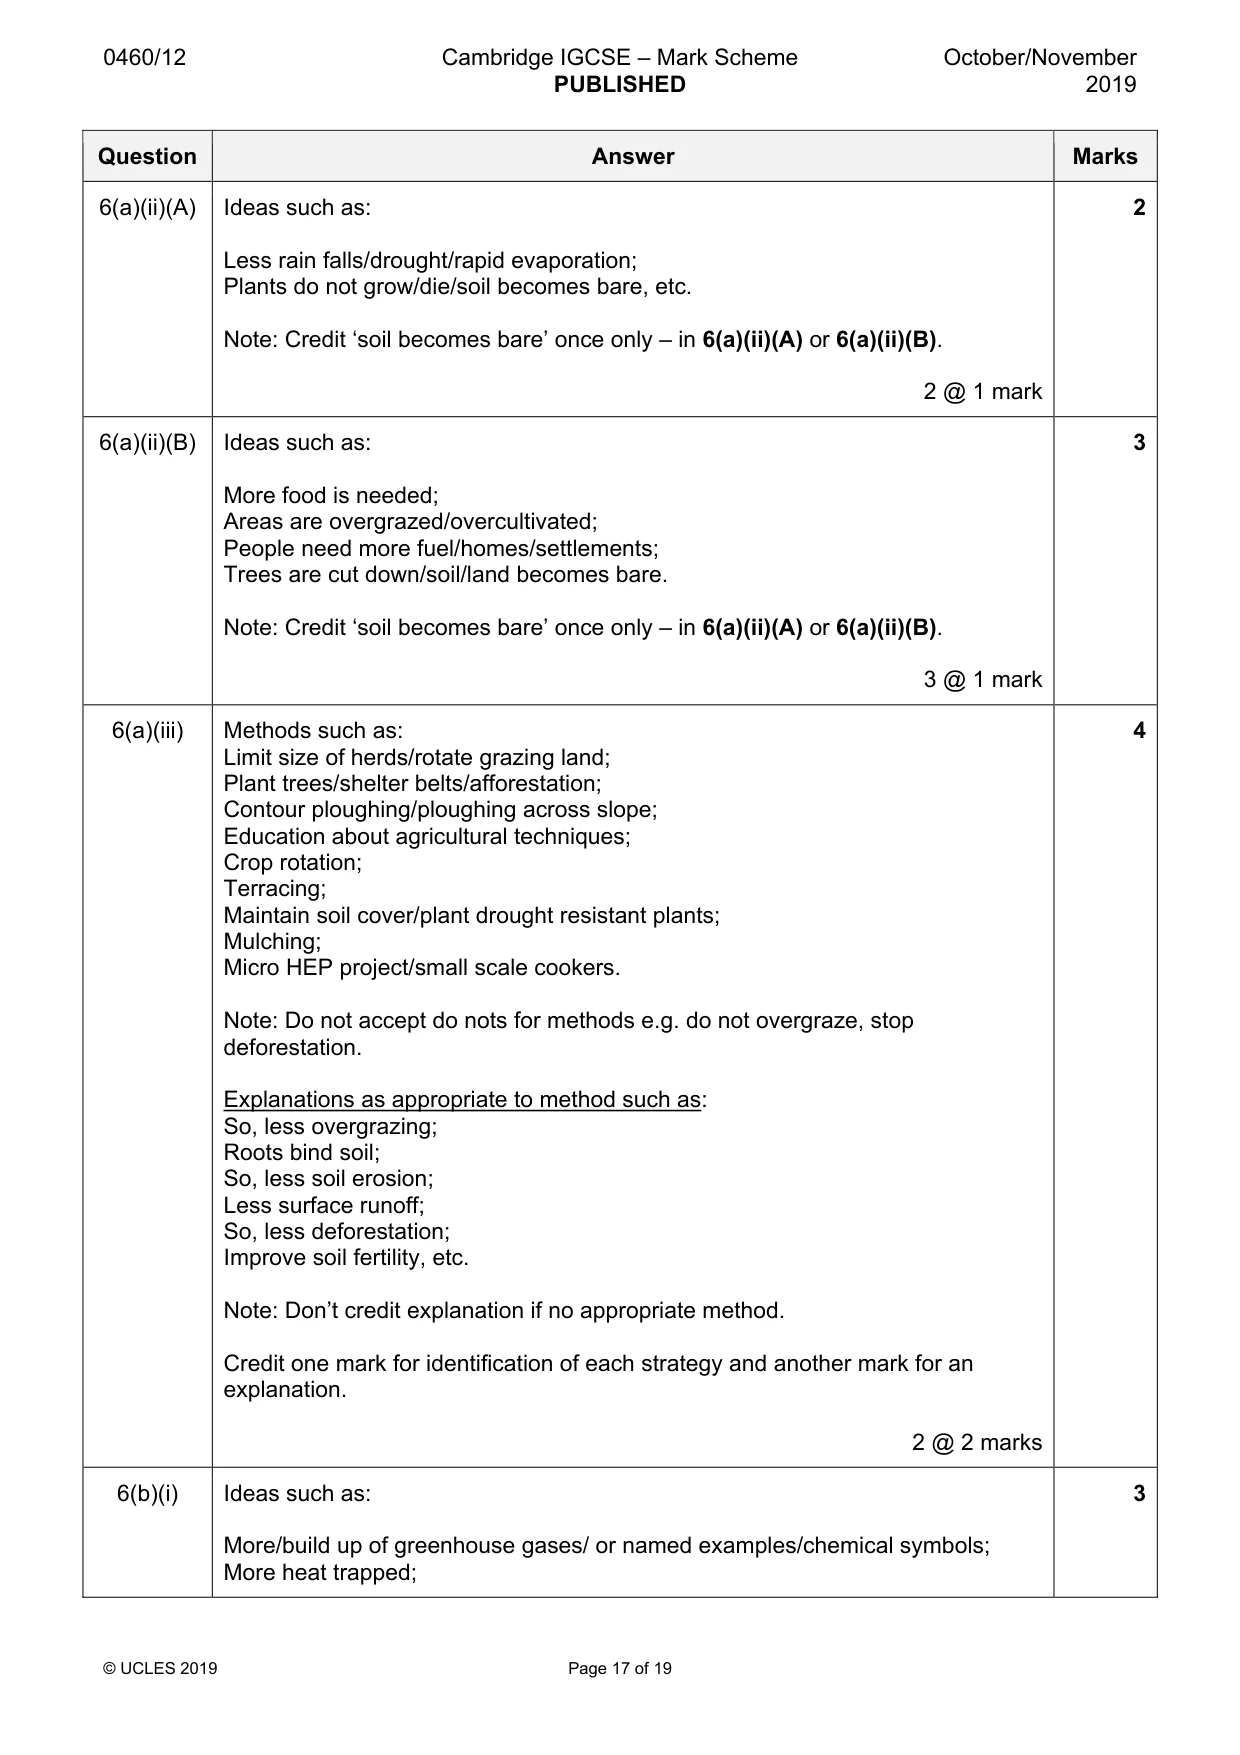
0460/12 Cambridge IGCSE – Mark Scheme PUBLISHED October/November 2019 © UCLES 2019 Page 17 of 19 Question Answer Marks 6(a)(ii)(A) Ideas such as: Less rain falls/drought/rapid evaporation; Plants do not grow/die/soil becomes bare, etc. Note: Credit ‘soil becomes bare’ once only – in 6(a)(ii)(A) or 6(a)(ii)(B). 2 @ 1 mark 2 6(a)(ii)(B) Ideas such as: More food is needed; Areas are overgrazed/overcultivated; People need more fuel/homes/settlements; Trees are cut down/soil/land becomes bare. Note: Credit ‘soil becomes bare’ once only – in 6(a)(ii)(A) or 6(a)(ii)(B). 3 @ 1 mark 3 6(a)(iii) Methods such as: Limit size of herds/rotate grazing land; Plant trees/shelter belts/afforestation; Contour ploughing/ploughing across slope; Education about agricultural techniques; Crop rotation; Terracing; Maintain soil cover/plant drought resistant plants; Mulching; Micro HEP project/small scale cookers. Note: Do not accept do nots for methods e.g. do not overgraze, stop deforestation. Explanations as appropriate to method such as: So, less overgrazing; Roots bind soil; So, less soil erosion; Less surface runoff; So, less deforestation; Improve soil fertility, etc. Note: Don’t credit explanation if no appropriate method. Credit one mark for identification of each strategy and another mark for an explanation. 2 @ 2 marks 4 6(b)(i) Ideas such as: More/build up of greenhouse gases/ or named examples/chemical symbols; More heat trapped; 3
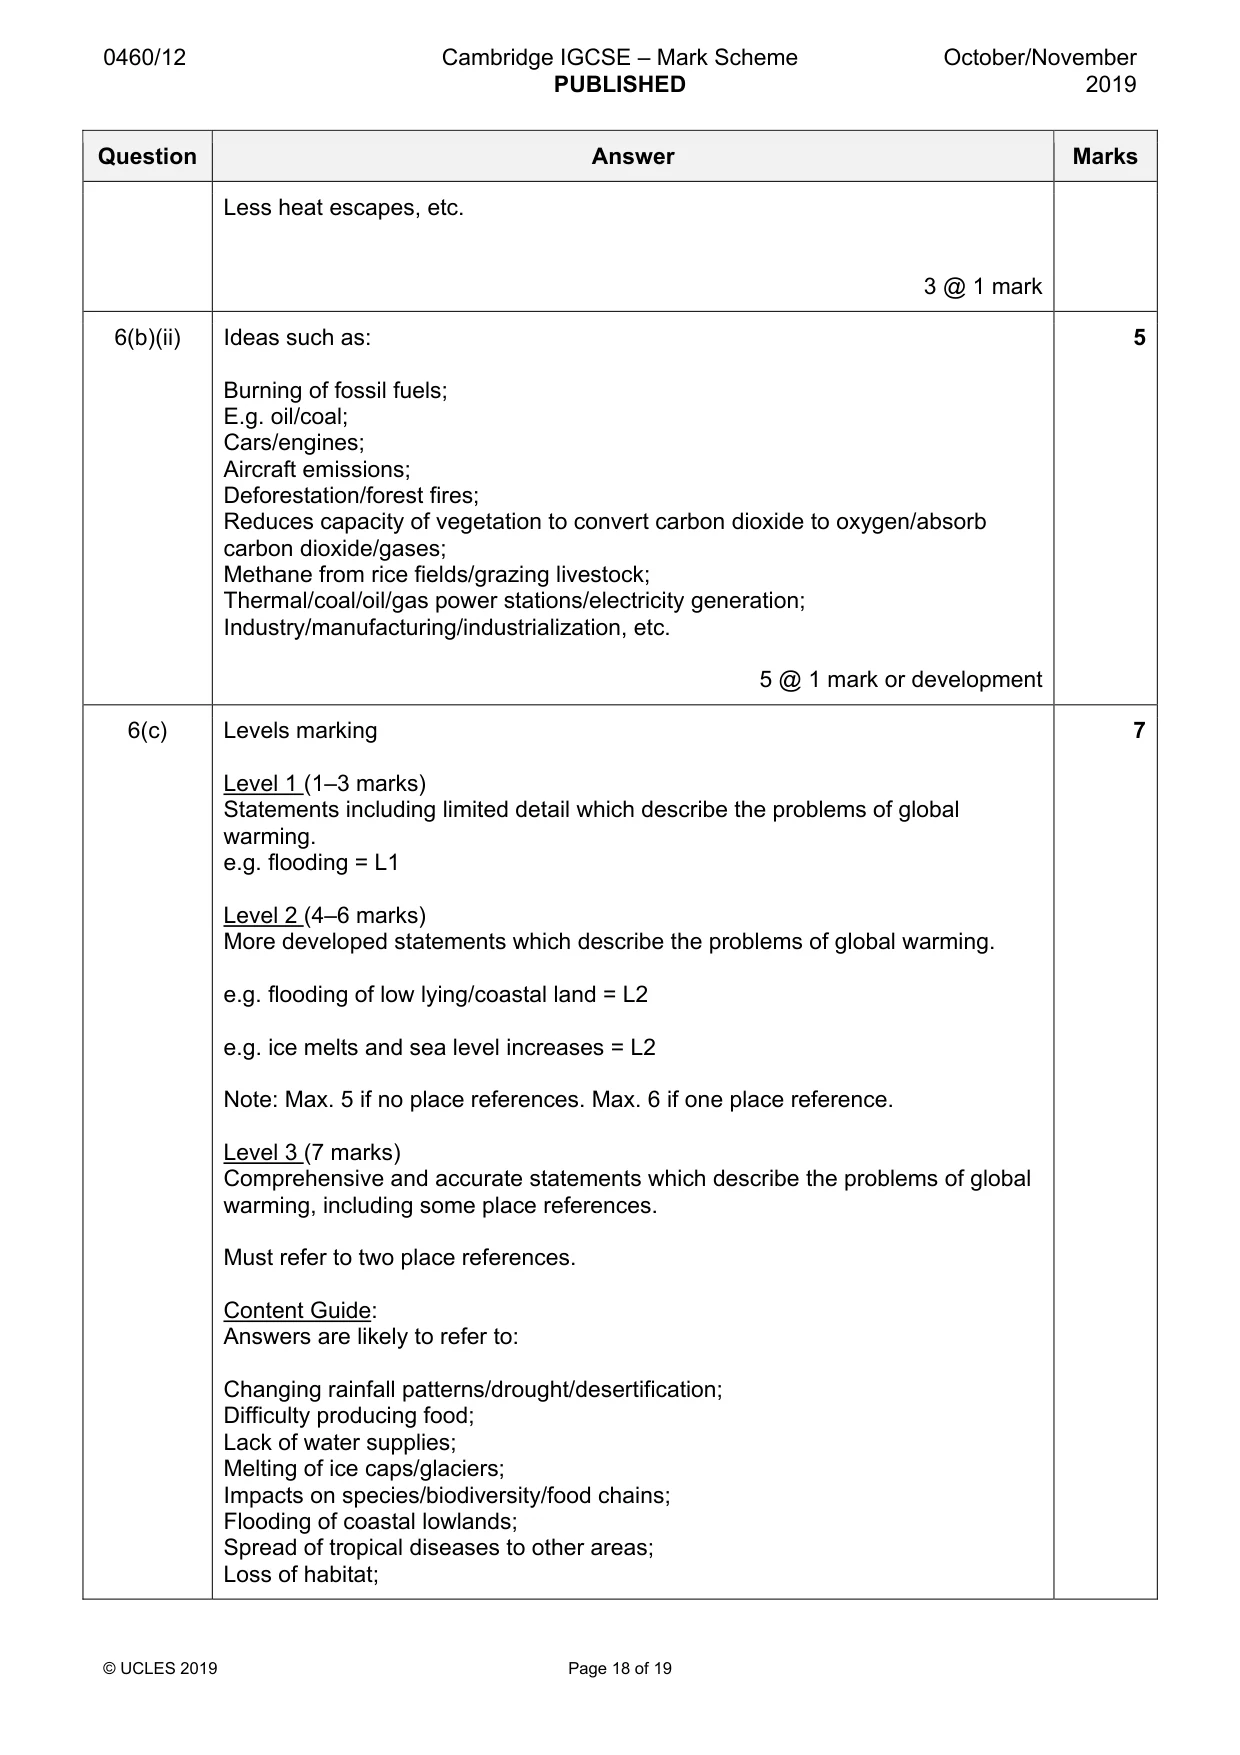
Mark scheme, page 18
0460/12 Cambridge IGCSE – Mark Scheme PUBLISHED October/November 2019 © UCLES 2019 Page 18 of 19 Question Answer Marks Less heat escapes, etc. 3 @ 1 mark 6(b)(ii) Ideas such as: Burning of fossil fuels; E.g. oil/coal; Cars/engines; Aircraft emissions; Deforestation/forest fires; Reduces capacity of vegetation to convert carbon dioxide to oxygen/absorb carbon dioxide/gases; Methane from rice fields/grazing livestock; Thermal/coal/oil/gas power stations/electricity generation; Industry/manufacturing/industrialization, etc. 5 @ 1 mark or development 5 6(c) Levels marking Level 1 (1–3 marks) Statements including limited detail which describe the problems of global warming. e.g. flooding = L1 Level 2 (4–6 marks) More developed statements which describe the problems of global warming. e.g. flooding of low lying/coastal land = L2 e.g. ice melts and sea level increases = L2 Note: Max. 5 if no place references. Max. 6 if one place reference. Level 3 (7 marks) Comprehensive and accurate statements which describe the problems of global warming, including some place references. Must refer to two place references. Content Guide: Answers are likely to refer to: Changing rainfall patterns/drought/desertification; Difficulty producing food; Lack of water supplies; Melting of ice caps/glaciers; Impacts on species/biodiversity/food chains; Flooding of coastal lowlands; Spread of tropical diseases to other areas; Loss of habitat; 7
Mark scheme, page 19
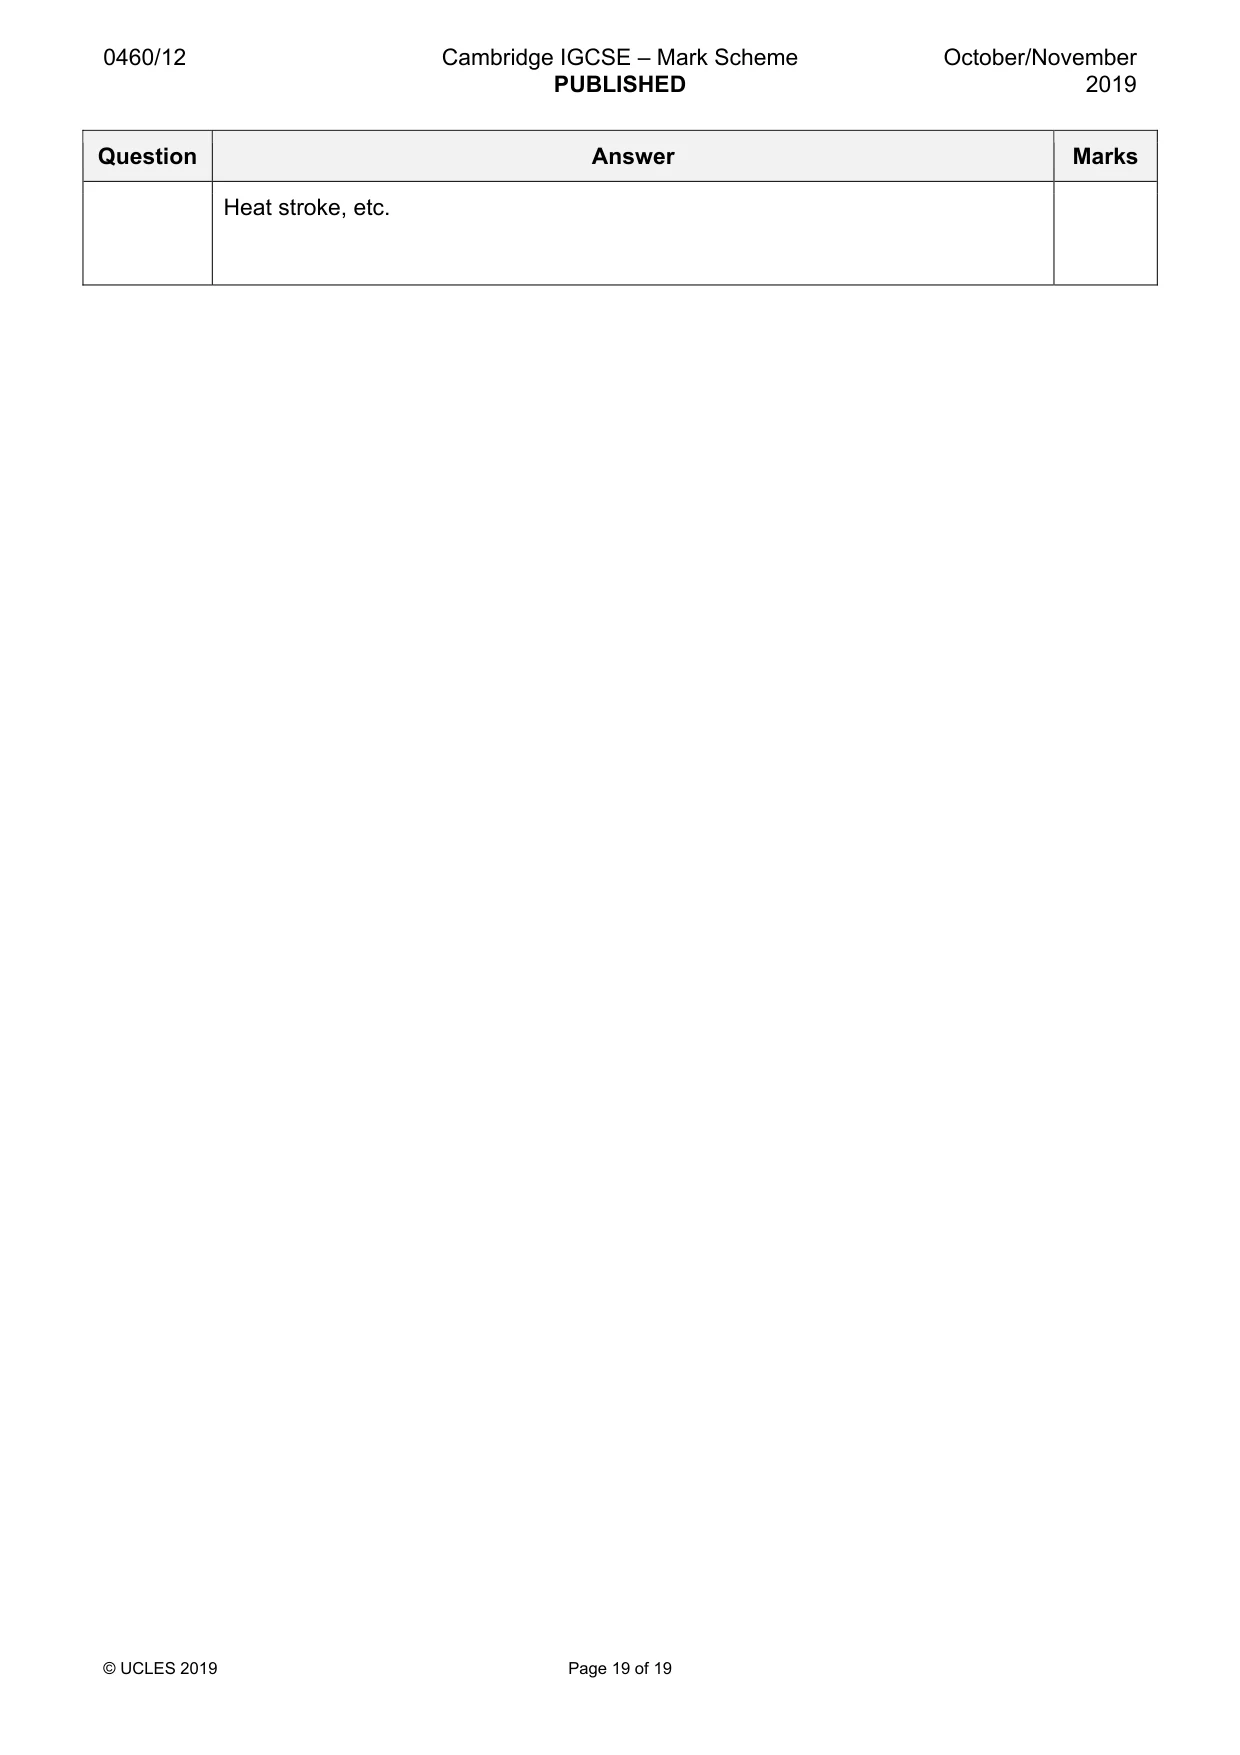
0460/12 Cambridge IGCSE – Mark Scheme PUBLISHED October/November 2019 © UCLES 2019 Page 19 of 19 Question Answer Marks Heat stroke, etc.
What you needed in this session
Cambridge’s own grade thresholds for 2019 Oct/Nov, Paper 1 · Variant 2. A higher threshold means an easier paper — the bar moves with how the cohort did.