Cambridge IGCSE Geography 0460 — 2019 Oct/Nov Paper 1 · Variant 3
0460/13/O/N/19 · 75 marks · ≈84 min
The question paper and its mark scheme, free to read here and free to download. This is Cambridge’s own paper, exactly as it was sat.
Question paper32 pages



Mark scheme17 pages
Answers below. Sit the paper first if you are practising.
Paper as text
Question paper, page 1
This document consists of 29 printed pages, 3 blank pages and 1 Insert. DC (JM/CB) 164275/5 © UCLES 2019 [Turn over * 8 6 1 0 6 7 3 1 0 9 * This syllabus is regulated for use in England, Wales and Northern Ireland as a Cambridge International Level 1/Level 2 Certificate. Cambridge Assessment International Education Cambridge International General Certificate of Secondary Education GEOGRAPHY 0460/13 Paper 1 October/November 2019 1 hour 45 minutes Candidates answer on the Question Paper. Additional Materials: Ruler Protractor Calculator READ THESE INSTRUCTIONS FIRST Write your centre number, candidate number and name in the spaces provided. Write in dark blue or black pen. You may use an HB pencil for any diagrams or graphs. Do not use staples, paper clips, glue or correction fluid. DO NOT WRITE IN ANY BARCODES. Write your answer to each question in the space provided. If additional space is required, you should use the lined pages at the end of this booklet. The question number(s) must be clearly shown. Answer three questions, one from each section. The Insert contains Fig. 4.1 for Question 4, Fig. 5.1 for Question 5, and Figs. 6.1, 6.2, 6.3 and 6.4 for Question 6. The Insert is not required by the Examiner. Sketch maps and diagrams should be drawn whenever they serve to illustrate an answer. At the end of the examination, fasten all your work securely together. The number of marks is given in brackets [ ] at the end of each question or part question. Definitions MEDCs – More Economically Developed Countries LEDCs – Less Economically Developed Countries
Question paper, page 2
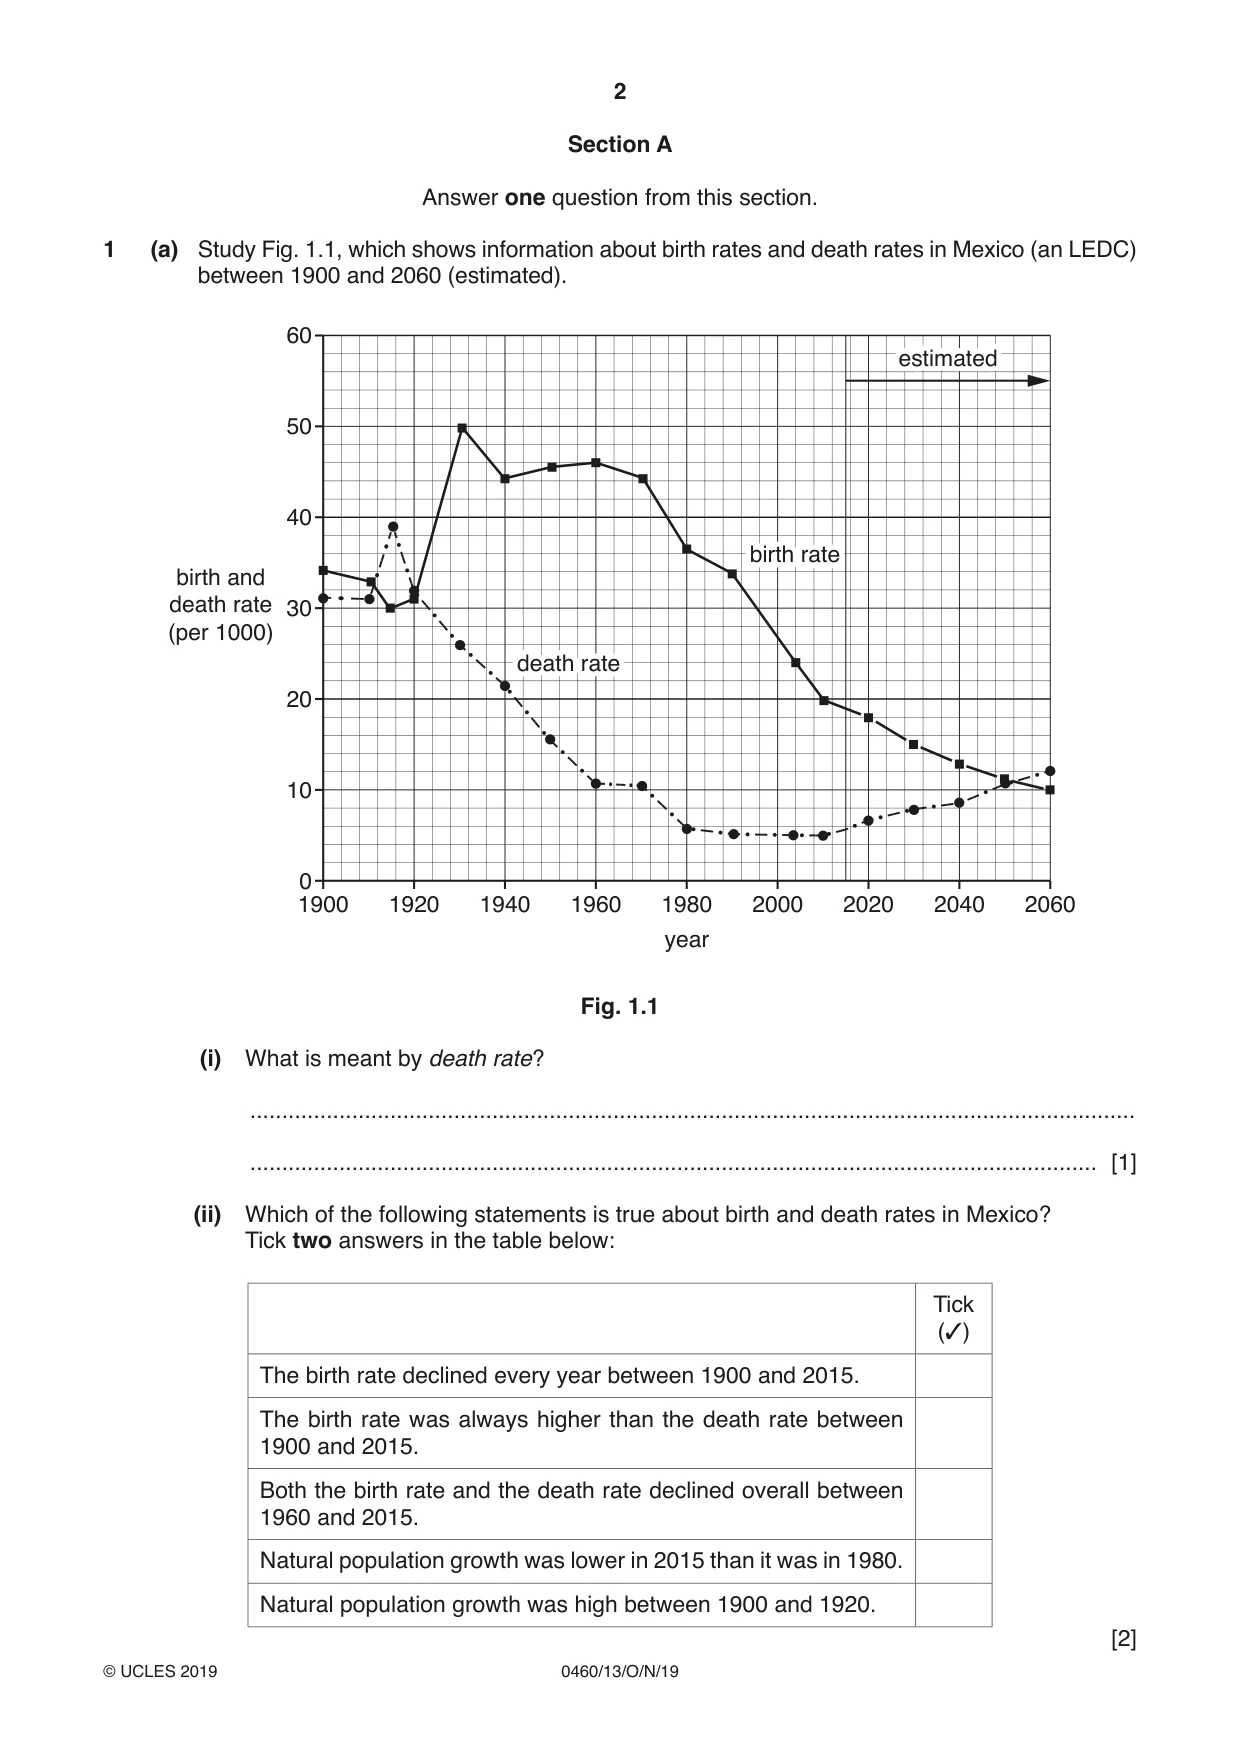
2 0460/13/O/N/19 © UCLES 2019 Section A Answer one question from this section. 1 (a) Study Fig. 1.1, which shows information about birth rates and death rates in Mexico (an LEDC) between 1900 and 2060 (estimated). birth and death rate (per 1000) 1900 1920 1940 1960 1980 year estimated death rate birth rate 2000 2020 2040 2060 0 10 20 30 40 50 60 Fig. 1.1 (i) What is meant by death rate? … … [1] (ii) Which of the following statements is true about birth and death rates in Mexico? Tick two answers in the table below: Tick (✓) The birth rate declined every year between 1900 and 2015. The birth rate was always higher than the death rate between 1900 and 2015. Both the birth rate and the death rate declined overall between 1960 and 2015. Natural population growth was lower in 2015 than it was in 1980. Natural population growth was high between 1900 and 1920. [2]
Question paper, page 3
3 0460/13/O/N/19 © UCLES 2019 [Turn over (iii) Calculate the natural population growth rate of Mexico in 2010. You should show your calculations. … [3] (iv) Suggest reasons to explain why the natural population growth rate in Mexico is likely to decrease between 2015 and 2050. … … … … … … … … [4]
Question paper, page 4
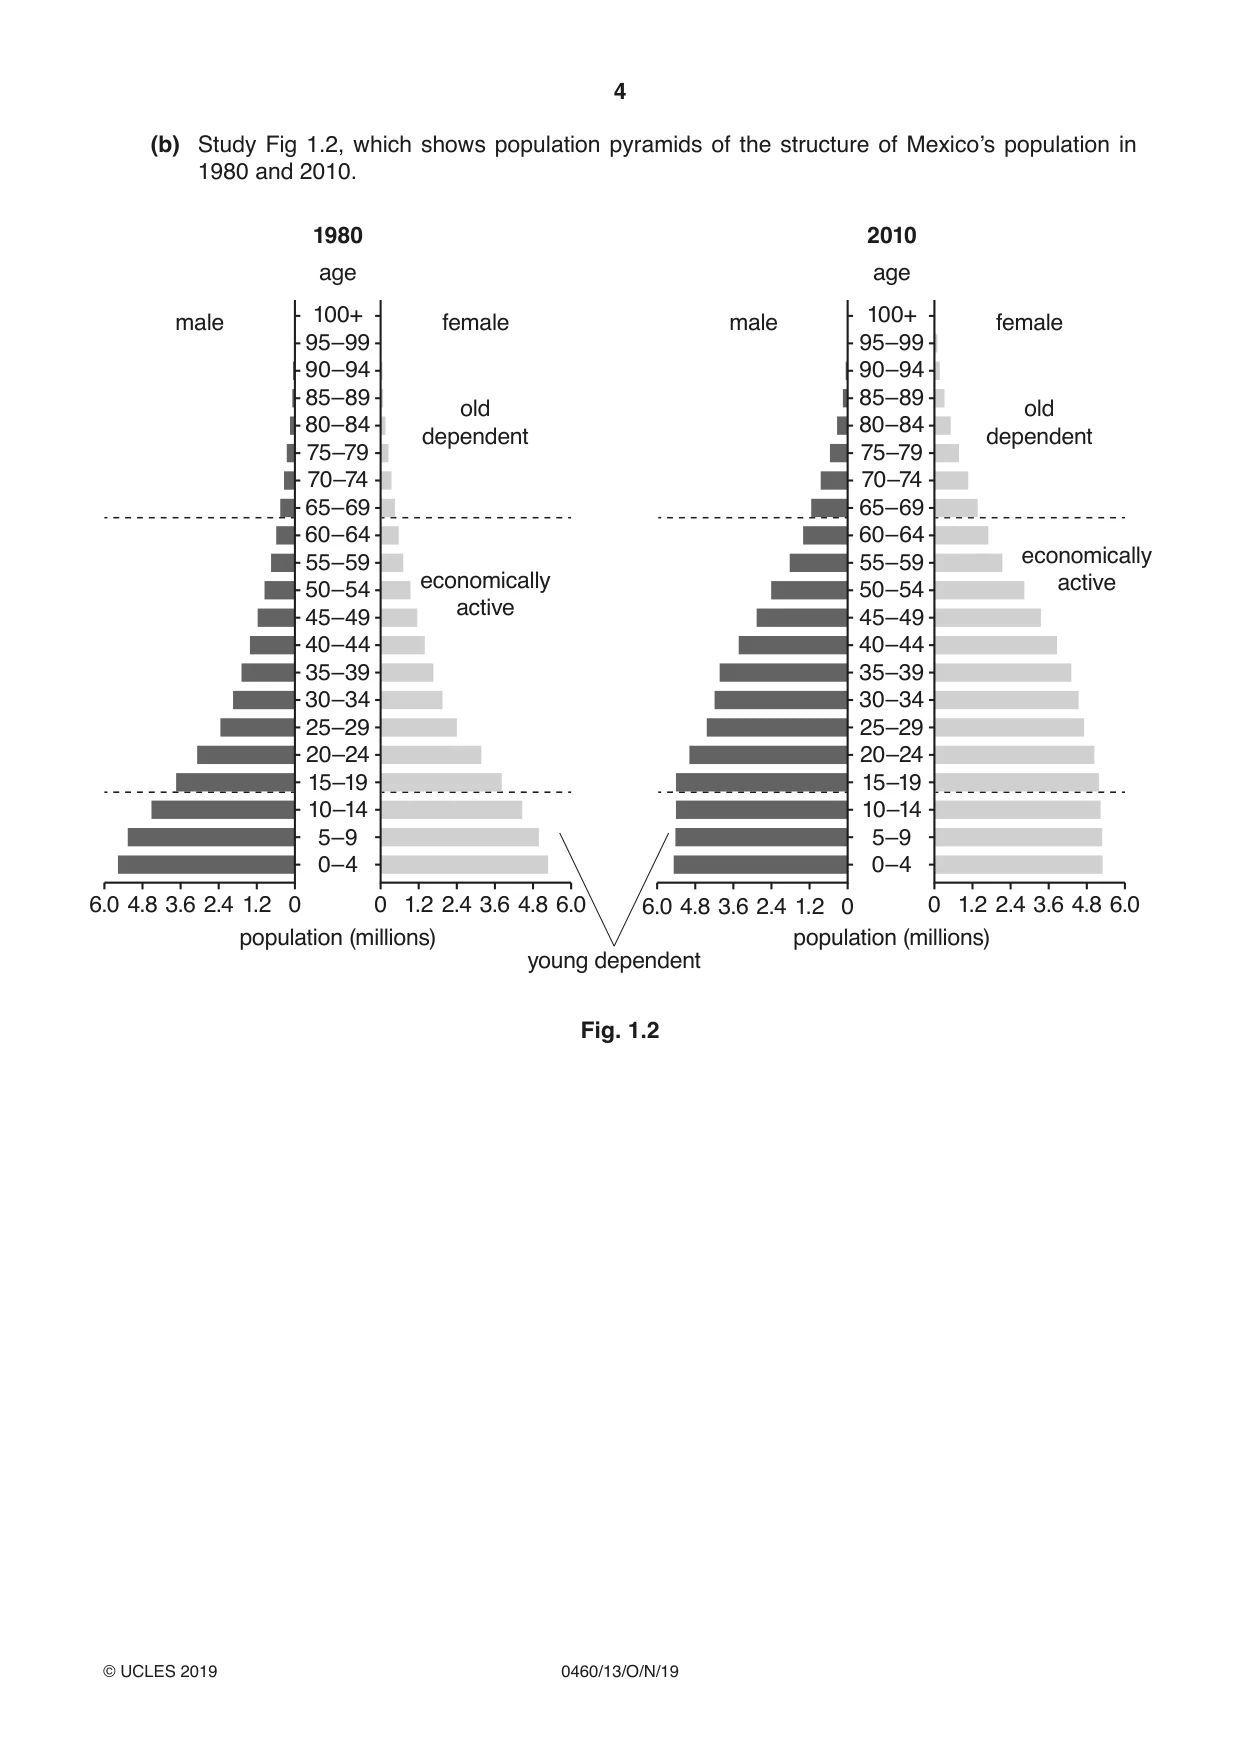
4 0460/13/O/N/19 © UCLES 2019 (b) Study Fig 1.2, which shows population pyramids of the structure of Mexico’s population in 1980 and 2010. 0 0 age 100+ 95–99 90–94 85–89 80–84 75–79 70–74 65–69 60–64 55–59 50–54 45–49 40–44 35–39 30–34 25–29 20–24 15–19 10–14 5–9 0–4 population (millions) population (millions) age 100+ 95–99 90–94 85–89 80–84 75–79 70–74 65–69 60–64 55–59 50–54 45–49 40–44 35–39 30–34 25–29 20–24 15–19 10–14 5–9 0–4 1980 male female old dependent young dependent economically active old dependent economically active male female 2010 1.2 1.2 2.4 2.4 3.6 3.6 4.8 4.8 6.0 6.0 0 1.2 2.4 3.6 4.8 6.0 0 1.2 2.4 3.6 4.8 6.0 Fig. 1.2
Question paper, page 5
5 0460/13/O/N/19 © UCLES 2019 [Turn over (i) Describe the changes in Mexico’s population structure between 1980 and 2010. … … … … … … [3] (ii) Suggest ways in which a large young dependent population is likely to cause problems for a country. … … … … … … … … … … [5]
Question paper, page 6
6 0460/13/O/N/19 © UCLES 2019 (c) For a named country you have studied, describe a policy which is used to influence natural population growth rates. Name of country … … … … … … … … … … … … … … … … … … … … … … … … … [7] [Total: 25]
Question paper, page 7
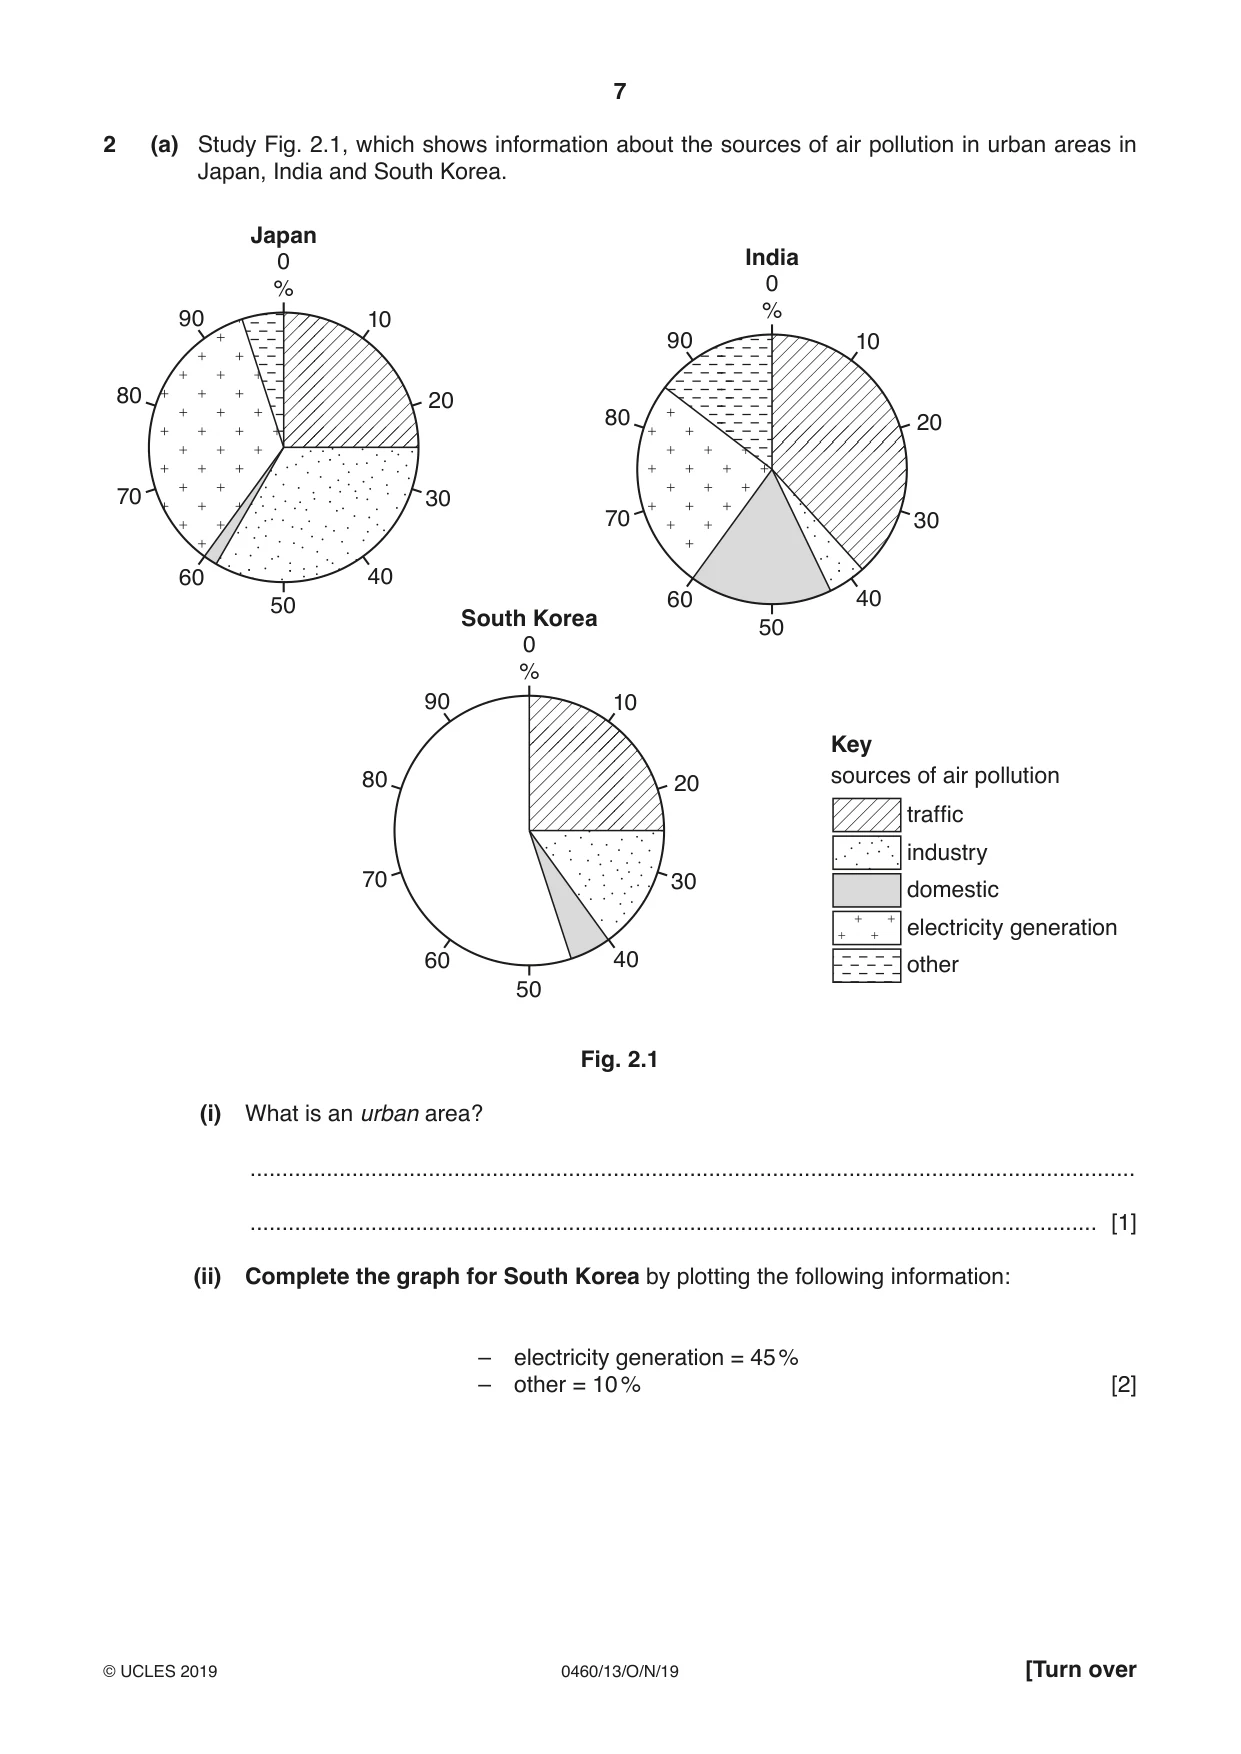
7 0460/13/O/N/19 © UCLES 2019 [Turn over 2 (a) Study Fig. 2.1, which shows information about the sources of air pollution in urban areas in Japan, India and South Korea. 0 % 10 20 30 40 50 60 70 80 90 Japan 0 % 10 20 30 40 50 60 70 80 90 India 0 % 10 20 30 40 50 60 70 80 90 South Korea Key sources of air pollution traffic industry domestic electricity generation other Fig. 2.1 (i) What is an urban area? … … [1] (ii) Complete the graph for South Korea by plotting the following information: – electricity generation = 45 % – other = 10 % [2]
Question paper, page 8
8 0460/13/O/N/19 © UCLES 2019 (iii) Identify the main differences between the sources of air pollution in India and Japan. … … … … … … [3] (iv) Explain how air pollution causes problems for people who live in urban areas. … … … … … … … … [4]
Question paper, page 9
9 0460/13/O/N/19 © UCLES 2019 [Turn over (b) Study Fig. 2.2, which is information about traffic congestion in Gauteng, a province in South Africa. According to Ismail Vadi, a member of the Executive Council for Roads and Transport in Gauteng, traffic congestion is likely to increase in the next 25 years. The number of vehicles is expected to double and cause average speed in urban areas during peak hours to drop from the current 48 km/h to 10 km/h. He recently released the Integrated Transport Master Plan (ITMP25), which shows that the province’s population will increase from 12.4 million to 18.7 million and its working population will grow to 8.6 million, increasing rush hour passenger journeys to 25 million a day. ITMP25 plans to prioritise the use of public transport, particularly the rail network, which has lacked investment in the last 20 years. If nothing is done there will be a severe impact on the built and natural environment and the quality of lives of residents will deteriorate. Fig. 2.2 (i) Using Fig. 2.2 only, give three reasons why urban areas in Gauteng will experience increased traffic congestion. 1 … … 2 … … 3 … … [3]
Question paper, page 10
10 0460/13/O/N/19 © UCLES 2019 (ii) Using Fig. 2.2 and your own knowledge, suggest how traffic problems could be reduced in urban areas in Gauteng. … … … … … … … … … … [5]
Question paper, page 11
11 0460/13/O/N/19 © UCLES 2019 [Turn over (c) For a named urban area you have studied, describe a change in land use and explain why it has caused conflict. Name of urban area … … … … … … … … … … … … … … … … … … … … … … … … … [7] [Total: 25]
Question paper, page 12
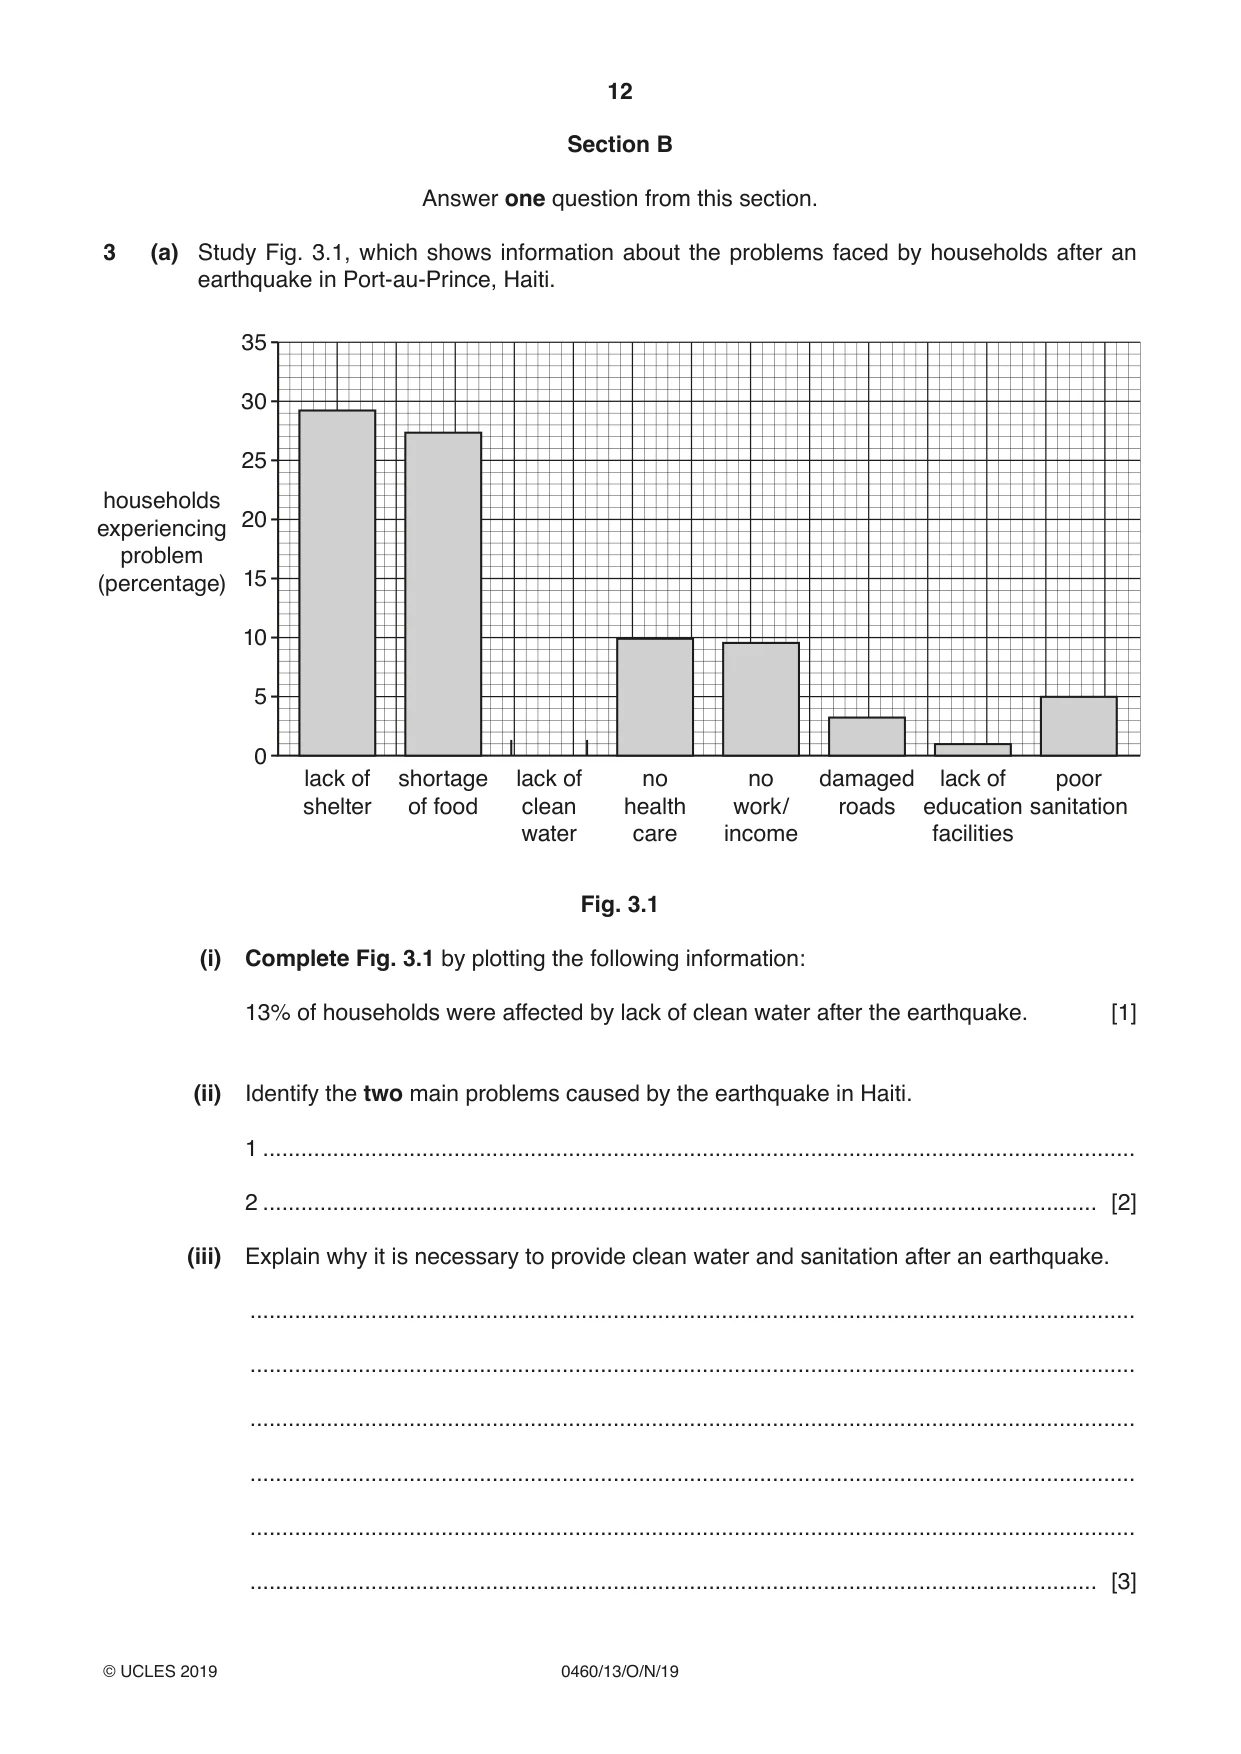
12 0460/13/O/N/19 © UCLES 2019 Section B Answer one question from this section. 3 (a) Study Fig. 3.1, which shows information about the problems faced by households after an earthquake in Port-au-Prince, Haiti. lack of shelter 0 5 10 15 20 25 30 35 shortage of food lack of clean water no health care no work/ income households experiencing problem (percentage) damaged roads lack of education facilities poor sanitation Fig. 3.1 (i) Complete Fig. 3.1 by plotting the following information: 13% of households were affected by lack of clean water after the earthquake. [1] (ii) Identify the two main problems caused by the earthquake in Haiti. 1 … 2 … [2] (iii) Explain why it is necessary to provide clean water and sanitation after an earthquake. … … … … … … [3]
Question paper, page 13
13 0460/13/O/N/19 © UCLES 2019 [Turn over (iv) Explain how new buildings can be earthquake-proofed, so that they are less likely to be damaged in an earthquake. … … … … … … … … [4]
Question paper, page 14
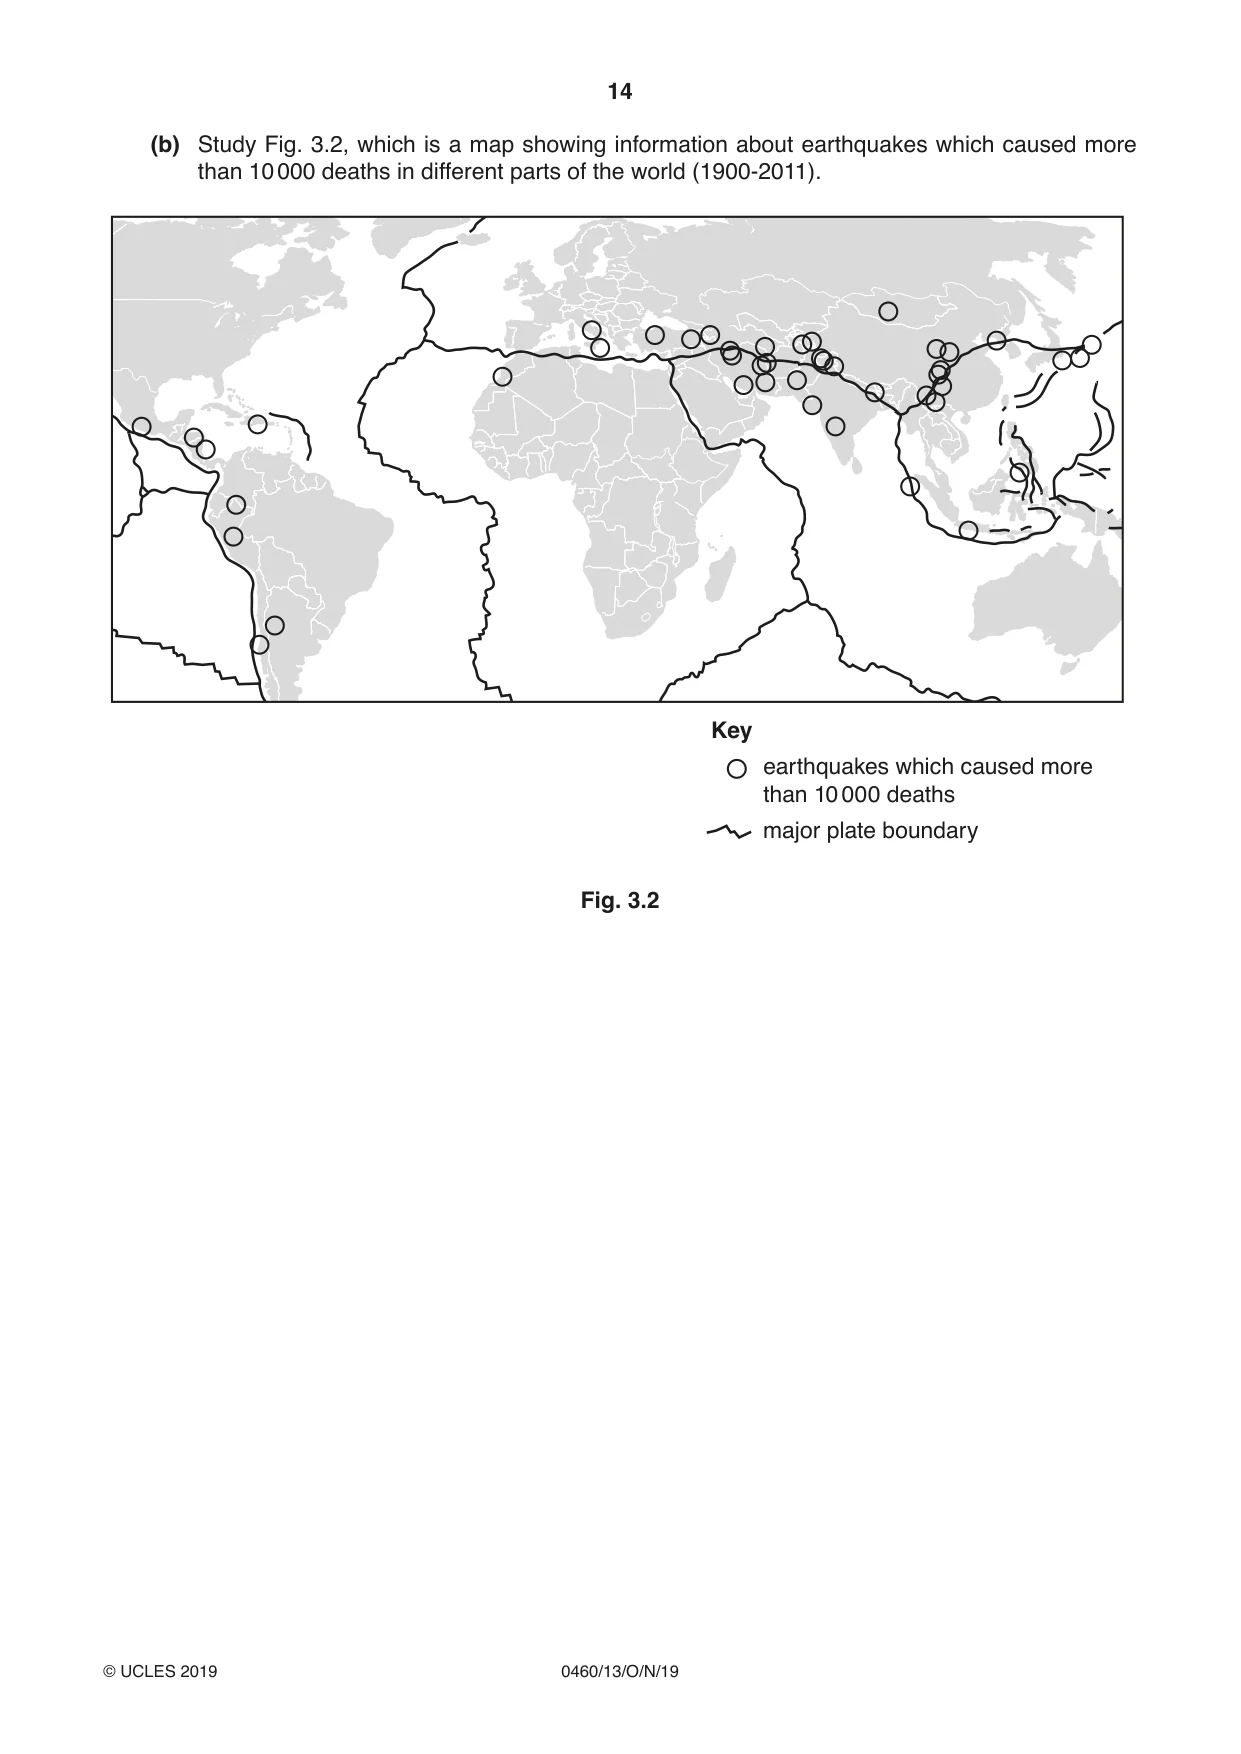
14 0460/13/O/N/19 © UCLES 2019 (b) Study Fig. 3.2, which is a map showing information about earthquakes which caused more than 10 000 deaths in different parts of the world (1900-2011). Key earthquakes which caused more than 10 000 deaths major plate boundary Fig. 3.2
Question paper, page 15
15 0460/13/O/N/19 © UCLES 2019 [Turn over (i) The distribution of earthquakes is uneven. Describe the distribution of the areas where earthquakes caused more than 10 000 deaths between 1900 and 2011. … … … … … … [3] (ii) Explain why the distribution of the areas where large numbers of deaths have been caused by earthquakes is uneven. … … … … … … … … … … [5]
Question paper, page 16
16 0460/13/O/N/19 © UCLES 2019 (c) Volcanic eruptions are another tectonic hazard. For a named volcano you have studied, explain the causes of a volcanic eruption. Name of volcano … … … … … … … … … … … … … … … … … … … … … … … … … [7] [Total: 25]
Question paper, page 17
17 0460/13/O/N/19 © UCLES 2019 [Turn over 4 (a) Study Fig. 4.1 (Insert), which is a photograph of part of a river. (i) What river feature is shown in Fig. 4.1? Underline one answer in the list below: confluence meander potholes source [1] (ii) Describe two characteristics of the feature labelled X on Fig. 4.1. 1 … … 2 … … [2] (iii) Explain how the feature labelled Y on Fig. 4.1 was formed. … … … … … … [3] (iv) Suggest how the course of the river shown in Fig. 4.1 may change in the future as a result of natural processes. … … … … … … … … [4]
Question paper, page 18
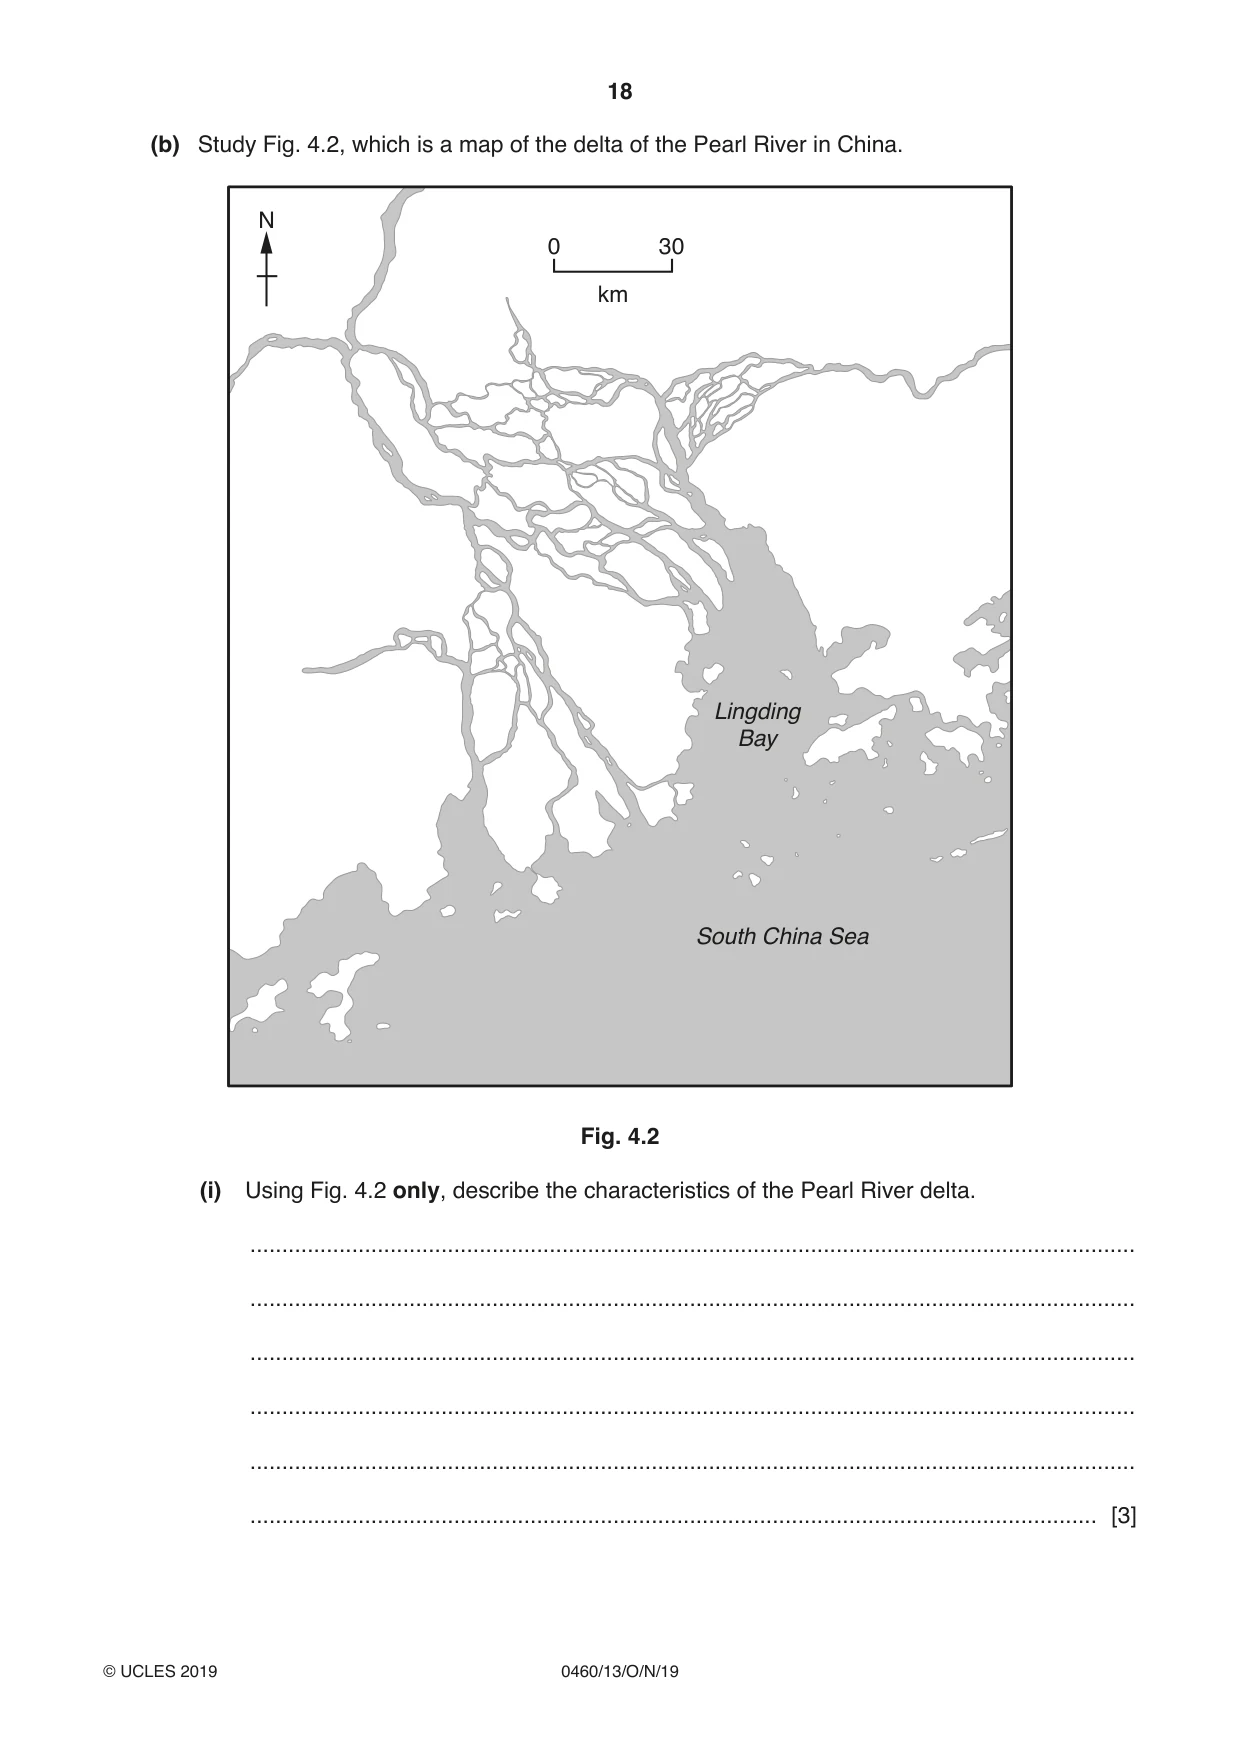
18 0460/13/O/N/19 © UCLES 2019 (b) Study Fig. 4.2, which is a map of the delta of the Pearl River in China. 0 30 km South China Sea Lingding Bay N Fig. 4.2 (i) Using Fig. 4.2 only, describe the characteristics of the Pearl River delta. … … … … … … [3]
Question paper, page 19
19 0460/13/O/N/19 © UCLES 2019 [Turn over (ii) Explain how a delta is formed. You may include a labelled diagram. … … … … … … … … … … [5]
Question paper, page 20
20 0460/13/O/N/19 © UCLES 2019 (c) For a named river you have studied, describe the hazards and difficulties of living close to it. Name of river … … … … … … … … … … … … … … … … … … … … … … … … … [7] [Total: 25]
Question paper, page 21
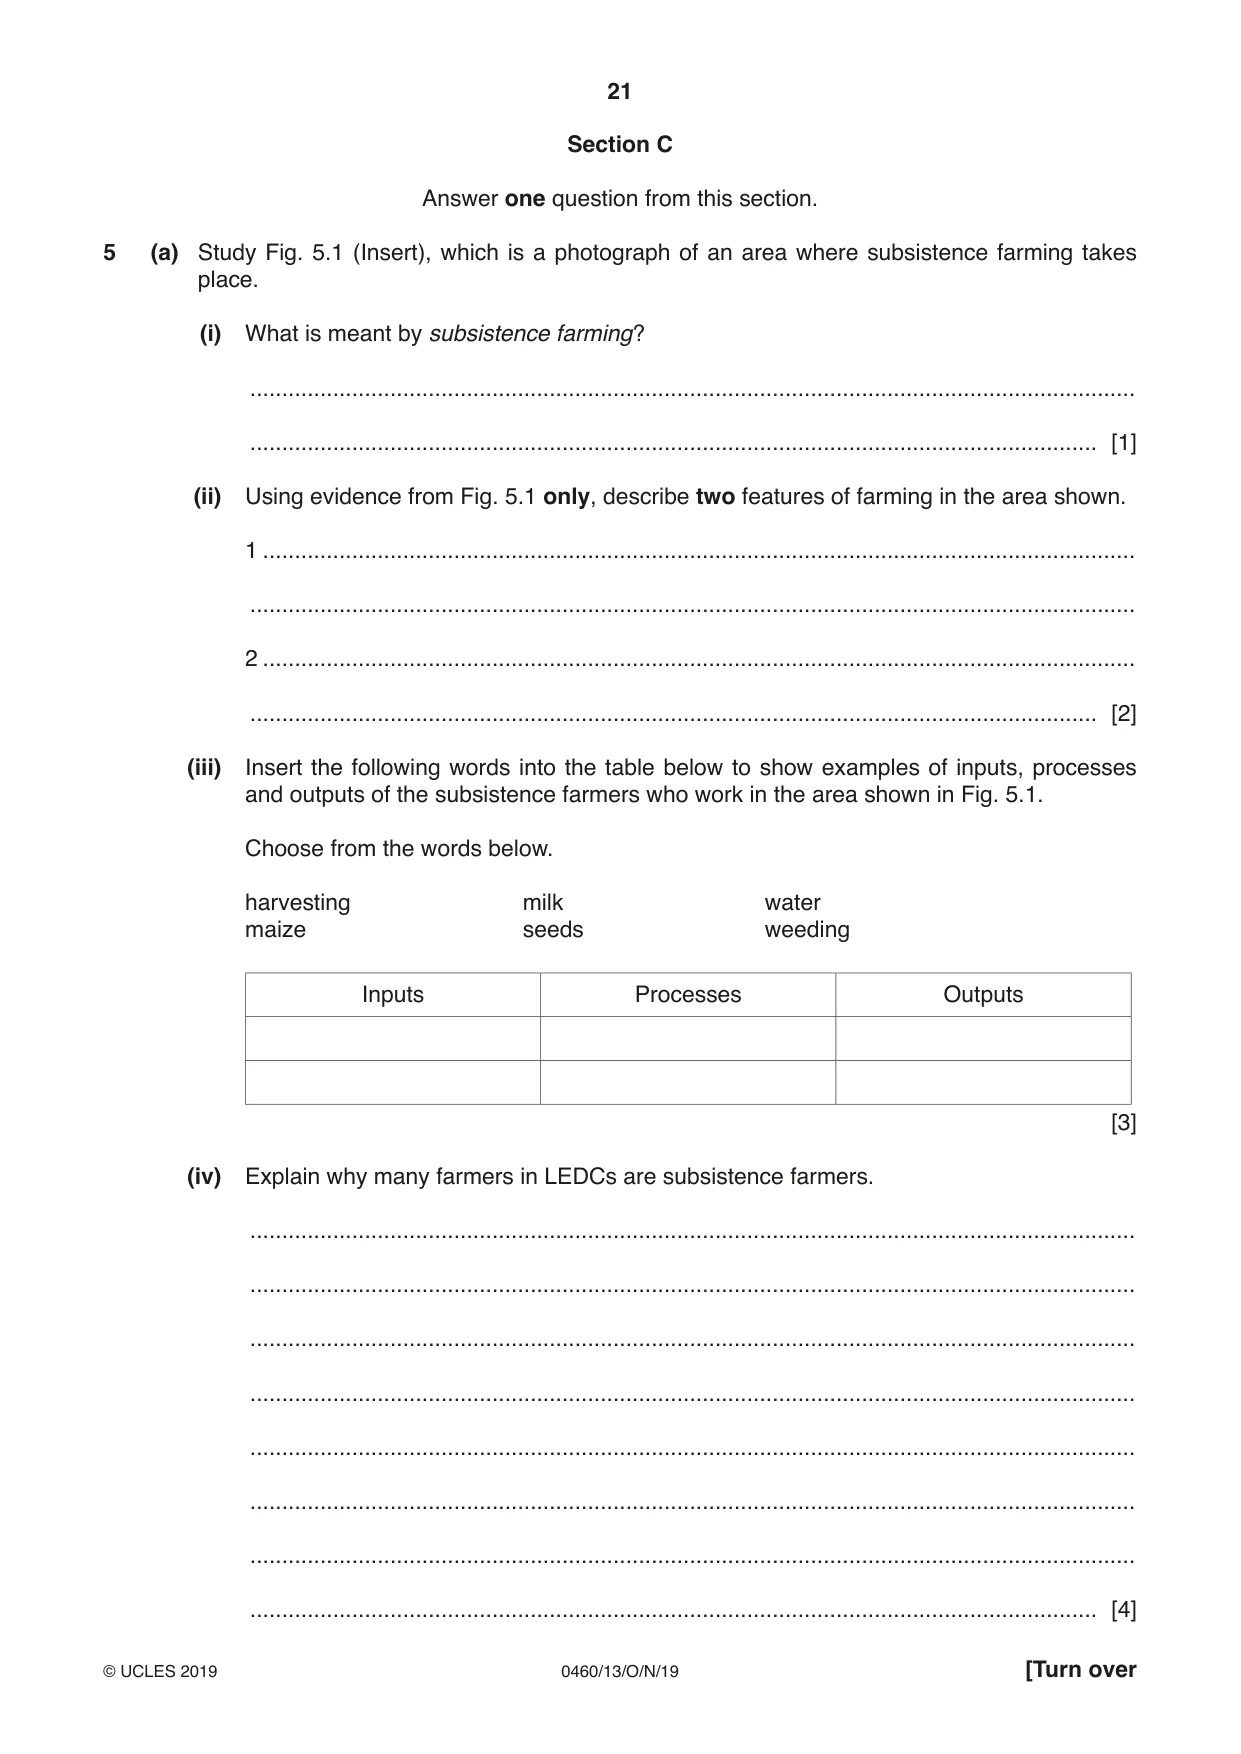
21 0460/13/O/N/19 © UCLES 2019 [Turn over Section C Answer one question from this section. 5 (a) Study Fig. 5.1 (Insert), which is a photograph of an area where subsistence farming takes place. (i) What is meant by subsistence farming? … … [1] (ii) Using evidence from Fig. 5.1 only, describe two features of farming in the area shown. 1 … … 2 … … [2] (iii) Insert the following words into the table below to show examples of inputs, processes and outputs of the subsistence farmers who work in the area shown in Fig. 5.1. Choose from the words below. harvesting milk water maize seeds weeding Inputs Processes Outputs [3] (iv) Explain why many farmers in LEDCs are subsistence farmers. … … … … … … … … [4]
Question paper, page 22
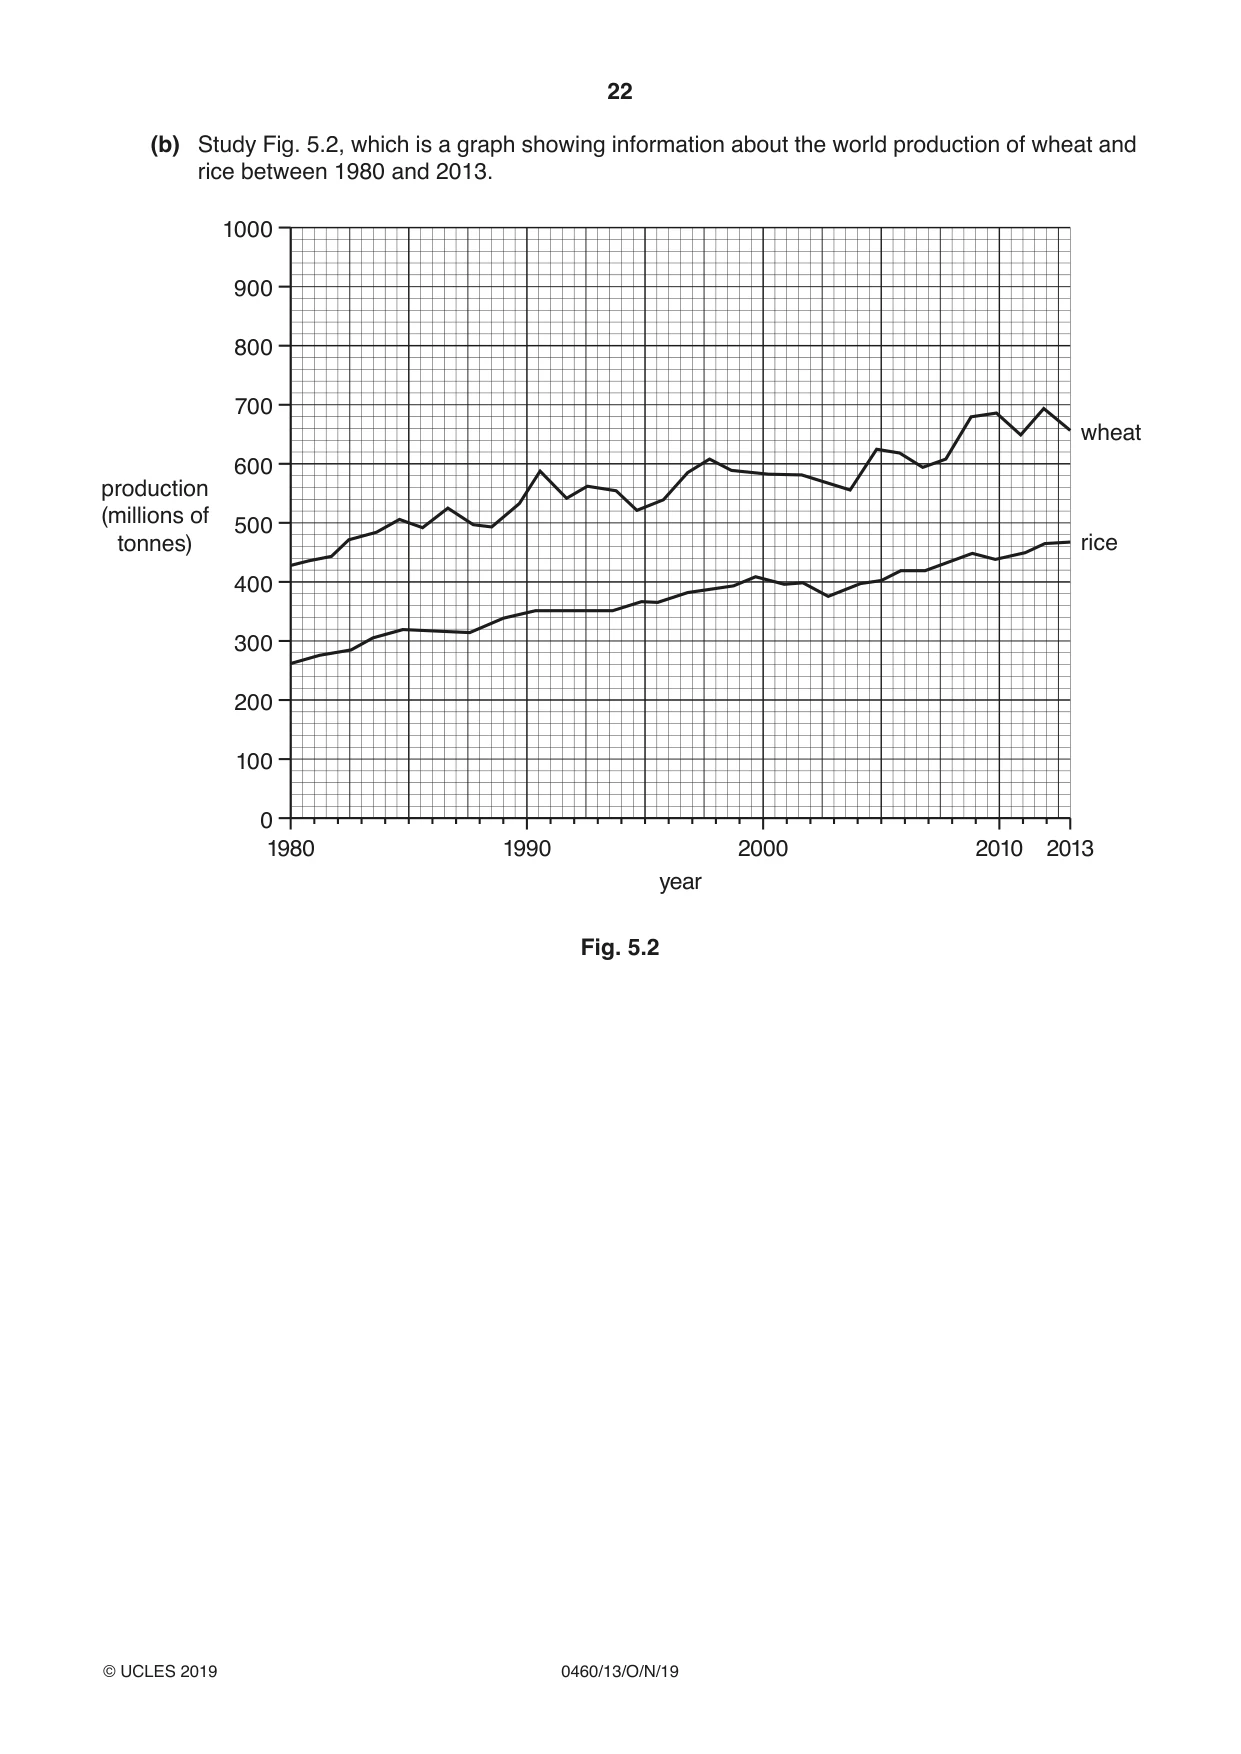
22 0460/13/O/N/19 © UCLES 2019 (b) Study Fig. 5.2, which is a graph showing information about the world production of wheat and rice between 1980 and 2013. production (millions of tonnes) wheat rice 0 1980 1990 2000 year 2010 2013 100 200 300 400 500 600 700 800 900 1000 Fig. 5.2
Question paper, page 23
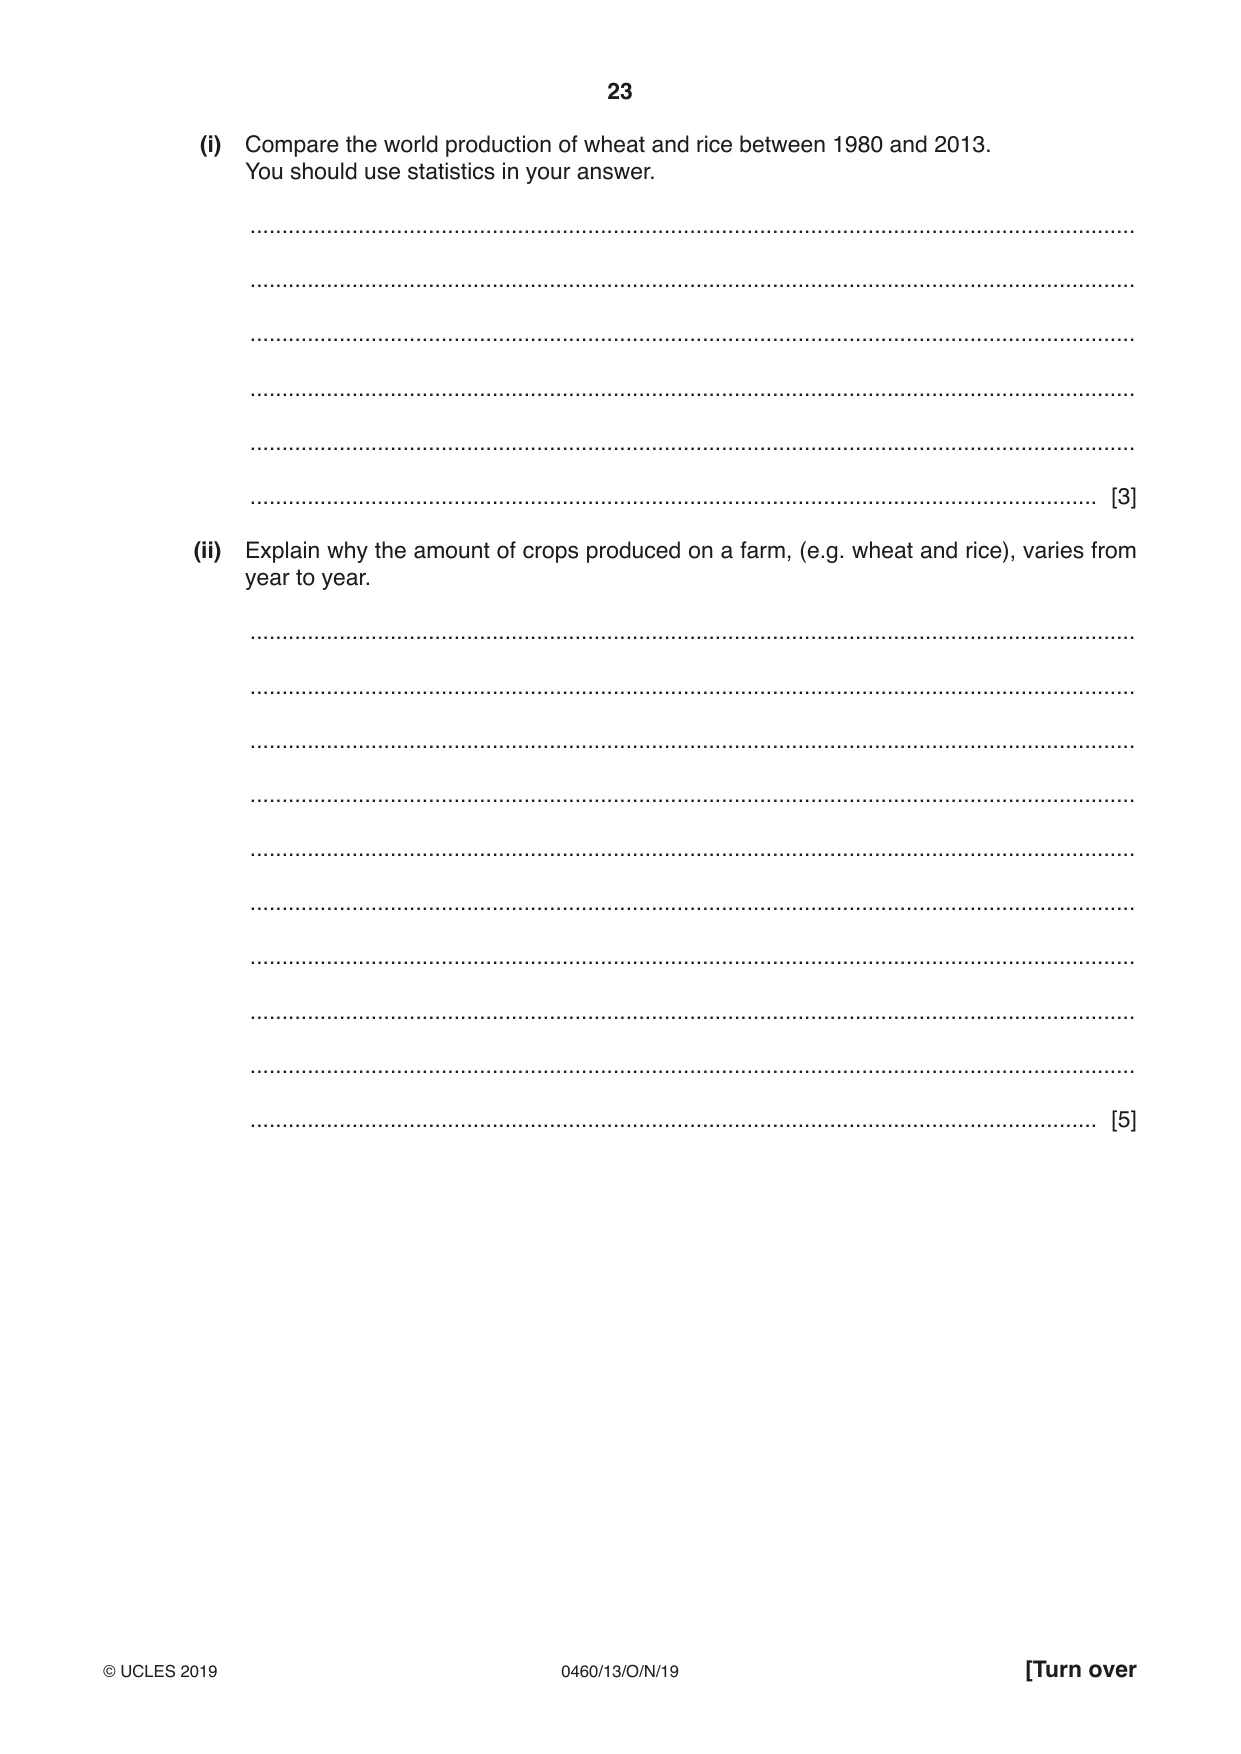
23 0460/13/O/N/19 © UCLES 2019 [Turn over (i) Compare the world production of wheat and rice between 1980 and 2013. You should use statistics in your answer. … … … … … … [3] (ii) Explain why the amount of crops produced on a farm, (e.g. wheat and rice), varies from year to year. … … … … … … … … … … [5]
Question paper, page 24
24 0460/13/O/N/19 © UCLES 2019 (c) For an example you have studied, describe and explain the land use of a farm or agricultural area. Name of farm or agricultural area … … … … … … … … … … … … … … … … … … … … … … … … … [7] [Total: 25]
Question paper, page 25
25 0460/13/O/N/19 © UCLES 2019 [Turn over 6 (a) Study Fig. 6.1 (Insert), which shows information about threats to the natural environment in the Caspian Sea. (i) Identify the main source of pollution in the Caspian Sea. … [1] (ii) Using information from Fig. 6.1 only, name: – a major urban area within 50 km of the Caspian Sea … – a river which flows into the Caspian Sea. … [2] (iii) Using evidence from Fig. 6.1 only, suggest three likely impacts on the natural environment of pollution in the Caspian Sea. 1 … … 2 … … 3 … … [3] (iv) Suggest why it is difficult to reduce water pollution in the Caspian Sea. … … … … … … … … [4]
Question paper, page 26
26 0460/13/O/N/19 © UCLES 2019 (b) Study Figs. 6.2, 6.3 and 6.4 (Insert), which are photographs of economic activities which increase greenhouse gases in the atmosphere. (i) Explain how each of the economic activities shown in Figs. 6.2, 6.3 and 6.4 increase greenhouse gases in the atmosphere. Fig. 6.2 … … Fig. 6.3 … … Fig. 6.4 … … [3] (ii) Explain how an increase in greenhouse gases in the atmosphere is causing global warming. … … … … … … … … … … [5]
Question paper, page 27
27 0460/13/O/N/19 © UCLES 2019 (c) Describe the threats caused by global warming. You should refer to named areas affected. … … … … … … … … … … … … … … … … … … … … … … … … [7] [Total: 25]
Question paper, page 28
28 0460/13/O/N/19 © UCLES 2019 Additional Pages If you use the following lined pages to complete the answer(s) to any question(s), the question number(s) must be clearly shown. … … … … … … … … … … … … … … … … … … … … … … … … … …
Question paper, page 29
29 0460/13/O/N/19 © UCLES 2019 … … … … … … … … … … … … … … … … … … … … … … … … … … … …
Question paper, page 30
30 0460/13/O/N/19 © UCLES 2019 BLANK PAGE
Question paper, page 31
31 0460/13/O/N/19 © UCLES 2019 BLANK PAGE
Question paper, page 32
32 0460/13/O/N/19 © UCLES 2019 BLANK PAGE Permission to reproduce items where third-party owned material protected by copyright is included has been sought and cleared where possible. Every reasonable effort has been made by the publisher (UCLES) to trace copyright holders, but if any items requiring clearance have unwittingly been included, the publisher will be pleased to make amends at the earliest possible opportunity. To avoid the issue of disclosure of answer-related information to candidates, all copyright acknowledgements are reproduced online in the Cambridge Assessment International Education Copyright Acknowledgements Booklet. This is produced for each series of examinations and is freely available to download at www.cambridgeinternational.org after the live examination series. Cambridge Assessment International Education is part of the Cambridge Assessment Group. Cambridge Assessment is the brand name of the University of Cambridge Local Examinations Syndicate (UCLES), which itself is a department of the University of Cambridge.
Mark scheme, page 1
This syllabus is regulated for use in England, Wales and Northern Ireland as a Cambridge International Level 1/Level 2 Certificate. This document consists of 17 printed pages. © UCLES 2019 [Turn over Cambridge Assessment International Education Cambridge International General Certificate of Secondary Education GEOGRAPHY 0460/13 Paper 1 October/November 2019 MARK SCHEME Maximum Mark: 75 Published This mark scheme is published as an aid to teachers and candidates, to indicate the requirements of the examination. It shows the basis on which Examiners were instructed to award marks. It does not indicate the details of the discussions that took place at an Examiners’ meeting before marking began, which would have considered the acceptability of alternative answers. Mark schemes should be read in conjunction with the question paper and the Principal Examiner Report for Teachers. Cambridge International will not enter into discussions about these mark schemes. Cambridge International is publishing the mark schemes for the October/November 2019 series for most Cambridge IGCSE™, Cambridge International A and AS Level components and some Cambridge O Level components.
Mark scheme, page 2
0460/13 Cambridge IGCSE – Mark Scheme PUBLISHED October/November 2019 © UCLES 2019 Page 2 of 17 Generic Marking Principles These general marking principles must be applied by all examiners when marking candidate answers. They should be applied alongside the specific content of the mark scheme or generic level descriptors for a question. Each question paper and mark scheme will also comply with these marking principles. GENERIC MARKING PRINCIPLE 1: Marks must be awarded in line with: • the specific content of the mark scheme or the generic level descriptors for the question • the specific skills defined in the mark scheme or in the generic level descriptors for the question • the standard of response required by a candidate as exemplified by the standardisation scripts. GENERIC MARKING PRINCIPLE 2: Marks awarded are always whole marks (not half marks, or other fractions). GENERIC MARKING PRINCIPLE 3: Marks must be awarded positively: • marks are awarded for correct/valid answers, as defined in the mark scheme. However, credit is given for valid answers which go beyond the scope of the syllabus and mark scheme, referring to your Team Leader as appropriate • marks are awarded when candidates clearly demonstrate what they know and can do • marks are not deducted for errors • marks are not deducted for omissions • answers should only be judged on the quality of spelling, punctuation and grammar when these features are specifically assessed by the question as indicated by the mark scheme. The meaning, however, should be unambiguous. GENERIC MARKING PRINCIPLE 4: Rules must be applied consistently e.g. in situations where candidates have not followed instructions or in the application of generic level descriptors. GENERIC MARKING PRINCIPLE 5: Marks should be awarded using the full range of marks defined in the mark scheme for the question (however; the use of the full mark range may be limited according to the quality of the candidate responses seen). GENERIC MARKING PRINCIPLE 6: Marks awarded are based solely on the requirements as defined in the mark scheme. Marks should not be awarded with grade thresholds or grade descriptors in mind.
Mark scheme, page 3
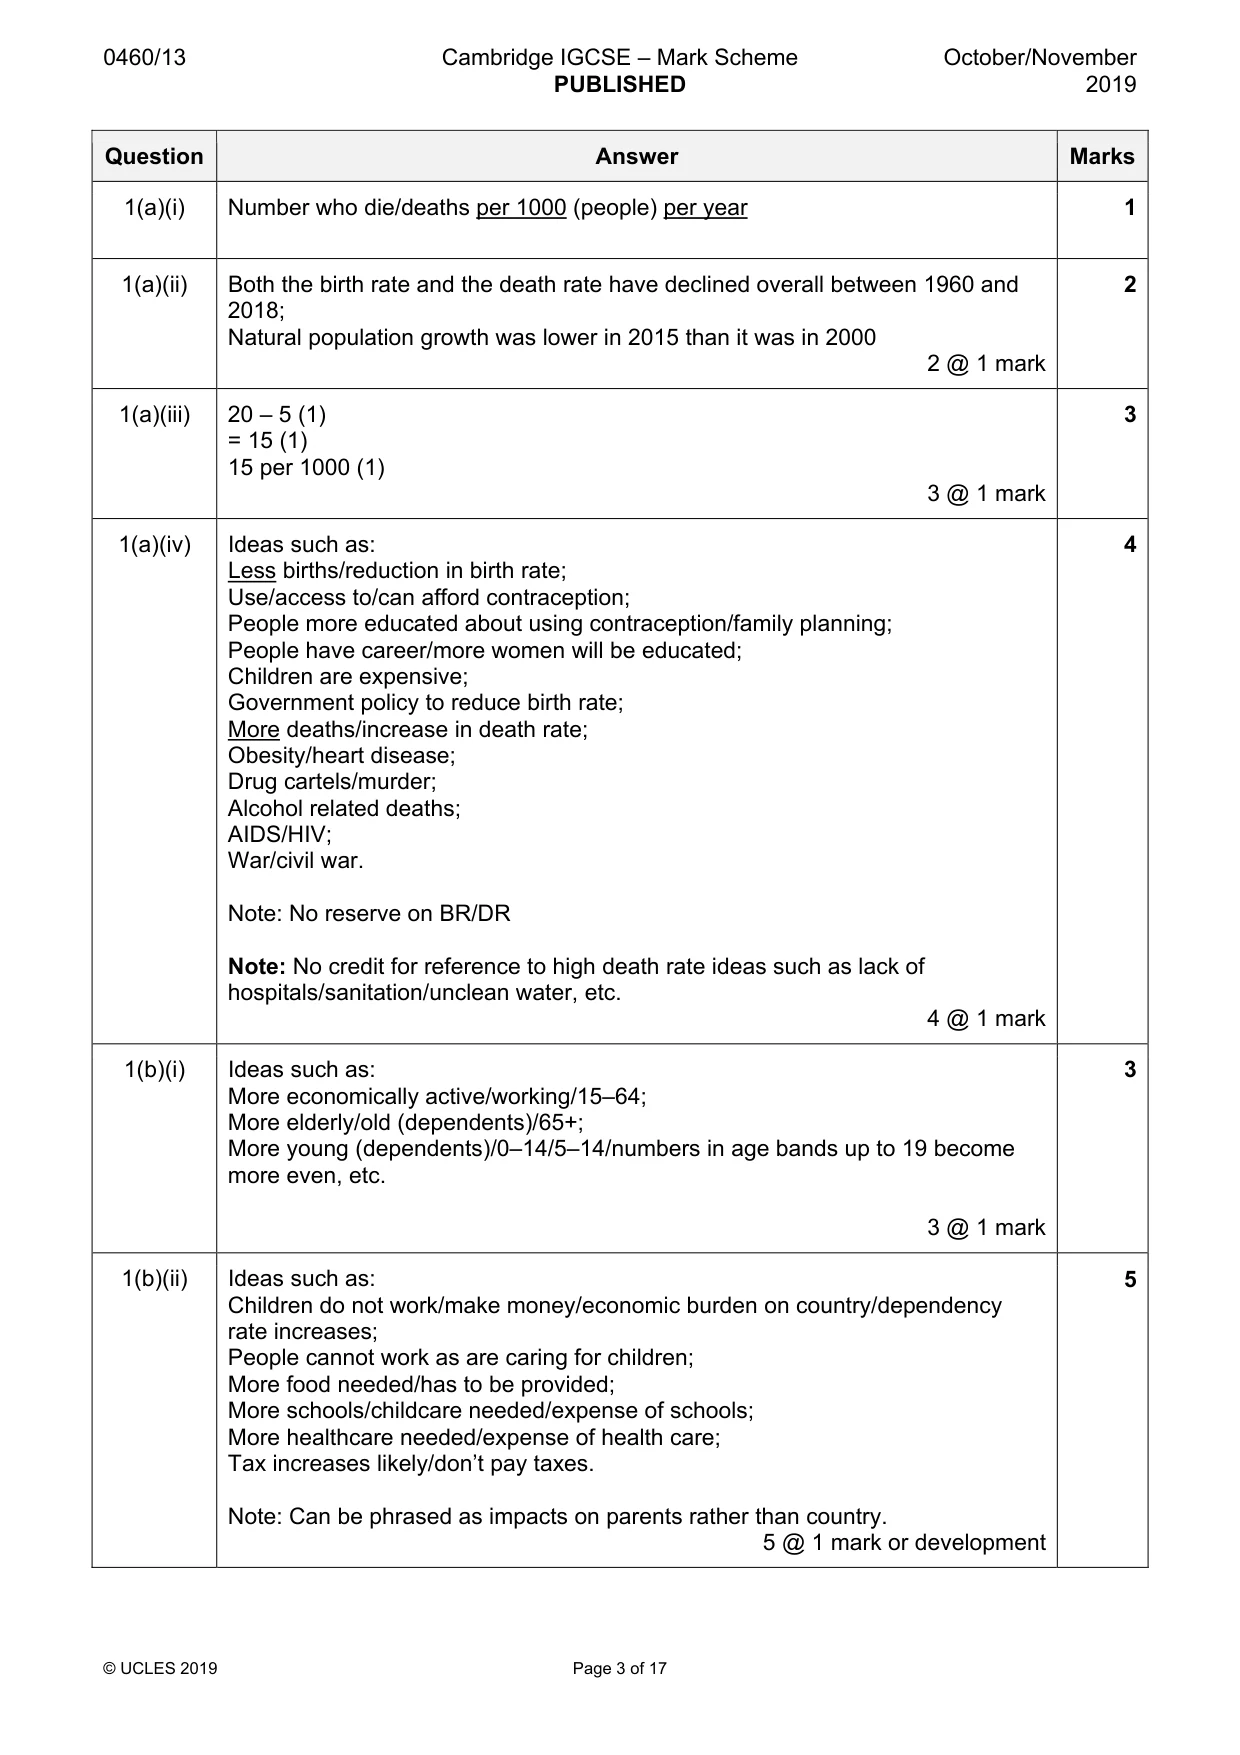
0460/13 Cambridge IGCSE – Mark Scheme PUBLISHED October/November 2019 © UCLES 2019 Page 3 of 17 Question Answer Marks 1(a)(i) Number who die/deaths per 1000 (people) per year 1 1(a)(ii) Both the birth rate and the death rate have declined overall between 1960 and 2018; Natural population growth was lower in 2015 than it was in 2000 2 @ 1 mark 2 1(a)(iii) 20 – 5 (1) = 15 (1) 15 per 1000 (1) 3 @ 1 mark 3 1(a)(iv) Ideas such as: Less births/reduction in birth rate; Use/access to/can afford contraception; People more educated about using contraception/family planning; People have career/more women will be educated; Children are expensive; Government policy to reduce birth rate; More deaths/increase in death rate; Obesity/heart disease; Drug cartels/murder; Alcohol related deaths; AIDS/HIV; War/civil war. Note: No reserve on BR/DR Note: No credit for reference to high death rate ideas such as lack of hospitals/sanitation/unclean water, etc. 4 @ 1 mark 4 1(b)(i) Ideas such as: More economically active/working/15–64; More elderly/old (dependents)/65+; More young (dependents)/0–14/5–14/numbers in age bands up to 19 become more even, etc. 3 @ 1 mark 3 1(b)(ii) Ideas such as: Children do not work/make money/economic burden on country/dependency rate increases; People cannot work as are caring for children; More food needed/has to be provided; More schools/childcare needed/expense of schools; More healthcare needed/expense of health care; Tax increases likely/don’t pay taxes. Note: Can be phrased as impacts on parents rather than country. 5 @ 1 mark or development 5
Mark scheme, page 4
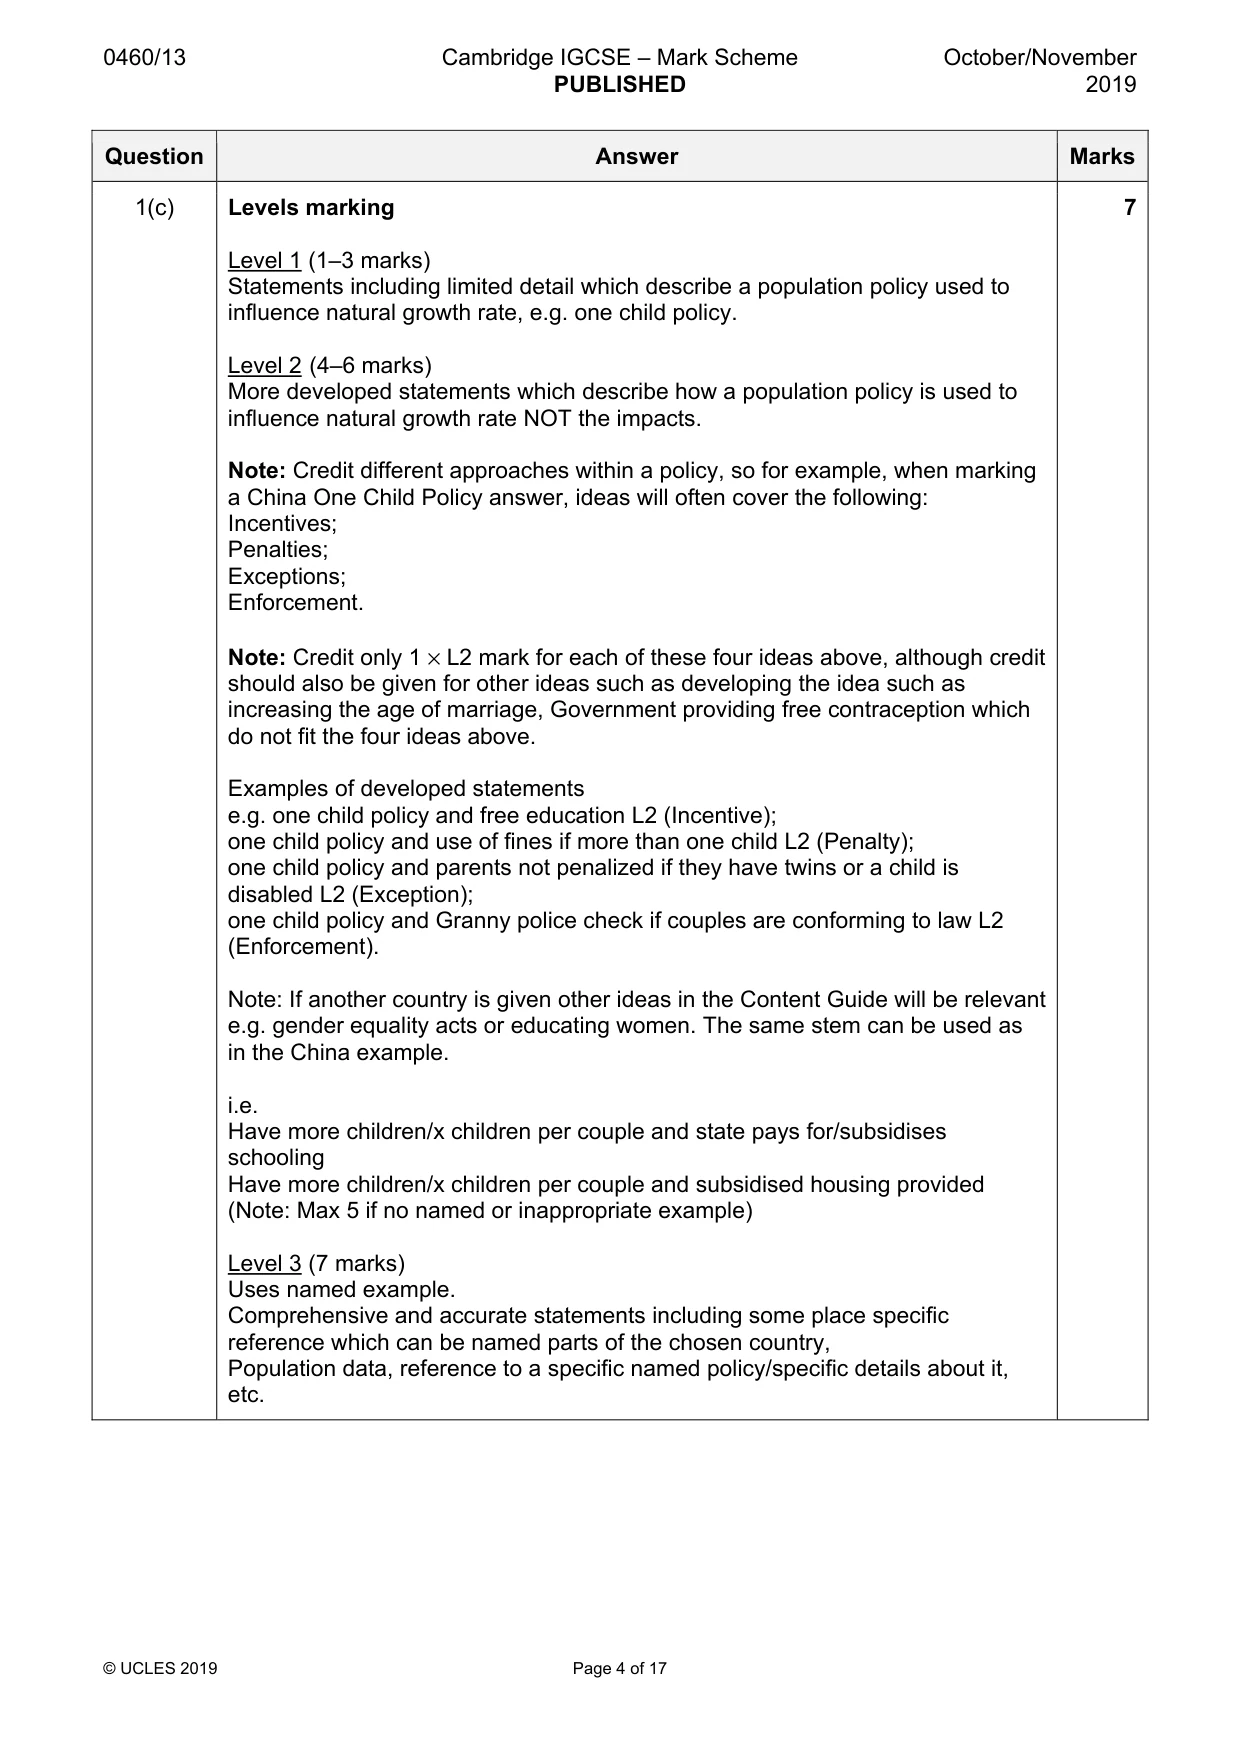
0460/13 Cambridge IGCSE – Mark Scheme PUBLISHED October/November 2019 © UCLES 2019 Page 4 of 17 Question Answer Marks 1(c) Levels marking Level 1 (1–3 marks) Statements including limited detail which describe a population policy used to influence natural growth rate, e.g. one child policy. Level 2 (4–6 marks) More developed statements which describe how a population policy is used to influence natural growth rate NOT the impacts. Note: Credit different approaches within a policy, so for example, when marking a China One Child Policy answer, ideas will often cover the following: Incentives; Penalties; Exceptions; Enforcement. Note: Credit only 1 × L2 mark for each of these four ideas above, although credit should also be given for other ideas such as developing the idea such as increasing the age of marriage, Government providing free contraception which do not fit the four ideas above. Examples of developed statements e.g. one child policy and free education L2 (Incentive); one child policy and use of fines if more than one child L2 (Penalty); one child policy and parents not penalized if they have twins or a child is disabled L2 (Exception); one child policy and Granny police check if couples are conforming to law L2 (Enforcement). Note: If another country is given other ideas in the Content Guide will be relevant e.g. gender equality acts or educating women. The same stem can be used as in the China example. i.e. Have more children/x children per couple and state pays for/subsidises schooling Have more children/x children per couple and subsidised housing provided (Note: Max 5 if no named or inappropriate example) Level 3 (7 marks) Uses named example. Comprehensive and accurate statements including some place specific reference which can be named parts of the chosen country, Population data, reference to a specific named policy/specific details about it, etc. 7
Mark scheme, page 5
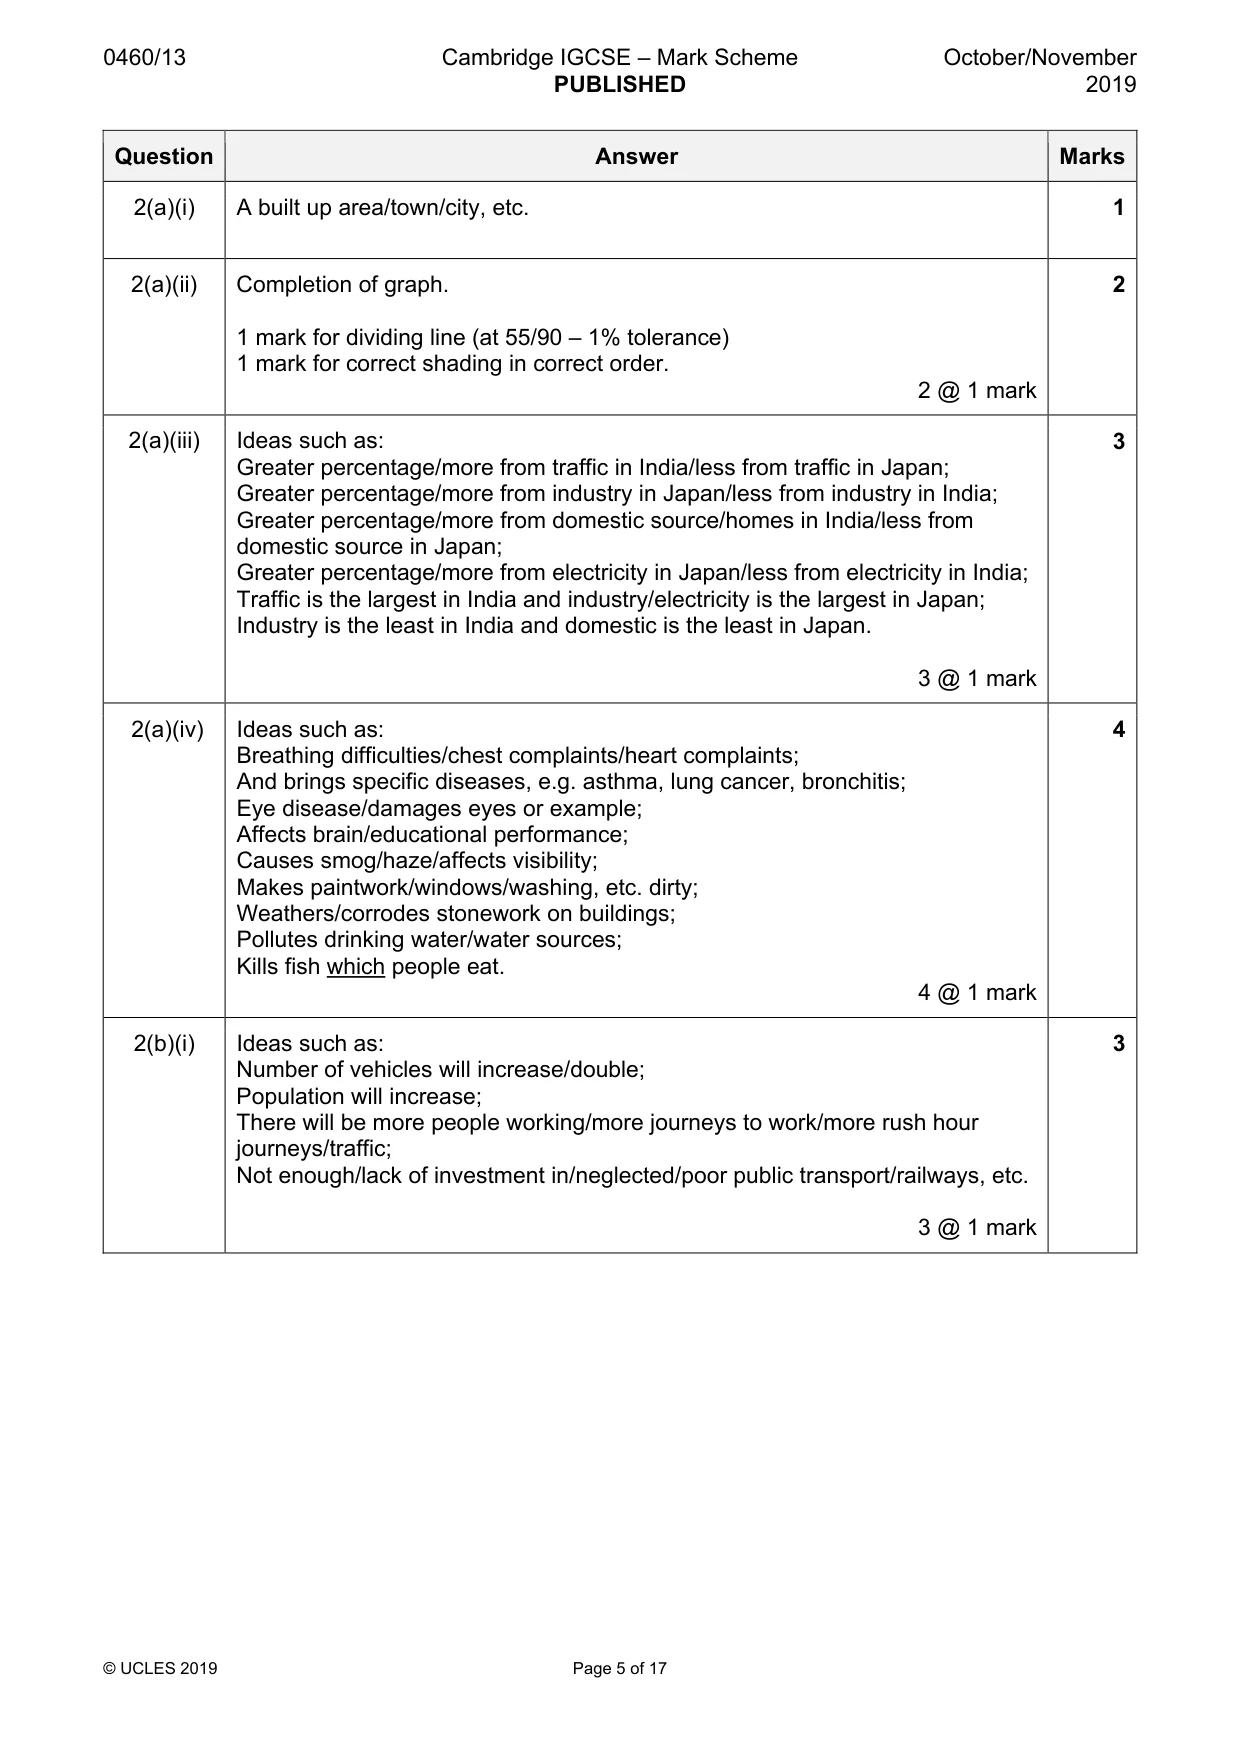
0460/13 Cambridge IGCSE – Mark Scheme PUBLISHED October/November 2019 © UCLES 2019 Page 5 of 17 Question Answer Marks 2(a)(i) A built up area/town/city, etc. 1 2(a)(ii) Completion of graph. 1 mark for dividing line (at 55/90 – 1% tolerance) 1 mark for correct shading in correct order. 2 @ 1 mark 2 2(a)(iii) Ideas such as: Greater percentage/more from traffic in India/less from traffic in Japan; Greater percentage/more from industry in Japan/less from industry in India; Greater percentage/more from domestic source/homes in India/less from domestic source in Japan; Greater percentage/more from electricity in Japan/less from electricity in India; Traffic is the largest in India and industry/electricity is the largest in Japan; Industry is the least in India and domestic is the least in Japan. 3 @ 1 mark 3 2(a)(iv) Ideas such as: Breathing difficulties/chest complaints/heart complaints; And brings specific diseases, e.g. asthma, lung cancer, bronchitis; Eye disease/damages eyes or example; Affects brain/educational performance; Causes smog/haze/affects visibility; Makes paintwork/windows/washing, etc. dirty; Weathers/corrodes stonework on buildings; Pollutes drinking water/water sources; Kills fish which people eat. 4 @ 1 mark 4 2(b)(i) Ideas such as: Number of vehicles will increase/double; Population will increase; There will be more people working/more journeys to work/more rush hour journeys/traffic; Not enough/lack of investment in/neglected/poor public transport/railways, etc. 3 @ 1 mark 3
Mark scheme, page 6
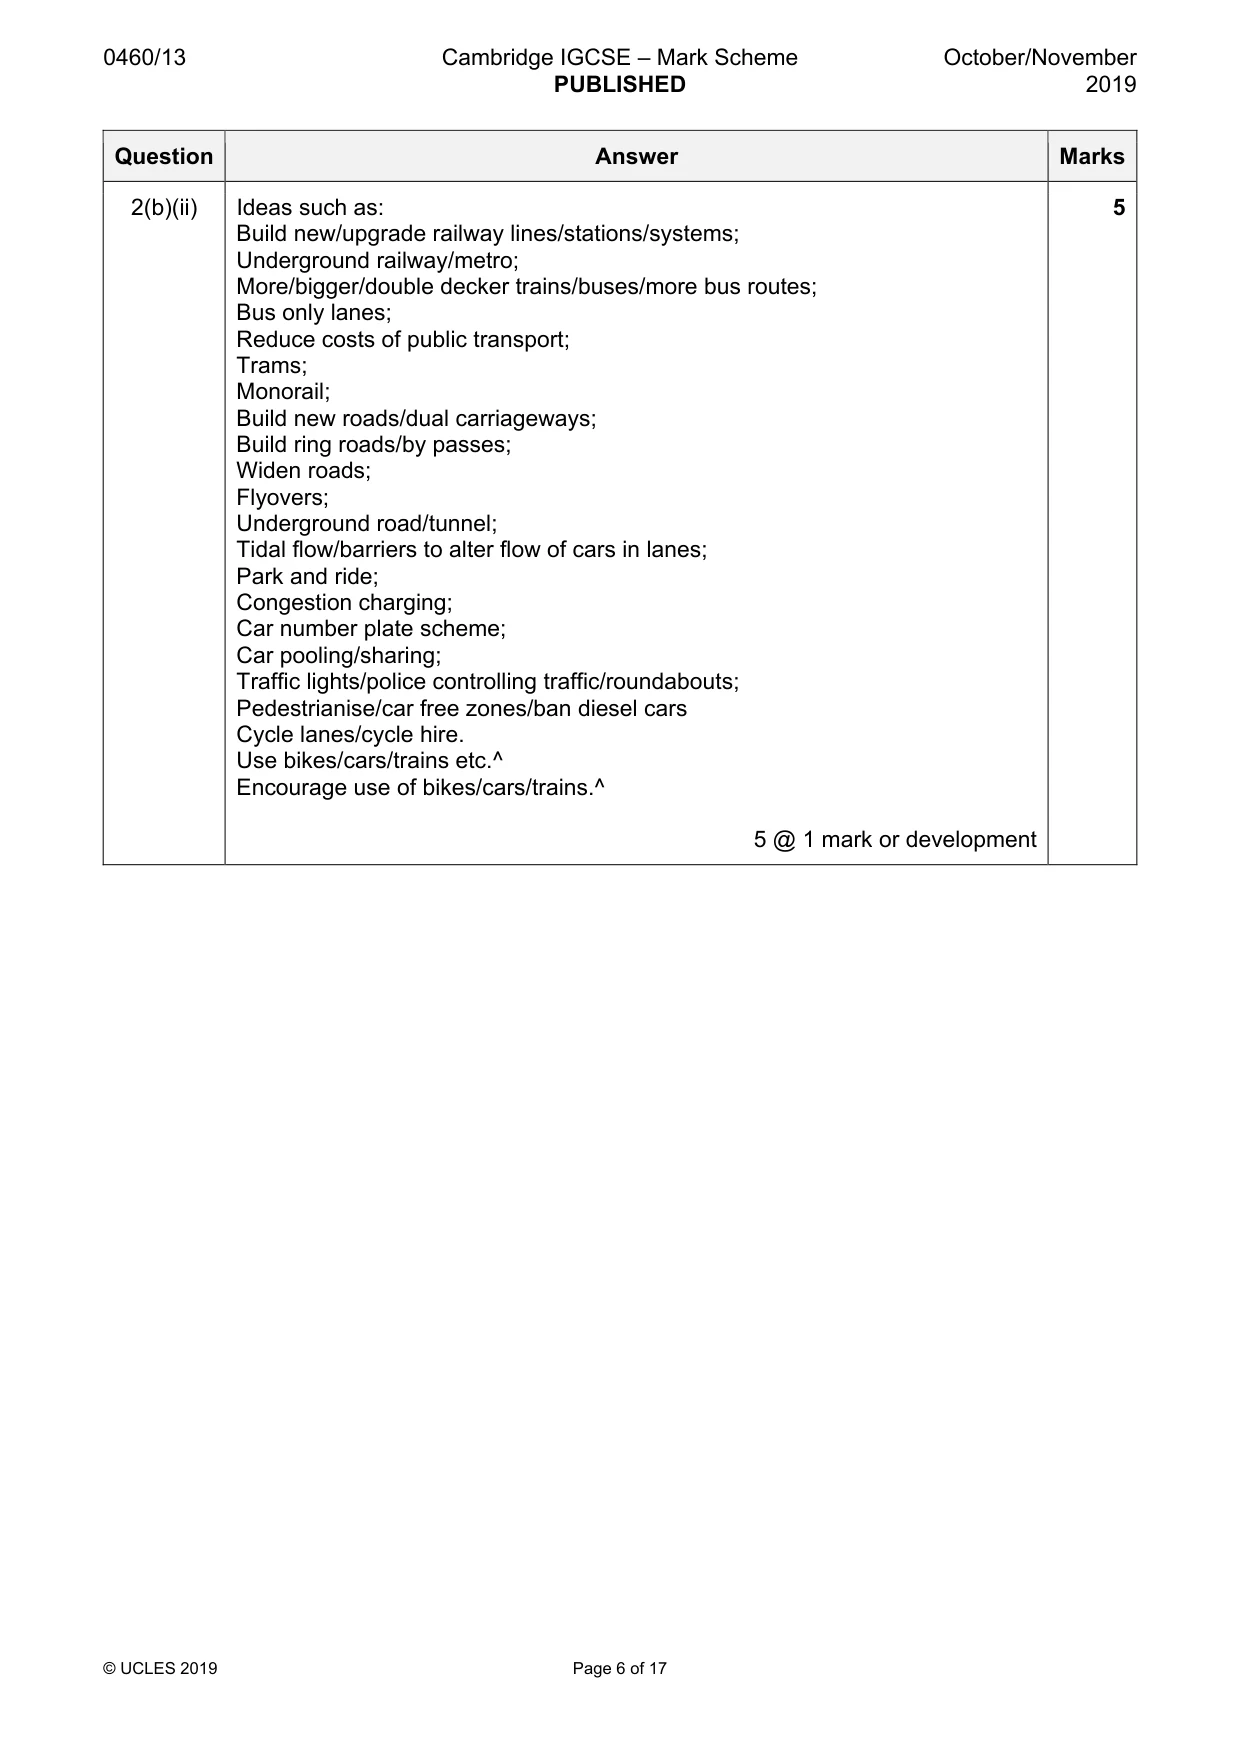
0460/13 Cambridge IGCSE – Mark Scheme PUBLISHED October/November 2019 © UCLES 2019 Page 6 of 17 Question Answer Marks 2(b)(ii) Ideas such as: Build new/upgrade railway lines/stations/systems; Underground railway/metro; More/bigger/double decker trains/buses/more bus routes; Bus only lanes; Reduce costs of public transport; Trams; Monorail; Build new roads/dual carriageways; Build ring roads/by passes; Widen roads; Flyovers; Underground road/tunnel; Tidal flow/barriers to alter flow of cars in lanes; Park and ride; Congestion charging; Car number plate scheme; Car pooling/sharing; Traffic lights/police controlling traffic/roundabouts; Pedestrianise/car free zones/ban diesel cars Cycle lanes/cycle hire. Use bikes/cars/trains etc.^ Encourage use of bikes/cars/trains.^ 5 @ 1 mark or development 5
Mark scheme, page 7
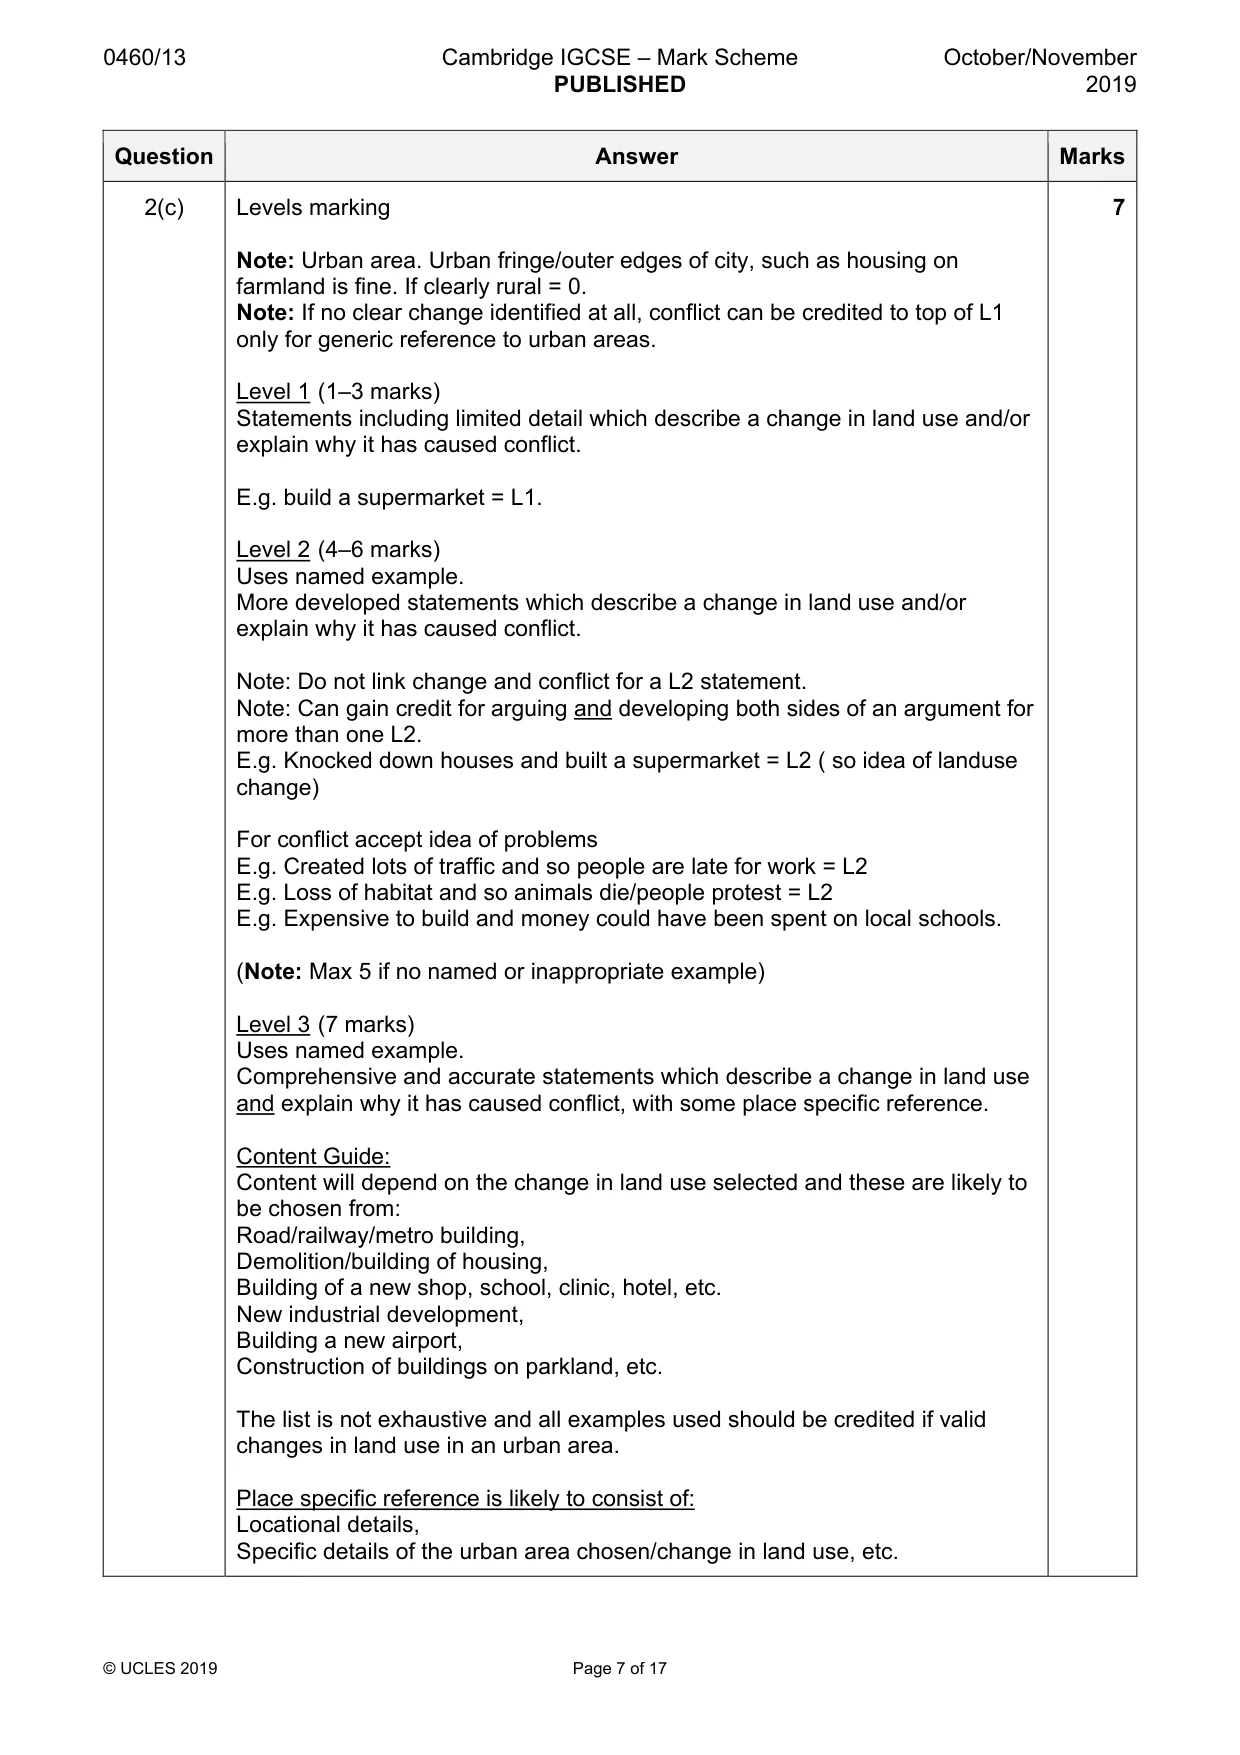
0460/13 Cambridge IGCSE – Mark Scheme PUBLISHED October/November 2019 © UCLES 2019 Page 7 of 17 Question Answer Marks 2(c) Levels marking Note: Urban area. Urban fringe/outer edges of city, such as housing on farmland is fine. If clearly rural = 0. Note: If no clear change identified at all, conflict can be credited to top of L1 only for generic reference to urban areas. Level 1 (1–3 marks) Statements including limited detail which describe a change in land use and/or explain why it has caused conflict. E.g. build a supermarket = L1. Level 2 (4–6 marks) Uses named example. More developed statements which describe a change in land use and/or explain why it has caused conflict. Note: Do not link change and conflict for a L2 statement. Note: Can gain credit for arguing and developing both sides of an argument for more than one L2. E.g. Knocked down houses and built a supermarket = L2 ( so idea of landuse change) For conflict accept idea of problems E.g. Created lots of traffic and so people are late for work = L2 E.g. Loss of habitat and so animals die/people protest = L2 E.g. Expensive to build and money could have been spent on local schools. (Note: Max 5 if no named or inappropriate example) Level 3 (7 marks) Uses named example. Comprehensive and accurate statements which describe a change in land use and explain why it has caused conflict, with some place specific reference. Content Guide: Content will depend on the change in land use selected and these are likely to be chosen from: Road/railway/metro building, Demolition/building of housing, Building of a new shop, school, clinic, hotel, etc. New industrial development, Building a new airport, Construction of buildings on parkland, etc. The list is not exhaustive and all examples used should be credited if valid changes in land use in an urban area. Place specific reference is likely to consist of: Locational details, Specific details of the urban area chosen/change in land use, etc. 7
Mark scheme, page 8
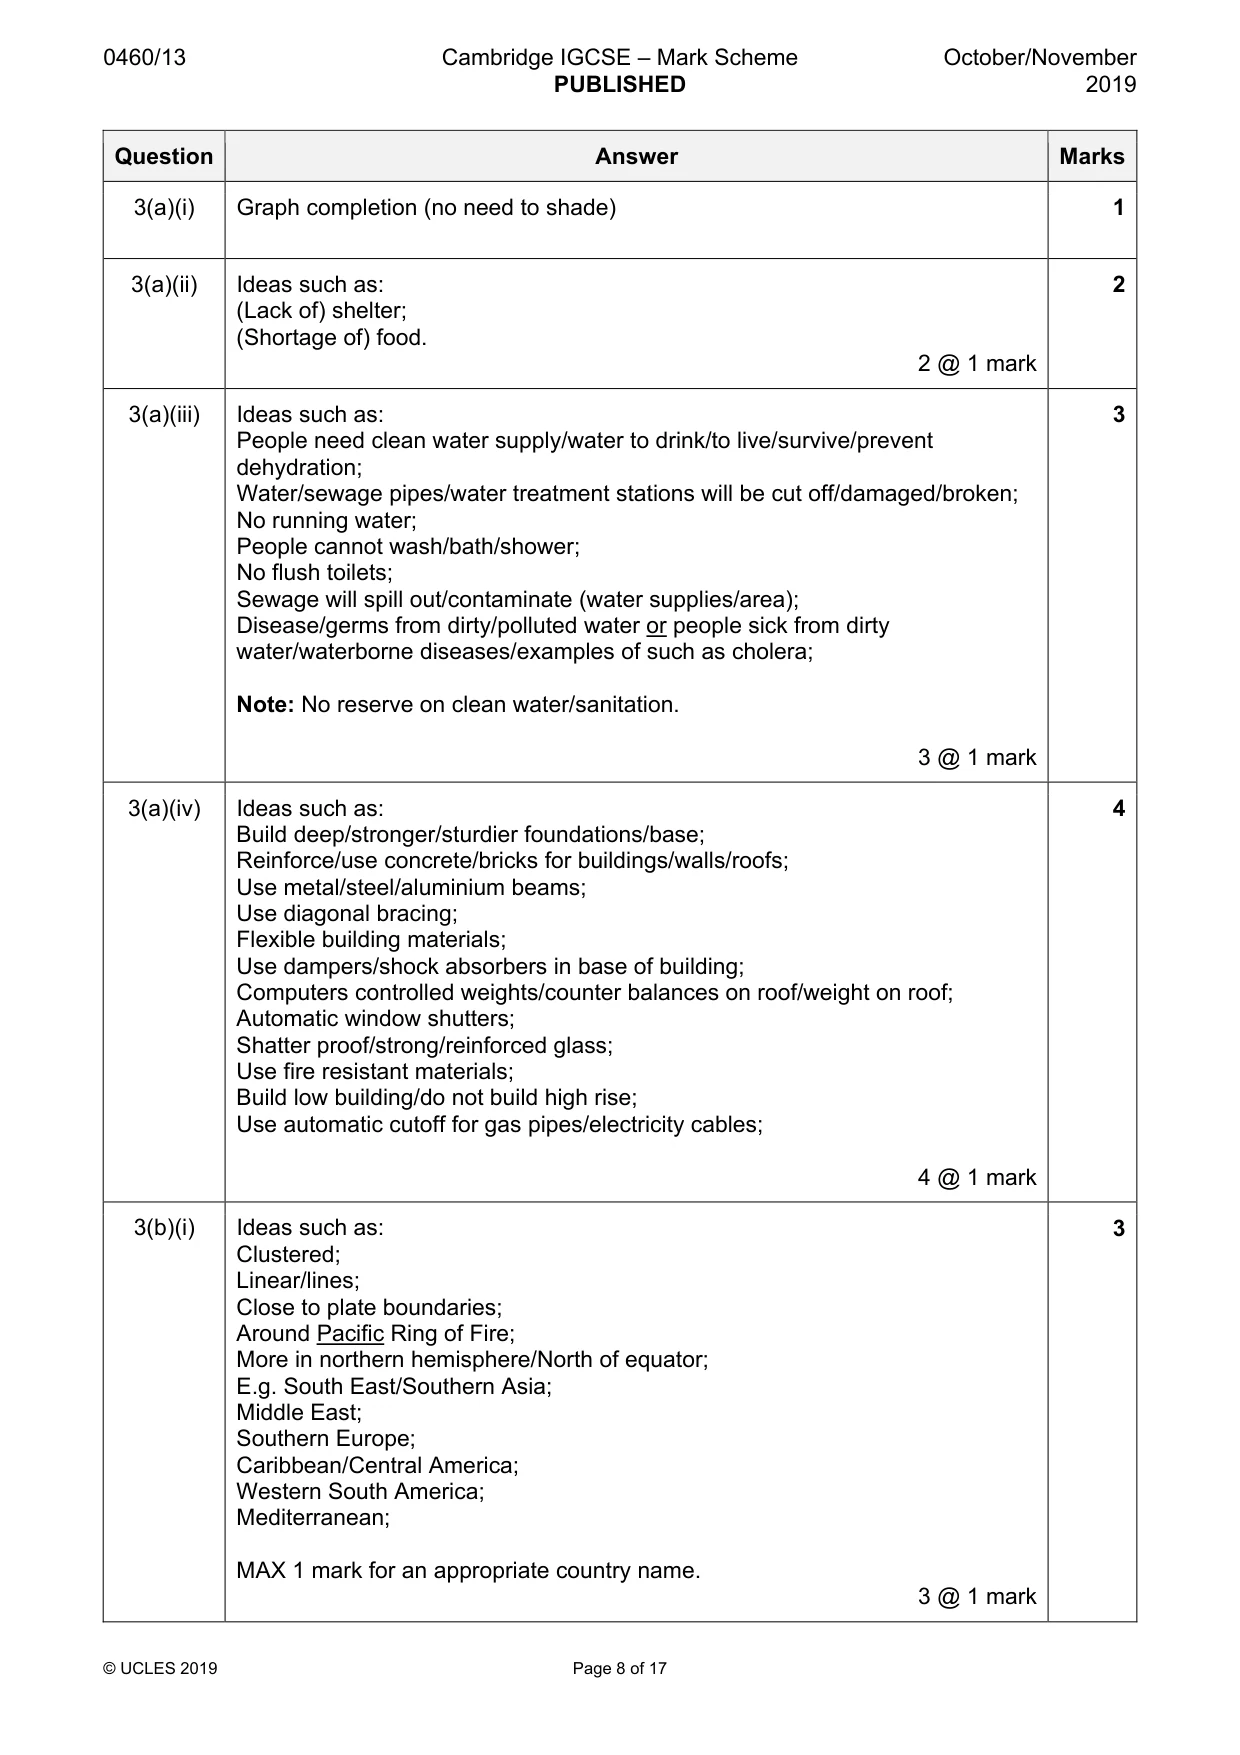
0460/13 Cambridge IGCSE – Mark Scheme PUBLISHED October/November 2019 © UCLES 2019 Page 8 of 17 Question Answer Marks 3(a)(i) Graph completion (no need to shade) 1 3(a)(ii) Ideas such as: (Lack of) shelter; (Shortage of) food. 2 @ 1 mark 2 3(a)(iii) Ideas such as: People need clean water supply/water to drink/to live/survive/prevent dehydration; Water/sewage pipes/water treatment stations will be cut off/damaged/broken; No running water; People cannot wash/bath/shower; No flush toilets; Sewage will spill out/contaminate (water supplies/area); Disease/germs from dirty/polluted water or people sick from dirty water/waterborne diseases/examples of such as cholera; Note: No reserve on clean water/sanitation. 3 @ 1 mark 3 3(a)(iv) Ideas such as: Build deep/stronger/sturdier foundations/base; Reinforce/use concrete/bricks for buildings/walls/roofs; Use metal/steel/aluminium beams; Use diagonal bracing; Flexible building materials; Use dampers/shock absorbers in base of building; Computers controlled weights/counter balances on roof/weight on roof; Automatic window shutters; Shatter proof/strong/reinforced glass; Use fire resistant materials; Build low building/do not build high rise; Use automatic cutoff for gas pipes/electricity cables; 4 @ 1 mark 4 3(b)(i) Ideas such as: Clustered; Linear/lines; Close to plate boundaries; Around Pacific Ring of Fire; More in northern hemisphere/North of equator; E.g. South East/Southern Asia; Middle East; Southern Europe; Caribbean/Central America; Western South America; Mediterranean; MAX 1 mark for an appropriate country name. 3 @ 1 mark 3
Mark scheme, page 9
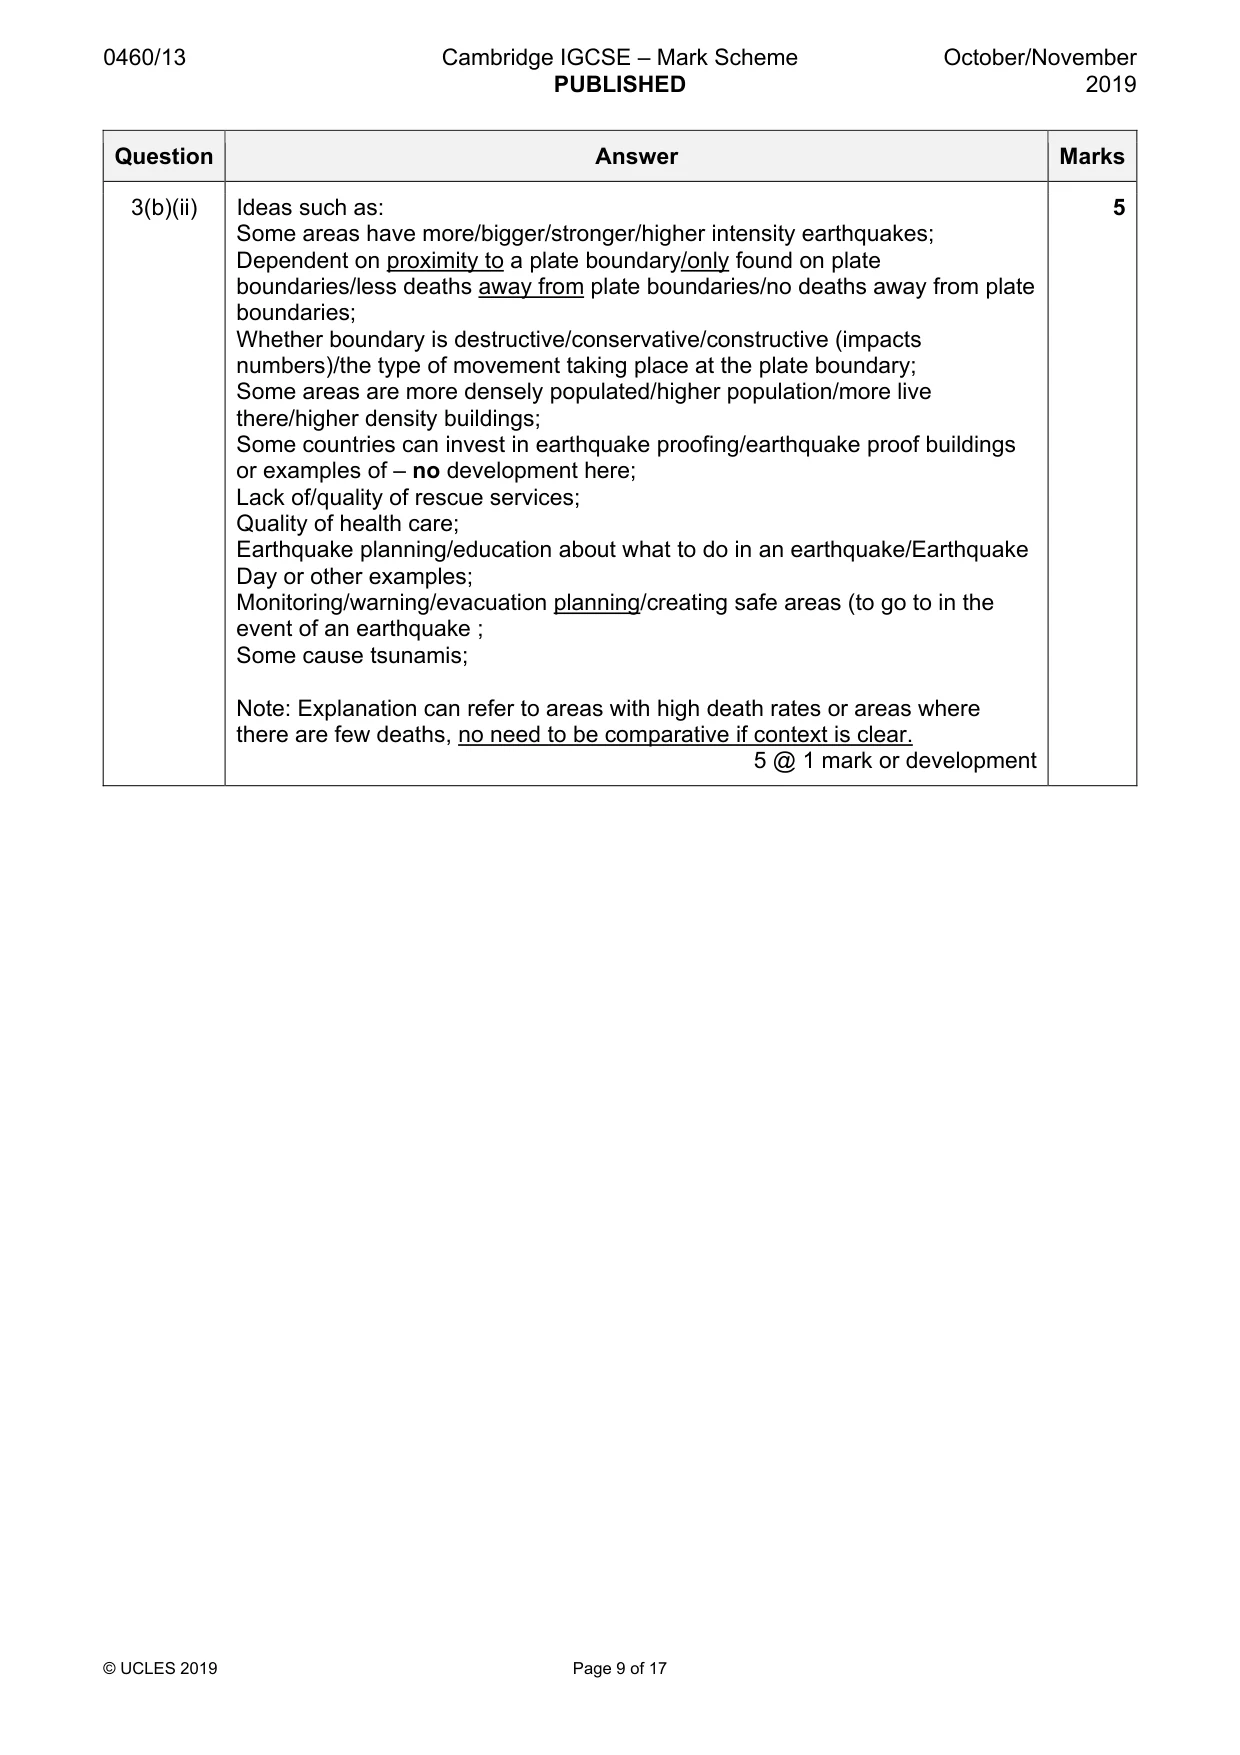
0460/13 Cambridge IGCSE – Mark Scheme PUBLISHED October/November 2019 © UCLES 2019 Page 9 of 17 Question Answer Marks 3(b)(ii) Ideas such as: Some areas have more/bigger/stronger/higher intensity earthquakes; Dependent on proximity to a plate boundary/only found on plate boundaries/less deaths away from plate boundaries/no deaths away from plate boundaries; Whether boundary is destructive/conservative/constructive (impacts numbers)/the type of movement taking place at the plate boundary; Some areas are more densely populated/higher population/more live there/higher density buildings; Some countries can invest in earthquake proofing/earthquake proof buildings or examples of – no development here; Lack of/quality of rescue services; Quality of health care; Earthquake planning/education about what to do in an earthquake/Earthquake Day or other examples; Monitoring/warning/evacuation planning/creating safe areas (to go to in the event of an earthquake ; Some cause tsunamis; Note: Explanation can refer to areas with high death rates or areas where there are few deaths, no need to be comparative if context is clear. 5 @ 1 mark or development 5
Mark scheme, page 10
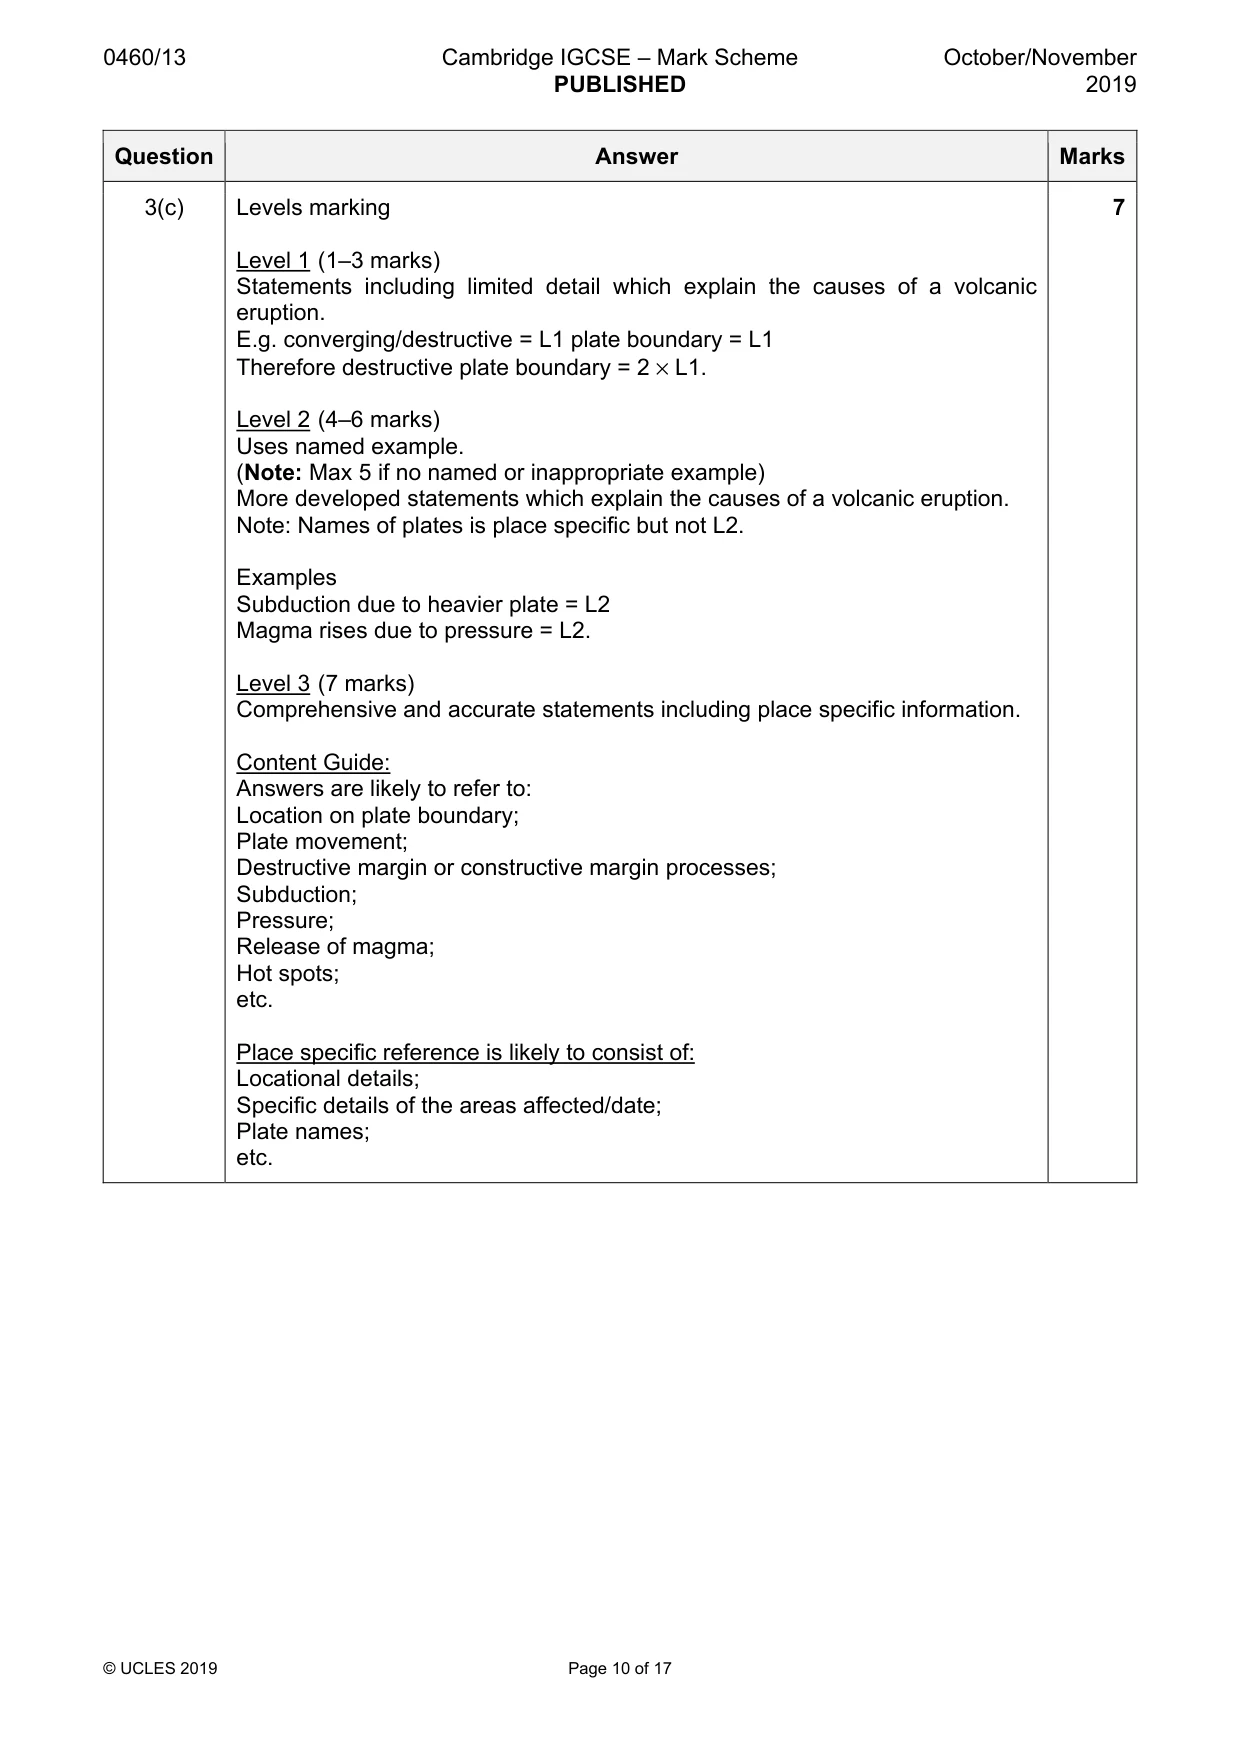
0460/13 Cambridge IGCSE – Mark Scheme PUBLISHED October/November 2019 © UCLES 2019 Page 10 of 17 Question Answer Marks 3(c) Levels marking Level 1 (1–3 marks) Statements including limited detail which explain the causes of a volcanic eruption. E.g. converging/destructive = L1 plate boundary = L1 Therefore destructive plate boundary = 2 × L1. Level 2 (4–6 marks) Uses named example. (Note: Max 5 if no named or inappropriate example) More developed statements which explain the causes of a volcanic eruption. Note: Names of plates is place specific but not L2. Examples Subduction due to heavier plate = L2 Magma rises due to pressure = L2. Level 3 (7 marks) Comprehensive and accurate statements including place specific information. Content Guide: Answers are likely to refer to: Location on plate boundary; Plate movement; Destructive margin or constructive margin processes; Subduction; Pressure; Release of magma; Hot spots; etc. Place specific reference is likely to consist of: Locational details; Specific details of the areas affected/date; Plate names; etc. 7
Mark scheme, page 11
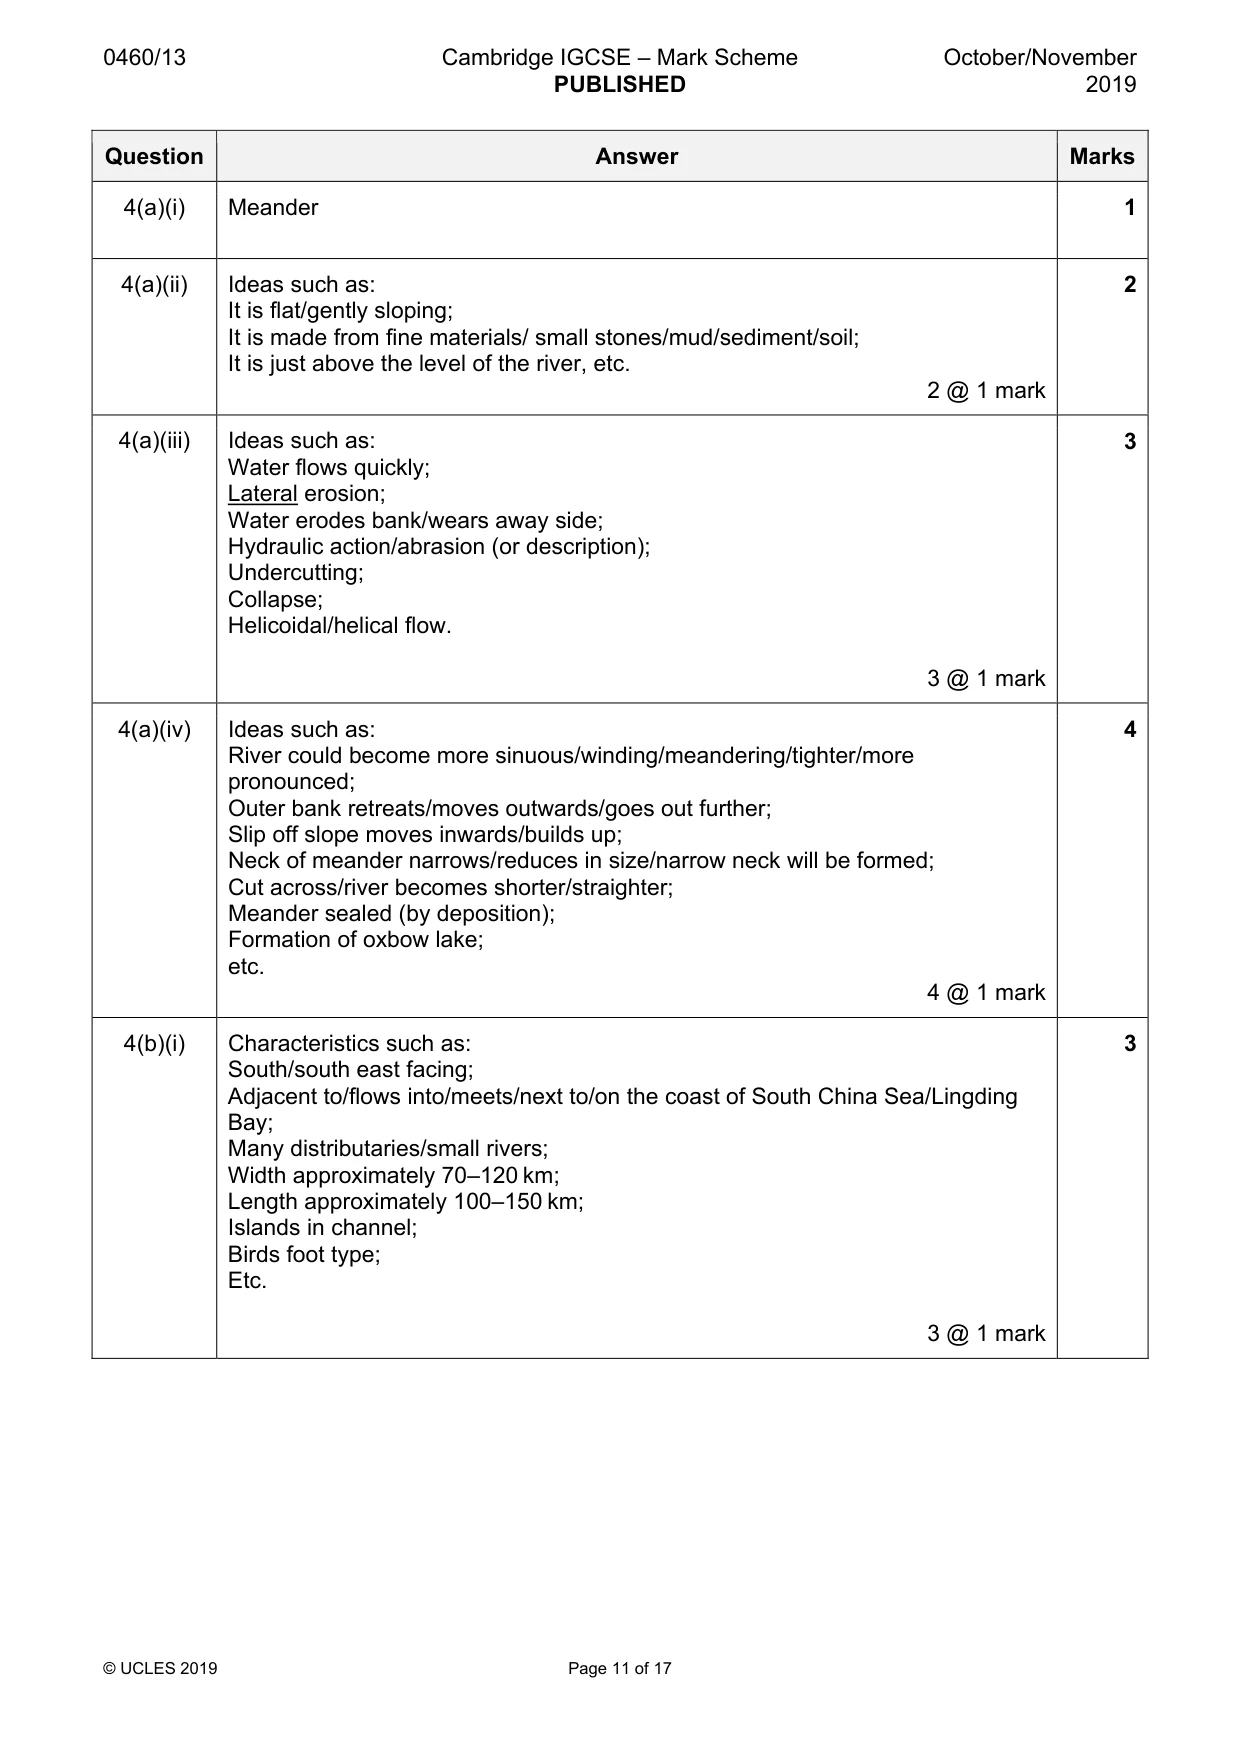
0460/13 Cambridge IGCSE – Mark Scheme PUBLISHED October/November 2019 © UCLES 2019 Page 11 of 17 Question Answer Marks 4(a)(i) Meander 1 4(a)(ii) Ideas such as: It is flat/gently sloping; It is made from fine materials/ small stones/mud/sediment/soil; It is just above the level of the river, etc. 2 @ 1 mark 2 4(a)(iii) Ideas such as: Water flows quickly; Lateral erosion; Water erodes bank/wears away side; Hydraulic action/abrasion (or description); Undercutting; Collapse; Helicoidal/helical flow. 3 @ 1 mark 3 4(a)(iv) Ideas such as: River could become more sinuous/winding/meandering/tighter/more pronounced; Outer bank retreats/moves outwards/goes out further; Slip off slope moves inwards/builds up; Neck of meander narrows/reduces in size/narrow neck will be formed; Cut across/river becomes shorter/straighter; Meander sealed (by deposition); Formation of oxbow lake; etc. 4 @ 1 mark 4 4(b)(i) Characteristics such as: South/south east facing; Adjacent to/flows into/meets/next to/on the coast of South China Sea/Lingding Bay; Many distributaries/small rivers; Width approximately 70–120 km; Length approximately 100–150 km; Islands in channel; Birds foot type; Etc. 3 @ 1 mark 3
Mark scheme, page 12
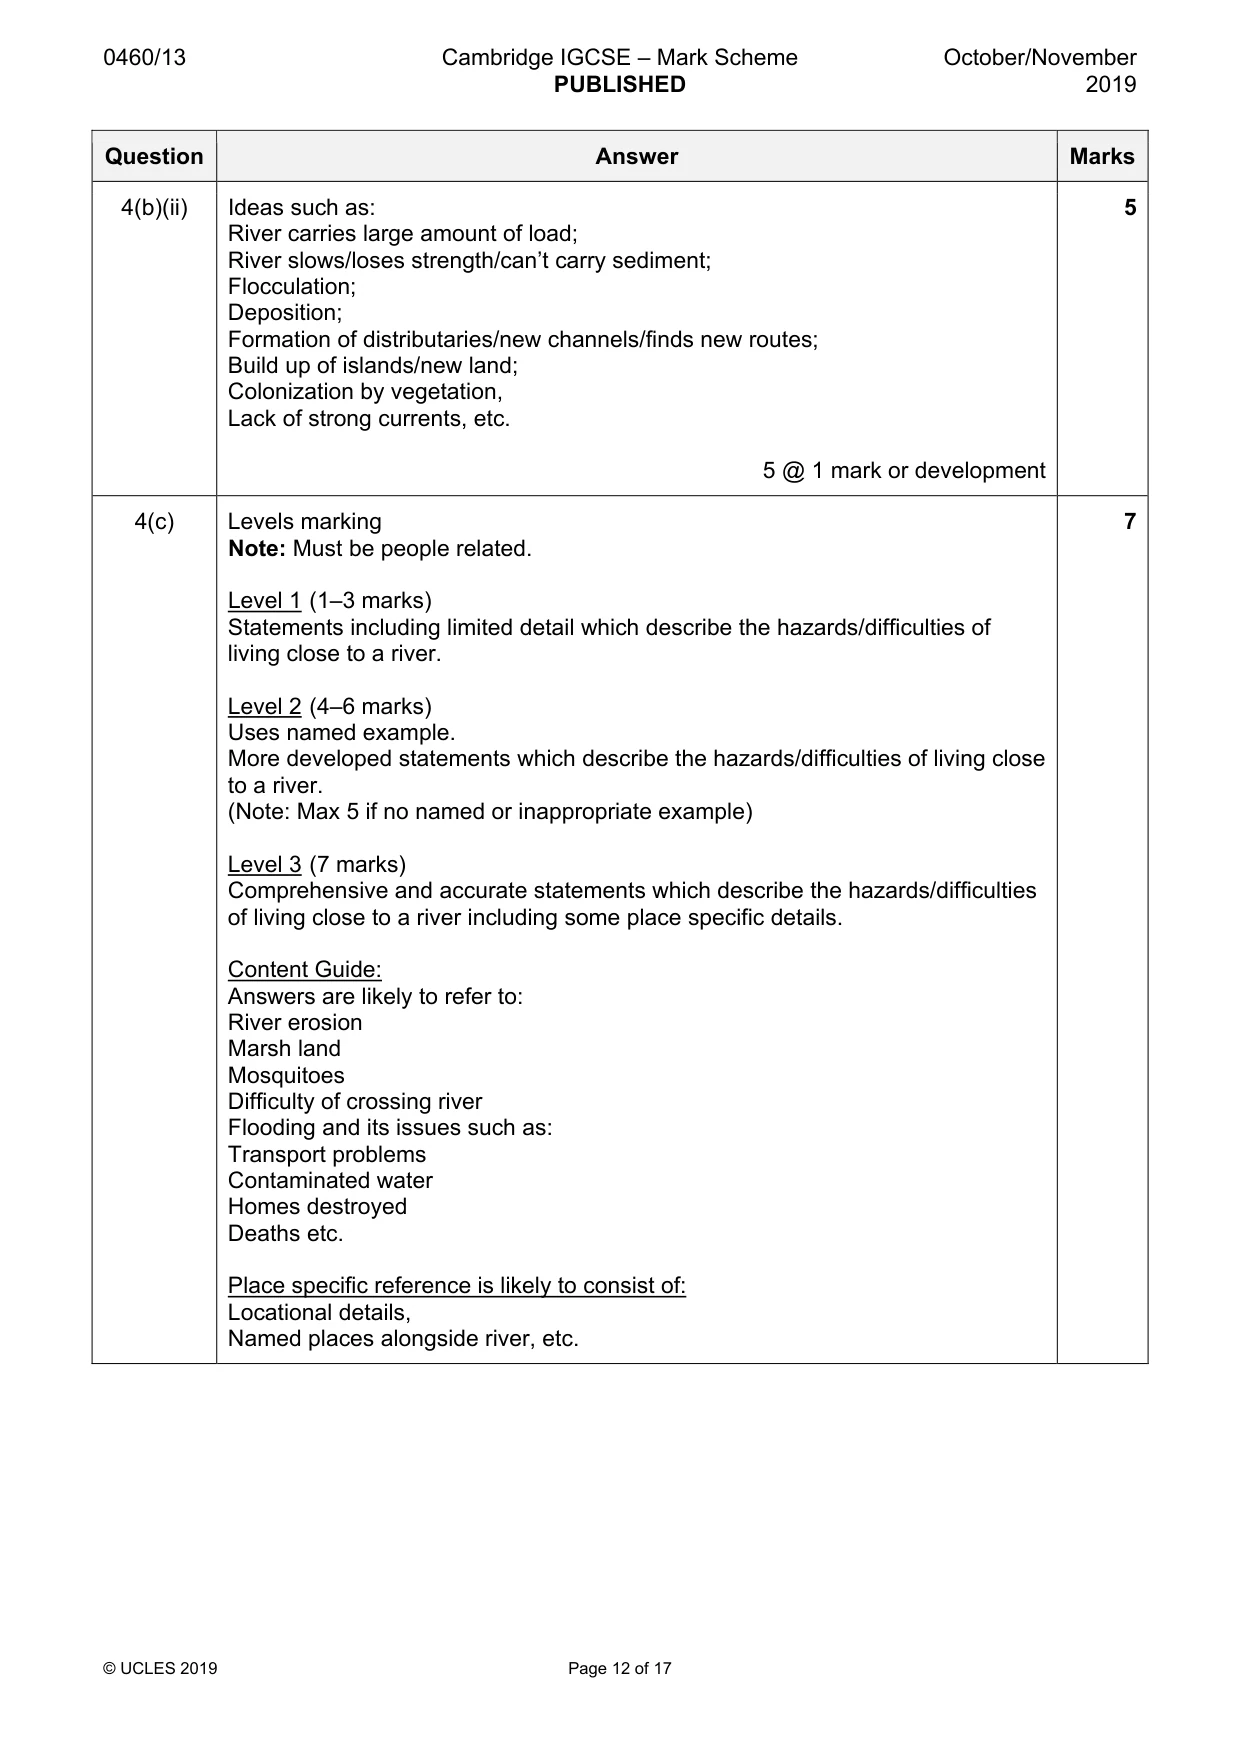
0460/13 Cambridge IGCSE – Mark Scheme PUBLISHED October/November 2019 © UCLES 2019 Page 12 of 17 Question Answer Marks 4(b)(ii) Ideas such as: River carries large amount of load; River slows/loses strength/can’t carry sediment; Flocculation; Deposition; Formation of distributaries/new channels/finds new routes; Build up of islands/new land; Colonization by vegetation, Lack of strong currents, etc. 5 @ 1 mark or development 5 4(c) Levels marking Note: Must be people related. Level 1 (1–3 marks) Statements including limited detail which describe the hazards/difficulties of living close to a river. Level 2 (4–6 marks) Uses named example. More developed statements which describe the hazards/difficulties of living close to a river. (Note: Max 5 if no named or inappropriate example) Level 3 (7 marks) Comprehensive and accurate statements which describe the hazards/difficulties of living close to a river including some place specific details. Content Guide: Answers are likely to refer to: River erosion Marsh land Mosquitoes Difficulty of crossing river Flooding and its issues such as: Transport problems Contaminated water Homes destroyed Deaths etc. Place specific reference is likely to consist of: Locational details, Named places alongside river, etc. 7
Mark scheme, page 13
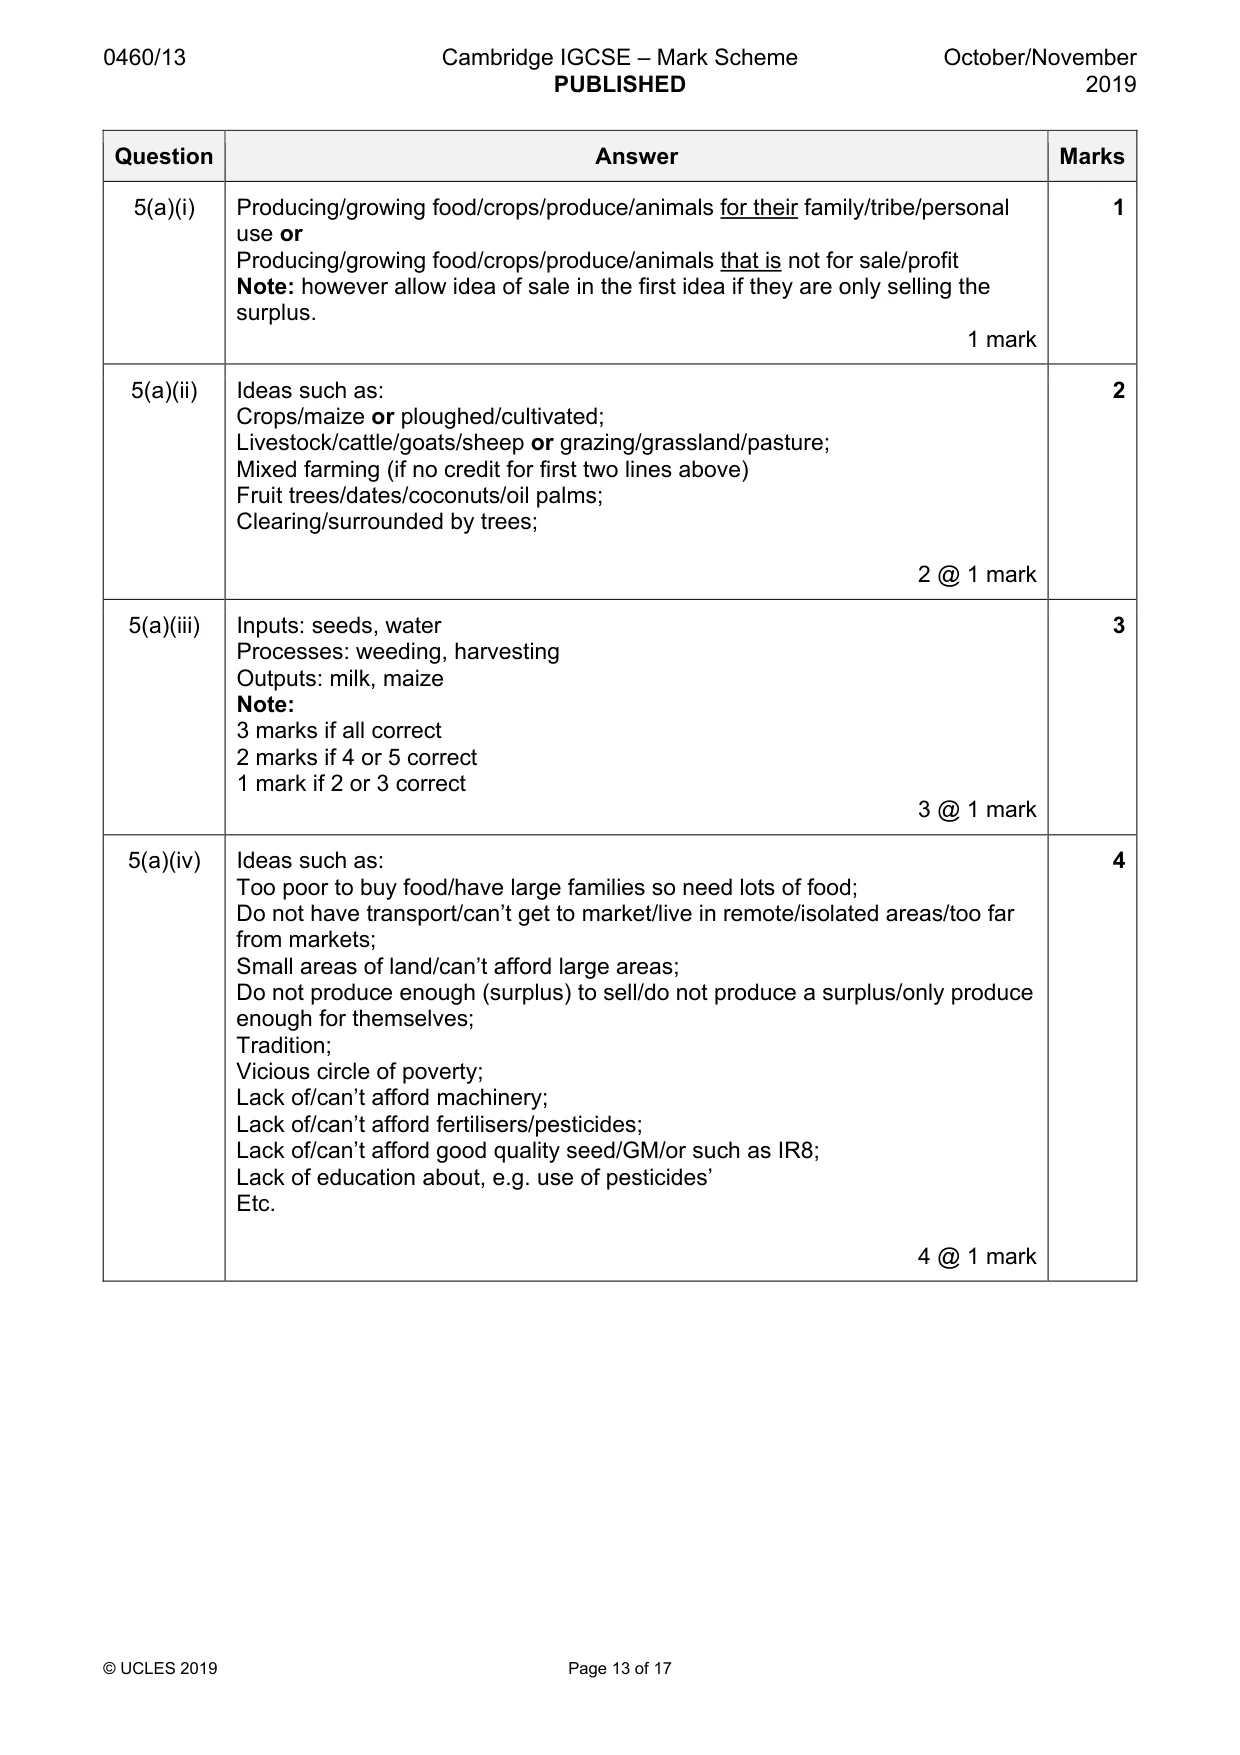
0460/13 Cambridge IGCSE – Mark Scheme PUBLISHED October/November 2019 © UCLES 2019 Page 13 of 17 Question Answer Marks 5(a)(i) Producing/growing food/crops/produce/animals for their family/tribe/personal use or Producing/growing food/crops/produce/animals that is not for sale/profit Note: however allow idea of sale in the first idea if they are only selling the surplus. 1 mark 1 5(a)(ii) Ideas such as: Crops/maize or ploughed/cultivated; Livestock/cattle/goats/sheep or grazing/grassland/pasture; Mixed farming (if no credit for first two lines above) Fruit trees/dates/coconuts/oil palms; Clearing/surrounded by trees; 2 @ 1 mark 2 5(a)(iii) Inputs: seeds, water Processes: weeding, harvesting Outputs: milk, maize Note: 3 marks if all correct 2 marks if 4 or 5 correct 1 mark if 2 or 3 correct 3 @ 1 mark 3 5(a)(iv) Ideas such as: Too poor to buy food/have large families so need lots of food; Do not have transport/can’t get to market/live in remote/isolated areas/too far from markets; Small areas of land/can’t afford large areas; Do not produce enough (surplus) to sell/do not produce a surplus/only produce enough for themselves; Tradition; Vicious circle of poverty; Lack of/can’t afford machinery; Lack of/can’t afford fertilisers/pesticides; Lack of/can’t afford good quality seed/GM/or such as IR8; Lack of education about, e.g. use of pesticides’ Etc. 4 @ 1 mark 4
Mark scheme, page 14
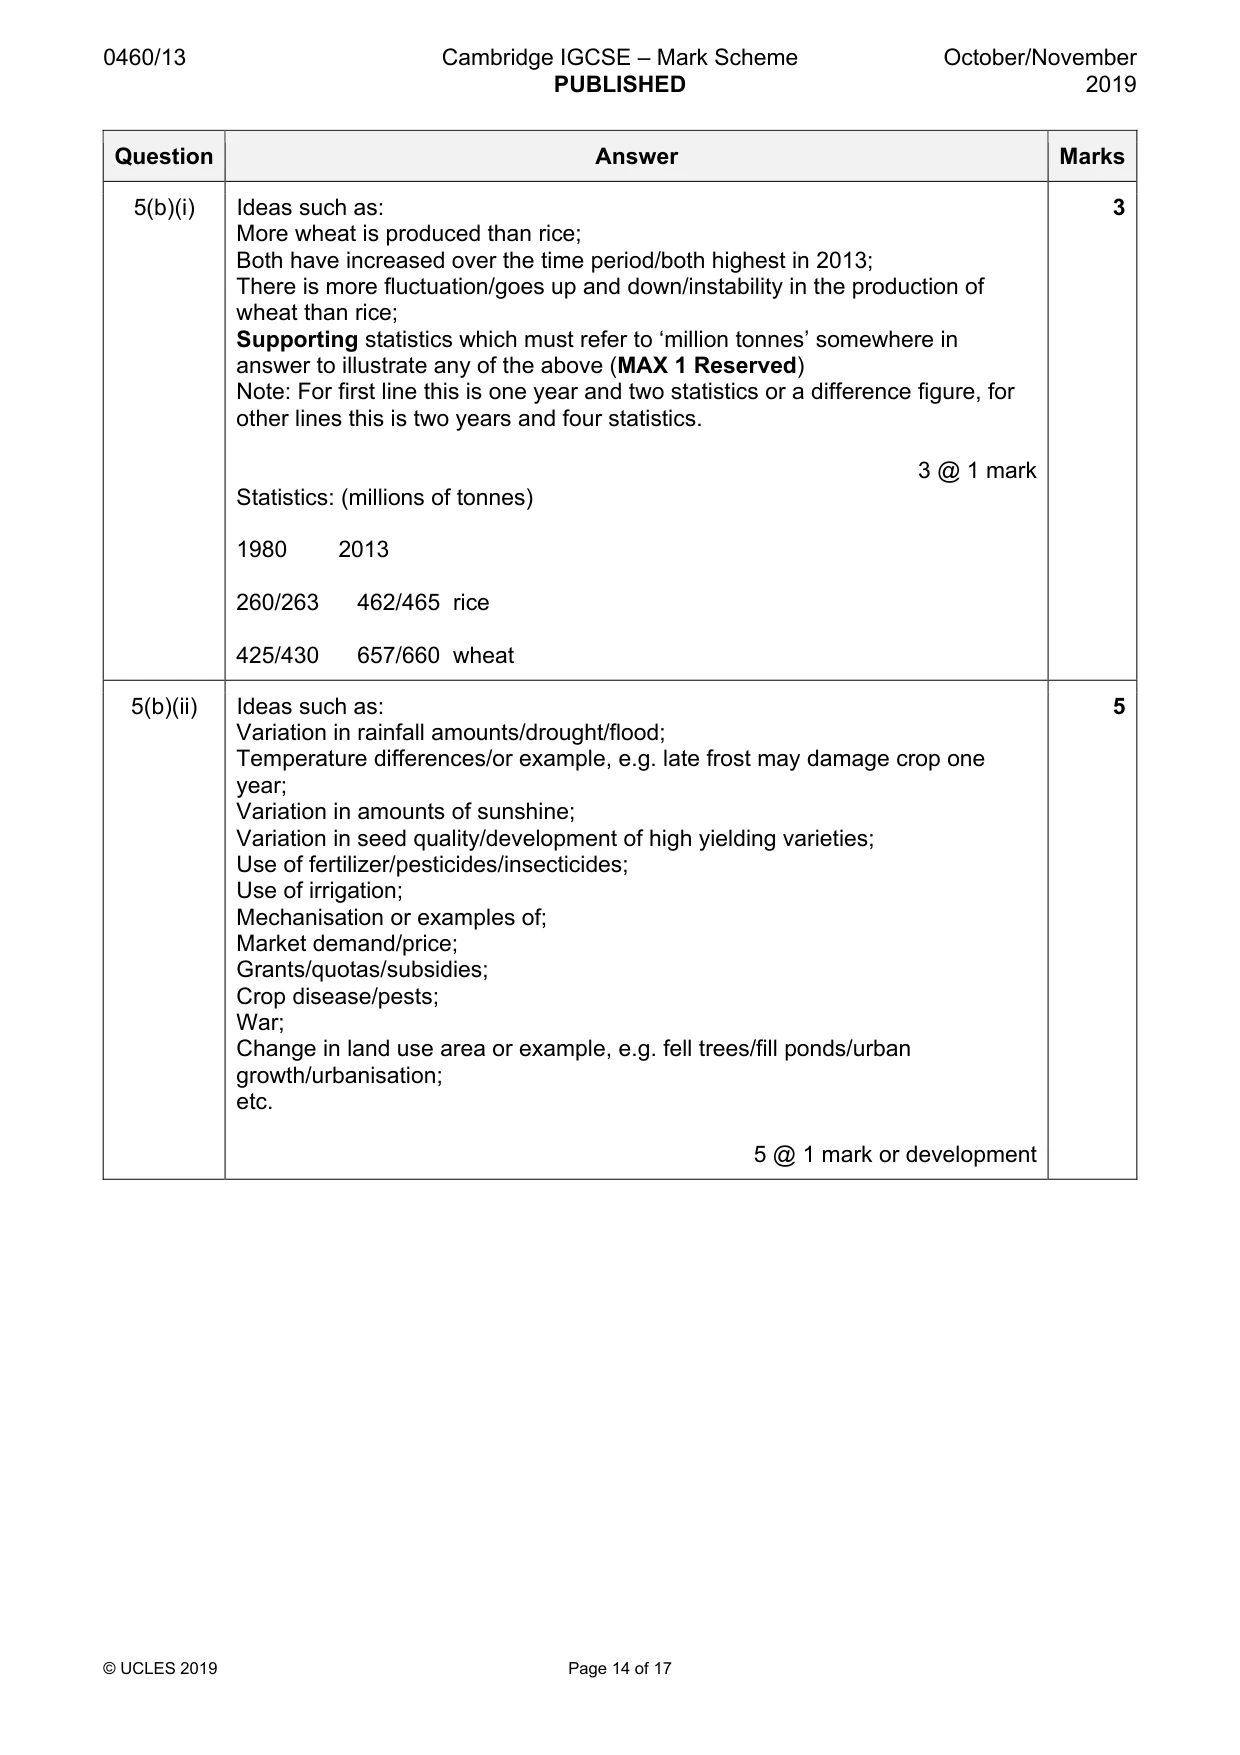
0460/13 Cambridge IGCSE – Mark Scheme PUBLISHED October/November 2019 © UCLES 2019 Page 14 of 17 Question Answer Marks 5(b)(i) Ideas such as: More wheat is produced than rice; Both have increased over the time period/both highest in 2013; There is more fluctuation/goes up and down/instability in the production of wheat than rice; Supporting statistics which must refer to ‘million tonnes’ somewhere in answer to illustrate any of the above (MAX 1 Reserved) Note: For first line this is one year and two statistics or a difference figure, for other lines this is two years and four statistics. 3 @ 1 mark Statistics: (millions of tonnes) 1980 2013 260/263 462/465 rice 425/430 657/660 wheat 3 5(b)(ii) Ideas such as: Variation in rainfall amounts/drought/flood; Temperature differences/or example, e.g. late frost may damage crop one year; Variation in amounts of sunshine; Variation in seed quality/development of high yielding varieties; Use of fertilizer/pesticides/insecticides; Use of irrigation; Mechanisation or examples of; Market demand/price; Grants/quotas/subsidies; Crop disease/pests; War; Change in land use area or example, e.g. fell trees/fill ponds/urban growth/urbanisation; etc. 5 @ 1 mark or development 5
Mark scheme, page 15
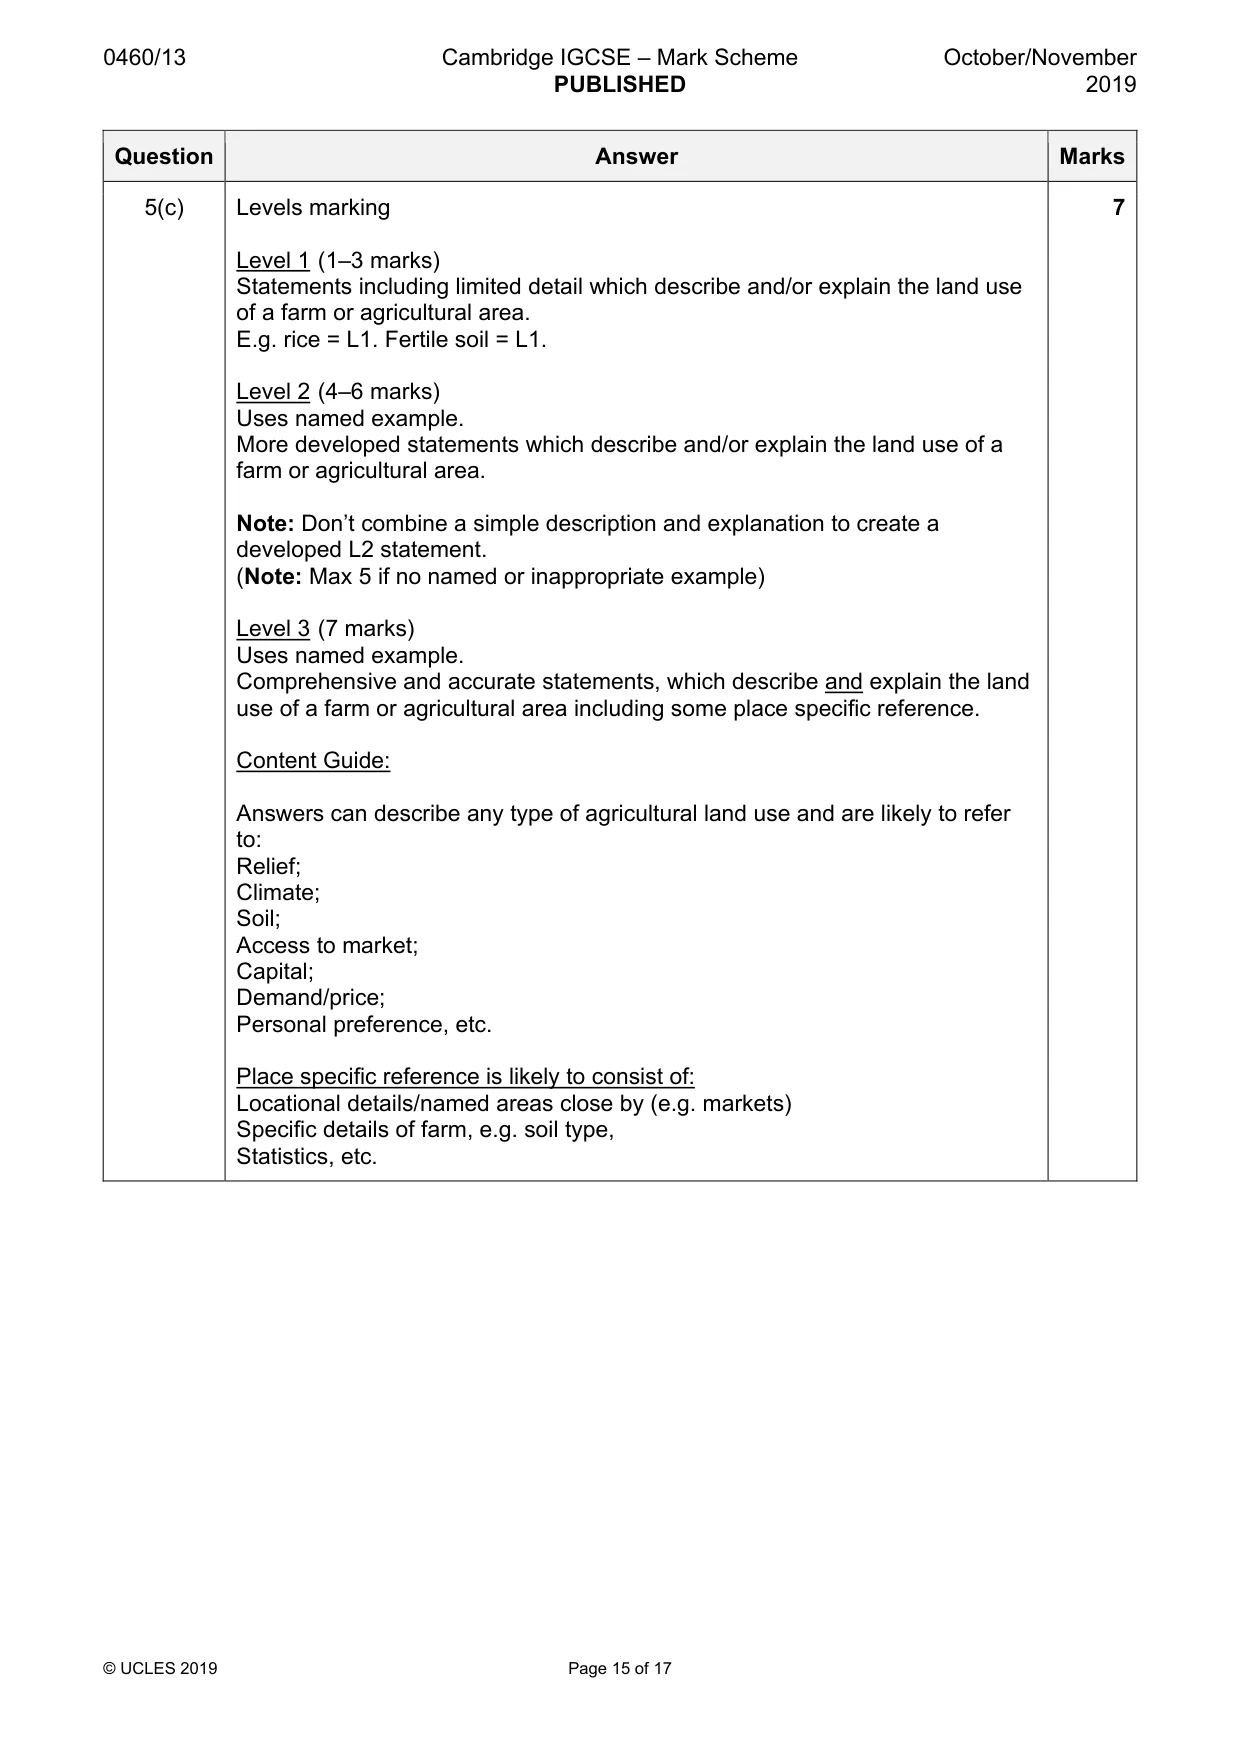
0460/13 Cambridge IGCSE – Mark Scheme PUBLISHED October/November 2019 © UCLES 2019 Page 15 of 17 Question Answer Marks 5(c) Levels marking Level 1 (1–3 marks) Statements including limited detail which describe and/or explain the land use of a farm or agricultural area. E.g. rice = L1. Fertile soil = L1. Level 2 (4–6 marks) Uses named example. More developed statements which describe and/or explain the land use of a farm or agricultural area. Note: Don’t combine a simple description and explanation to create a developed L2 statement. (Note: Max 5 if no named or inappropriate example) Level 3 (7 marks) Uses named example. Comprehensive and accurate statements, which describe and explain the land use of a farm or agricultural area including some place specific reference. Content Guide: Answers can describe any type of agricultural land use and are likely to refer to: Relief; Climate; Soil; Access to market; Capital; Demand/price; Personal preference, etc. Place specific reference is likely to consist of: Locational details/named areas close by (e.g. markets) Specific details of farm, e.g. soil type, Statistics, etc. 7
Mark scheme, page 16
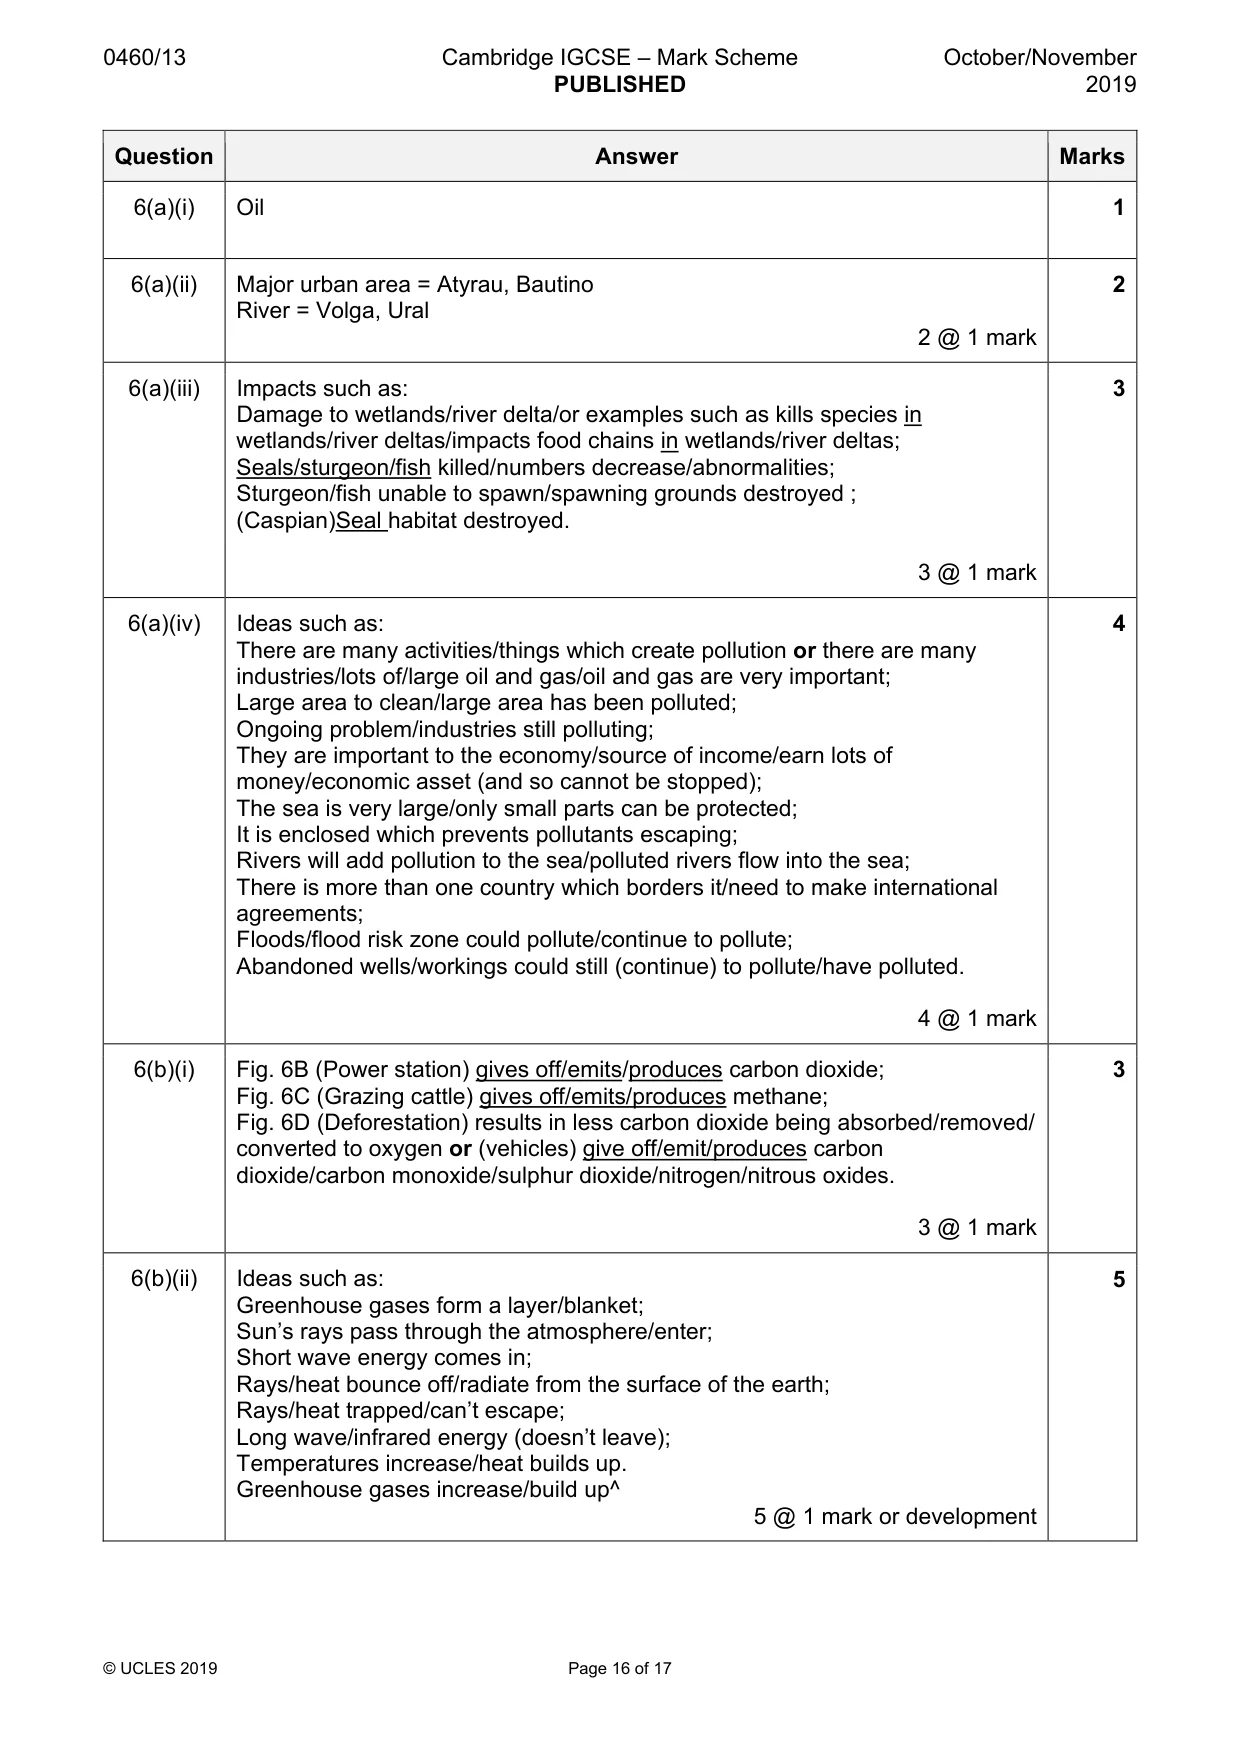
0460/13 Cambridge IGCSE – Mark Scheme PUBLISHED October/November 2019 © UCLES 2019 Page 16 of 17 Question Answer Marks 6(a)(i) Oil 1 6(a)(ii) Major urban area = Atyrau, Bautino River = Volga, Ural 2 @ 1 mark 2 6(a)(iii) Impacts such as: Damage to wetlands/river delta/or examples such as kills species in wetlands/river deltas/impacts food chains in wetlands/river deltas; Seals/sturgeon/fish killed/numbers decrease/abnormalities; Sturgeon/fish unable to spawn/spawning grounds destroyed ; (Caspian)Seal habitat destroyed. 3 @ 1 mark 3 6(a)(iv) Ideas such as: There are many activities/things which create pollution or there are many industries/lots of/large oil and gas/oil and gas are very important; Large area to clean/large area has been polluted; Ongoing problem/industries still polluting; They are important to the economy/source of income/earn lots of money/economic asset (and so cannot be stopped); The sea is very large/only small parts can be protected; It is enclosed which prevents pollutants escaping; Rivers will add pollution to the sea/polluted rivers flow into the sea; There is more than one country which borders it/need to make international agreements; Floods/flood risk zone could pollute/continue to pollute; Abandoned wells/workings could still (continue) to pollute/have polluted. 4 @ 1 mark 4 6(b)(i) Fig. 6B (Power station) gives off/emits/produces carbon dioxide; Fig. 6C (Grazing cattle) gives off/emits/produces methane; Fig. 6D (Deforestation) results in less carbon dioxide being absorbed/removed/ converted to oxygen or (vehicles) give off/emit/produces carbon dioxide/carbon monoxide/sulphur dioxide/nitrogen/nitrous oxides. 3 @ 1 mark 3 6(b)(ii) Ideas such as: Greenhouse gases form a layer/blanket; Sun’s rays pass through the atmosphere/enter; Short wave energy comes in; Rays/heat bounce off/radiate from the surface of the earth; Rays/heat trapped/can’t escape; Long wave/infrared energy (doesn’t leave); Temperatures increase/heat builds up. Greenhouse gases increase/build up^ 5 @ 1 mark or development 5
Mark scheme, page 17
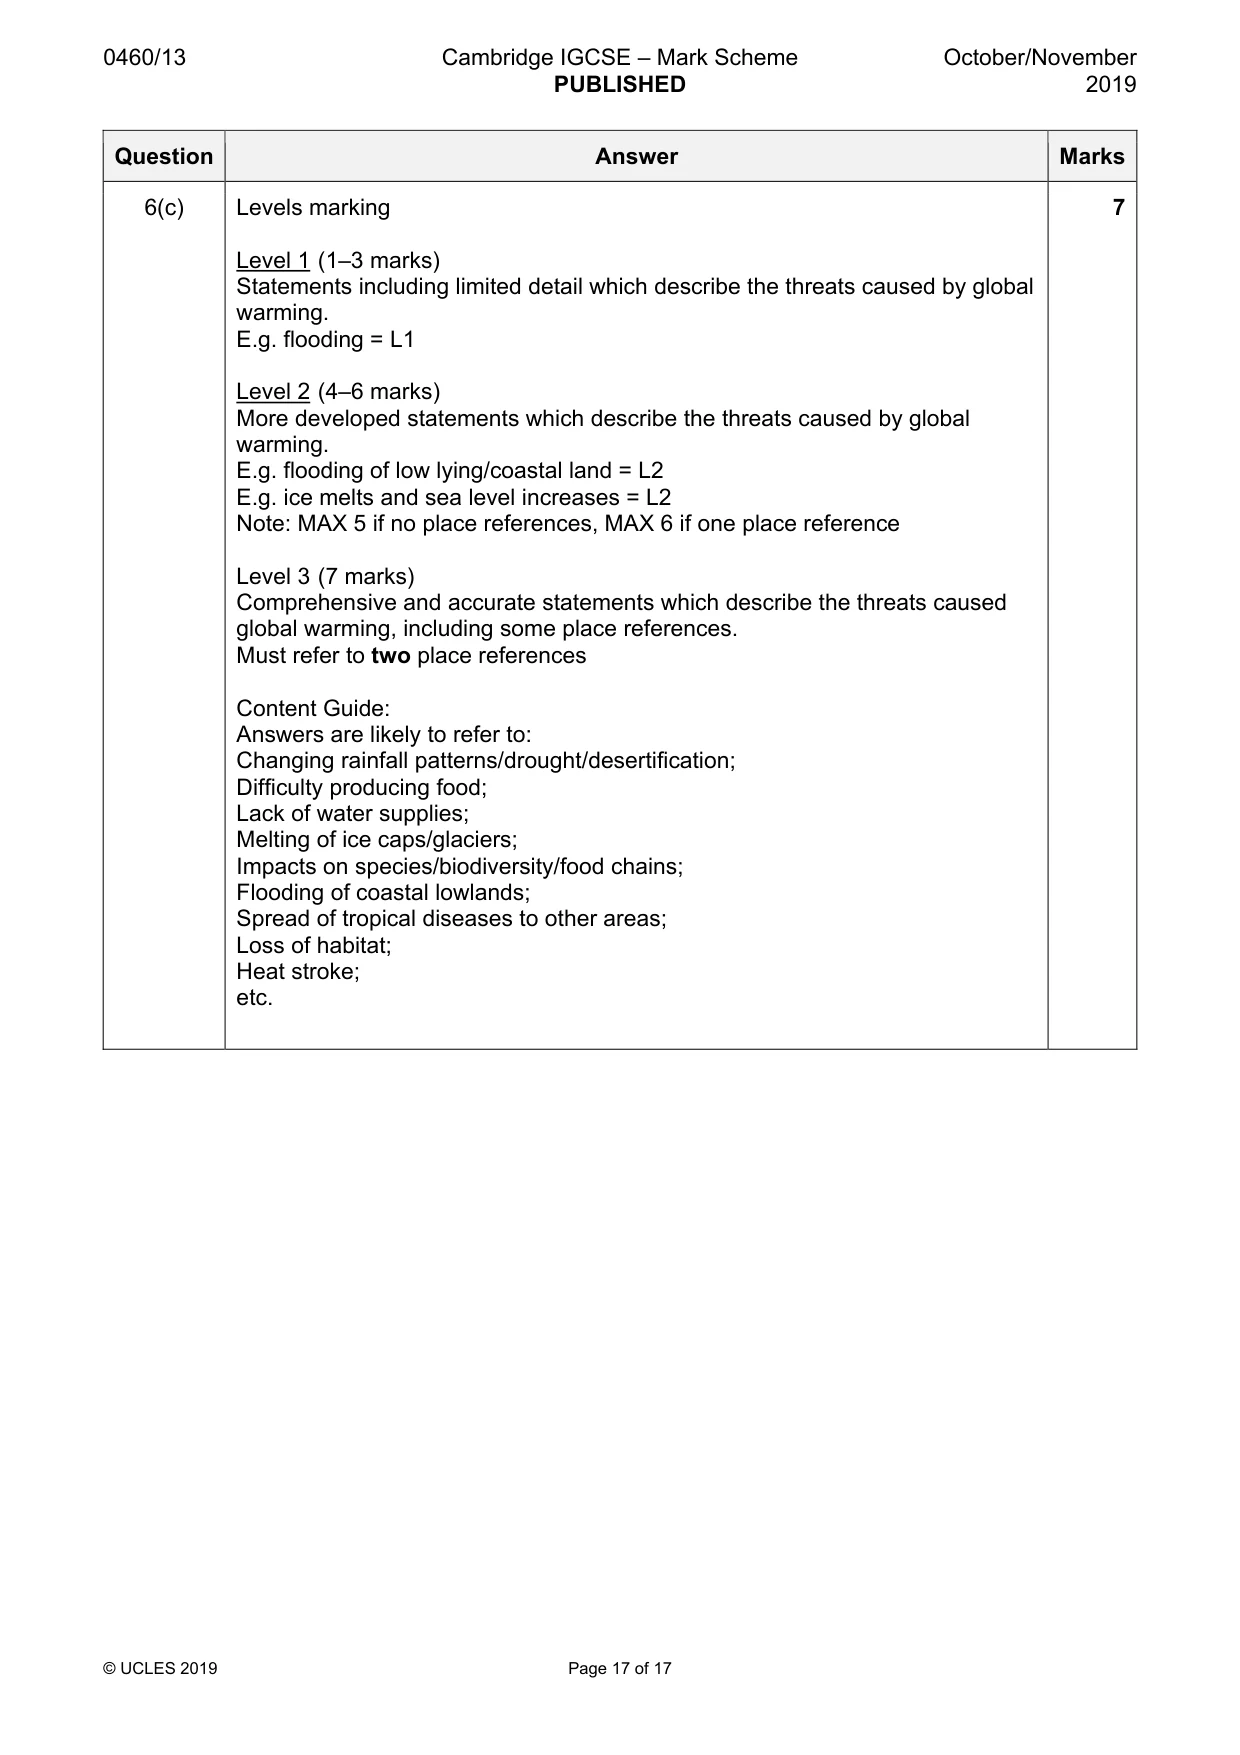
0460/13 Cambridge IGCSE – Mark Scheme PUBLISHED October/November 2019 © UCLES 2019 Page 17 of 17 Question Answer Marks 6(c) Levels marking Level 1 (1–3 marks) Statements including limited detail which describe the threats caused by global warming. E.g. flooding = L1 Level 2 (4–6 marks) More developed statements which describe the threats caused by global warming. E.g. flooding of low lying/coastal land = L2 E.g. ice melts and sea level increases = L2 Note: MAX 5 if no place references, MAX 6 if one place reference Level 3 (7 marks) Comprehensive and accurate statements which describe the threats caused global warming, including some place references. Must refer to two place references Content Guide: Answers are likely to refer to: Changing rainfall patterns/drought/desertification; Difficulty producing food; Lack of water supplies; Melting of ice caps/glaciers; Impacts on species/biodiversity/food chains; Flooding of coastal lowlands; Spread of tropical diseases to other areas; Loss of habitat; Heat stroke; etc. 7
What you needed in this session
Cambridge’s own grade thresholds for 2019 Oct/Nov, Paper 1 · Variant 3. A higher threshold means an easier paper — the bar moves with how the cohort did.