Cambridge IGCSE Geography 0460 — 2019 May/June Paper 1 · Variant 1
0460/11/M/J/19 · 75 marks · ≈84 min
The question paper and its mark scheme, free to read here and free to download. This is Cambridge’s own paper, exactly as it was sat.
Question paper32 pages









Mark scheme17 pages
Answers below. Sit the paper first if you are practising.
Paper as text
Question paper, page 1
This document consists of 30 printed pages, 2 blank pages and 1 Insert. DC (KS/CB) 162375/6 © UCLES 2019 [Turn over Cambridge Assessment International Education Cambridge International General Certificate of Secondary Education * 8 7 1 3 5 2 8 3 5 9 * This syllabus is regulated for use in England, Wales and Northern Ireland as a Cambridge International Level 1/Level 2 Certificate. GEOGRAPHY 0460/11 Paper 1 May/June 2019 1 hour 45 minutes Candidates answer on the Question Paper. Additional Materials: Ruler Calculator Protractor READ THESE INSTRUCTIONS FIRST Write your centre number, candidate number and name in the spaces provided. Write in dark blue or black pen. You may use an HB pencil for any diagrams or graphs. Do not use staples, paper clips, glue or correction fluid. DO NOT WRITE IN ANY BARCODES. Write your answer to each question in the space provided. If additional space is required, you should use the lined pages at the end of this booklet. The question number(s) must be clearly shown. Answer three questions, one from each section. The Insert contains Fig. 1.1 for Question 1, Figs. 3.1 and 3.3 for Question 3, and Figs. 6.1 and 6.2 for Question 6. The Insert is not required by the Examiner. Sketch maps and diagrams should be drawn whenever they serve to illustrate an answer. At the end of the examination, fasten all your work securely together. The number of marks is given in brackets [ ] at the end of each question or part question. Definitions MEDCs – More Economically Developed Countries LEDCs – Less Economically Developed Countries
Question paper, page 2
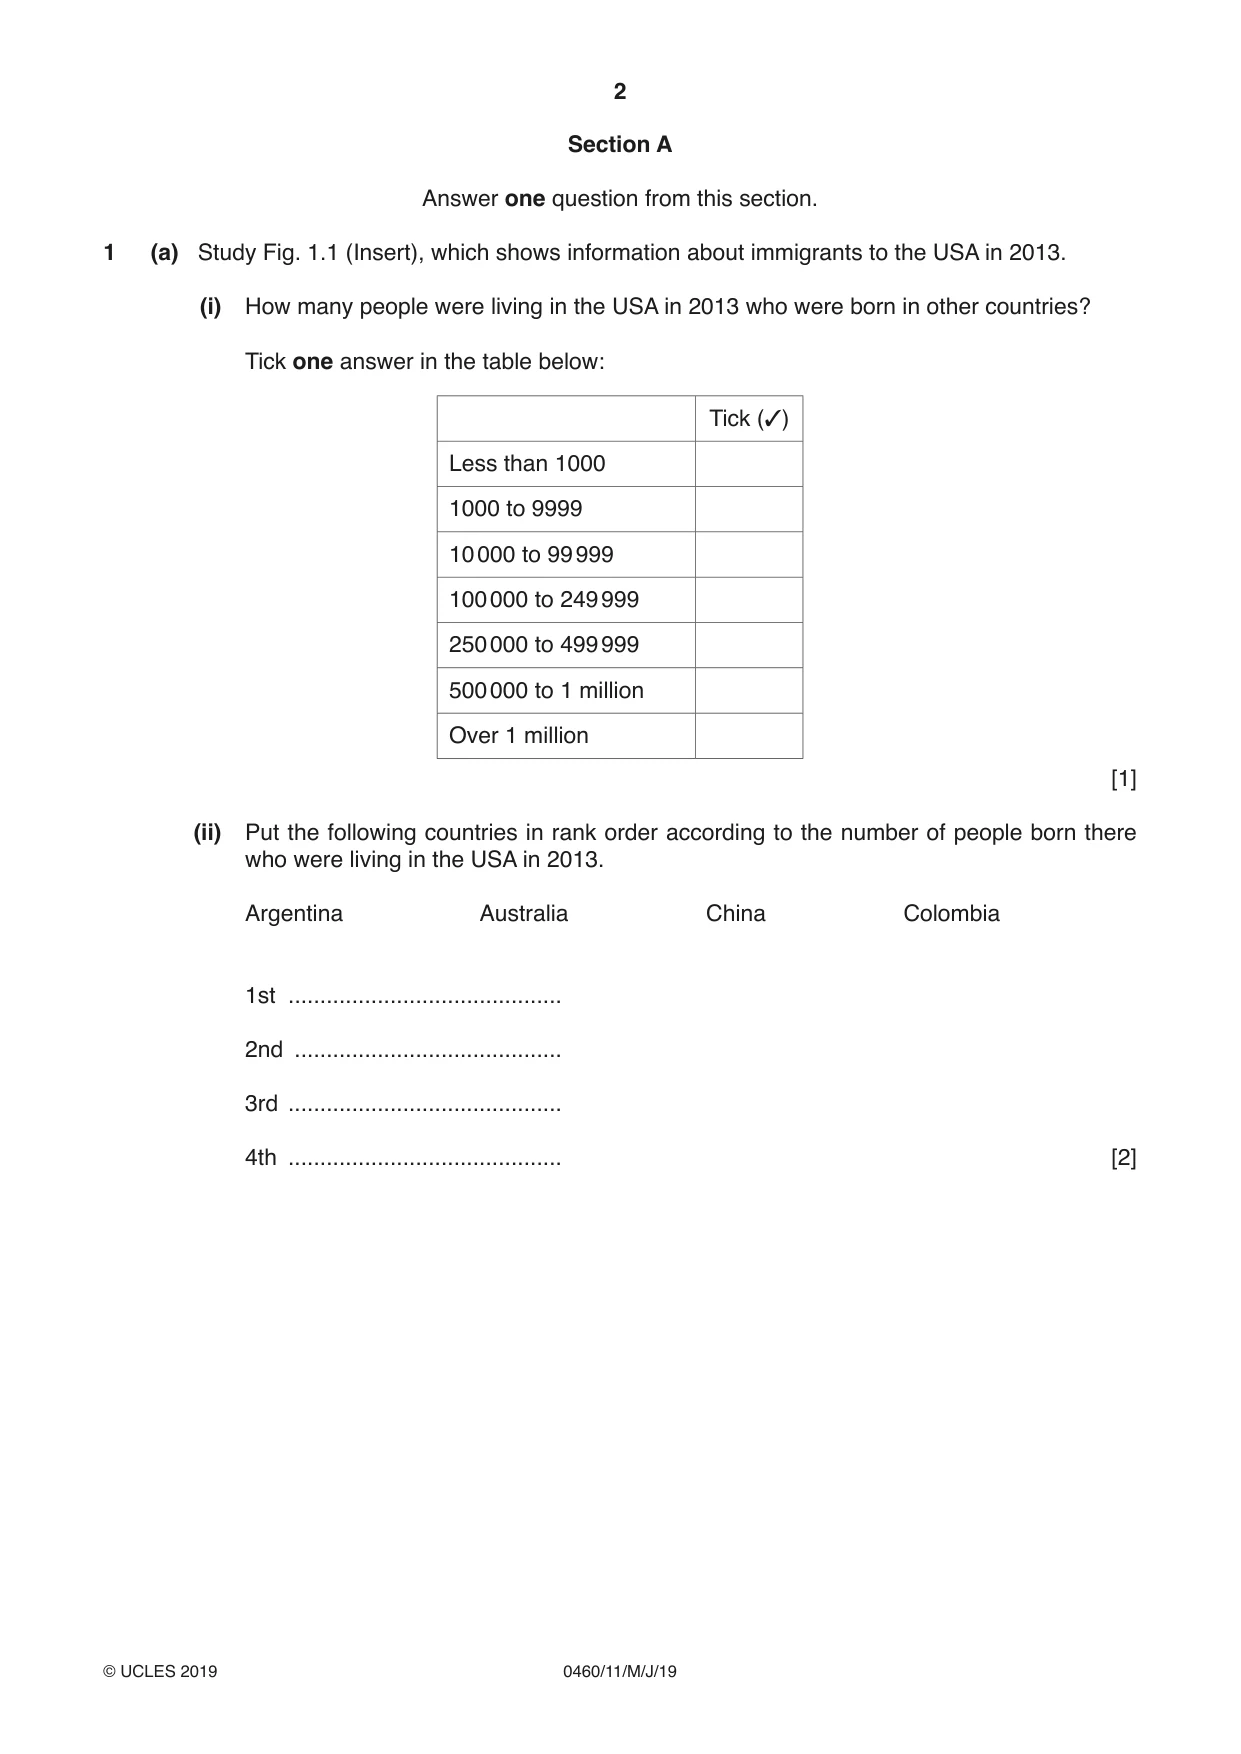
2 0460/11/M/J/19 © UCLES 2019 Section A Answer one question from this section. 1 (a) Study Fig. 1.1 (Insert), which shows information about immigrants to the USA in 2013. (i) How many people were living in the USA in 2013 who were born in other countries? Tick one answer in the table below: Tick (✓) Less than 1000 1000 to 9999 10 000 to 99 999 100 000 to 249 999 250 000 to 499 999 500 000 to 1 million Over 1 million [1] (ii) Put the following countries in rank order according to the number of people born there who were living in the USA in 2013. Argentina Australia China Colombia 1st … 2nd … 3rd … 4th … [2]
Question paper, page 3
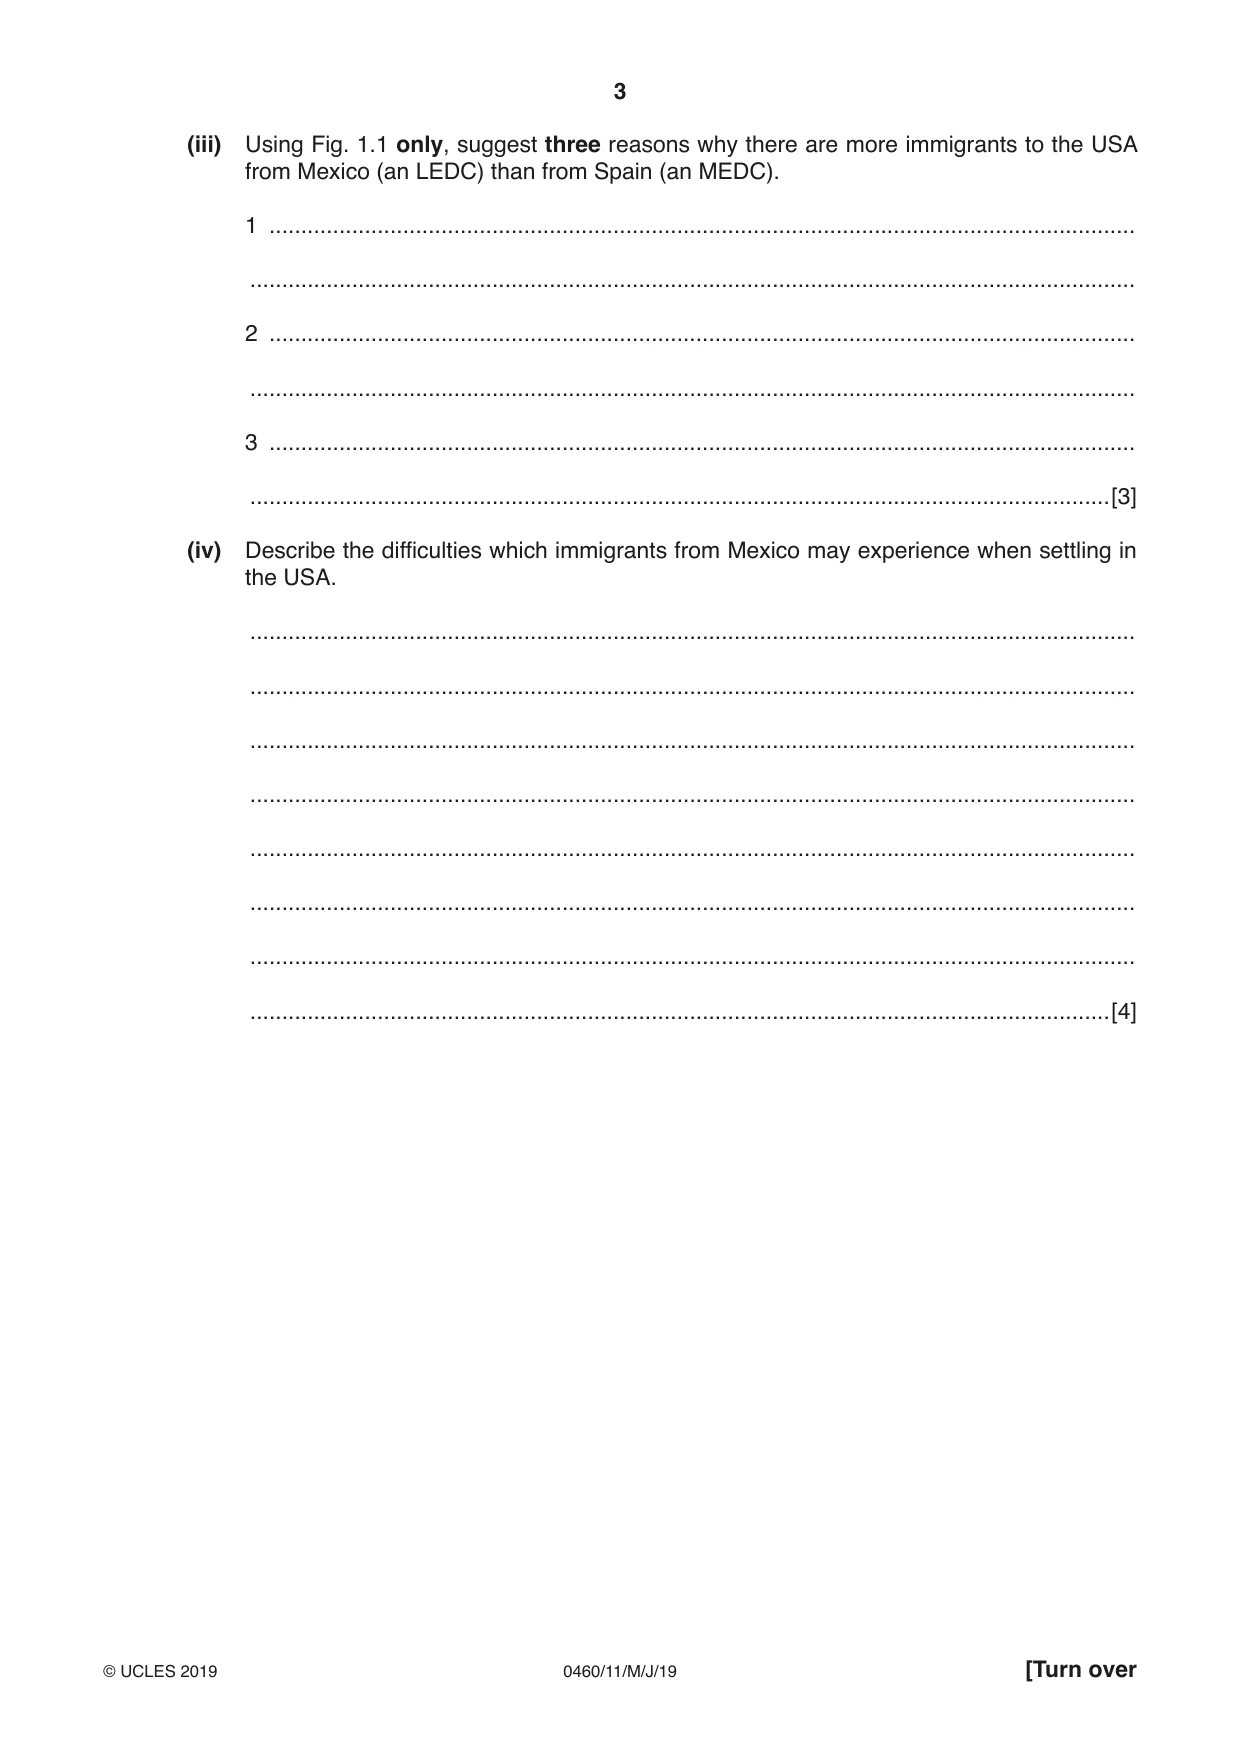
3 0460/11/M/J/19 © UCLES 2019 [Turn over (iii) Using Fig. 1.1 only, suggest three reasons why there are more immigrants to the USA from Mexico (an LEDC) than from Spain (an MEDC). 1 … … 2 … … 3 … …[3] (iv) Describe the difficulties which immigrants from Mexico may experience when settling in the USA. … … … … … … … …[4]
Question paper, page 4
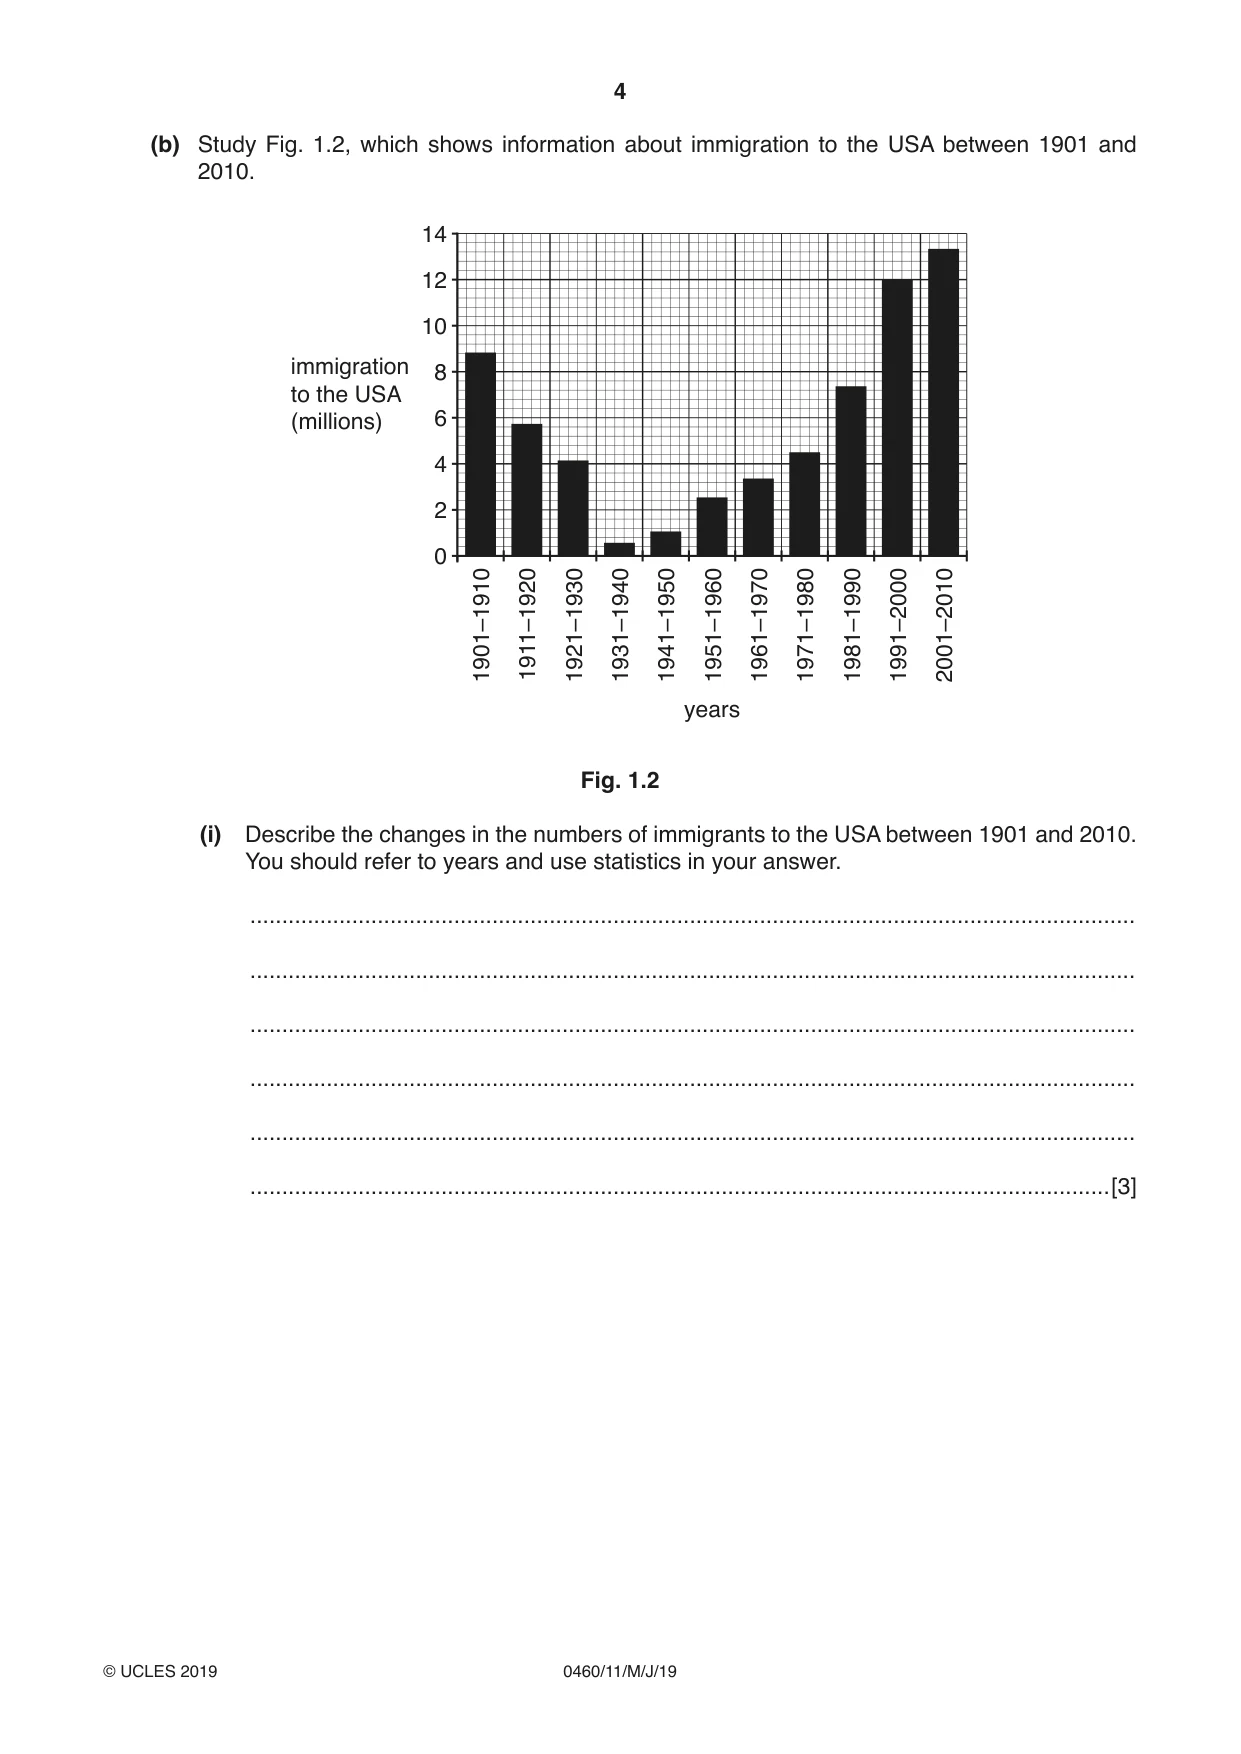
4 0460/11/M/J/19 © UCLES 2019 (b) Study Fig. 1.2, which shows information about immigration to the USA between 1901 and 2010. immigration to the USA (millions) 1901–1910 1911–1920 1921–1930 1931–1940 1941–1950 1951–1960 1961–1970 1971–1980 1981–1990 1991–2000 2001–2010 years 0 2 4 6 8 10 12 14 Fig. 1.2 (i) Describe the changes in the numbers of immigrants to the USA between 1901 and 2010. You should refer to years and use statistics in your answer. … … … … … …[3]
Question paper, page 5
5 0460/11/M/J/19 © UCLES 2019 [Turn over (ii) Explain how a large amount of immigration is likely to create challenges for countries receiving migrants such as the USA. … … … … … … … … … …[5]
Question paper, page 6
6 0460/11/M/J/19 © UCLES 2019 (c) For a named country you have studied, describe a policy which has been used to influence its population growth. Name of country … … … … … … … … … … … … … … … … … … … … … … … … …[7] [Total: 25]
Question paper, page 7
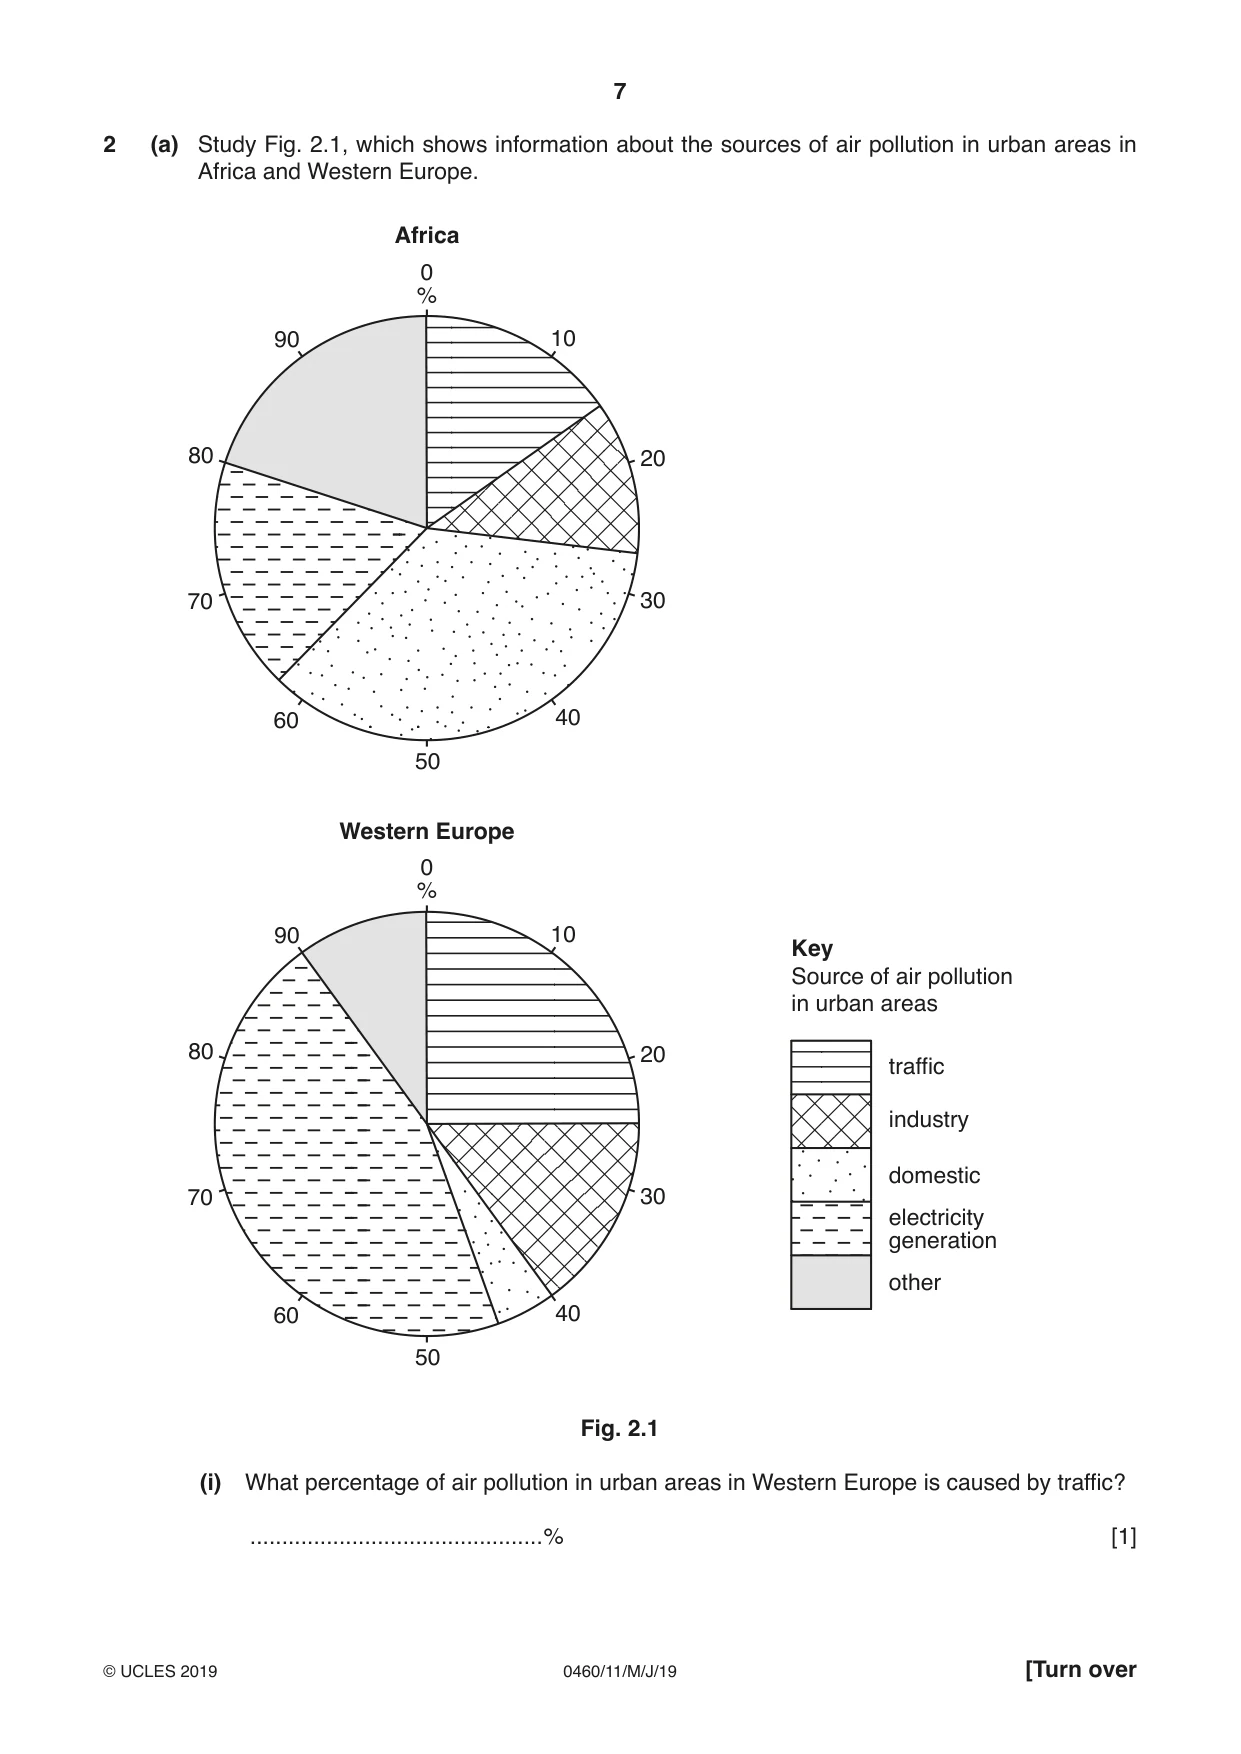
7 0460/11/M/J/19 © UCLES 2019 [Turn over 2 (a) Study Fig. 2.1, which shows information about the sources of air pollution in urban areas in Africa and Western Europe. 0 % 10 20 30 40 50 60 70 80 90 Africa 0 % 10 20 30 40 50 60 70 80 90 Western Europe Key Source of air pollution in urban areas traffic industry domestic electricity generation other Fig. 2.1 (i) What percentage of air pollution in urban areas in Western Europe is caused by traffic? …% [1]
Question paper, page 8
8 0460/11/M/J/19 © UCLES 2019 (ii) Explain how traffic and industry may each cause air pollution. Traffic … … Industry … …[2] (iii) Using evidence from Fig. 2.1 only, compare sources of air pollution in urban areas in Africa and Western Europe. … … … … … …[3] (iv) Suggest reasons for the differences in the sources of air pollution in urban areas in Africa and Western Europe. … … … … … … … …[4]
Question paper, page 9
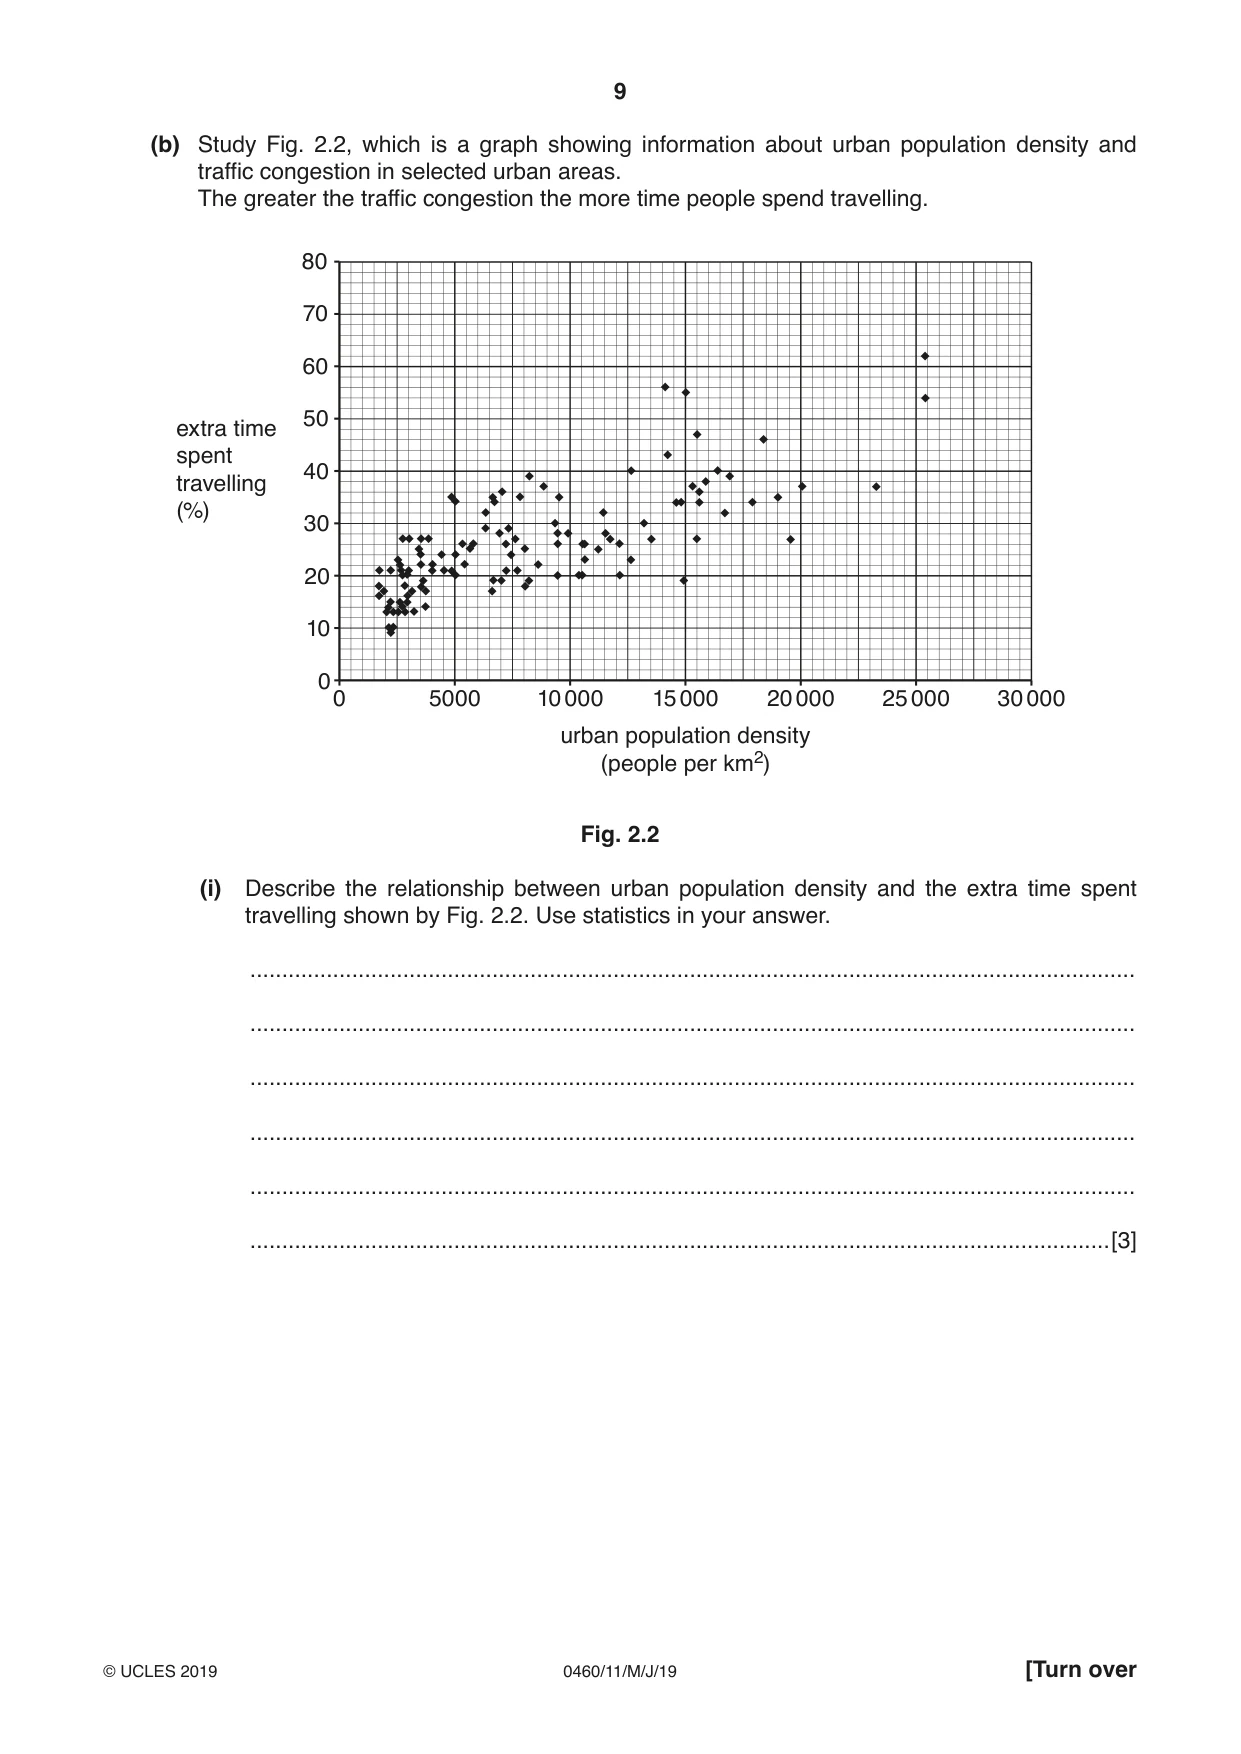
9 0460/11/M/J/19 © UCLES 2019 [Turn over (b) Study Fig. 2.2, which is a graph showing information about urban population density and traffic congestion in selected urban areas. The greater the traffic congestion the more time people spend travelling. extra time spent travelling (%) 00 5000 10 000 urban population density (people per km2) 15 000 20 000 25 000 30 000 10 20 30 40 50 60 70 80 Fig. 2.2 (i) Describe the relationship between urban population density and the extra time spent travelling shown by Fig. 2.2. Use statistics in your answer. … … … … … …[3]
Question paper, page 10
10 0460/11/M/J/19 © UCLES 2019 (ii) Explain why traffic congestion is a problem in many urban areas. … … … … … … … … … …[5]
Question paper, page 11
11 0460/11/M/J/19 © UCLES 2019 [Turn over (c) For a named urban area you have studied, describe the strategies used to reduce traffic congestion. Name of urban area … … … … … … … … … … … … … … … … … … … … … … … … … …[7] [Total: 25]
Question paper, page 12
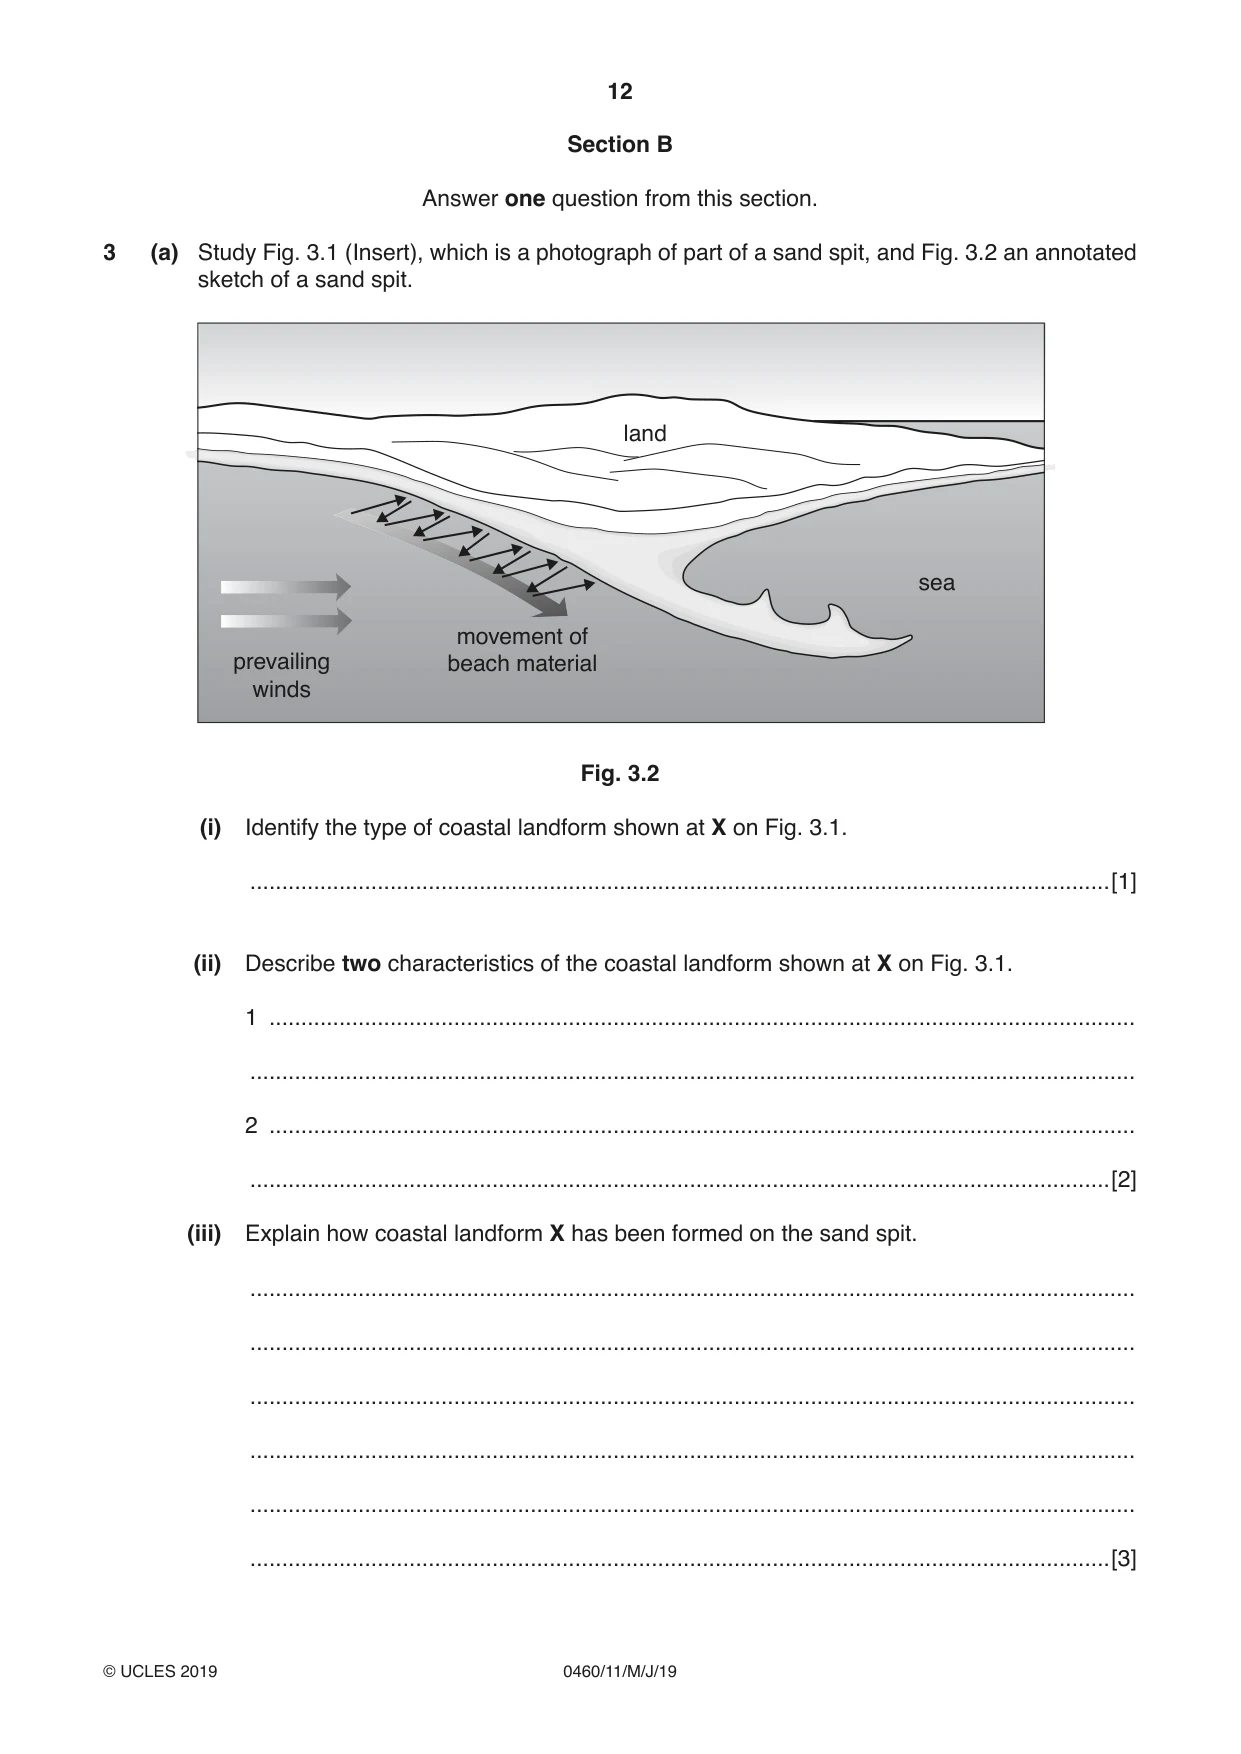
12 0460/11/M/J/19 © UCLES 2019 Section B Answer one question from this section. 3 (a) Study Fig. 3.1 (Insert), which is a photograph of part of a sand spit, and Fig. 3.2 an annotated sketch of a sand spit. movement of beach material land sea prevailing winds Fig. 3.2 (i) Identify the type of coastal landform shown at X on Fig. 3.1. …[1] (ii) Describe two characteristics of the coastal landform shown at X on Fig. 3.1. 1 … … 2 … …[2] (iii) Explain how coastal landform X has been formed on the sand spit. … … … … … …[3]
Question paper, page 13
13 0460/11/M/J/19 © UCLES 2019 [Turn over (iv) Explain how a sand spit is formed. … … … … … … … …[4] (b) Study Fig. 3.3 (Insert), which is a photograph of an area of coastline which has been affected by coastal erosion. (i) Identify the coastal landforms labelled P, Q and R on Fig. 3.3 in the spaces below. P … Q … R … [3] (ii) Describe the processes of coastal erosion. … … … … … … … … … …[5]
Question paper, page 14
14 0460/11/M/J/19 © UCLES 2019 (c) For a named area of coast you have studied, describe the strategies used to manage coastal erosion. Name of area of coast … … … … … … … … … … … … … … … … … … … … … … … … … …[7] [Total: 25]
Question paper, page 15
15 0460/11/M/J/19 © UCLES 2019 [Turn over TURN PAGE FOR QUESTION 4
Question paper, page 16
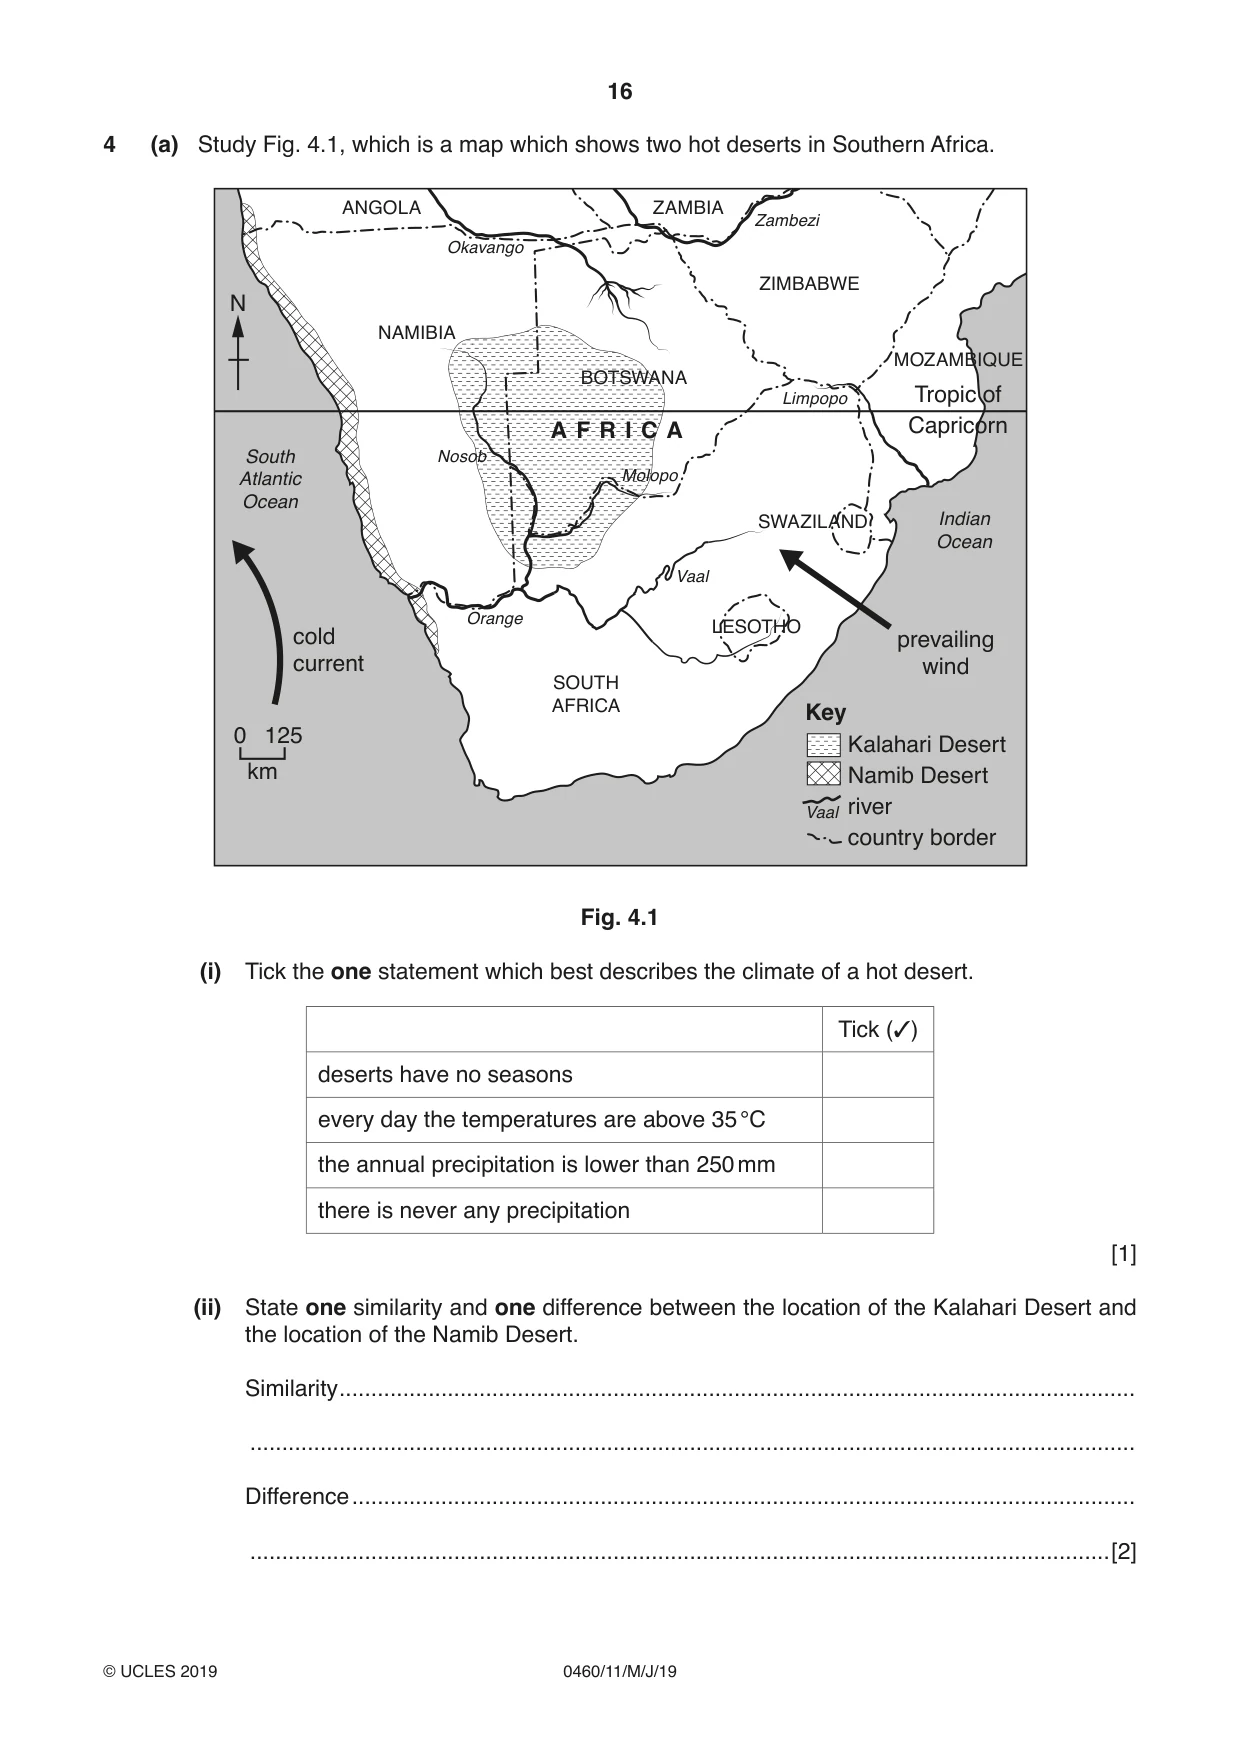
16 0460/11/M/J/19 © UCLES 2019 4 (a) Study Fig. 4.1, which is a map which shows two hot deserts in Southern Africa. Vaal SOUTH AFRICA NAMIBIA BOTSWANA Vaal Limpopo Zambezi Okavango Nosob Orange Molopo SWAZILAND MOZAMBIQUE ZIMBABWE ZAMBIA ANGOLA LESOTHO Indian Ocean A F R I C A South Atlantic Ocean prevailing wind Key Kalahari Desert Namib Desert river country border Tropic of Capricorn cold current 0 km 125 N Fig. 4.1 (i) Tick the one statement which best describes the climate of a hot desert. Tick (✓) deserts have no seasons every day the temperatures are above 35 °C the annual precipitation is lower than 250 mm there is never any precipitation [1] (ii) State one similarity and one difference between the location of the Kalahari Desert and the location of the Namib Desert. Similarity … … Difference … …[2]
Question paper, page 17
17 0460/11/M/J/19 © UCLES 2019 [Turn over (iii) Explain why deserts, such as the Kalahari, have a high diurnal (daily) range of temperature. … … … … … …[3] (iv) Using evidence from Fig. 4.1 and your own knowledge, explain why the Namib Desert does not receive much rainfall. … … … … … … … …[4]
Question paper, page 18
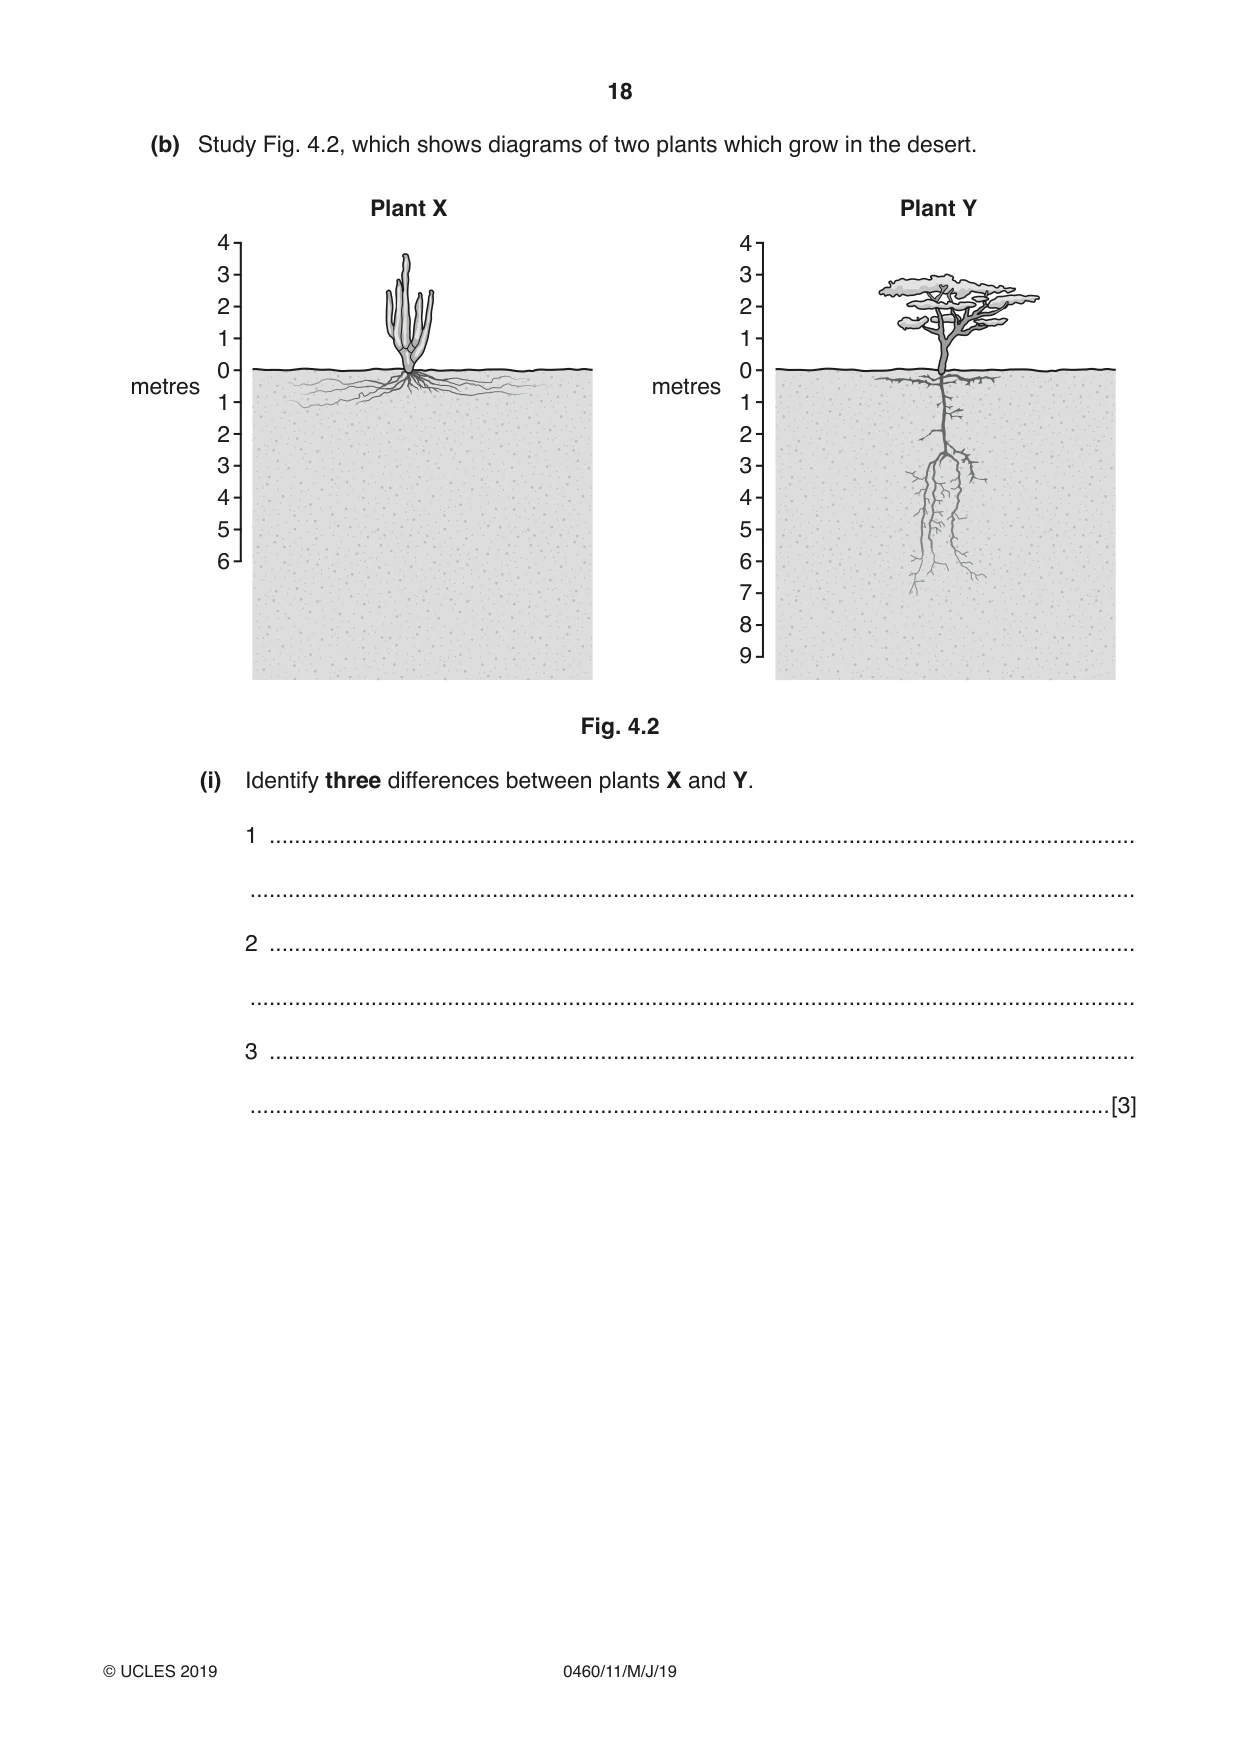
18 0460/11/M/J/19 © UCLES 2019 (b) Study Fig. 4.2, which shows diagrams of two plants which grow in the desert. 6 5 4 3 2 1 0 metres metres 1 2 3 4 6 7 8 9 5 4 3 2 1 0 Plant X Plant Y 1 2 3 4 Fig. 4.2 (i) Identify three differences between plants X and Y. 1 … … 2 … … 3 … …[3]
Question paper, page 19
19 0460/11/M/J/19 © UCLES 2019 [Turn over (ii) Explain how plants and wildlife are able to survive in a hot desert. … … … … … … … … … …[5]
Question paper, page 20
20 0460/11/M/J/19 © UCLES 2019 (c) For a named area of tropical rainforest, describe the characteristics of its ecosystem. Name of area of rainforest … … … … … … … … … … … … … … … … … … … … … … … … … … …[7] [Total: 25]
Question paper, page 21
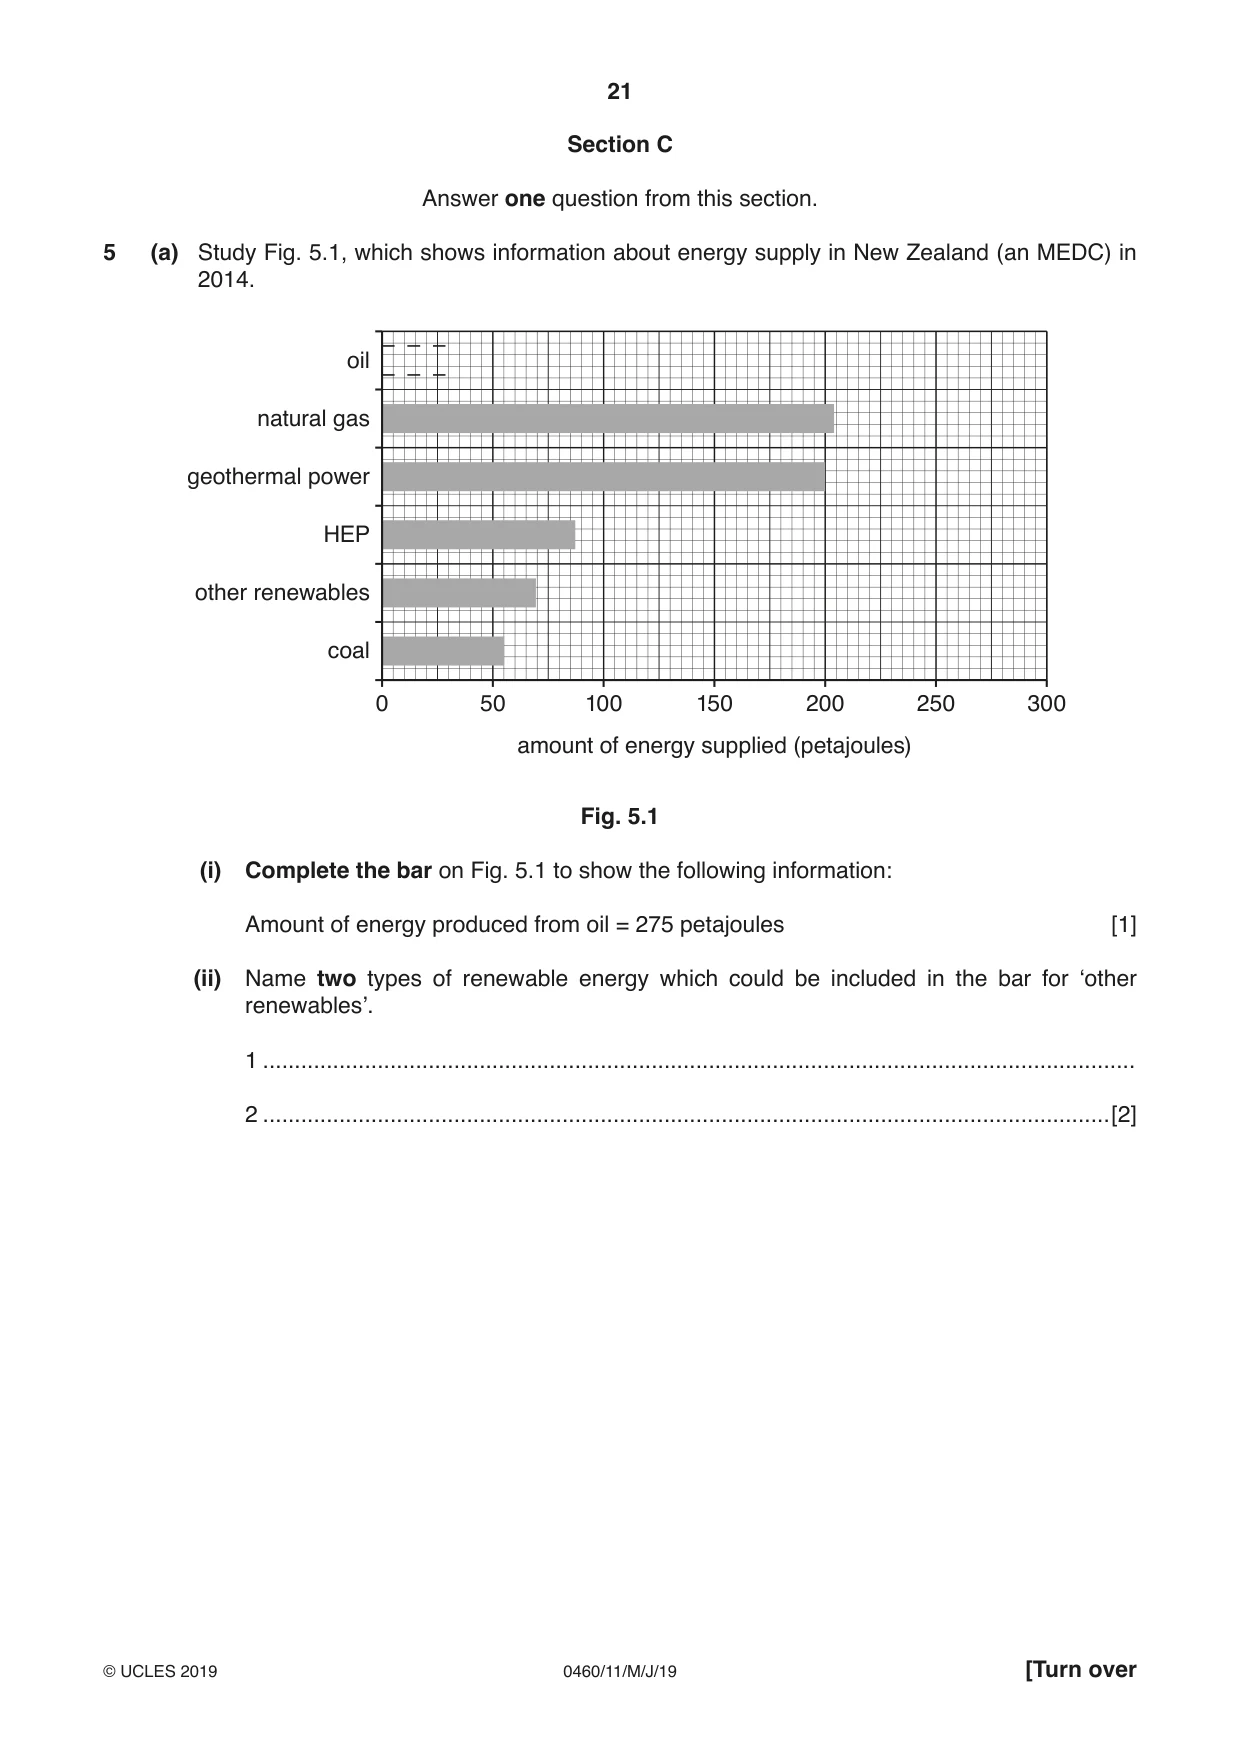
21 0460/11/M/J/19 © UCLES 2019 [Turn over Section C Answer one question from this section. 5 (a) Study Fig. 5.1, which shows information about energy supply in New Zealand (an MEDC) in 2014. oil natural gas geothermal power other renewables coal HEP 0 50 100 150 200 amount of energy supplied (petajoules) 250 300 Fig. 5.1 (i) Complete the bar on Fig. 5.1 to show the following information: Amount of energy produced from oil = 275 petajoules [1] (ii) Name two types of renewable energy which could be included in the bar for ‘other renewables’. 1 … 2 …[2]
Question paper, page 22
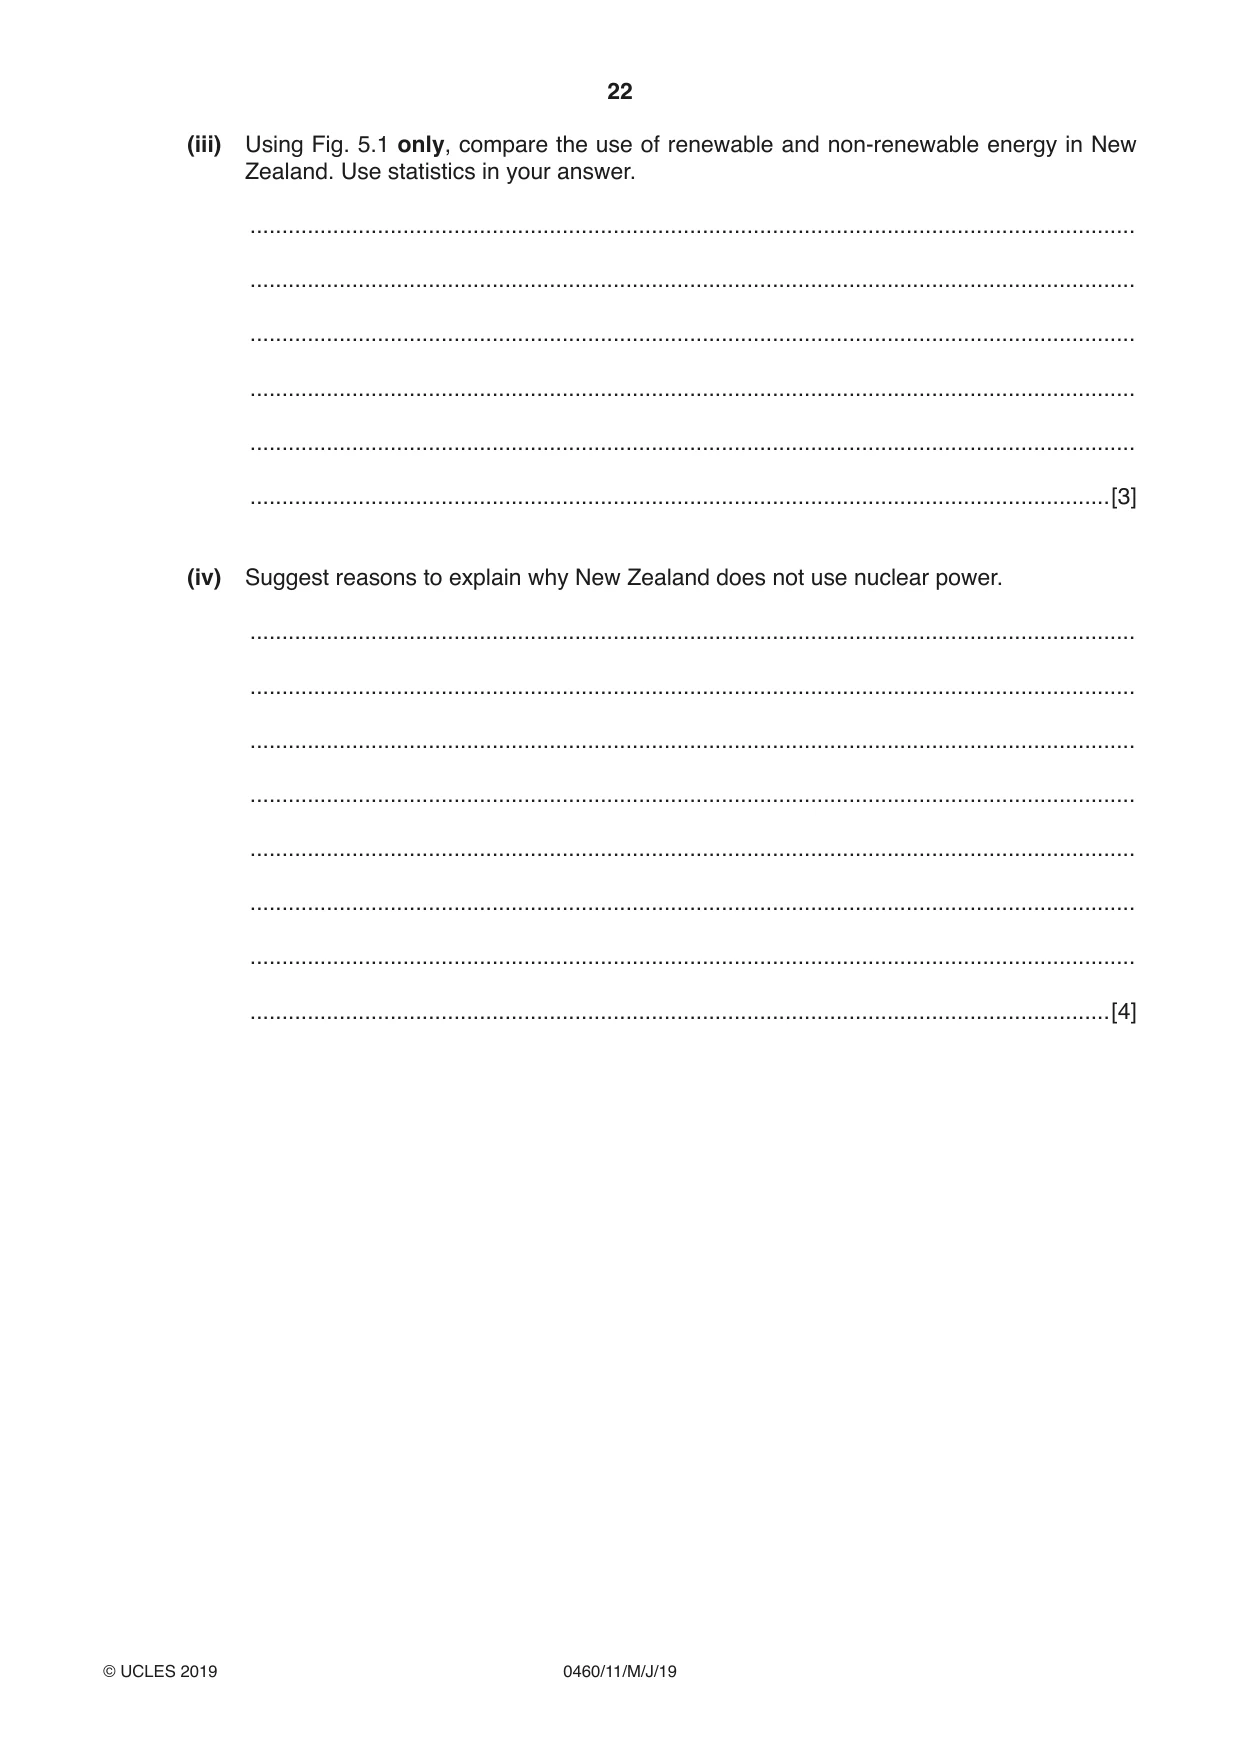
22 0460/11/M/J/19 © UCLES 2019 (iii) Using Fig. 5.1 only, compare the use of renewable and non-renewable energy in New Zealand. Use statistics in your answer. … … … … … …[3] (iv) Suggest reasons to explain why New Zealand does not use nuclear power. … … … … … … … …[4]
Question paper, page 23
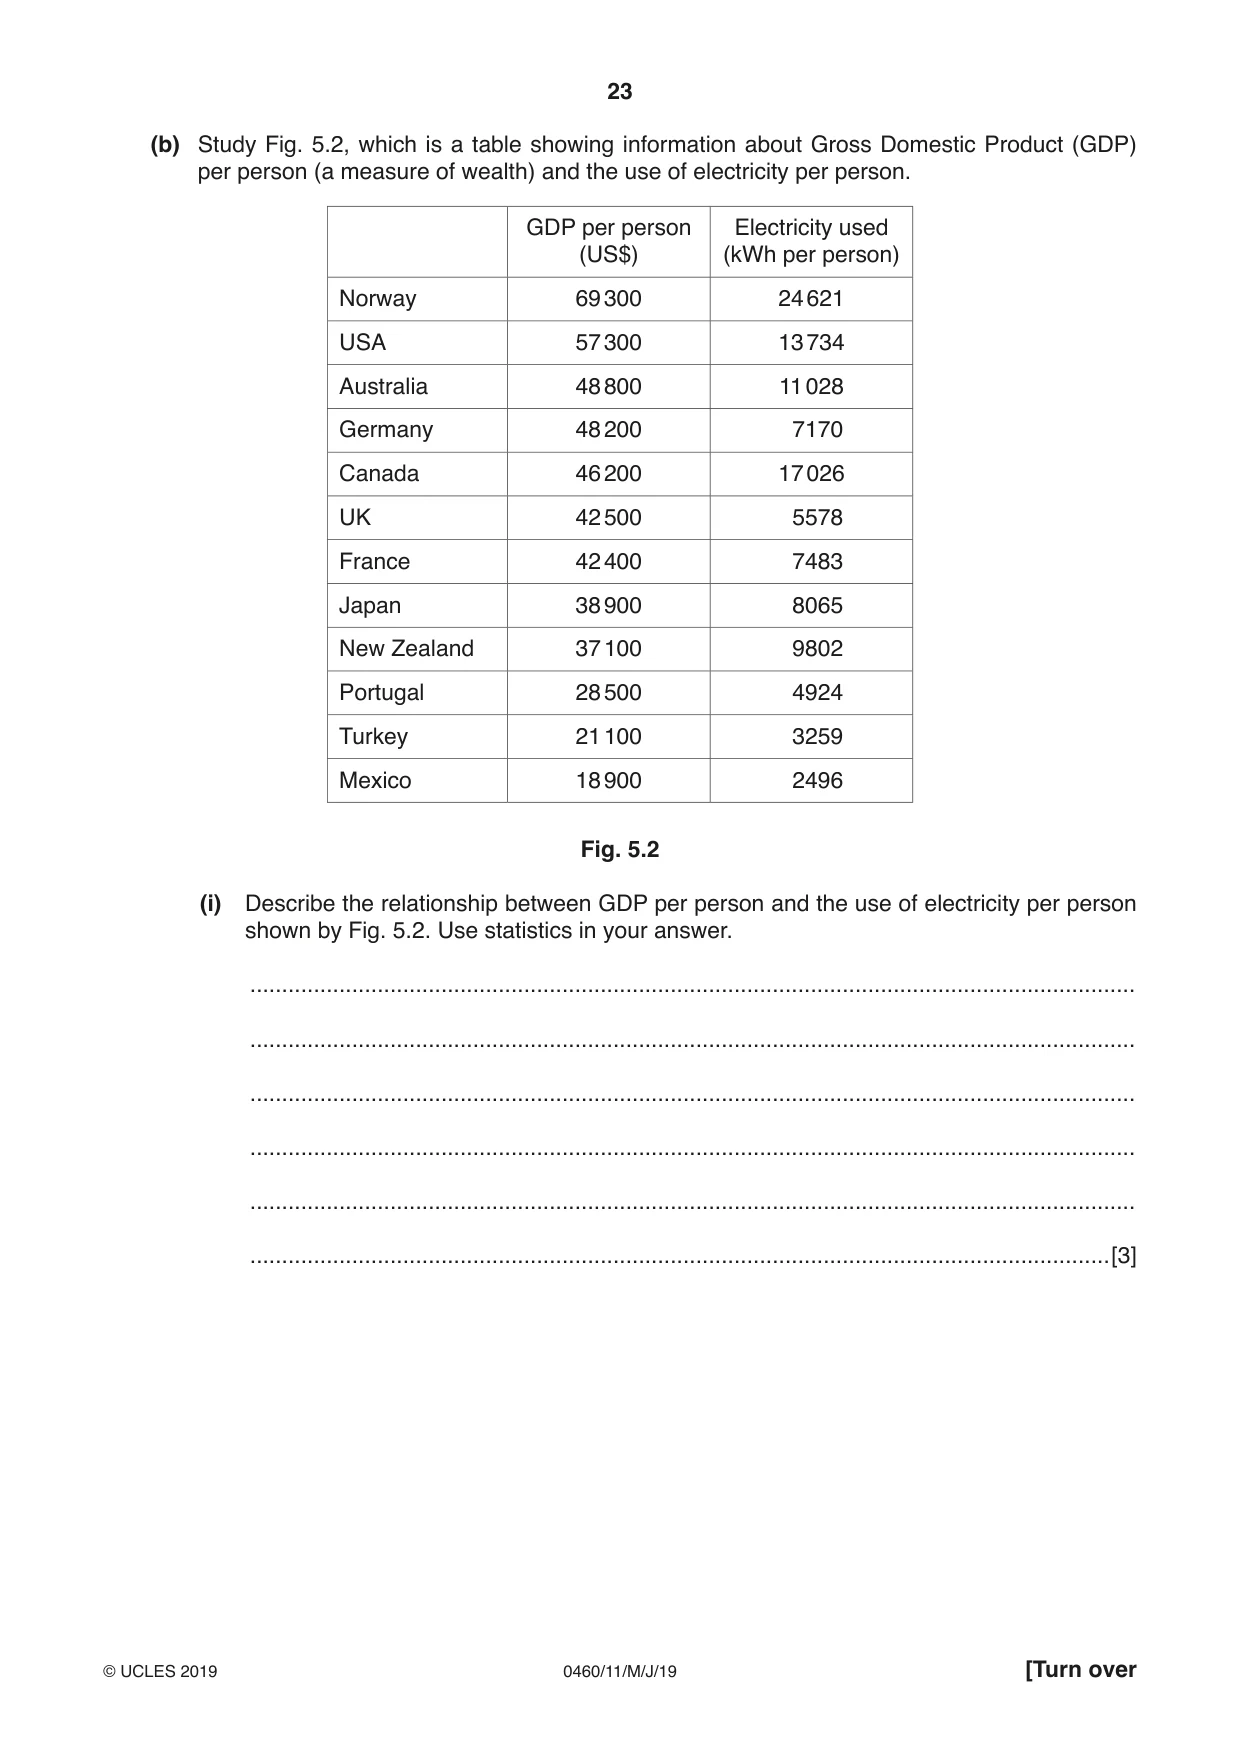
23 0460/11/M/J/19 © UCLES 2019 [Turn over (b) Study Fig. 5.2, which is a table showing information about Gross Domestic Product (GDP) per person (a measure of wealth) and the use of electricity per person. GDP per person (US$) Electricity used (kWh per person) Norway 69 300 24 621 USA 57 300 13 734 Australia 48 800 11 028 Germany 48 200 7170 Canada 46 200 17 026 UK 42 500 5578 France 42 400 7483 Japan 38 900 8065 New Zealand 37 100 9802 Portugal 28 500 4924 Turkey 21 100 3259 Mexico 18 900 2496 Fig. 5.2 (i) Describe the relationship between GDP per person and the use of electricity per person shown by Fig. 5.2. Use statistics in your answer. … … … … … …[3]
Question paper, page 24
24 0460/11/M/J/19 © UCLES 2019 (ii) Explain why there is a relationship between GDP per person and the use of electricity per person. … … … … … … … … … …[5]
Question paper, page 25
25 0460/11/M/J/19 © UCLES 2019 [Turn over (c) For a named country, describe the methods used to supply water to the population. Name of country … … … … … … … … … … … … … … … … … … … … … … … … … …[7] [Total: 25]
Question paper, page 26
26 0460/11/M/J/19 © UCLES 2019 6 (a) Study Fig. 6.1 (Insert), which is a photograph of an area with an Equatorial climate where the land is being used for subsistence farming. (i) What is meant by subsistence farming? … … …[1] (ii) Identify two pieces of evidence that the forest has been cleared in the area shown in Fig. 6.1. 1 … … 2 … …[2] (iii) Explain why soil erosion is likely to occur in the area shown in Fig. 6.1. … … … … … …[3] (iv) Describe the strategies which can be used by farmers to reduce soil erosion. … … … … … … … … …[4]
Question paper, page 27
27 0460/11/M/J/19 © UCLES 2019 [Turn over (b) Study Fig. 6.2 (Insert), which is a photograph of an area where economic activity is taking place. (i) Suggest why each of the following types of pollution are occurring in the area shown in Fig. 6.2. air pollution … … water pollution … … noise pollution … …[3] (ii) Explain how pollution may threaten the local natural environment. … … … … … … … … … …[5]
Question paper, page 28
28 0460/11/M/J/19 © UCLES 2019 (c) Describe the impacts of global warming on the natural environment. You should refer to named areas affected. … … … … … … … … … … … … … … … … … … … … … … … … … …[7] [Total: 25]
Question paper, page 29
29 0460/11/M/J/19 © UCLES 2019 Additional Pages If you use the following lined pages to complete the answer(s) to any question(s), the question number(s) must be clearly shown. … … … … … … … … … … … … … … … … … … … … … … … … … …
Question paper, page 30
30 0460/11/M/J/19 © UCLES 2019 … … … … … … … … … … … … … … … … … … … … … … … … … … … …
Question paper, page 31
31 0460/11/M/J/19 © UCLES 2019 BLANK PAGE
Question paper, page 32
32 0460/11/M/J/19 © UCLES 2019 Permission to reproduce items where third-party owned material protected by copyright is included has been sought and cleared where possible. Every reasonable effort has been made by the publisher (UCLES) to trace copyright holders, but if any items requiring clearance have unwittingly been included, the publisher will be pleased to make amends at the earliest possible opportunity. To avoid the issue of disclosure of answer-related information to candidates, all copyright acknowledgements are reproduced online in the Cambridge Assessment International Education Copyright Acknowledgements Booklet. This is produced for each series of examinations and is freely available to download at www.cambridgeinternational.org after the live examination series. Cambridge Assessment International Education is part of the Cambridge Assessment Group. Cambridge Assessment is the brand name of the University of Cambridge Local Examinations Syndicate (UCLES), which itself is a department of the University of Cambridge. BLANK PAGE
Mark scheme, page 1
This syllabus is regulated for use in England, Wales and Northern Ireland as a Cambridge International Level 1/Level 2 Certificate. This document consists of 17 printed pages. © UCLES 2019 [Turn over Cambridge Assessment International Education Cambridge International General Certificate of Secondary Education GEOGRAPHY 0460/11 Paper 1 May/June 2019 MARK SCHEME Maximum Mark: 75 Published This mark scheme is published as an aid to teachers and candidates, to indicate the requirements of the examination. It shows the basis on which Examiners were instructed to award marks. It does not indicate the details of the discussions that took place at an Examiners’ meeting before marking began, which would have considered the acceptability of alternative answers. Mark schemes should be read in conjunction with the question paper and the Principal Examiner Report for Teachers. Cambridge International will not enter into discussions about these mark schemes. Cambridge International is publishing the mark schemes for the May/June 2019 series for most Cambridge IGCSE™, Cambridge International A and AS Level and Cambridge Pre-U components, and some Cambridge O Level components.
Mark scheme, page 2
0460/11 Cambridge IGCSE – Mark Scheme PUBLISHED May/June 2019 © UCLES 2019 Page 2 of 17 Generic Marking Principles These general marking principles must be applied by all examiners when marking candidate answers. They should be applied alongside the specific content of the mark scheme or generic level descriptors for a question. Each question paper and mark scheme will also comply with these marking principles. GENERIC MARKING PRINCIPLE 1: Marks must be awarded in line with: • the specific content of the mark scheme or the generic level descriptors for the question • the specific skills defined in the mark scheme or in the generic level descriptors for the question • the standard of response required by a candidate as exemplified by the standardisation scripts. GENERIC MARKING PRINCIPLE 2: Marks awarded are always whole marks (not half marks, or other fractions). GENERIC MARKING PRINCIPLE 3: Marks must be awarded positively: • marks are awarded for correct/valid answers, as defined in the mark scheme. However, credit is given for valid answers which go beyond the scope of the syllabus and mark scheme, referring to your Team Leader as appropriate • marks are awarded when candidates clearly demonstrate what they know and can do • marks are not deducted for errors • marks are not deducted for omissions • answers should only be judged on the quality of spelling, punctuation and grammar when these features are specifically assessed by the question as indicated by the mark scheme. The meaning, however, should be unambiguous. GENERIC MARKING PRINCIPLE 4: Rules must be applied consistently e.g. in situations where candidates have not followed instructions or in the application of generic level descriptors. GENERIC MARKING PRINCIPLE 5: Marks should be awarded using the full range of marks defined in the mark scheme for the question (however; the use of the full mark range may be limited according to the quality of the candidate responses seen). GENERIC MARKING PRINCIPLE 6: Marks awarded are based solely on the requirements as defined in the mark scheme. Marks should not be awarded with grade thresholds or grade descriptors in mind.
Mark scheme, page 3
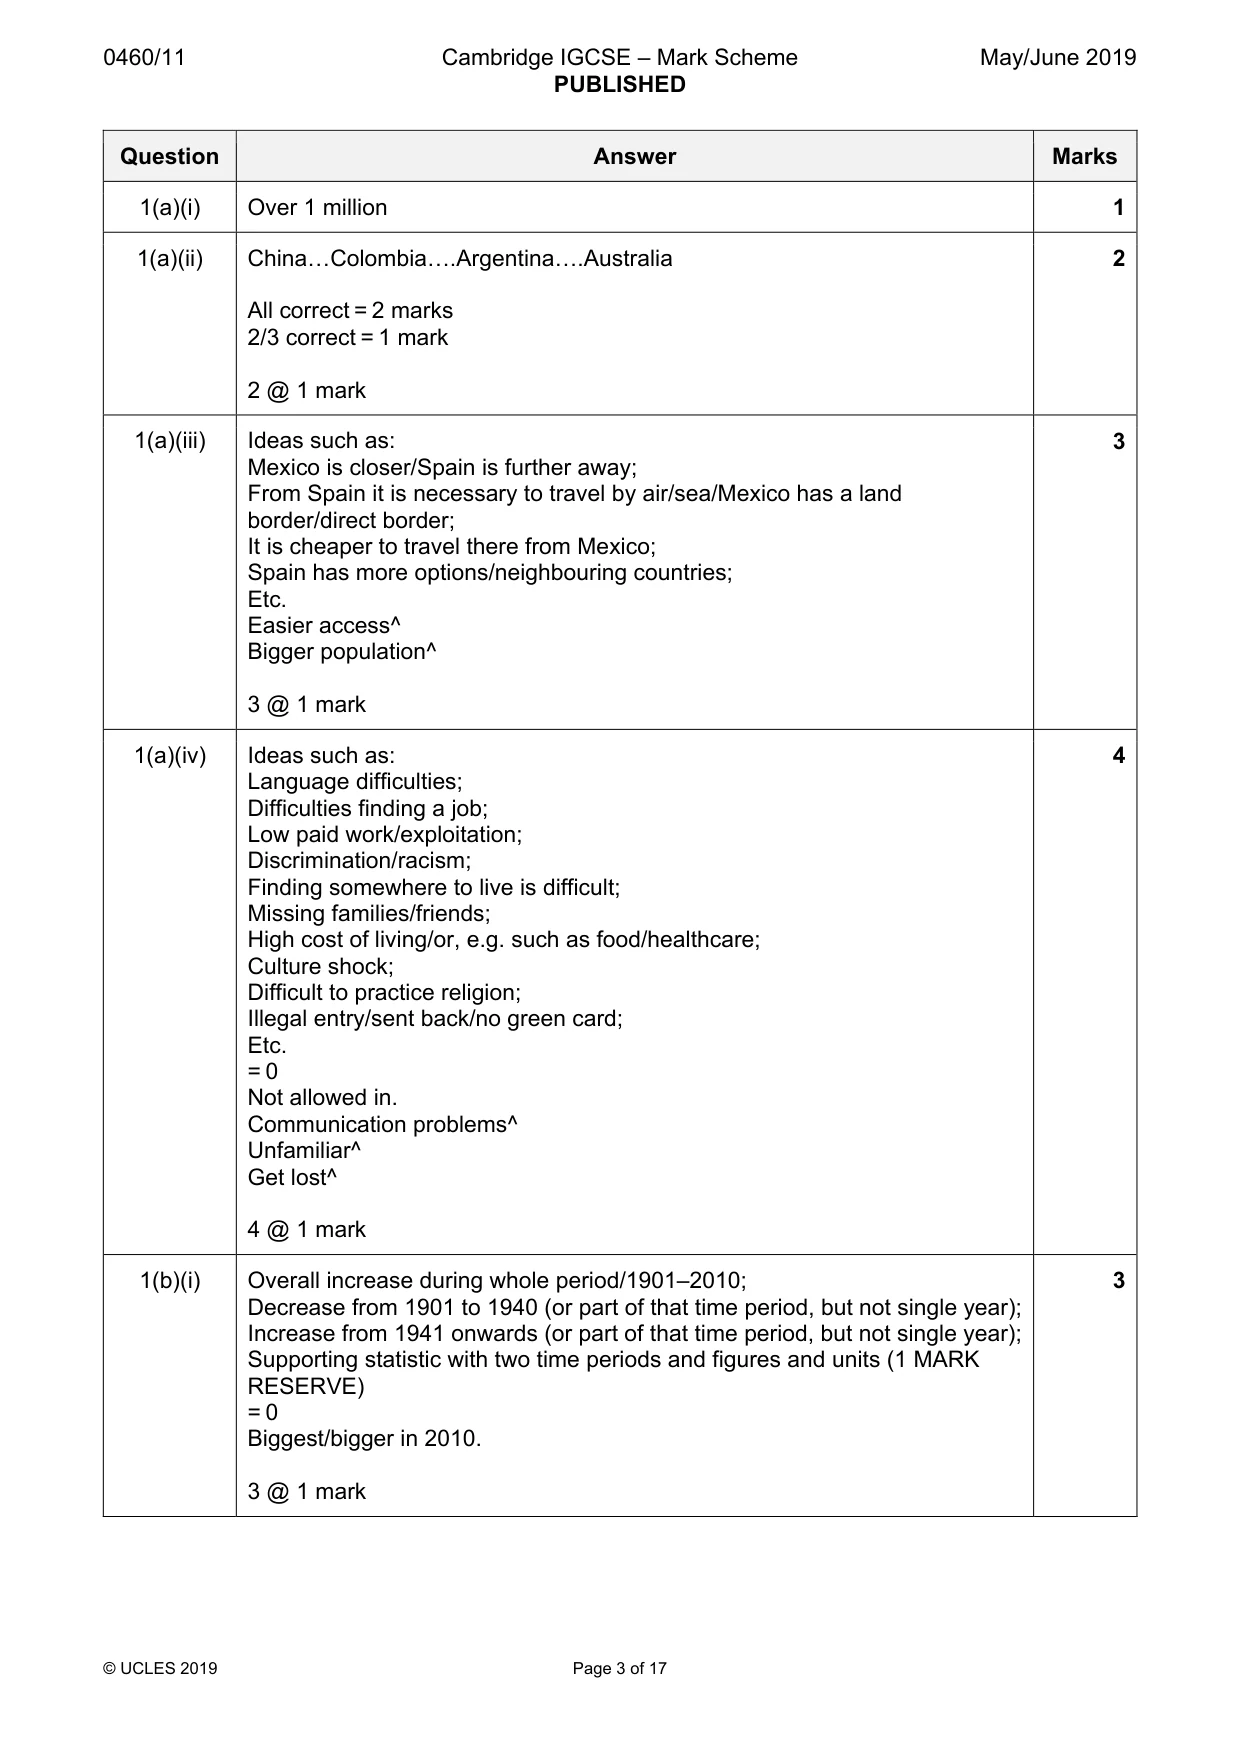
0460/11 Cambridge IGCSE – Mark Scheme PUBLISHED May/June 2019 © UCLES 2019 Page 3 of 17 Question Answer Marks 1(a)(i) Over 1 million 1 1(a)(ii) China«Colombia«.Argentina«.Australia All correct = 2 marks 2/3 correct = 1 mark 2 @ 1 mark 2 1(a)(iii) Ideas such as: Mexico is closer/Spain is further away; From Spain it is necessary to travel by air/sea/Mexico has a land border/direct border; It is cheaper to travel there from Mexico; Spain has more options/neighbouring countries; Etc. Easier access^ Bigger population^ 3 @ 1 mark 3 1(a)(iv) Ideas such as: Language difficulties; Difficulties finding a job; Low paid work/exploitation; Discrimination/racism; Finding somewhere to live is difficult; Missing families/friends; High cost of living/or, e.g. such as food/healthcare; Culture shock; Difficult to practice religion; Illegal entry/sent back/no green card; Etc. = 0 Not allowed in. Communication problems^ Unfamiliar^ Get lost^ 4 @ 1 mark 4 1(b)(i) Overall increase during whole period/1901–2010; Decrease from 1901 to 1940 (or part of that time period, but not single year); Increase from 1941 onwards (or part of that time period, but not single year); Supporting statistic with two time periods and figures and units (1 MARK RESERVE) = 0 Biggest/bigger in 2010. 3 @ 1 mark 3
Mark scheme, page 4
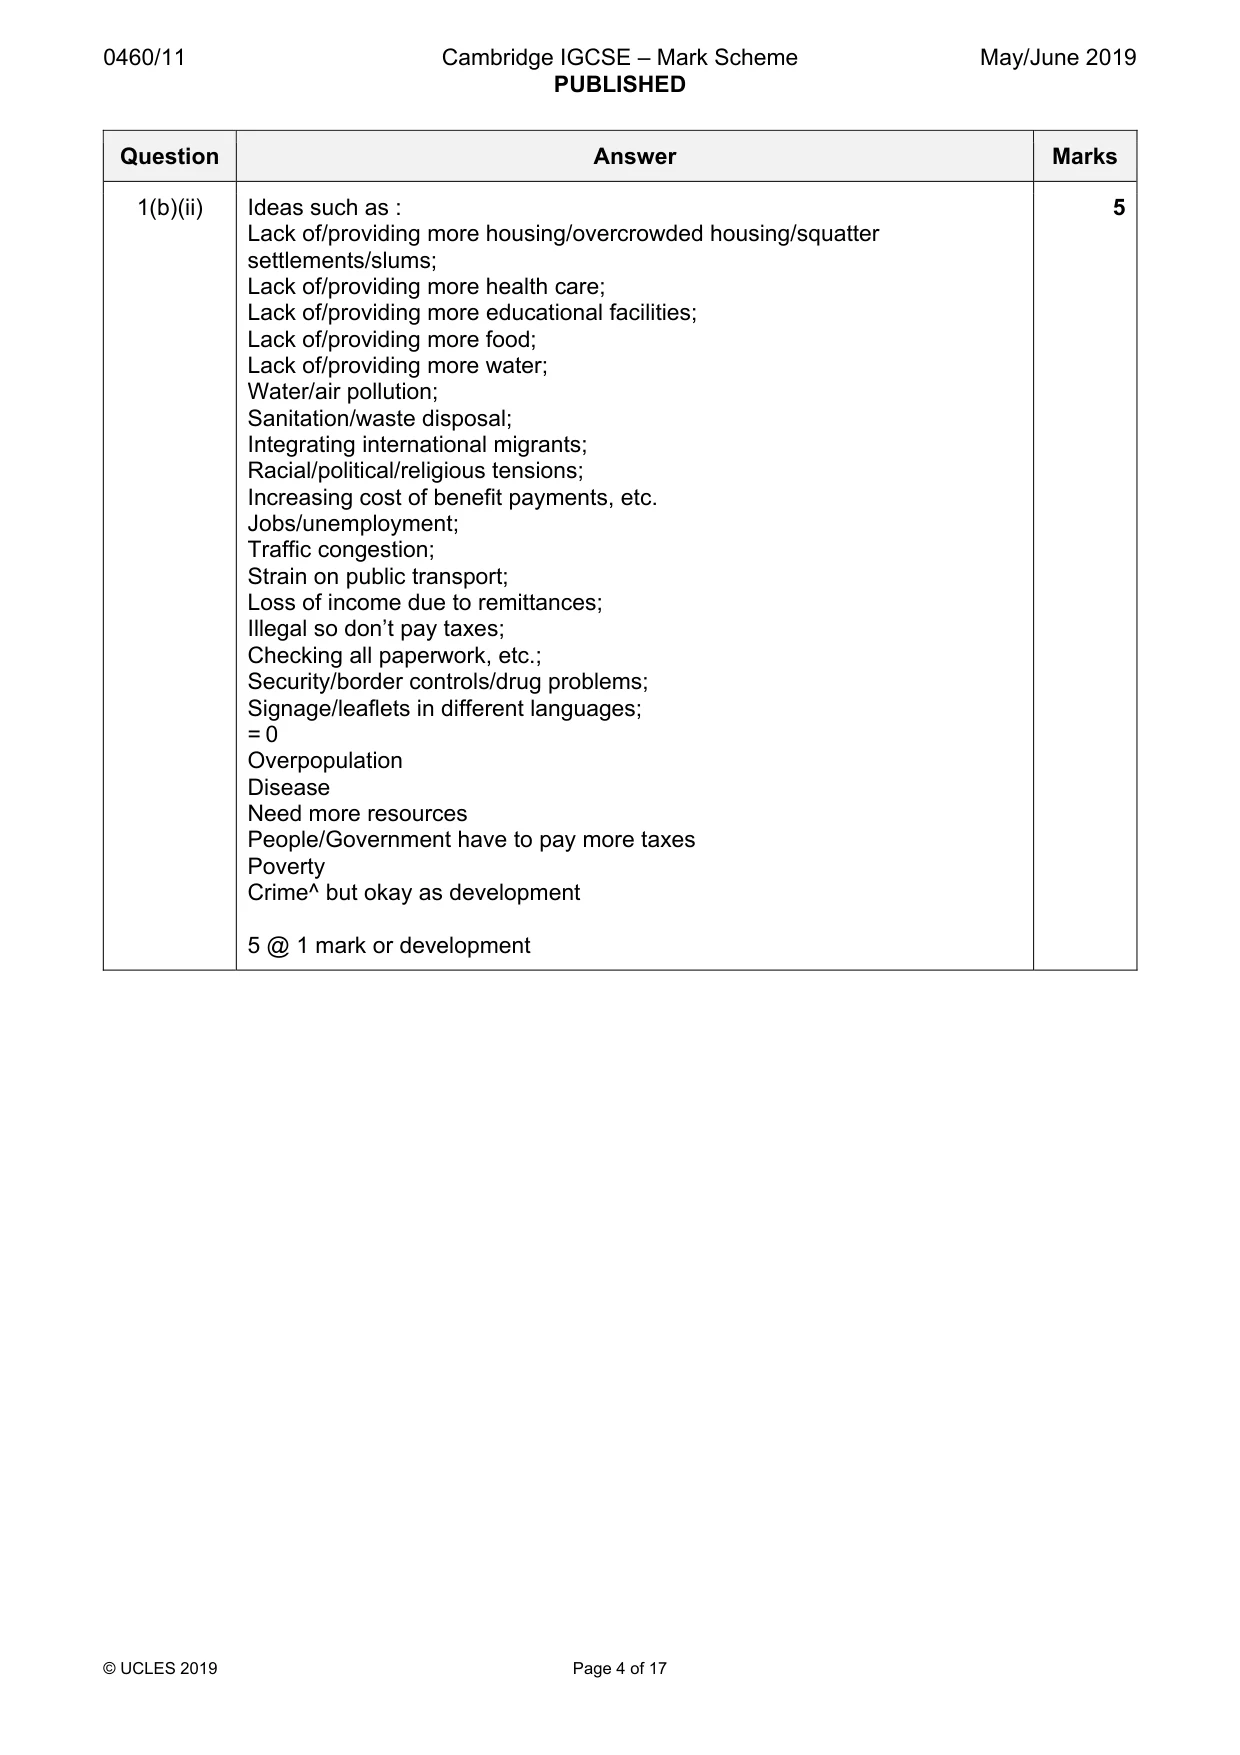
0460/11 Cambridge IGCSE – Mark Scheme PUBLISHED May/June 2019 © UCLES 2019 Page 4 of 17 Question Answer Marks 1(b)(ii) Ideas such as : Lack of/providing more housing/overcrowded housing/squatter settlements/slums; Lack of/providing more health care; Lack of/providing more educational facilities; Lack of/providing more food; Lack of/providing more water; Water/air pollution; Sanitation/waste disposal; Integrating international migrants; Racial/political/religious tensions; Increasing cost of benefit payments, etc. Jobs/unemployment; Traffic congestion; Strain on public transport; Loss of income due to remittances; Illegal so don’t pay taxes; Checking all paperwork, etc.; Security/border controls/drug problems; Signage/leaflets in different languages; = 0 Overpopulation Disease Need more resources People/Government have to pay more taxes Poverty Crime^ but okay as development 5 @ 1 mark or development 5
Mark scheme, page 5
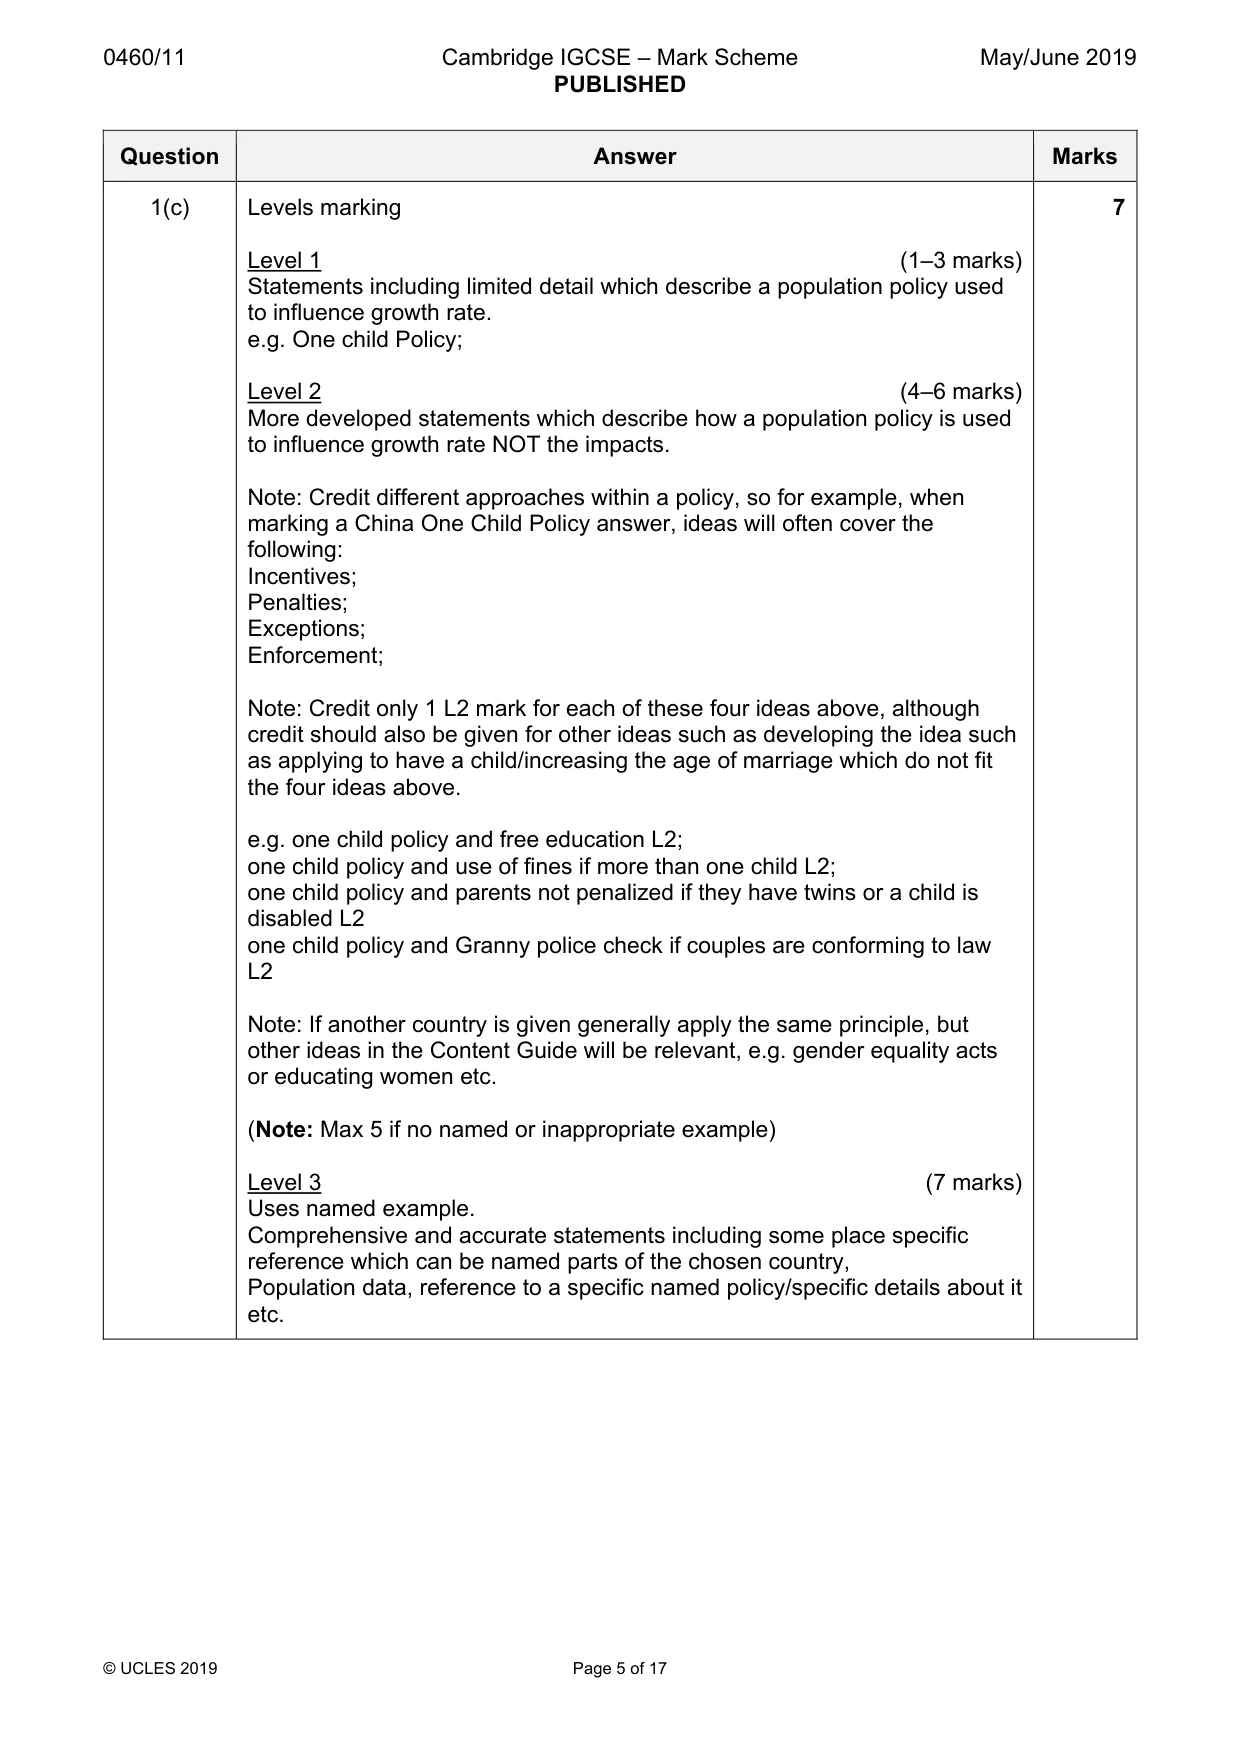
0460/11 Cambridge IGCSE – Mark Scheme PUBLISHED May/June 2019 © UCLES 2019 Page 5 of 17 Question Answer Marks 1(c) Levels marking Level 1 (1–3 marks) Statements including limited detail which describe a population policy used to influence growth rate. e.g. One child Policy; Level 2 (4–6 marks) More developed statements which describe how a population policy is used to influence growth rate NOT the impacts. Note: Credit different approaches within a policy, so for example, when marking a China One Child Policy answer, ideas will often cover the following: Incentives; Penalties; Exceptions; Enforcement; Note: Credit only 1 L2 mark for each of these four ideas above, although credit should also be given for other ideas such as developing the idea such as applying to have a child/increasing the age of marriage which do not fit the four ideas above. e.g. one child policy and free education L2; one child policy and use of fines if more than one child L2; one child policy and parents not penalized if they have twins or a child is disabled L2 one child policy and Granny police check if couples are conforming to law L2 Note: If another country is given generally apply the same principle, but other ideas in the Content Guide will be relevant, e.g. gender equality acts or educating women etc. (Note: Max 5 if no named or inappropriate example) Level 3 (7 marks) Uses named example. Comprehensive and accurate statements including some place specific reference which can be named parts of the chosen country, Population data, reference to a specific named policy/specific details about it etc. 7
Mark scheme, page 6
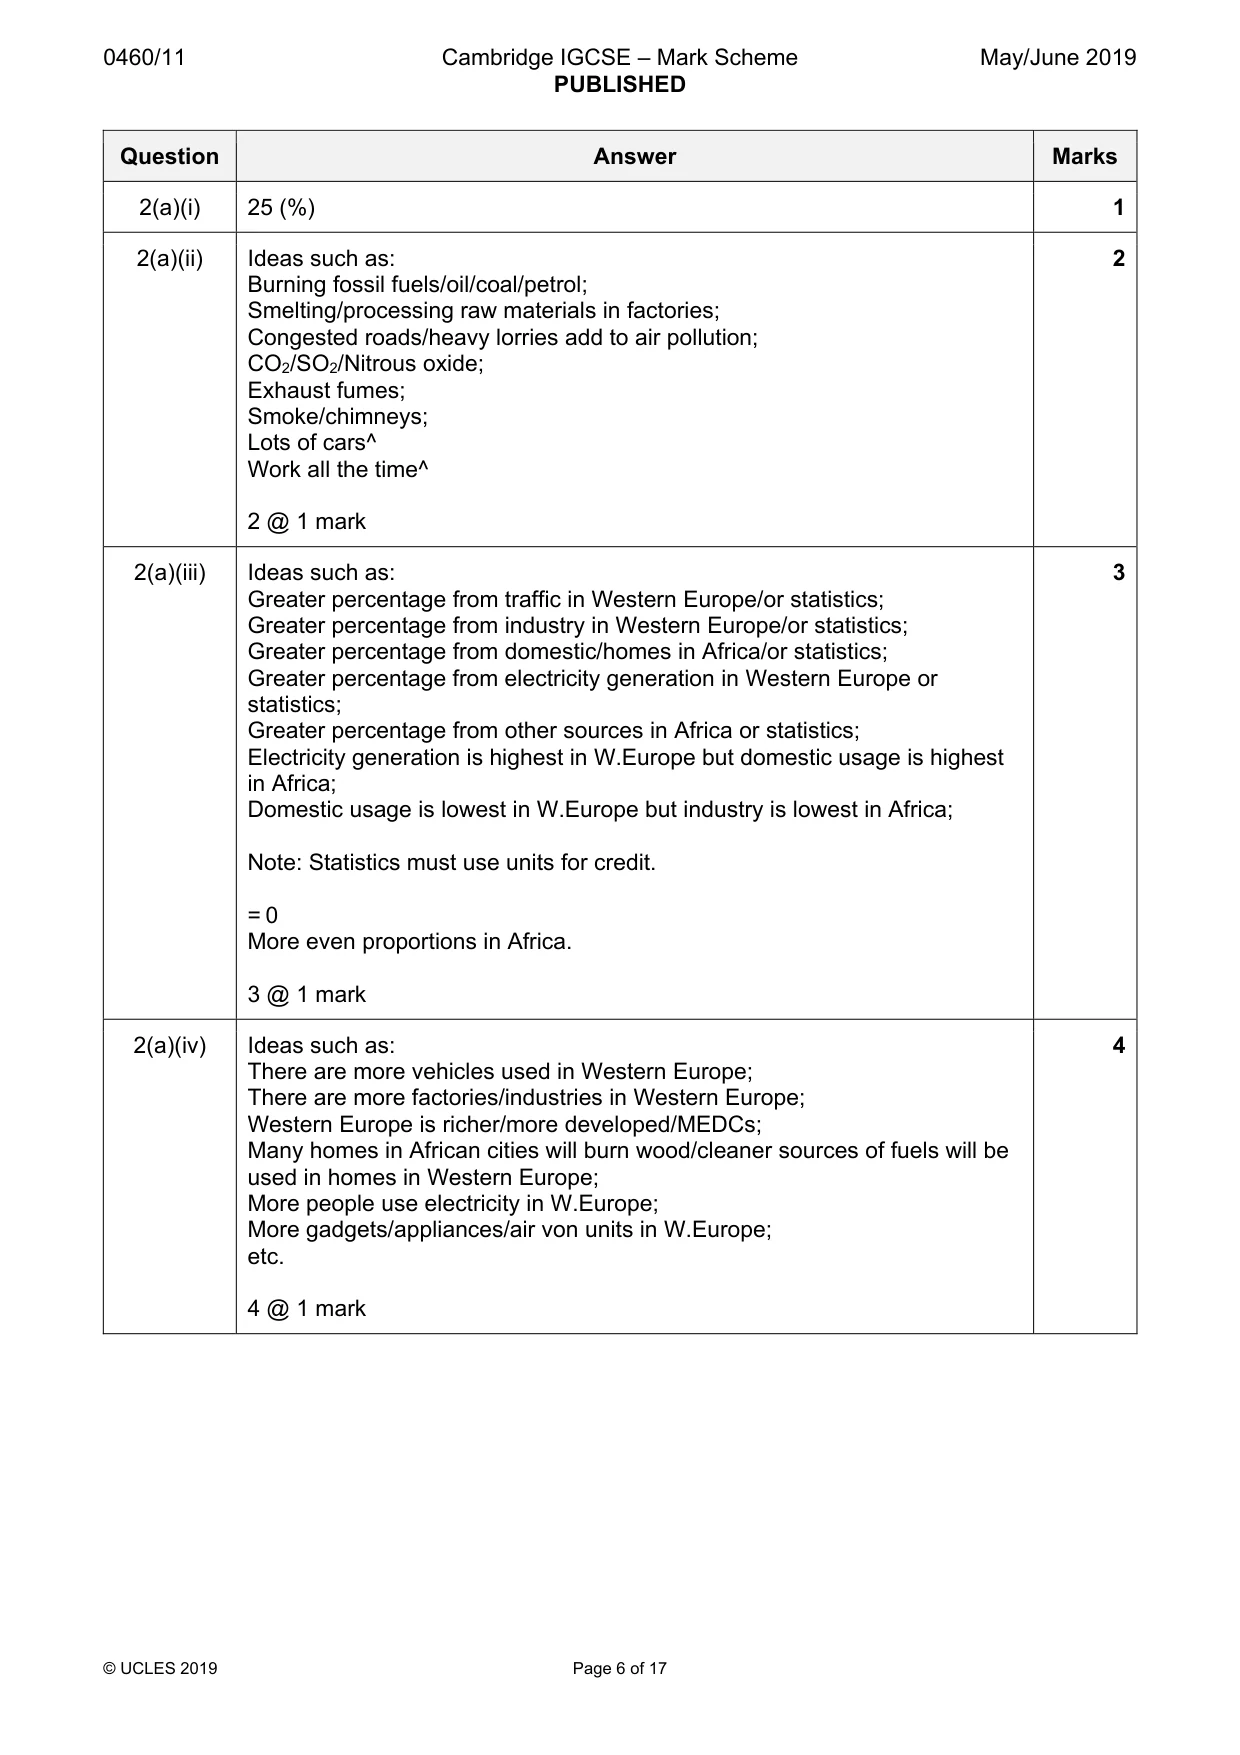
0460/11 Cambridge IGCSE – Mark Scheme PUBLISHED May/June 2019 © UCLES 2019 Page 6 of 17 Question Answer Marks 2(a)(i) 25 (%) 1 2(a)(ii) Ideas such as: Burning fossil fuels/oil/coal/petrol; Smelting/processing raw materials in factories; Congested roads/heavy lorries add to air pollution; CO2/SO2/Nitrous oxide; Exhaust fumes; Smoke/chimneys; Lots of cars^ Work all the time^ 2 @ 1 mark 2 2(a)(iii) Ideas such as: Greater percentage from traffic in Western Europe/or statistics; Greater percentage from industry in Western Europe/or statistics; Greater percentage from domestic/homes in Africa/or statistics; Greater percentage from electricity generation in Western Europe or statistics; Greater percentage from other sources in Africa or statistics; Electricity generation is highest in W.Europe but domestic usage is highest in Africa; Domestic usage is lowest in W.Europe but industry is lowest in Africa; Note: Statistics must use units for credit. = 0 More even proportions in Africa. 3 @ 1 mark 3 2(a)(iv) Ideas such as: There are more vehicles used in Western Europe; There are more factories/industries in Western Europe; Western Europe is richer/more developed/MEDCs; Many homes in African cities will burn wood/cleaner sources of fuels will be used in homes in Western Europe; More people use electricity in W.Europe; More gadgets/appliances/air von units in W.Europe; etc. 4 @ 1 mark 4
Mark scheme, page 7
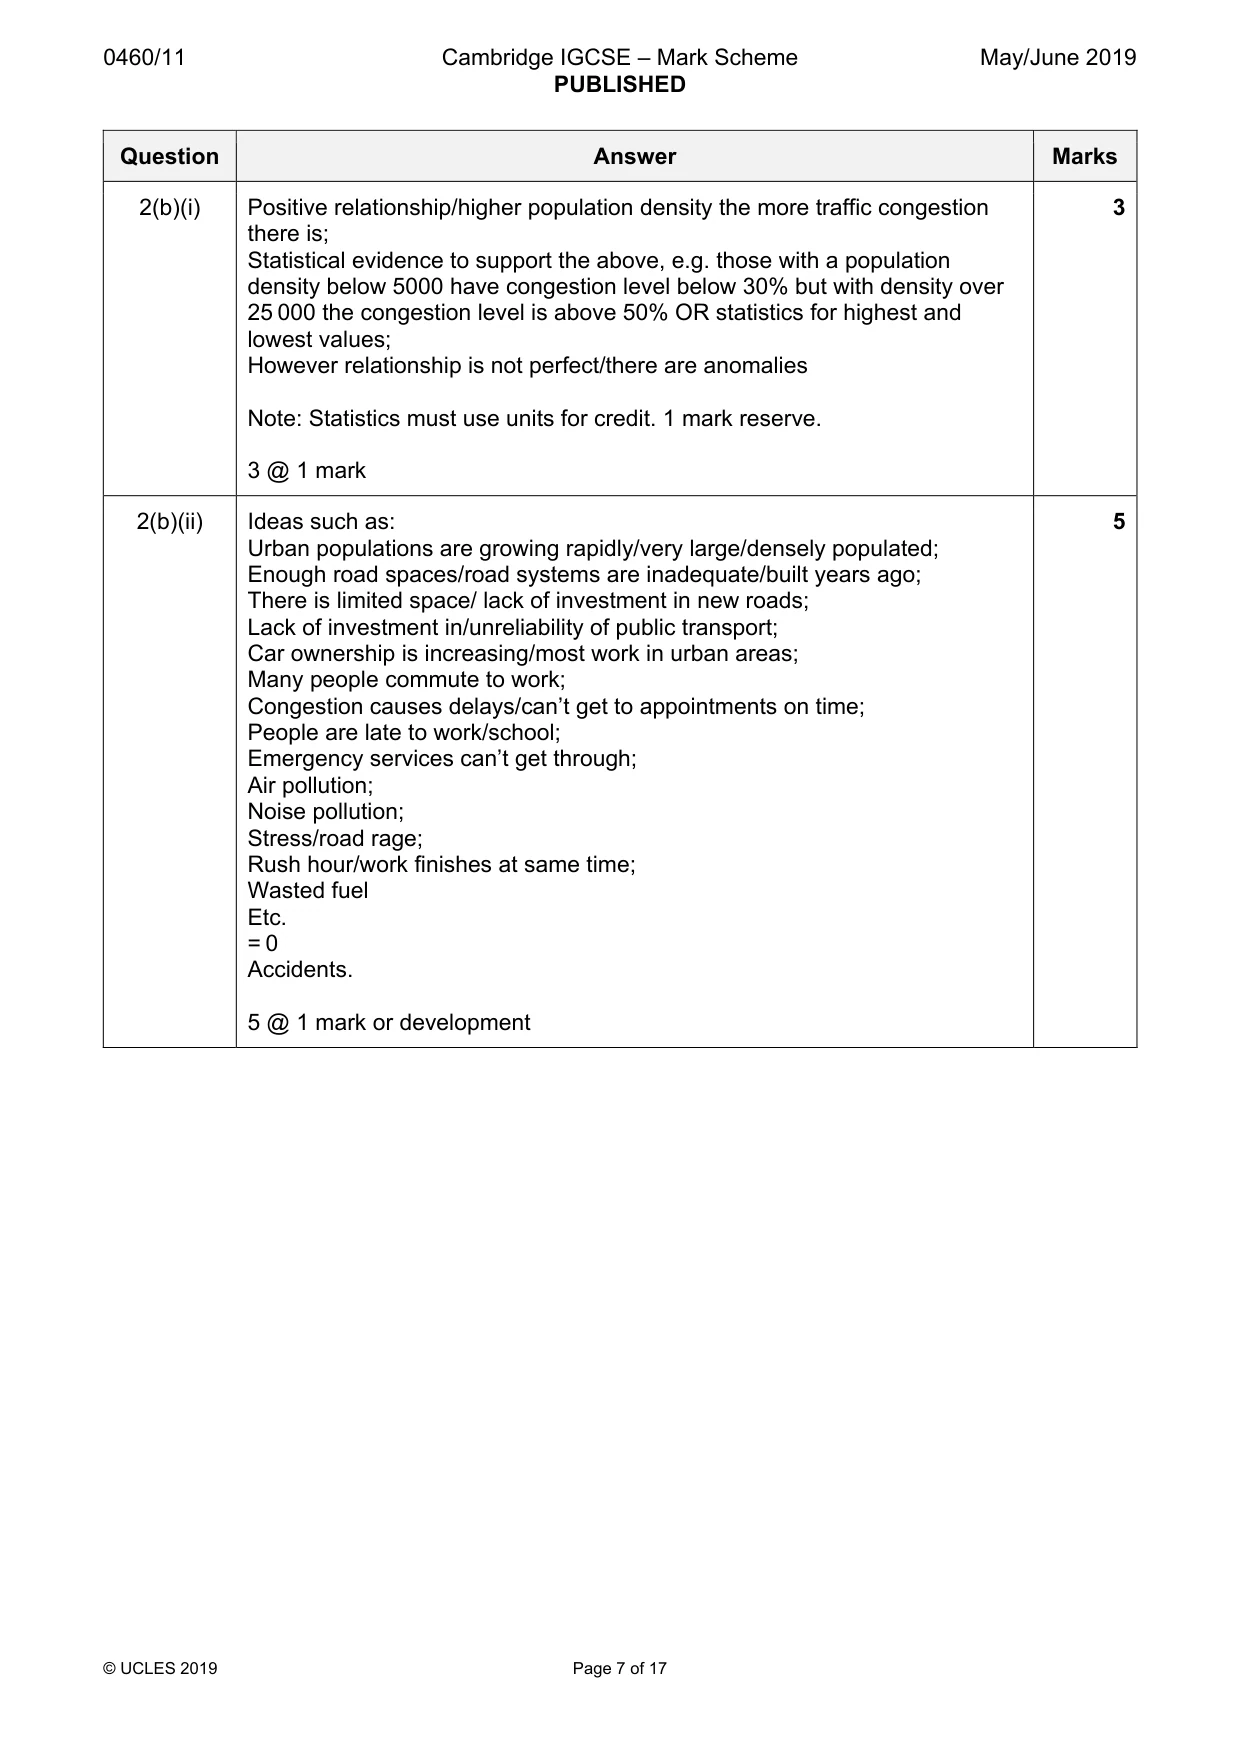
0460/11 Cambridge IGCSE – Mark Scheme PUBLISHED May/June 2019 © UCLES 2019 Page 7 of 17 Question Answer Marks 2(b)(i) Positive relationship/higher population density the more traffic congestion there is; Statistical evidence to support the above, e.g. those with a population density below 5000 have congestion level below 30% but with density over 25 000 the congestion level is above 50% OR statistics for highest and lowest values; However relationship is not perfect/there are anomalies Note: Statistics must use units for credit. 1 mark reserve. 3 @ 1 mark 3 2(b)(ii) Ideas such as: Urban populations are growing rapidly/very large/densely populated; Enough road spaces/road systems are inadequate/built years ago; There is limited space/ lack of investment in new roads; Lack of investment in/unreliability of public transport; Car ownership is increasing/most work in urban areas; Many people commute to work; Congestion causes delays/can’t get to appointments on time; People are late to work/school; Emergency services can’t get through; Air pollution; Noise pollution; Stress/road rage; Rush hour/work finishes at same time; Wasted fuel Etc. = 0 Accidents. 5 @ 1 mark or development 5
Mark scheme, page 8
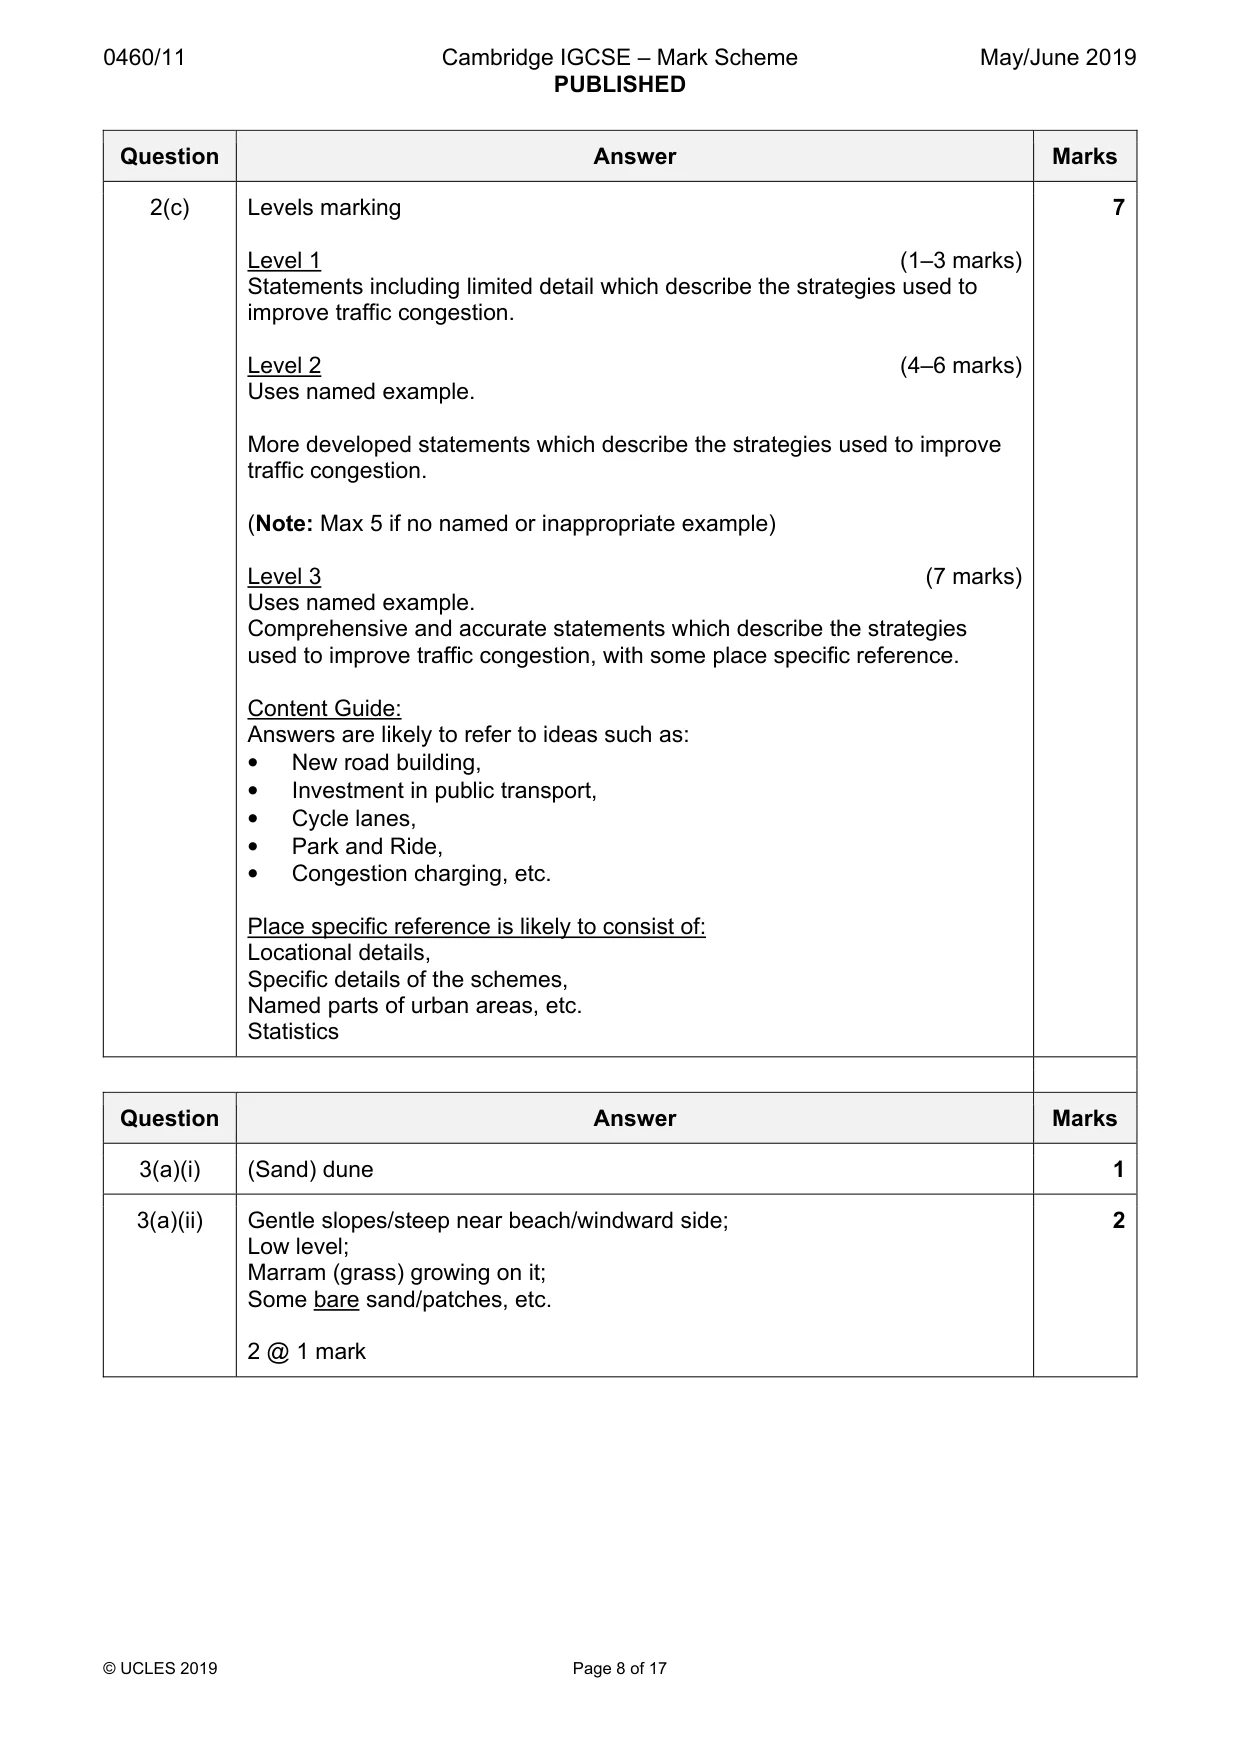
0460/11 Cambridge IGCSE – Mark Scheme PUBLISHED May/June 2019 © UCLES 2019 Page 8 of 17 Question Answer Marks 2(c) Levels marking Level 1 (1–3 marks) Statements including limited detail which describe the strategies used to improve traffic congestion. Level 2 (4–6 marks) Uses named example. More developed statements which describe the strategies used to improve traffic congestion. (Note: Max 5 if no named or inappropriate example) Level 3 (7 marks) Uses named example. Comprehensive and accurate statements which describe the strategies used to improve traffic congestion, with some place specific reference. Content Guide: Answers are likely to refer to ideas such as: • New road building, • Investment in public transport, • Cycle lanes, • Park and Ride, • Congestion charging, etc. Place specific reference is likely to consist of: Locational details, Specific details of the schemes, Named parts of urban areas, etc. Statistics 7 Question Answer Marks 3(a)(i) (Sand) dune 1 3(a)(ii) Gentle slopes/steep near beach/windward side; Low level; Marram (grass) growing on it; Some bare sand/patches, etc. 2 @ 1 mark 2
Mark scheme, page 9
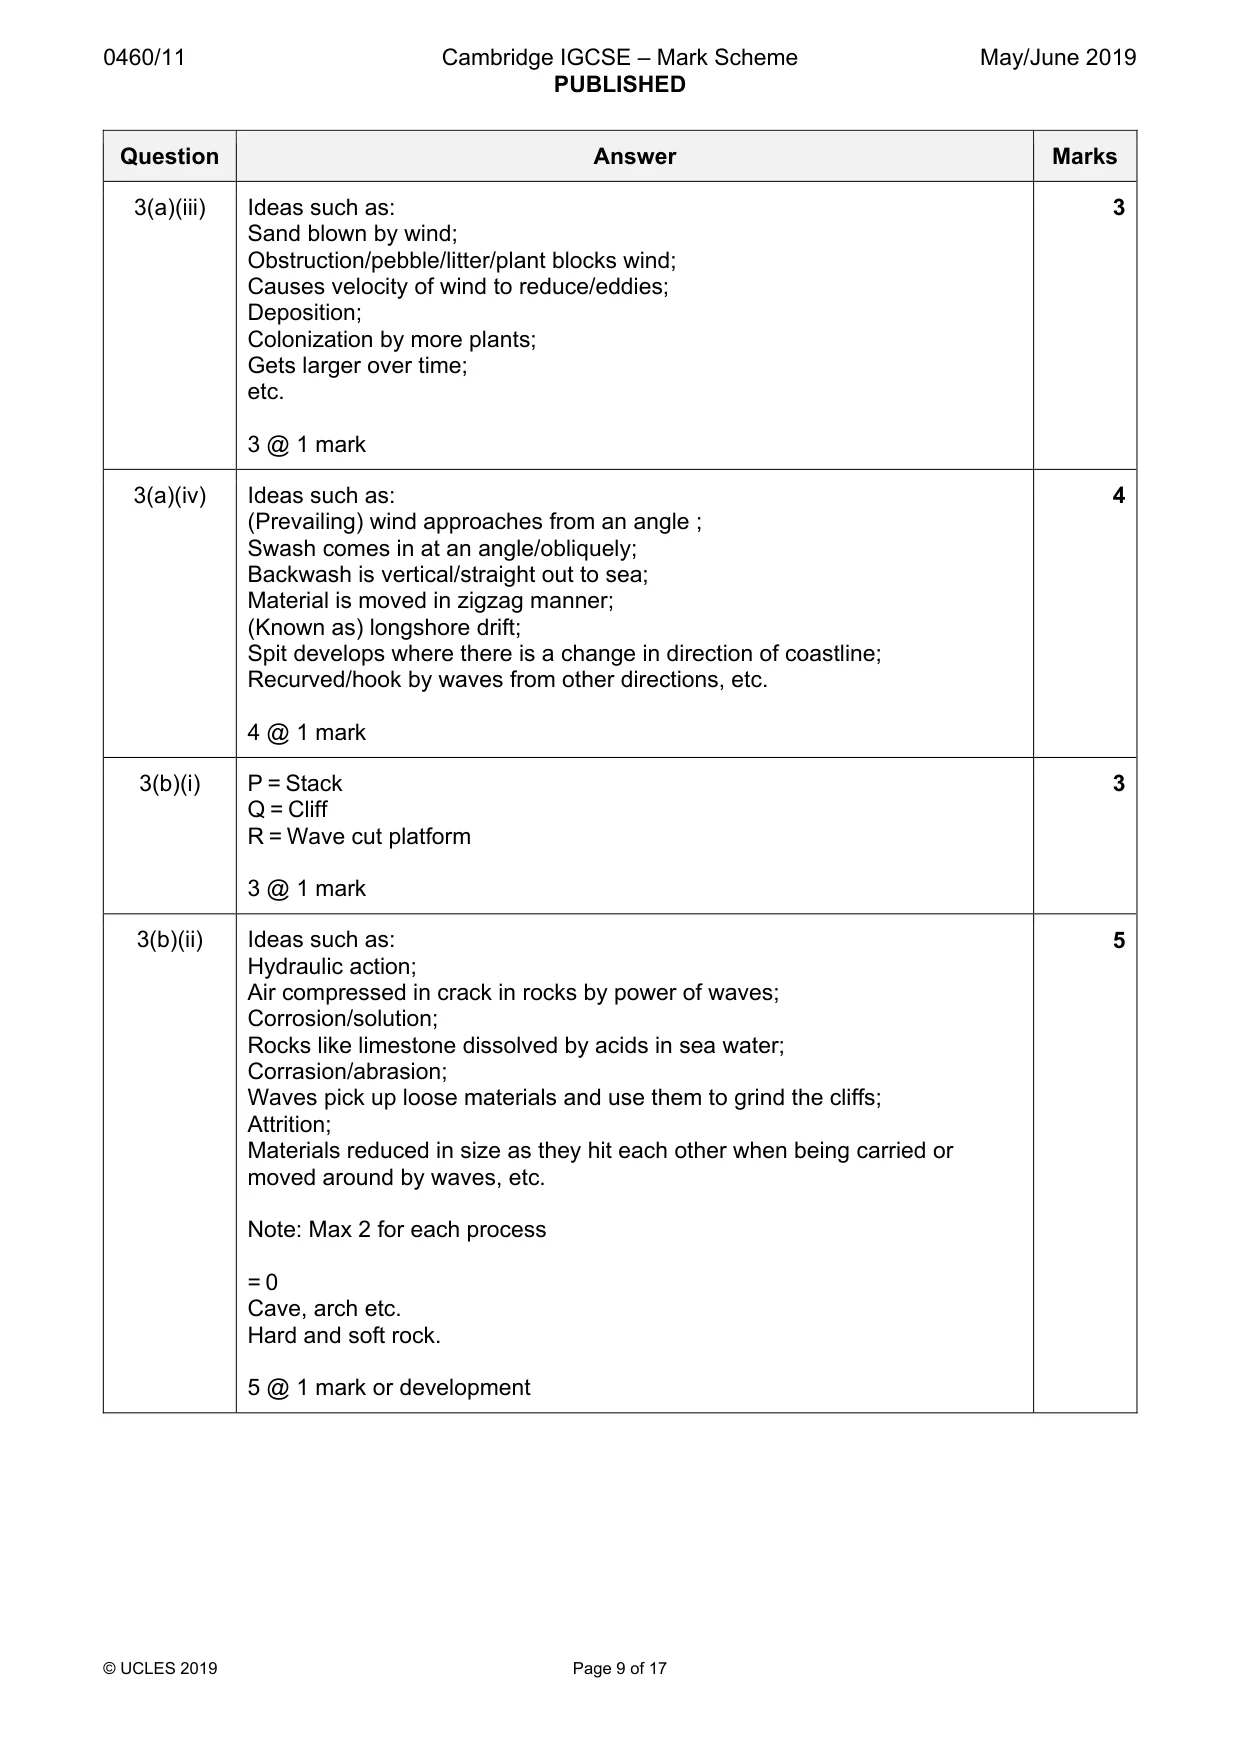
0460/11 Cambridge IGCSE – Mark Scheme PUBLISHED May/June 2019 © UCLES 2019 Page 9 of 17 Question Answer Marks 3(a)(iii) Ideas such as: Sand blown by wind; Obstruction/pebble/litter/plant blocks wind; Causes velocity of wind to reduce/eddies; Deposition; Colonization by more plants; Gets larger over time; etc. 3 @ 1 mark 3 3(a)(iv) Ideas such as: (Prevailing) wind approaches from an angle ; Swash comes in at an angle/obliquely; Backwash is vertical/straight out to sea; Material is moved in zigzag manner; (Known as) longshore drift; Spit develops where there is a change in direction of coastline; Recurved/hook by waves from other directions, etc. 4 @ 1 mark 4 3(b)(i) P = Stack Q = Cliff R = Wave cut platform 3 @ 1 mark 3 3(b)(ii) Ideas such as: Hydraulic action; Air compressed in crack in rocks by power of waves; Corrosion/solution; Rocks like limestone dissolved by acids in sea water; Corrasion/abrasion; Waves pick up loose materials and use them to grind the cliffs; Attrition; Materials reduced in size as they hit each other when being carried or moved around by waves, etc. Note: Max 2 for each process = 0 Cave, arch etc. Hard and soft rock. 5 @ 1 mark or development 5
Mark scheme, page 10
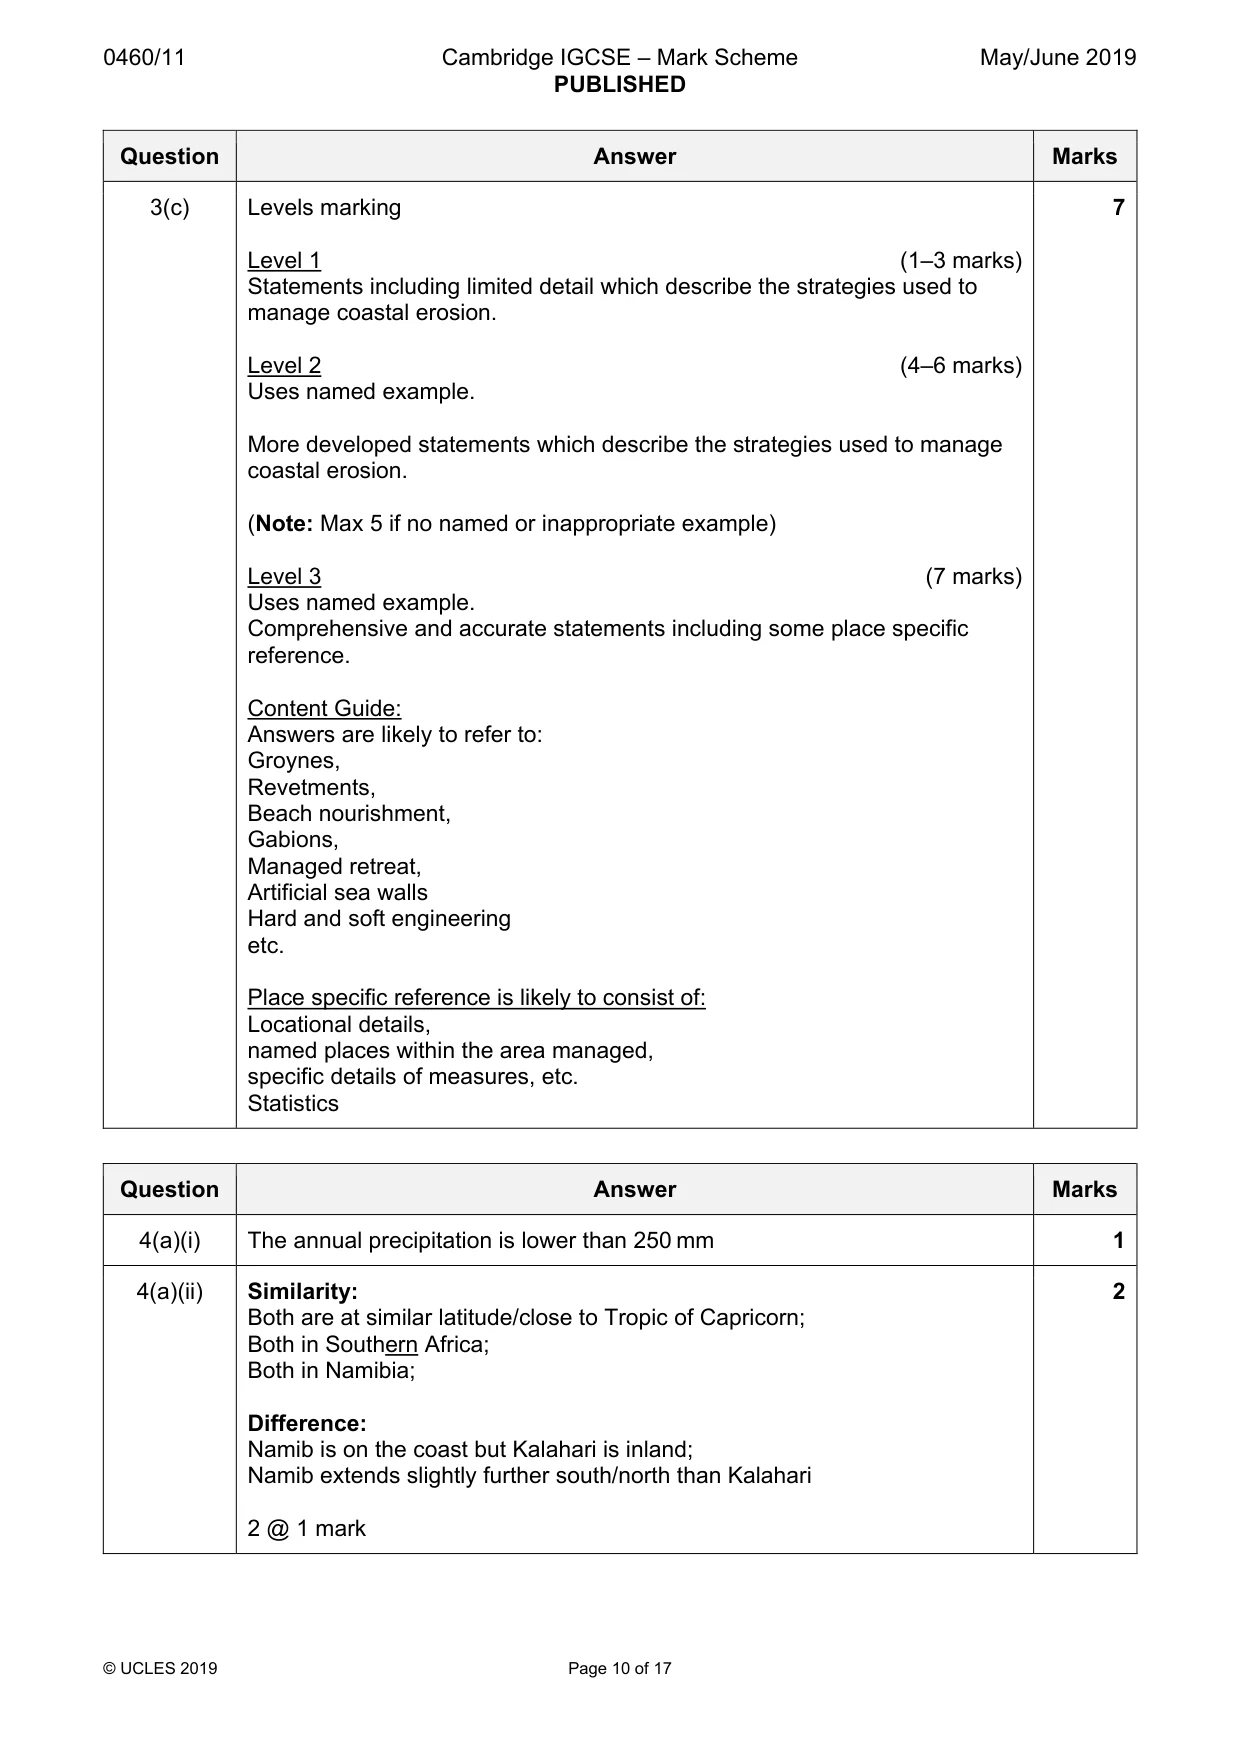
0460/11 Cambridge IGCSE – Mark Scheme PUBLISHED May/June 2019 © UCLES 2019 Page 10 of 17 Question Answer Marks 3(c) Levels marking Level 1 (1–3 marks) Statements including limited detail which describe the strategies used to manage coastal erosion. Level 2 (4–6 marks) Uses named example. More developed statements which describe the strategies used to manage coastal erosion. (Note: Max 5 if no named or inappropriate example) Level 3 (7 marks) Uses named example. Comprehensive and accurate statements including some place specific reference. Content Guide: Answers are likely to refer to: Groynes, Revetments, Beach nourishment, Gabions, Managed retreat, Artificial sea walls Hard and soft engineering etc. Place specific reference is likely to consist of: Locational details, named places within the area managed, specific details of measures, etc. Statistics 7 Question Answer Marks 4(a)(i) The annual precipitation is lower than 250 mm 1 4(a)(ii) Similarity: Both are at similar latitude/close to Tropic of Capricorn; Both in Southern Africa; Both in Namibia; Difference: Namib is on the coast but Kalahari is inland; Namib extends slightly further south/north than Kalahari 2 @ 1 mark 2
Mark scheme, page 11
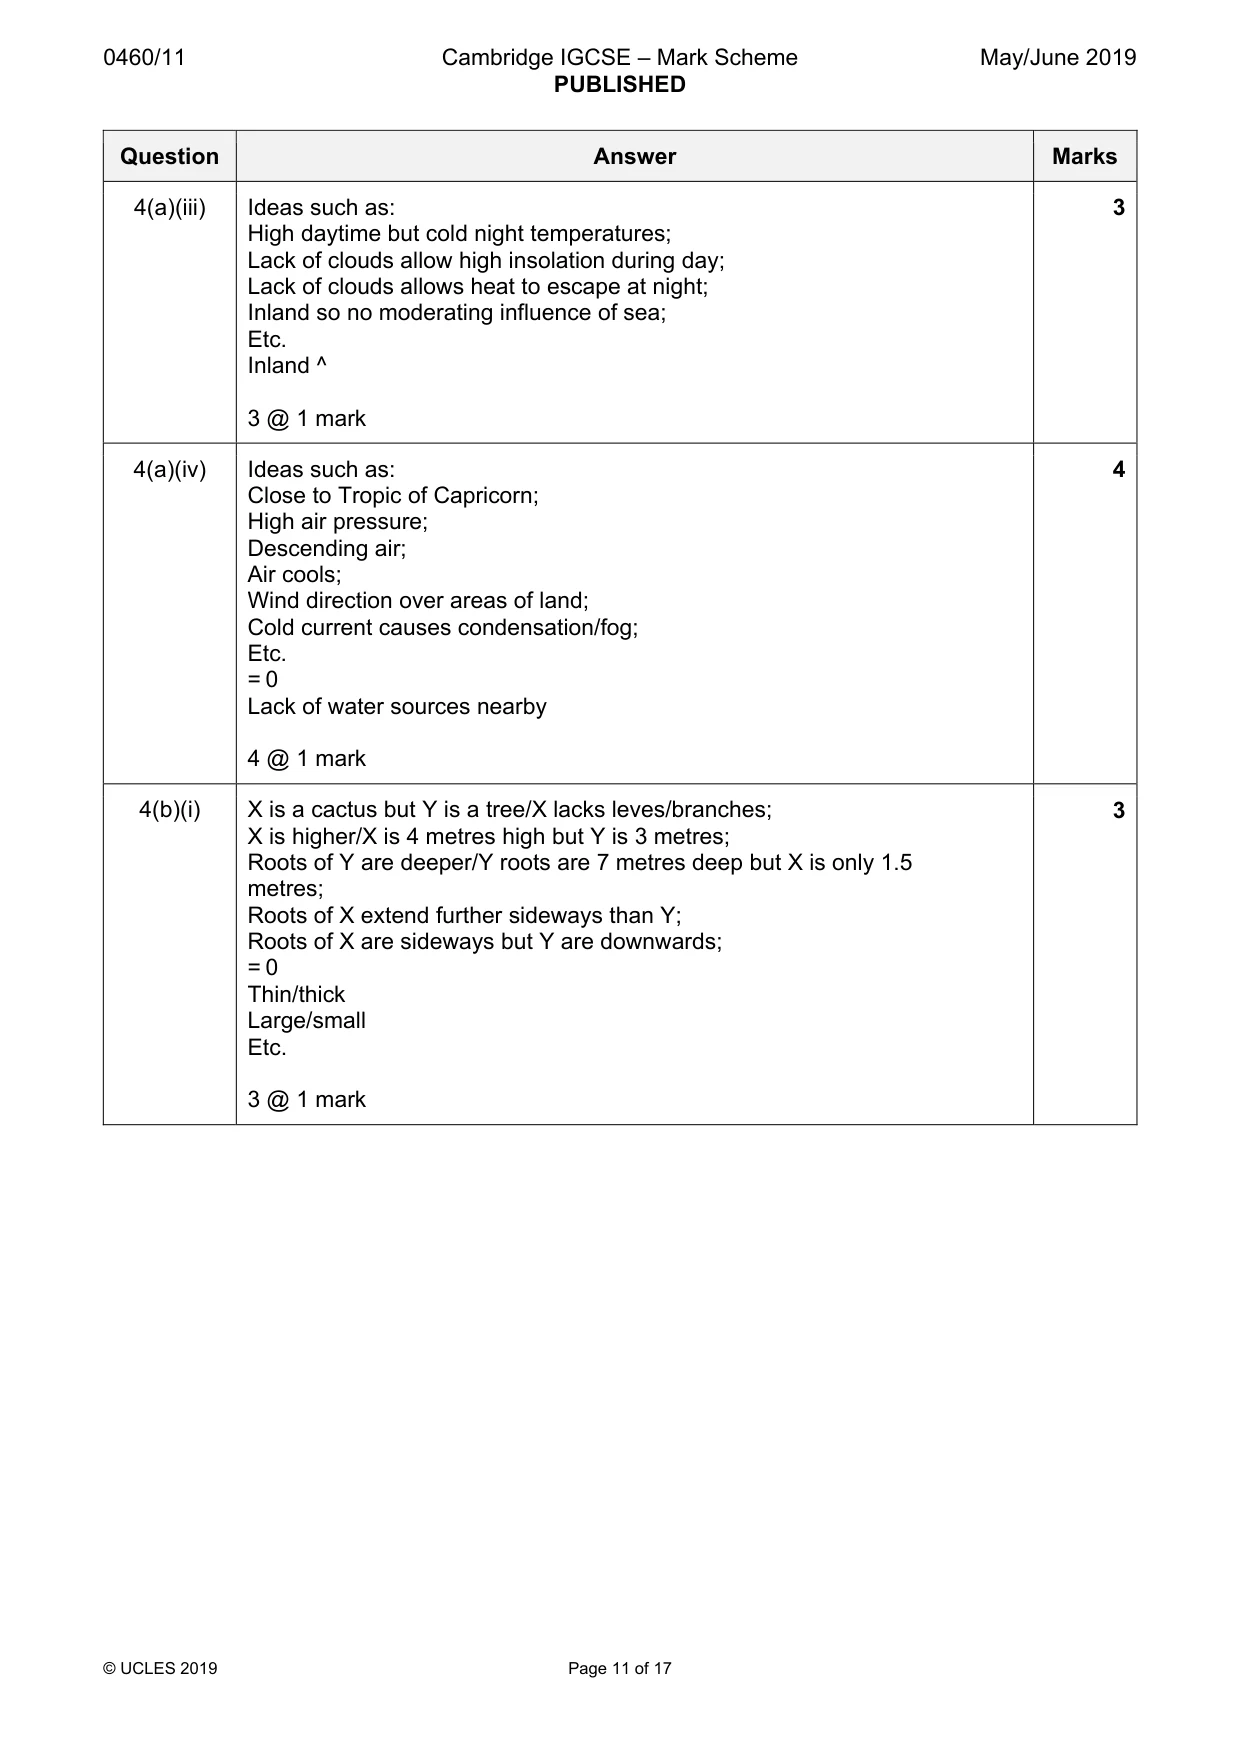
0460/11 Cambridge IGCSE – Mark Scheme PUBLISHED May/June 2019 © UCLES 2019 Page 11 of 17 Question Answer Marks 4(a)(iii) Ideas such as: High daytime but cold night temperatures; Lack of clouds allow high insolation during day; Lack of clouds allows heat to escape at night; Inland so no moderating influence of sea; Etc. Inland ^ 3 @ 1 mark 3 4(a)(iv) Ideas such as: Close to Tropic of Capricorn; High air pressure; Descending air; Air cools; Wind direction over areas of land; Cold current causes condensation/fog; Etc. = 0 Lack of water sources nearby 4 @ 1 mark 4 4(b)(i) X is a cactus but Y is a tree/X lacks leves/branches; X is higher/X is 4 metres high but Y is 3 metres; Roots of Y are deeper/Y roots are 7 metres deep but X is only 1.5 metres; Roots of X extend further sideways than Y; Roots of X are sideways but Y are downwards; = 0 Thin/thick Large/small Etc. 3 @ 1 mark 3
Mark scheme, page 12
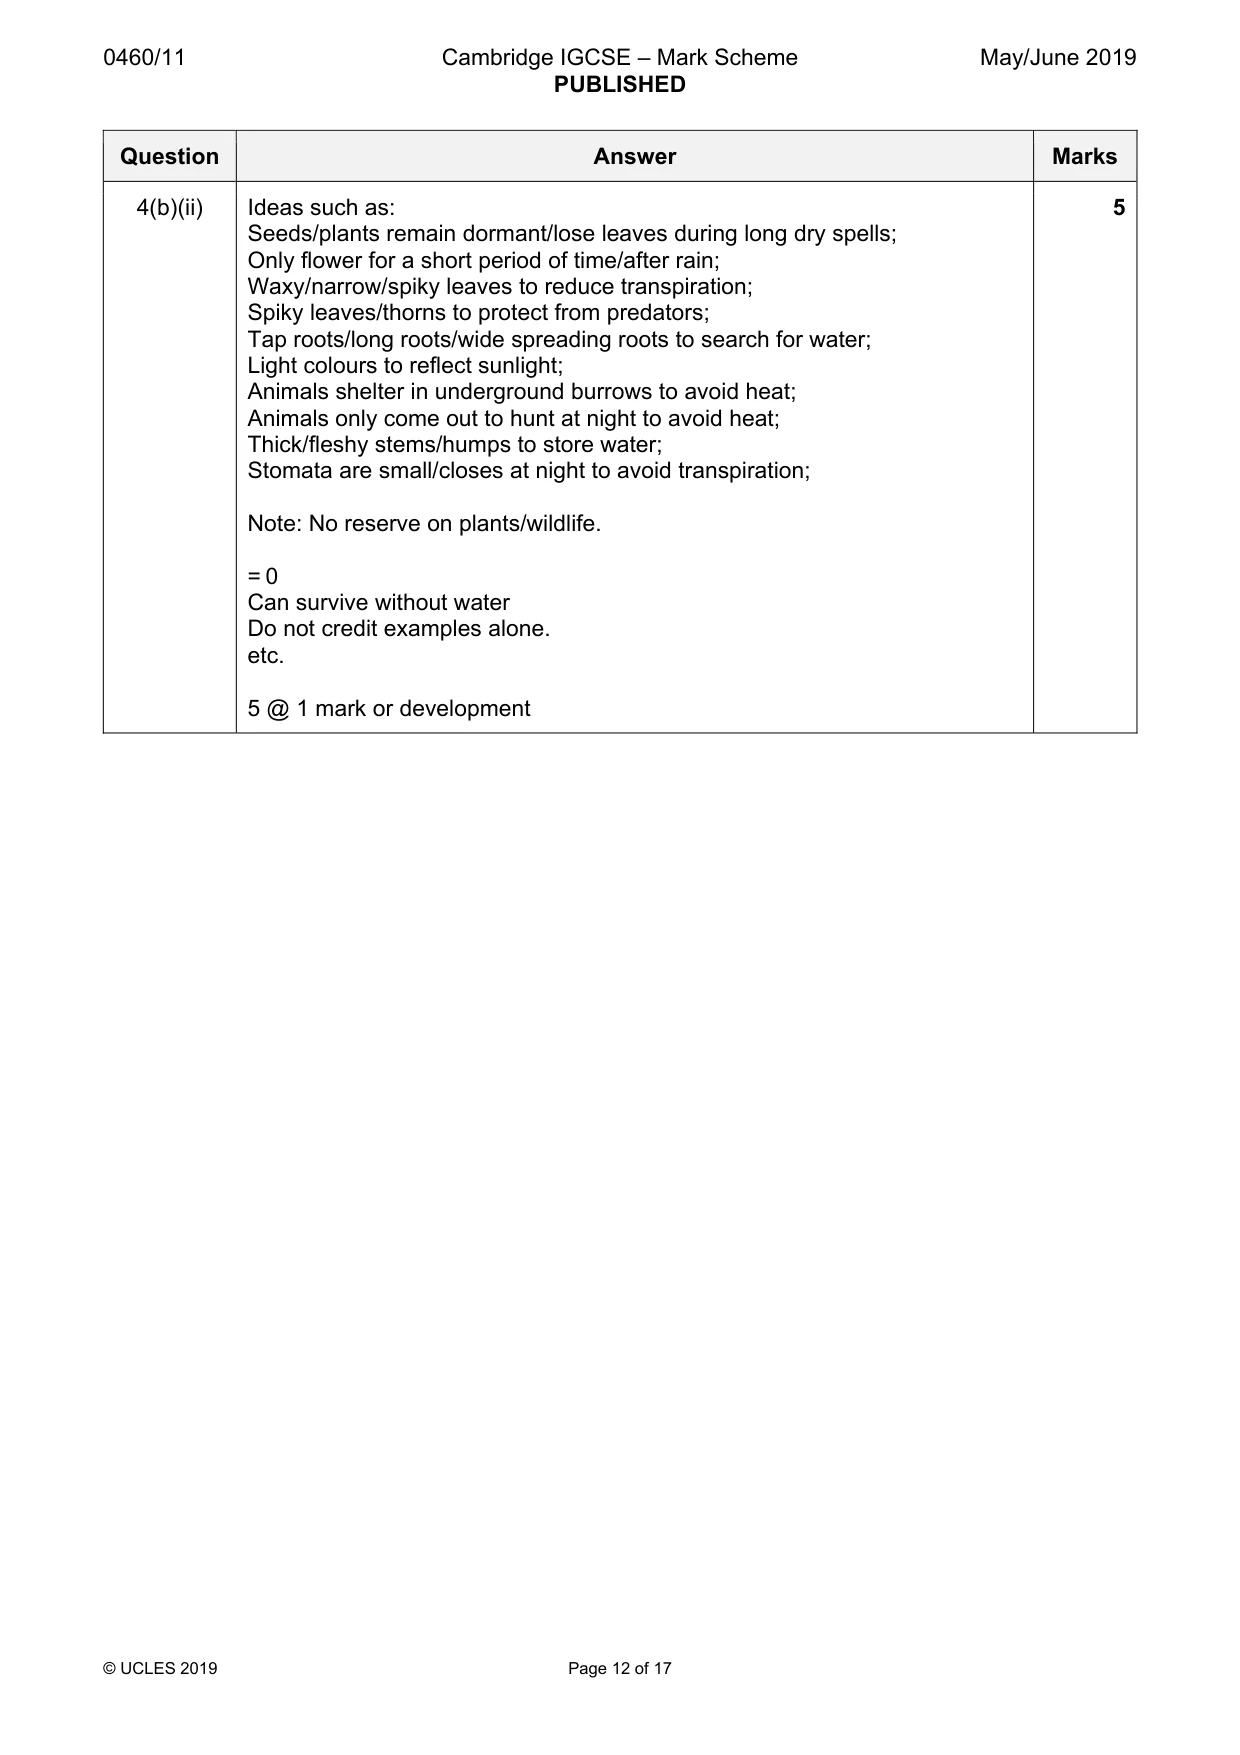
0460/11 Cambridge IGCSE – Mark Scheme PUBLISHED May/June 2019 © UCLES 2019 Page 12 of 17 Question Answer Marks 4(b)(ii) Ideas such as: Seeds/plants remain dormant/lose leaves during long dry spells; Only flower for a short period of time/after rain; Waxy/narrow/spiky leaves to reduce transpiration; Spiky leaves/thorns to protect from predators; Tap roots/long roots/wide spreading roots to search for water; Light colours to reflect sunlight; Animals shelter in underground burrows to avoid heat; Animals only come out to hunt at night to avoid heat; Thick/fleshy stems/humps to store water; Stomata are small/closes at night to avoid transpiration; Note: No reserve on plants/wildlife. = 0 Can survive without water Do not credit examples alone. etc. 5 @ 1 mark or development 5
Mark scheme, page 13
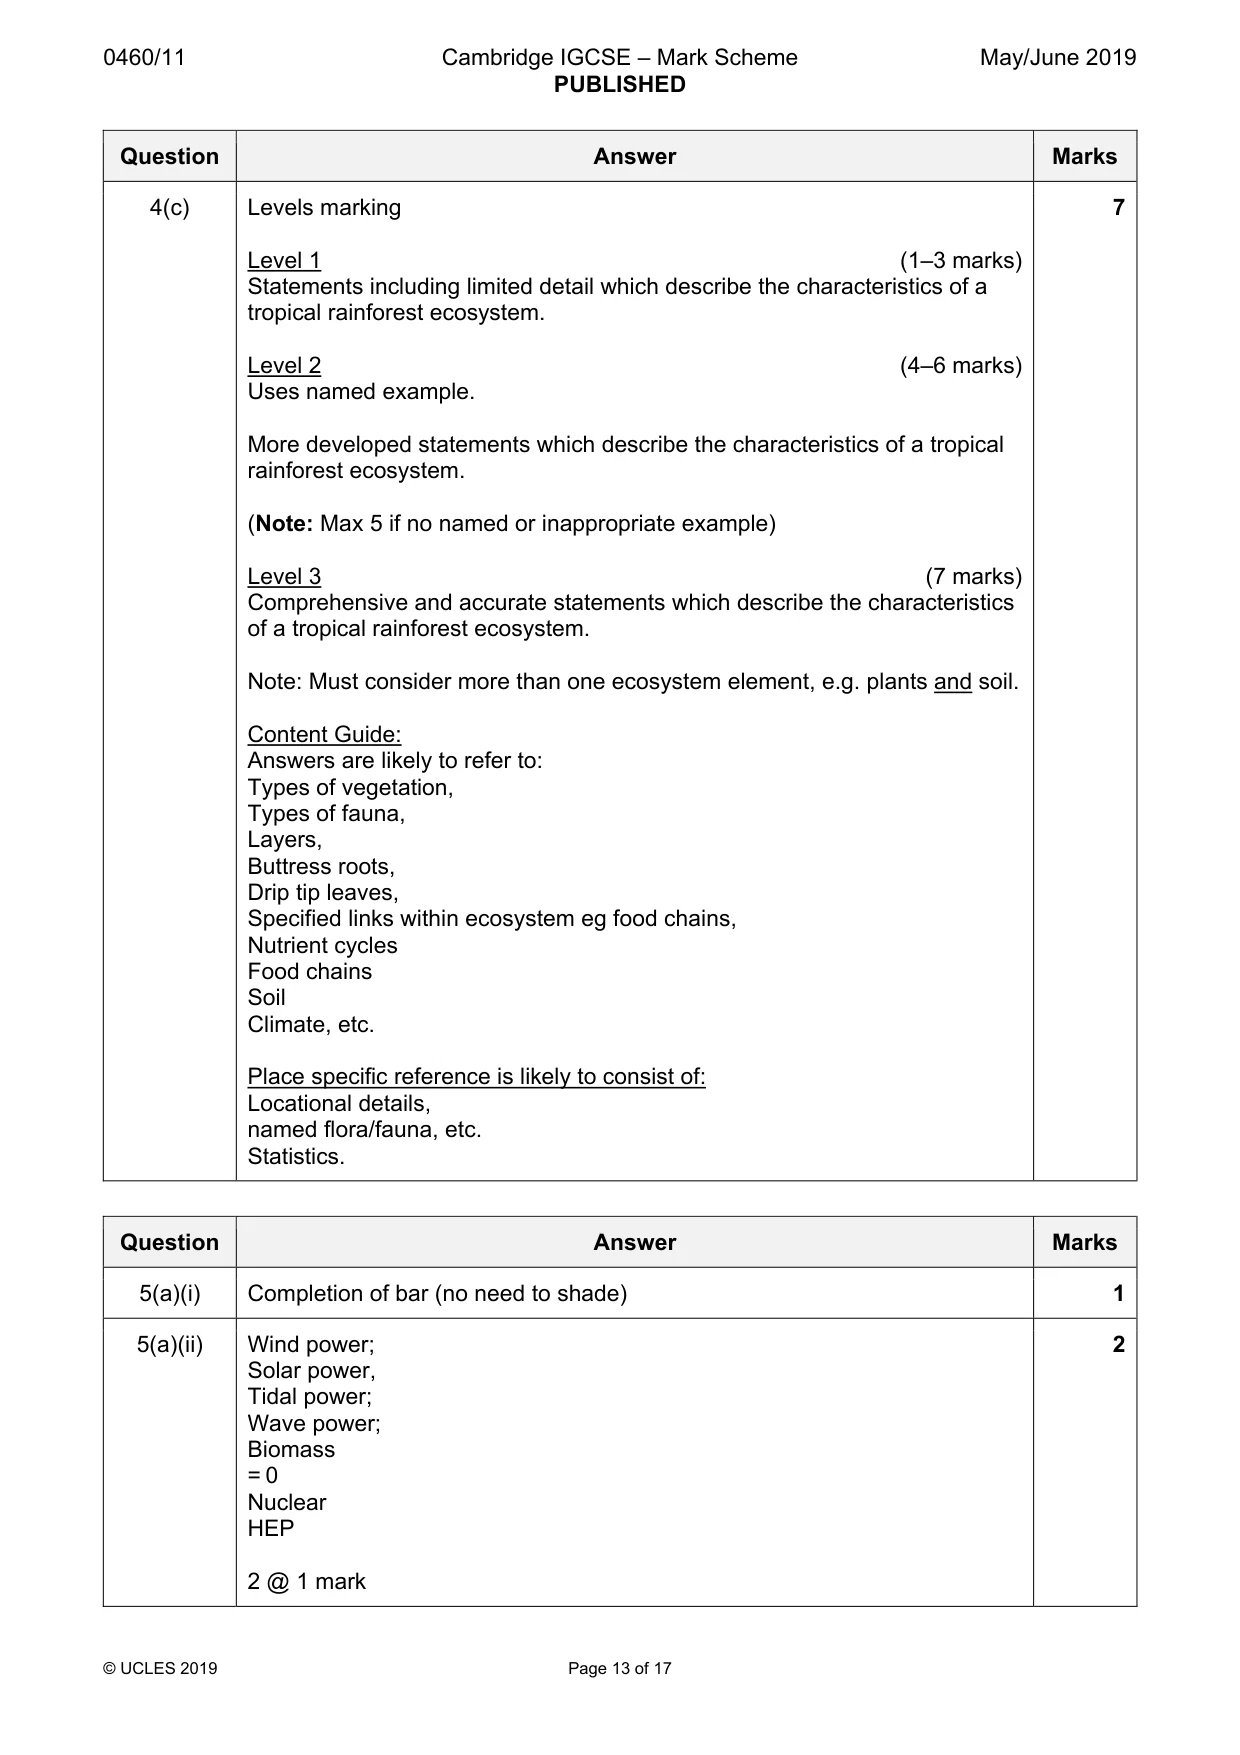
0460/11 Cambridge IGCSE – Mark Scheme PUBLISHED May/June 2019 © UCLES 2019 Page 13 of 17 Question Answer Marks 4(c) Levels marking Level 1 (1–3 marks) Statements including limited detail which describe the characteristics of a tropical rainforest ecosystem. Level 2 (4–6 marks) Uses named example. More developed statements which describe the characteristics of a tropical rainforest ecosystem. (Note: Max 5 if no named or inappropriate example) Level 3 (7 marks) Comprehensive and accurate statements which describe the characteristics of a tropical rainforest ecosystem. Note: Must consider more than one ecosystem element, e.g. plants and soil. Content Guide: Answers are likely to refer to: Types of vegetation, Types of fauna, Layers, Buttress roots, Drip tip leaves, Specified links within ecosystem eg food chains, Nutrient cycles Food chains Soil Climate, etc. Place specific reference is likely to consist of: Locational details, named flora/fauna, etc. Statistics. 7 Question Answer Marks 5(a)(i) Completion of bar (no need to shade) 1 5(a)(ii) Wind power; Solar power, Tidal power; Wave power; Biomass = 0 Nuclear HEP 2 @ 1 mark 2
Mark scheme, page 14
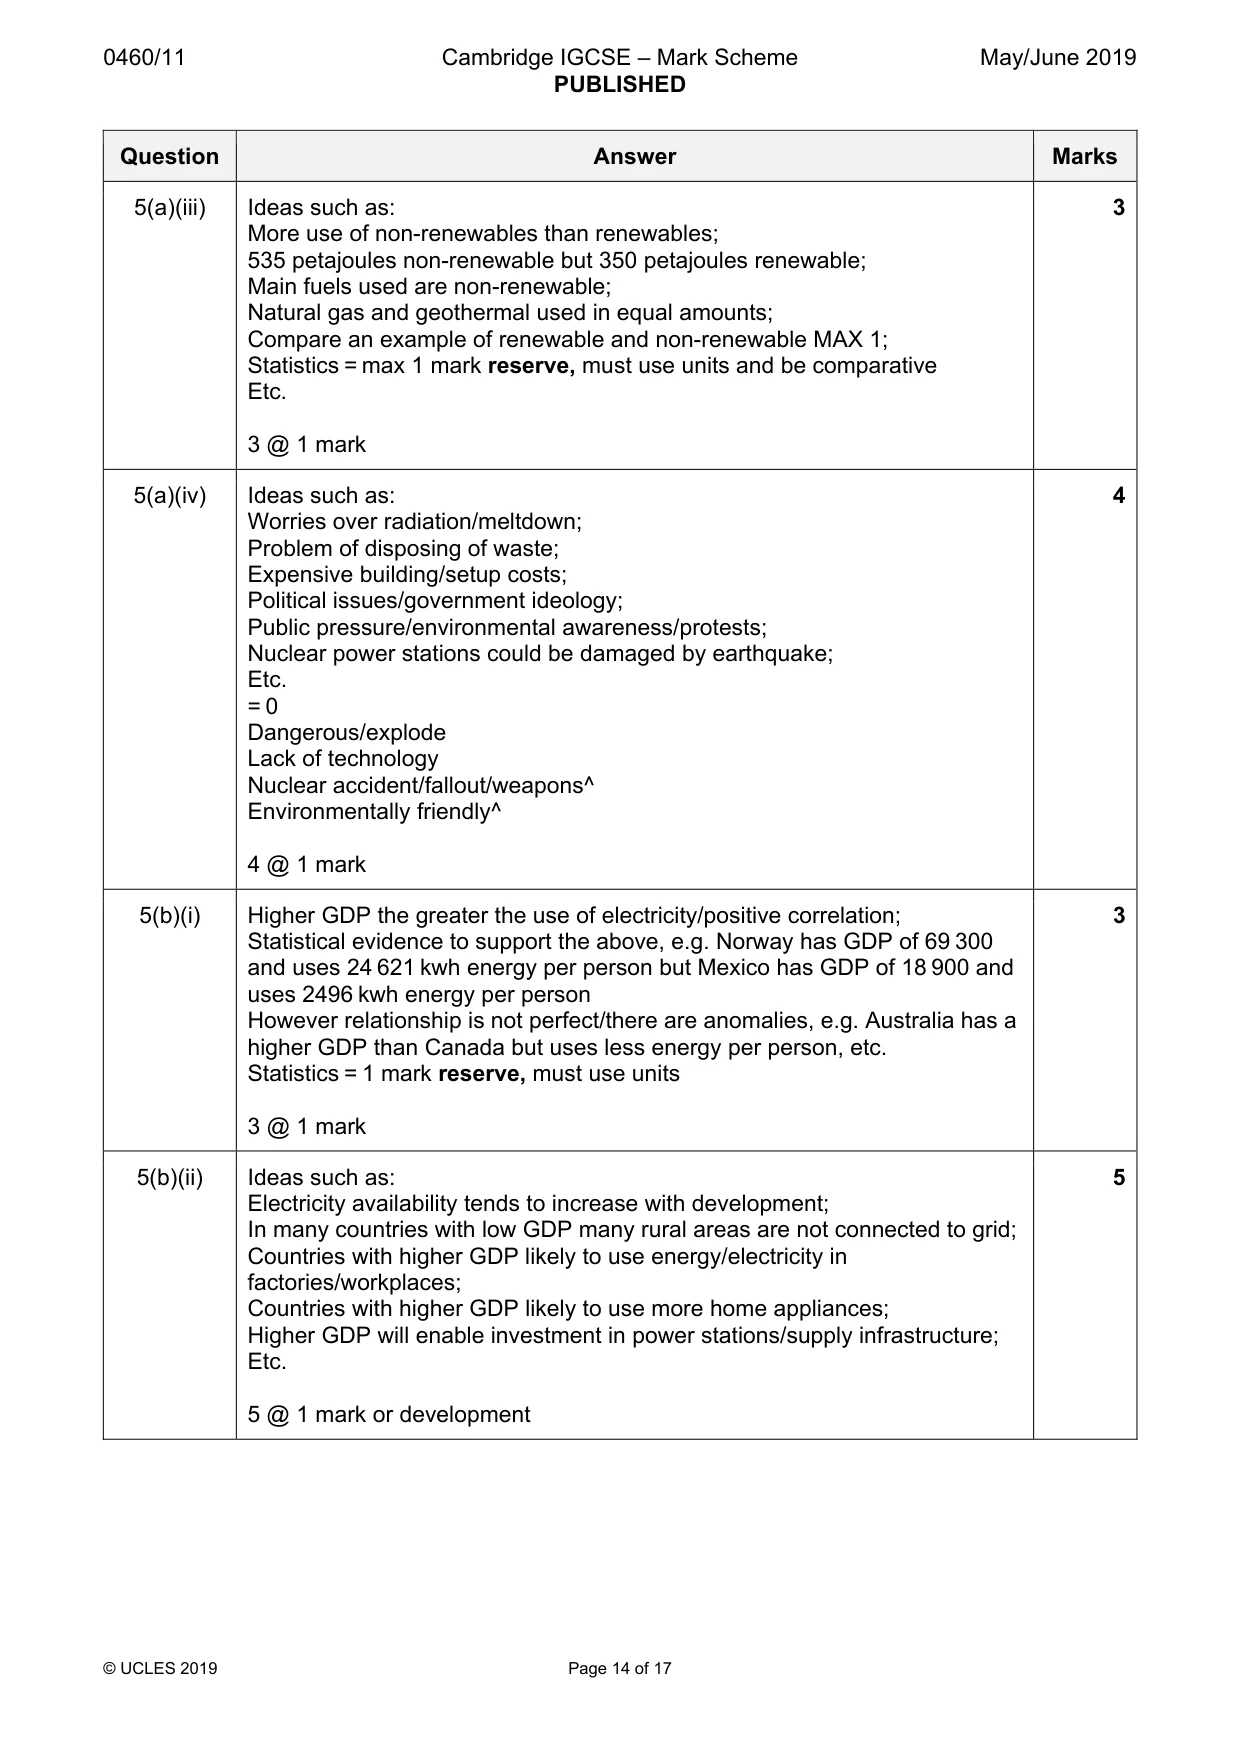
0460/11 Cambridge IGCSE – Mark Scheme PUBLISHED May/June 2019 © UCLES 2019 Page 14 of 17 Question Answer Marks 5(a)(iii) Ideas such as: More use of non-renewables than renewables; 535 petajoules non-renewable but 350 petajoules renewable; Main fuels used are non-renewable; Natural gas and geothermal used in equal amounts; Compare an example of renewable and non-renewable MAX 1; Statistics = max 1 mark reserve, must use units and be comparative Etc. 3 @ 1 mark 3 5(a)(iv) Ideas such as: Worries over radiation/meltdown; Problem of disposing of waste; Expensive building/setup costs; Political issues/government ideology; Public pressure/environmental awareness/protests; Nuclear power stations could be damaged by earthquake; Etc. = 0 Dangerous/explode Lack of technology Nuclear accident/fallout/weapons^ Environmentally friendly^ 4 @ 1 mark 4 5(b)(i) Higher GDP the greater the use of electricity/positive correlation; Statistical evidence to support the above, e.g. Norway has GDP of 69 300 and uses 24 621 kwh energy per person but Mexico has GDP of 18 900 and uses 2496 kwh energy per person However relationship is not perfect/there are anomalies, e.g. Australia has a higher GDP than Canada but uses less energy per person, etc. Statistics = 1 mark reserve, must use units 3 @ 1 mark 3 5(b)(ii) Ideas such as: Electricity availability tends to increase with development; In many countries with low GDP many rural areas are not connected to grid; Countries with higher GDP likely to use energy/electricity in factories/workplaces; Countries with higher GDP likely to use more home appliances; Higher GDP will enable investment in power stations/supply infrastructure; Etc. 5 @ 1 mark or development 5
Mark scheme, page 15
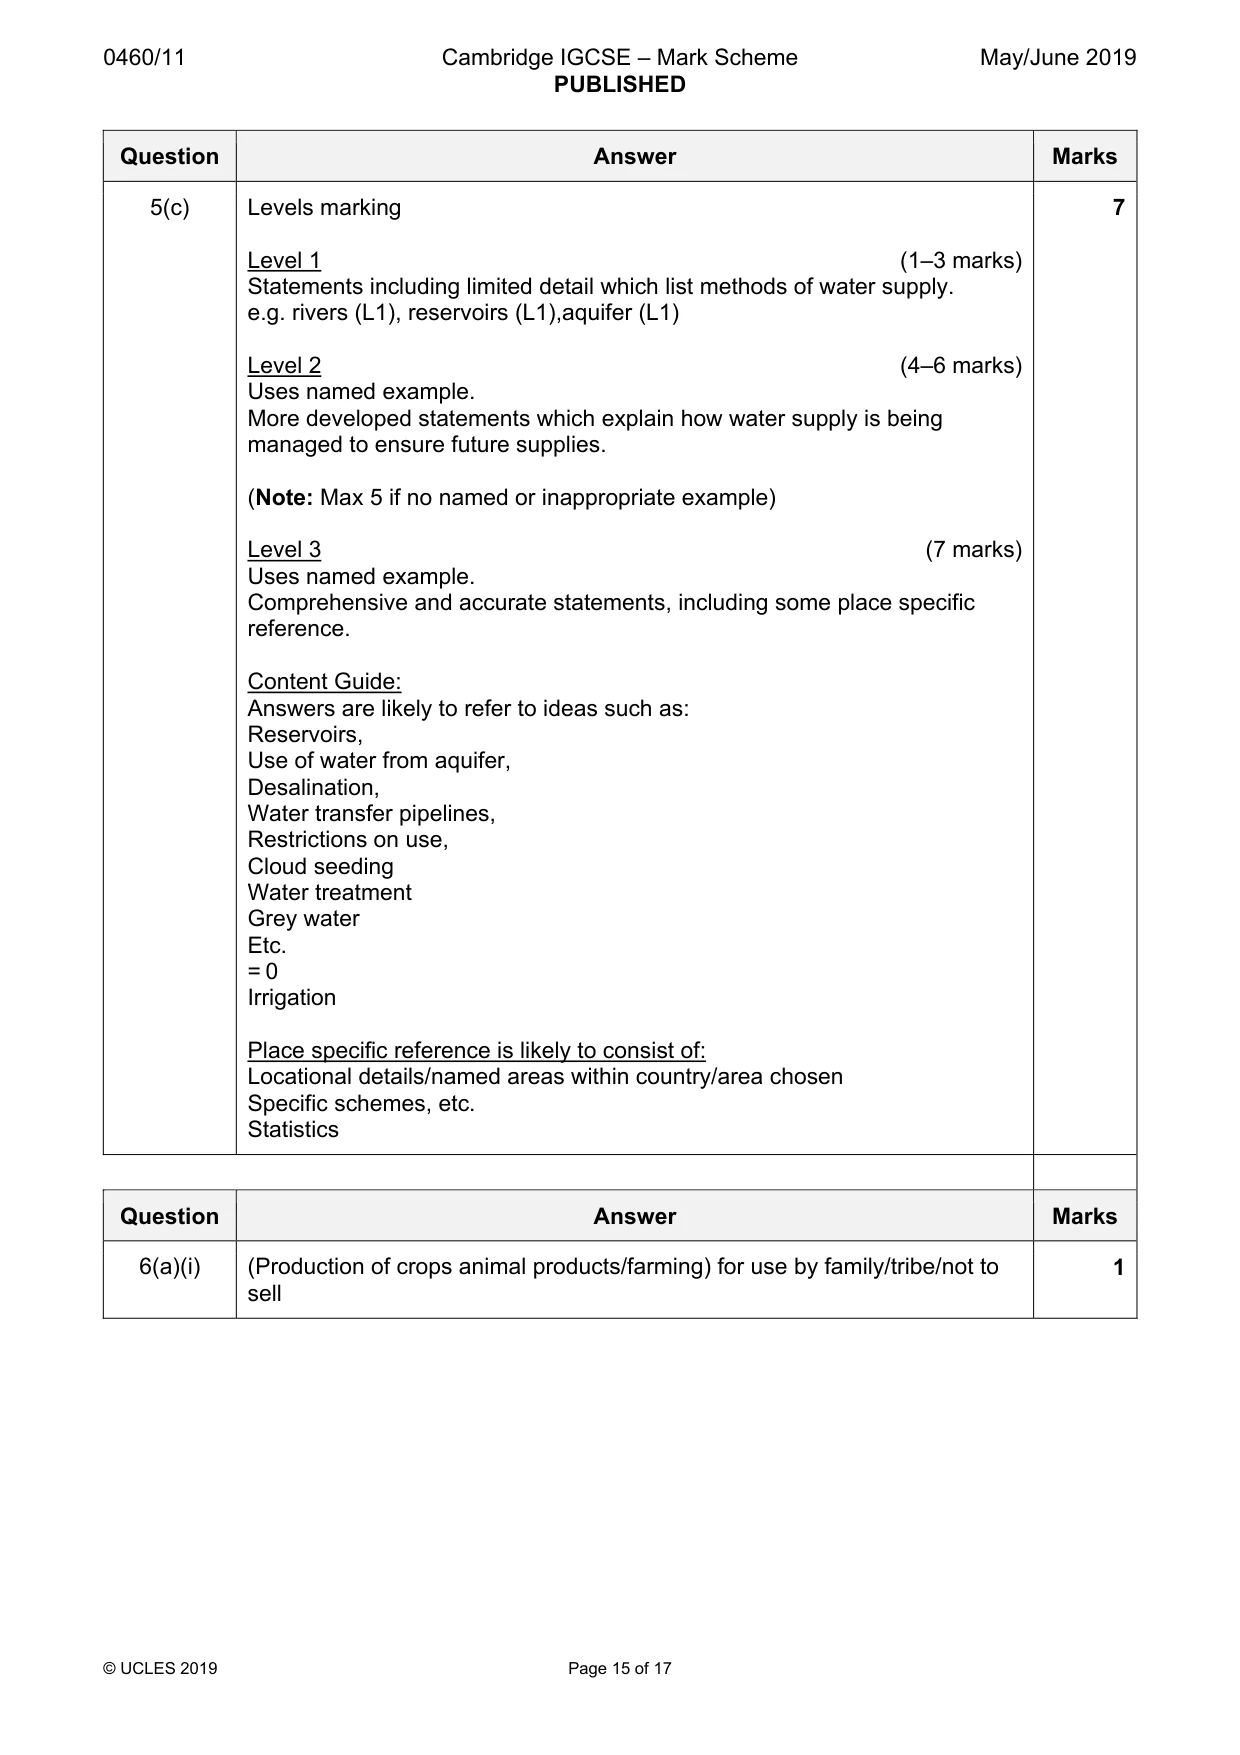
0460/11 Cambridge IGCSE – Mark Scheme PUBLISHED May/June 2019 © UCLES 2019 Page 15 of 17 Question Answer Marks 5(c) Levels marking Level 1 (1–3 marks) Statements including limited detail which list methods of water supply. e.g. rivers (L1), reservoirs (L1),aquifer (L1) Level 2 (4–6 marks) Uses named example. More developed statements which explain how water supply is being managed to ensure future supplies. (Note: Max 5 if no named or inappropriate example) Level 3 (7 marks) Uses named example. Comprehensive and accurate statements, including some place specific reference. Content Guide: Answers are likely to refer to ideas such as: Reservoirs, Use of water from aquifer, Desalination, Water transfer pipelines, Restrictions on use, Cloud seeding Water treatment Grey water Etc. = 0 Irrigation Place specific reference is likely to consist of: Locational details/named areas within country/area chosen Specific schemes, etc. Statistics 7 Question Answer Marks 6(a)(i) (Production of crops animal products/farming) for use by family/tribe/not to sell 1
Mark scheme, page 16
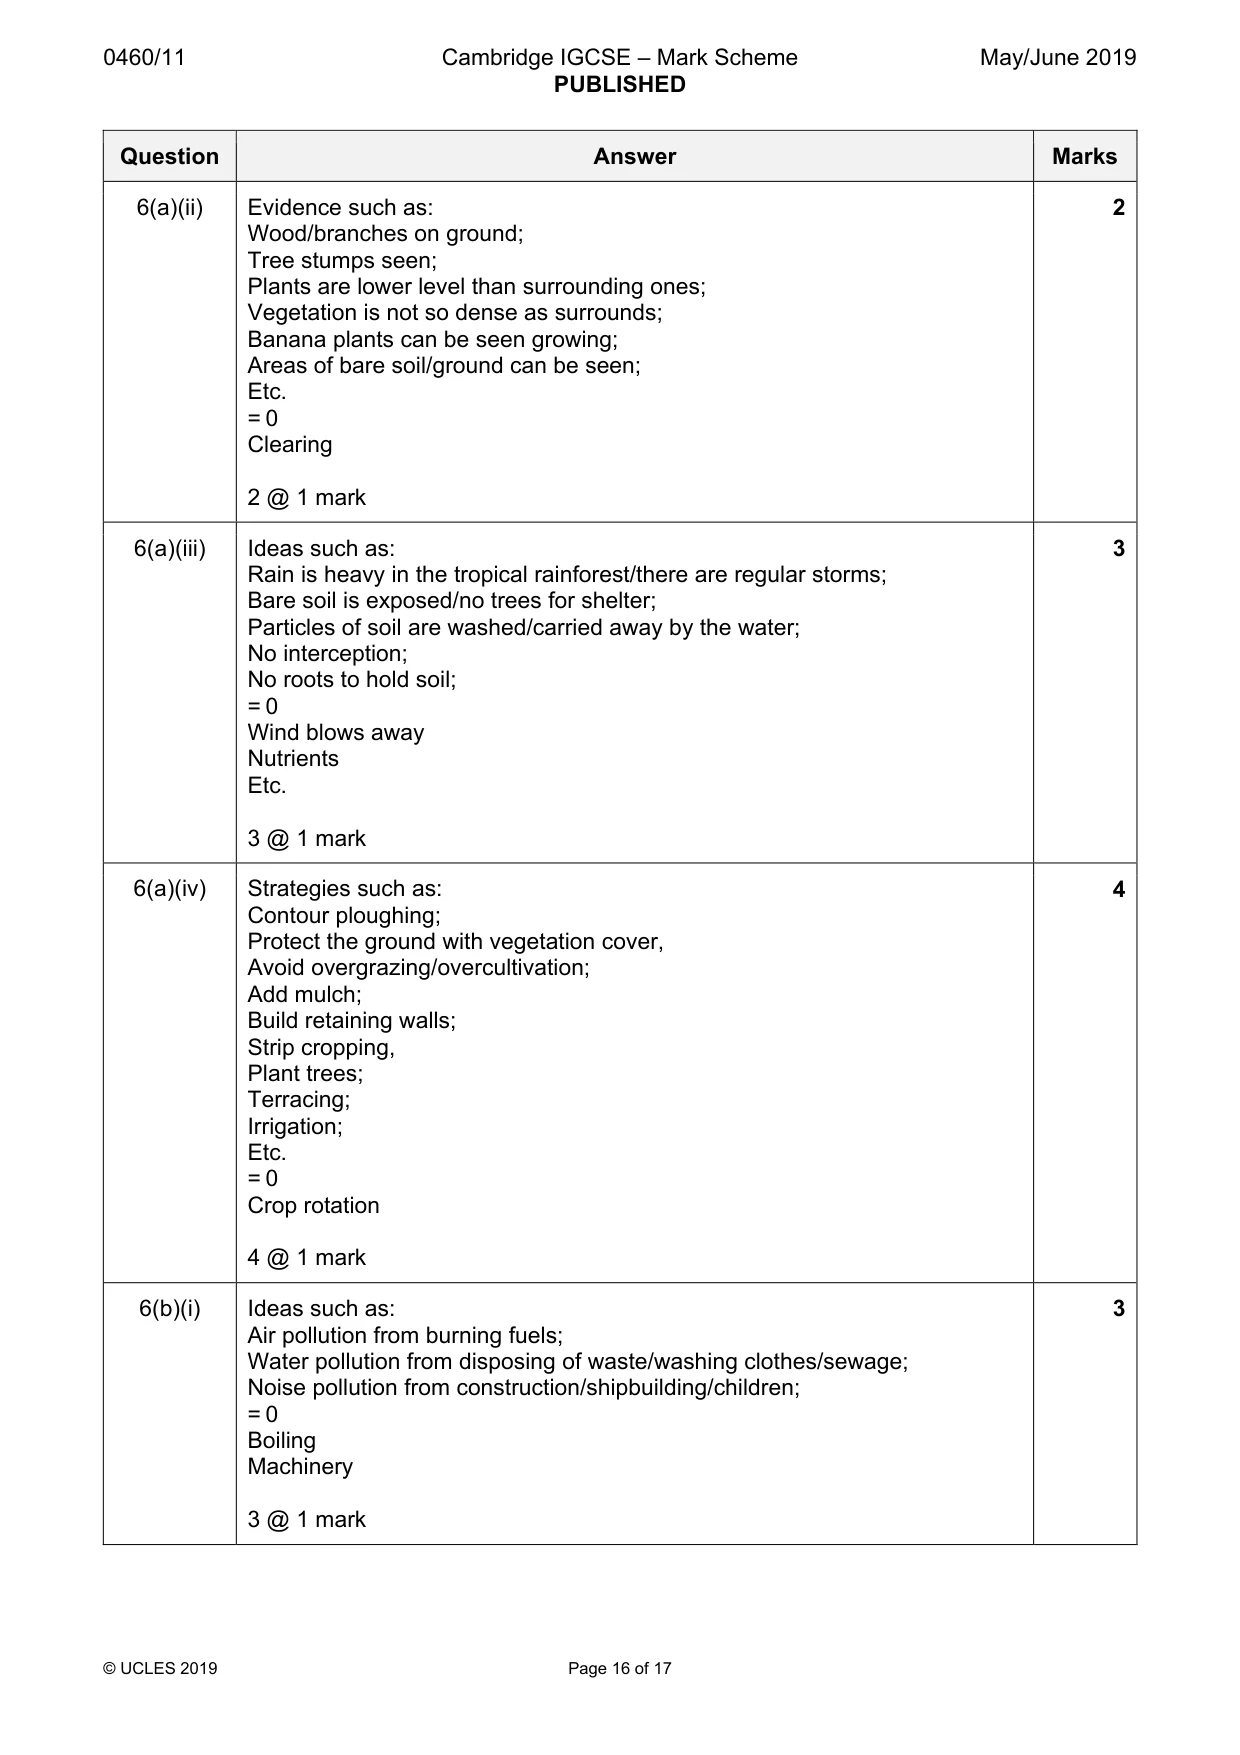
0460/11 Cambridge IGCSE – Mark Scheme PUBLISHED May/June 2019 © UCLES 2019 Page 16 of 17 Question Answer Marks 6(a)(ii) Evidence such as: Wood/branches on ground; Tree stumps seen; Plants are lower level than surrounding ones; Vegetation is not so dense as surrounds; Banana plants can be seen growing; Areas of bare soil/ground can be seen; Etc. = 0 Clearing 2 @ 1 mark 2 6(a)(iii) Ideas such as: Rain is heavy in the tropical rainforest/there are regular storms; Bare soil is exposed/no trees for shelter; Particles of soil are washed/carried away by the water; No interception; No roots to hold soil; = 0 Wind blows away Nutrients Etc. 3 @ 1 mark 3 6(a)(iv) Strategies such as: Contour ploughing; Protect the ground with vegetation cover, Avoid overgrazing/overcultivation; Add mulch; Build retaining walls; Strip cropping, Plant trees; Terracing; Irrigation; Etc. = 0 Crop rotation 4 @ 1 mark 4 6(b)(i) Ideas such as: Air pollution from burning fuels; Water pollution from disposing of waste/washing clothes/sewage; Noise pollution from construction/shipbuilding/children; = 0 Boiling Machinery 3 @ 1 mark 3
Mark scheme, page 17
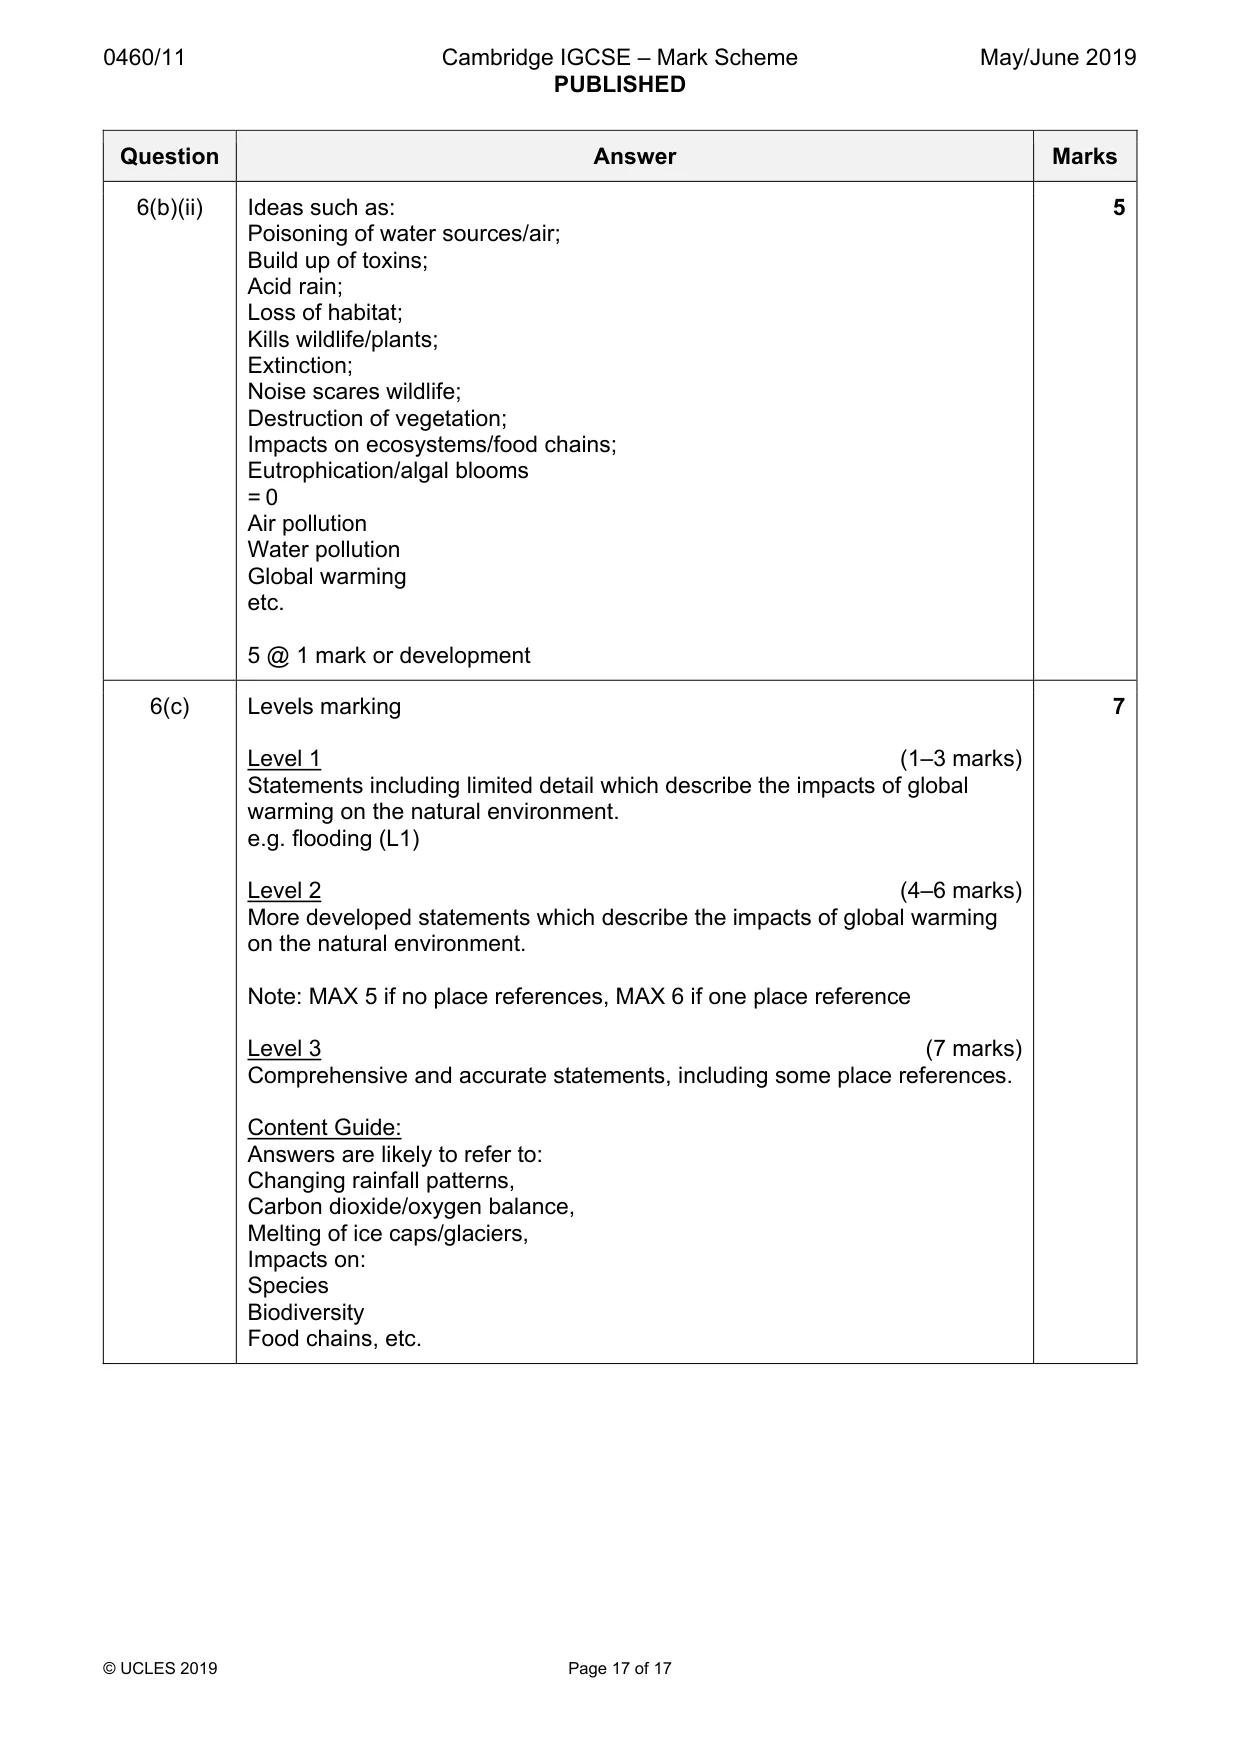
0460/11 Cambridge IGCSE – Mark Scheme PUBLISHED May/June 2019 © UCLES 2019 Page 17 of 17 Question Answer Marks 6(b)(ii) Ideas such as: Poisoning of water sources/air; Build up of toxins; Acid rain; Loss of habitat; Kills wildlife/plants; Extinction; Noise scares wildlife; Destruction of vegetation; Impacts on ecosystems/food chains; Eutrophication/algal blooms = 0 Air pollution Water pollution Global warming etc. 5 @ 1 mark or development 5 6(c) Levels marking Level 1 (1–3 marks) Statements including limited detail which describe the impacts of global warming on the natural environment. e.g. flooding (L1) Level 2 (4–6 marks) More developed statements which describe the impacts of global warming on the natural environment. Note: MAX 5 if no place references, MAX 6 if one place reference Level 3 (7 marks) Comprehensive and accurate statements, including some place references. Content Guide: Answers are likely to refer to: Changing rainfall patterns, Carbon dioxide/oxygen balance, Melting of ice caps/glaciers, Impacts on: Species Biodiversity Food chains, etc. 7
What you needed in this session
Cambridge’s own grade thresholds for 2019 May/June, Paper 1 · Variant 1. A higher threshold means an easier paper — the bar moves with how the cohort did.