Cambridge IGCSE Geography 0460 — 2019 May/June Paper 1 · Variant 3
0460/13/M/J/19 · 75 marks · ≈84 min
The question paper and its mark scheme, free to read here and free to download. This is Cambridge’s own paper, exactly as it was sat.
Question paper28 pages

Mark scheme18 pages
Answers below. Sit the paper first if you are practising.
Paper as text
Question paper, page 1
This document consists of 28 printed pages and 1 Insert. DC (CE/CB) 162397/7 © UCLES 2019 [Turn over Cambridge Assessment International Education Cambridge International General Certificate of Secondary Education * 5 1 0 9 5 7 0 4 5 4 * GEOGRAPHY 0460/13 Paper 1 May/June 2019 `1 hour 45 minutes Candidates answer on the Question Paper. Additional Materials: Ruler Calculator Protractor READ THESE INSTRUCTIONS FIRST Write your centre number, candidate number and name in the spaces provided. Write in dark blue or black pen. You may use an HB pencil for any diagrams or graphs. Do not use staples, paper clips, glue or correction fluid. DO NOT WRITE IN ANY BARCODES. Write your answer to each question in the space provided. If additional space is required, you should use the lined pages at the end of this booklet. The question number(s) must be clearly shown. Answer three questions, one from each section. The Insert contains Fig. 1.2 for Question 1, Fig. 4.3 for Question 4, Figs. 5.2 and 5.3 for Question 5, and Figs. 6.1 and 6.2 for Question 6. The Insert is not required by the Examiner. Sketch maps and diagrams should be drawn whenever they serve to illustrate an answer. At the end of the examination, fasten all your work securely together. The number of marks is given in brackets [ ] at the end of each question or part question. Definitions MEDCs – More Economically Developed Countries LEDCs – Less Economically Developed Countries This syllabus is regulated for use in England, Wales and Northern Ireland as a Cambridge International Level 1/Level 2 Certificate.
Question paper, page 2
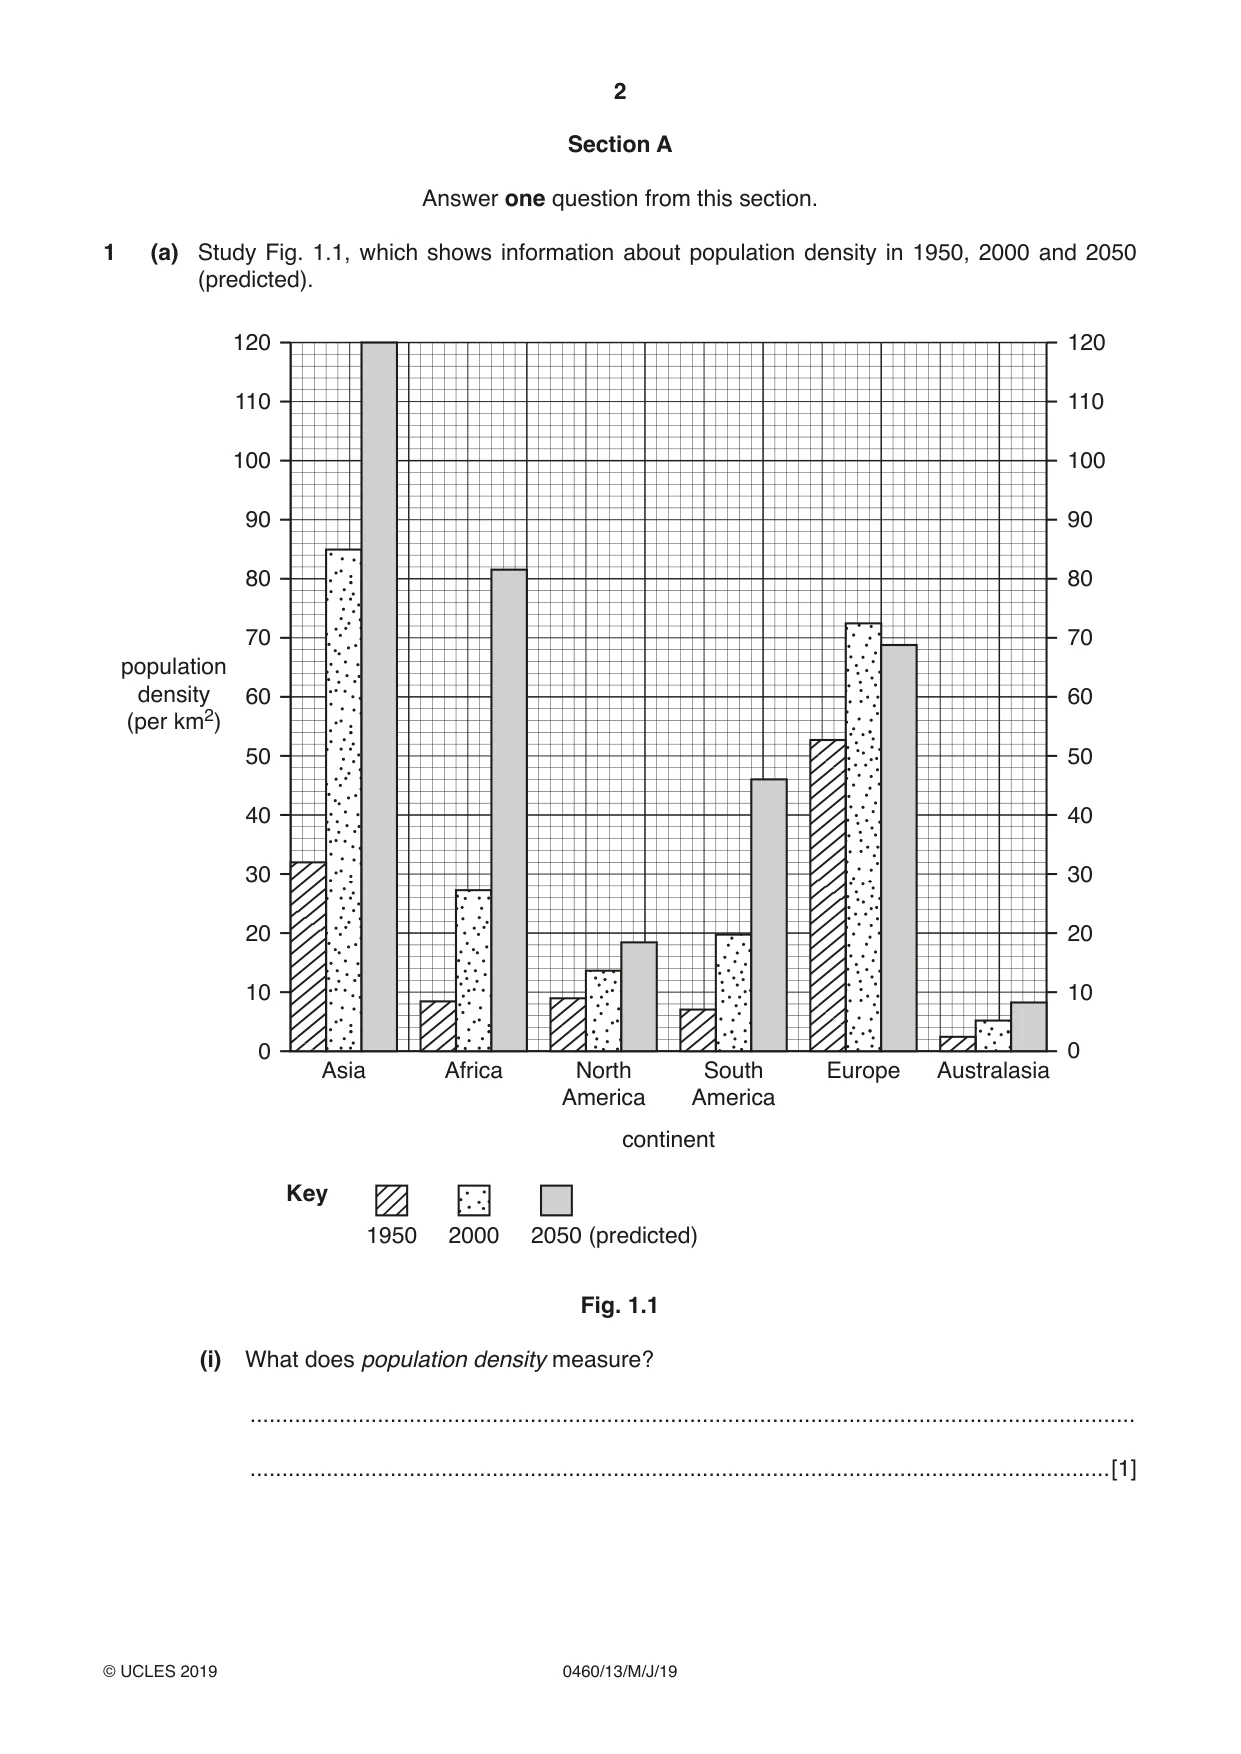
2 0460/13/M/J/19 © UCLES 2019 Section A Answer one question from this section. 1 (a) Study Fig. 1.1, which shows information about population density in 1950, 2000 and 2050 (predicted). 10 0 20 30 40 50 60 70 80 90 100 110 120 10 0 20 30 40 50 60 70 80 90 100 110 120 Asia Africa North America South America continent population density (per km2) Key 1950 2000 2050 (predicted) Europe Australasia Fig. 1.1 (i) What does population density measure? … …[1]
Question paper, page 3
3 0460/13/M/J/19 © UCLES 2019 [Turn over (ii) Name the continent with: - an increase in population density of over 50 per km2 between 1950 and 2000 … - a predicted decrease in population density between 2000 and 2050. … [2] (iii) Parts of Australasia and North America are under-populated. Explain why some areas are underpopulated. … … … … … …[3] (iv) Describe the impacts of over-population on a country. … … … … … … … …[4]
Question paper, page 4
4 0460/13/M/J/19 © UCLES 2019 (b) Study Fig. 1.2 (Insert), which is a photograph of an area which is sparsely populated. (i) Explain how physical factors have influenced the population density and distribution in the area shown in Fig. 1.2. … … … … … …[3] (ii) Explain why many areas with good transport networks are densely populated. … … … … … … … … … …[5]
Question paper, page 5
5 0460/13/M/J/19 © UCLES 2019 [Turn over (c) Explain the causes of an example of international migration you have studied. Migration from … to … Explanation … … … … … … … … … … … … … … … … … … … … … … … … …[7] [Total: 25]
Question paper, page 6
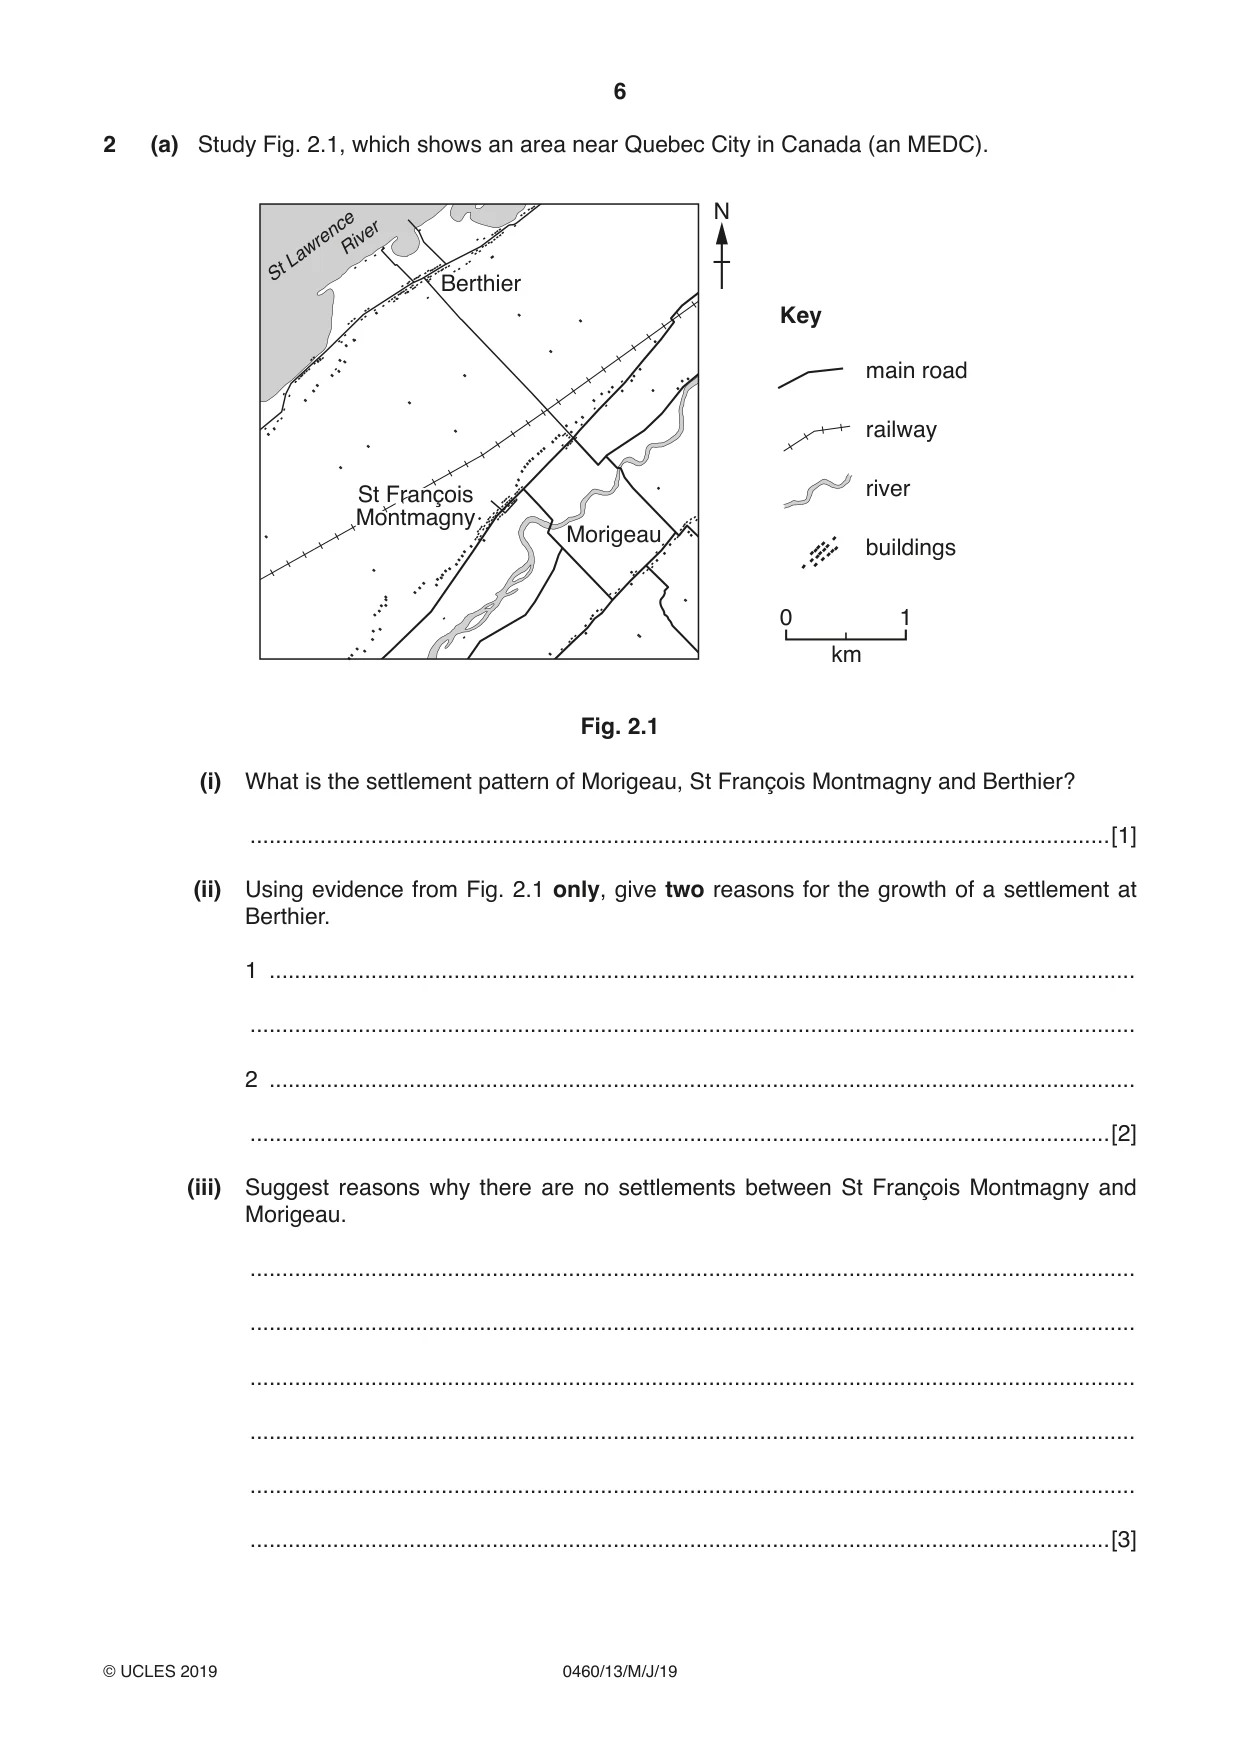
6 0460/13/M/J/19 © UCLES 2019 2 (a) Study Fig. 2.1, which shows an area near Quebec City in Canada (an MEDC). Morigeau main road railway river buildings km 0 1 Key Berthier St Lawrence River St François Montmagny N Fig. 2.1 (i) What is the settlement pattern of Morigeau, St François Montmagny and Berthier? …[1] (ii) Using evidence from Fig. 2.1 only, give two reasons for the growth of a settlement at Berthier. 1 … … 2 … …[2] (iii) Suggest reasons why there are no settlements between St François Montmagny and Morigeau. … … … … … …[3]
Question paper, page 7
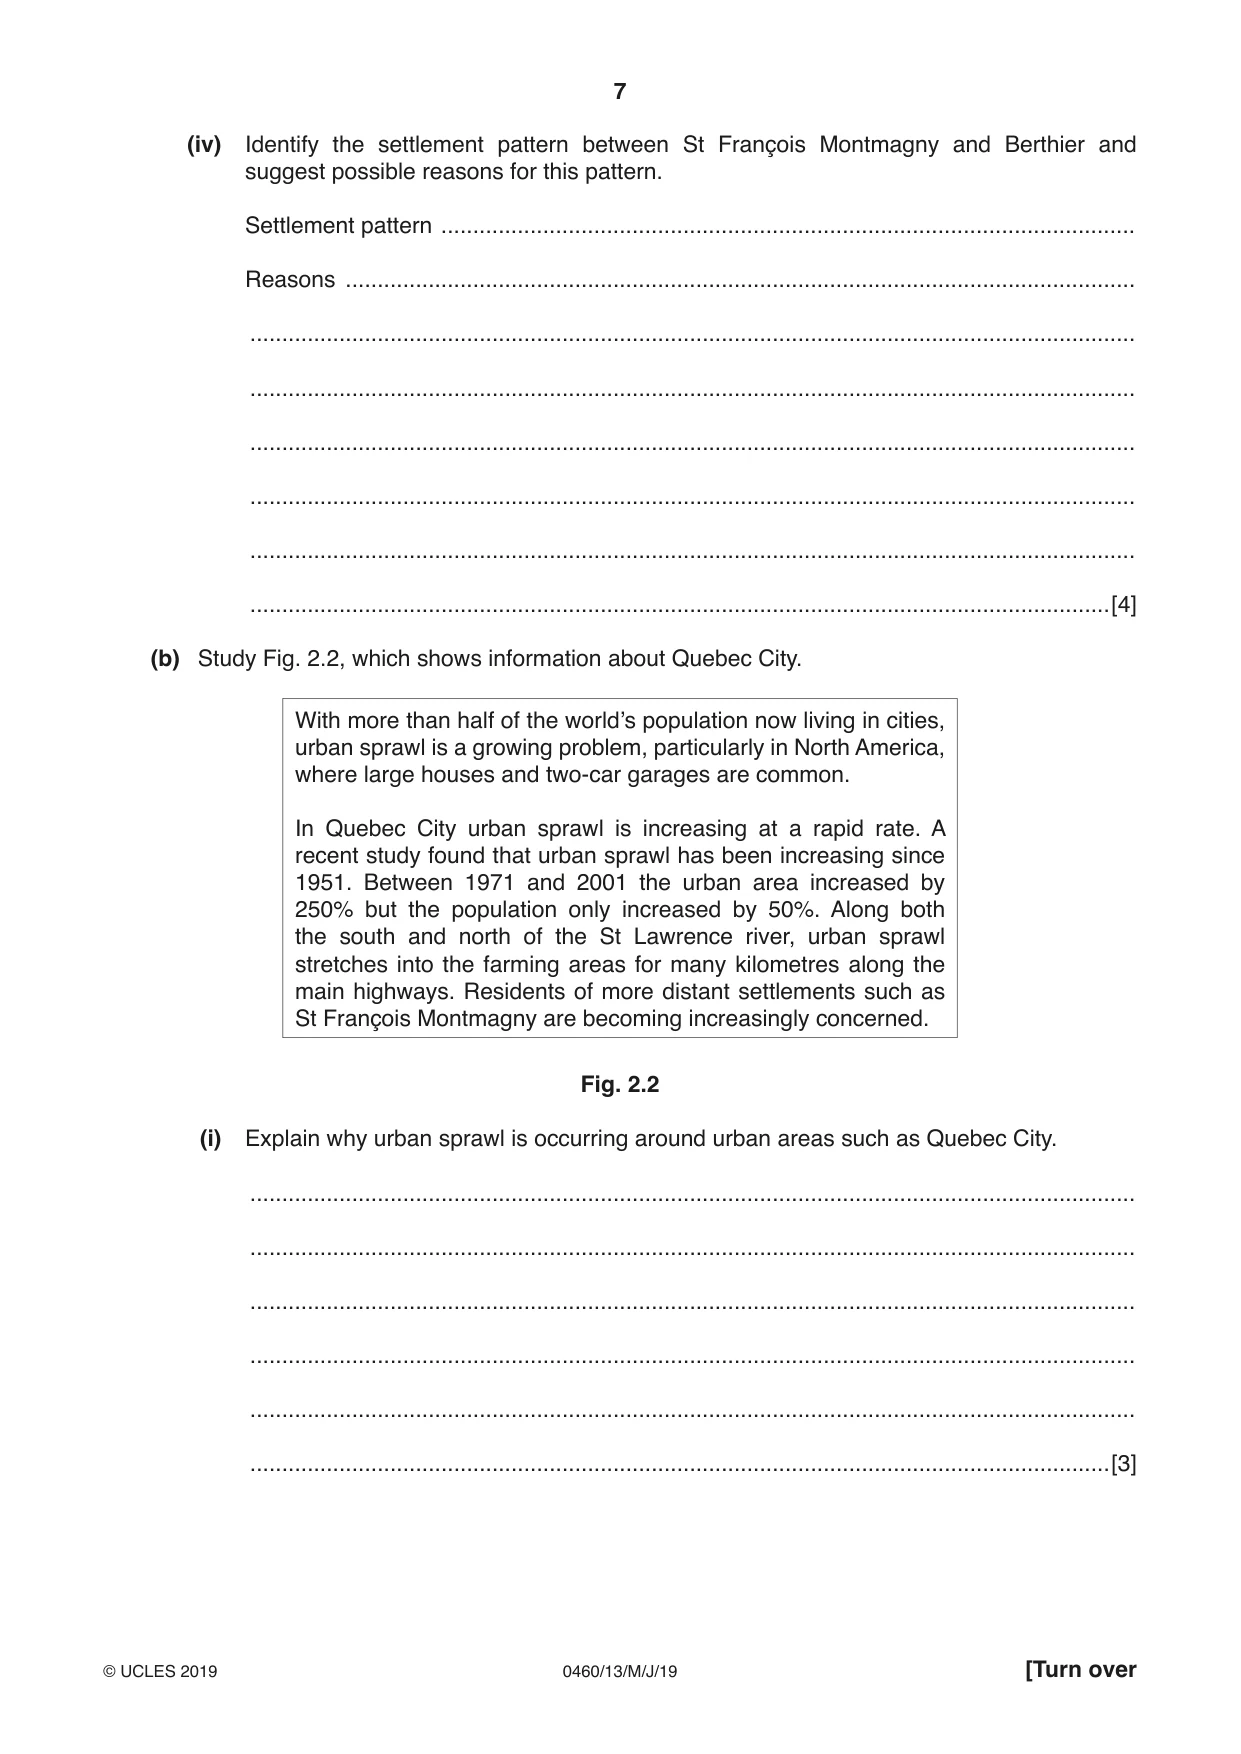
7 0460/13/M/J/19 © UCLES 2019 [Turn over (iv) Identify the settlement pattern between St François Montmagny and Berthier and suggest possible reasons for this pattern. Settlement pattern … Reasons … … … … … … …[4] (b) Study Fig. 2.2, which shows information about Quebec City. With more than half of the world’s population now living in cities, urban sprawl is a growing problem, particularly in North America, where large houses and two-car garages are common. In Quebec City urban sprawl is increasing at a rapid rate. A recent study found that urban sprawl has been increasing since 1951. Between 1971 and 2001 the urban area increased by 250% but the population only increased by 50%. Along both the south and north of the St Lawrence river, urban sprawl stretches into the farming areas for many kilometres along the main highways. Residents of more distant settlements such as St François Montmagny are becoming increasingly concerned. Fig. 2.2 (i) Explain why urban sprawl is occurring around urban areas such as Quebec City. … … … … … …[3]
Question paper, page 8
8 0460/13/M/J/19 © UCLES 2019 (ii) Suggest reasons why residents of settlements such as St François Montmagny are becoming increasingly concerned by Quebec City’s urban sprawl. … … … … … … … … … …[5]
Question paper, page 9
9 0460/13/M/J/19 © UCLES 2019 [Turn over (c) For two named settlements of different sizes you have studied, compare the service provision. Name of settlement 1 … Name of settlement 2 … … … … … … … … … … … … … … … … … … … … … … … … …[7] [Total: 25]
Question paper, page 10
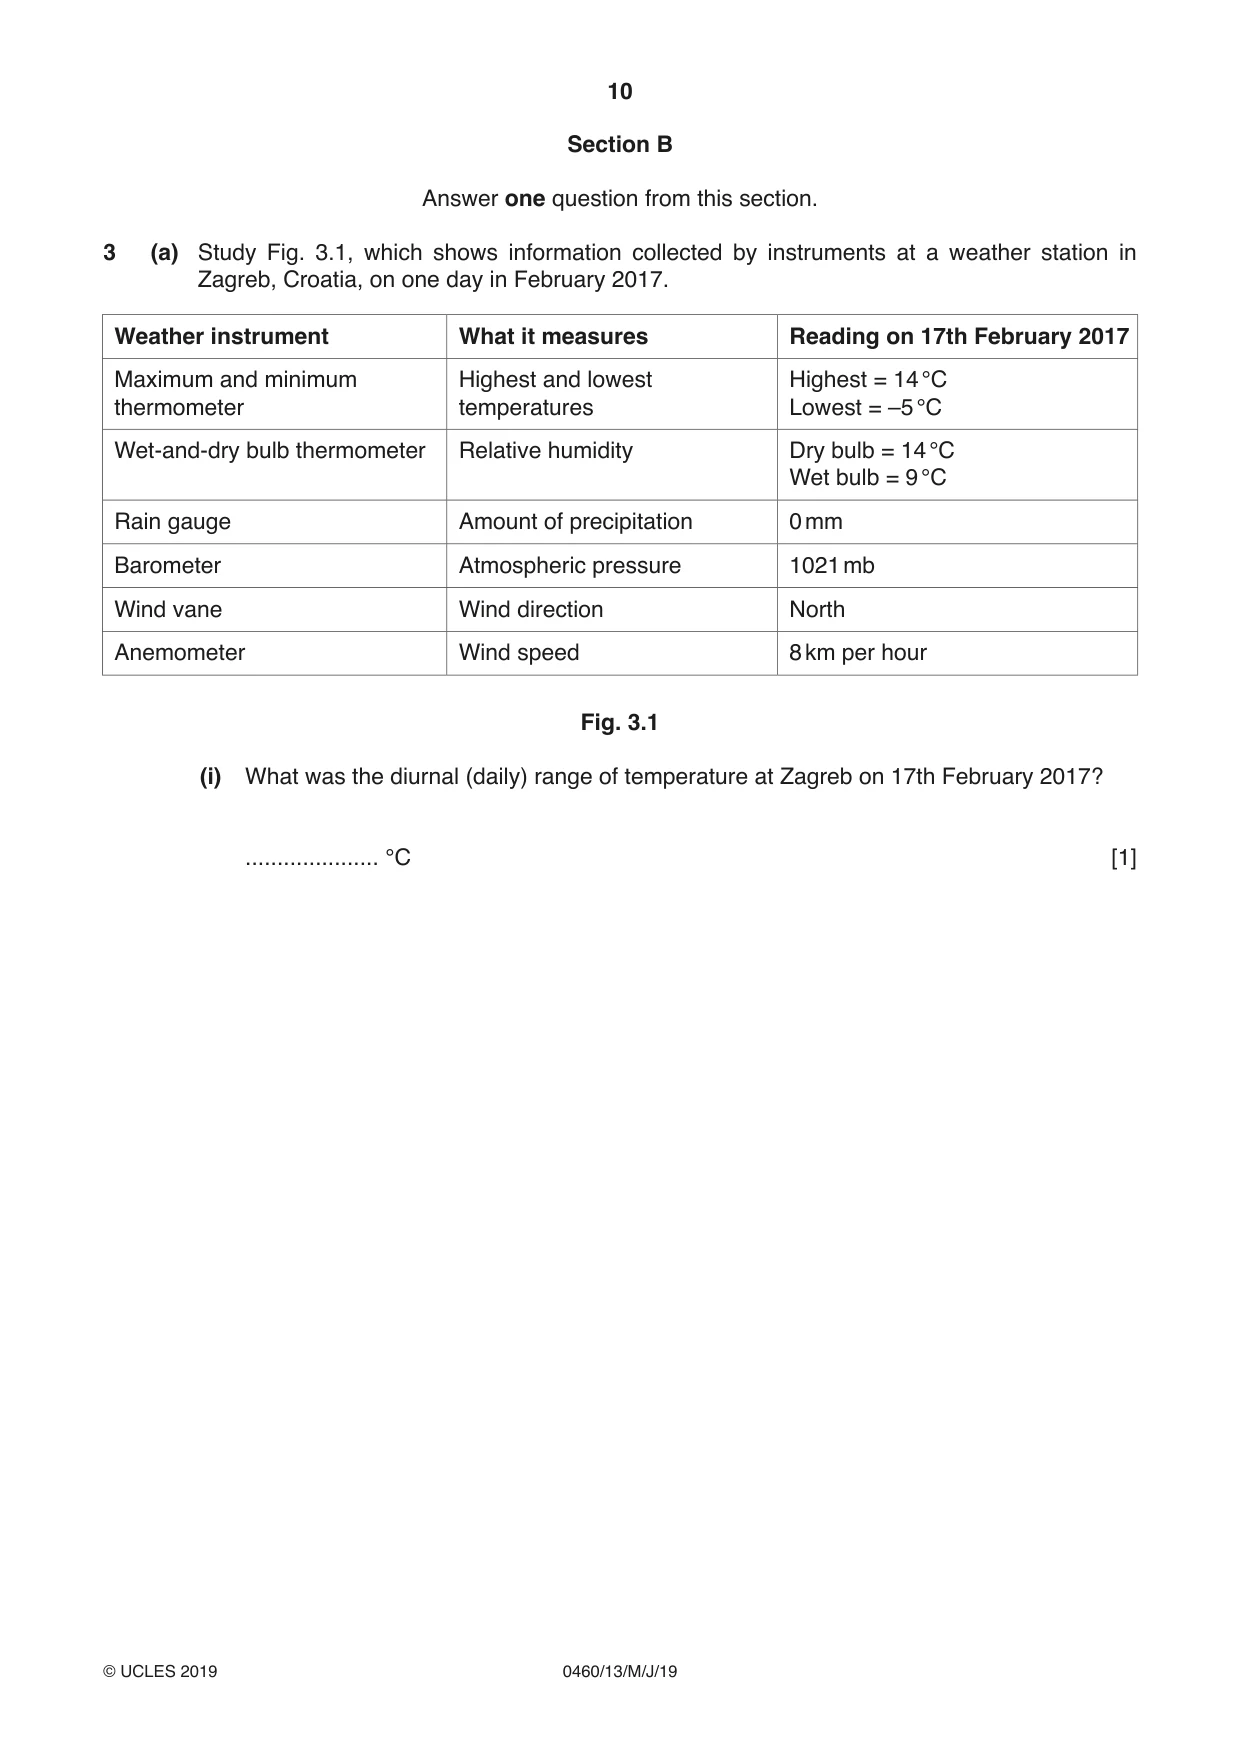
10 0460/13/M/J/19 © UCLES 2019 Section B Answer one question from this section. 3 (a) Study Fig. 3.1, which shows information collected by instruments at a weather station in Zagreb, Croatia, on one day in February 2017. Weather instrument What it measures Reading on 17th February 2017 Maximum and minimum thermometer Highest and lowest temperatures Highest = 14 °C Lowest = –5 °C Wet-and-dry bulb thermometer Relative humidity Dry bulb = 14 °C Wet bulb = 9 °C Rain gauge Amount of precipitation 0 mm Barometer Atmospheric pressure 1021 mb Wind vane Wind direction North Anemometer Wind speed 8 km per hour Fig. 3.1 (i) What was the diurnal (daily) range of temperature at Zagreb on 17th February 2017? … °C [1]
Question paper, page 11
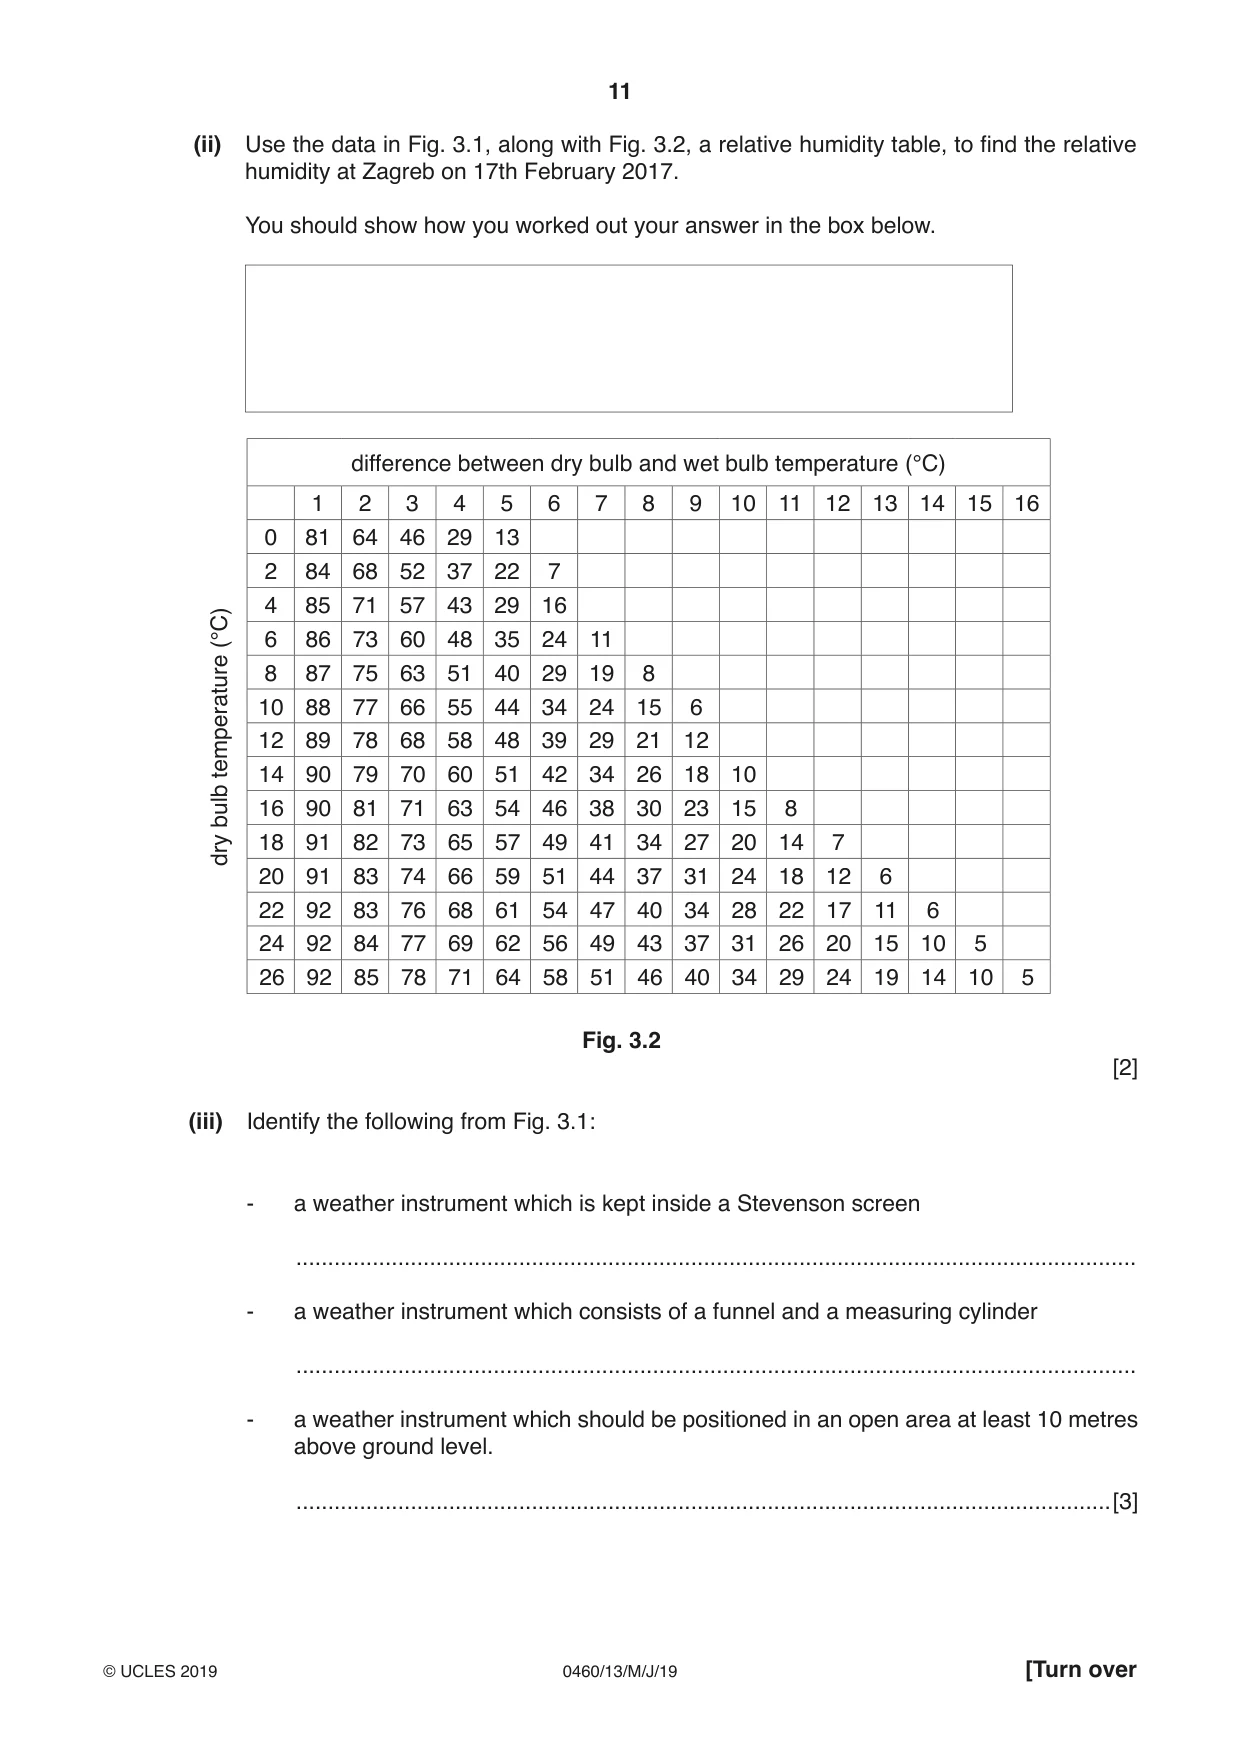
11 0460/13/M/J/19 © UCLES 2019 [Turn over (ii) Use the data in Fig. 3.1, along with Fig. 3.2, a relative humidity table, to find the relative humidity at Zagreb on 17th February 2017. You should show how you worked out your answer in the box below. difference between dry bulb and wet bulb temperature (°C) dry bulb temperature (°C) 1 2 3 4 5 6 7 8 9 10 11 12 13 14 15 16 0 81 64 46 29 13 2 84 68 52 37 22 7 4 85 71 57 43 29 16 6 86 73 60 48 35 24 11 8 87 75 63 51 40 29 19 8 10 88 77 66 55 44 34 24 15 6 12 89 78 68 58 48 39 29 21 12 14 90 79 70 60 51 42 34 26 18 10 16 90 81 71 63 54 46 38 30 23 15 8 18 91 82 73 65 57 49 41 34 27 20 14 7 20 91 83 74 66 59 51 44 37 31 24 18 12 6 22 92 83 76 68 61 54 47 40 34 28 22 17 11 6 24 92 84 77 69 62 56 49 43 37 31 26 20 15 10 5 26 92 85 78 71 64 58 51 46 40 34 29 24 19 14 10 5 Fig. 3.2 [2] (iii) Identify the following from Fig. 3.1: - a weather instrument which is kept inside a Stevenson screen … - a weather instrument which consists of a funnel and a measuring cylinder … - a weather instrument which should be positioned in an open area at least 10 metres above ground level. …[3]
Question paper, page 12
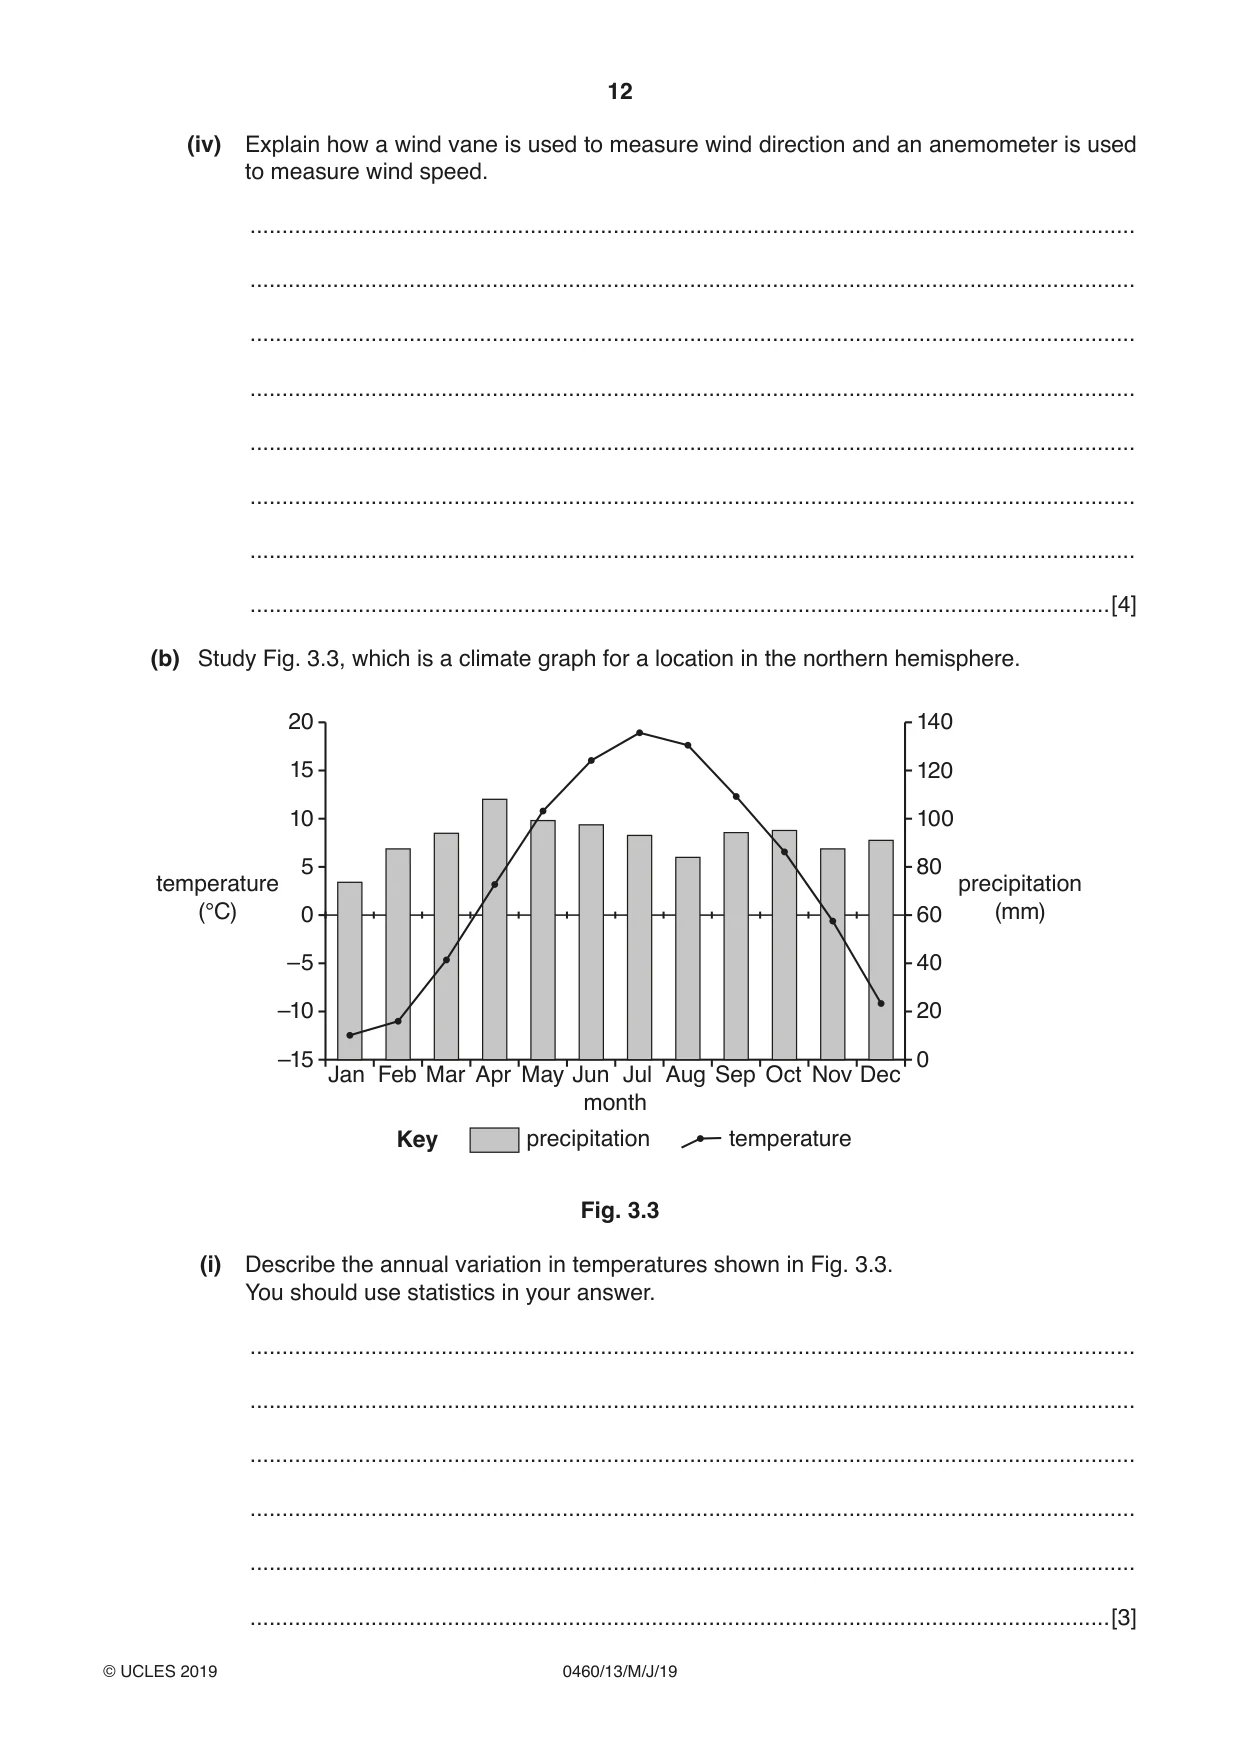
12 0460/13/M/J/19 © UCLES 2019 (iv) Explain how a wind vane is used to measure wind direction and an anemometer is used to measure wind speed. … … … … … … … …[4] (b) Study Fig. 3.3, which is a climate graph for a location in the northern hemisphere. –15 –10 –5 0 temperature (°C) precipitation (mm) Jan Feb Mar Apr May Jun Jul Aug month Sep Oct Nov Dec 5 10 15 20 0 20 40 60 80 100 120 140 Key precipitation temperature Fig. 3.3 (i) Describe the annual variation in temperatures shown in Fig. 3.3. You should use statistics in your answer. … … … … … …[3]
Question paper, page 13
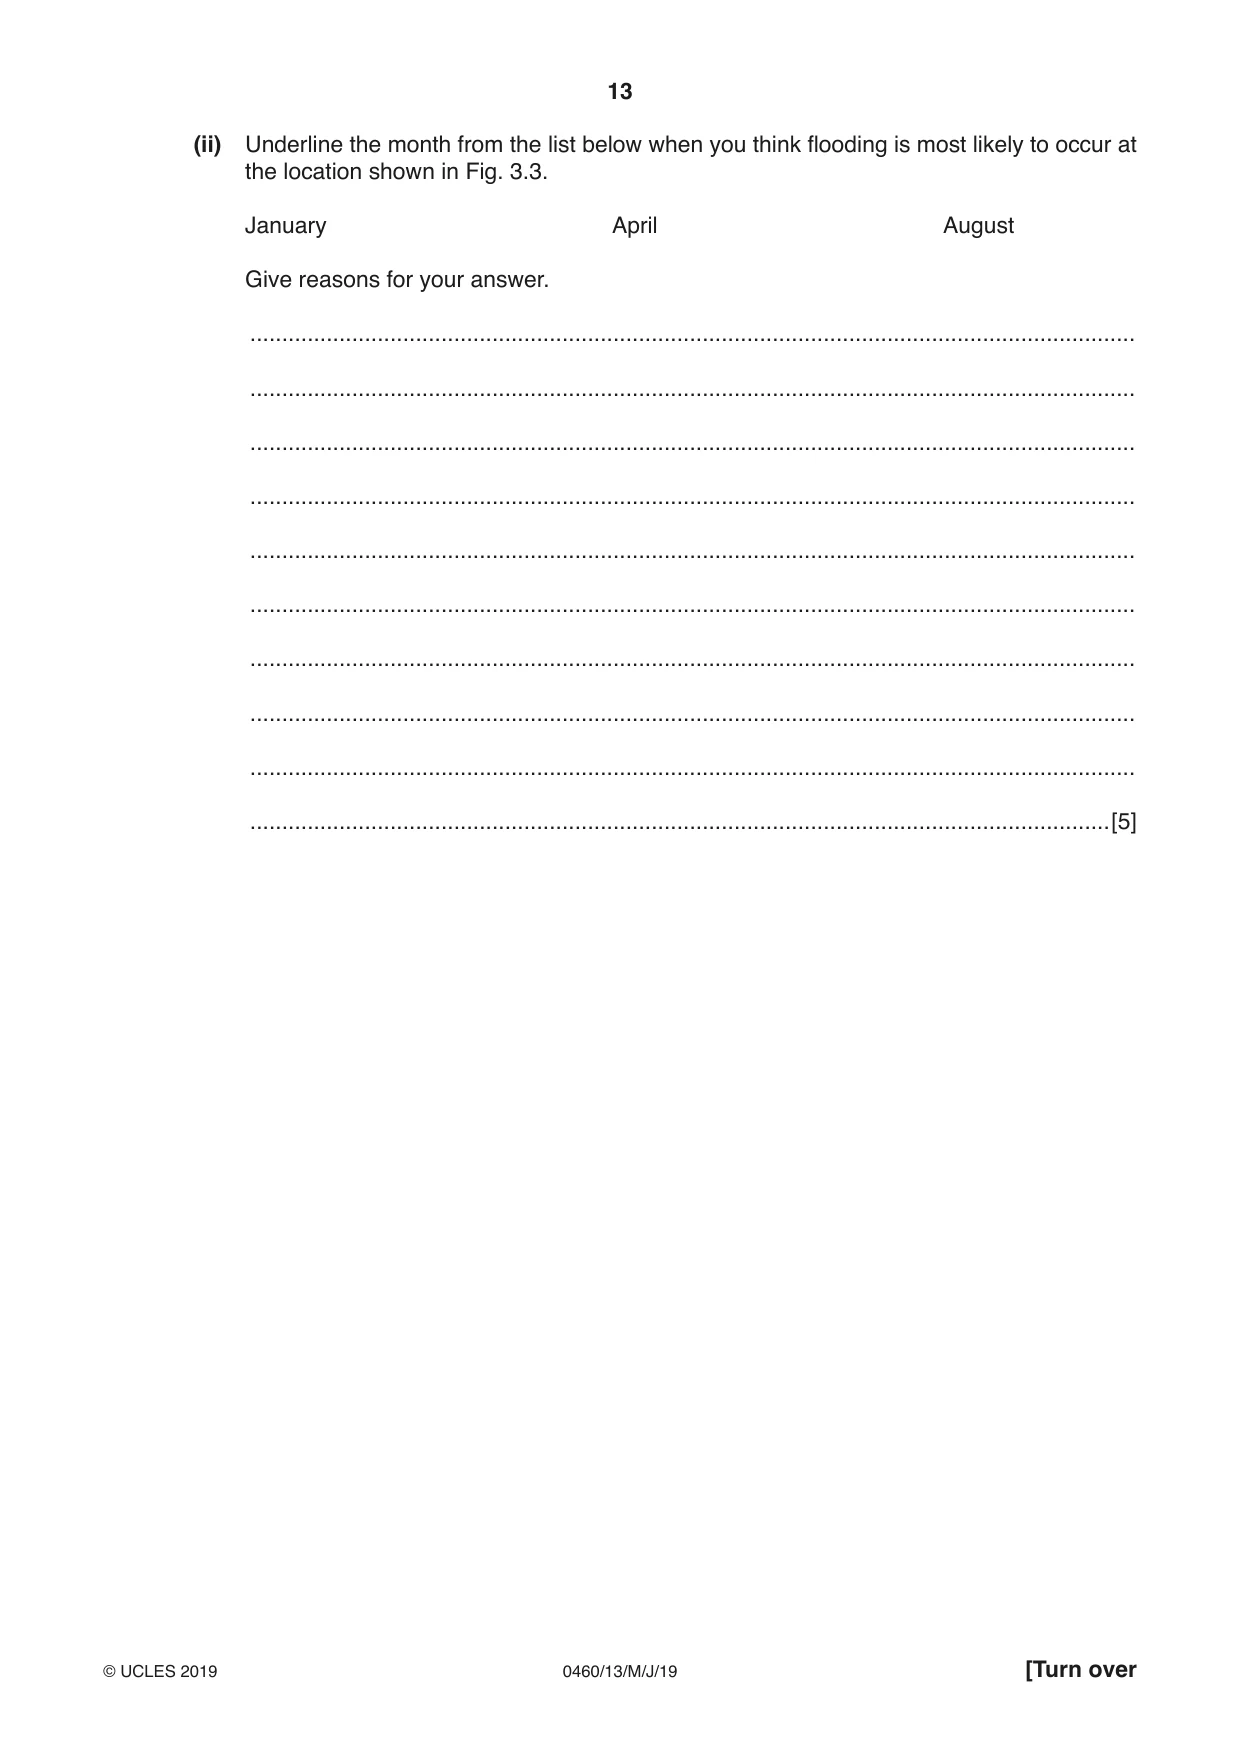
13 0460/13/M/J/19 © UCLES 2019 [Turn over (ii) Underline the month from the list below when you think flooding is most likely to occur at the location shown in Fig. 3.3. January April August Give reasons for your answer. … … … … … … … … … …[5]
Question paper, page 14
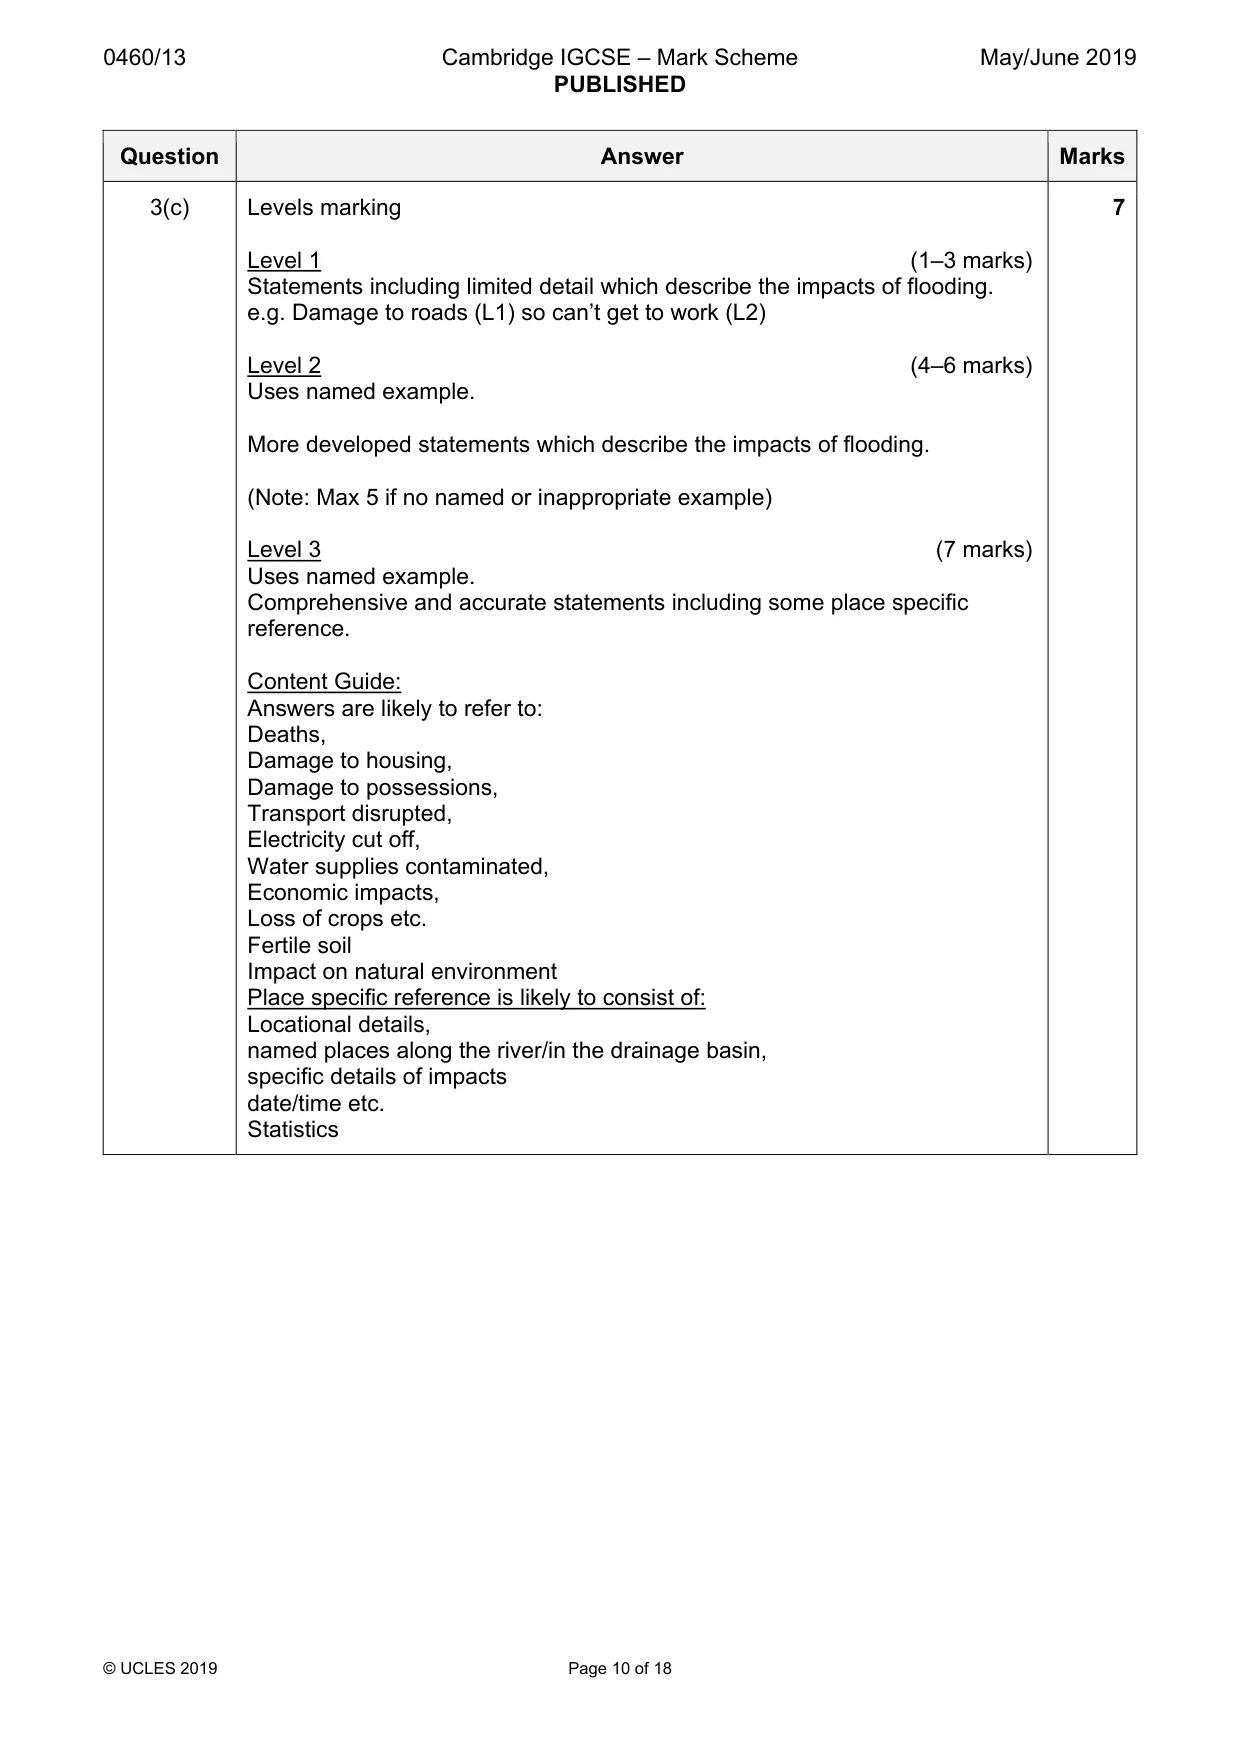
14 0460/13/M/J/19 © UCLES 2019 (c) For a named river you have studied, describe the impacts of flooding. Named river … … … … … … … … … … … … … … … … … … … … … … … … … …[7] [Total: 25]
Question paper, page 15
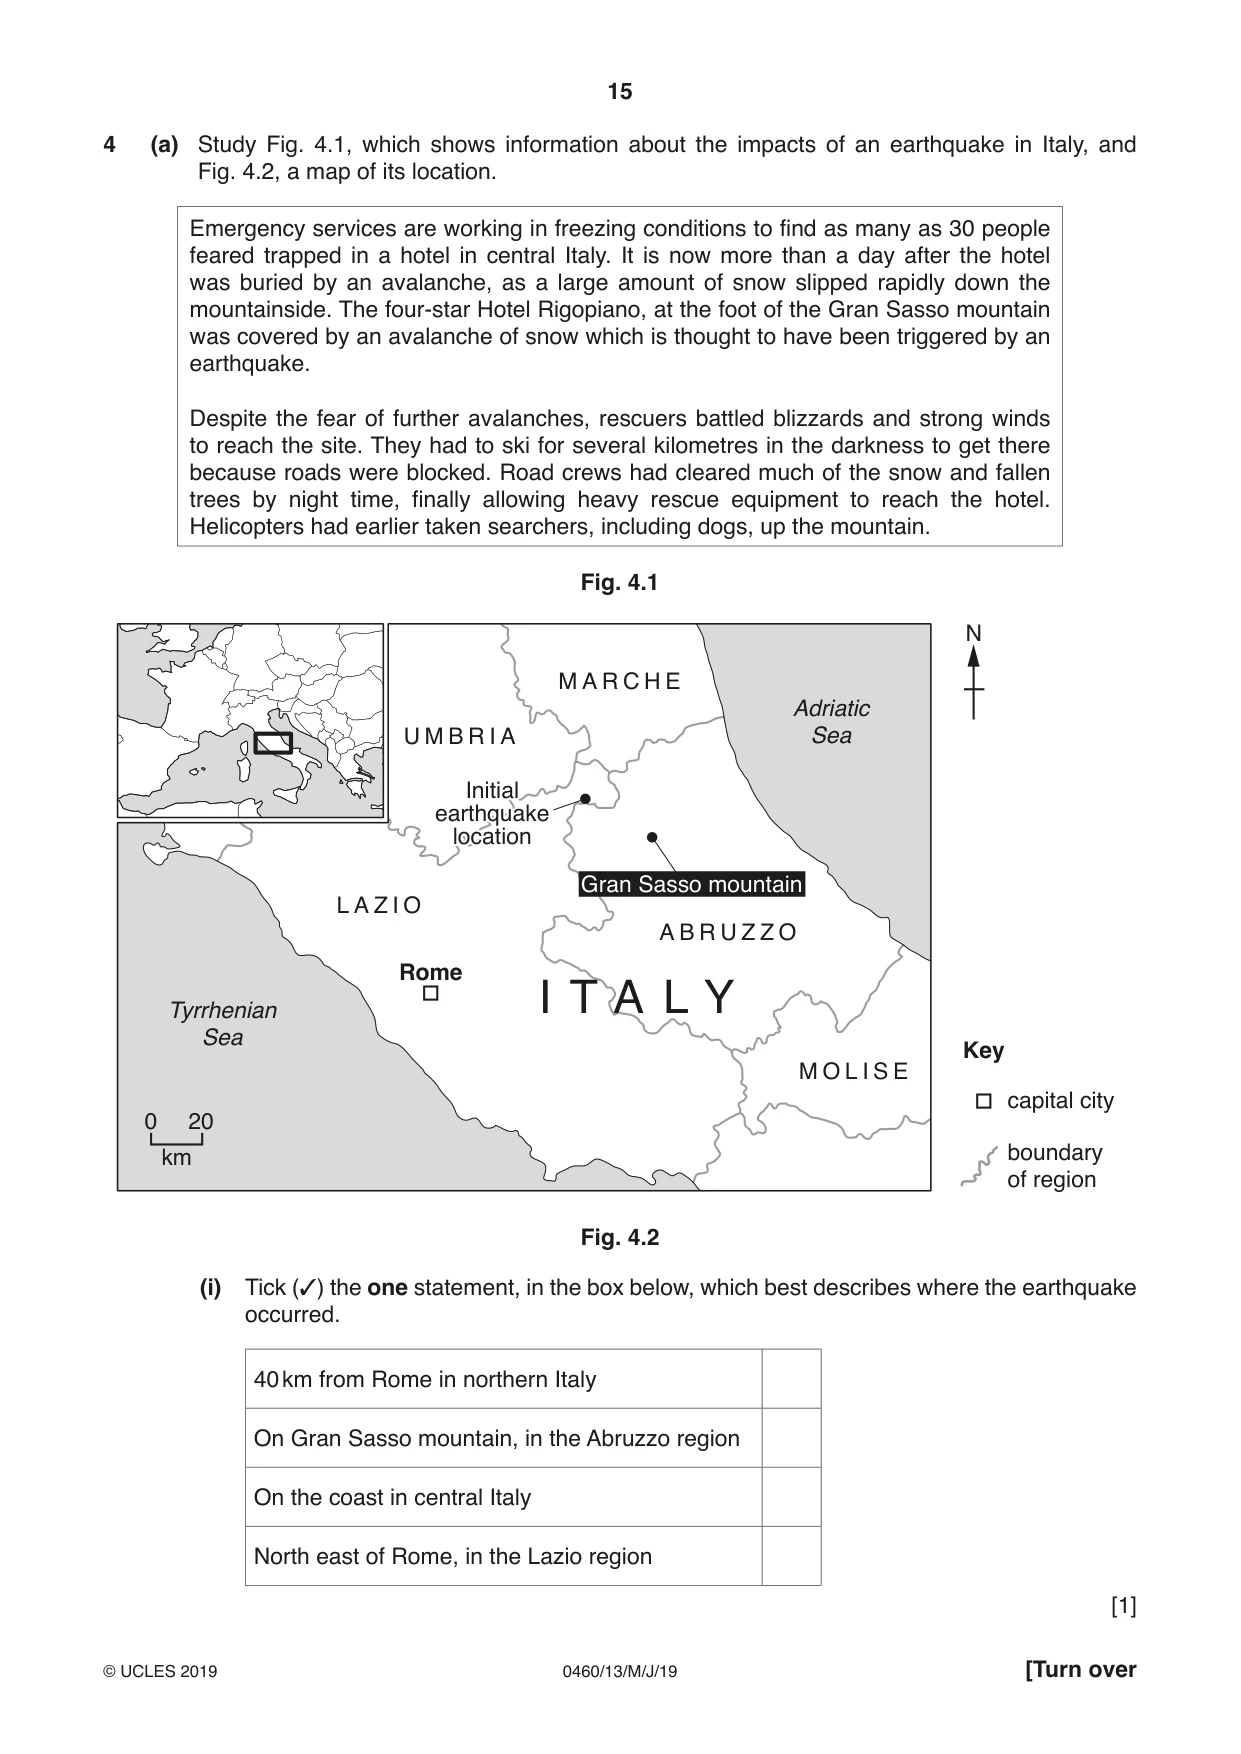
15 0460/13/M/J/19 © UCLES 2019 [Turn over 4 (a) Study Fig. 4.1, which shows information about the impacts of an earthquake in Italy, and Fig. 4.2, a map of its location. Emergency services are working in freezing conditions to find as many as 30 people feared trapped in a hotel in central Italy. It is now more than a day after the hotel was buried by an avalanche, as a large amount of snow slipped rapidly down the mountainside. The four-star Hotel Rigopiano, at the foot of the Gran Sasso mountain was covered by an avalanche of snow which is thought to have been triggered by an earthquake. Despite the fear of further avalanches, rescuers battled blizzards and strong winds to reach the site. They had to ski for several kilometres in the darkness to get there because roads were blocked. Road crews had cleared much of the snow and fallen trees by night time, finally allowing heavy rescue equipment to reach the hotel. Helicopters had earlier taken searchers, including dogs, up the mountain. Fig. 4.1 Adriatic Sea Tyrrhenian Sea Initial earthquake location Key capital city boundary of region Rome M A R C H E U M B R I A L A Z I O A B R U Z Z O M O L I S E I T A L Y Gran Sasso mountain 0 km 20 N Fig. 4.2 (i) Tick (3) the one statement, in the box below, which best describes where the earthquake occurred. 40 km from Rome in northern Italy On Gran Sasso mountain, in the Abruzzo region On the coast in central Italy North east of Rome, in the Lazio region [1]
Question paper, page 16
16 0460/13/M/J/19 © UCLES 2019 (ii) Suggest how the earthquake caused an avalanche of snow on Gran Sasso mountain. … … … …[2] (iii) Using information from Fig. 4.1 only, give three reasons why rescuing people from the Hotel Rigopiano was difficult. 1 … … 2 … … 3 … …[3]
Question paper, page 17
17 0460/13/M/J/19 © UCLES 2019 [Turn over (iv) Explain why many people continue to live in areas which experience earthquakes. … … … … … … … …[4] (b) Study Fig. 4.3 (Insert), which is a photograph of a crater on Tangkuban Perahu volcano in Indonesia. (i) Using Fig. 4.3 only, describe three features of the crater of Tangkuban Perahu volcano. 1 … … 2 … … 3 … …[3]
Question paper, page 18
18 0460/13/M/J/19 © UCLES 2019 (ii) Tangkuban Perahu volcano is located on a destructive plate boundary. Explain why volcanoes erupt on destructive plate boundaries. You may include a labelled diagram. … … … … … … … … … … [5]
Question paper, page 19
19 0460/13/M/J/19 © UCLES 2019 [Turn over (c) For a named volcano you have studied, describe the impacts of a volcanic eruption. Name of volcano … … … … … … … … … … … … … … … … … … … … … … … … … …[7] [Total: 25]
Question paper, page 20
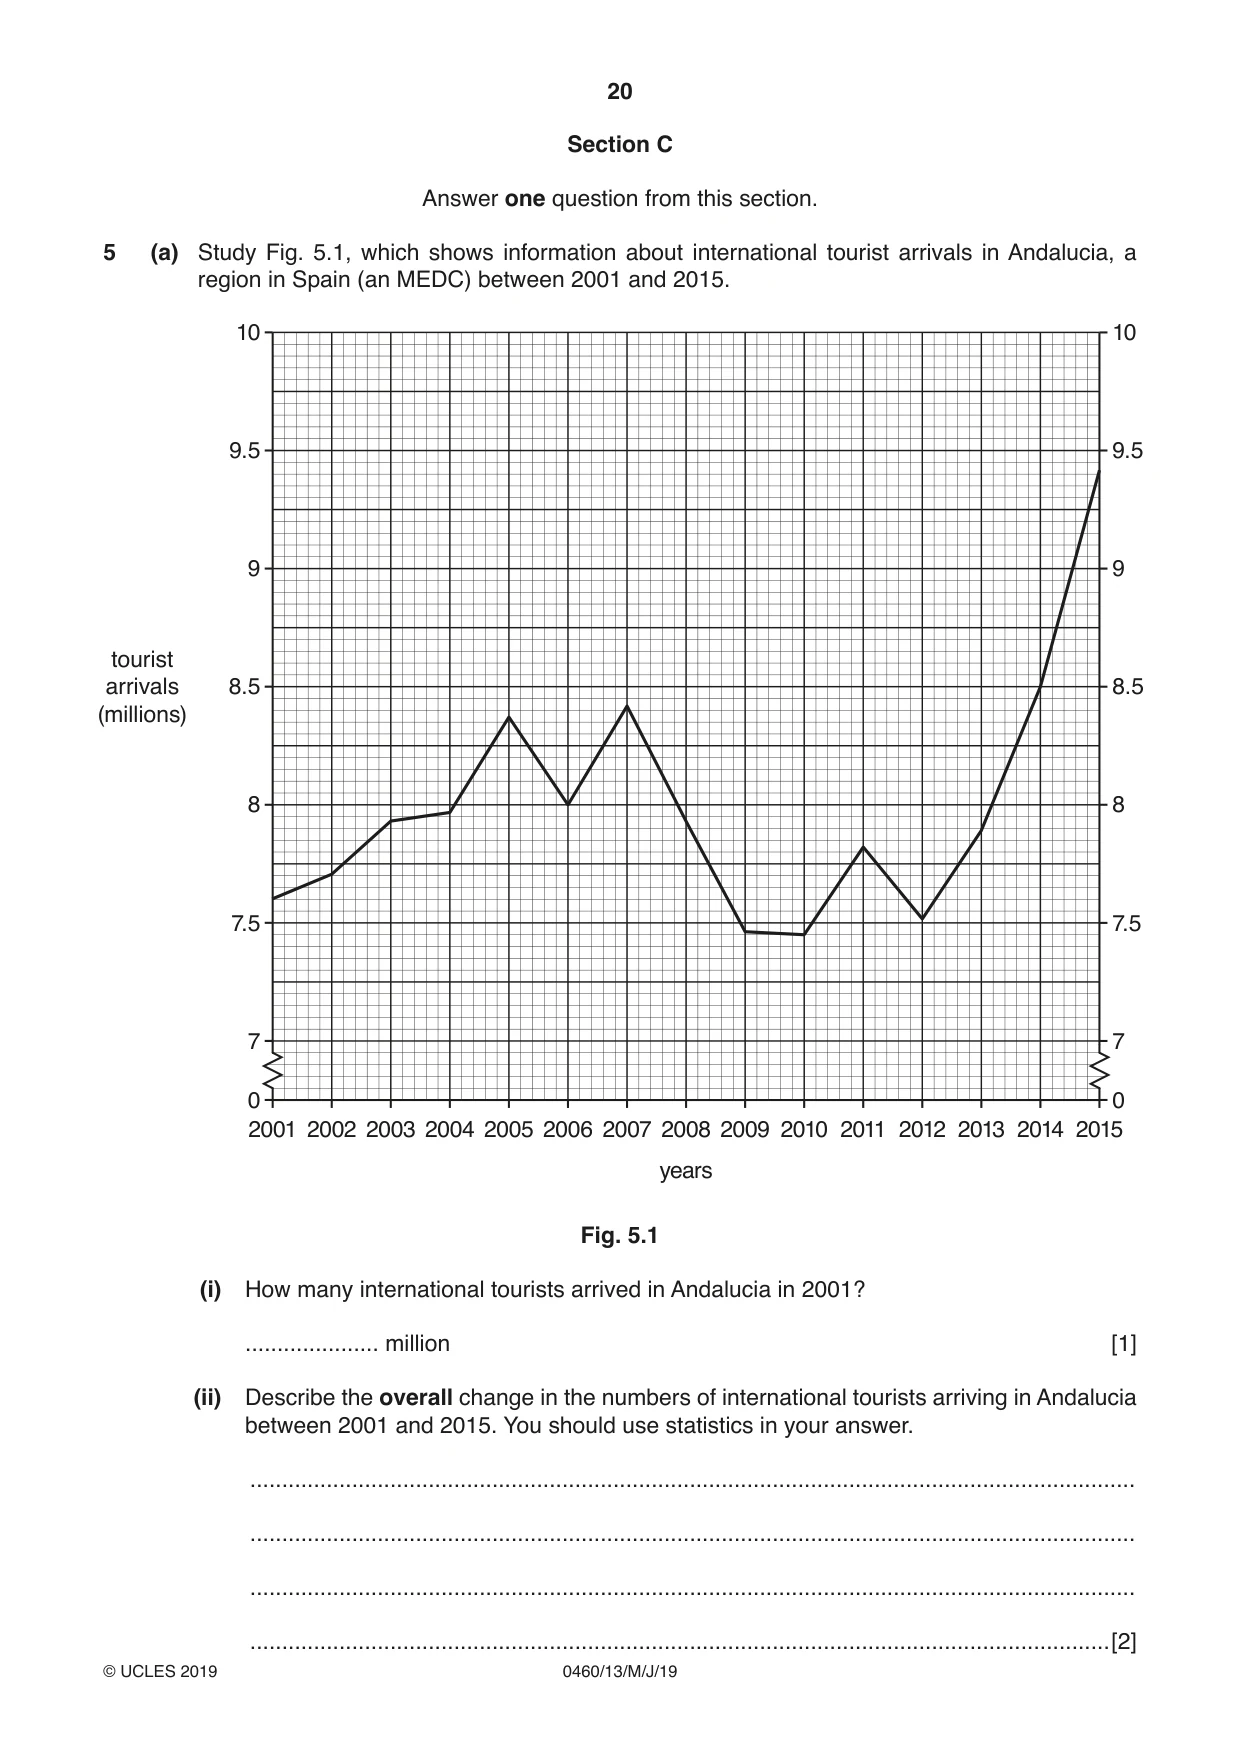
20 0460/13/M/J/19 © UCLES 2019 Section C Answer one question from this section. 5 (a) Study Fig. 5.1, which shows information about international tourist arrivals in Andalucia, a region in Spain (an MEDC) between 2001 and 2015. 7 2001 2002 2003 2004 2005 2006 2007 2008 years 2009 2010 2011 2012 2013 2014 2015 7.5 8 8.5 9 9.5 10 7 0 0 7.5 8 8.5 9 9.5 10 tourist arrivals (millions) Fig. 5.1 (i) How many international tourists arrived in Andalucia in 2001? … million [1] (ii) Describe the overall change in the numbers of international tourists arriving in Andalucia between 2001 and 2015. You should use statistics in your answer. … … … …[2]
Question paper, page 21
21 0460/13/M/J/19 © UCLES 2019 [Turn over (iii) Suggest reasons why the number of tourists visiting Andalucia varies from year to year. … … … … … …[3] (b) Study Figs. 5.2 and Fig. 5.3 (Insert), which are photographs taken in Andalucia. (i) Describe three different attractions to tourists of the area shown in Figs. 5.2 and 5.3. 1 … … 2 … … 3 … …[3] (ii) Explain two likely benefits of tourism for local people in Andalucia. 1 … … … … 2 … … … …[4]
Question paper, page 22
22 0460/13/M/J/19 © UCLES 2019 (iii) Suggest ways in which the tourist industry is likely to threaten the natural environment in Andalucia. … … … … … … … … … …[5]
Question paper, page 23
23 0460/13/M/J/19 © UCLES 2019 [Turn over (c) For a named tourist destination or region you have studied, explain how tourism is managed so that it is sustainable. Name of destination or region … … … … … … … … … … … … … … … … … … … … … … … … … …[7] [Total: 25]
Question paper, page 24
24 0460/13/M/J/19 © UCLES 2019 6 (a) Study Fig. 6.1 (Insert), which shows information on sources of energy which were used in Japan in 2013 and are planned to be used in 2030. (i) What was the main source of energy used in Japan in 2013? . … [1] (ii) State two pieces of evidence from Fig. 6.1 that Japan plans to reduce the use of fossil fuels by 2030. 1 … … 2 … …[2] (iii) Explain how it will benefit Japan to reduce the use of imported fossil fuels and use more renewable energy. … … … … … …[3] (iv) Japan plans to increase its use of nuclear power. Suggest two benefits and two possible problems for Japan of using more nuclear power. Benefit 1 … … Benefit 2 … … Problem 1 … … Problem 2 … …[4]
Question paper, page 25
25 0460/13/M/J/19 © UCLES 2019 [Turn over (b) Study Fig. 6.2 (Insert), which is a photograph showing an area where electricity is generated using solar panels and wind turbines in Madeira, a Portuguese island in the Atlantic Ocean. (i) Suggest why these methods of electricity generation are possible in this location. … … … … … …[3] (ii) There is a proposal to extend the area where solar power is being generated into area X. Explain why some people are likely to support this proposal but other people will be against it. … … … … … … … … … …[5]
Question paper, page 26
26 0460/13/M/J/19 © UCLES 2019 (c) For a named country you have studied, explain how water supply is being managed to ensure future supplies. Name of country … … … … … … … … … … … … … … … … … … … … …[7] [Total: 25]
Question paper, page 27
27 0460/13/M/J/19 © UCLES 2019 Additional Pages If you use the following lined pages to complete the answer(s) to any question(s), the question number(s) must be clearly shown. … … … … … … … … … … … … … … … … … … … … … … … … … …
Question paper, page 28
28 0460/13/M/J/19 © UCLES 2019 … … … … … … … … … … … … … … … … … … … … … … … … Permission to reproduce items where third-party owned material protected by copyright is included has been sought and cleared where possible. Every reasonable effort has been made by the publisher (UCLES) to trace copyright holders, but if any items requiring clearance have unwittingly been included, the publisher will be pleased to make amends at the earliest possible opportunity. To avoid the issue of disclosure of answer-related information to candidates, all copyright acknowledgements are reproduced online in the Cambridge Assessment International Education Copyright Acknowledgements Booklet. This is produced for each series of examinations and is freely available to download at www.cambridgeinternational.org after the live examination series. Cambridge Assessment International Education is part of the Cambridge Assessment Group. Cambridge Assessment is the brand name of the University of Cambridge Local Examinations Syndicate (UCLES), which itself is a department of the University of Cambridge.
Mark scheme, page 1
This document consists of 18 printed pages. © UCLES 2019 [Turn over Cambridge Assessment International Education Cambridge International General Certificate of Secondary Education GEOGRAPHY 0460/13 Paper 1 May/June 2019 MARK SCHEME Maximum Mark: 75 Published This mark scheme is published as an aid to teachers and candidates, to indicate the requirements of the examination. It shows the basis on which Examiners were instructed to award marks. It does not indicate the details of the discussions that took place at an Examiners’ meeting before marking began, which would have considered the acceptability of alternative answers. Mark schemes should be read in conjunction with the question paper and the Principal Examiner Report for Teachers. Cambridge International will not enter into discussions about these mark schemes. Cambridge International is publishing the mark schemes for the May/June 2019 series for most Cambridge IGCSE™, Cambridge International A and AS Level and Cambridge Pre-U components, and some Cambridge O Level components.
Mark scheme, page 2
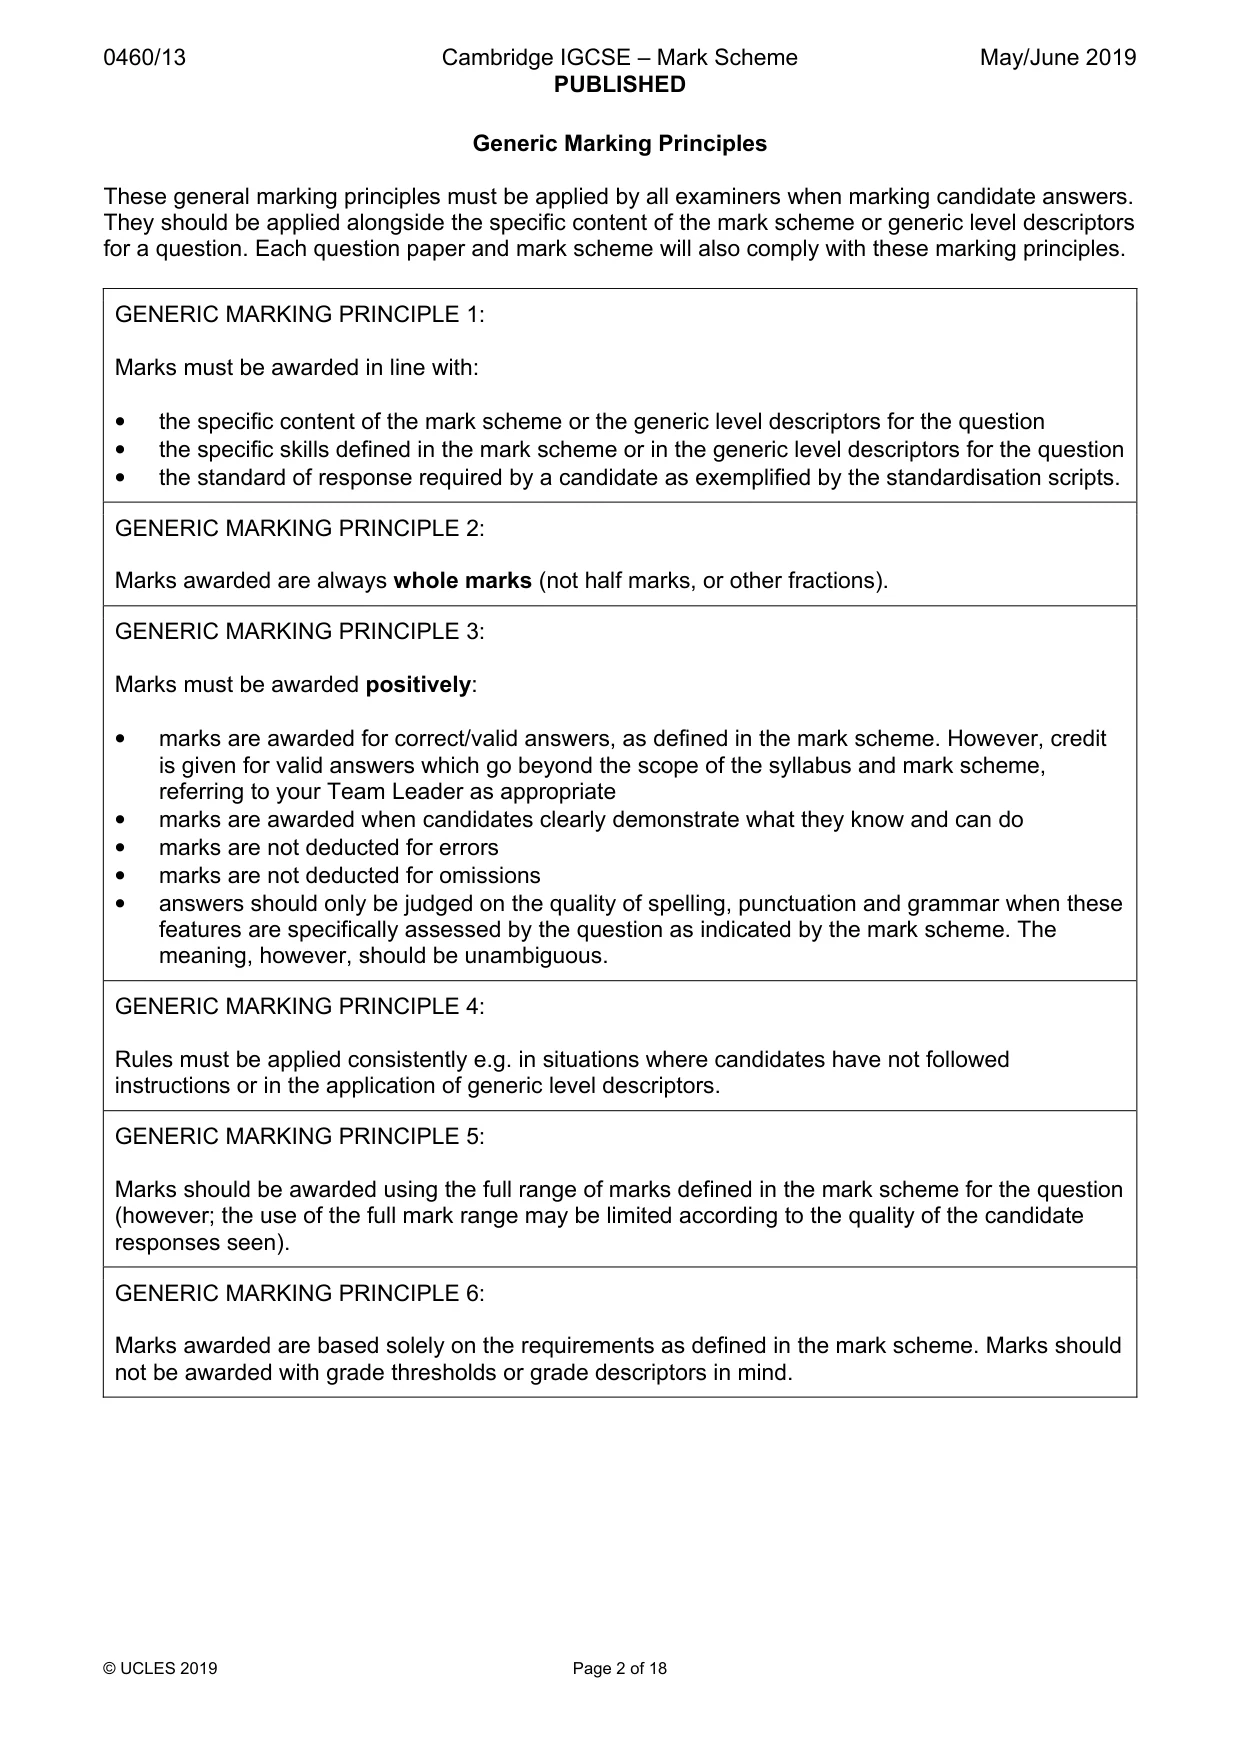
0460/13 Cambridge IGCSE – Mark Scheme PUBLISHED May/June 2019 © UCLES 2019 Page 2 of 18 Generic Marking Principles These general marking principles must be applied by all examiners when marking candidate answers. They should be applied alongside the specific content of the mark scheme or generic level descriptors for a question. Each question paper and mark scheme will also comply with these marking principles. GENERIC MARKING PRINCIPLE 1: Marks must be awarded in line with: • the specific content of the mark scheme or the generic level descriptors for the question • the specific skills defined in the mark scheme or in the generic level descriptors for the question • the standard of response required by a candidate as exemplified by the standardisation scripts. GENERIC MARKING PRINCIPLE 2: Marks awarded are always whole marks (not half marks, or other fractions). GENERIC MARKING PRINCIPLE 3: Marks must be awarded positively: • marks are awarded for correct/valid answers, as defined in the mark scheme. However, credit is given for valid answers which go beyond the scope of the syllabus and mark scheme, referring to your Team Leader as appropriate • marks are awarded when candidates clearly demonstrate what they know and can do • marks are not deducted for errors • marks are not deducted for omissions • answers should only be judged on the quality of spelling, punctuation and grammar when these features are specifically assessed by the question as indicated by the mark scheme. The meaning, however, should be unambiguous. GENERIC MARKING PRINCIPLE 4: Rules must be applied consistently e.g. in situations where candidates have not followed instructions or in the application of generic level descriptors. GENERIC MARKING PRINCIPLE 5: Marks should be awarded using the full range of marks defined in the mark scheme for the question (however; the use of the full mark range may be limited according to the quality of the candidate responses seen). GENERIC MARKING PRINCIPLE 6: Marks awarded are based solely on the requirements as defined in the mark scheme. Marks should not be awarded with grade thresholds or grade descriptors in mind.
Mark scheme, page 3
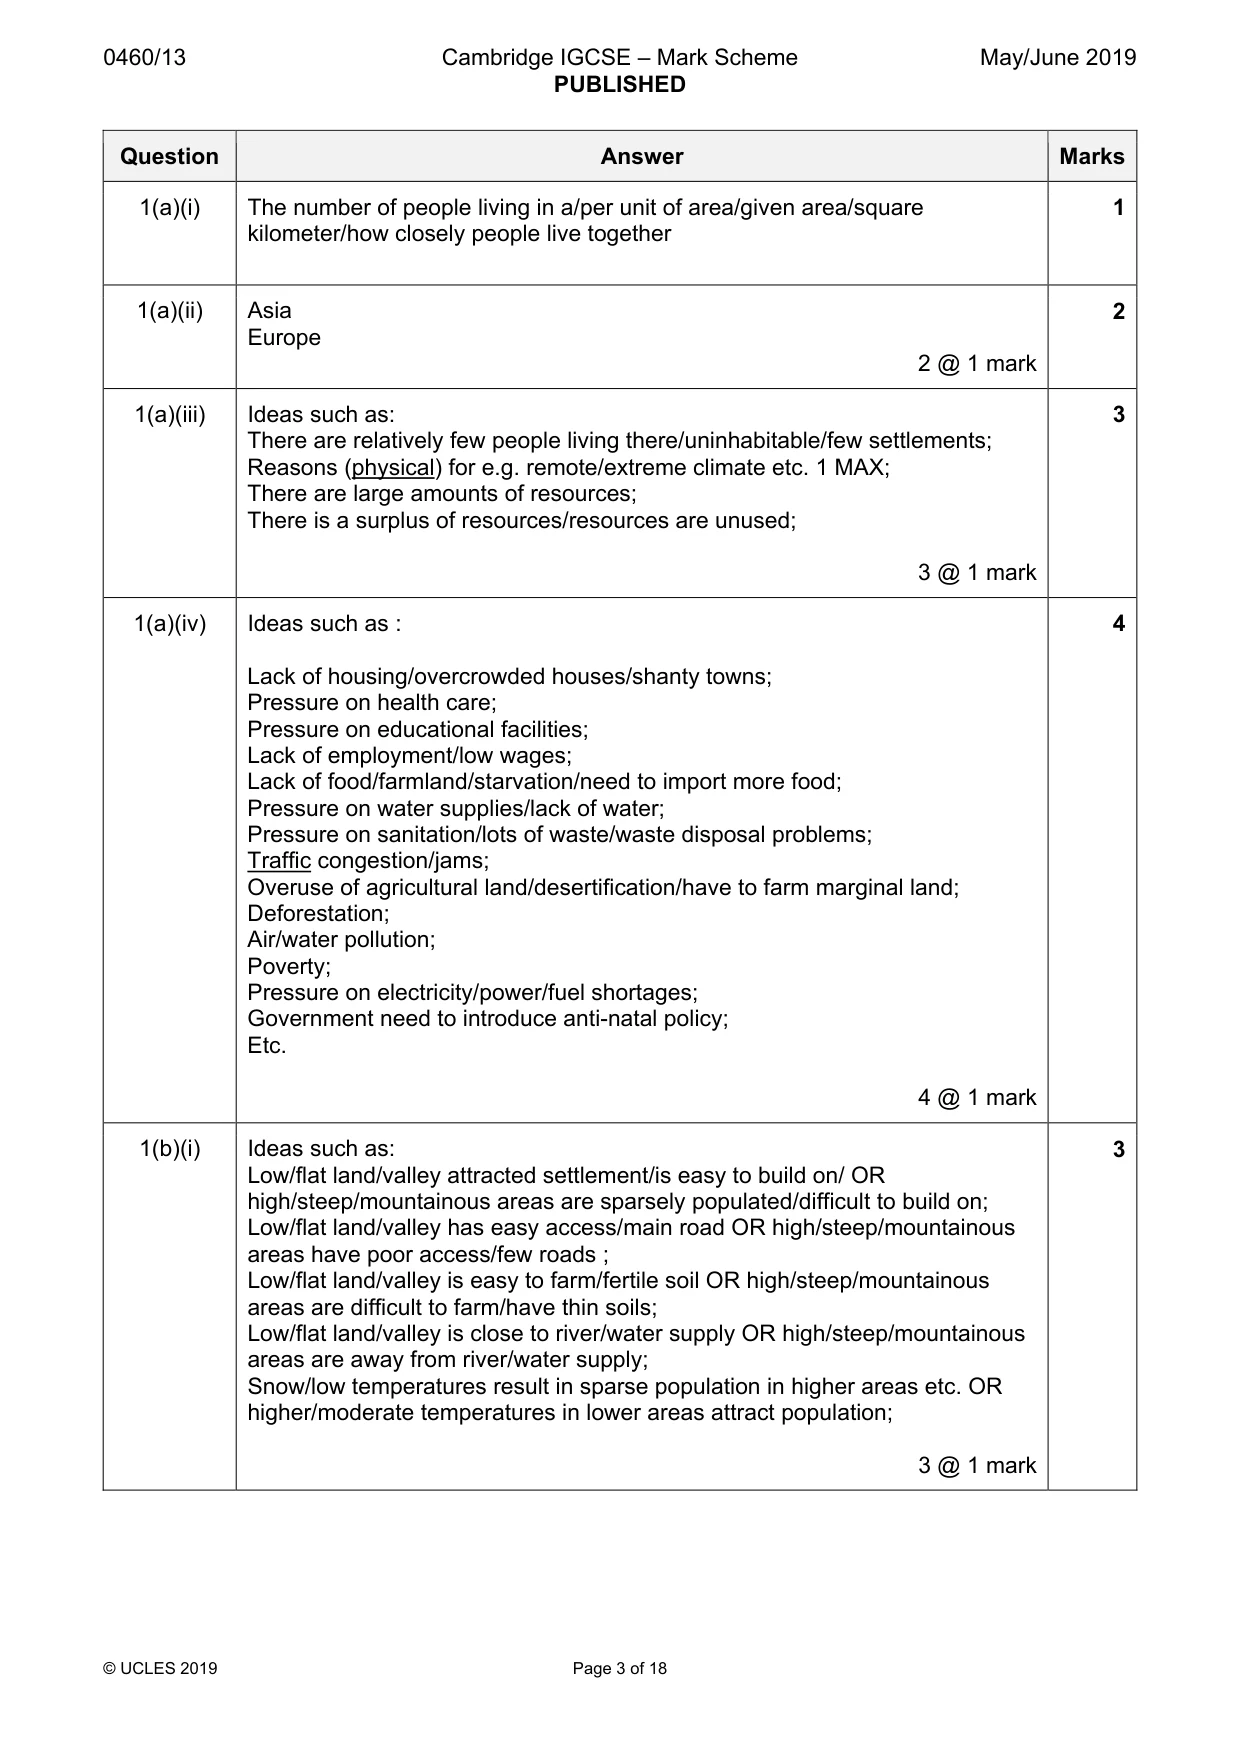
0460/13 Cambridge IGCSE – Mark Scheme PUBLISHED May/June 2019 © UCLES 2019 Page 3 of 18 Question Answer Marks 1(a)(i) The number of people living in a/per unit of area/given area/square kilometer/how closely people live together 1 1(a)(ii) Asia Europe 2 @ 1 mark 2 1(a)(iii) Ideas such as: There are relatively few people living there/uninhabitable/few settlements; Reasons (physical) for e.g. remote/extreme climate etc. 1 MAX; There are large amounts of resources; There is a surplus of resources/resources are unused; 3 @ 1 mark 3 1(a)(iv) Ideas such as : Lack of housing/overcrowded houses/shanty towns; Pressure on health care; Pressure on educational facilities; Lack of employment/low wages; Lack of food/farmland/starvation/need to import more food; Pressure on water supplies/lack of water; Pressure on sanitation/lots of waste/waste disposal problems; Traffic congestion/jams; Overuse of agricultural land/desertification/have to farm marginal land; Deforestation; Air/water pollution; Poverty; Pressure on electricity/power/fuel shortages; Government need to introduce anti-natal policy; Etc. 4 @ 1 mark 4 1(b)(i) Ideas such as: Low/flat land/valley attracted settlement/is easy to build on/ OR high/steep/mountainous areas are sparsely populated/difficult to build on; Low/flat land/valley has easy access/main road OR high/steep/mountainous areas have poor access/few roads ; Low/flat land/valley is easy to farm/fertile soil OR high/steep/mountainous areas are difficult to farm/have thin soils; Low/flat land/valley is close to river/water supply OR high/steep/mountainous areas are away from river/water supply; Snow/low temperatures result in sparse population in higher areas etc. OR higher/moderate temperatures in lower areas attract population; 3 @ 1 mark 3
Mark scheme, page 4
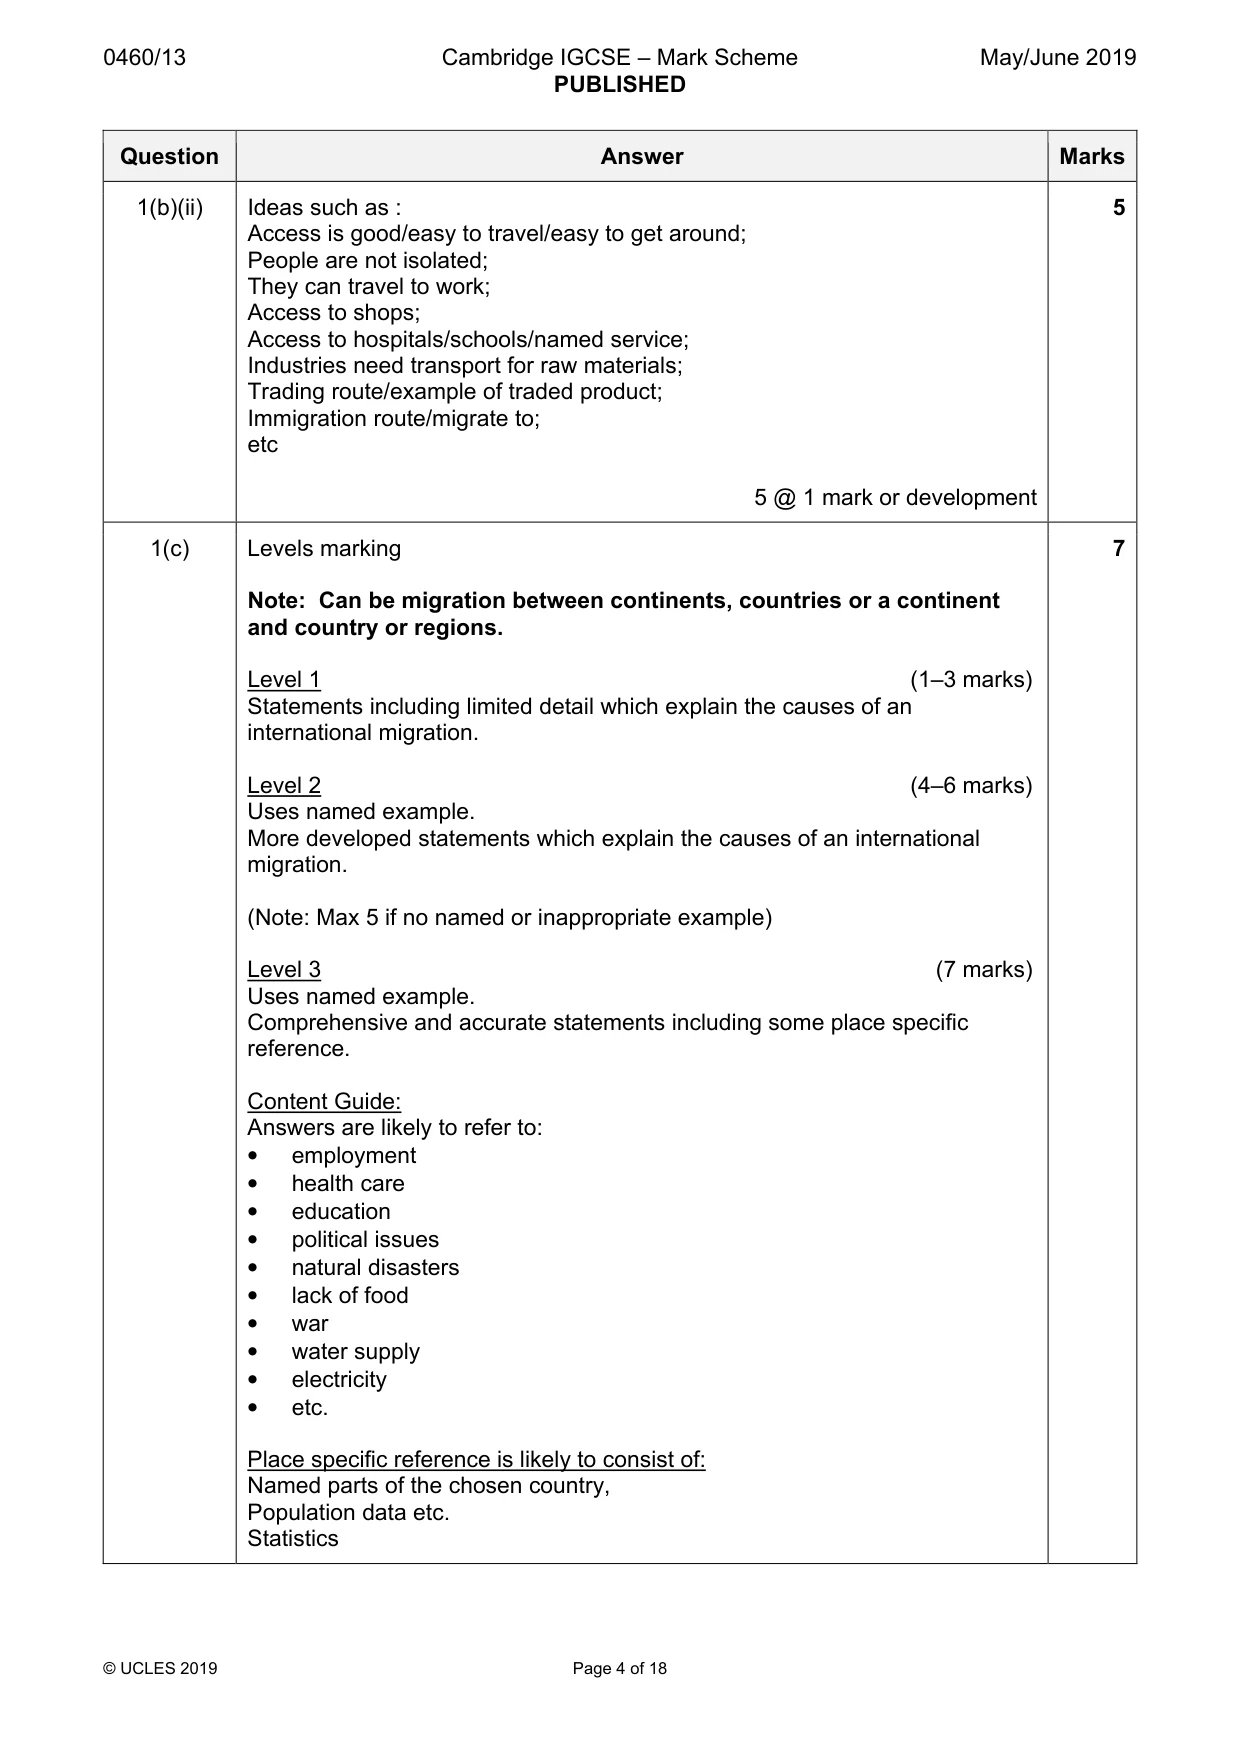
0460/13 Cambridge IGCSE – Mark Scheme PUBLISHED May/June 2019 © UCLES 2019 Page 4 of 18 Question Answer Marks 1(b)(ii) Ideas such as : Access is good/easy to travel/easy to get around; People are not isolated; They can travel to work; Access to shops; Access to hospitals/schools/named service; Industries need transport for raw materials; Trading route/example of traded product; Immigration route/migrate to; etc 5 @ 1 mark or development 5 1(c) Levels marking Note: Can be migration between continents, countries or a continent and country or regions. Level 1 (1–3 marks) Statements including limited detail which explain the causes of an international migration. Level 2 (4–6 marks) Uses named example. More developed statements which explain the causes of an international migration. (Note: Max 5 if no named or inappropriate example) Level 3 (7 marks) Uses named example. Comprehensive and accurate statements including some place specific reference. Content Guide: Answers are likely to refer to: • employment • health care • education • political issues • natural disasters • lack of food • war • water supply • electricity • etc. Place specific reference is likely to consist of: Named parts of the chosen country, Population data etc. Statistics 7
Mark scheme, page 5
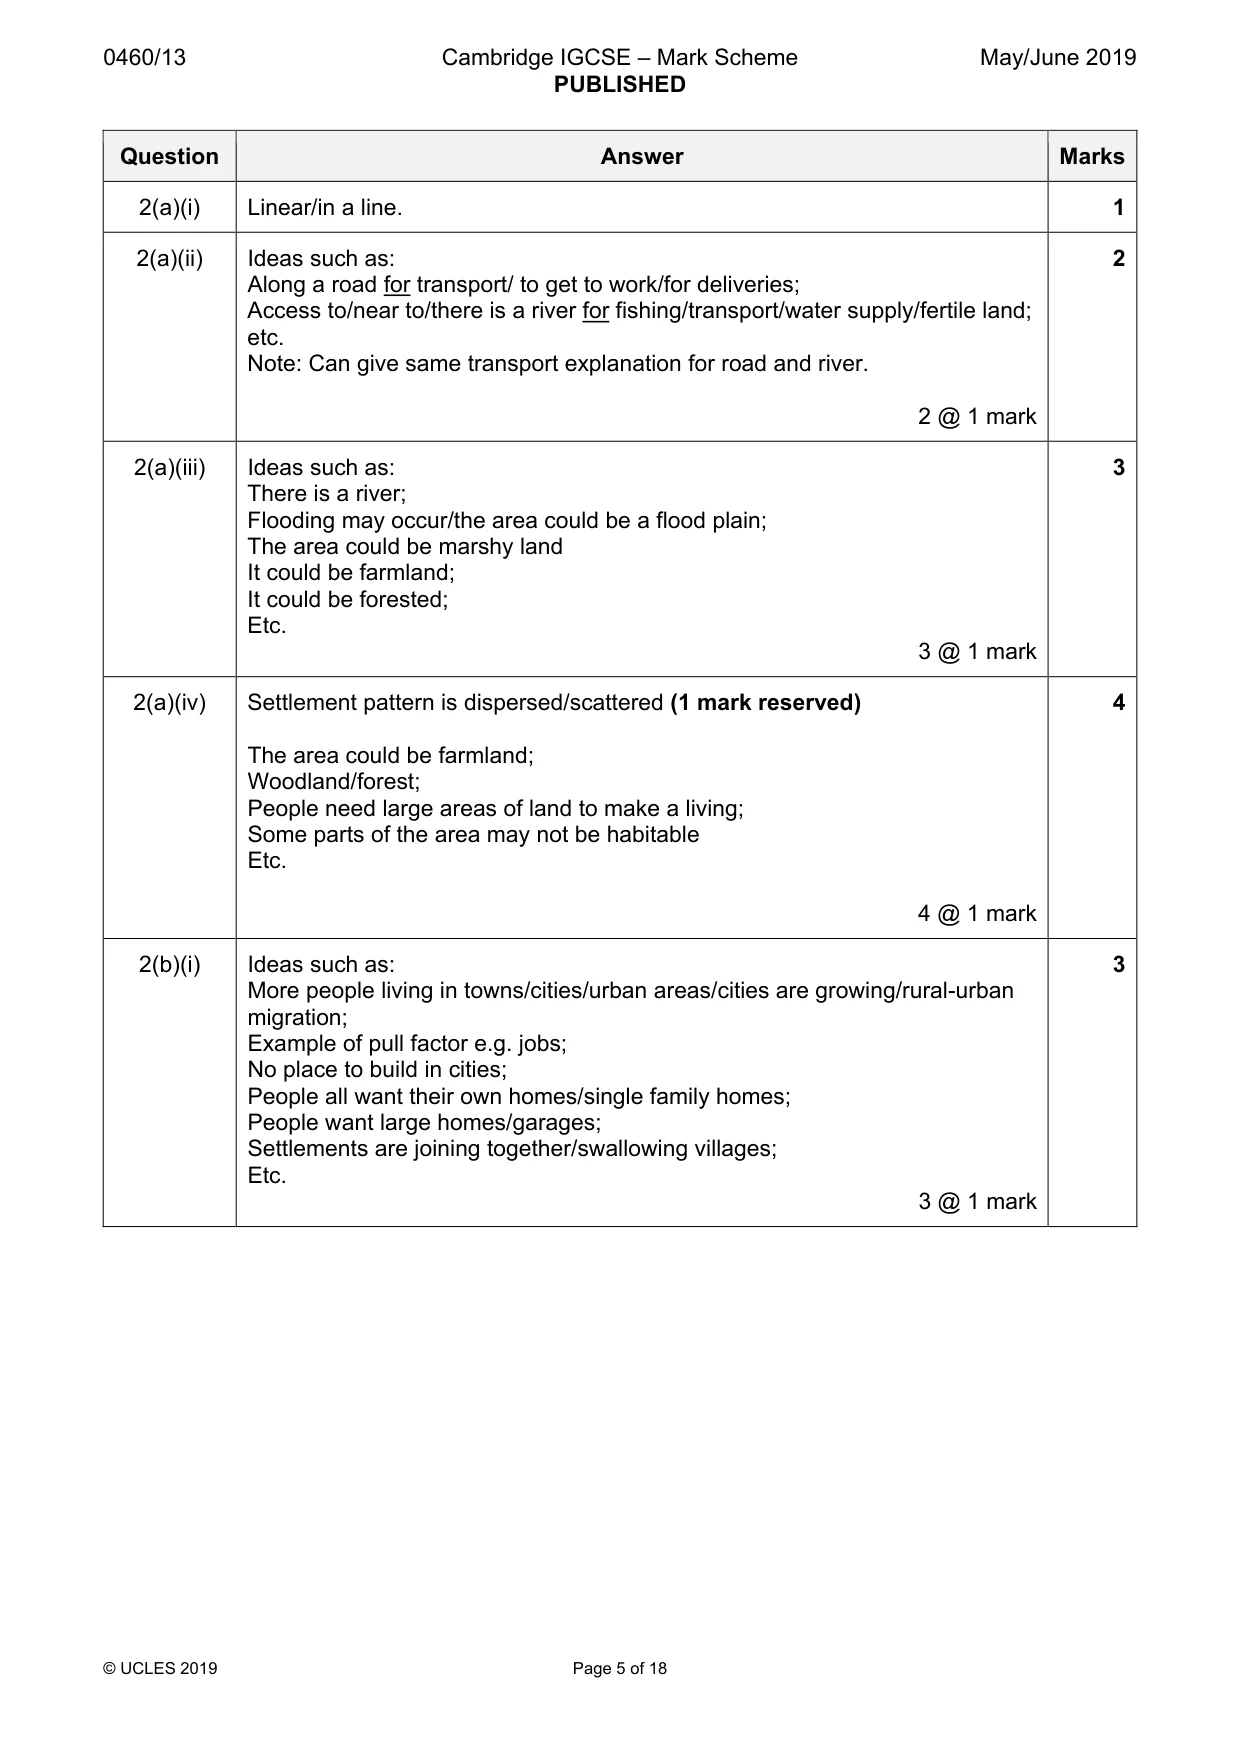
0460/13 Cambridge IGCSE – Mark Scheme PUBLISHED May/June 2019 © UCLES 2019 Page 5 of 18 Question Answer Marks 2(a)(i) Linear/in a line. 1 2(a)(ii) Ideas such as: Along a road for transport/ to get to work/for deliveries; Access to/near to/there is a river for fishing/transport/water supply/fertile land; etc. Note: Can give same transport explanation for road and river. 2 @ 1 mark 2 2(a)(iii) Ideas such as: There is a river; Flooding may occur/the area could be a flood plain; The area could be marshy land It could be farmland; It could be forested; Etc. 3 @ 1 mark 3 2(a)(iv) Settlement pattern is dispersed/scattered (1 mark reserved) The area could be farmland; Woodland/forest; People need large areas of land to make a living; Some parts of the area may not be habitable Etc. 4 @ 1 mark 4 2(b)(i) Ideas such as: More people living in towns/cities/urban areas/cities are growing/rural-urban migration; Example of pull factor e.g. jobs; No place to build in cities; People all want their own homes/single family homes; People want large homes/garages; Settlements are joining together/swallowing villages; Etc. 3 @ 1 mark 3
Mark scheme, page 6
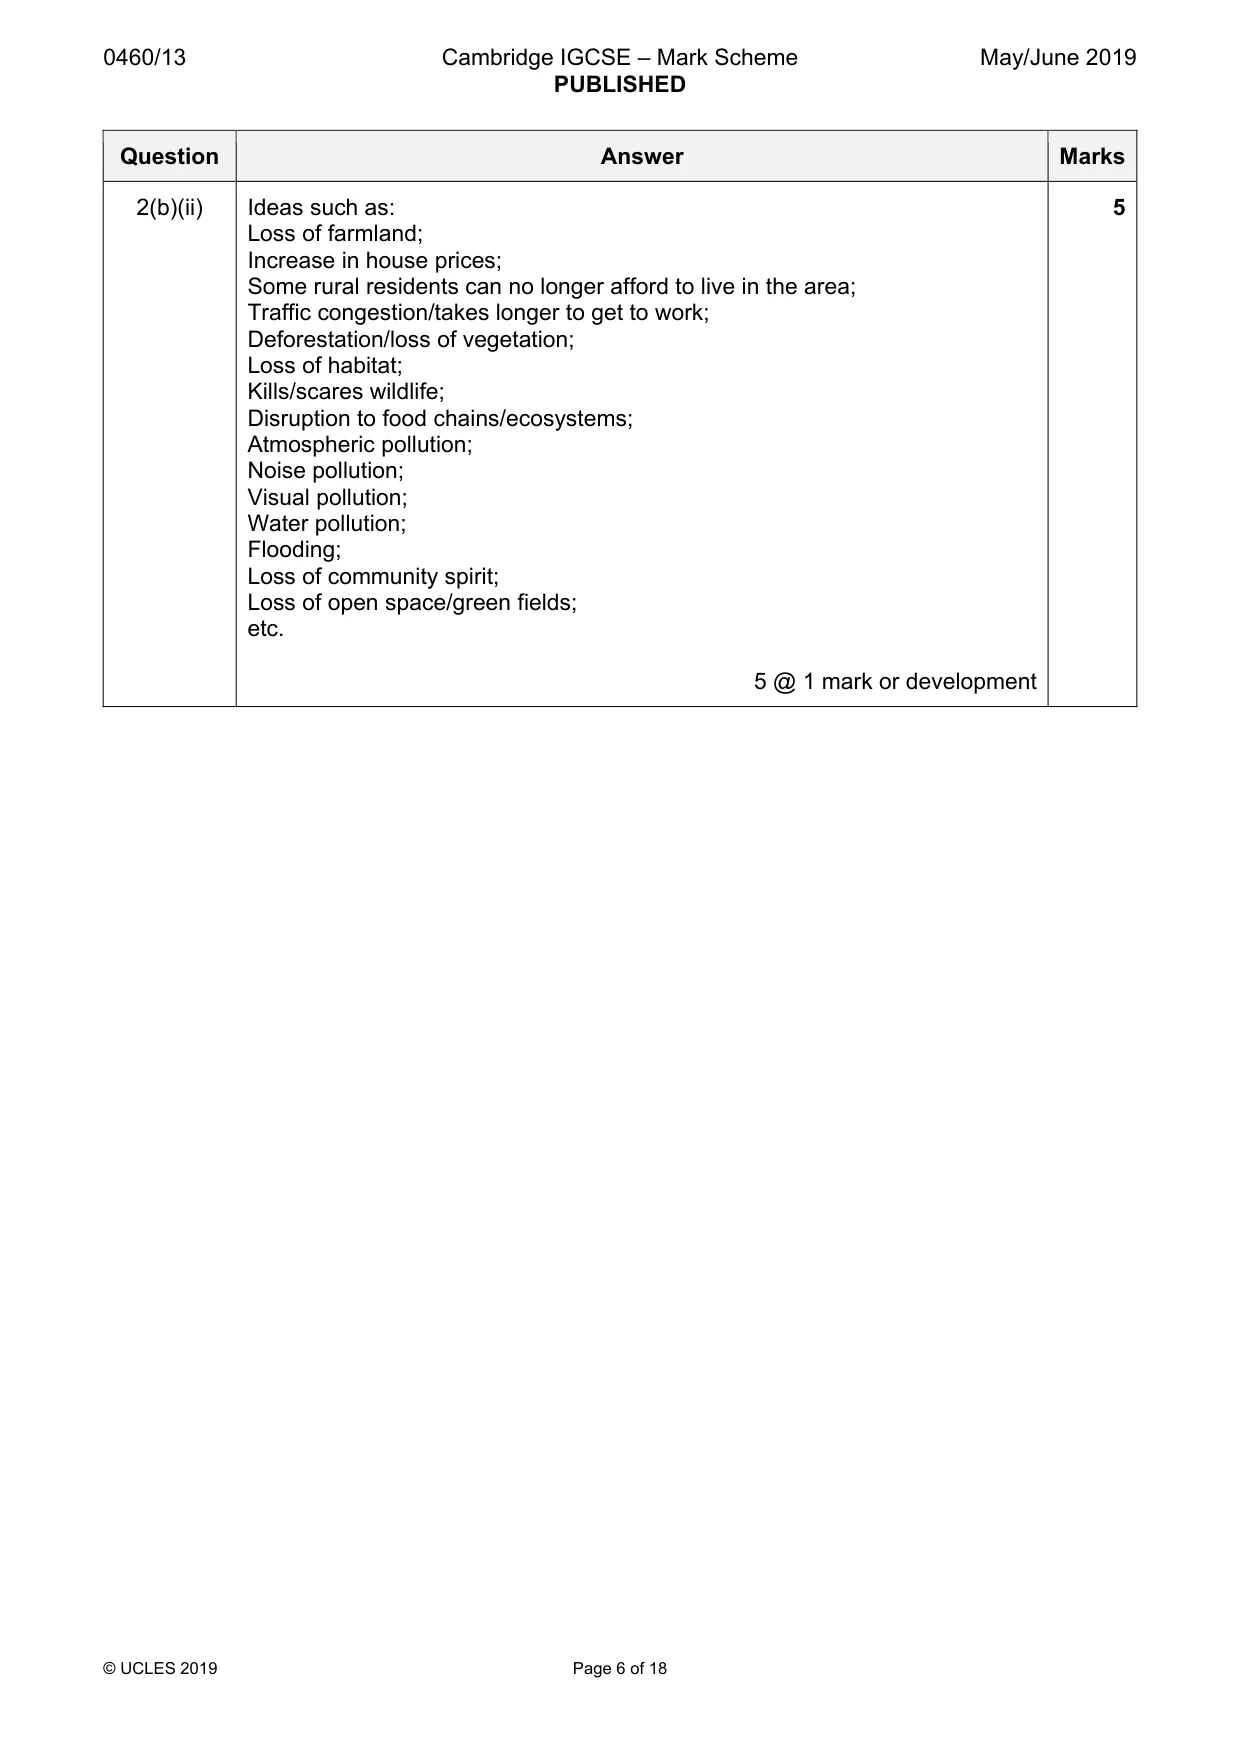
0460/13 Cambridge IGCSE – Mark Scheme PUBLISHED May/June 2019 © UCLES 2019 Page 6 of 18 Question Answer Marks 2(b)(ii) Ideas such as: Loss of farmland; Increase in house prices; Some rural residents can no longer afford to live in the area; Traffic congestion/takes longer to get to work; Deforestation/loss of vegetation; Loss of habitat; Kills/scares wildlife; Disruption to food chains/ecosystems; Atmospheric pollution; Noise pollution; Visual pollution; Water pollution; Flooding; Loss of community spirit; Loss of open space/green fields; etc. 5 @ 1 mark or development 5
Mark scheme, page 7
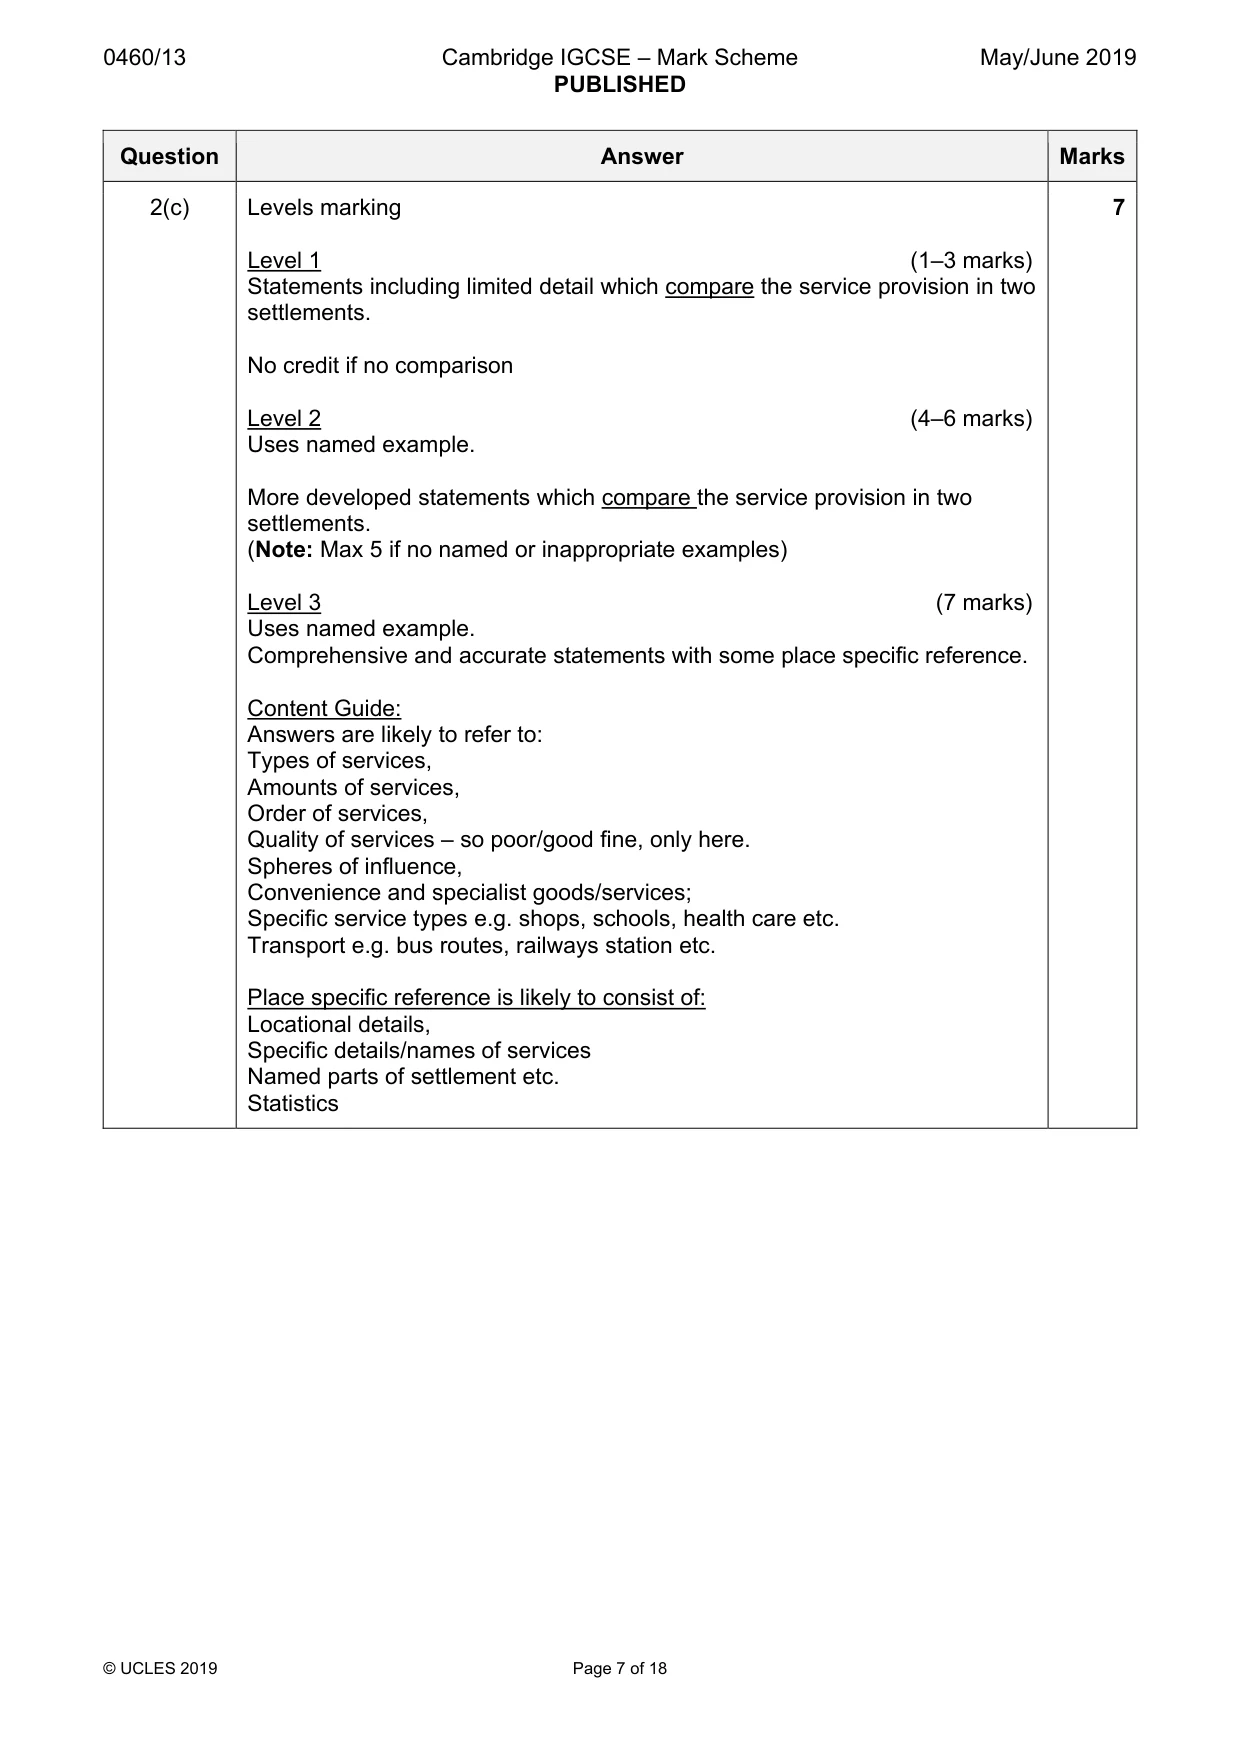
0460/13 Cambridge IGCSE – Mark Scheme PUBLISHED May/June 2019 © UCLES 2019 Page 7 of 18 Question Answer Marks 2(c) Levels marking Level 1 (1–3 marks) Statements including limited detail which compare the service provision in two settlements. No credit if no comparison Level 2 (4–6 marks) Uses named example. More developed statements which compare the service provision in two settlements. (Note: Max 5 if no named or inappropriate examples) Level 3 (7 marks) Uses named example. Comprehensive and accurate statements with some place specific reference. Content Guide: Answers are likely to refer to: Types of services, Amounts of services, Order of services, Quality of services – so poor/good fine, only here. Spheres of influence, Convenience and specialist goods/services; Specific service types e.g. shops, schools, health care etc. Transport e.g. bus routes, railways station etc. Place specific reference is likely to consist of: Locational details, Specific details/names of services Named parts of settlement etc. Statistics 7
Mark scheme, page 8
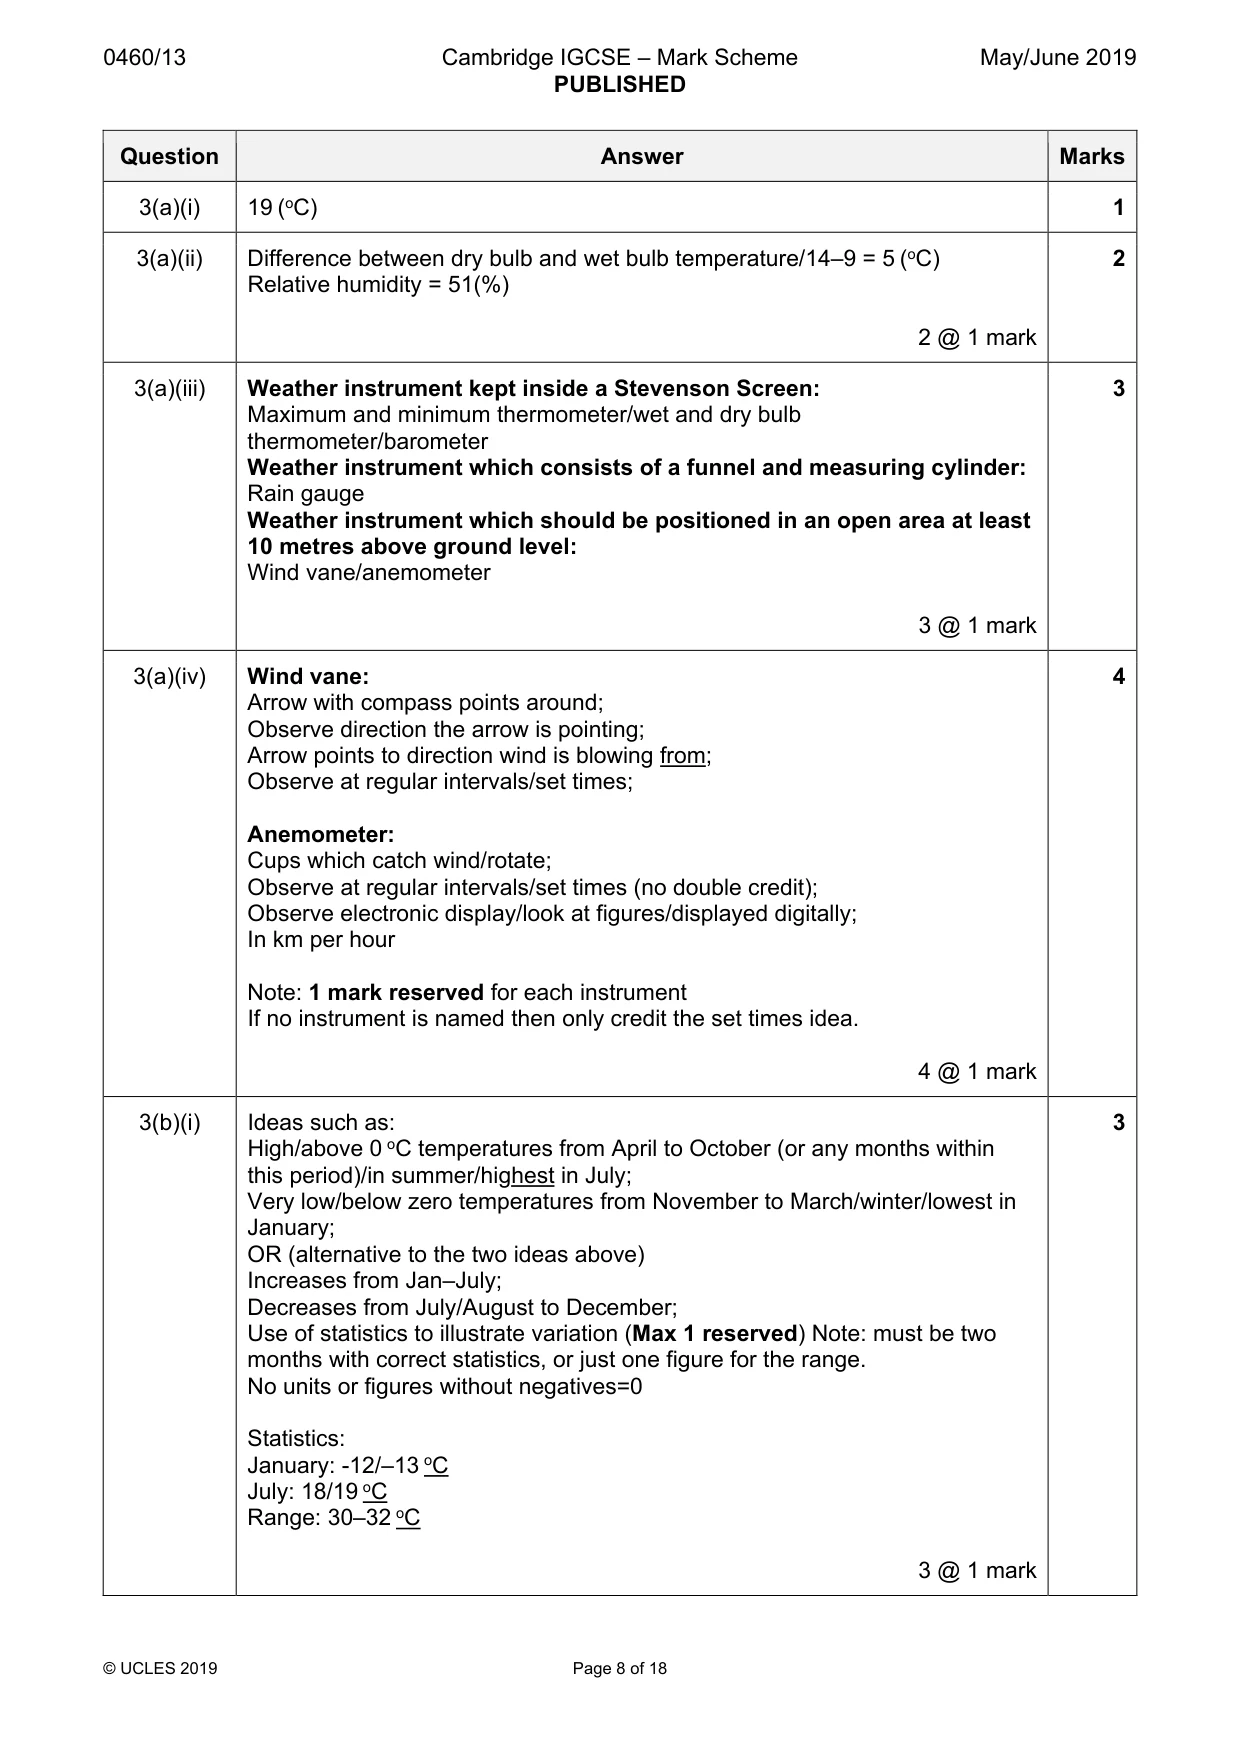
0460/13 Cambridge IGCSE – Mark Scheme PUBLISHED May/June 2019 © UCLES 2019 Page 8 of 18 Question Answer Marks 3(a)(i) 19 (oC) 1 3(a)(ii) Difference between dry bulb and wet bulb temperature/14–9 = 5 (oC) Relative humidity = 51(%) 2 @ 1 mark 2 3(a)(iii) Weather instrument kept inside a Stevenson Screen: Maximum and minimum thermometer/wet and dry bulb thermometer/barometer Weather instrument which consists of a funnel and measuring cylinder: Rain gauge Weather instrument which should be positioned in an open area at least 10 metres above ground level: Wind vane/anemometer 3 @ 1 mark 3 3(a)(iv) Wind vane: Arrow with compass points around; Observe direction the arrow is pointing; Arrow points to direction wind is blowing from; Observe at regular intervals/set times; Anemometer: Cups which catch wind/rotate; Observe at regular intervals/set times (no double credit); Observe electronic display/look at figures/displayed digitally; In km per hour Note: 1 mark reserved for each instrument If no instrument is named then only credit the set times idea. 4 @ 1 mark 4 3(b)(i) Ideas such as: High/above 0 oC temperatures from April to October (or any months within this period)/in summer/highest in July; Very low/below zero temperatures from November to March/winter/lowest in January; OR (alternative to the two ideas above) Increases from Jan–July; Decreases from July/August to December; Use of statistics to illustrate variation (Max 1 reserved) Note: must be two months with correct statistics, or just one figure for the range. No units or figures without negatives=0 Statistics: January: -12/–13 oC July: 18/19 oC Range: 30–32 oC 3 @ 1 mark 3
Mark scheme, page 9
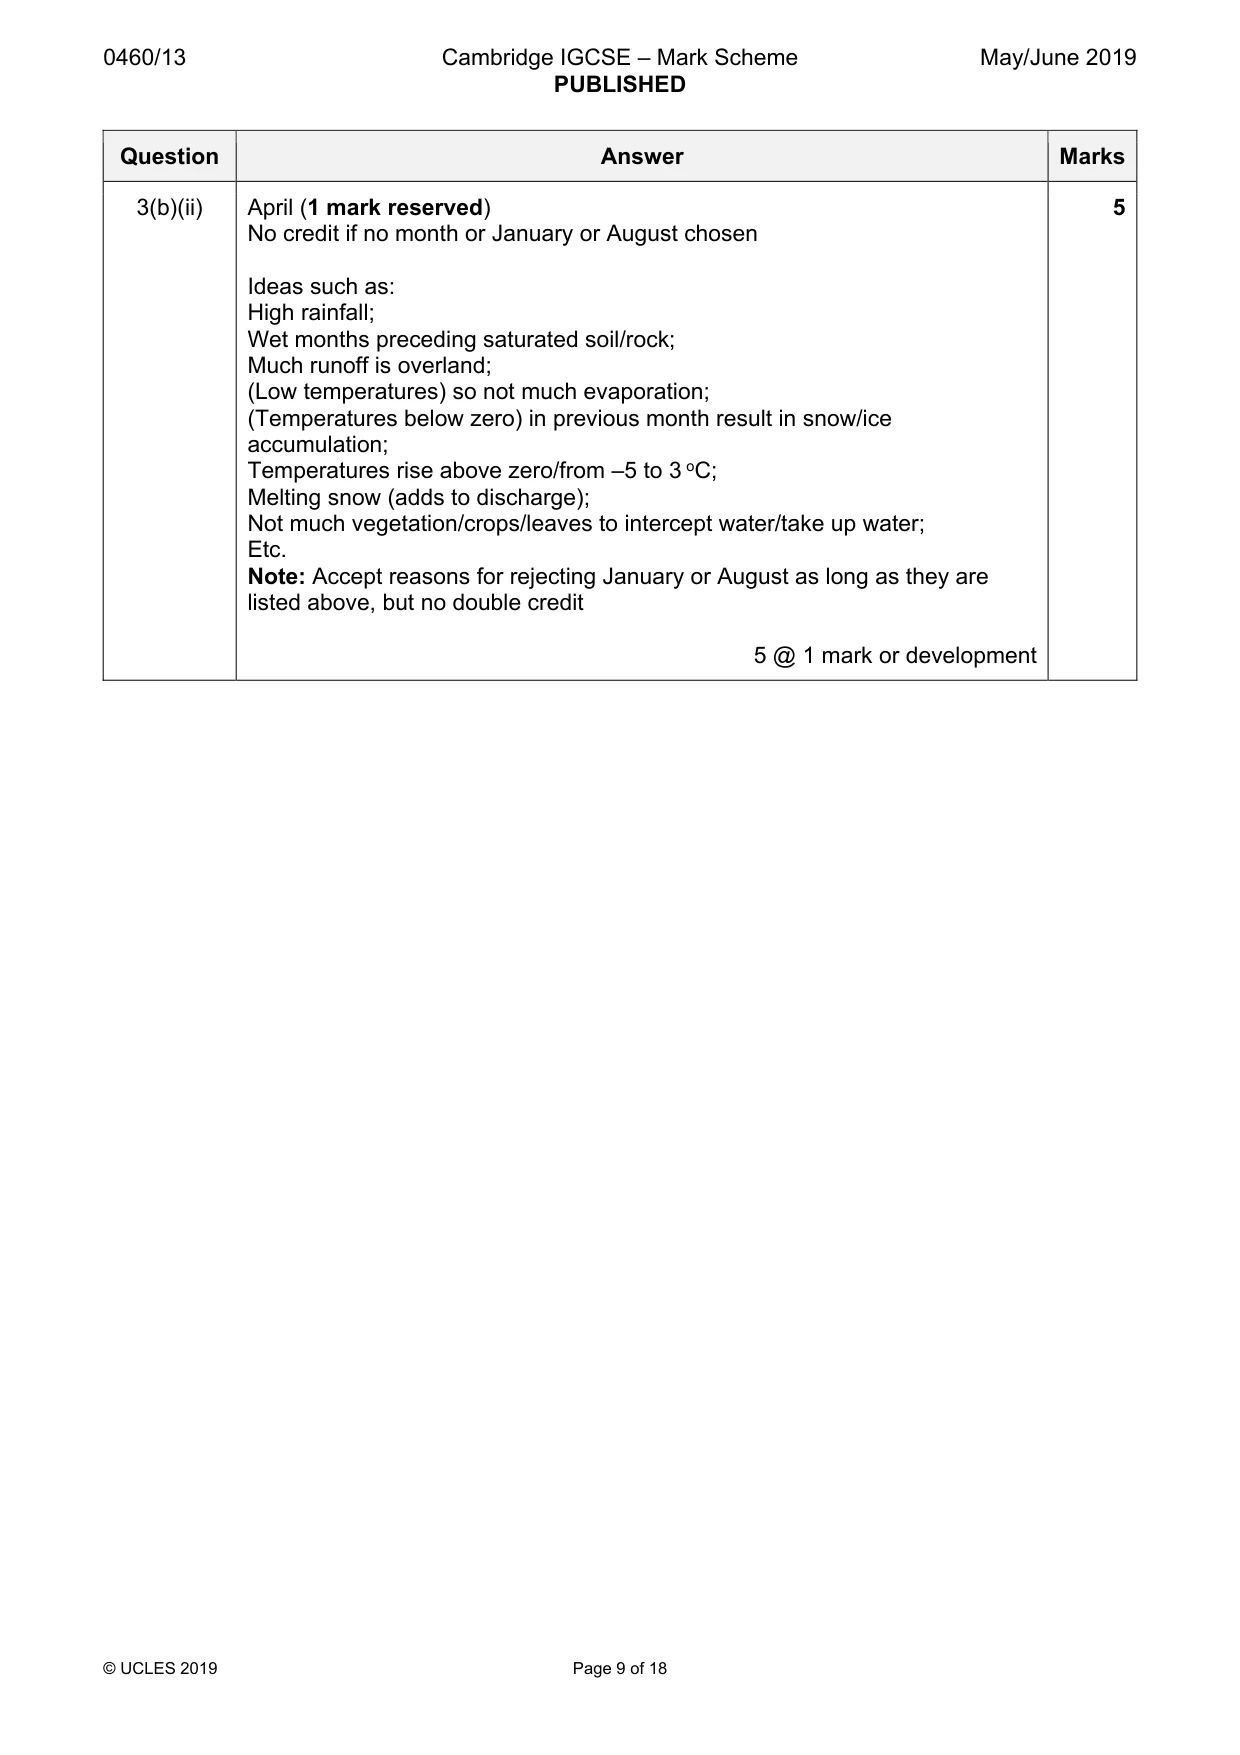
0460/13 Cambridge IGCSE – Mark Scheme PUBLISHED May/June 2019 © UCLES 2019 Page 9 of 18 Question Answer Marks 3(b)(ii) April (1 mark reserved) No credit if no month or January or August chosen Ideas such as: High rainfall; Wet months preceding saturated soil/rock; Much runoff is overland; (Low temperatures) so not much evaporation; (Temperatures below zero) in previous month result in snow/ice accumulation; Temperatures rise above zero/from –5 to 3 oC; Melting snow (adds to discharge); Not much vegetation/crops/leaves to intercept water/take up water; Etc. Note: Accept reasons for rejecting January or August as long as they are listed above, but no double credit 5 @ 1 mark or development 5
Mark scheme, page 10
0460/13 Cambridge IGCSE – Mark Scheme PUBLISHED May/June 2019 © UCLES 2019 Page 10 of 18 Question Answer Marks 3(c) Levels marking Level 1 (1–3 marks) Statements including limited detail which describe the impacts of flooding. e.g. Damage to roads (L1) so can’t get to work (L2) Level 2 (4–6 marks) Uses named example. More developed statements which describe the impacts of flooding. (Note: Max 5 if no named or inappropriate example) Level 3 (7 marks) Uses named example. Comprehensive and accurate statements including some place specific reference. Content Guide: Answers are likely to refer to: Deaths, Damage to housing, Damage to possessions, Transport disrupted, Electricity cut off, Water supplies contaminated, Economic impacts, Loss of crops etc. Fertile soil Impact on natural environment Place specific reference is likely to consist of: Locational details, named places along the river/in the drainage basin, specific details of impacts date/time etc. Statistics 7
Mark scheme, page 11
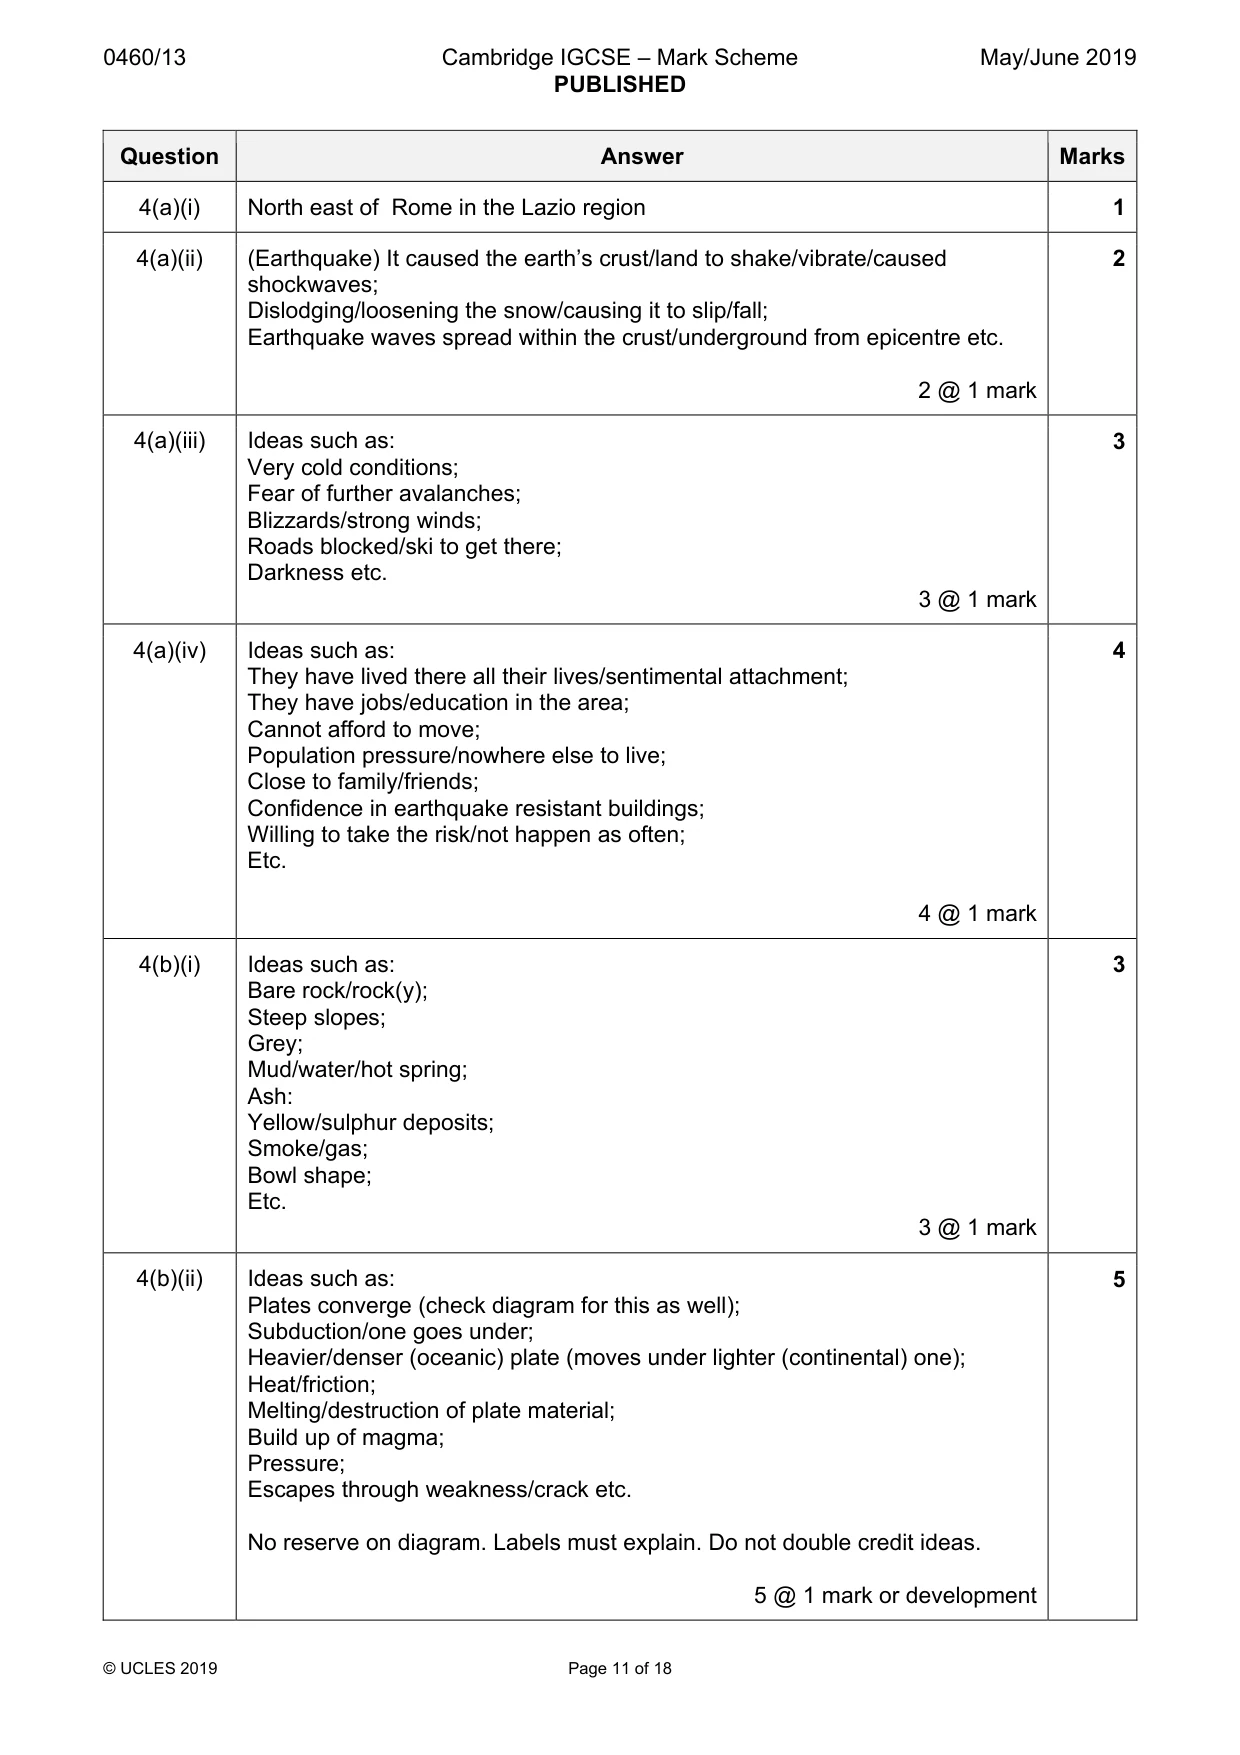
0460/13 Cambridge IGCSE – Mark Scheme PUBLISHED May/June 2019 © UCLES 2019 Page 11 of 18 Question Answer Marks 4(a)(i) North east of Rome in the Lazio region 1 4(a)(ii) (Earthquake) It caused the earth’s crust/land to shake/vibrate/caused shockwaves; Dislodging/loosening the snow/causing it to slip/fall; Earthquake waves spread within the crust/underground from epicentre etc. 2 @ 1 mark 2 4(a)(iii) Ideas such as: Very cold conditions; Fear of further avalanches; Blizzards/strong winds; Roads blocked/ski to get there; Darkness etc. 3 @ 1 mark 3 4(a)(iv) Ideas such as: They have lived there all their lives/sentimental attachment; They have jobs/education in the area; Cannot afford to move; Population pressure/nowhere else to live; Close to family/friends; Confidence in earthquake resistant buildings; Willing to take the risk/not happen as often; Etc. 4 @ 1 mark 4 4(b)(i) Ideas such as: Bare rock/rock(y); Steep slopes; Grey; Mud/water/hot spring; Ash: Yellow/sulphur deposits; Smoke/gas; Bowl shape; Etc. 3 @ 1 mark 3 4(b)(ii) Ideas such as: Plates converge (check diagram for this as well); Subduction/one goes under; Heavier/denser (oceanic) plate (moves under lighter (continental) one); Heat/friction; Melting/destruction of plate material; Build up of magma; Pressure; Escapes through weakness/crack etc. No reserve on diagram. Labels must explain. Do not double credit ideas. 5 @ 1 mark or development 5
Mark scheme, page 12
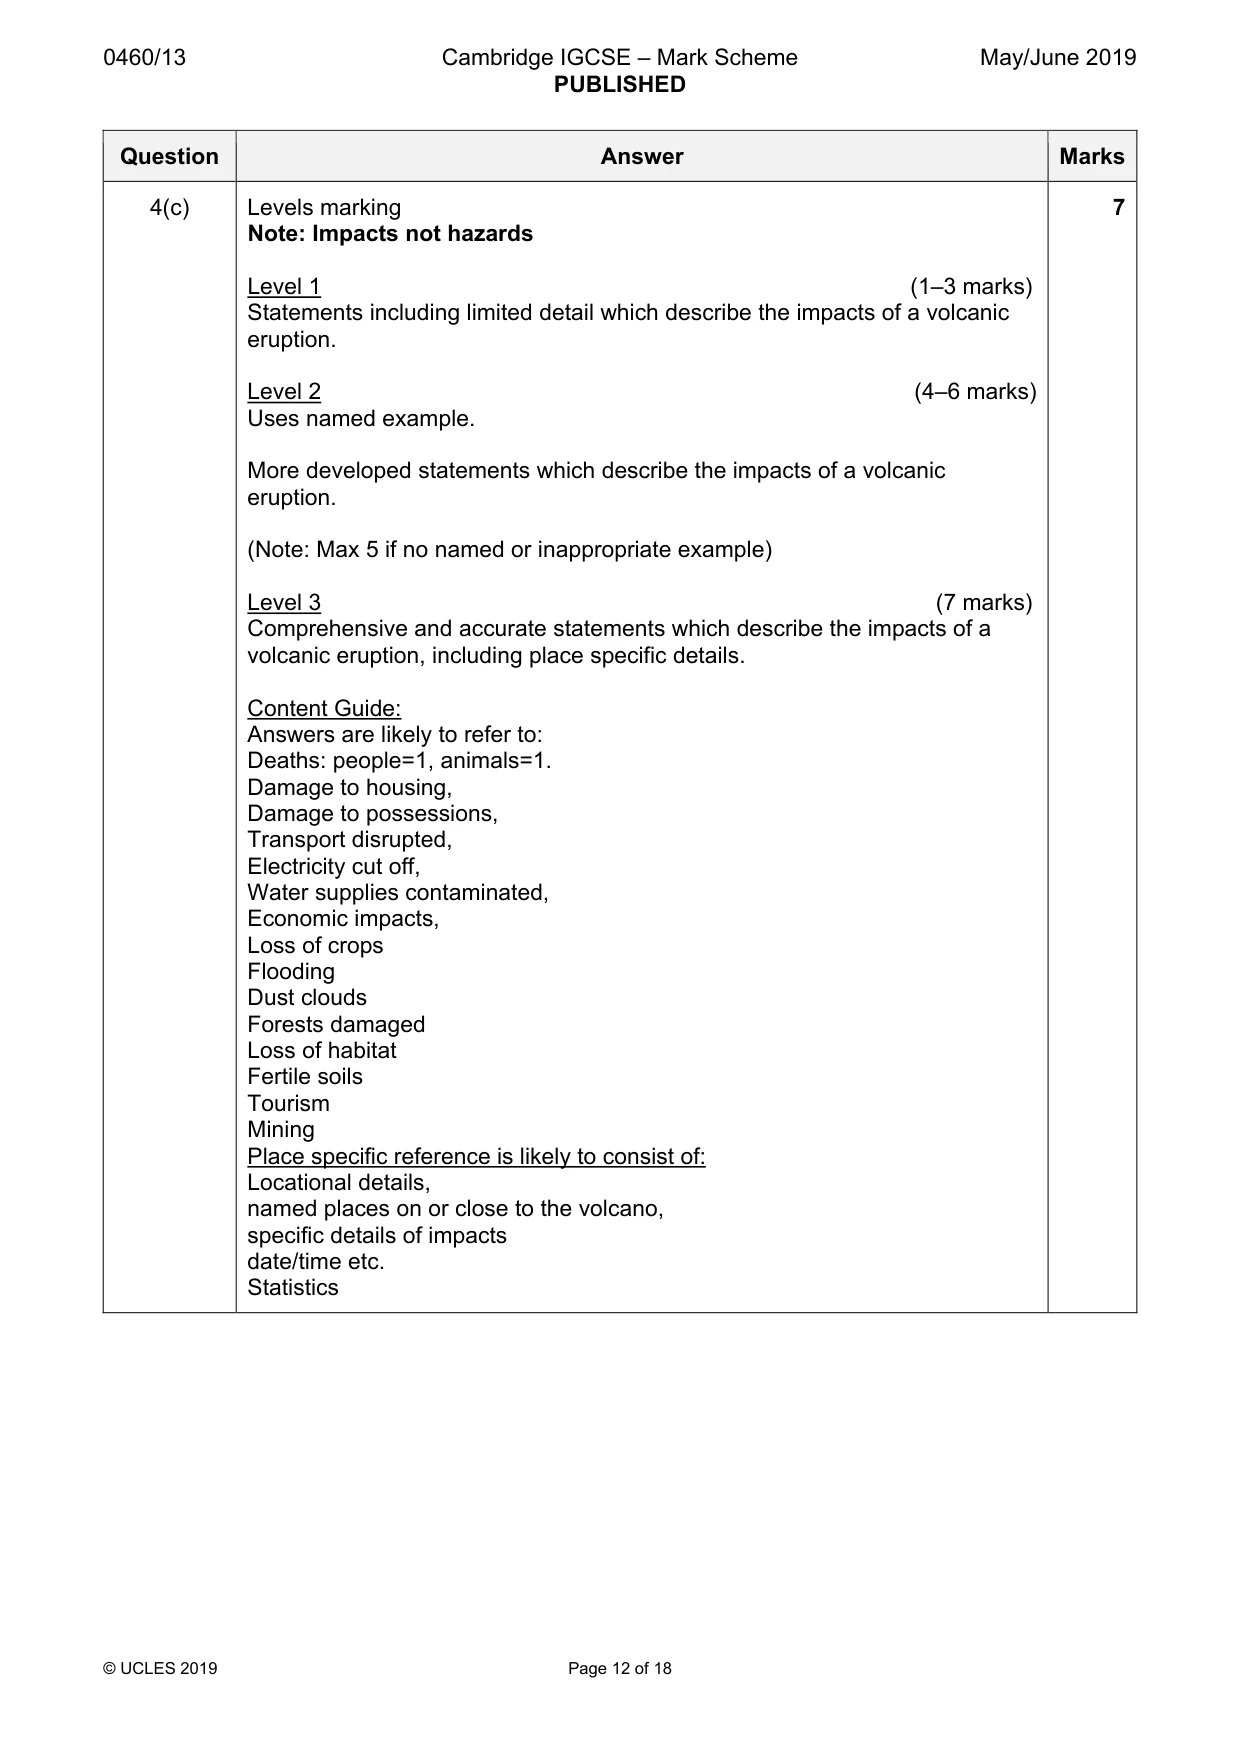
0460/13 Cambridge IGCSE – Mark Scheme PUBLISHED May/June 2019 © UCLES 2019 Page 12 of 18 Question Answer Marks 4(c) Levels marking Note: Impacts not hazards Level 1 (1–3 marks) Statements including limited detail which describe the impacts of a volcanic eruption. Level 2 (4–6 marks) Uses named example. More developed statements which describe the impacts of a volcanic eruption. (Note: Max 5 if no named or inappropriate example) Level 3 (7 marks) Comprehensive and accurate statements which describe the impacts of a volcanic eruption, including place specific details. Content Guide: Answers are likely to refer to: Deaths: people=1, animals=1. Damage to housing, Damage to possessions, Transport disrupted, Electricity cut off, Water supplies contaminated, Economic impacts, Loss of crops Flooding Dust clouds Forests damaged Loss of habitat Fertile soils Tourism Mining Place specific reference is likely to consist of: Locational details, named places on or close to the volcano, specific details of impacts date/time etc. Statistics 7
Mark scheme, page 13
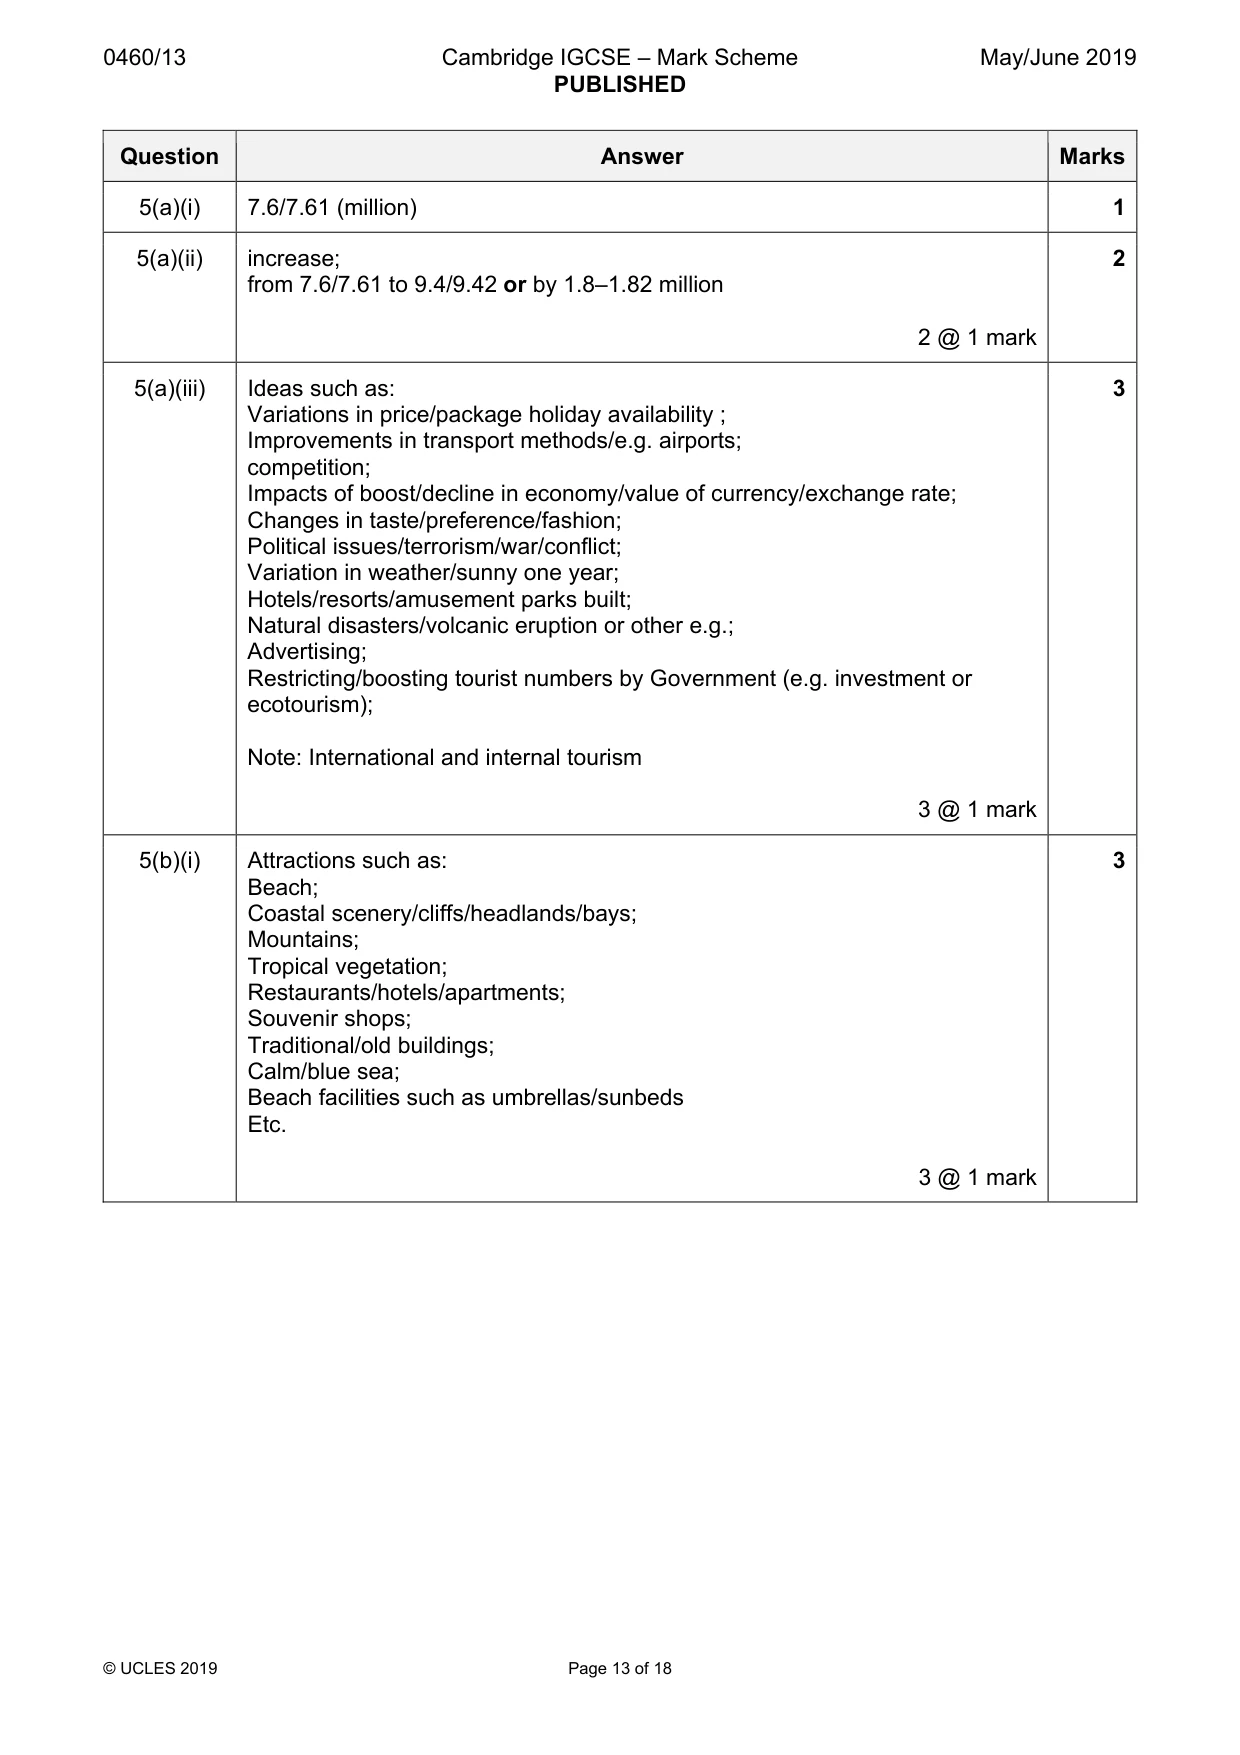
0460/13 Cambridge IGCSE – Mark Scheme PUBLISHED May/June 2019 © UCLES 2019 Page 13 of 18 Question Answer Marks 5(a)(i) 7.6/7.61 (million) 1 5(a)(ii) increase; from 7.6/7.61 to 9.4/9.42 or by 1.8–1.82 million 2 @ 1 mark 2 5(a)(iii) Ideas such as: Variations in price/package holiday availability ; Improvements in transport methods/e.g. airports; competition; Impacts of boost/decline in economy/value of currency/exchange rate; Changes in taste/preference/fashion; Political issues/terrorism/war/conflict; Variation in weather/sunny one year; Hotels/resorts/amusement parks built; Natural disasters/volcanic eruption or other e.g.; Advertising; Restricting/boosting tourist numbers by Government (e.g. investment or ecotourism); Note: International and internal tourism 3 @ 1 mark 3 5(b)(i) Attractions such as: Beach; Coastal scenery/cliffs/headlands/bays; Mountains; Tropical vegetation; Restaurants/hotels/apartments; Souvenir shops; Traditional/old buildings; Calm/blue sea; Beach facilities such as umbrellas/sunbeds Etc. 3 @ 1 mark 3
Mark scheme, page 14
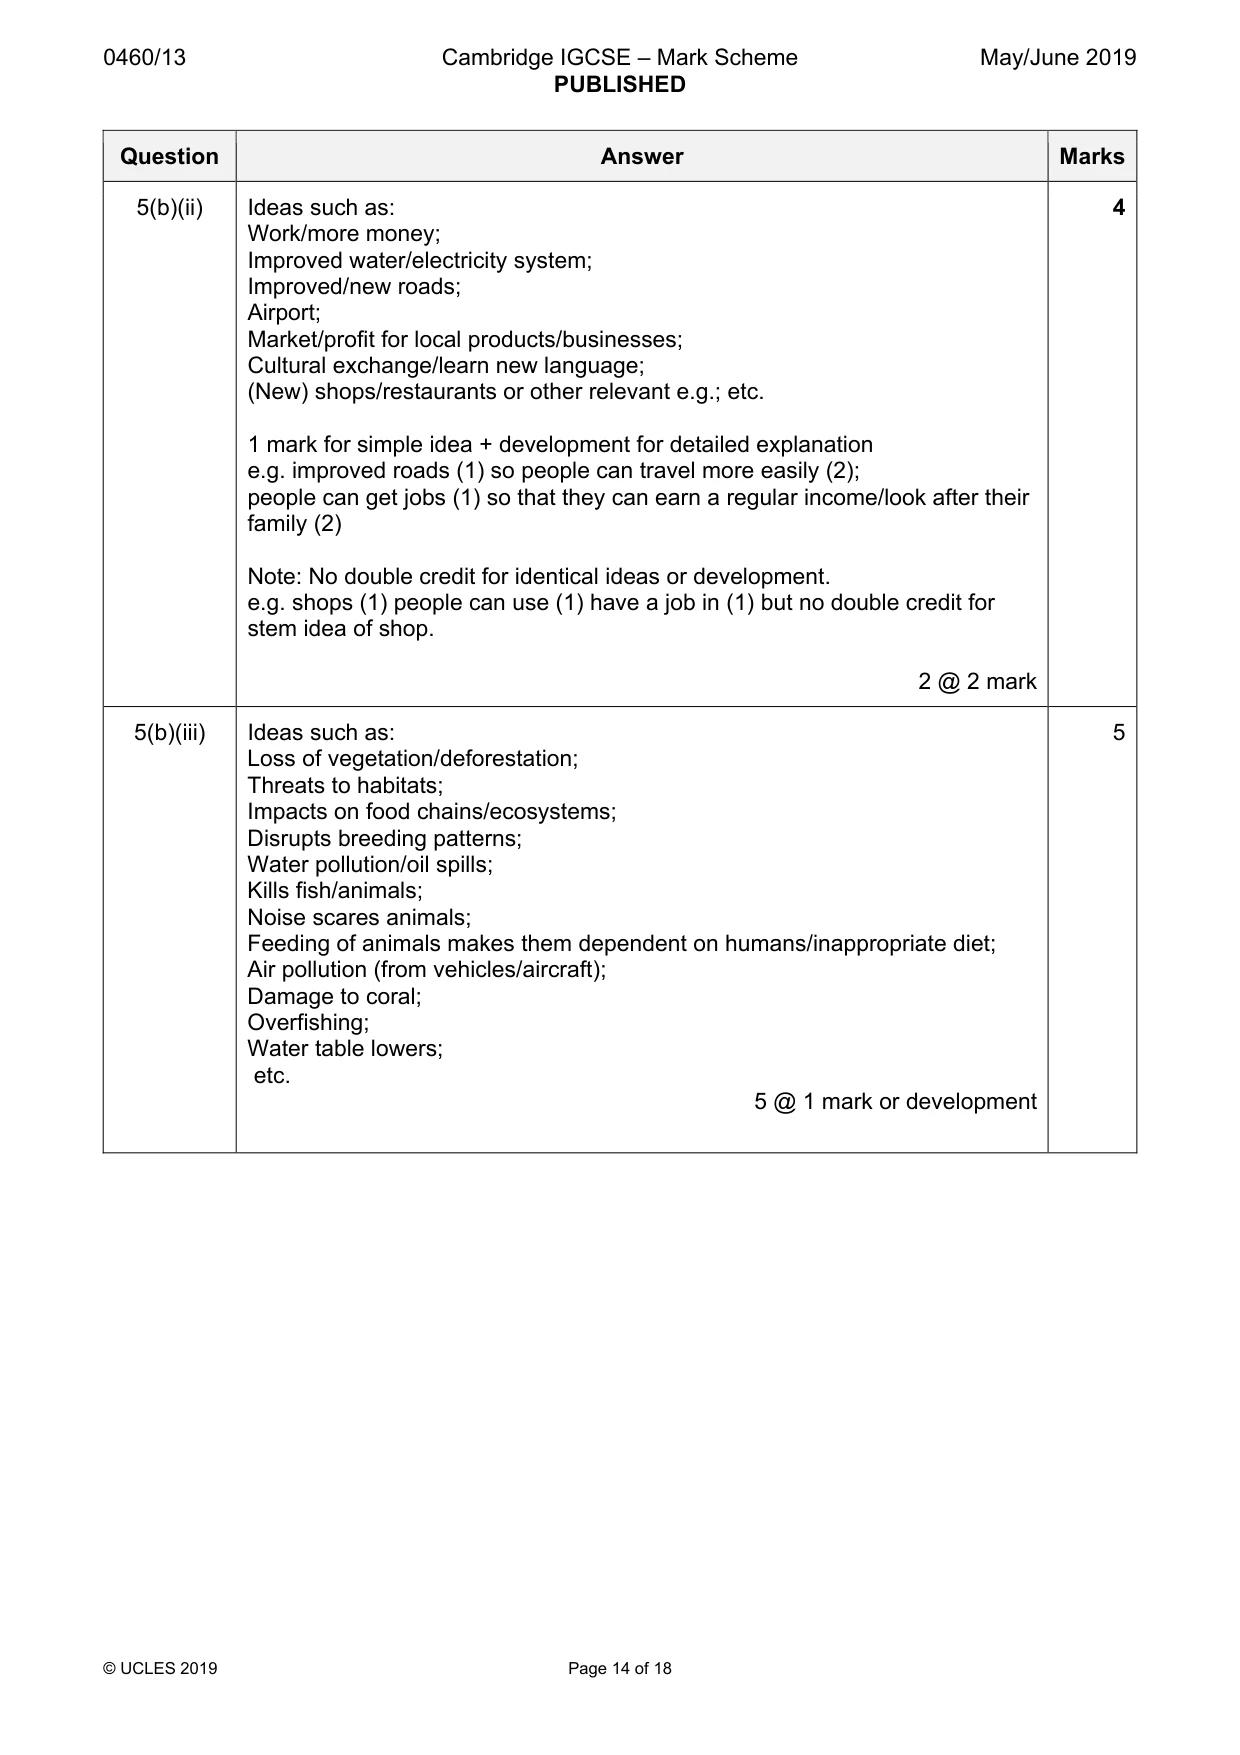
0460/13 Cambridge IGCSE – Mark Scheme PUBLISHED May/June 2019 © UCLES 2019 Page 14 of 18 Question Answer Marks 5(b)(ii) Ideas such as: Work/more money; Improved water/electricity system; Improved/new roads; Airport; Market/profit for local products/businesses; Cultural exchange/learn new language; (New) shops/restaurants or other relevant e.g.; etc. 1 mark for simple idea + development for detailed explanation e.g. improved roads (1) so people can travel more easily (2); people can get jobs (1) so that they can earn a regular income/look after their family (2) Note: No double credit for identical ideas or development. e.g. shops (1) people can use (1) have a job in (1) but no double credit for stem idea of shop. 2 @ 2 mark 4 5(b)(iii) Ideas such as: Loss of vegetation/deforestation; Threats to habitats; Impacts on food chains/ecosystems; Disrupts breeding patterns; Water pollution/oil spills; Kills fish/animals; Noise scares animals; Feeding of animals makes them dependent on humans/inappropriate diet; Air pollution (from vehicles/aircraft); Damage to coral; Overfishing; Water table lowers; etc. 5 @ 1 mark or development 5
Mark scheme, page 15
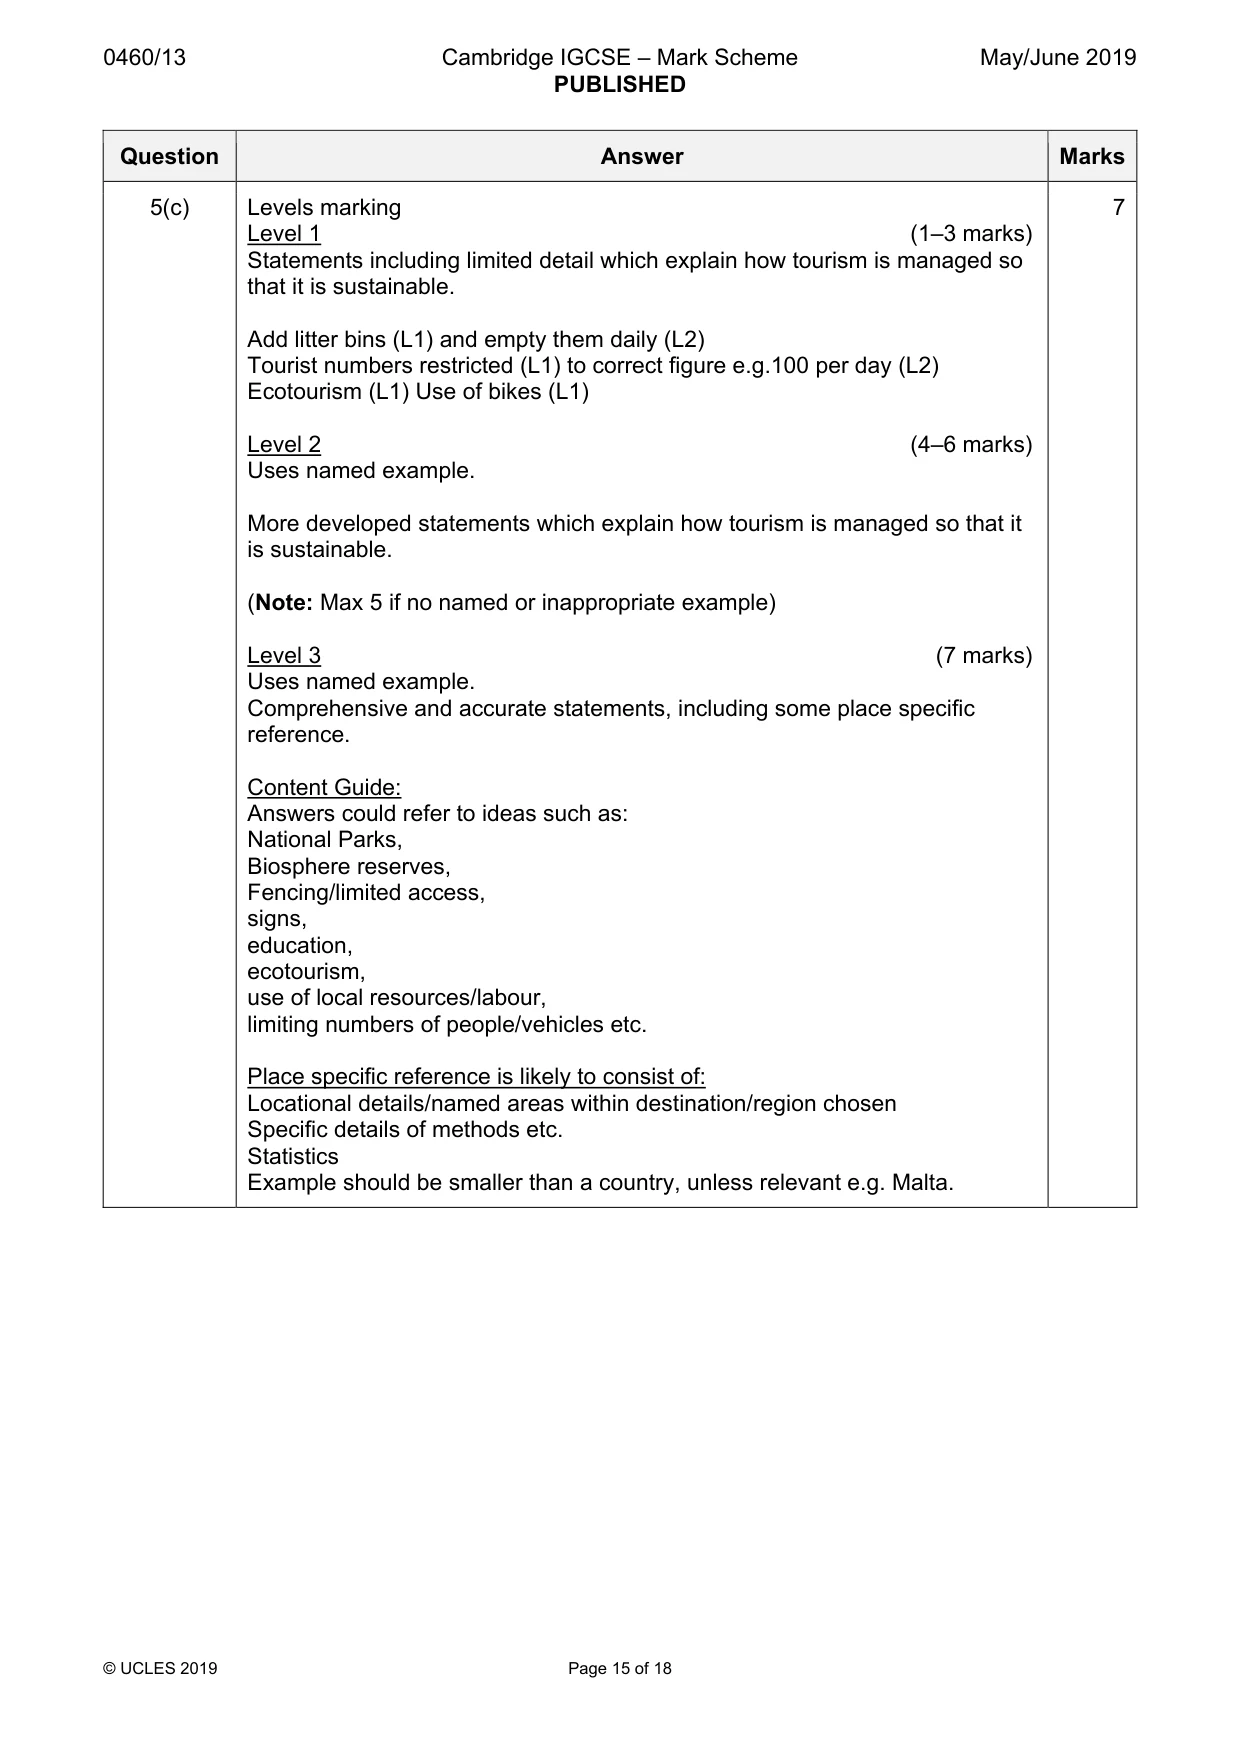
0460/13 Cambridge IGCSE – Mark Scheme PUBLISHED May/June 2019 © UCLES 2019 Page 15 of 18 Question Answer Marks 5(c) Levels marking Level 1 (1–3 marks) Statements including limited detail which explain how tourism is managed so that it is sustainable. Add litter bins (L1) and empty them daily (L2) Tourist numbers restricted (L1) to correct figure e.g.100 per day (L2) Ecotourism (L1) Use of bikes (L1) Level 2 (4–6 marks) Uses named example. More developed statements which explain how tourism is managed so that it is sustainable. (Note: Max 5 if no named or inappropriate example) Level 3 (7 marks) Uses named example. Comprehensive and accurate statements, including some place specific reference. Content Guide: Answers could refer to ideas such as: National Parks, Biosphere reserves, Fencing/limited access, signs, education, ecotourism, use of local resources/labour, limiting numbers of people/vehicles etc. Place specific reference is likely to consist of: Locational details/named areas within destination/region chosen Specific details of methods etc. Statistics Example should be smaller than a country, unless relevant e.g. Malta. 7
Mark scheme, page 16
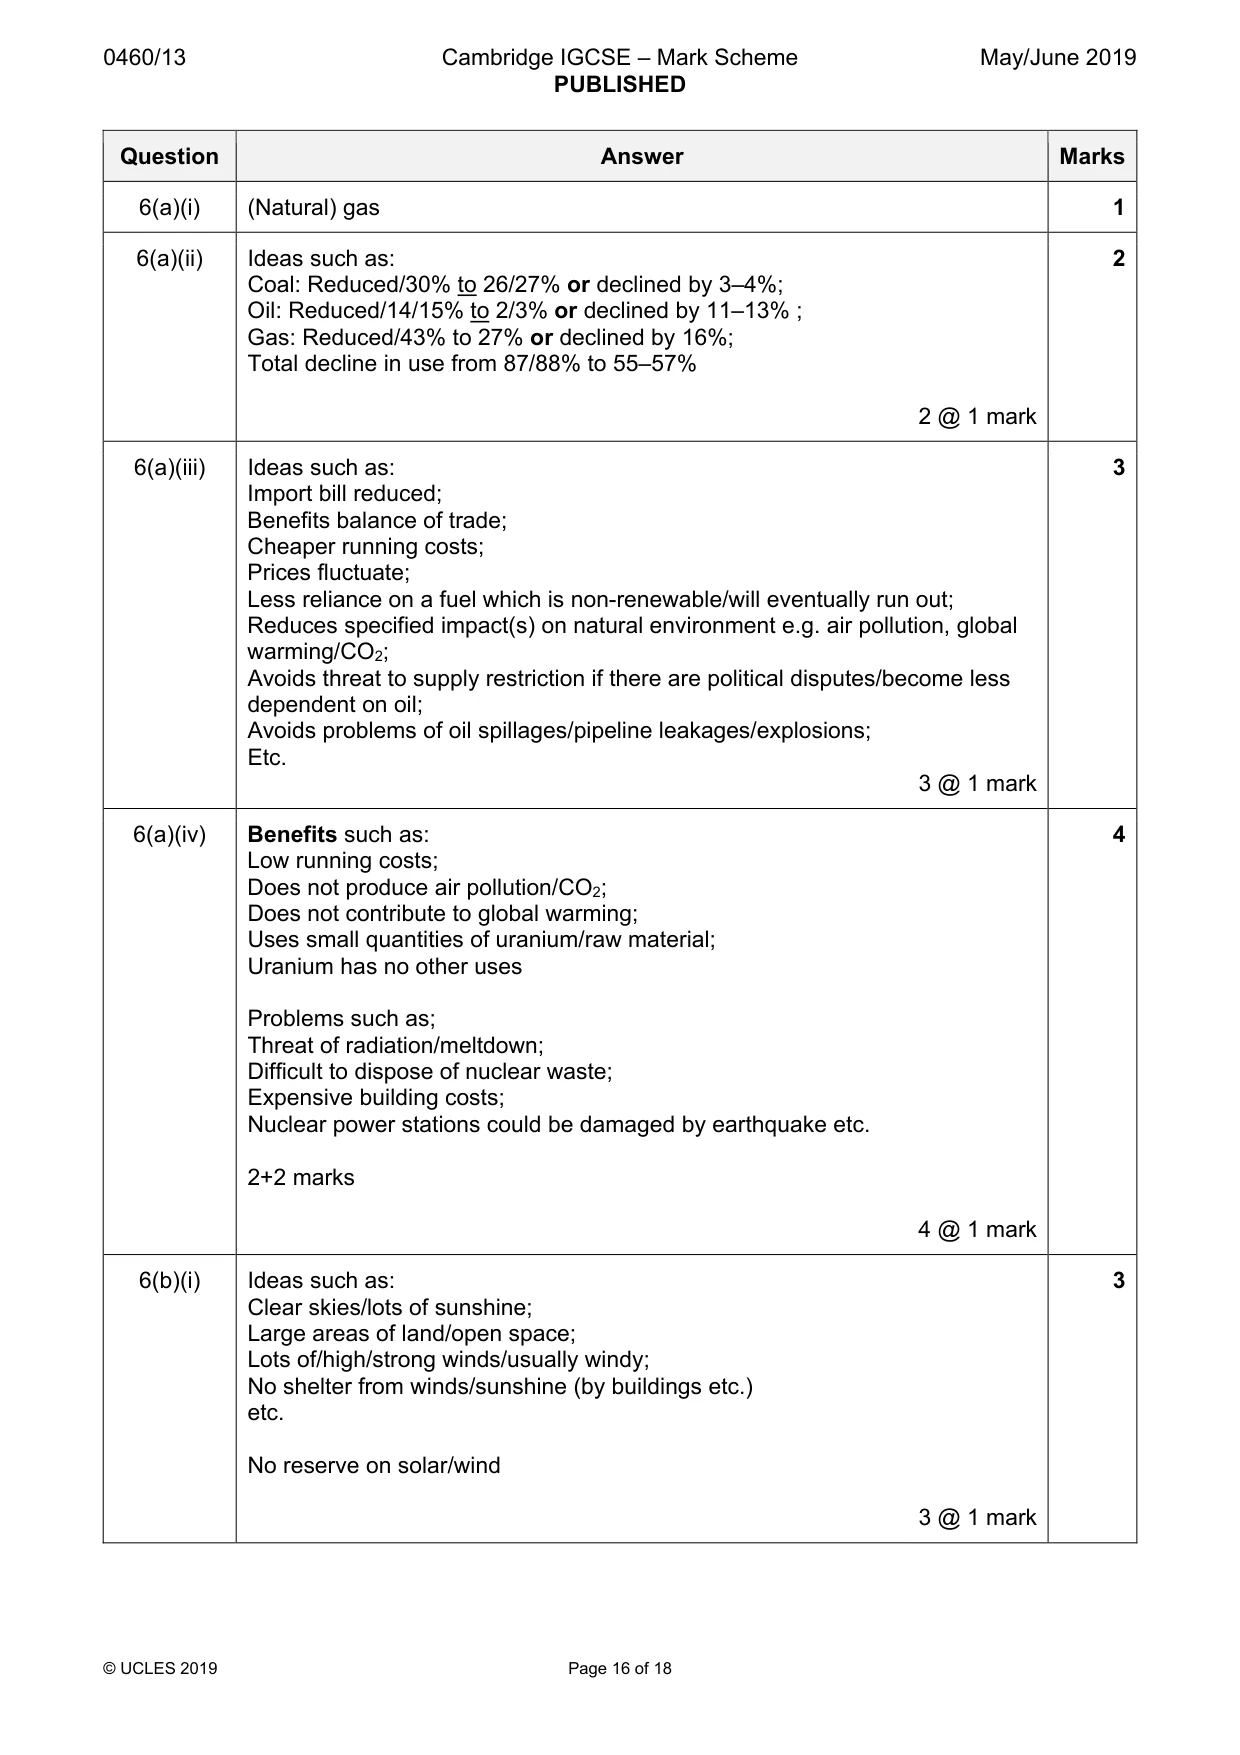
0460/13 Cambridge IGCSE – Mark Scheme PUBLISHED May/June 2019 © UCLES 2019 Page 16 of 18 Question Answer Marks 6(a)(i) (Natural) gas 1 6(a)(ii) Ideas such as: Coal: Reduced/30% to 26/27% or declined by 3–4%; Oil: Reduced/14/15% to 2/3% or declined by 11–13% ; Gas: Reduced/43% to 27% or declined by 16%; Total decline in use from 87/88% to 55–57% 2 @ 1 mark 2 6(a)(iii) Ideas such as: Import bill reduced; Benefits balance of trade; Cheaper running costs; Prices fluctuate; Less reliance on a fuel which is non-renewable/will eventually run out; Reduces specified impact(s) on natural environment e.g. air pollution, global warming/CO2; Avoids threat to supply restriction if there are political disputes/become less dependent on oil; Avoids problems of oil spillages/pipeline leakages/explosions; Etc. 3 @ 1 mark 3 6(a)(iv) Benefits such as: Low running costs; Does not produce air pollution/CO2; Does not contribute to global warming; Uses small quantities of uranium/raw material; Uranium has no other uses Problems such as; Threat of radiation/meltdown; Difficult to dispose of nuclear waste; Expensive building costs; Nuclear power stations could be damaged by earthquake etc. 2+2 marks 4 @ 1 mark 4 6(b)(i) Ideas such as: Clear skies/lots of sunshine; Large areas of land/open space; Lots of/high/strong winds/usually windy; No shelter from winds/sunshine (by buildings etc.) etc. No reserve on solar/wind 3 @ 1 mark 3
Mark scheme, page 17
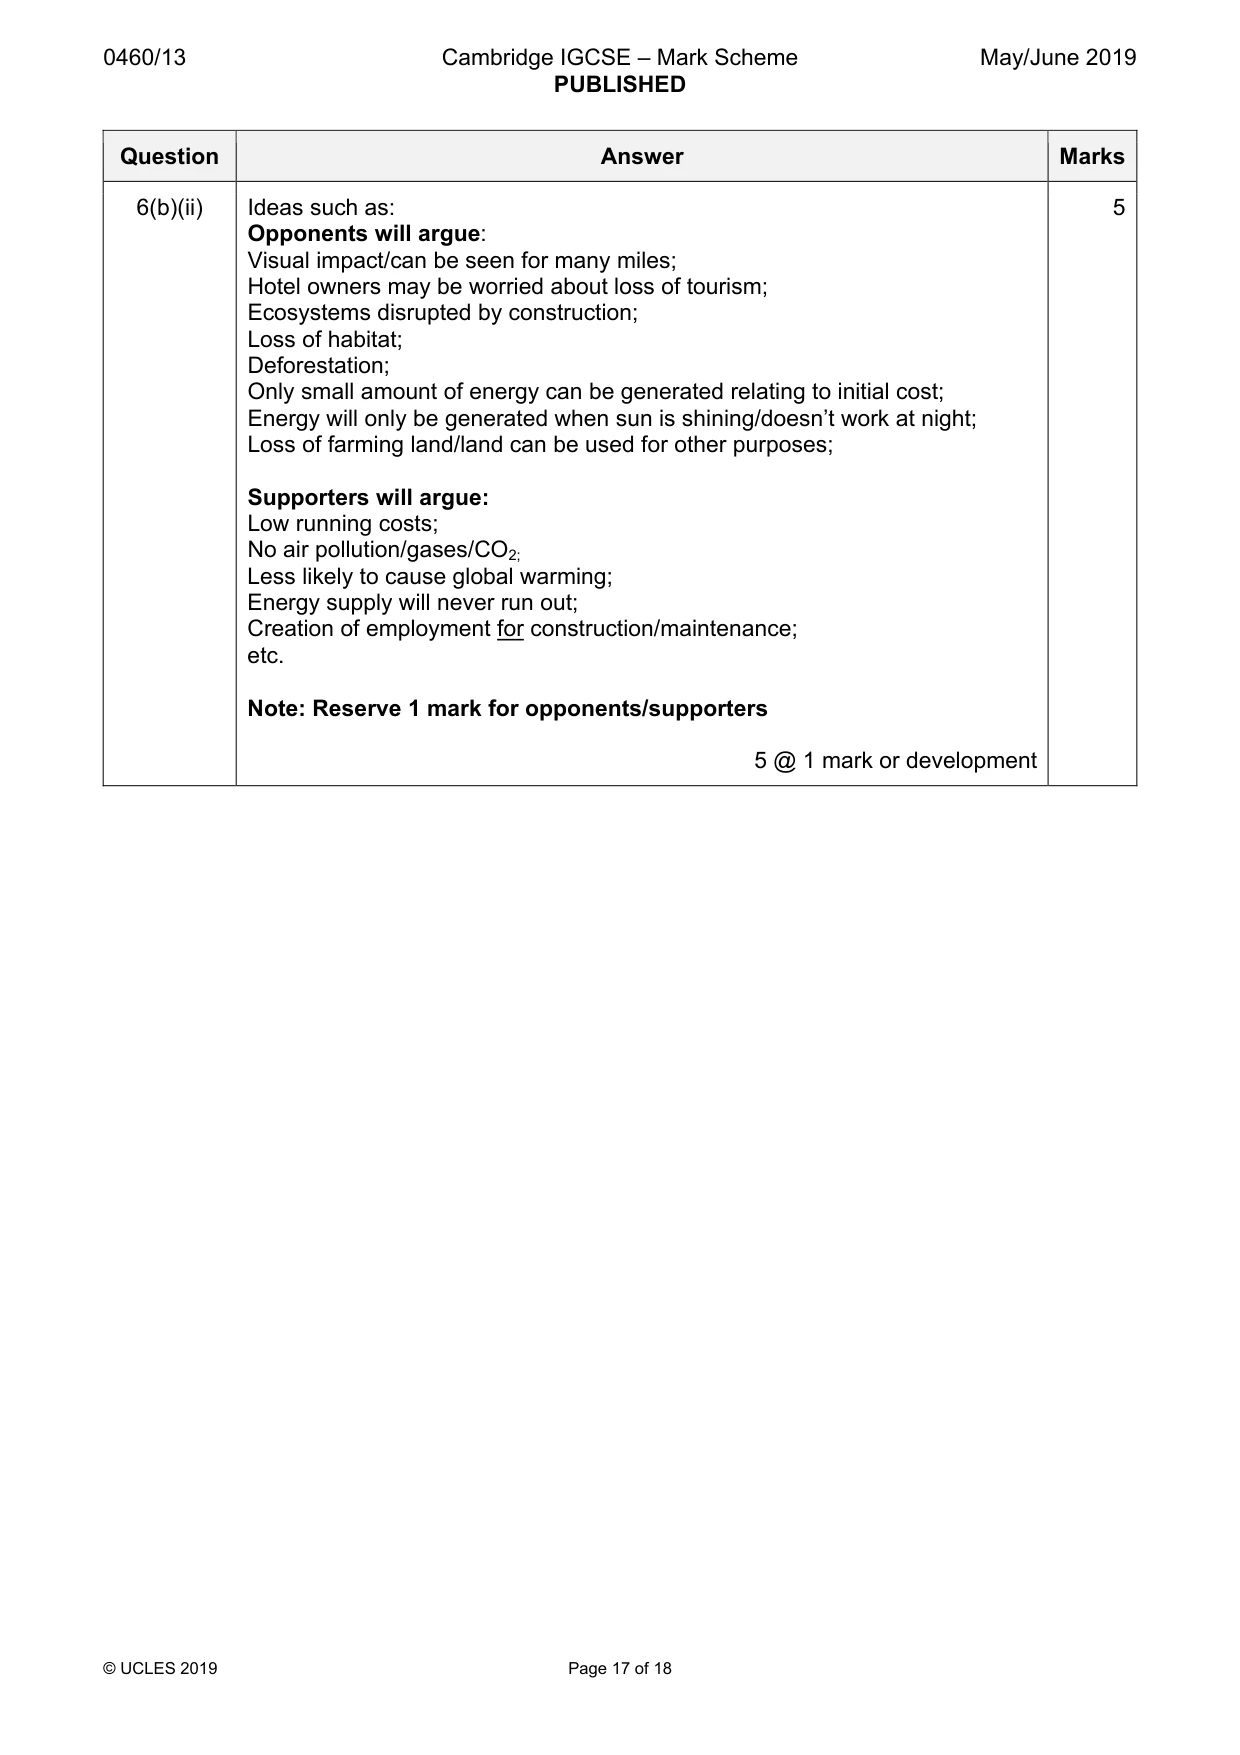
0460/13 Cambridge IGCSE – Mark Scheme PUBLISHED May/June 2019 © UCLES 2019 Page 17 of 18 Question Answer Marks 6(b)(ii) Ideas such as: Opponents will argue: Visual impact/can be seen for many miles; Hotel owners may be worried about loss of tourism; Ecosystems disrupted by construction; Loss of habitat; Deforestation; Only small amount of energy can be generated relating to initial cost; Energy will only be generated when sun is shining/doesn’t work at night; Loss of farming land/land can be used for other purposes; Supporters will argue: Low running costs; No air pollution/gases/CO2; Less likely to cause global warming; Energy supply will never run out; Creation of employment for construction/maintenance; etc. Note: Reserve 1 mark for opponents/supporters 5 @ 1 mark or development 5
Mark scheme, page 18
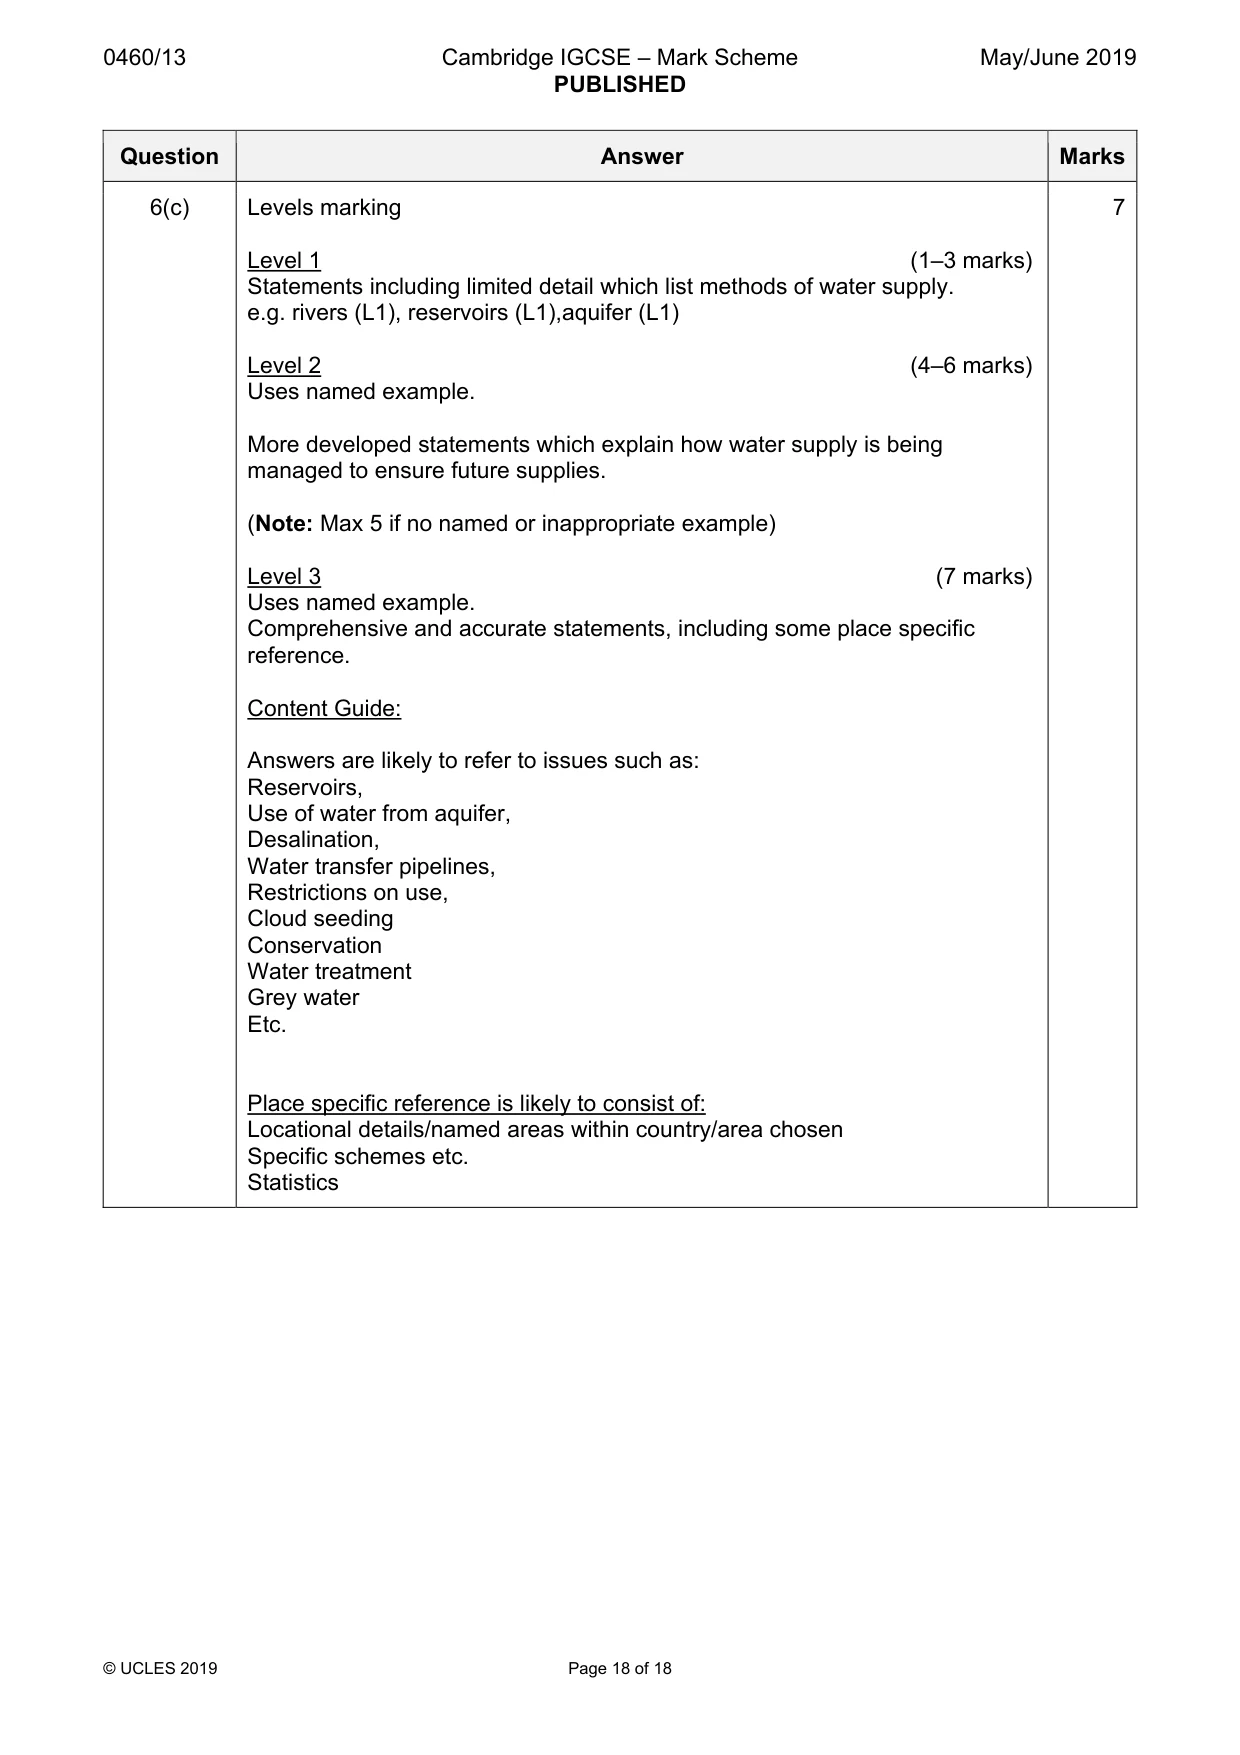
0460/13 Cambridge IGCSE – Mark Scheme PUBLISHED May/June 2019 © UCLES 2019 Page 18 of 18 Question Answer Marks 6(c) Levels marking Level 1 (1–3 marks) Statements including limited detail which list methods of water supply. e.g. rivers (L1), reservoirs (L1),aquifer (L1) Level 2 (4–6 marks) Uses named example. More developed statements which explain how water supply is being managed to ensure future supplies. (Note: Max 5 if no named or inappropriate example) Level 3 (7 marks) Uses named example. Comprehensive and accurate statements, including some place specific reference. Content Guide: Answers are likely to refer to issues such as: Reservoirs, Use of water from aquifer, Desalination, Water transfer pipelines, Restrictions on use, Cloud seeding Conservation Water treatment Grey water Etc. Place specific reference is likely to consist of: Locational details/named areas within country/area chosen Specific schemes etc. Statistics 7
What you needed in this session
Cambridge’s own grade thresholds for 2019 May/June, Paper 1 · Variant 3. A higher threshold means an easier paper — the bar moves with how the cohort did.