Cambridge IGCSE Geography 0460 — 2014 May/June Paper 4 · Variant 2
0460/42/M/J/14 · 60 marks · ≈68 min
The question paper and its mark scheme, free to read here and free to download. This is Cambridge’s own paper, exactly as it was sat.
Question paper16 pages



Mark scheme6 pages
Answers below. Sit the paper first if you are practising.
Paper as text
Question paper, page 1
This document consists of 14 printed pages, 2 blank pages and 1 Insert. DC (SJF/CGW) 80068/7 © UCLES 2014 [Turn over Cambridge International Examinations Cambridge International General Certificate of Secondary Education * 6 5 6 7 3 0 4 4 0 4 * GEOGRAPHY 0460/42 Paper 4 Alternative to Coursework May/June 2014 1 hour 30 minutes Candidates answer on the Question Paper. Additional Materials: Calculator Ruler READ THESE INSTRUCTIONS FIRST Write your Centre number, candidate number and name in the spaces provided. Write in dark blue or black pen. You may use an HB pencil for any diagrams or graphs. Do not use staples, paper clips, glue or correction fluid. DO NOT WRITE IN ANY BARCODES. Answer all questions. The Insert contains Photographs A, B and C, Figs 1 and 2 and Table 1 for Question 1, and Fig. 6 and Table 5 for Question 2. The Insert is not required by the Examiner. Sketch maps and diagrams should be drawn whenever they serve to illustrate an answer. At the end of the examination, fasten all your work securely together. The number of marks is given in brackets [ ] at the end of each question or part question. The syllabus is approved for use in England, Wales and Northern Ireland as a Cambridge International Level 1/Level 2 Certificate.
Question paper, page 2
2 0460/42/M/J/14 © UCLES 2014 1 Three students wanted to investigate the effects of two different types of woodland on temperature and the amount of sunlight in the wooded areas. Photographs A and B (Insert) show the two types of woodland. They decided to investigate the following hypotheses: Hypothesis 1: Temperature will be higher in the area of deciduous woodland than in the area of coniferous woodland. Hypothesis 2: The amount of light at ground level will differ in the two areas of woodland. (a) To begin their investigation the students drew two transect lines (X and Y) on a map of the area. These are shown on Fig. 1 (Insert). (i) Suggest three pieces of advice their teacher gave them to keep them safe whilst carrying out fieldwork in this area. 1 … … 2 … … 3 … …[3] (ii) Using Fig. 1, describe two similarities and two differences between transects X and Y. Similarities 1 … … 2 … … Differences 1 … … 2 … …[4]
Question paper, page 3
3 0460/42/M/J/14 © UCLES 2014 [Turn over (b) The three students decided to take measurements of temperature and light every 25 metres along each transect line. They worked along transect X in the morning and along transect Y in the afternoon. (i) What is the name of the sampling method they used? Circle your choice below. random stratified systematic [1] (ii) Suggest why they took measurements every 25 metres. … … … …[2] (c) The results of the students’ measurements are shown in Table 1 (Insert). (i) To measure temperature they used the digital thermometer shown in Photograph C (Insert). Give two advantages of using a digital thermometer for this task. 1 … … 2 … …[2] (ii) To measure the amount of light at ground level the students made a measuring device to estimate the percentage of sky they could see. More sky means more light. Their measuring device is shown in Fig. 2 (Insert) along with instructions on how it was used. What percentage of sky is shown on Fig. 2? …% [2] (iii) Use Table 1 (Insert) to give the most common temperature recorded in the grassland area. … °C [1]
Question paper, page 4
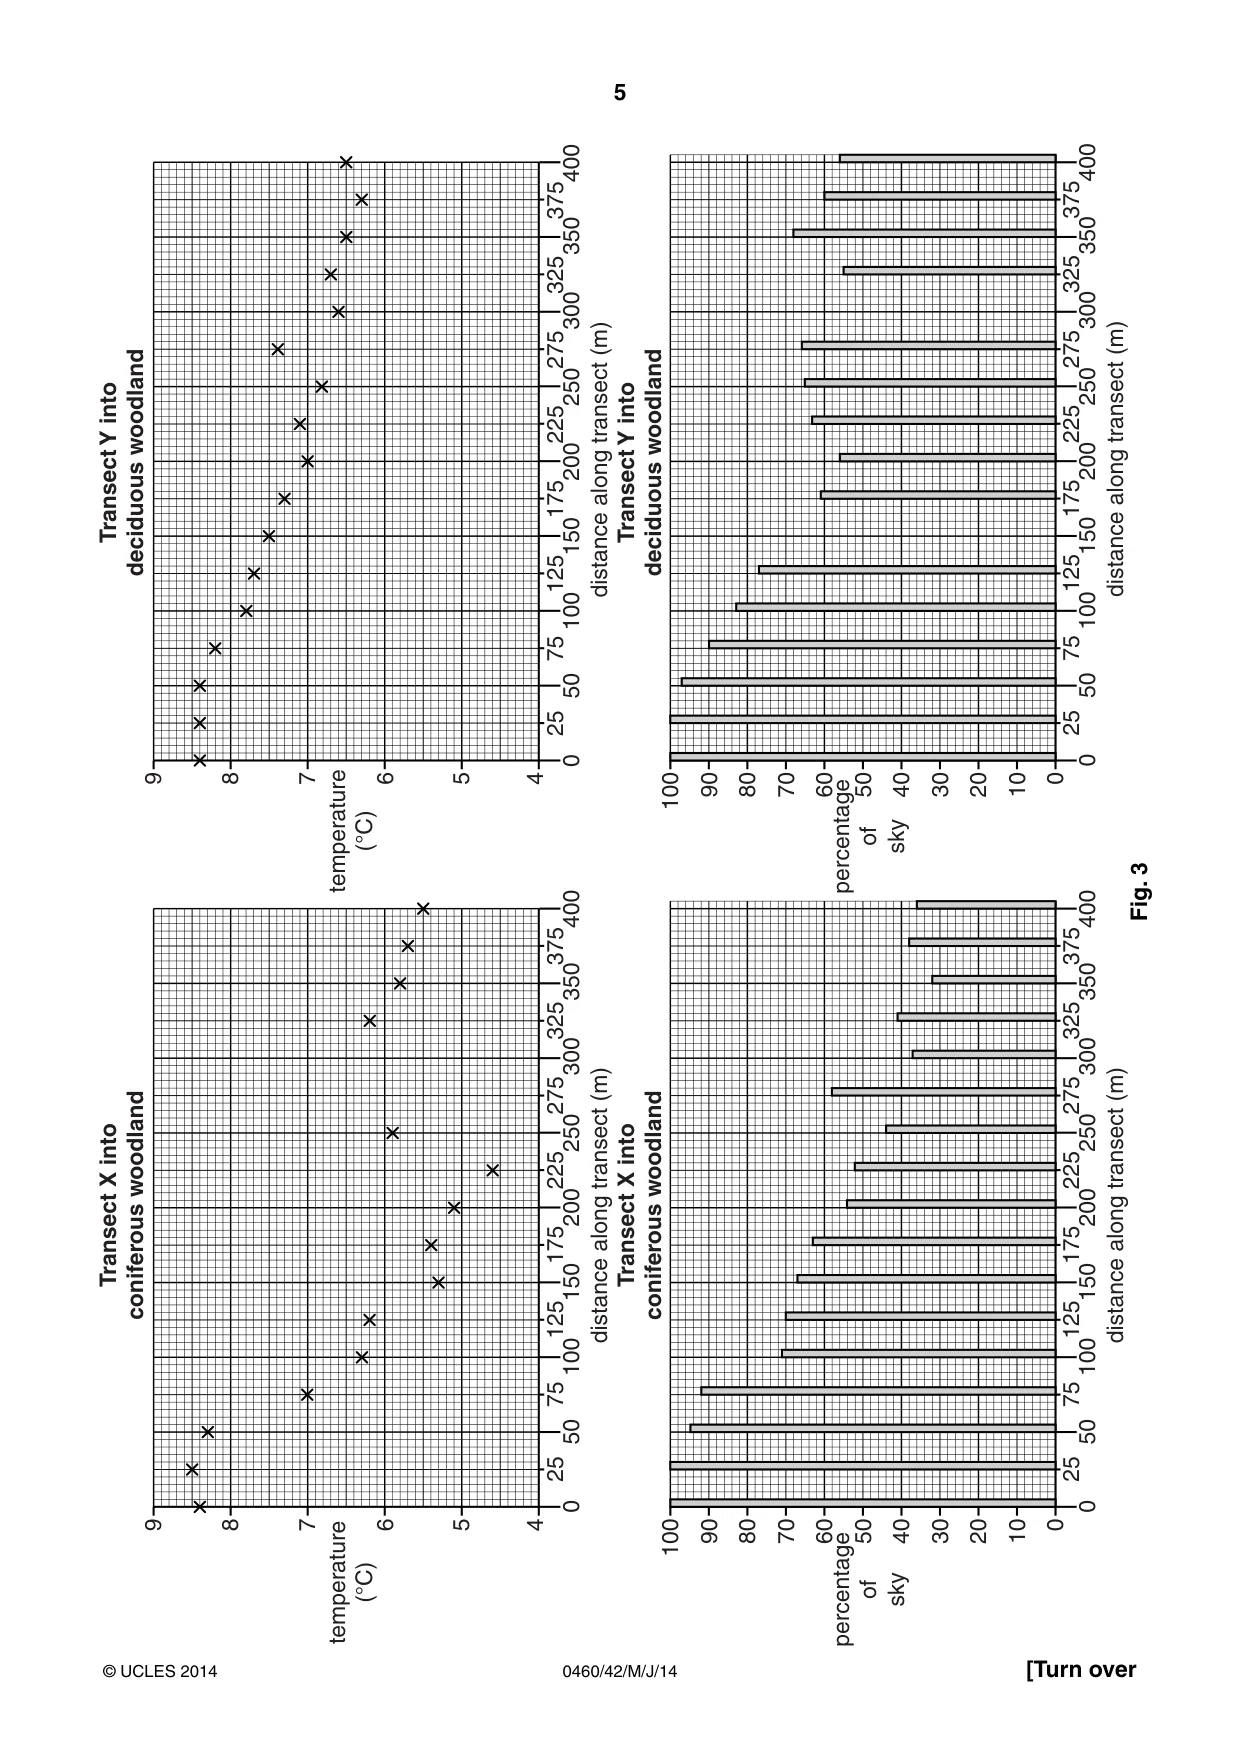
4 0460/42/M/J/14 © UCLES 2014 (iv) The students used their results in Table 1 (Insert) to plot the graphs in Fig. 3 opposite. Use the results shown in Table 1 to plot the temperatures at 275 m and 300 m along transect X. [2] (v) Use the results in Table 1 to plot the percentage of sky measured at 150 m and 300 m along transect Y. [2] (vi) How does the percentage of sky measured differ between the grassland and woodland in both transects? … …[1]
Question paper, page 5
5 0460/42/M/J/14 © UCLES 2014 [Turn over temperature (°C) temperature (°C) 0 10 20 30 40 50 60 70 80 90 100 0 25 50 75 100125150175200225250 375400 300 350 275 325 4 5 6 0 25 50 75 100125150175200225 distance along transect (m) distance along transect (m) Transect X into coniferous woodland Transect Y into deciduous woodland Transect X into coniferous woodland Transect Y into deciduous woodland 250 375400 300 350 275 325 0 25 50 75 100125150175200225 distance along transect (m) 250 375400 300 350 275 325 7 8 9 4 5 6 7 8 9 0 10 20 30 40 50 60 70 80 90 100 0 25 50 75 100125150175200225 distance along transect (m) 250 375400 300 350 275 325 percentage of sky percentage of sky Fig. 3
Question paper, page 6
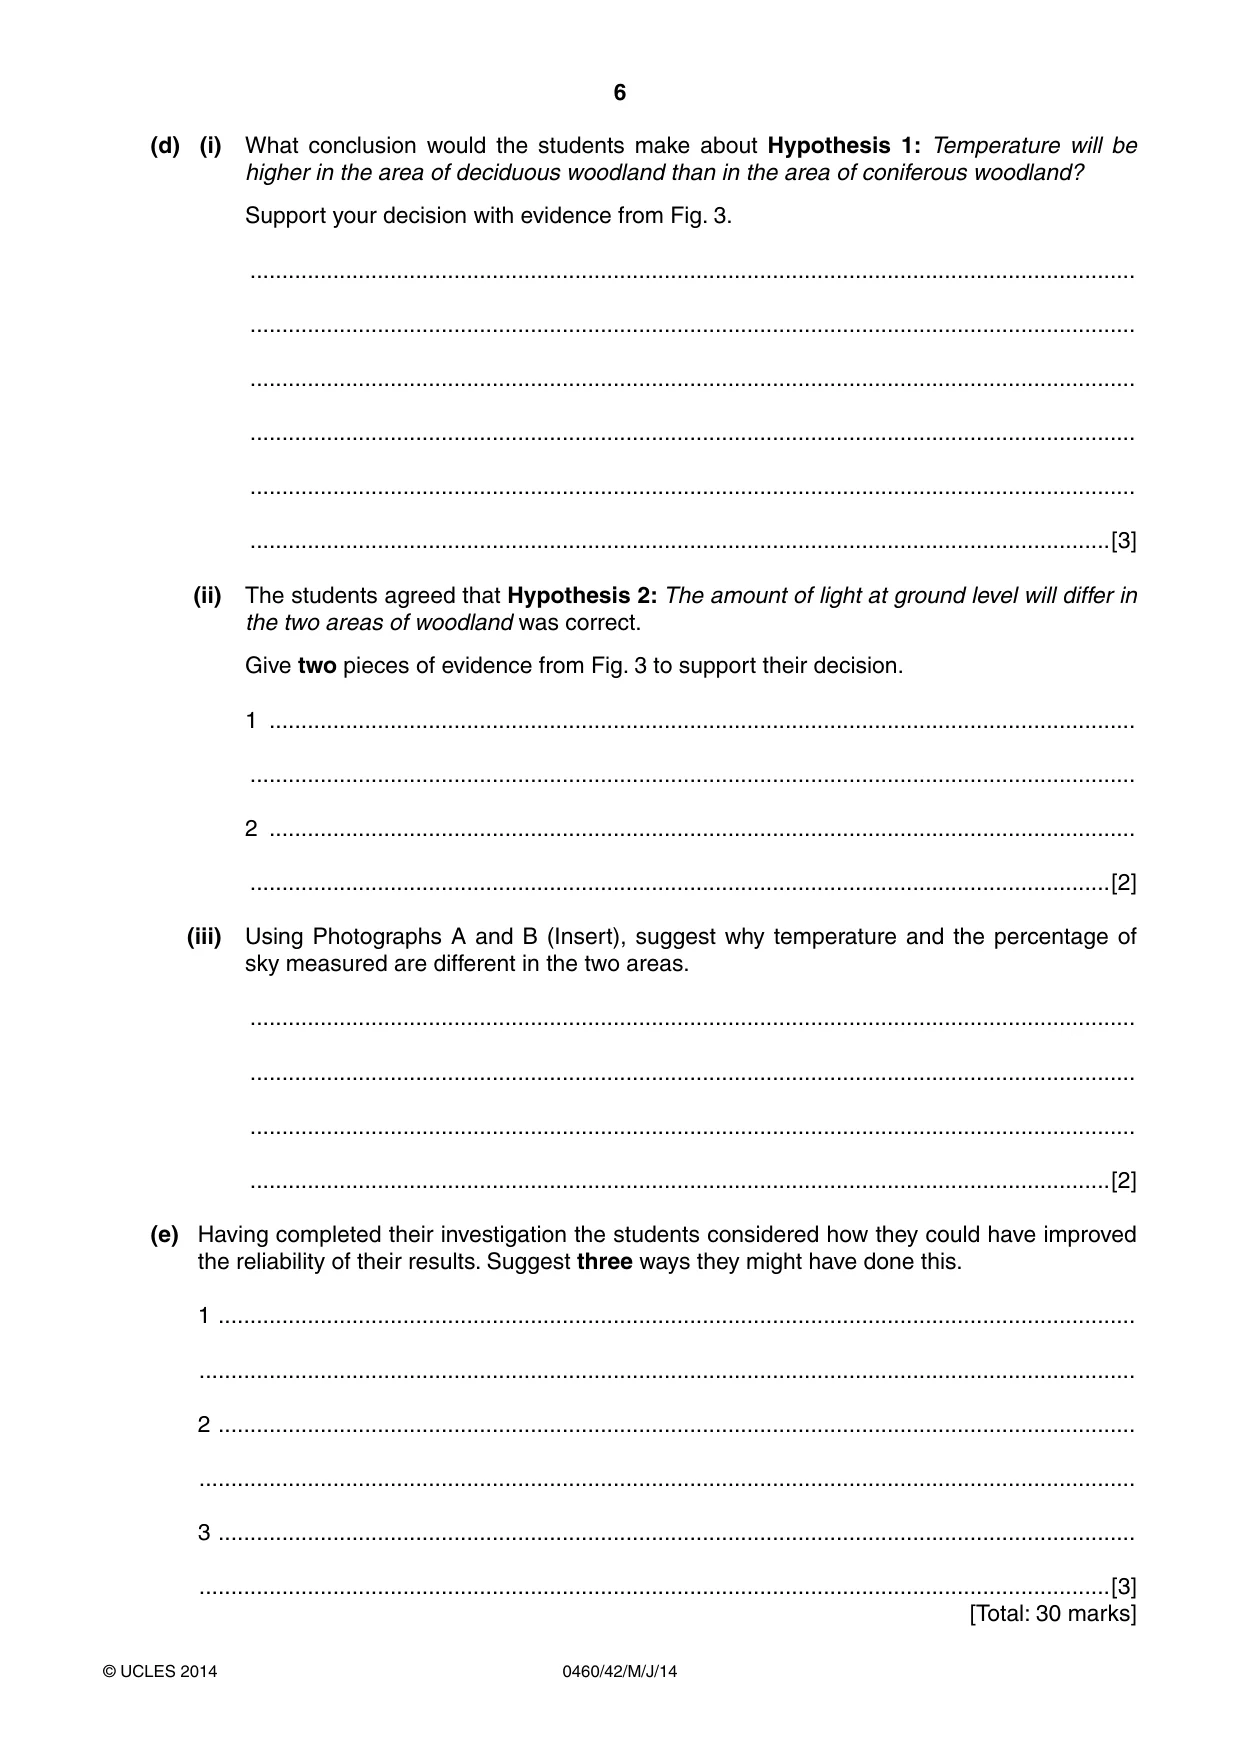
6 0460/42/M/J/14 © UCLES 2014 (d) (i) What conclusion would the students make about Hypothesis 1: Temperature will be higher in the area of deciduous woodland than in the area of coniferous woodland? Support your decision with evidence from Fig. 3. … … … … … …[3] (ii) The students agreed that Hypothesis 2: The amount of light at ground level will differ in the two areas of woodland was correct. Give two pieces of evidence from Fig. 3 to support their decision. 1 … … 2 … …[2] (iii) Using Photographs A and B (Insert), suggest why temperature and the percentage of sky measured are different in the two areas. … … … …[2] (e) Having completed their investigation the students considered how they could have improved the reliability of their results. Suggest three ways they might have done this. 1 … … 2 … … 3 … …[3] [Total: 30 marks]
Question paper, page 7
7 0460/42/M/J/14 © UCLES 2014 [Turn over TURN PAGE FOR QUESTION 2
Question paper, page 8
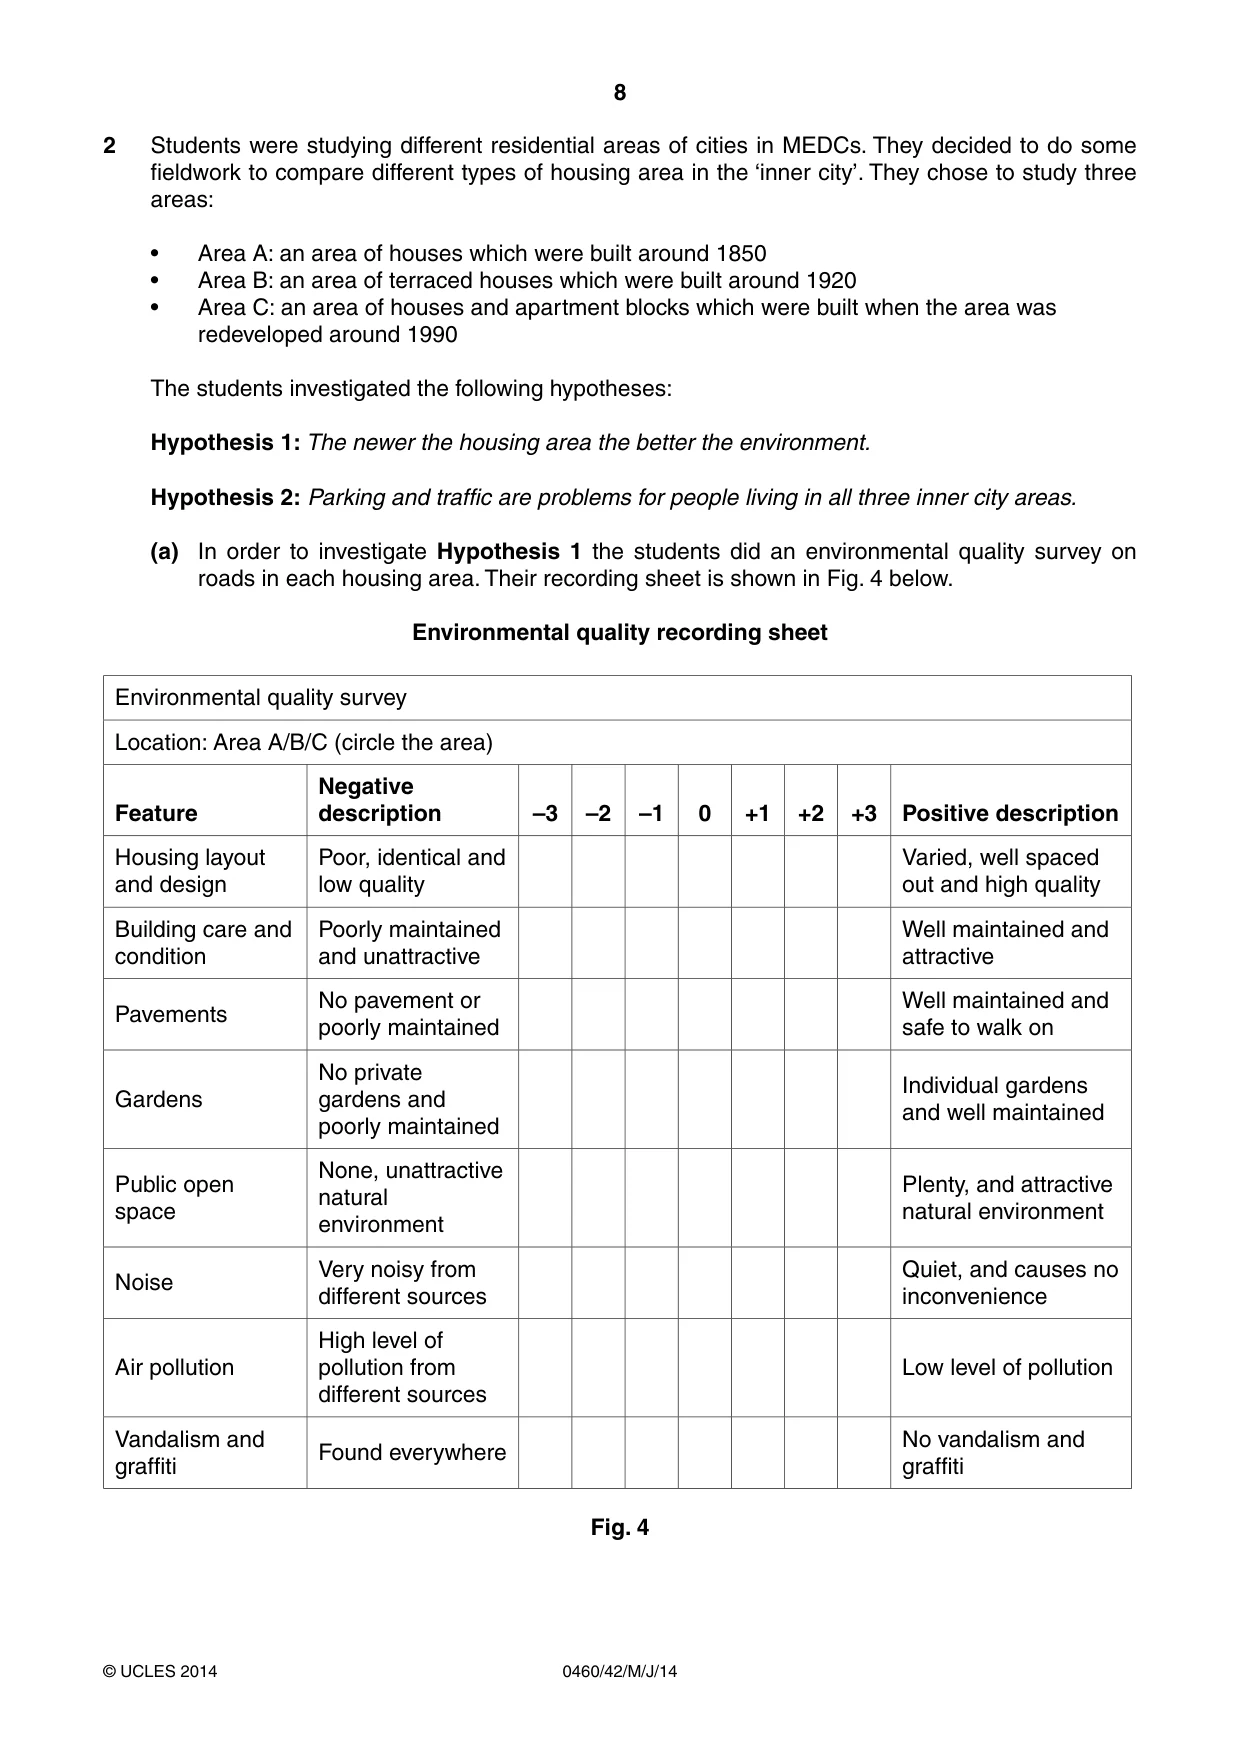
8 0460/42/M/J/14 © UCLES 2014 2 Students were studying different residential areas of cities in MEDCs. They decided to do some fieldwork to compare different types of housing area in the ‘inner city’. They chose to study three areas: • Area A: an area of houses which were built around 1850 • Area B: an area of terraced houses which were built around 1920 • Area C: an area of houses and apartment blocks which were built when the area was redeveloped around 1990 The students investigated the following hypotheses: Hypothesis 1: The newer the housing area the better the environment. Hypothesis 2: Parking and traffic are problems for people living in all three inner city areas. (a) In order to investigate Hypothesis 1 the students did an environmental quality survey on roads in each housing area. Their recording sheet is shown in Fig. 4 below. Environmental quality recording sheet Environmental quality survey Location: Area A/B/C (circle the area) Feature Negative description –3 –2 –1 0 +1 +2 +3 Positive description Housing layout and design Poor, identical and low quality Varied, well spaced out and high quality Building care and condition Poorly maintained and unattractive Well maintained and attractive Pavements No pavement or poorly maintained Well maintained and safe to walk on Gardens No private gardens and poorly maintained Individual gardens and well maintained Public open space None, unattractive natural environment Plenty, and attractive natural environment Noise Very noisy from different sources Quiet, and causes no inconvenience Air pollution High level of pollution from different sources Low level of pollution Vandalism and graffiti Found everywhere No vandalism and graffiti Fig. 4
Question paper, page 9
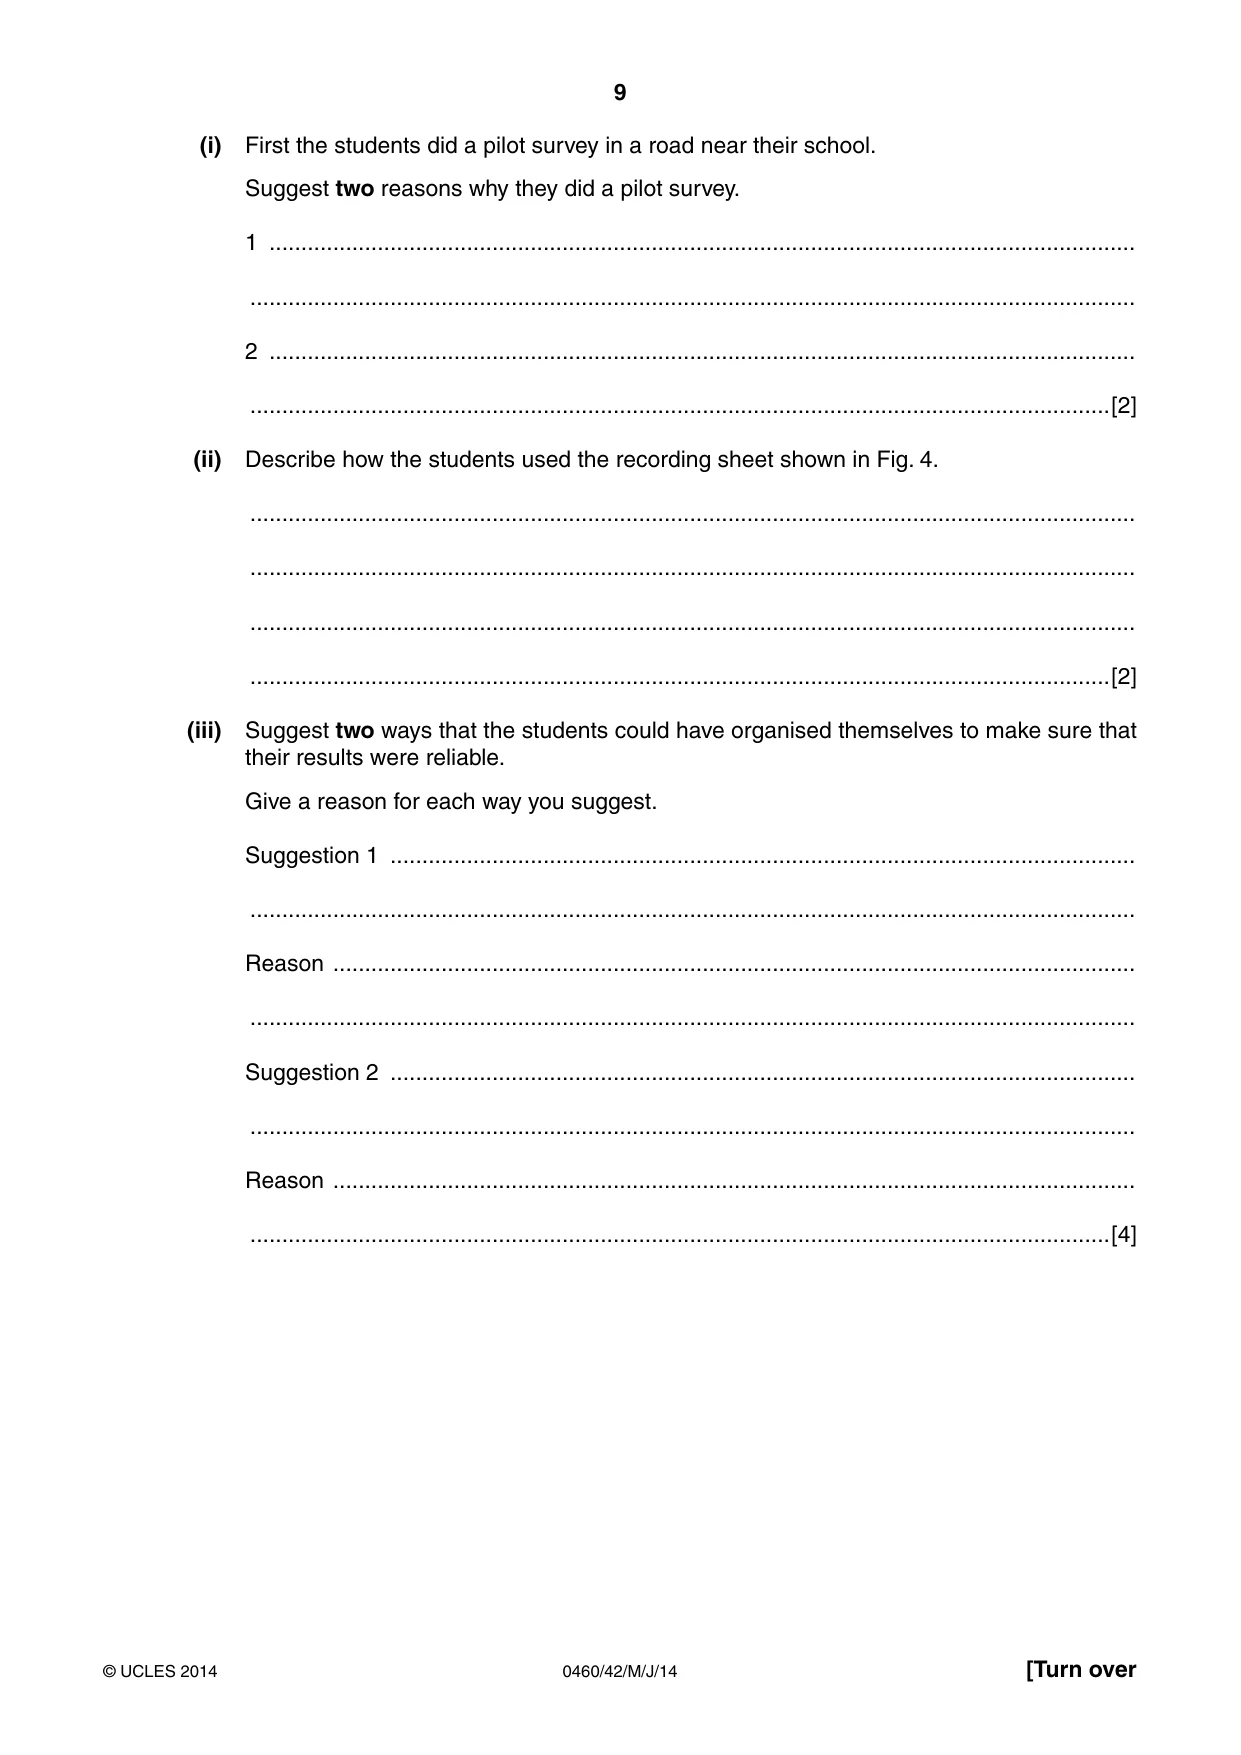
9 0460/42/M/J/14 © UCLES 2014 [Turn over (i) First the students did a pilot survey in a road near their school. Suggest two reasons why they did a pilot survey. 1 … … 2 … …[2] (ii) Describe how the students used the recording sheet shown in Fig. 4. … … … …[2] (iii) Suggest two ways that the students could have organised themselves to make sure that their results were reliable. Give a reason for each way you suggest. Suggestion 1 … … Reason … … Suggestion 2 … … Reason … …[4]
Question paper, page 10
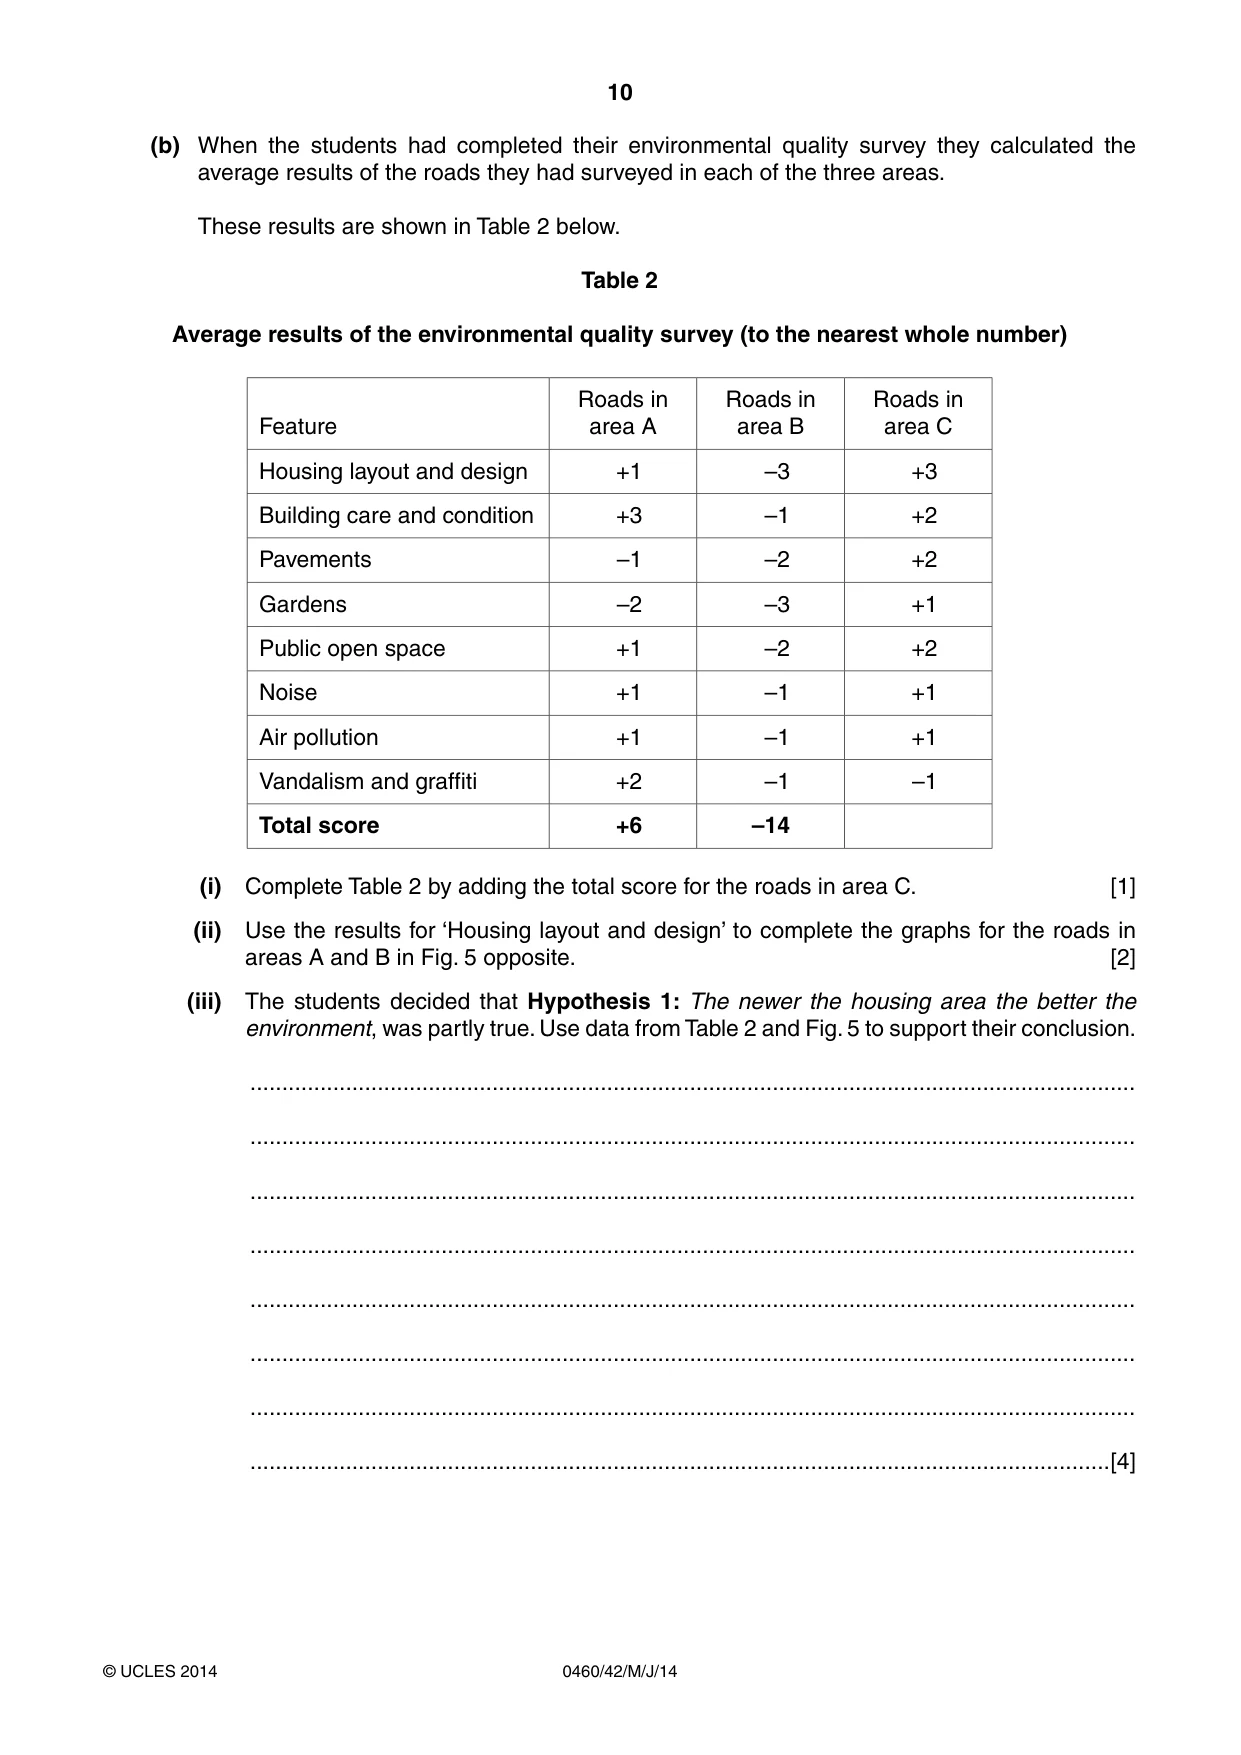
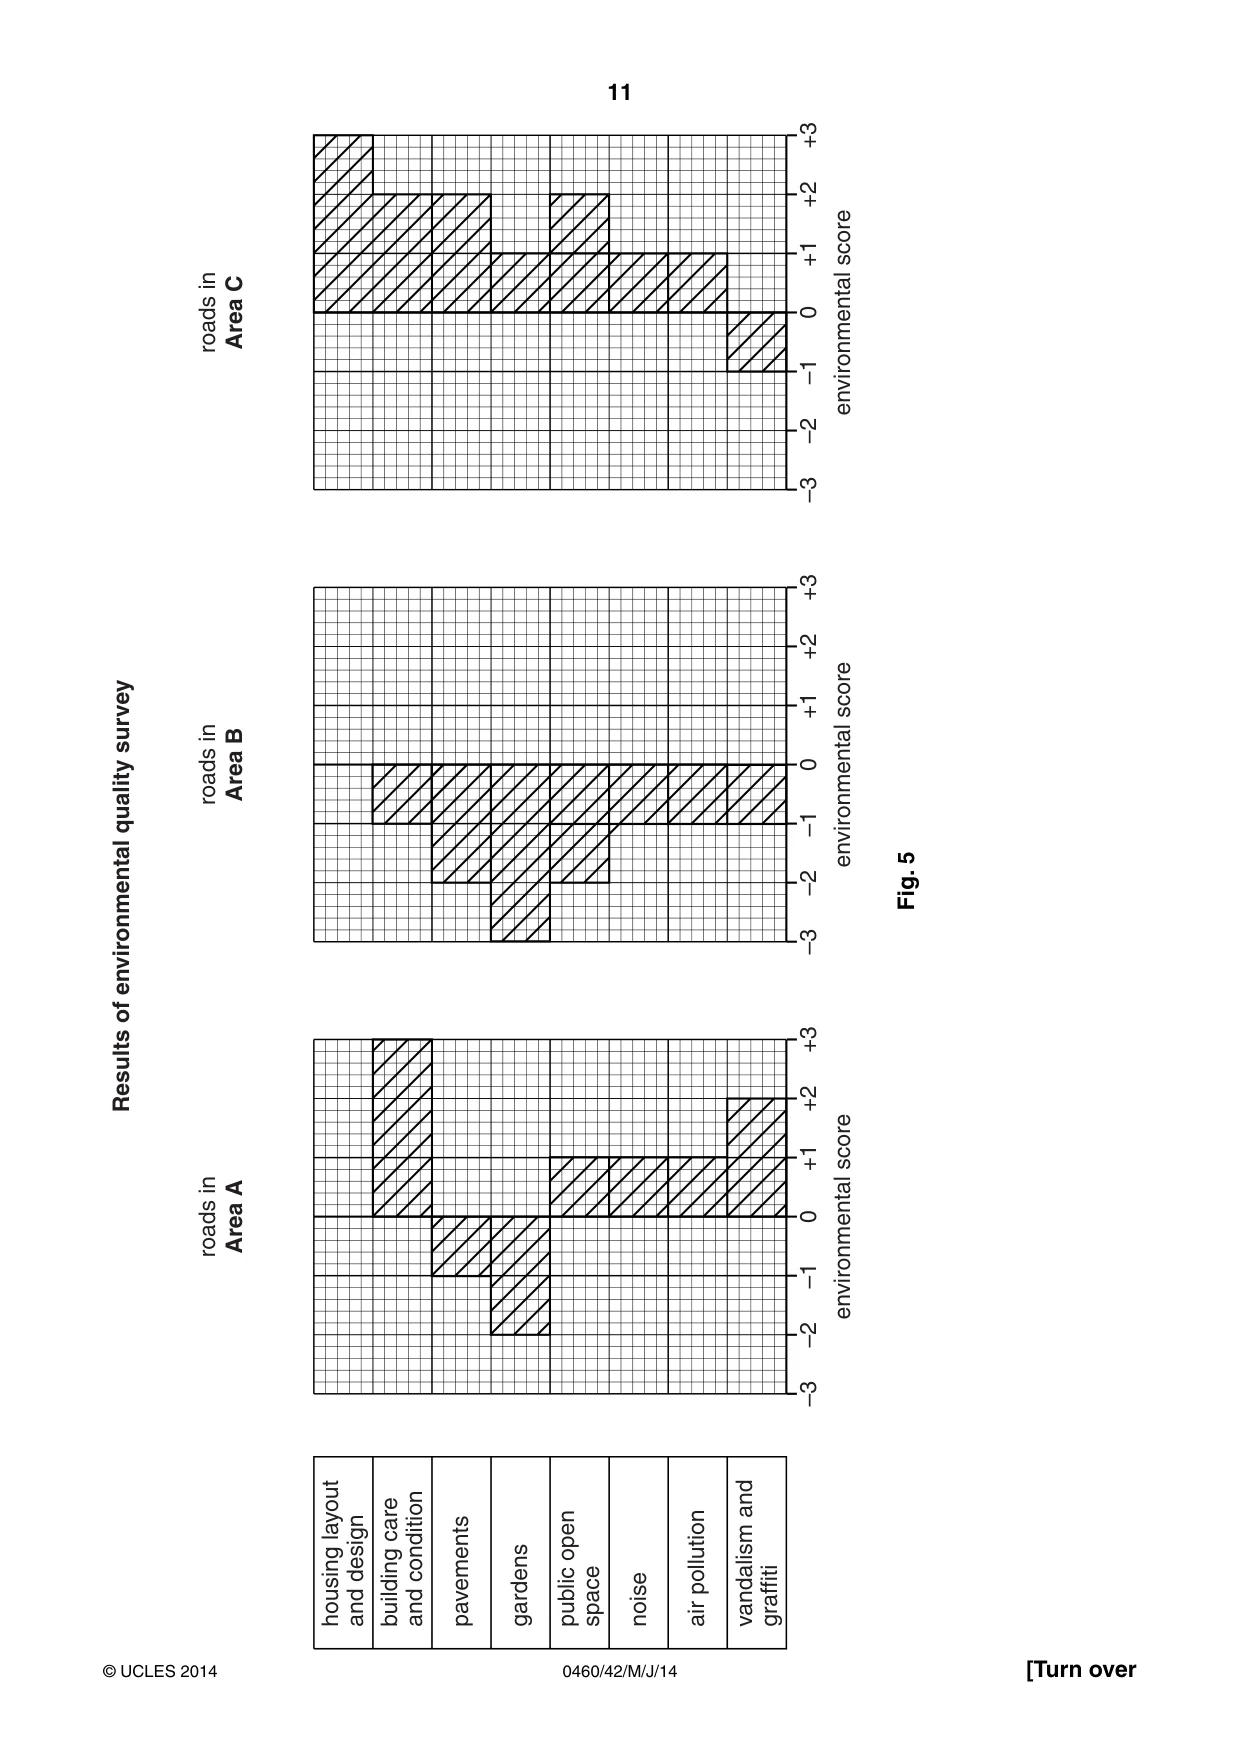
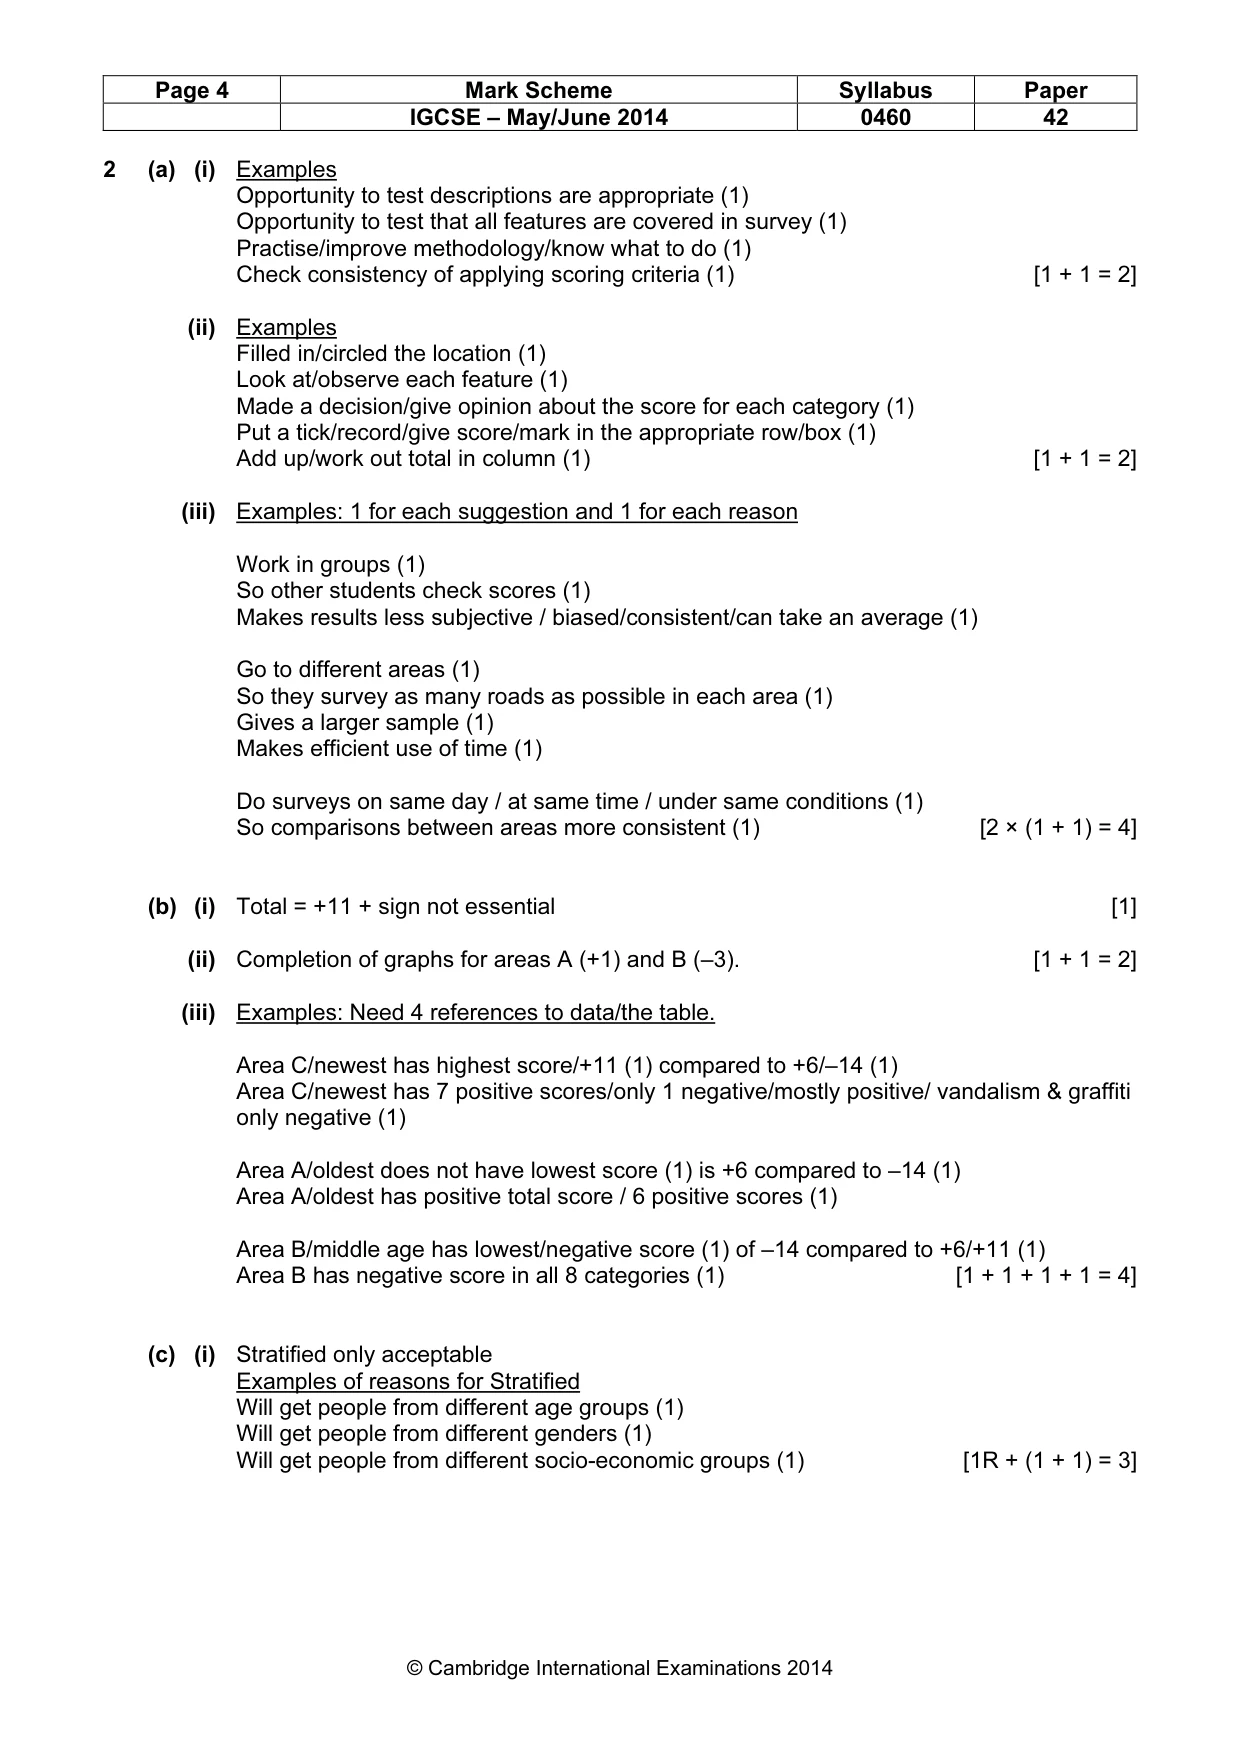
10 0460/42/M/J/14 © UCLES 2014 (b) When the students had completed their environmental quality survey they calculated the average results of the roads they had surveyed in each of the three areas. These results are shown in Table 2 below. Table 2 Average results of the environmental quality survey (to the nearest whole number) Feature Roads in area A Roads in area B Roads in area C Housing layout and design +1 –3 +3 Building care and condition +3 –1 +2 Pavements –1 –2 +2 Gardens –2 –3 +1 Public open space +1 –2 +2 Noise +1 –1 +1 Air pollution +1 –1 +1 Vandalism and graffiti +2 –1 –1 Total score +6 –14 (i) Complete Table 2 by adding the total score for the roads in area C. [1] (ii) Use the results for ‘Housing layout and design’ to complete the graphs for the roads in areas A and B in Fig. 5 opposite. [2] (iii) The students decided that Hypothesis 1: The newer the housing area the better the environment, was partly true. Use data from Table 2 and Fig. 5 to support their conclusion. … … … … … … … …[4]
Question paper, page 11
11 0460/42/M/J/14 © UCLES 2014 [Turn over 0 environmental score gardens pavements noise air pollution building care and condition vandalism and graffiti housing layout and design public open space –1 –2 –3 +3 +2 +1 0 environmental score –1 –2 –3 +3 +2 +1 0 environmental score roads in Area A roads in Area B Results of environmental quality survey roads in Area C –1 –2 –3 +3 +2 +1 Fig. 5
Question paper, page 12
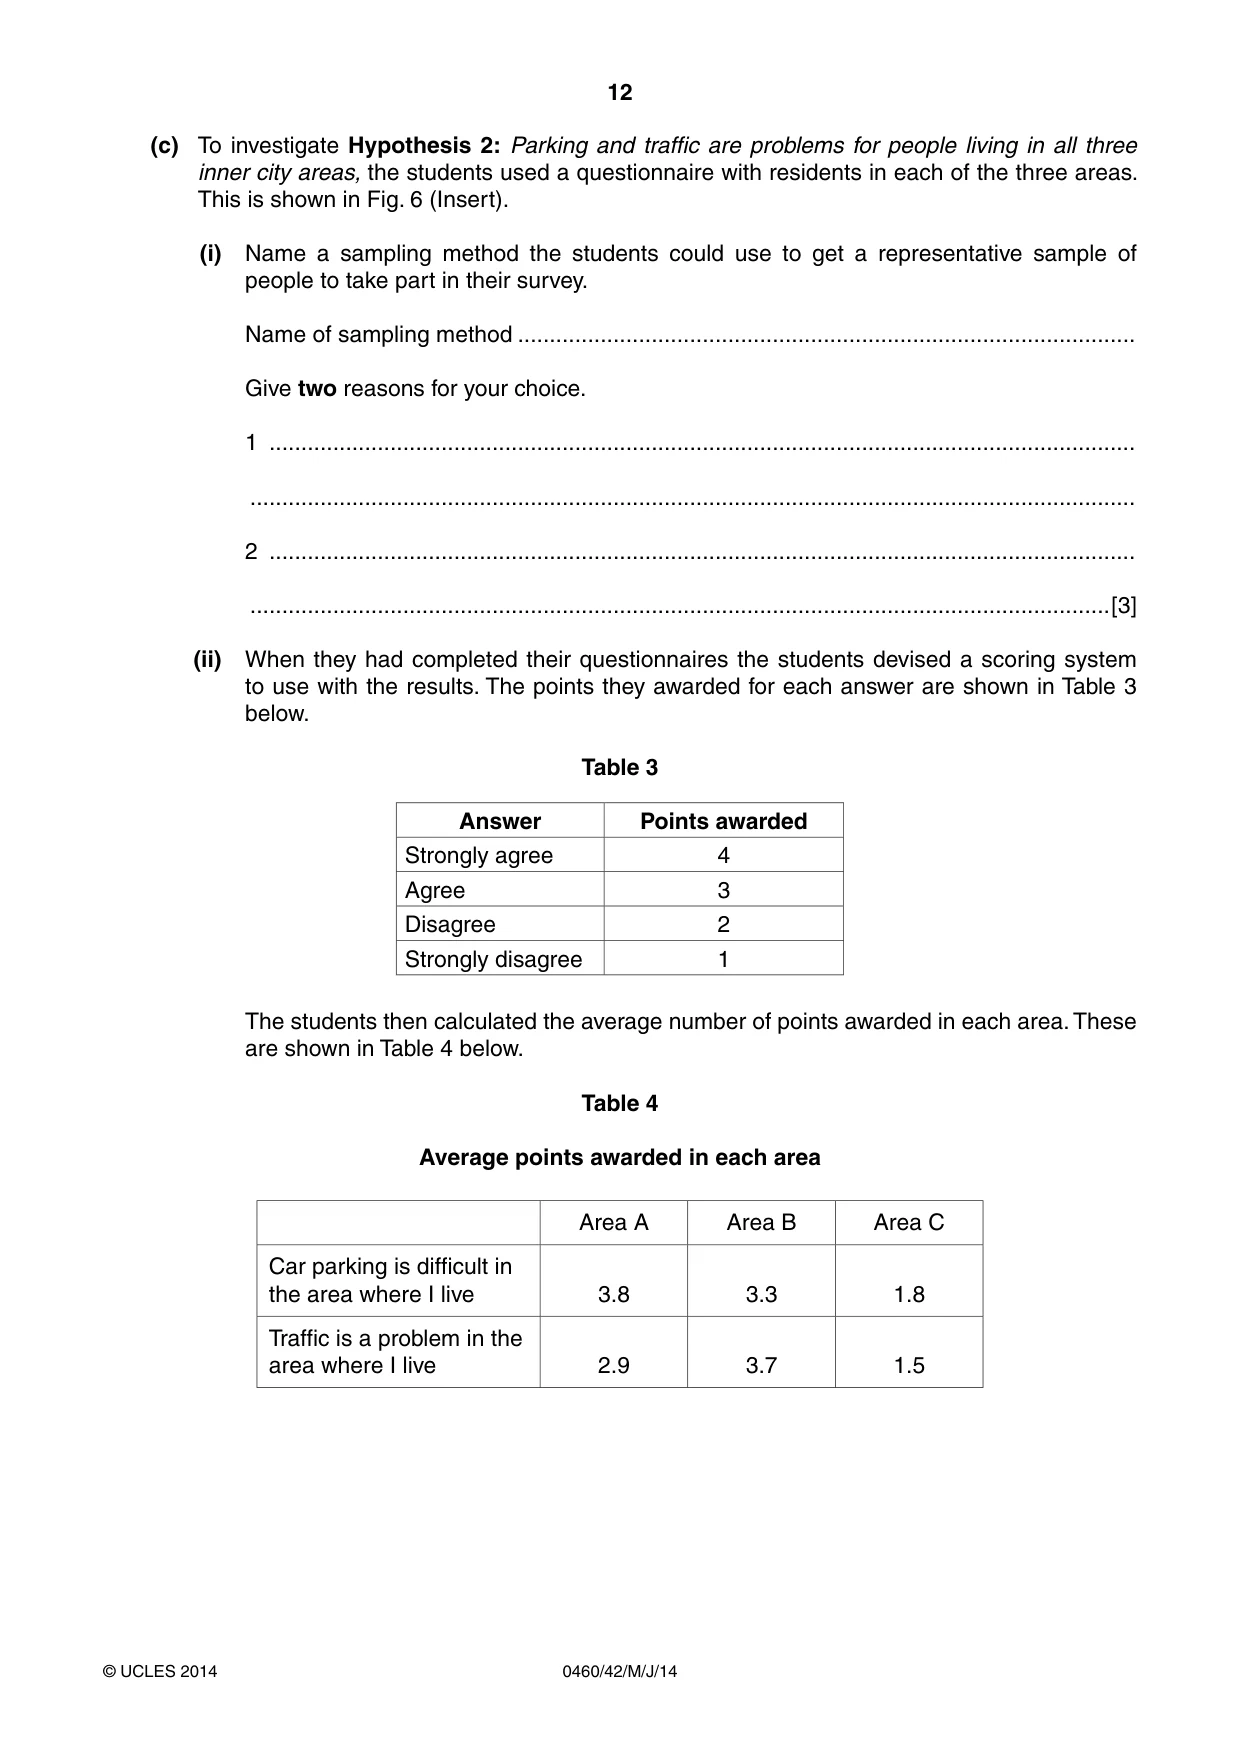
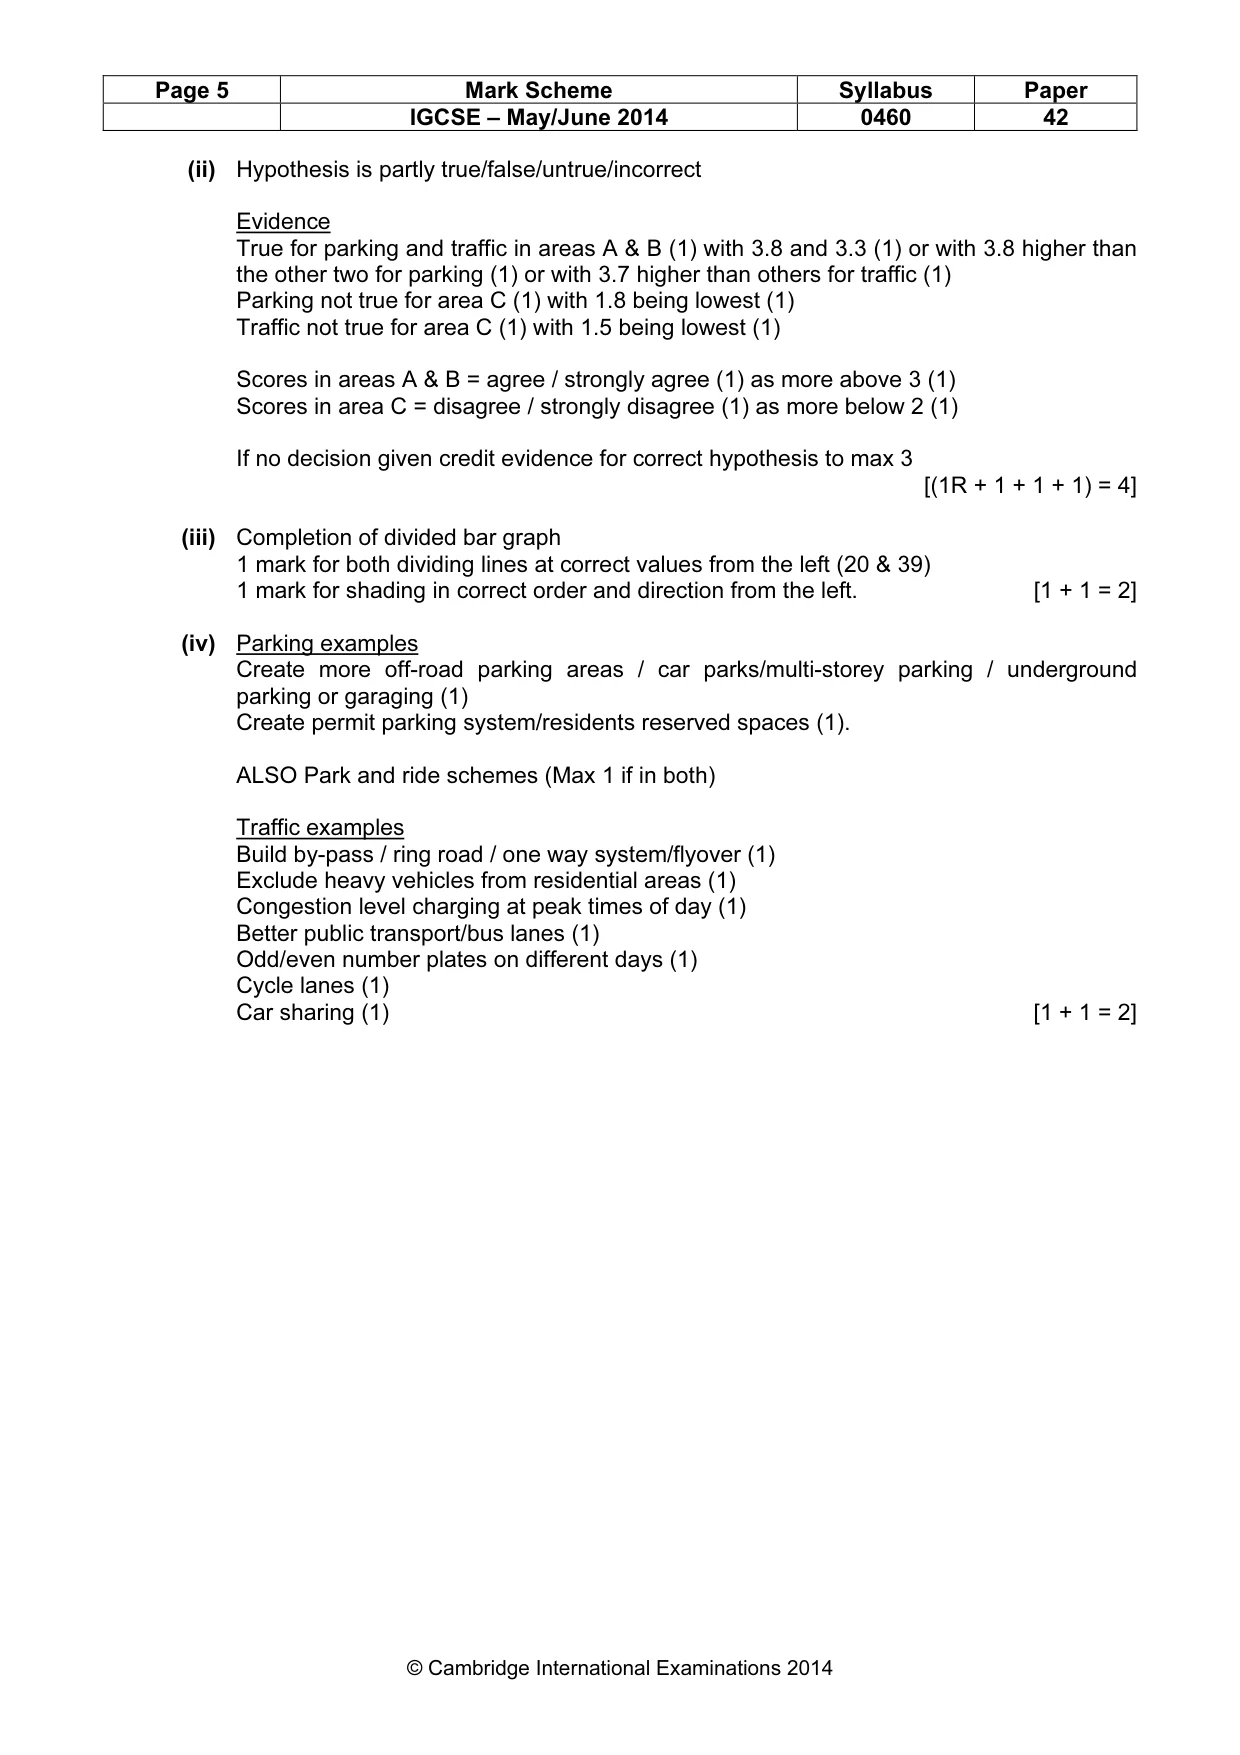
12 0460/42/M/J/14 © UCLES 2014 (c) To investigate Hypothesis 2: Parking and traffic are problems for people living in all three inner city areas, the students used a questionnaire with residents in each of the three areas. This is shown in Fig. 6 (Insert). (i) Name a sampling method the students could use to get a representative sample of people to take part in their survey. Name of sampling method … Give two reasons for your choice. 1 … … 2 … …[3] (ii) When they had completed their questionnaires the students devised a scoring system to use with the results. The points they awarded for each answer are shown in Table 3 below. Table 3 Answer Points awarded Strongly agree 4 Agree 3 Disagree 2 Strongly disagree 1 The students then calculated the average number of points awarded in each area. These are shown in Table 4 below. Table 4 Average points awarded in each area Area A Area B Area C Car parking is difficult in the area where I live 3.8 3.3 1.8 Traffic is a problem in the area where I live 2.9 3.7 1.5
Question paper, page 13
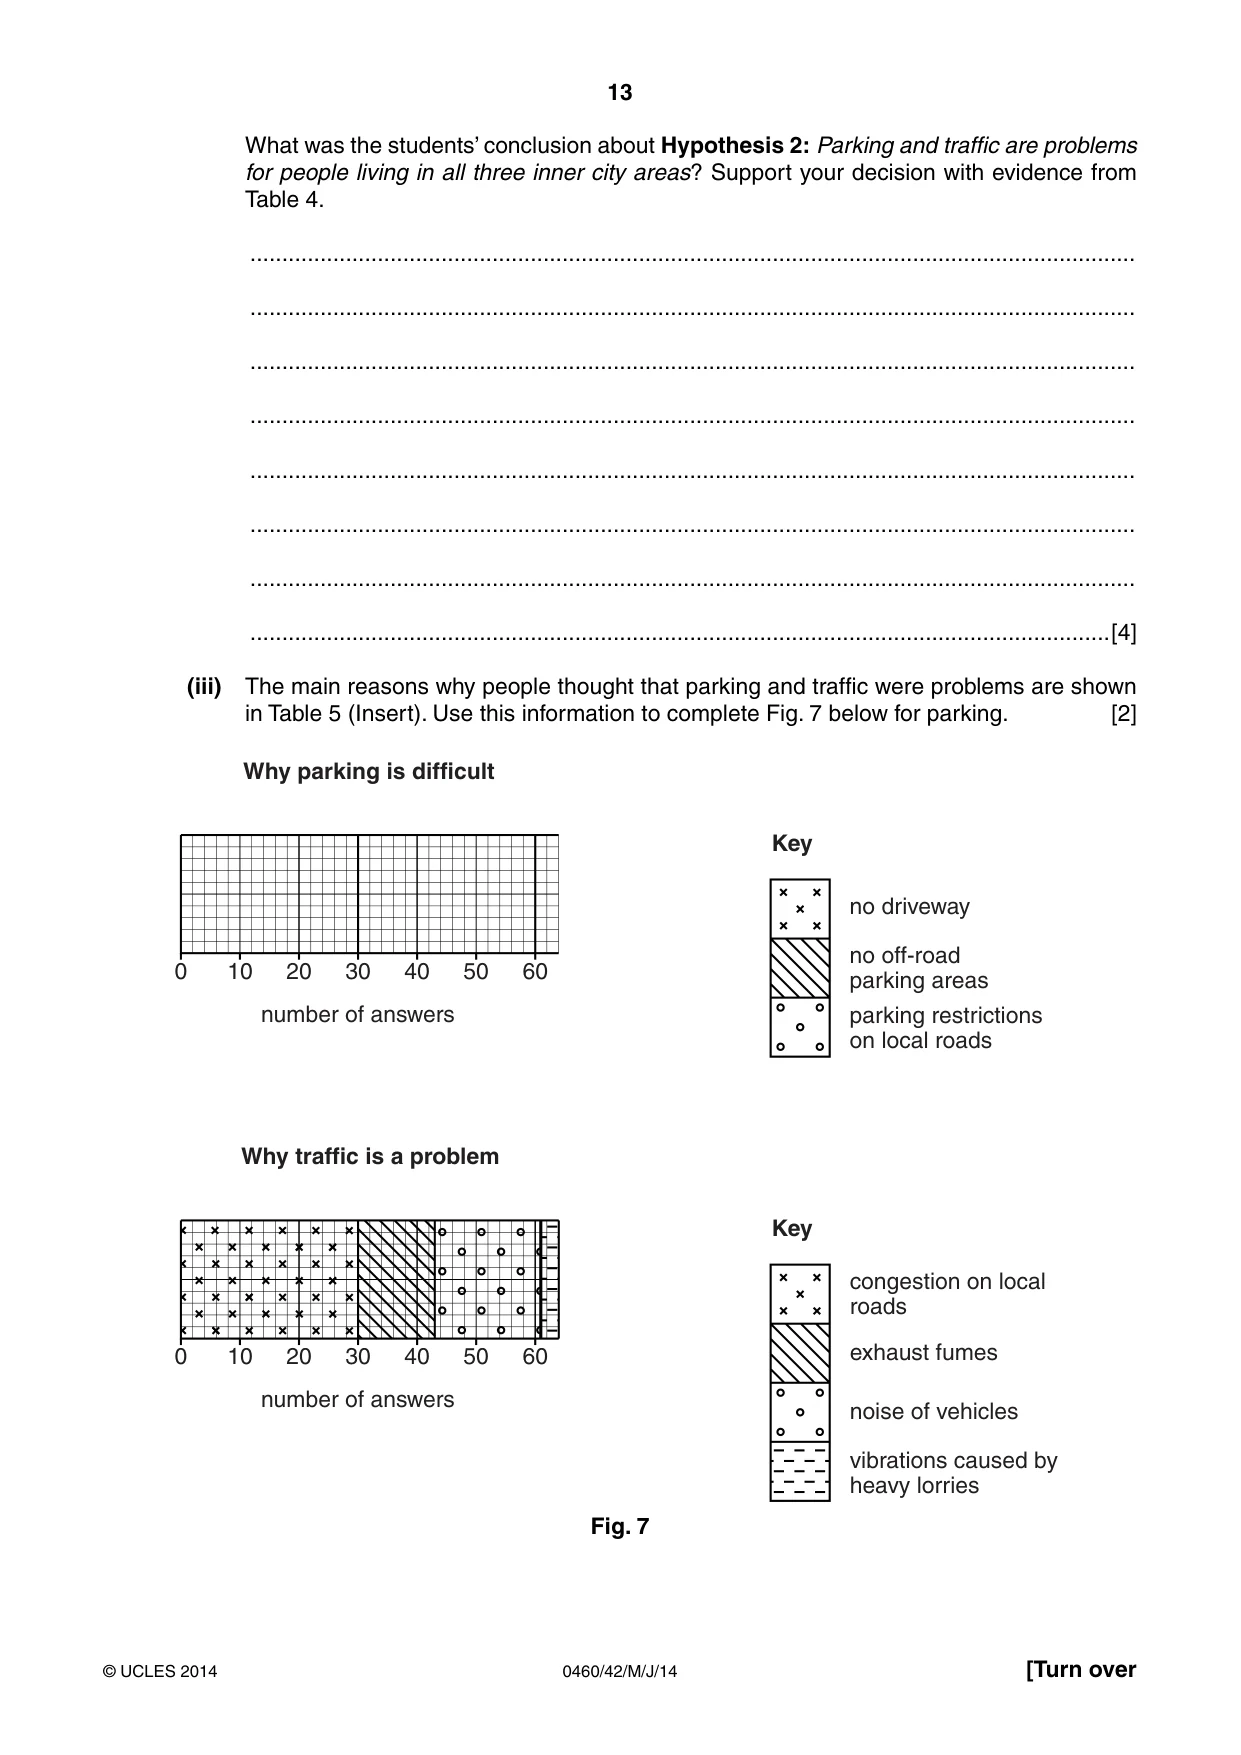
13 0460/42/M/J/14 © UCLES 2014 [Turn over What was the students’ conclusion about Hypothesis 2: Parking and traffic are problems for people living in all three inner city areas? Support your decision with evidence from Table 4. … … … … … … … …[4] (iii) The main reasons why people thought that parking and traffic were problems are shown in Table 5 (Insert). Use this information to complete Fig. 7 below for parking. [2] number of answers Why parking is difficult Why traffic is a problem no driveway no off-road parking areas parking restrictions on local roads Key 0 10 20 30 number of answers 40 60 50 congestion on local roads exhaust fumes noise of vehicles vibrations caused by heavy lorries Key 0 10 20 30 40 60 50 Fig. 7
Question paper, page 14
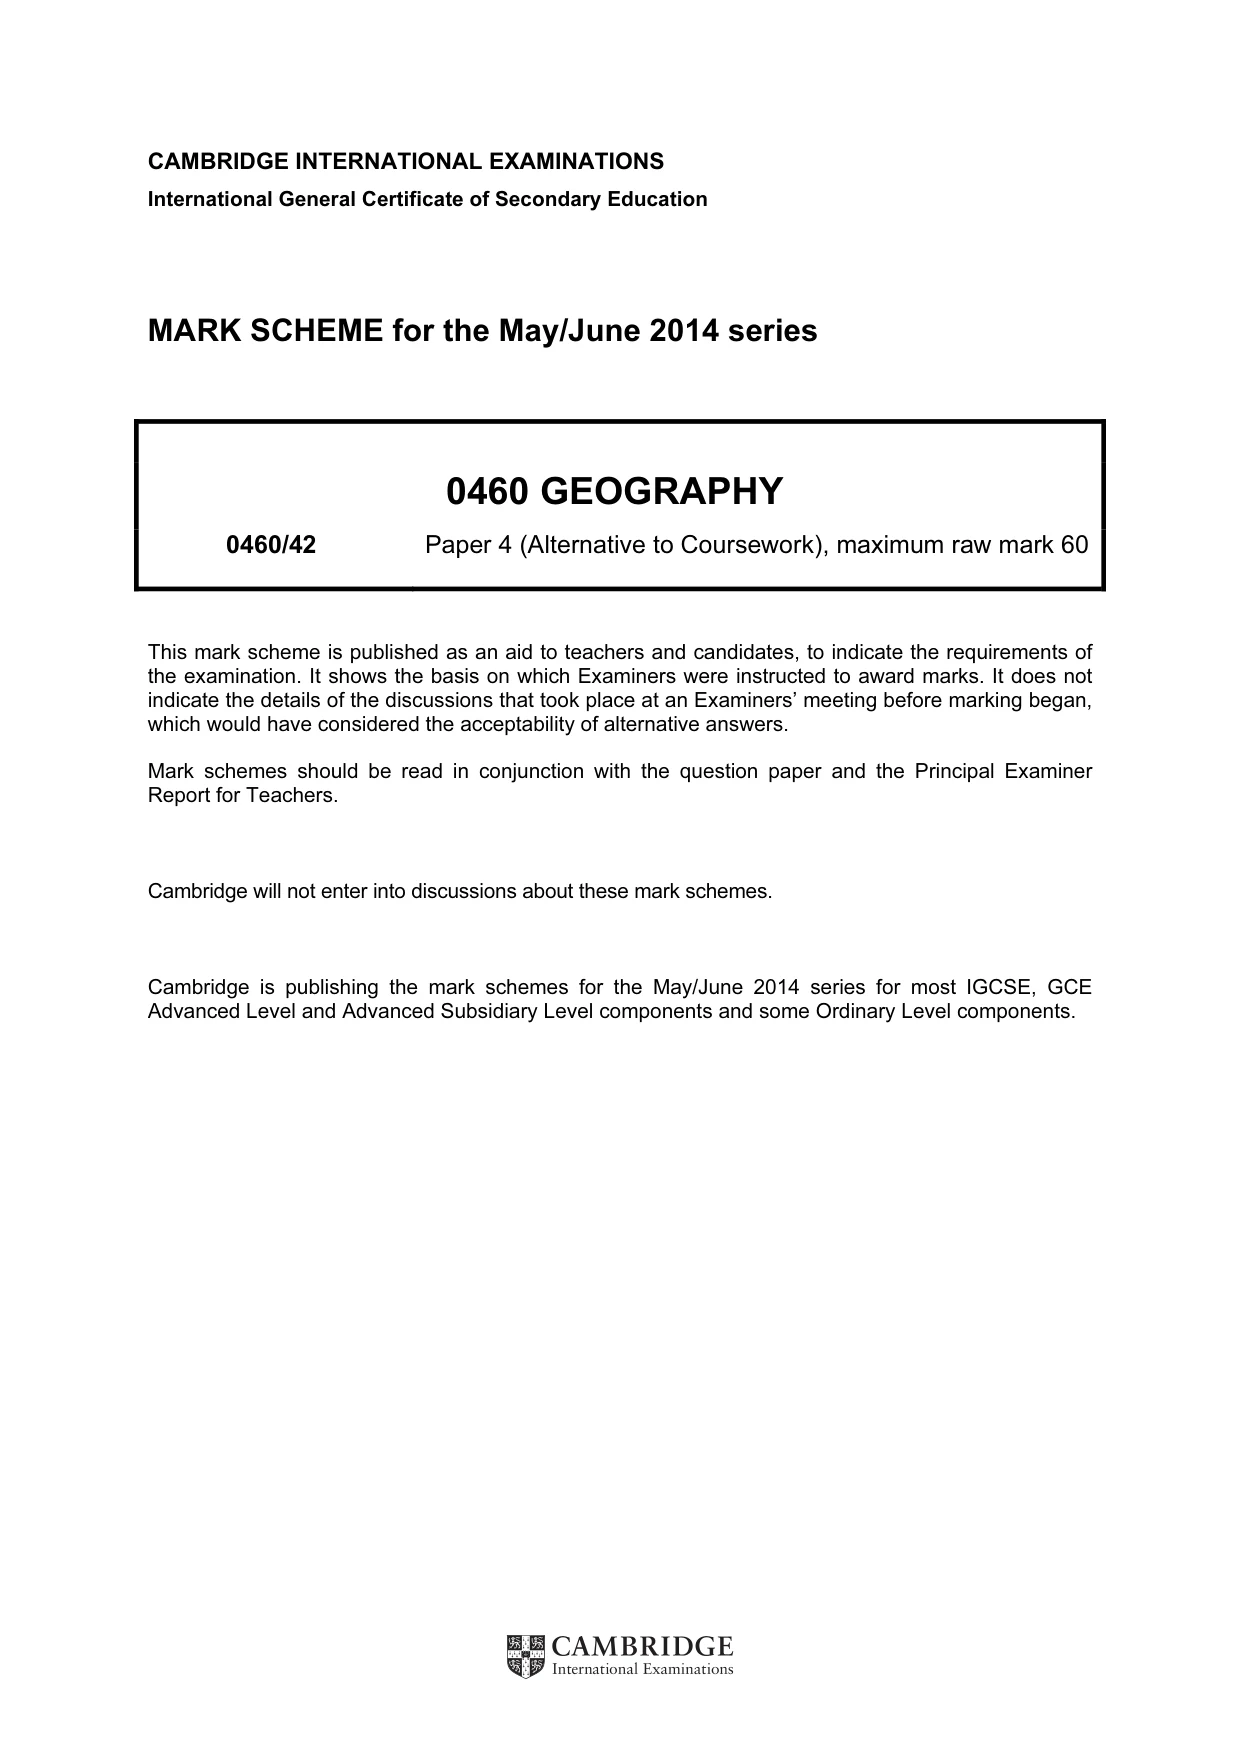
14 0460/42/M/J/14 © UCLES 2014 (iv) Suggest a different way to improve each of the following in inner city areas. Parking … … Traffic problems … …[2] (d) To extend their fieldwork the students wanted to investigate another possible difference between the three housing areas. Suggest an investigation and describe a method you would use. Investigation … … Fieldwork method … … … … … …[4] [Total: 30 marks]
Question paper, page 15
15 0460/42/M/J/14 © UCLES 2014 BLANK PAGE
Question paper, page 16
16 0460/42/M/J/14 © UCLES 2014 Copyright Acknowledgements: Question 1 Photograph A Question 1 Photograph B © http://www.offwell.free-online.co.uk/maps_website/coniferouswoodland.htm © http://www.countrysideinfo.co.uk/maps_website/wetwland.htm Permission to reproduce items where third-party owned material protected by copyright is included has been sought and cleared where possible. Every reasonable effort has been made by the publisher (UCLES) to trace copyright holders, but if any items requiring clearance have unwittingly been included, the publisher will be pleased to make amends at the earliest possible opportunity. Cambridge International Examinations is part of the Cambridge Assessment Group. Cambridge Assessment is the brand name of University of Cambridge Local Examinations Syndicate (UCLES), which is itself a department of the University of Cambridge. BLANK PAGE
Mark scheme, page 1
CAMBRIDGE INTERNATIONAL EXAMINATIONS International General Certificate of Secondary Education MARK SCHEME for the May/June 2014 series 0460 GEOGRAPHY 0460/42 Paper 4 (Alternative to Coursework), maximum raw mark 60 This mark scheme is published as an aid to teachers and candidates, to indicate the requirements of the examination. It shows the basis on which Examiners were instructed to award marks. It does not indicate the details of the discussions that took place at an Examiners’ meeting before marking began, which would have considered the acceptability of alternative answers. Mark schemes should be read in conjunction with the question paper and the Principal Examiner Report for Teachers. Cambridge will not enter into discussions about these mark schemes. Cambridge is publishing the mark schemes for the May/June 2014 series for most IGCSE, GCE Advanced Level and Advanced Subsidiary Level components and some Ordinary Level components.
Mark scheme, page 2
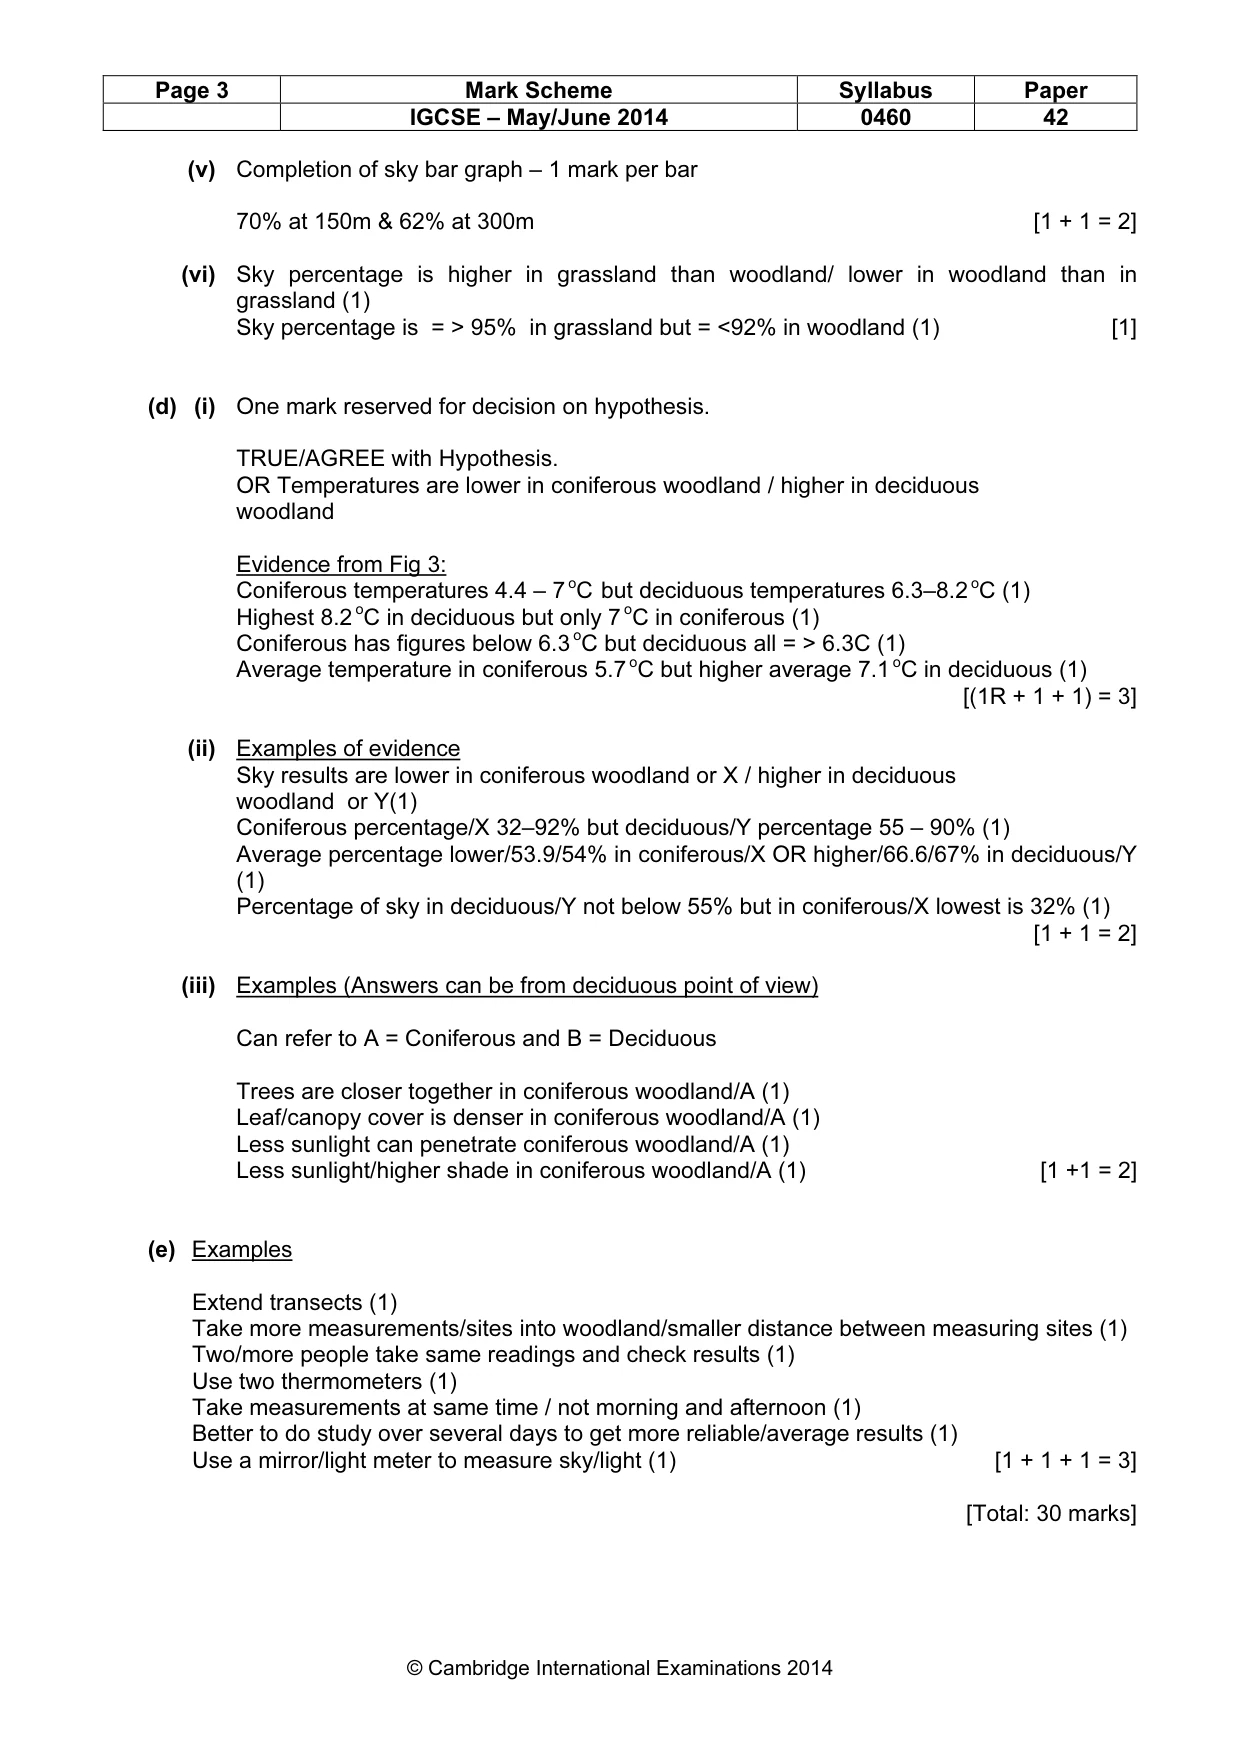
Page 2 Mark Scheme Syllabus Paper IGCSE – May/June 2014 0460 42 © Cambridge International Examinations 2014 1 (a) (i) Examples Keep together/stay as a group (1) Don’t get lost/stick to paths/stay in designated area (1) Use a map/compass (1) Wear boots/ appropriate clothes/suitable clothing (1) Don’t climb trees (1) Take a mobile phone (1) Stay away from wild animals (1) Use insect repellent/sunblock etc. (1) [1 + 1 + 1 = 3] (ii) Similarities: Same length/400 metres long (1) Start at same place/height/380 metres (1) Go from grassland into woodland/both start in grassland (1) Both downhill/sloping (1) Both straight (1) Both cross a land-use boundary (1) Differences: Go in different direction (1) Transect X is W-E/goes east, transect Y is S-N/goes north (1) Transect X is gentler (1) Transect X goes down to 321/339m (in range), Y goes down to 300m/Y goes to lower height (1) Transect X is in coniferous wood, transect Y is in deciduous wood (1) [2 + 2 = 4] (b) (i) Systematic [1] (ii) Examples To get an equal distribution of sites/ fair/consistent/no bias (1) To show how results change along transect (1) Gap between sites is not too big to miss change in results/get a good range (1) 25 metres is an easy length with a tape measure (1) If < 25 metres very time-consuming (1) By using 17 sites per transect can get a lot of data (1) [1 + 1 = 2] (c) (i) Examples Easy to read/use/less chance of error (1) Quick/saves time/ instant measurement (1) Accurate / precise/sensitive/ gives decimal point (1) [1 + 1 = 2] (ii) 35 – 37 % = 2 marks 32 – 34% or 38 – 40% = 1 mark [2] (iii) 8.4C [1] (iv) Completion of temperature line graph – 1 mark per plot 4.4 oC at 275m & 6.7 oC at 300m [1 + 1 = 2]
Mark scheme, page 3
Page 3 Mark Scheme Syllabus Paper IGCSE – May/June 2014 0460 42 © Cambridge International Examinations 2014 (v) Completion of sky bar graph – 1 mark per bar 70% at 150m & 62% at 300m [1 + 1 = 2] (vi) Sky percentage is higher in grassland than woodland/ lower in woodland than in grassland (1) Sky percentage is = > 95% in grassland but = <92% in woodland (1) [1] (d) (i) One mark reserved for decision on hypothesis. TRUE/AGREE with Hypothesis. OR Temperatures are lower in coniferous woodland / higher in deciduous woodland Evidence from Fig 3: Coniferous temperatures 4.4 – 7 oC but deciduous temperatures 6.3–8.2 oC (1) Highest 8.2 oC in deciduous but only 7 oC in coniferous (1) Coniferous has figures below 6.3 oC but deciduous all = > 6.3C (1) Average temperature in coniferous 5.7 oC but higher average 7.1 oC in deciduous (1) [(1R + 1 + 1) = 3] (ii) Examples of evidence Sky results are lower in coniferous woodland or X / higher in deciduous woodland or Y(1) Coniferous percentage/X 32–92% but deciduous/Y percentage 55 – 90% (1) Average percentage lower/53.9/54% in coniferous/X OR higher/66.6/67% in deciduous/Y (1) Percentage of sky in deciduous/Y not below 55% but in coniferous/X lowest is 32% (1) [1 + 1 = 2] (iii) Examples (Answers can be from deciduous point of view) Can refer to A = Coniferous and B = Deciduous Trees are closer together in coniferous woodland/A (1) Leaf/canopy cover is denser in coniferous woodland/A (1) Less sunlight can penetrate coniferous woodland/A (1) Less sunlight/higher shade in coniferous woodland/A (1) [1 +1 = 2] (e) Examples Extend transects (1) Take more measurements/sites into woodland/smaller distance between measuring sites (1) Two/more people take same readings and check results (1) Use two thermometers (1) Take measurements at same time / not morning and afternoon (1) Better to do study over several days to get more reliable/average results (1) Use a mirror/light meter to measure sky/light (1) [1 + 1 + 1 = 3] [Total: 30 marks]
Mark scheme, page 4
Page 4 Mark Scheme Syllabus Paper IGCSE – May/June 2014 0460 42 © Cambridge International Examinations 2014 2 (a) (i) Examples Opportunity to test descriptions are appropriate (1) Opportunity to test that all features are covered in survey (1) Practise/improve methodology/know what to do (1) Check consistency of applying scoring criteria (1) [1 + 1 = 2] (ii) Examples Filled in/circled the location (1) Look at/observe each feature (1) Made a decision/give opinion about the score for each category (1) Put a tick/record/give score/mark in the appropriate row/box (1) Add up/work out total in column (1) [1 + 1 = 2] (iii) Examples: 1 for each suggestion and 1 for each reason Work in groups (1) So other students check scores (1) Makes results less subjective / biased/consistent/can take an average (1) Go to different areas (1) So they survey as many roads as possible in each area (1) Gives a larger sample (1) Makes efficient use of time (1) Do surveys on same day / at same time / under same conditions (1) So comparisons between areas more consistent (1) [2 × (1 + 1) = 4] (b) (i) Total = +11 + sign not essential [1] (ii) Completion of graphs for areas A (+1) and B (–3). [1 + 1 = 2] (iii) Examples: Need 4 references to data/the table. Area C/newest has highest score/+11 (1) compared to +6/–14 (1) Area C/newest has 7 positive scores/only 1 negative/mostly positive/ vandalism & graffiti only negative (1) Area A/oldest does not have lowest score (1) is +6 compared to –14 (1) Area A/oldest has positive total score / 6 positive scores (1) Area B/middle age has lowest/negative score (1) of –14 compared to +6/+11 (1) Area B has negative score in all 8 categories (1) [1 + 1 + 1 + 1 = 4] (c) (i) Stratified only acceptable Examples of reasons for Stratified Will get people from different age groups (1) Will get people from different genders (1) Will get people from different socio-economic groups (1) [1R + (1 + 1) = 3]
Mark scheme, page 5
Page 5 Mark Scheme Syllabus Paper IGCSE – May/June 2014 0460 42 © Cambridge International Examinations 2014 (ii) Hypothesis is partly true/false/untrue/incorrect Evidence True for parking and traffic in areas A & B (1) with 3.8 and 3.3 (1) or with 3.8 higher than the other two for parking (1) or with 3.7 higher than others for traffic (1) Parking not true for area C (1) with 1.8 being lowest (1) Traffic not true for area C (1) with 1.5 being lowest (1) Scores in areas A & B = agree / strongly agree (1) as more above 3 (1) Scores in area C = disagree / strongly disagree (1) as more below 2 (1) If no decision given credit evidence for correct hypothesis to max 3 [(1R + 1 + 1 + 1) = 4] (iii) Completion of divided bar graph 1 mark for both dividing lines at correct values from the left (20 & 39) 1 mark for shading in correct order and direction from the left. [1 + 1 = 2] (iv) Parking examples Create more off-road parking areas / car parks/multi-storey parking / underground parking or garaging (1) Create permit parking system/residents reserved spaces (1). ALSO Park and ride schemes (Max 1 if in both) Traffic examples Build by-pass / ring road / one way system/flyover (1) Exclude heavy vehicles from residential areas (1) Congestion level charging at peak times of day (1) Better public transport/bus lanes (1) Odd/even number plates on different days (1) Cycle lanes (1) Car sharing (1) [1 + 1 = 2]
Mark scheme, page 6
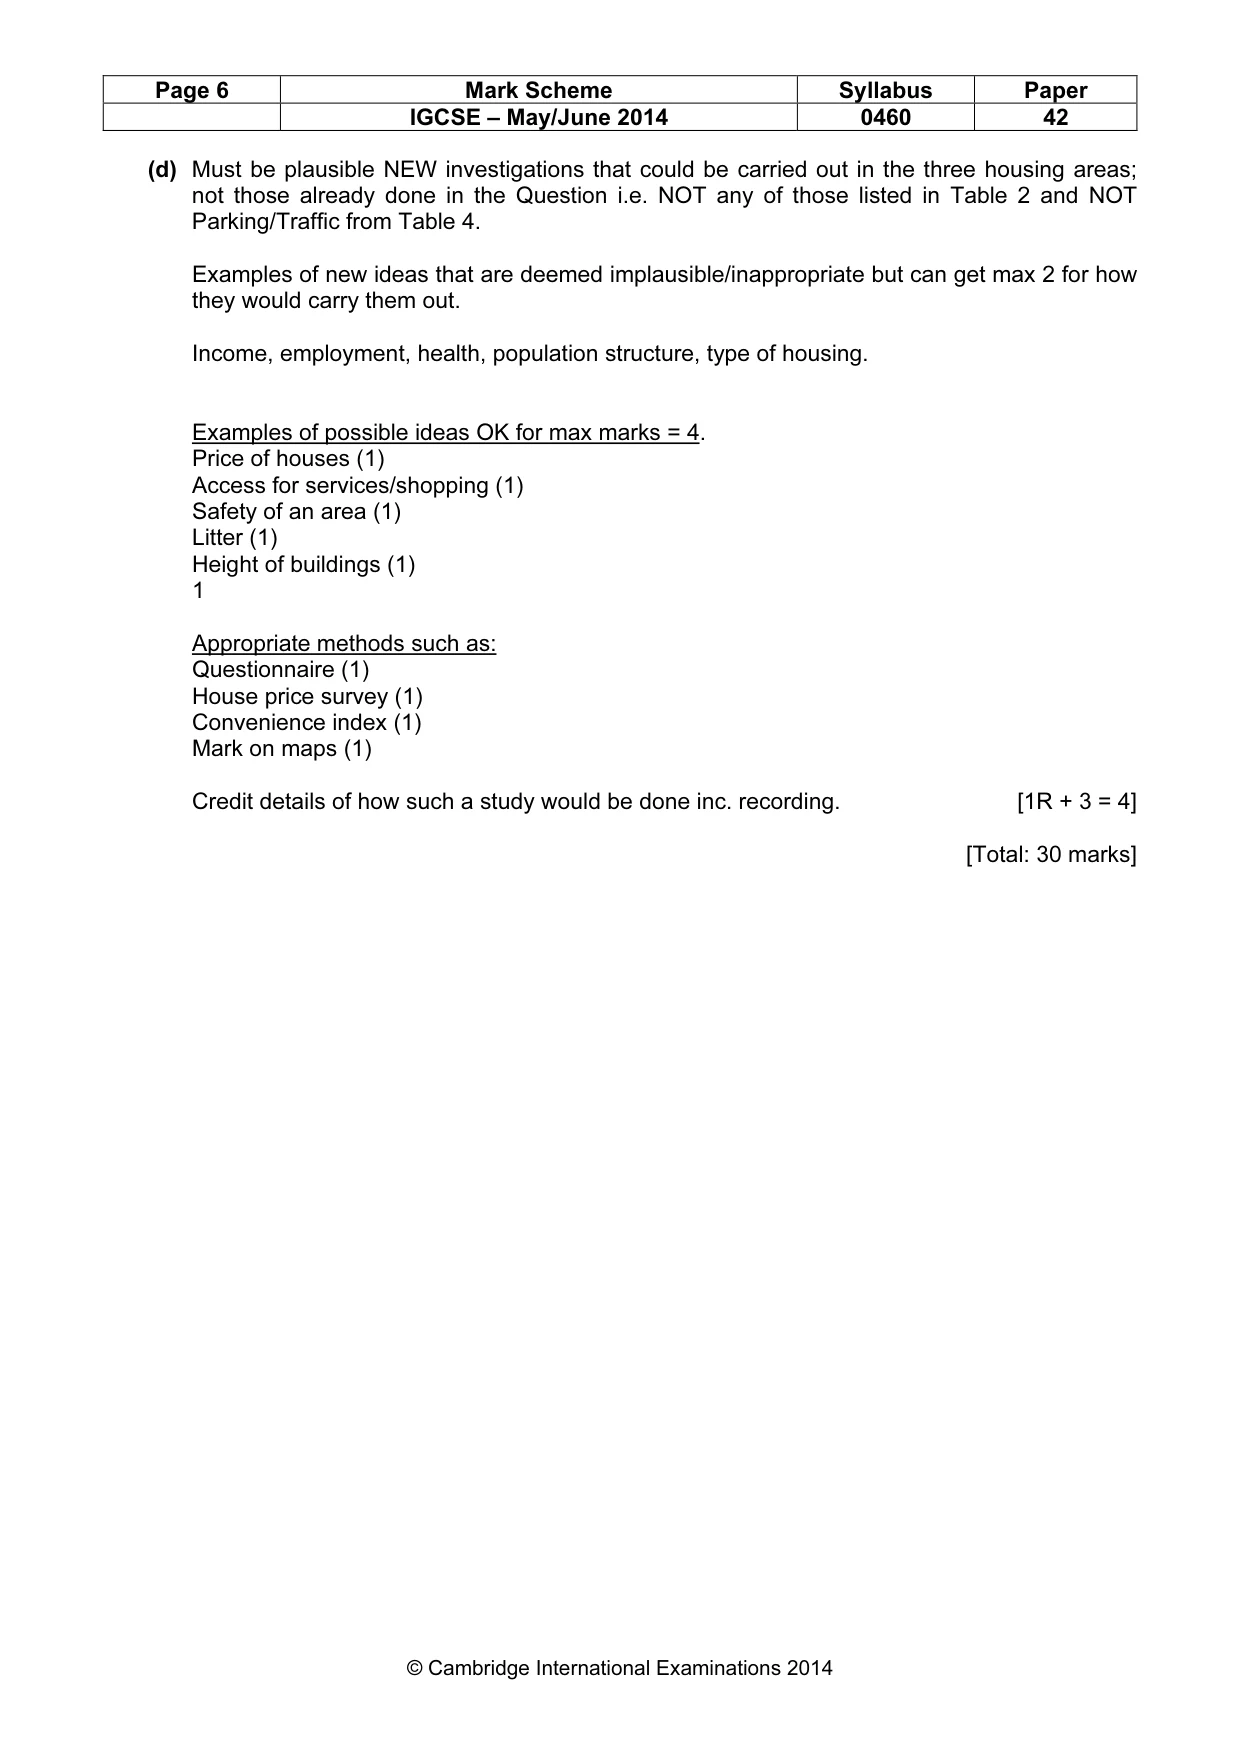
Page 6 Mark Scheme Syllabus Paper IGCSE – May/June 2014 0460 42 © Cambridge International Examinations 2014 (d) Must be plausible NEW investigations that could be carried out in the three housing areas; not those already done in the Question i.e. NOT any of those listed in Table 2 and NOT Parking/Traffic from Table 4. Examples of new ideas that are deemed implausible/inappropriate but can get max 2 for how they would carry them out. Income, employment, health, population structure, type of housing. Examples of possible ideas OK for max marks = 4. Price of houses (1) Access for services/shopping (1) Safety of an area (1) Litter (1) Height of buildings (1) 1 Appropriate methods such as: Questionnaire (1) House price survey (1) Convenience index (1) Mark on maps (1) Credit details of how such a study would be done inc. recording. [1R + 3 = 4] [Total: 30 marks]
What you needed in this session
Cambridge’s own grade thresholds for 2014 May/June, Paper 4 · Variant 2. A higher threshold means an easier paper — the bar moves with how the cohort did.