Cambridge IGCSE Geography 0460 — 2013 May/June Paper 1 · Variant 1
0460/11/M/J/13 · 75 marks · ≈84 min
The question paper and its mark scheme, free to read here and free to download. This is Cambridge’s own paper, exactly as it was sat.
Question paper28 pages
Mark scheme11 pages
Answers below. Sit the paper first if you are practising.
Paper as text
Question paper, page 1
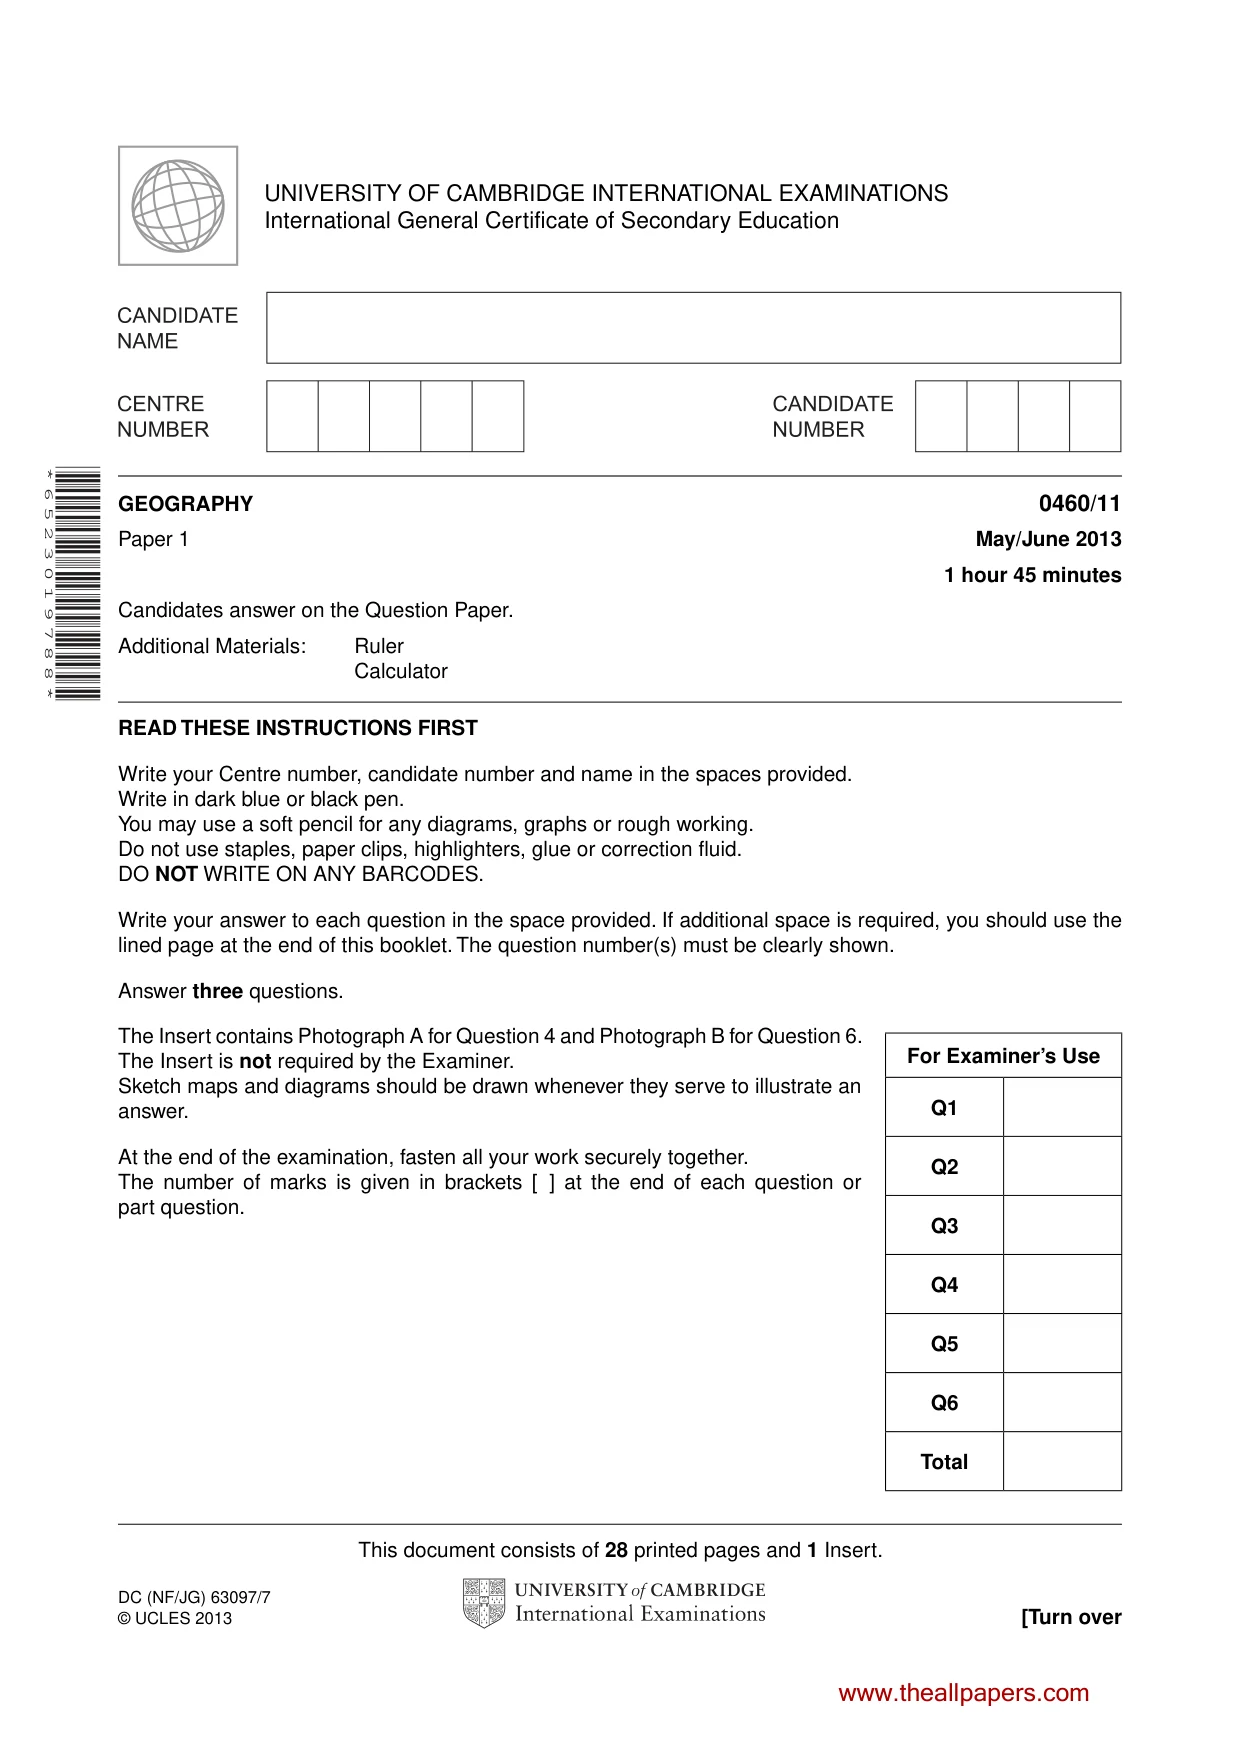
This document consists of 28 printed pages and 1 Insert. DC (NF/JG) 63097/7 © UCLES 2013 [Turn over UNIVERSITY OF CAMBRIDGE INTERNATIONAL EXAMINATIONS International General Certificate of Secondary Education * 6 5 2 3 0 1 9 7 8 8 * GEOGRAPHY 0460/11 Paper 1 May/June 2013 1 hour 45 minutes Candidates answer on the Question Paper. Additional Materials: Ruler Calculator READ THESE INSTRUCTIONS FIRST Write your Centre number, candidate number and name in the spaces provided. Write in dark blue or black pen. You may use a soft pencil for any diagrams, graphs or rough working. Do not use staples, paper clips, highlighters, glue or correction fluid. DO NOT WRITE ON ANY BARCODES. Write your answer to each question in the space provided. If additional space is required, you should use the lined page at the end of this booklet. The question number(s) must be clearly shown. Answer three questions. The Insert contains Photograph A for Question 4 and Photograph B for Question 6. The Insert is not required by the Examiner. Sketch maps and diagrams should be drawn whenever they serve to illustrate an answer. At the end of the examination, fasten all your work securely together. The number of marks is given in brackets [ ] at the end of each question or part question. For Examiner’s Use Q1 Q2 Q3 Q4 Q5 Q6 Total www.theallpapers.com
Question paper, page 2
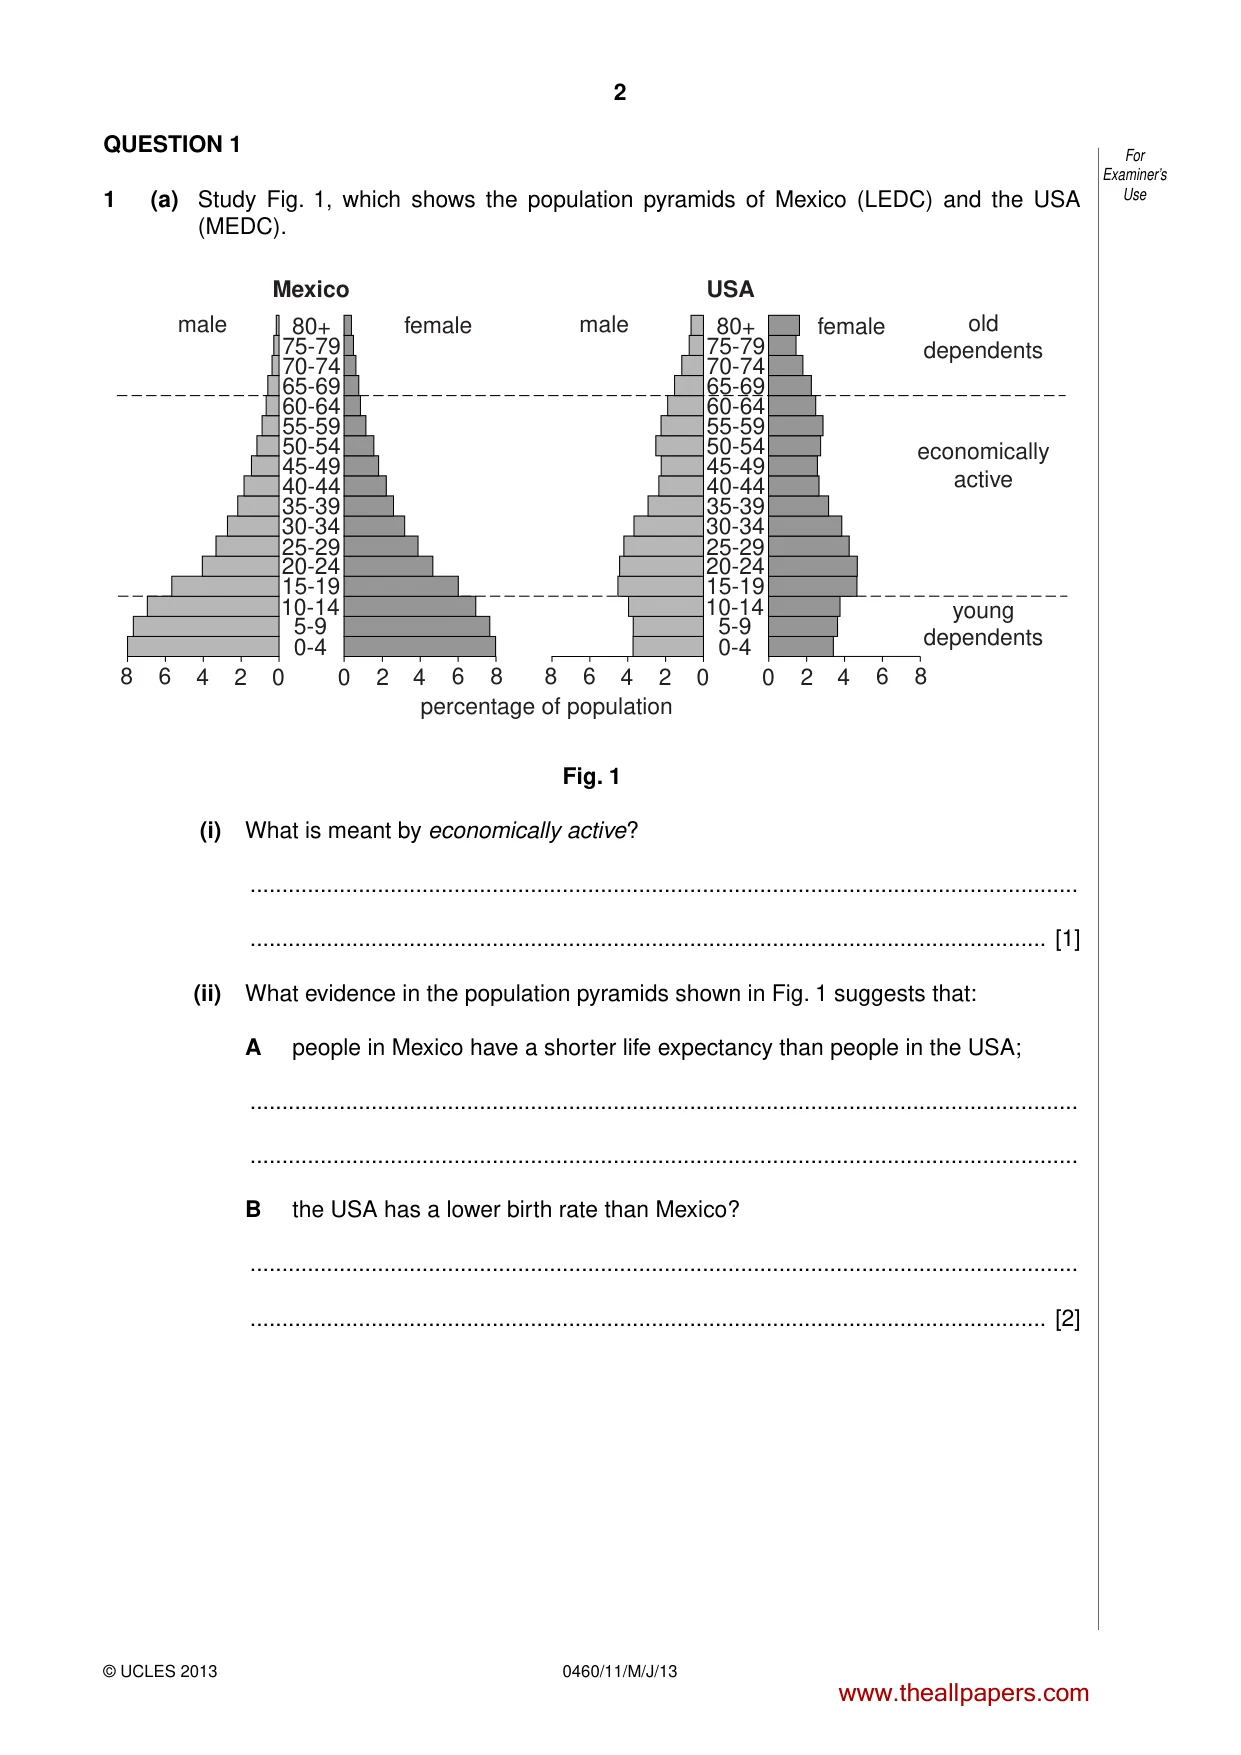
2 0460/11/M/J/13 © UCLES 2013 For Examiner’s Use QUESTION 1 1 (a) Study Fig. 1, which shows the population pyramids of Mexico (LEDC) and the USA (MEDC). male female 8 8 6 6 4 4 2 2 0 0 40-44 45-49 50-54 55-59 60-64 65-69 70-74 75-79 80+ 35-39 30-34 25-29 20-24 15-19 10-14 5-9 0-4 percentage of population Mexico male female 8 8 6 6 4 4 2 2 0 0 40-44 45-49 50-54 55-59 60-64 65-69 70-74 75-79 80+ 35-39 30-34 25-29 20-24 15-19 10-14 5-9 0-4 USA old dependents economically active young dependents Fig. 1 (i) What is meant by economically active? … … [1] (ii) What evidence in the population pyramids shown in Fig. 1 suggests that: A people in Mexico have a shorter life expectancy than people in the USA; … … B the USA has a lower birth rate than Mexico? … … [2] www.theallpapers.com
Question paper, page 3
3 0460/11/M/J/13 © UCLES 2013 [Turn over For Examiner’s Use (iii) Compare the percentage of young dependents in Mexico with that in the USA. Support your answer with figures. … … … … … … [3] (iv) Explain why, in LEDCs such as Mexico, young dependents make up a large percentage of the population. … … … … … … … … … [4] www.theallpapers.com
Question paper, page 4
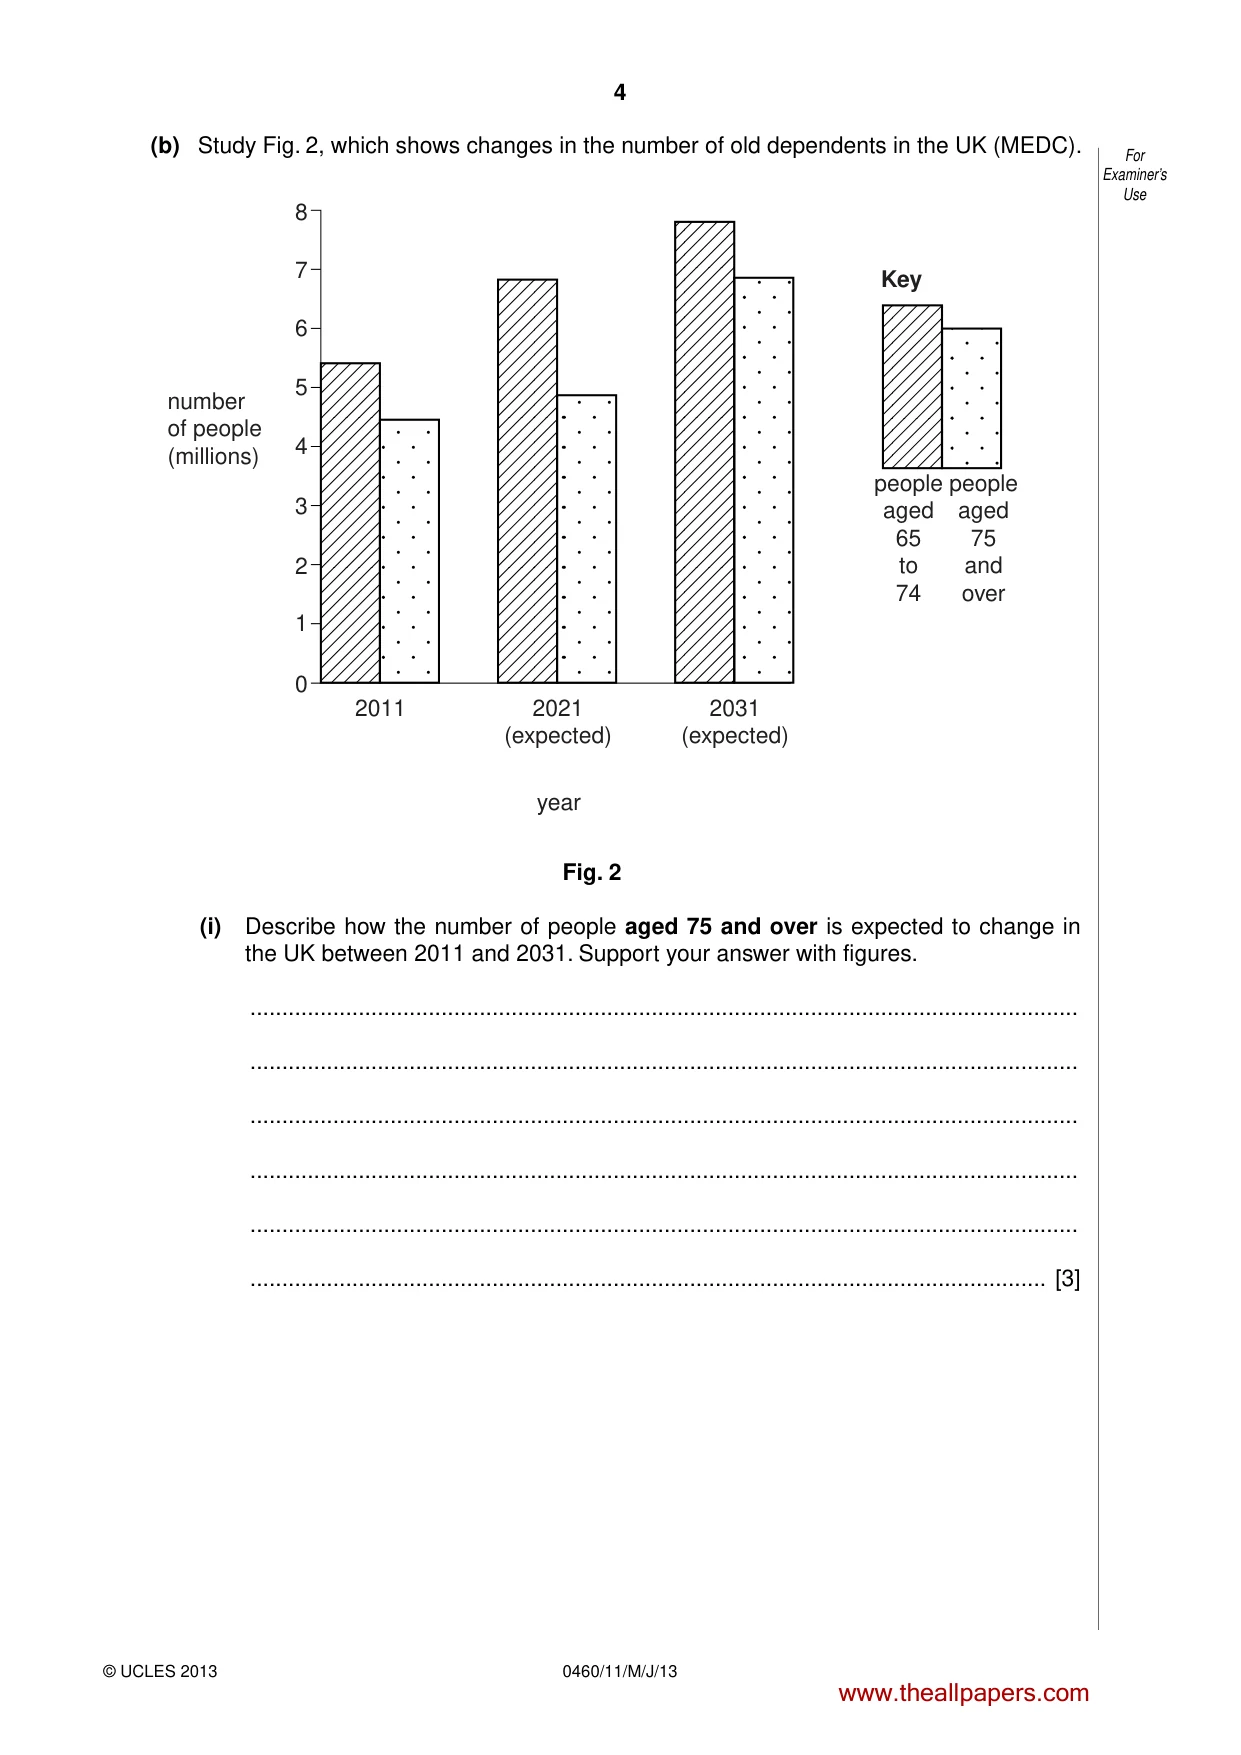
4 0460/11/M/J/13 © UCLES 2013 For Examiner’s Use (b) Study Fig. 2, which shows changes in the number of old dependents in the UK (MEDC). 0 1 2 3 4 5 6 7 8 2011 2021 (expected) 2031 (expected) number of people (millions) people aged 65 to 74 people aged 75 and over Key year Fig. 2 (i) Describe how the number of people aged 75 and over is expected to change in the UK between 2011 and 2031. Support your answer with figures. … … … … … … [3] www.theallpapers.com
Question paper, page 5
5 0460/11/M/J/13 © UCLES 2013 [Turn over For Examiner’s Use (ii) Explain why the governments of MEDCs, such as the UK, are concerned about the ageing population. … … … … … … … … … … [5] www.theallpapers.com
Question paper, page 6
6 0460/11/M/J/13 © UCLES 2013 For Examiner’s Use (c) For a named country, state a policy which has been used to influence rates of population growth. Describe the impacts of this policy. Name of country … Policy … Impacts … … … … … … … … … … … … … … … … … [7] [Total: 25 marks] END OF QUESTION 1 www.theallpapers.com
Question paper, page 7
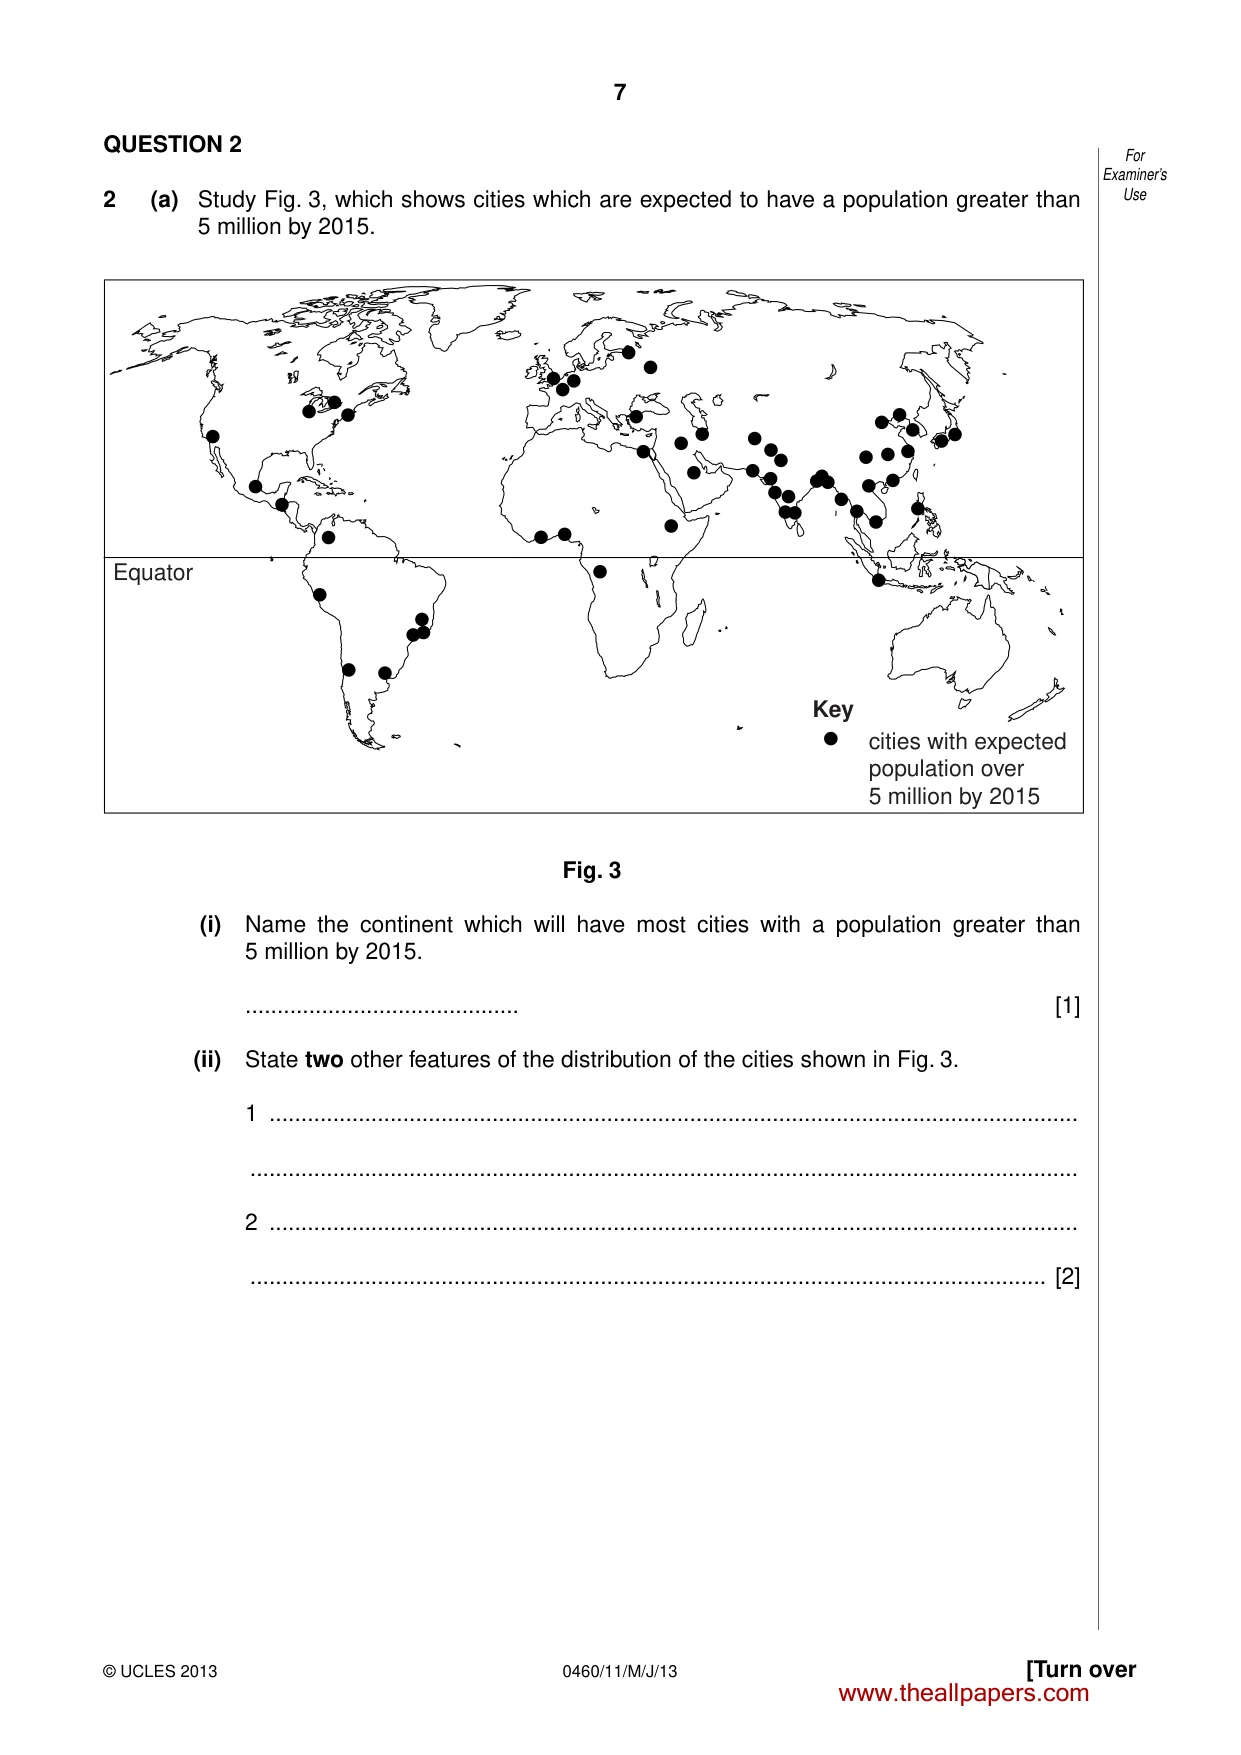
7 0460/11/M/J/13 © UCLES 2013 [Turn over For Examiner’s Use QUESTION 2 2 (a) Study Fig. 3, which shows cities which are expected to have a population greater than 5 million by 2015. Equator cities with expected population over 5 million by 2015 Key Fig. 3 (i) Name the continent which will have most cities with a population greater than 5 million by 2015. … [1] (ii) State two other features of the distribution of the cities shown in Fig. 3. 1 … … 2 … … [2] www.theallpapers.com
Question paper, page 8
8 0460/11/M/J/13 © UCLES 2013 For Examiner’s Use (iii) Explain how large cities in LEDCs can result from: A natural population growth; … … … … … … [3] B migration. … … … … … … … … [4] www.theallpapers.com
Question paper, page 9
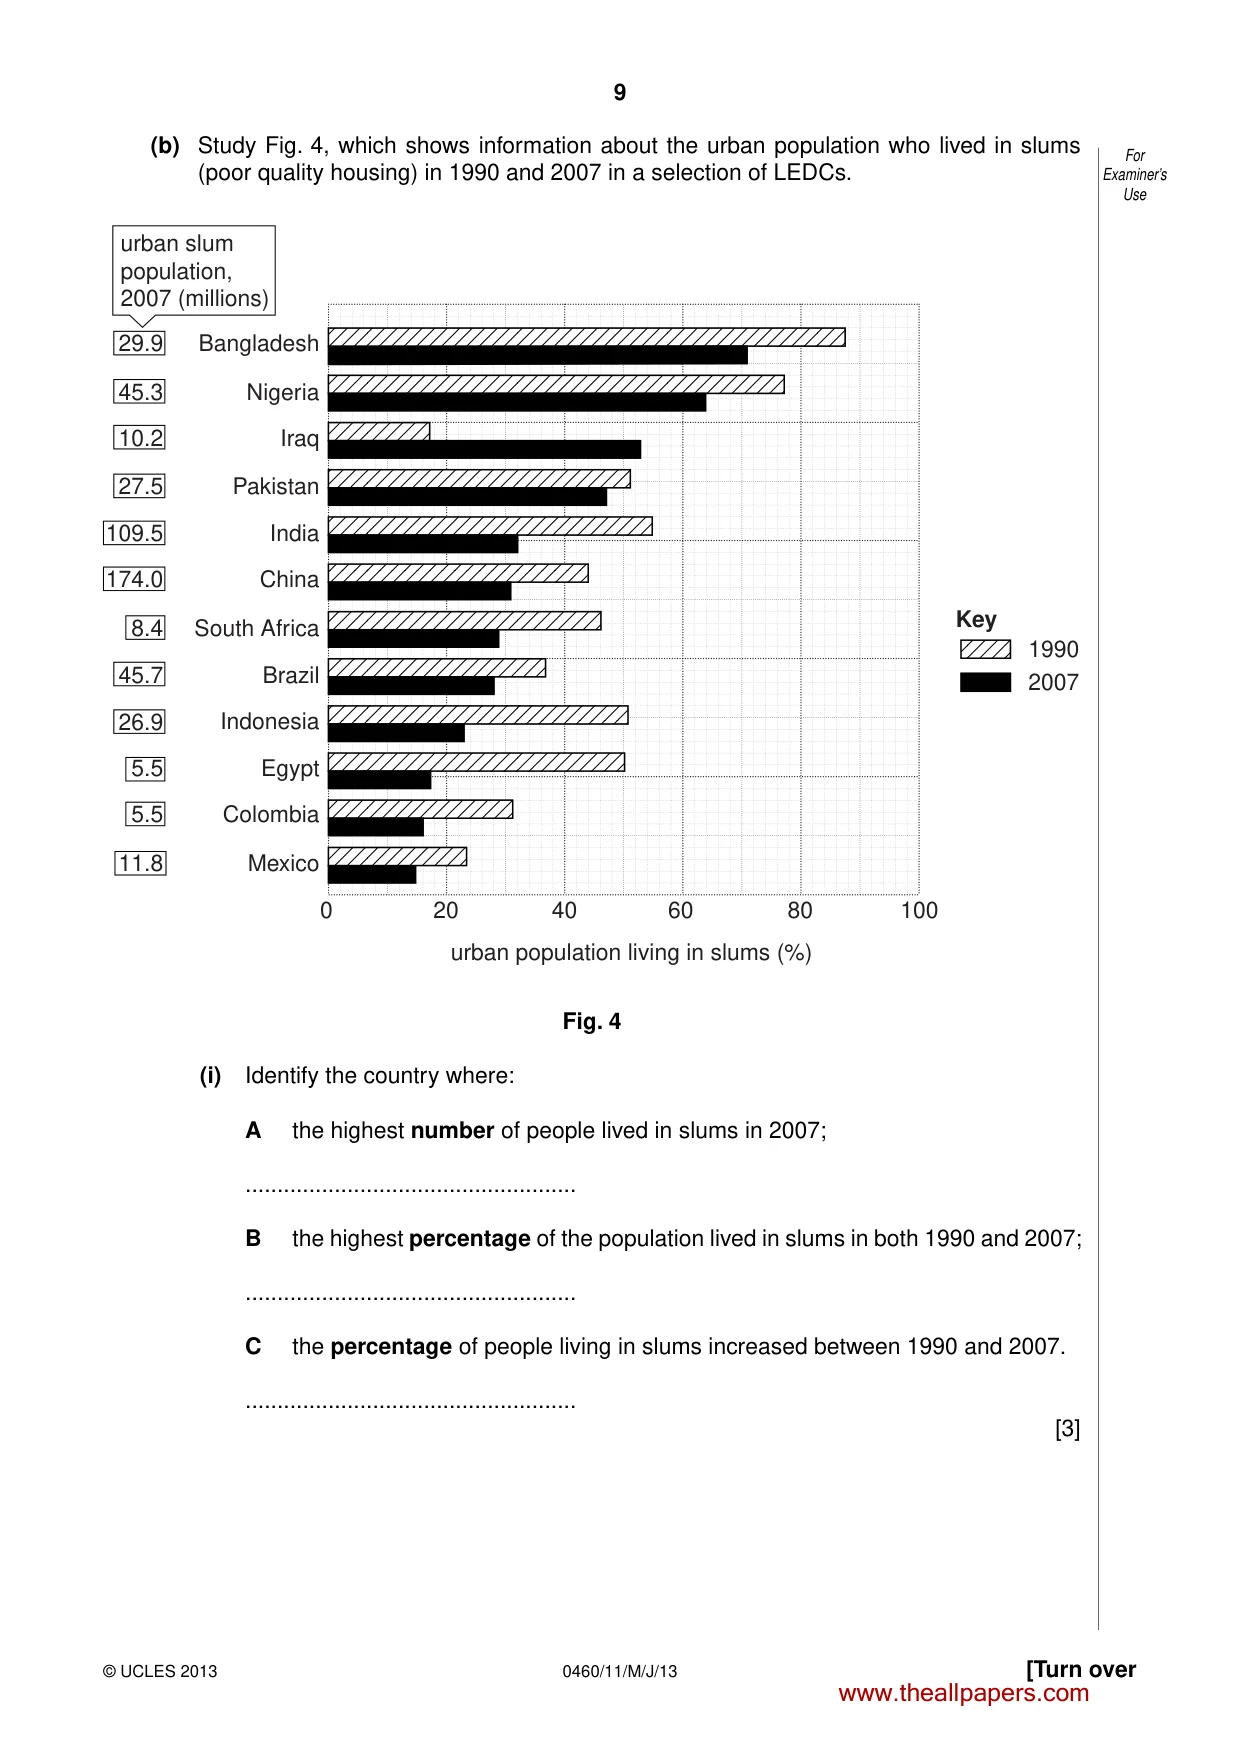
9 0460/11/M/J/13 © UCLES 2013 [Turn over For Examiner’s Use (b) Study Fig. 4, which shows information about the urban population who lived in slums (poor quality housing) in 1990 and 2007 in a selection of LEDCs. Key Mexico Colombia Egypt Indonesia Brazil South Africa China India Pakistan Iraq Nigeria Bangladesh 11.8 5.5 5.5 26.9 45.7 8.4 174.0 109.5 27.5 10.2 45.3 29.9 0 20 40 60 80 100 urban population living in slums (%) urban slum population, 2007 (millions) 1990 2007 Fig. 4 (i) Identify the country where: A the highest number of people lived in slums in 2007; … B the highest percentage of the population lived in slums in both 1990 and 2007; … C the percentage of people living in slums increased between 1990 and 2007. … [3] www.theallpapers.com
Question paper, page 10
10 0460/11/M/J/13 © UCLES 2013 For Examiner’s Use (ii) Explain why many people in cities in LEDCs live in slums. … … … … … … … … … … [5] (c) Name a city and describe what has been done to improve living conditions in the slums found there. Name of city … … … … … … … … … … … … … … … … [7] [Total: 25 marks] END OF QUESTION 2 www.theallpapers.com
Question paper, page 11
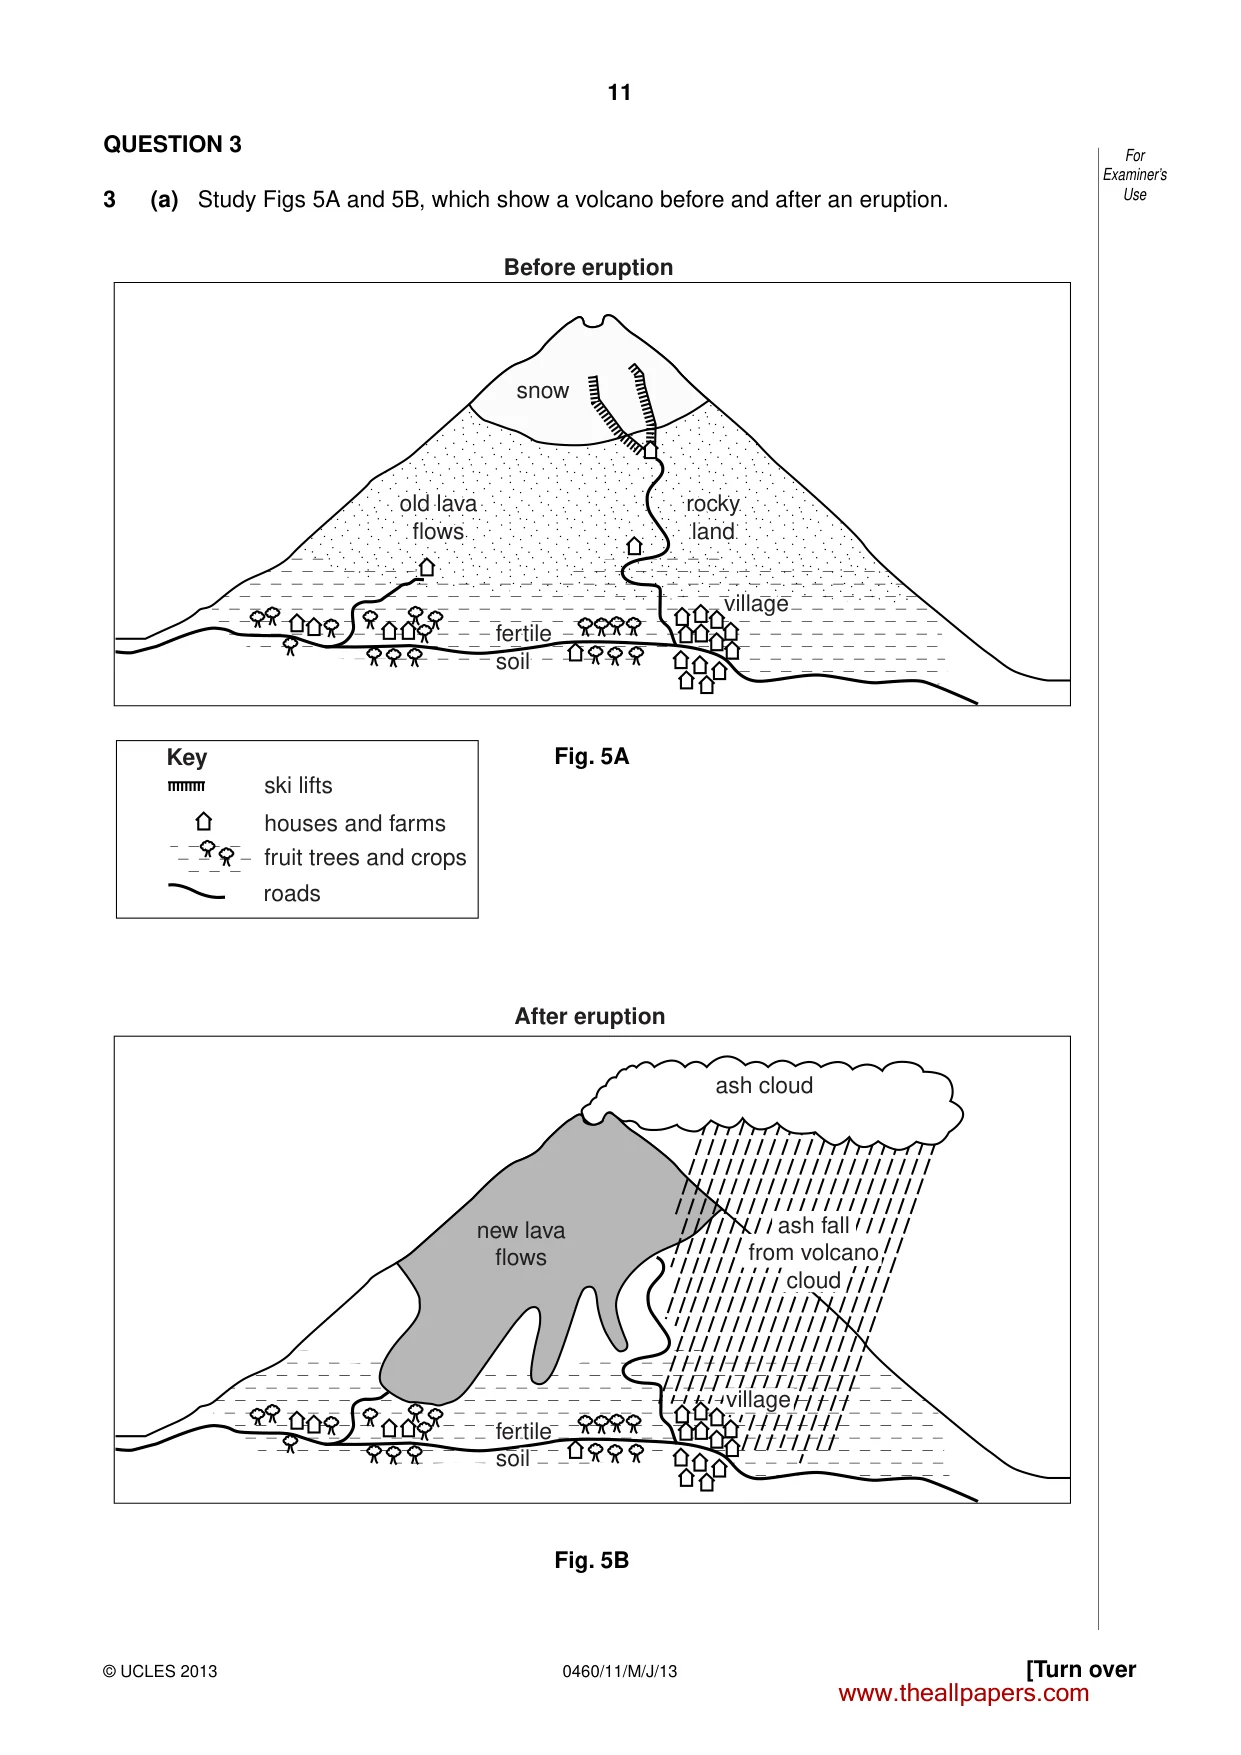
11 0460/11/M/J/13 © UCLES 2013 [Turn over For Examiner’s Use QUESTION 3 3 (a) Study Figs 5A and 5B, which show a volcano before and after an eruption. Key ski lifts houses and farms fruit trees and crops roads old lava flows rocky land village fertile soil old lava flows snow rocky land village fertile soil Before eruption Fig. 5A fertile soil fertile soil ash cloud ash fall from volcano cloud After eruption new lava flows village Fig. 5B www.theallpapers.com
Question paper, page 12
12 0460/11/M/J/13 © UCLES 2013 For Examiner’s Use (i) Identify a tourist facility shown on Fig. 5A, which was destroyed by the volcanic eruption. … [1] (ii) Describe two likely problems for people who live in the area shown on Figs 5A and 5B as a result of the volcanic eruption. 1 … … 2 … … [2] (iii) Explain why some volcanoes erupt on constructive (divergent) plate boundaries. … … … … … … [3] (iv) Describe the opportunities offered by volcanoes for people who live close to them. … … … … … … … … [4] www.theallpapers.com
Question paper, page 13
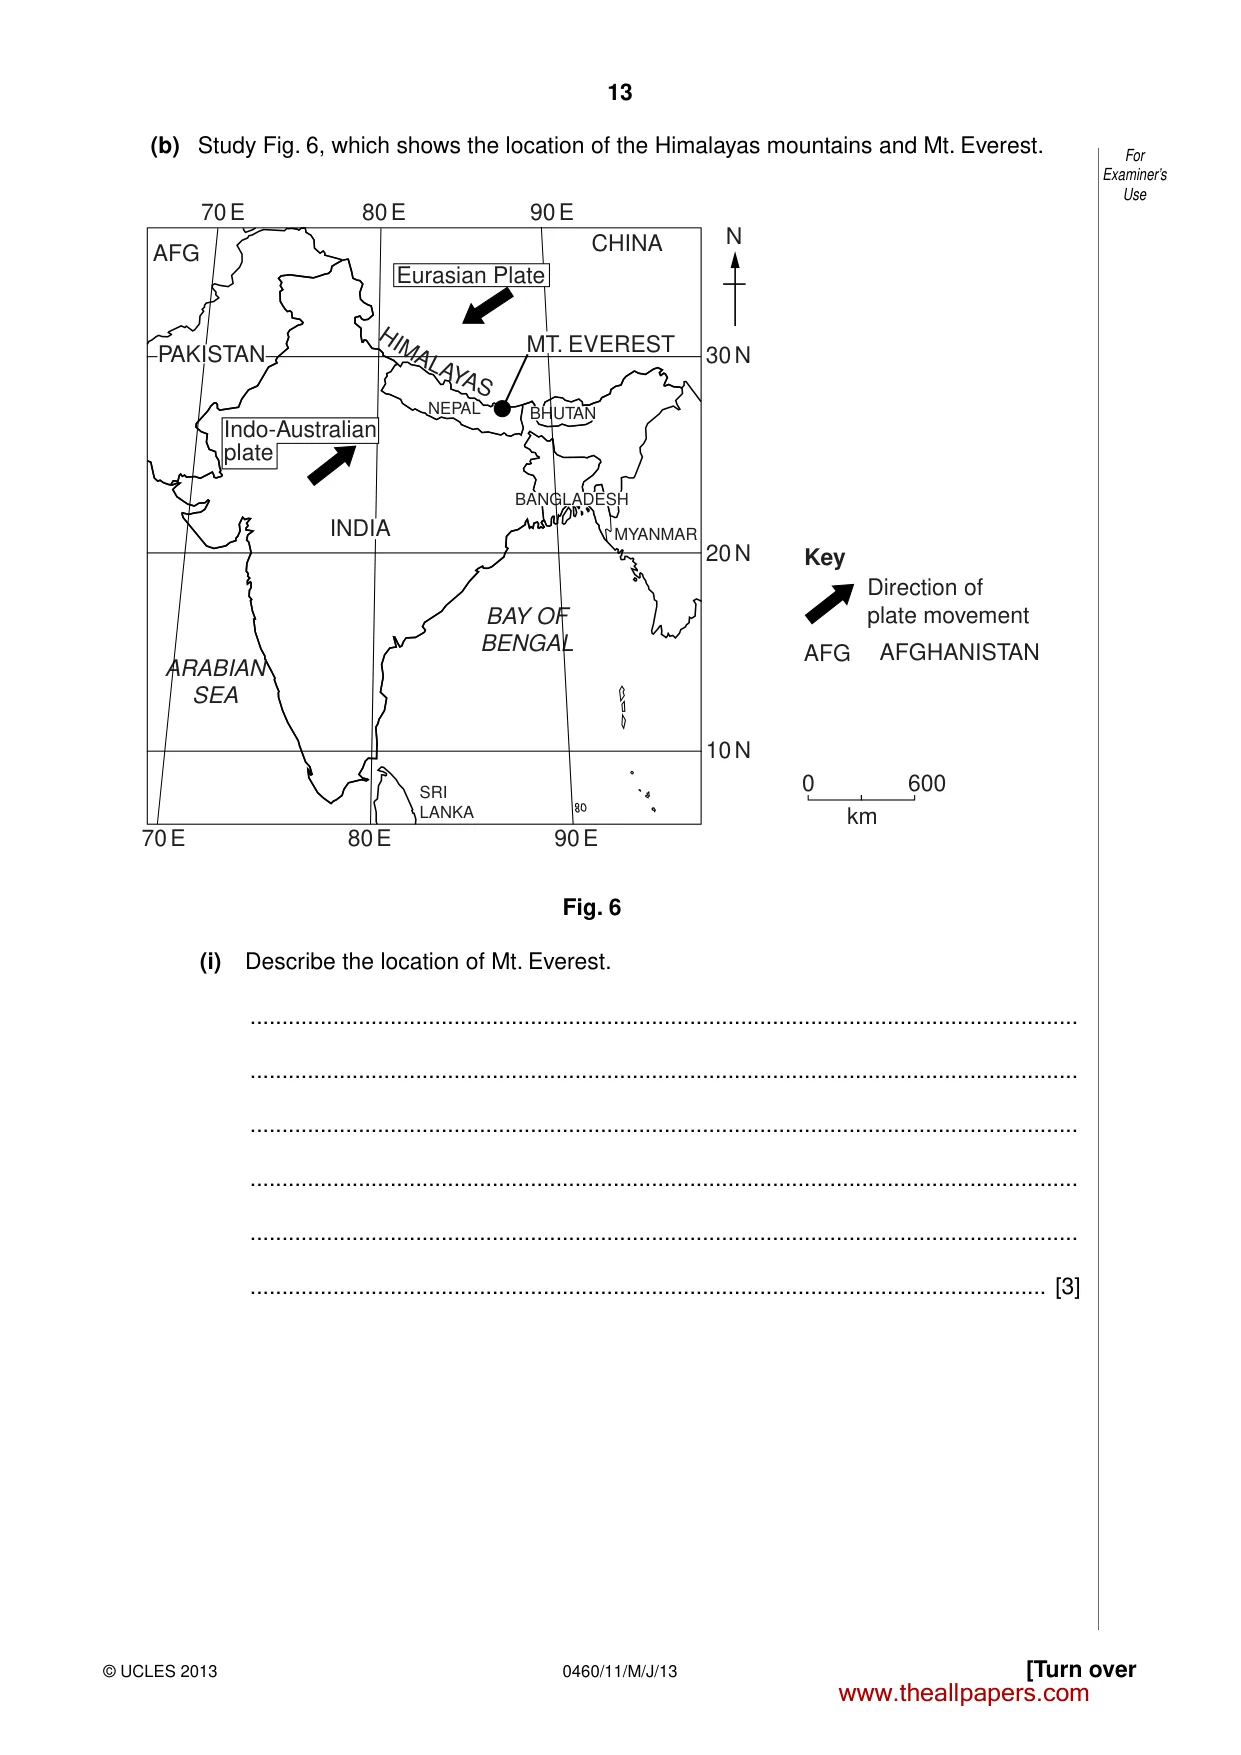
13 0460/11/M/J/13 © UCLES 2013 [Turn over For Examiner’s Use (b) Study Fig. 6, which shows the location of the Himalayas mountains and Mt. Everest. CHINA AFG AFG AFGHANISTAN MYANMAR BANGLADESH BHUTAN NEPAL ARABIAN SEA SRI LANKA BAY OF BENGAL 0 600 km 30 N 20 N 10 N 70 E 70 E 80 E 80 E 90 E 90 E PAKISTAN INDIA MT. EVEREST Key Direction of plate movement N Indo-Australian plate Eurasian Plate HI MA LAY AS Fig. 6 (i) Describe the location of Mt. Everest. … … … … … … [3] www.theallpapers.com
Question paper, page 14
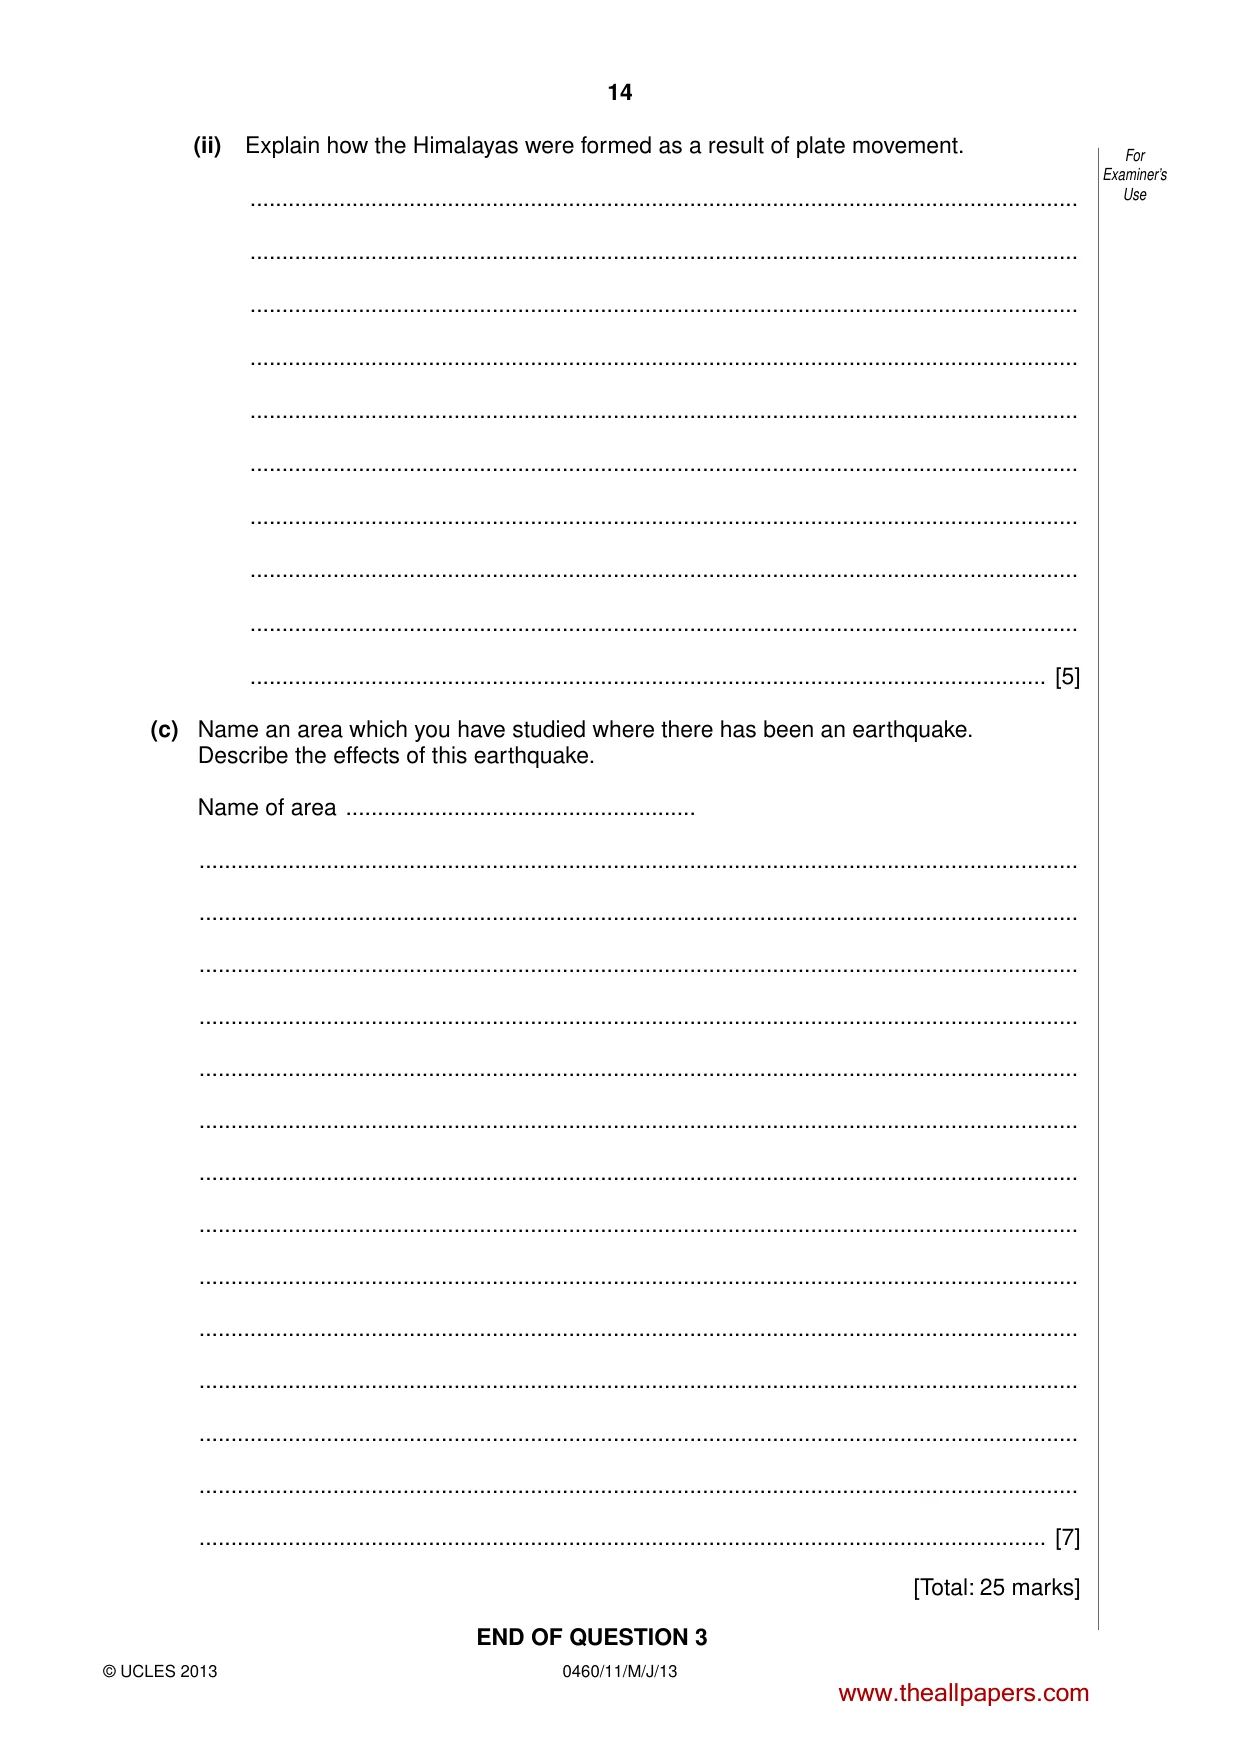
14 0460/11/M/J/13 © UCLES 2013 For Examiner’s Use (ii) Explain how the Himalayas were formed as a result of plate movement. … … … … … … … … … … [5] (c) Name an area which you have studied where there has been an earthquake. Describe the effects of this earthquake. Name of area … … … … … … … … … … … … … … … [7] [Total: 25 marks] END OF QUESTION 3 www.theallpapers.com
Question paper, page 15
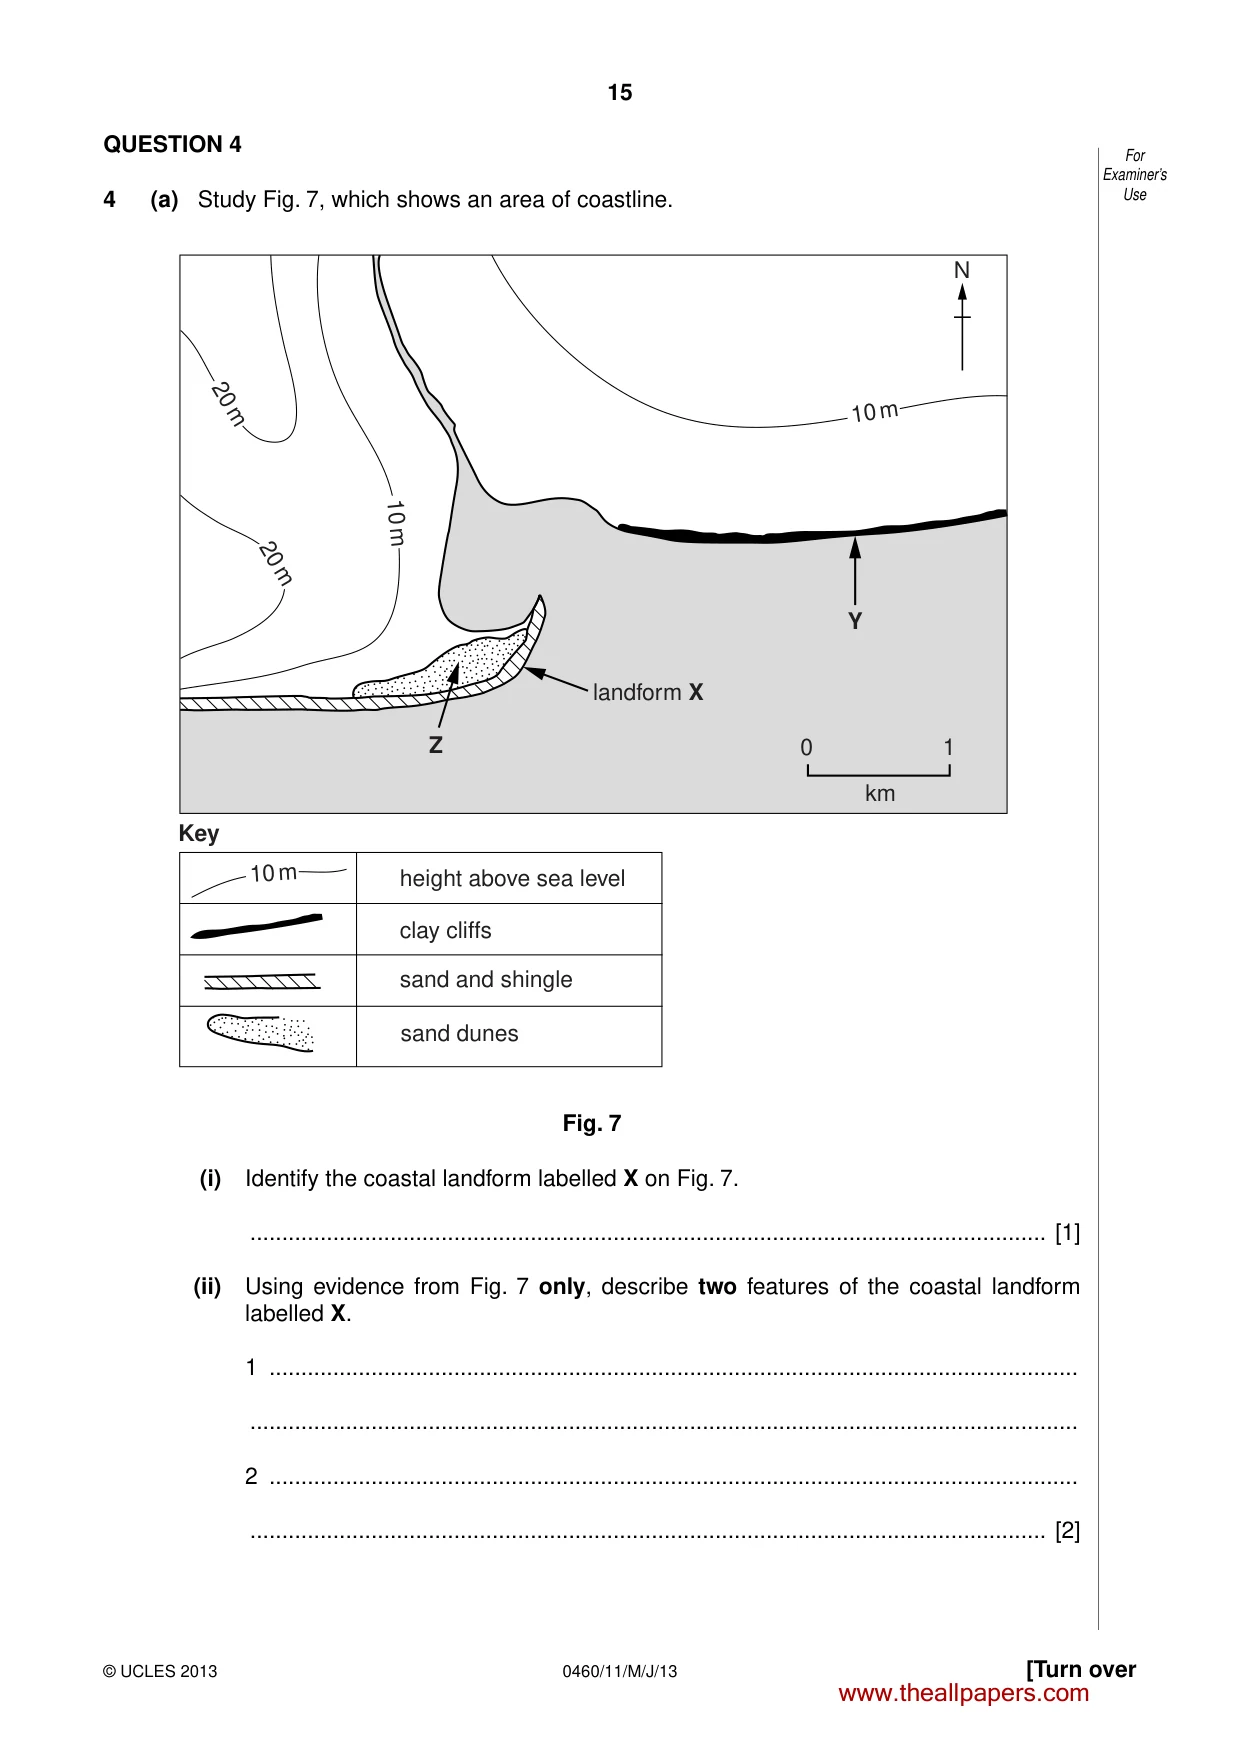
15 0460/11/M/J/13 © UCLES 2013 [Turn over For Examiner’s Use QUESTION 4 4 (a) Study Fig. 7, which shows an area of coastline. N 20 m 20 m 10 m 10 m 10 m Z Key Y landform X height above sea level clay cliffs sand and shingle sand dunes km 0 1 Fig. 7 (i) Identify the coastal landform labelled X on Fig. 7. … [1] (ii) Using evidence from Fig. 7 only, describe two features of the coastal landform labelled X. 1 … … 2 … … [2] www.theallpapers.com
Question paper, page 16
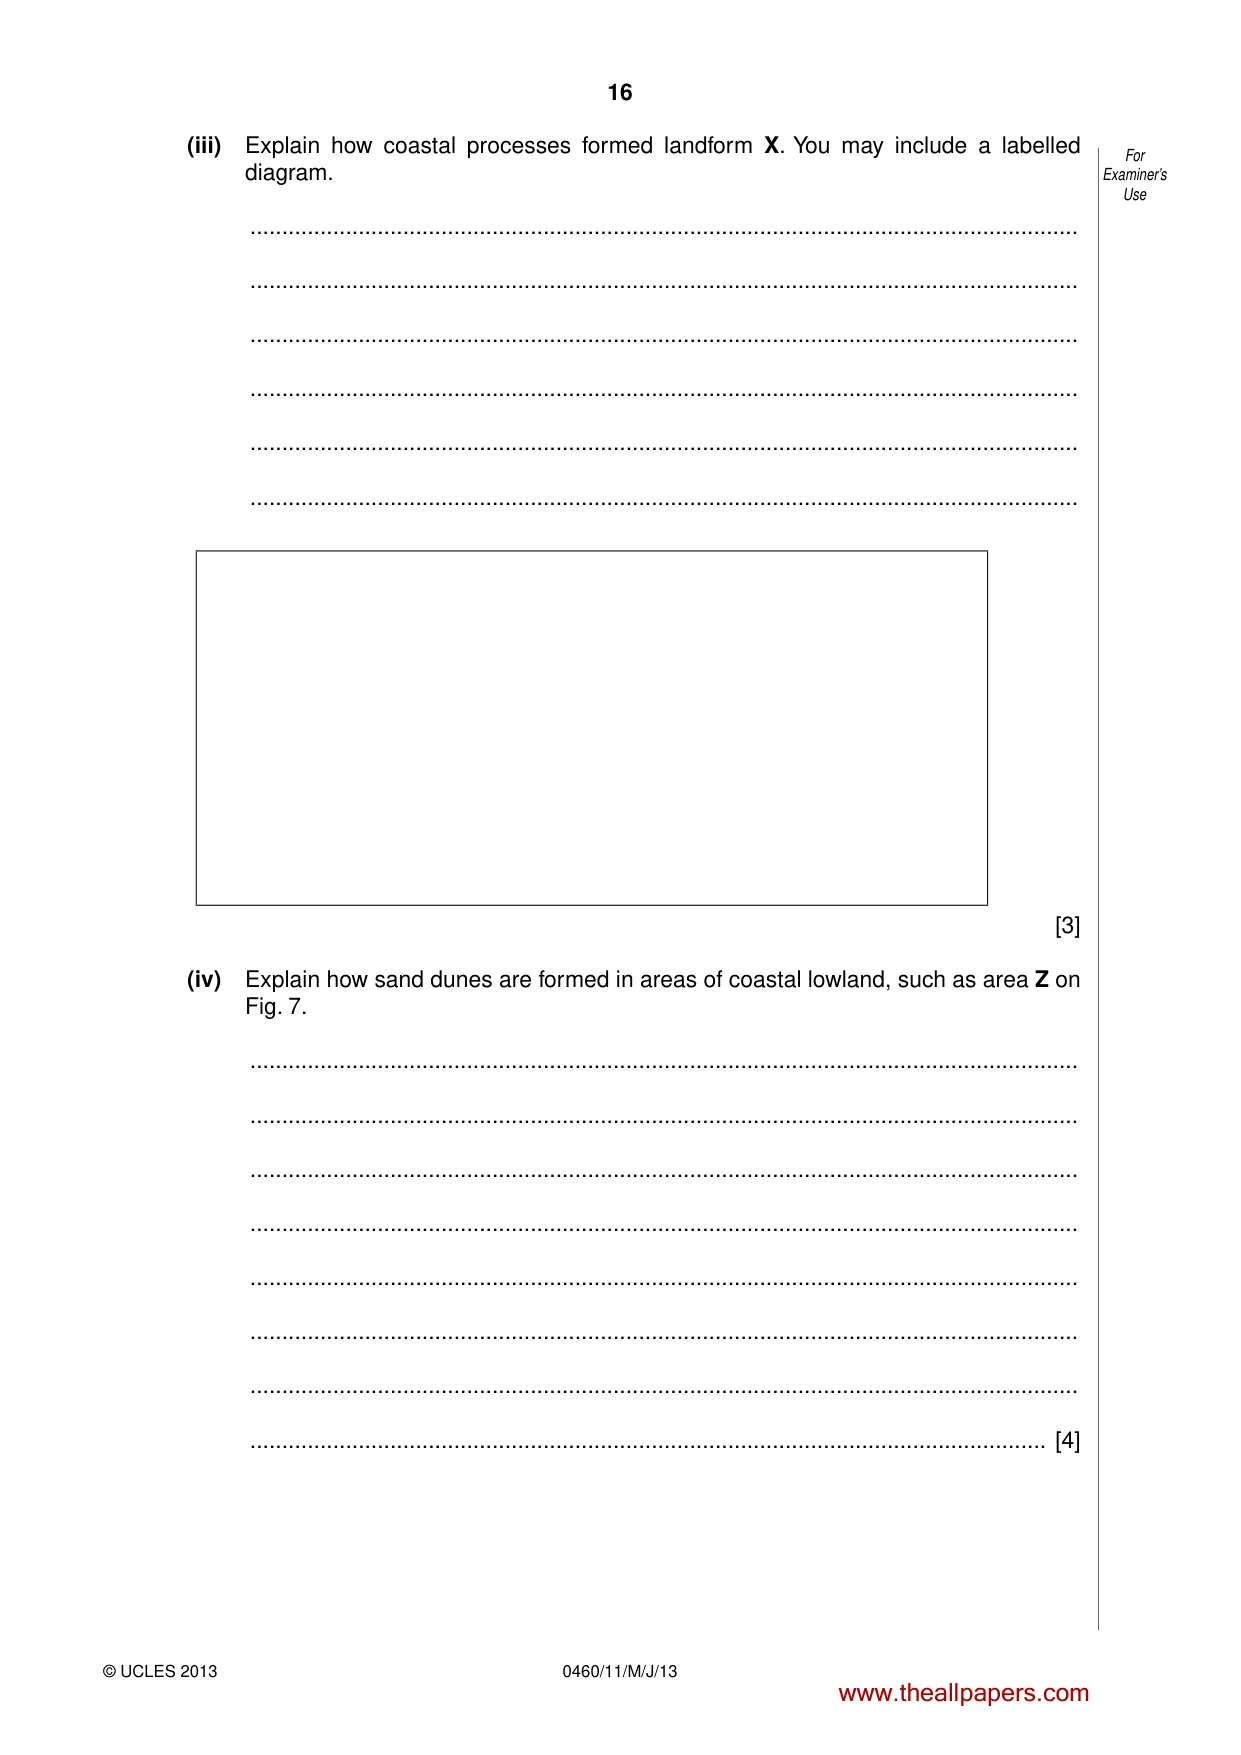
16 0460/11/M/J/13 © UCLES 2013 For Examiner’s Use (iii) Explain how coastal processes formed landform X. You may include a labelled diagram. … … … … … … [3] (iv) Explain how sand dunes are formed in areas of coastal lowland, such as area Z on Fig. 7. … … … … … … … … [4] www.theallpapers.com
Question paper, page 17
17 0460/11/M/J/13 © UCLES 2013 [Turn over For Examiner’s Use (b) Study Photograph A (Insert), which shows the cliffs labelled at Y on Fig. 7. (i) Suggest why the cliffs shown in Photograph A are eroding rapidly. … … … … … … [3] (ii) Explain how erosion of cliffs, such as those shown in Photograph A, could cause problems for people. … … … … … … … … … … [5] www.theallpapers.com
Question paper, page 18
18 0460/11/M/J/13 © UCLES 2013 For Examiner’s Use (c) Most deltas are located on the coast. Describe the benefits and problems of living on a delta which you have studied. Name of delta … … … … … … … … … … … … … … … [7] [Total: 25 marks] END OF QUESTION 4 www.theallpapers.com
Question paper, page 19
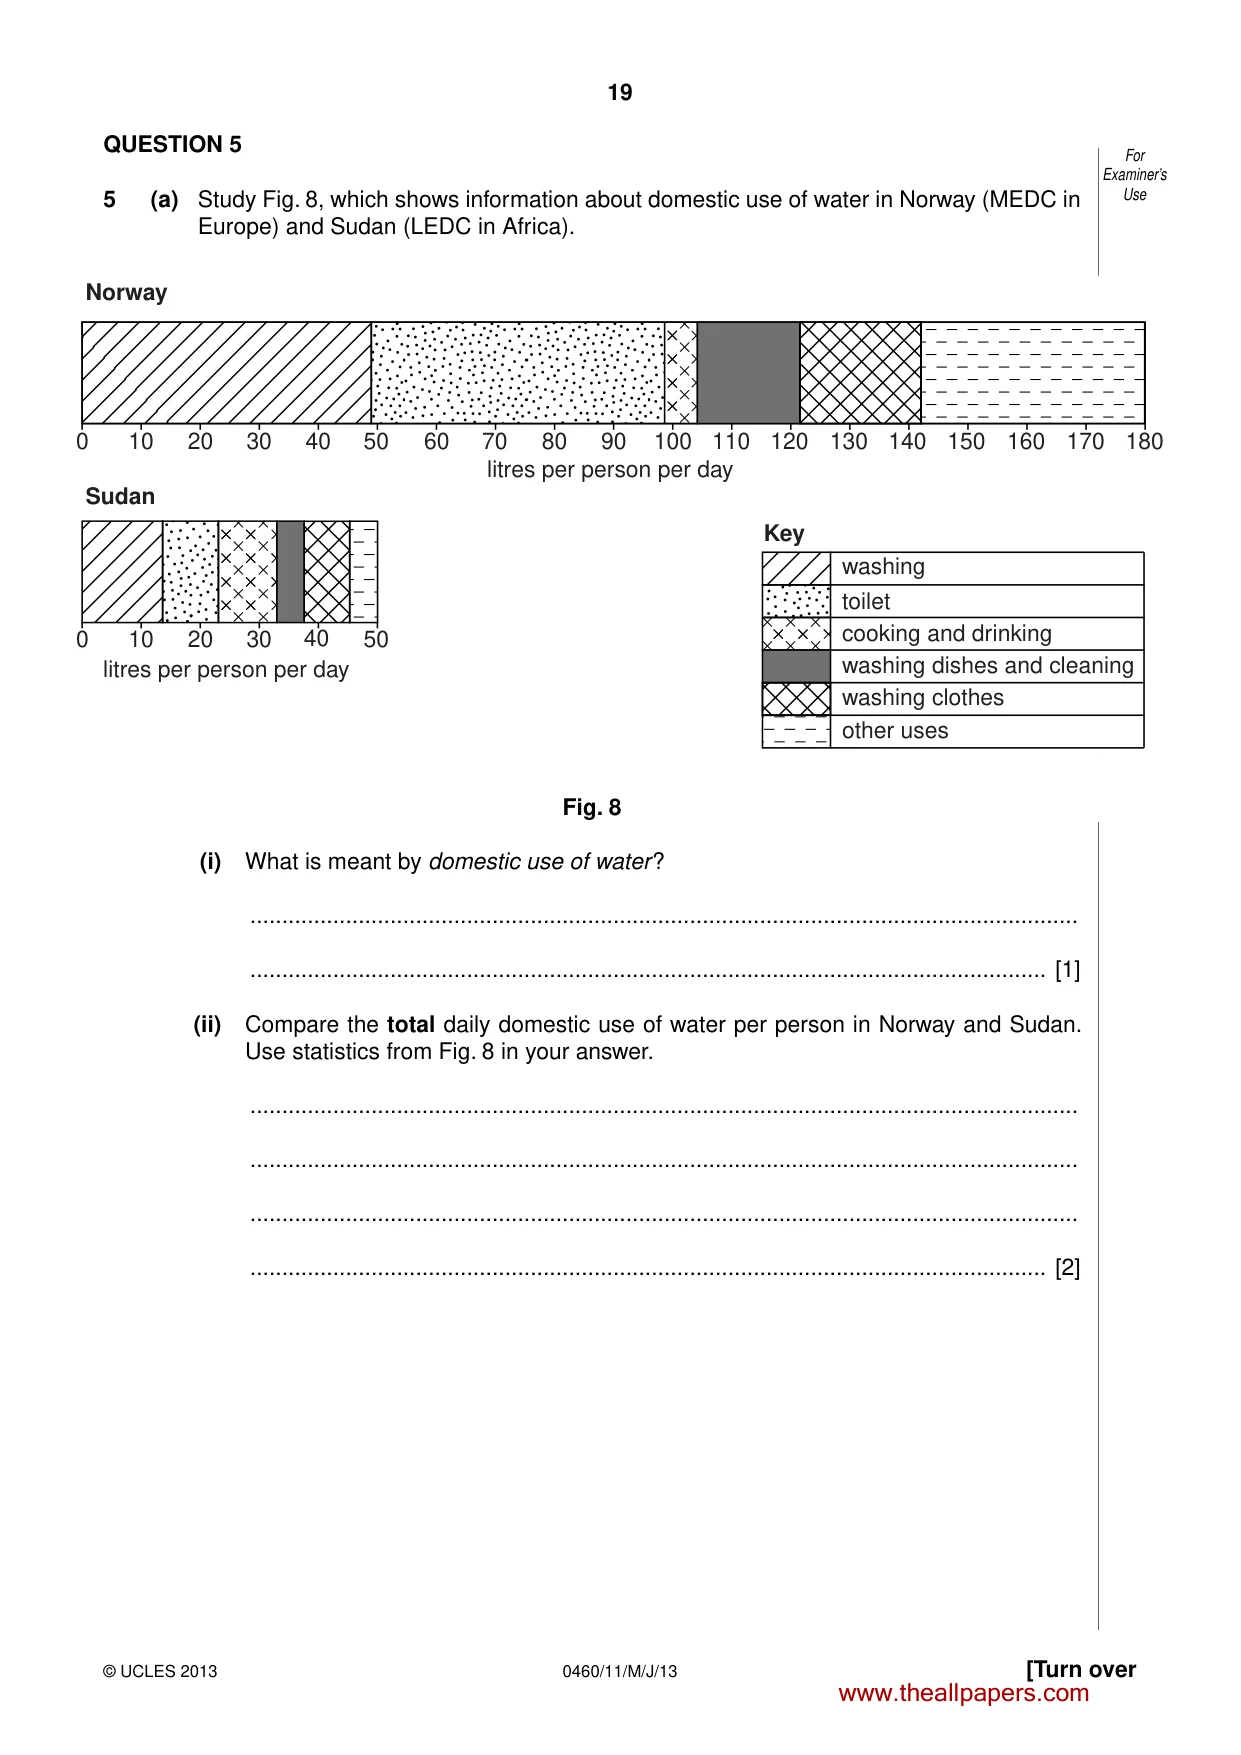
19 0460/11/M/J/13 © UCLES 2013 [Turn over For Examiner’s Use QUESTION 5 5 (a) Study Fig. 8, which shows information about domestic use of water in Norway (MEDC in Europe) and Sudan (LEDC in Africa). 0 10 20 30 40 50 0 10 20 30 40 50 60 70 80 90 100 110 120 130 140 150 160 170 180 washing toilet cooking and drinking washing dishes and cleaning washing clothes other uses Norway Sudan Key litres per person per day litres per person per day Fig. 8 (i) What is meant by domestic use of water? … … [1] (ii) Compare the total daily domestic use of water per person in Norway and Sudan. Use statistics from Fig. 8 in your answer. … … … … [2] www.theallpapers.com
Question paper, page 20
20 0460/11/M/J/13 © UCLES 2013 For Examiner’s Use (iii) Using evidence from Fig. 8 only, identify three other differences between the domestic use of water in Norway and Sudan. 1 … … 2 … … 3 … … [3] (iv) Suggest reasons for differences in the domestic use of water in Norway and Sudan. … … … … … … … … [4] www.theallpapers.com
Question paper, page 21
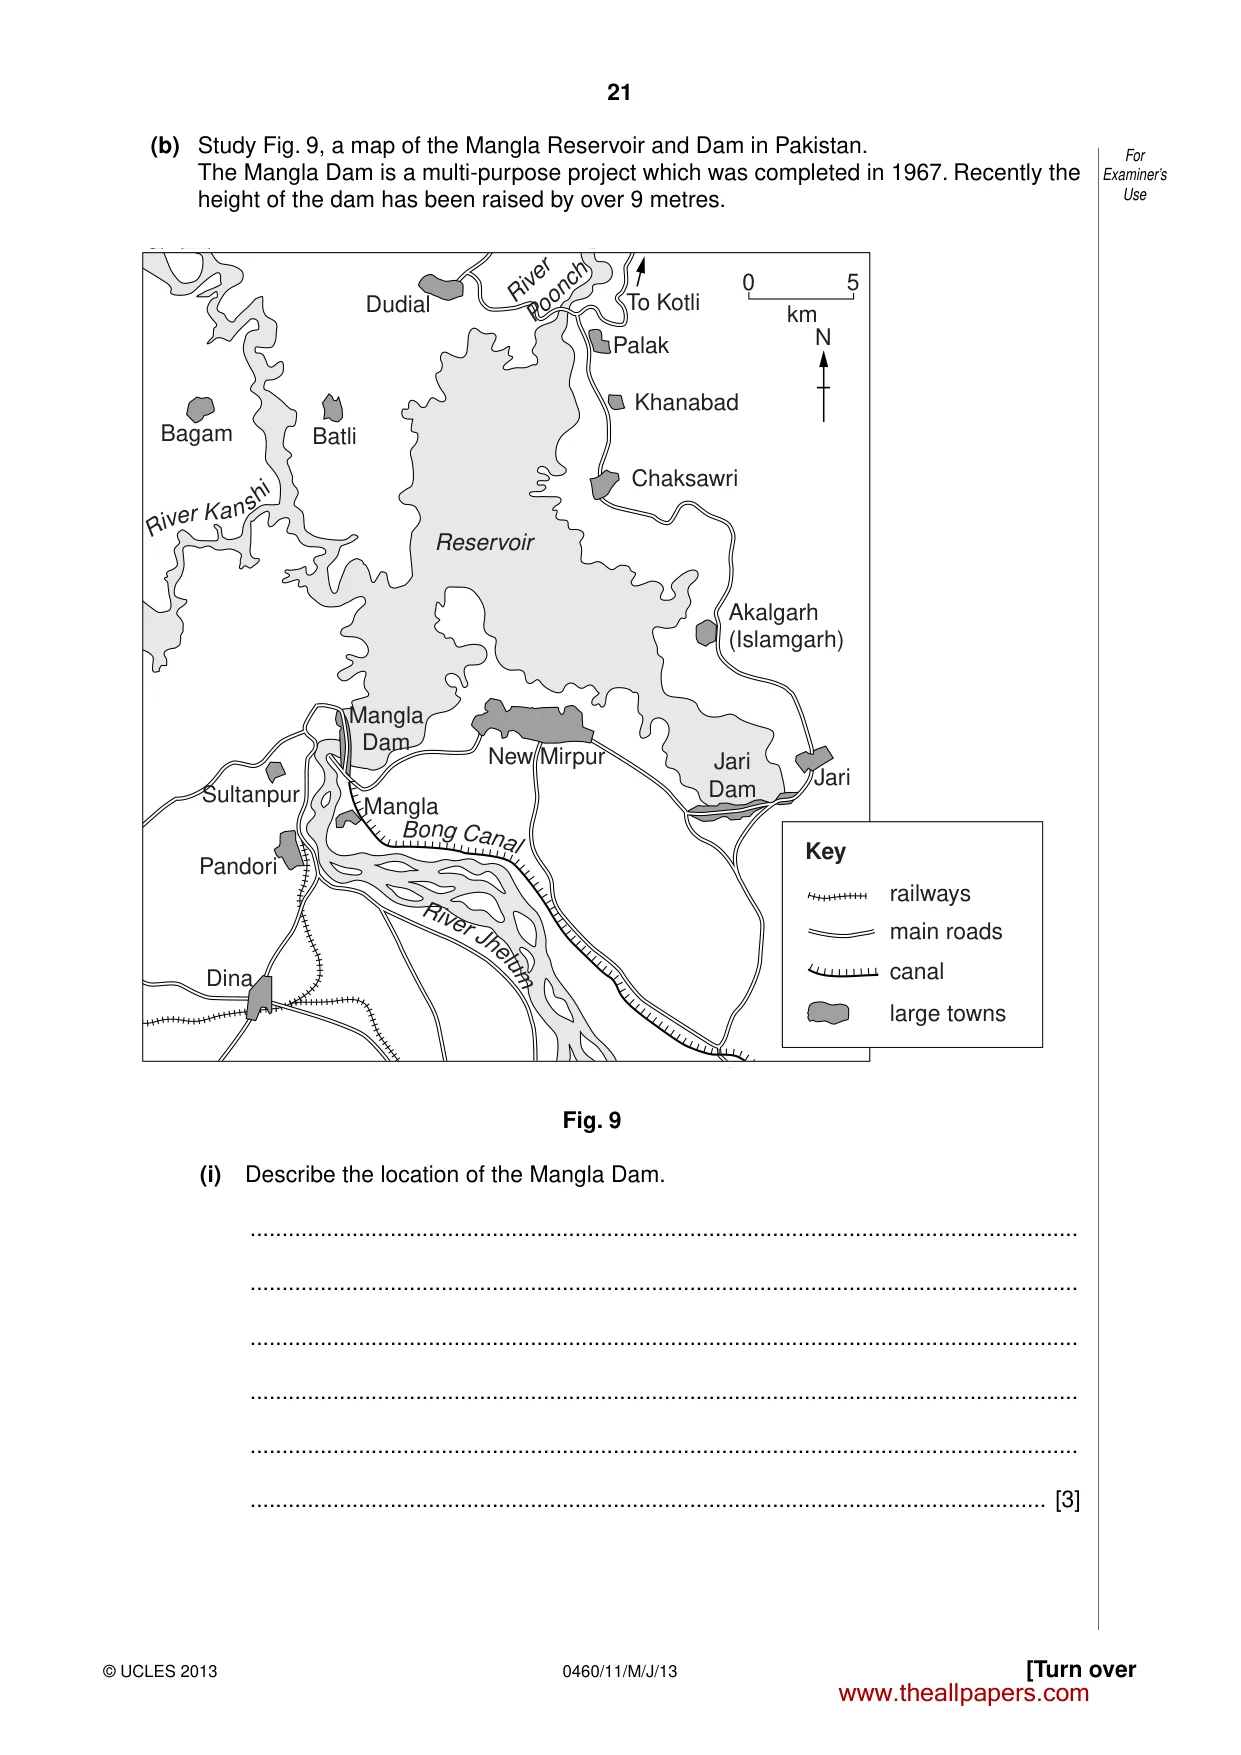
21 0460/11/M/J/13 © UCLES 2013 [Turn over For Examiner’s Use (b) Study Fig. 9, a map of the Mangla Reservoir and Dam in Pakistan. The Mangla Dam is a multi-purpose project which was completed in 1967. Recently the height of the dam has been raised by over 9 metres. Bagam Batli Dudial Palak Khanabad Chaksawri Akalgarh (Islamgarh) Jari Mangla New Mirpur Sultanpur Pandori Dina Jari Dam Mangla Dam Reservoir R i v e r Ka n s hi To Kotli N 5 0 km B o n g Ca n al Ri ve r J h e l u m River Poonch Key railways main roads canal large towns Fig. 9 (i) Describe the location of the Mangla Dam. … … … … … … [3] www.theallpapers.com
Question paper, page 22
22 0460/11/M/J/13 © UCLES 2013 For Examiner’s Use (ii) Suggest the benefits and problems of increasing the height of the Mangla Dam for people living in the area shown in Fig. 9. … … … … … … … … … … [5] (c) Name an example of a sea, lake or river which has been polluted by human activity. Describe the causes of pollution and its effects on the natural environment. Name of sea, lake or river … … … … … … … … … … … … … … … [7] [Total: 25 marks] END OF QUESTION 5 www.theallpapers.com
Question paper, page 23
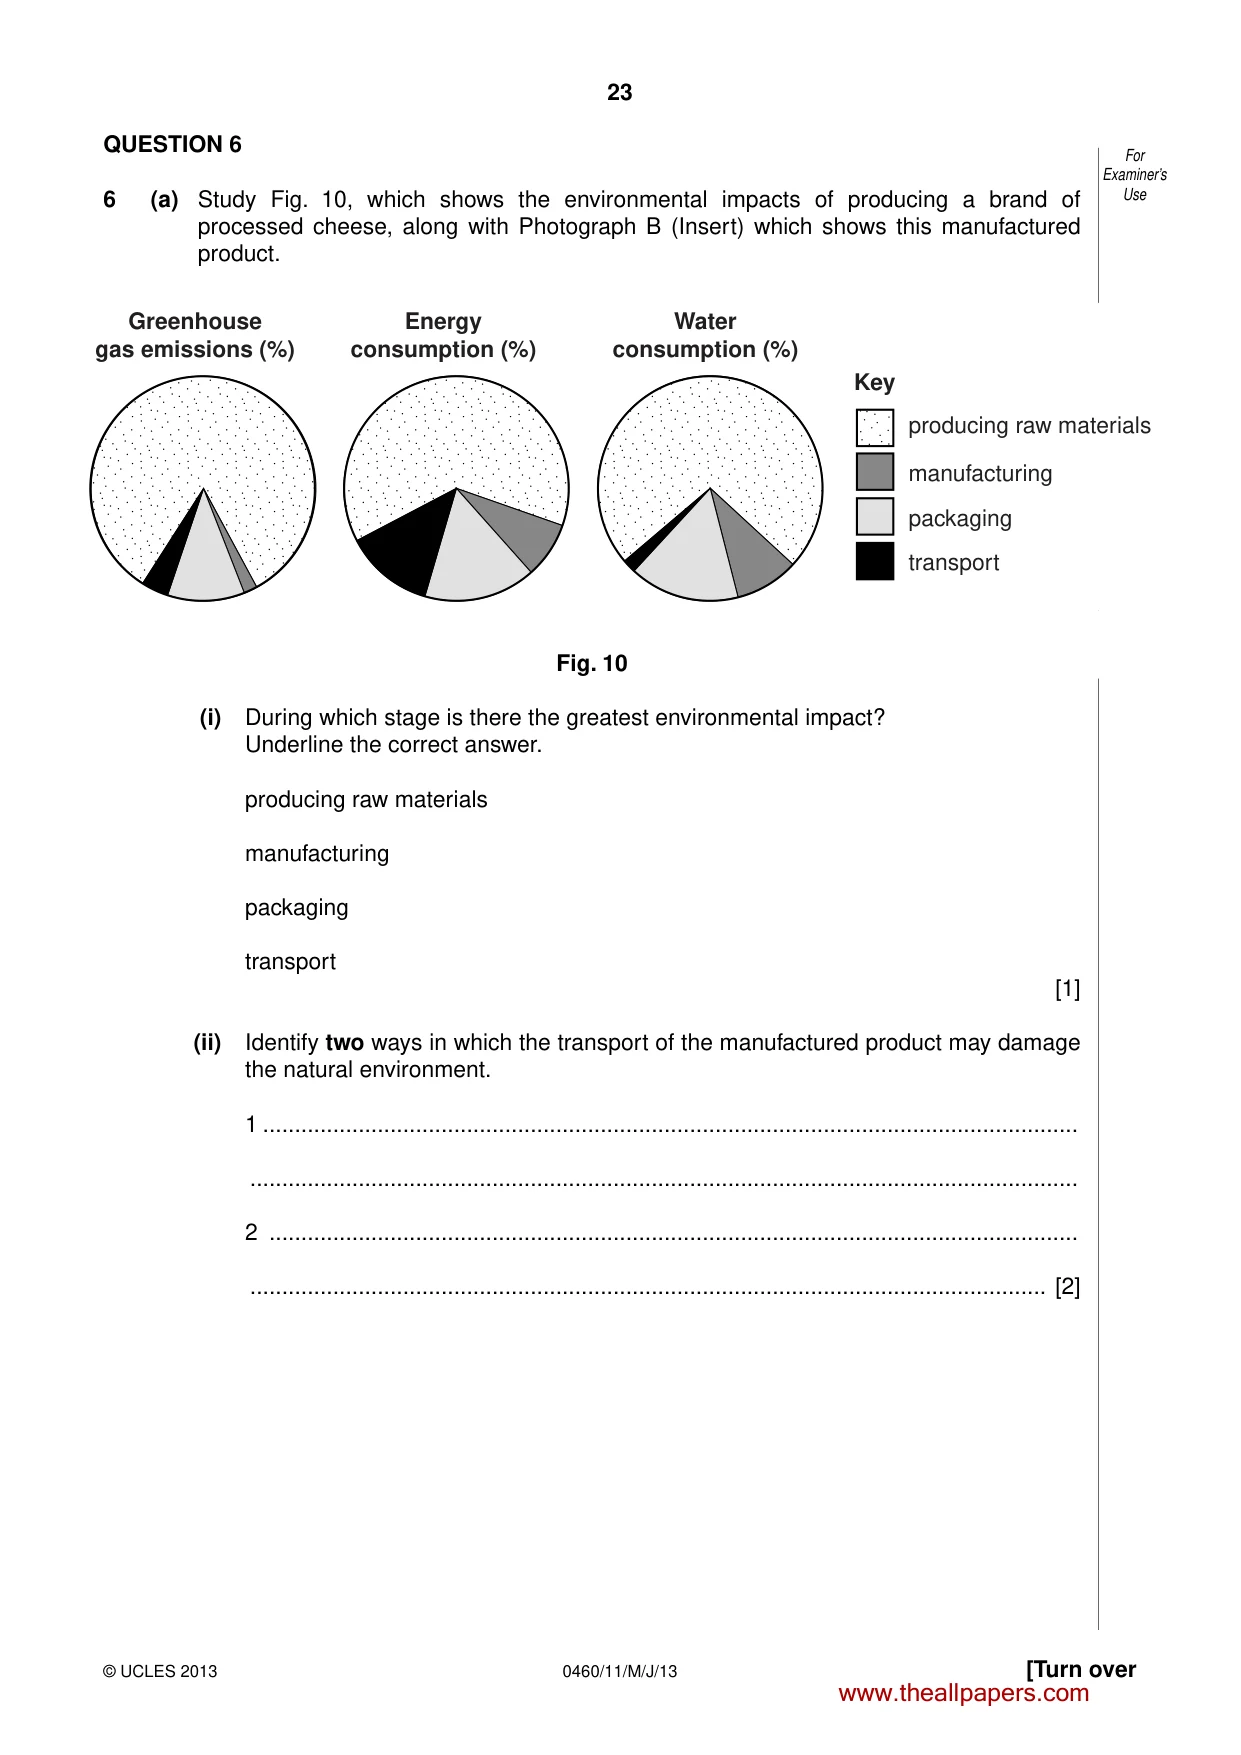
23 0460/11/M/J/13 © UCLES 2013 [Turn over For Examiner’s Use QUESTION 6 6 (a) Study Fig. 10, which shows the environmental impacts of producing a brand of processed cheese, along with Photograph B (Insert) which shows this manufactured product. producing raw materials manufacturing packaging transport Greenhouse gas emissions (%) Energy consumption (%) Water consumption (%) Key Fig. 10 (i) During which stage is there the greatest environmental impact? Underline the correct answer. producing raw materials manufacturing packaging transport [1] (ii) Identify two ways in which the transport of the manufactured product may damage the natural environment. 1 … … 2 … … [2] www.theallpapers.com
Question paper, page 24
24 0460/11/M/J/13 © UCLES 2013 For Examiner’s Use (iii) Suggest three ways in which the environmental impacts of producing and transporting this manufactured product could be reduced. 1 … … 2 … … 3 … … [3] (iv) Explain how greenhouse gas emissions may cause an increase in global temperatures. … … … … … … … … [4] www.theallpapers.com
Question paper, page 25
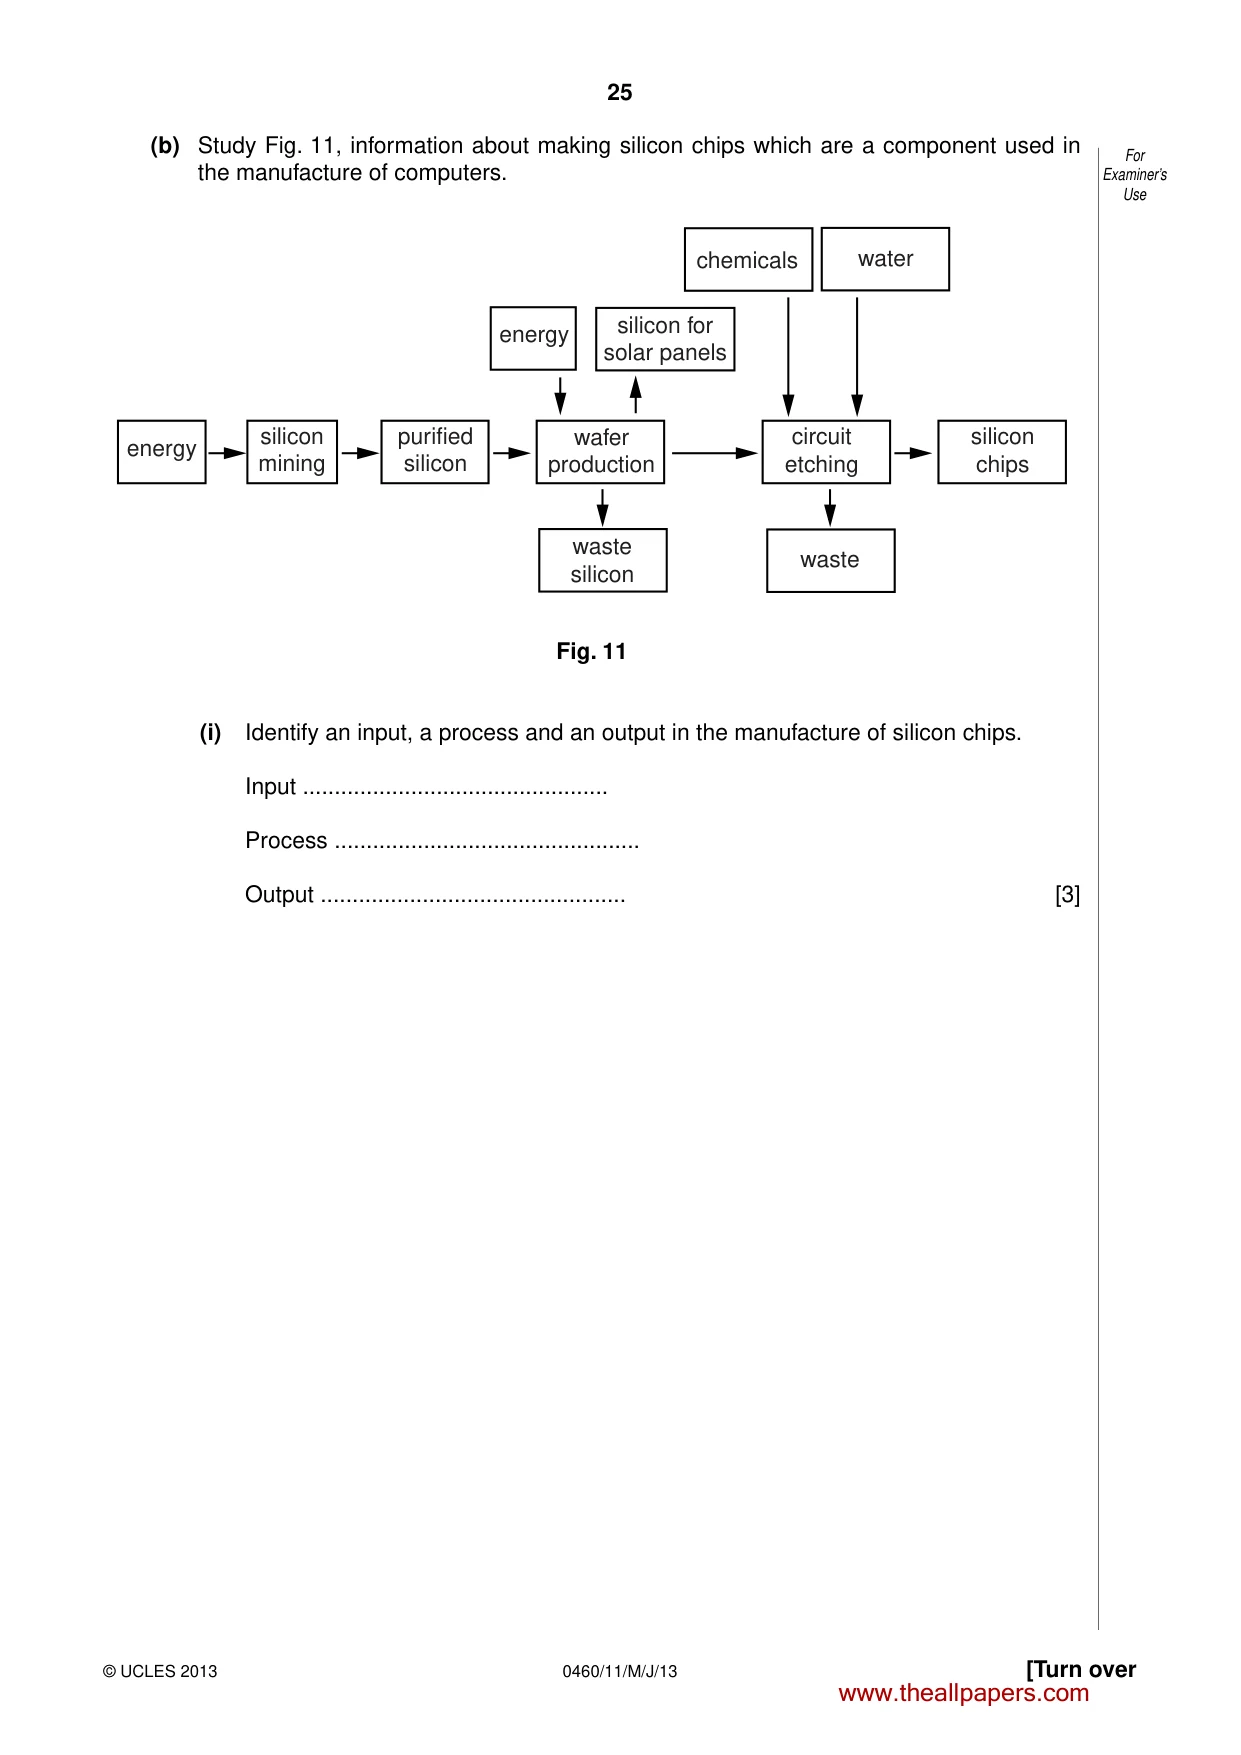
25 0460/11/M/J/13 © UCLES 2013 [Turn over For Examiner’s Use (b) Study Fig. 11, information about making silicon chips which are a component used in the manufacture of computers. wafer production energy energy silicon for solar panels silicon mining silicon chips purified silicon water chemicals waste silicon waste circuit etching Fig. 11 (i) Identify an input, a process and an output in the manufacture of silicon chips. Input … Process … Output … [3] www.theallpapers.com
Question paper, page 26
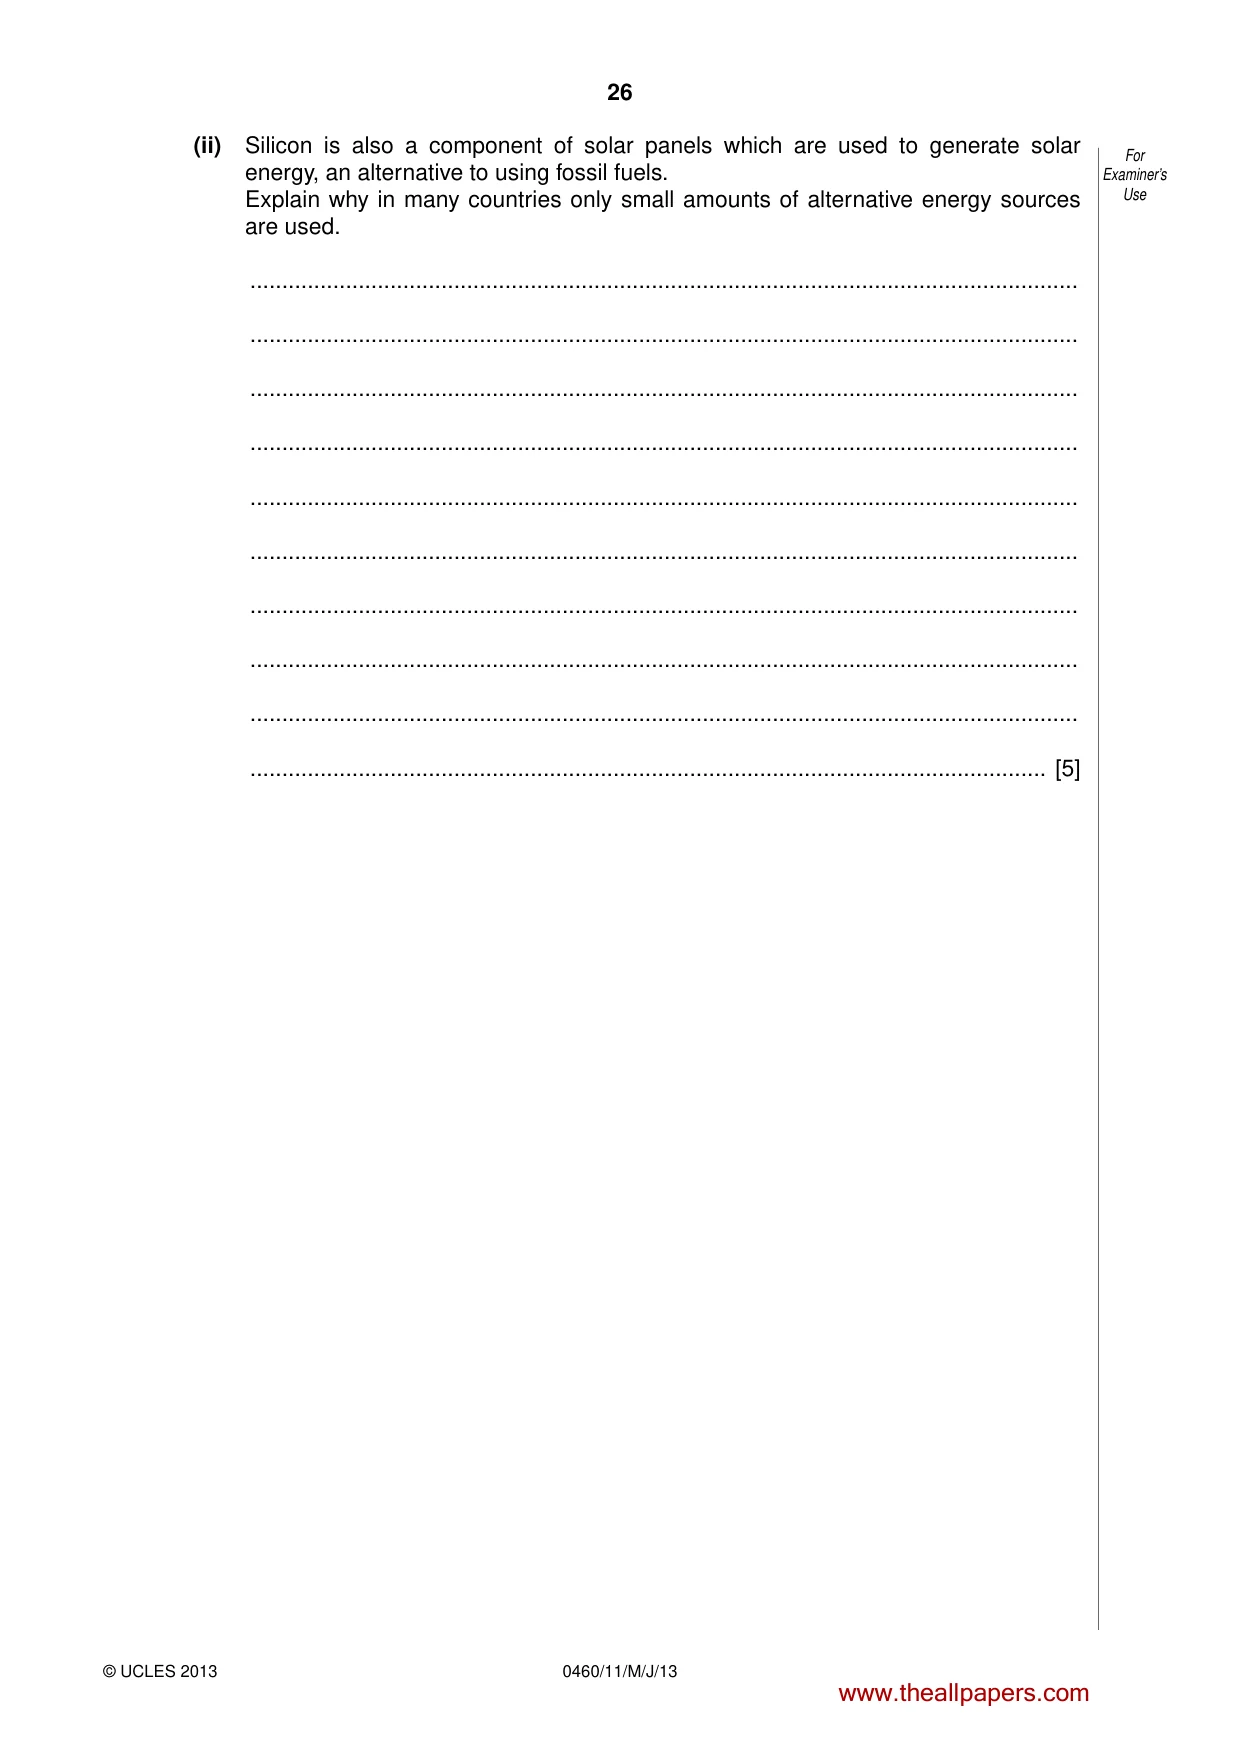
26 0460/11/M/J/13 © UCLES 2013 For Examiner’s Use (ii) Silicon is also a component of solar panels which are used to generate solar energy, an alternative to using fossil fuels. Explain why in many countries only small amounts of alternative energy sources are used. … … … … … … … … … … [5] www.theallpapers.com
Question paper, page 27
27 0460/11/M/J/13 © UCLES 2013 [Turn over For Examiner’s Use (c) Name an area where manufacturing or processing industry is important and give an example of a type of industry (or factory) which you have studied in that area. Explain the reasons for its growth at that location. Name of area … Type of industry … … … … … … … … … … … … … … [7] [Total: 25 marks] END OF QUESTION 6 www.theallpapers.com
Question paper, page 28
28 0460/11/M/J/13 © UCLES 2013 For Examiner’s Use Additional Page If you use the following lined page to complete the answer(s) to any question(s), the question number(s) must be clearly shown. … … … … … … … … … … … … … … … … … … … Copyright Acknowledgements: Question 2 Fig. 4 © adapted: Slums Graph; http://filipspagnoli.wordpress.com/stats-on-human-rights/statistics-on-poverty/statistics-on-poverty- urbanization-and-slums. Question 4 Photograph A S Sibley © UCLES. Question 5 Fig. 9 © adapted: Wideworld Magazine; Philip Allan Publishers; April 1997. Question 6 Fig. 10 © adapted: http://www.groupe-bel.com/bebel/en/corporate-social-responsibility/sustainable-development-2-3/environment-and- ecodesign.html. Question 6 Fig. 11 © adapted: http://cartanova.ca/green-business-blog/item/71-the-environmental-impact-of-the-internet. Question 6 Photograph B S Sibley © UCLES. Permission to reproduce items where third-party owned material protected by copyright is included has been sought and cleared where possible. Every reasonable effort has been made by the publisher (UCLES) to trace copyright holders, but if any items requiring clearance have unwittingly been included, the publisher will be pleased to make amends at the earliest possible opportunity. University of Cambridge International Examinations is part of the Cambridge Assessment Group. Cambridge Assessment is the brand name of University of Cambridge Local Examinations Syndicate (UCLES), which is itself a department of the University of Cambridge. www.theallpapers.com
Mark scheme, page 1
CAMBRIDGE INTERNATIONAL EXAMINATIONS International General Certificate of Secondary Education MARK SCHEME for the May/June 2013 series 0460 GEOGRAPHY 0460/11 Paper 1, maximum raw mark 75 This mark scheme is published as an aid to teachers and candidates, to indicate the requirements of the examination. It shows the basis on which Examiners were instructed to award marks. It does not indicate the details of the discussions that took place at an Examiners’ meeting before marking began, which would have considered the acceptability of alternative answers. Mark schemes should be read in conjunction with the question paper and the Principal Examiner Report for Teachers. Cambridge will not enter into discussions about these mark schemes. Cambridge is publishing the mark schemes for the May/June 2013 series for most IGCSE, GCE Advanced Level and Advanced Subsidiary Level components and some Ordinary Level components. www.theallpapers.com
Mark scheme, page 2
Page 2 Mark Scheme Syllabus Paper IGCSE – May/June 2013 0460 11 © Cambridge International Examinations 2013 1 (a) (i) Population of working age/aged 15 to 64/people who work/people who can sustain themselves/people who pay taxes/can financially provide for themselves; [1] [1] (ii) A Smaller or less % in Mexico at 65+ or any appropriate age group (old dependents/elderly/old people)/larger % at 65+ (or any appropriate age group) in United States; United States pyramid has wider apex/top to pyramid/Mexico has narrower apex/or could use appropriate comparative statistics; etc. B Smaller or less percentage of population in younger age groups/young dependents in United States/wider base to Mexican pyramid; etc. NB must look for comparatives. [2 × 1] [2] (iii) Candidates should compare here though we should link together two discrete accounts providing they are not simple repetition of figures without interpretation. Ideas such as: greater proportion of young dependents in Mexico/smaller proportion of young dependents in United States; about 2x/double percentage in Mexico than United States; about 44–47% of population of Mexico compared with about 22–24% of that of United States; e.g. 0–4 (or 5–9 or 10–14) 15/16% Mexico/7% United States (MAX 1 on any identified age band) [3 × 1] [3] (iv) Ideas such as: high birth rates; little availability of contraception/birth control/or examples; not educated re: contraception; not likely to be able to afford contraception; likely to want children to work on the land/farms; likely to want children to send out to work/earn money; likely to want children to help around the house/look after younger children/collect water; likely to want children to look after parents in old age; not likely to be affected by government policy to reduce family size; likely to have large families due to tradition/wealth/to get a son; likely to have large families due to religious influences/religion does not allow contraception; no access to abortion; high infant mortality rates/people have more children in the hope that some will survive; women stay in the home/don’t work; high death rates/low life expectancy; poor health care; poor sanitation; low water quality; lack of care homes/care for elderly; AIDS; etc. [4 × 1] [4] www.theallpapers.com
Mark scheme, page 3
Page 3 Mark Scheme Syllabus Paper IGCSE – May/June 2013 0460 11 © Cambridge International Examinations 2013 (b) (i) Ideas such as: population over 75 is expected to increase or rise by 2031 in UK/there will be more of them in 2031; increase is expected to be rapid after 2021/more than period before 2021/by 0.5m between 2011–2021 and 2m by 2031; expected to rise from 4.4 to 6.8 million (by 2.7 million); allow tolerance of 4.4–4.5 to 6.8–6.9 (increase by 2.3–2.5) increase by 57% from 2011 to 2031; [3 × 1] [3] (ii) Ideas such as: strain on working population/economy/government; economically active/government have to support/take care of/look after more people; higher taxation; have to pay for pensions; more money to be spent on health care/more health care needed; need to establish/spend money on care homes/specified service for the elderly; fewer workers available/older people do not contribute to economy/older people do not work; reduced supply of workers leads to increase in wages; people have to retire later; more immigration; less people to defend country; facilities for young people close/money taken away from schools; longer waiting list in hospitals; lack of innovation; etc. [5 × 1 mark or development] [5] (c) Levels marking Level 1 (1–3 marks) Statements including limited detail describing the impacts of policies which have been used to influence growth rates. Level 2 (4–6 marks) Uses named example. More developed statements describing the impacts of policies which have been used to influence growth rates. (NB MAX 5 MARKS WITH NO EXAMPLE) Level 3 (7 marks) Uses named example Comprehensive and accurate statements describing the impacts of policies which have been used to influence growth rates including some place specific reference. Answers are likely to refer to impacts such as: changing population growth imbalance in population structure and result of it advantages/disadvantages of policy subsequent policies Advantages of incentives [7] [Total: 25] www.theallpapers.com
Mark scheme, page 4
Page 4 Mark Scheme Syllabus Paper IGCSE – May/June 2013 0460 11 © Cambridge International Examinations 2013 2 (a) (i) Asia [1] [1] (ii) Ideas such as: in South/South East Asia/India & China; distribution is uneven/there are clusters in some parts of the world; a lot/many/most cities of 5million+ are in northern hemisphere; there are more in LEDCs than MEDCs; they are widespread; there are some in all continents except Australasia; a lot/many/most are on or near to coasts; [2 × 1] [2] (iii) A Ideas such as: birth rates exceed death rates/high birth rate and low death rate; reduction of death rates; life expectancy increased; [3 × 1] [3] B Ideas such as: lots of/many people move there/migrate into; from rural areas/from other countries; due to better work opportunities/higher paid jobs; better health care; improved sanitation; better water supplies; education opportunities; natural disaster or example; war; etc. NB MAX 3 marks for push or pull factors. [4 × 1] [4] (b) (i) A China B Bangladesh C Iraq [3 × 1] [3] (ii) Ideas such as: many people are unable to obtain jobs/unemployed; or they work for low pay/in informal sector; so cannot afford better housing/so forced to live in slums (dev)/so build own houses (dev); inadequate investment in housing stock/not enough houses; as authorities cannot cope with increases in population; due to other government/local authority priorities; lack of building space; etc. [5 × 1 mark or development] [5] www.theallpapers.com
Mark scheme, page 5
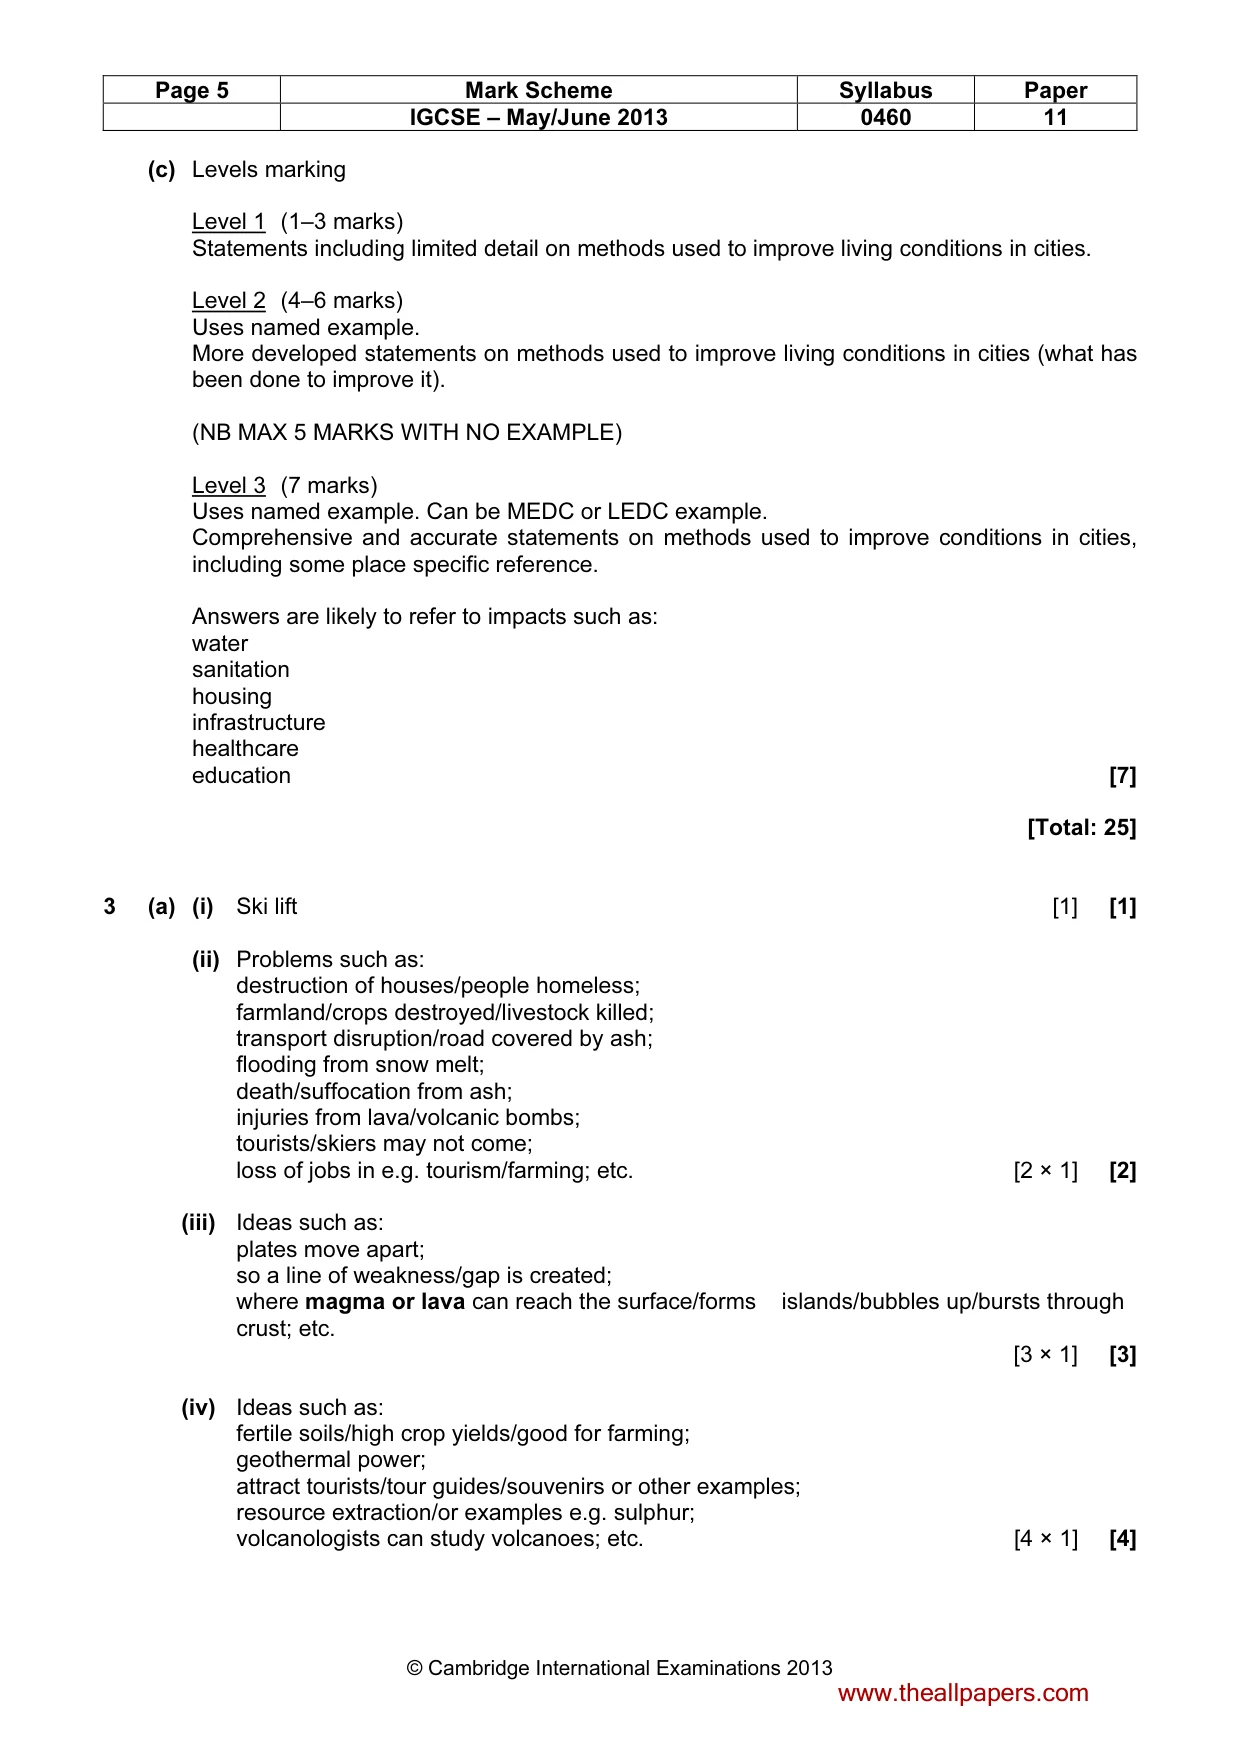
Page 5 Mark Scheme Syllabus Paper IGCSE – May/June 2013 0460 11 © Cambridge International Examinations 2013 (c) Levels marking Level 1 (1–3 marks) Statements including limited detail on methods used to improve living conditions in cities. Level 2 (4–6 marks) Uses named example. More developed statements on methods used to improve living conditions in cities (what has been done to improve it). (NB MAX 5 MARKS WITH NO EXAMPLE) Level 3 (7 marks) Uses named example. Can be MEDC or LEDC example. Comprehensive and accurate statements on methods used to improve conditions in cities, including some place specific reference. Answers are likely to refer to impacts such as: water sanitation housing infrastructure healthcare education [7] [Total: 25] 3 (a) (i) Ski lift [1] [1] (ii) Problems such as: destruction of houses/people homeless; farmland/crops destroyed/livestock killed; transport disruption/road covered by ash; flooding from snow melt; death/suffocation from ash; injuries from lava/volcanic bombs; tourists/skiers may not come; loss of jobs in e.g. tourism/farming; etc. [2 × 1] [2] (iii) Ideas such as: plates move apart; so a line of weakness/gap is created; where magma or lava can reach the surface/forms islands/bubbles up/bursts through crust; etc. [3 × 1] [3] (iv) Ideas such as: fertile soils/high crop yields/good for farming; geothermal power; attract tourists/tour guides/souvenirs or other examples; resource extraction/or examples e.g. sulphur; volcanologists can study volcanoes; etc. [4 × 1] [4] www.theallpapers.com
Mark scheme, page 6
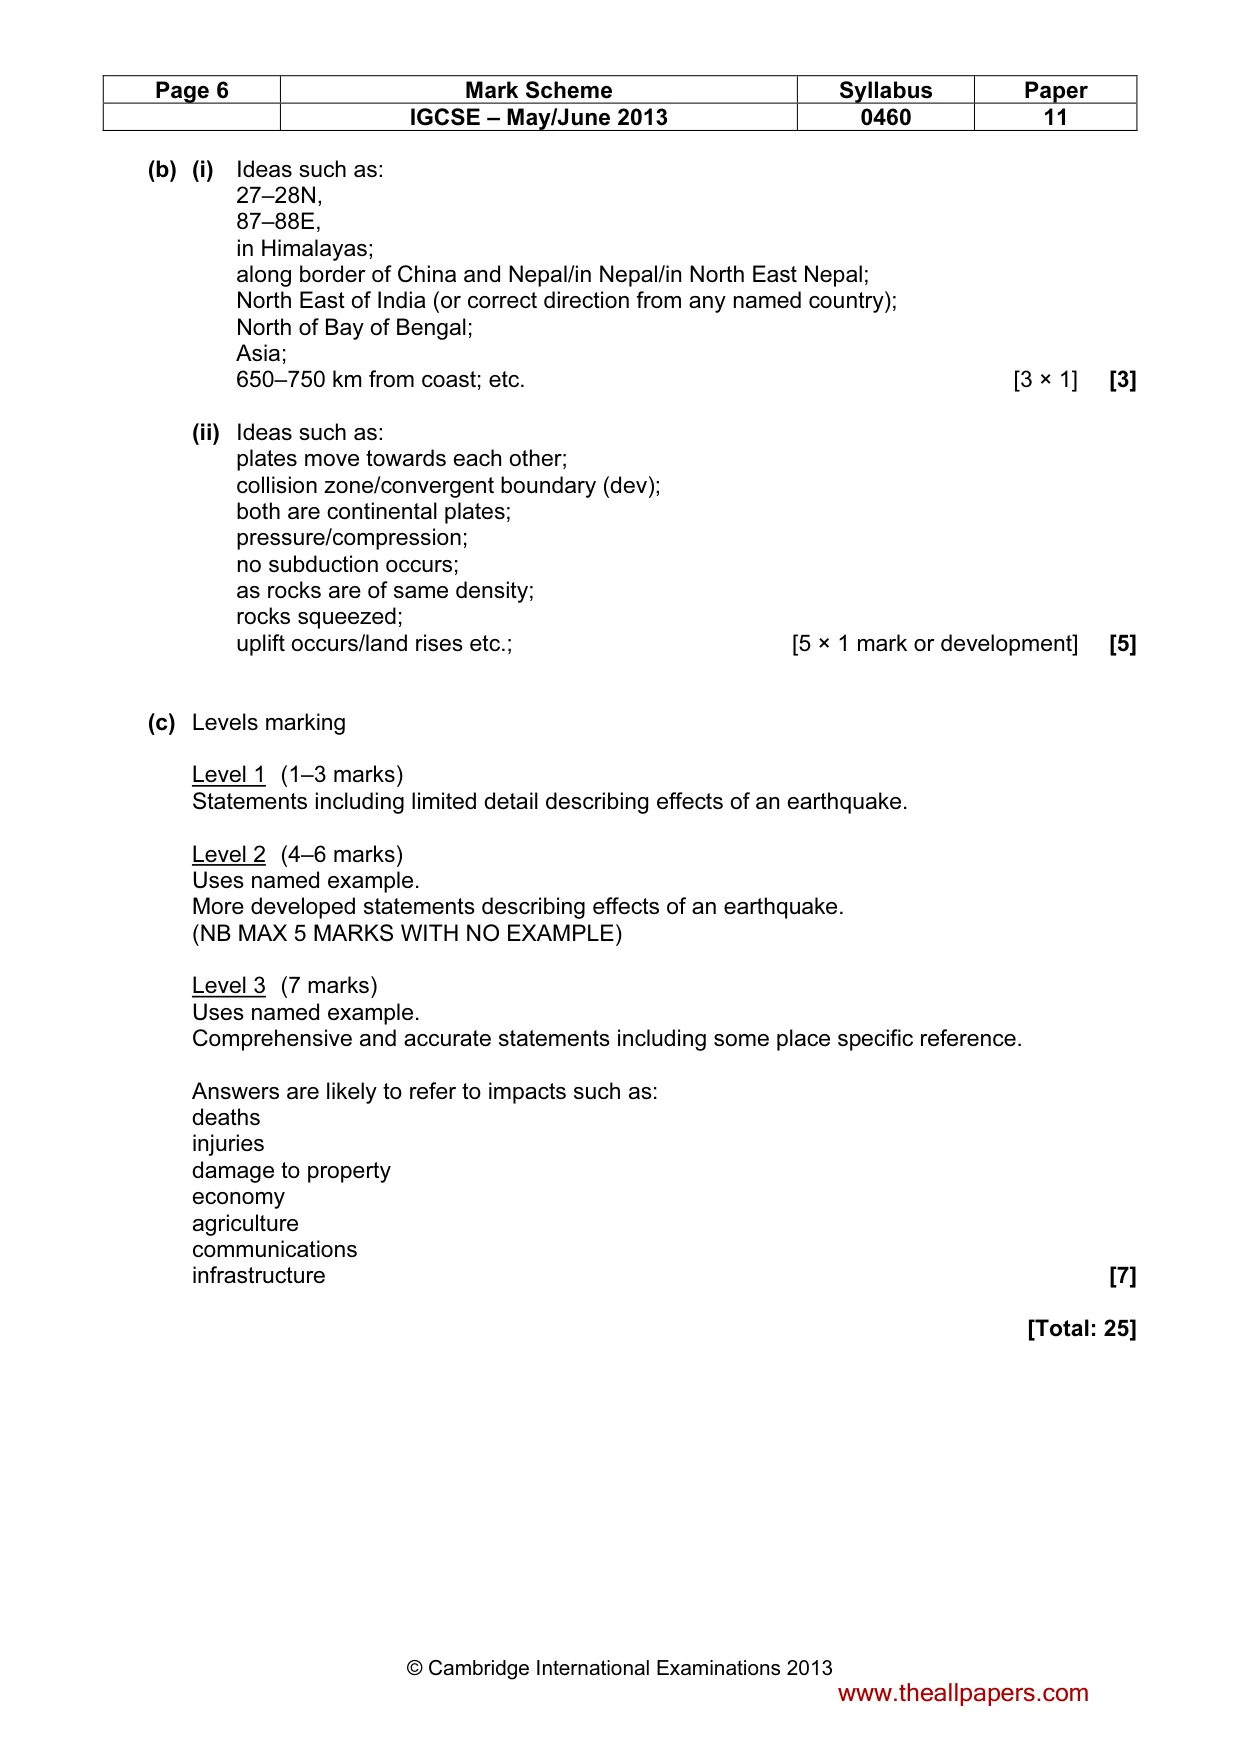
Page 6 Mark Scheme Syllabus Paper IGCSE – May/June 2013 0460 11 © Cambridge International Examinations 2013 (b) (i) Ideas such as: 27–28N, 87–88E, in Himalayas; along border of China and Nepal/in Nepal/in North East Nepal; North East of India (or correct direction from any named country); North of Bay of Bengal; Asia; 650–750 km from coast; etc. [3 × 1] [3] (ii) Ideas such as: plates move towards each other; collision zone/convergent boundary (dev); both are continental plates; pressure/compression; no subduction occurs; as rocks are of same density; rocks squeezed; uplift occurs/land rises etc.; [5 × 1 mark or development] [5] (c) Levels marking Level 1 (1–3 marks) Statements including limited detail describing effects of an earthquake. Level 2 (4–6 marks) Uses named example. More developed statements describing effects of an earthquake. (NB MAX 5 MARKS WITH NO EXAMPLE) Level 3 (7 marks) Uses named example. Comprehensive and accurate statements including some place specific reference. Answers are likely to refer to impacts such as: deaths injuries damage to property economy agriculture communications infrastructure [7] [Total: 25] www.theallpapers.com
Mark scheme, page 7
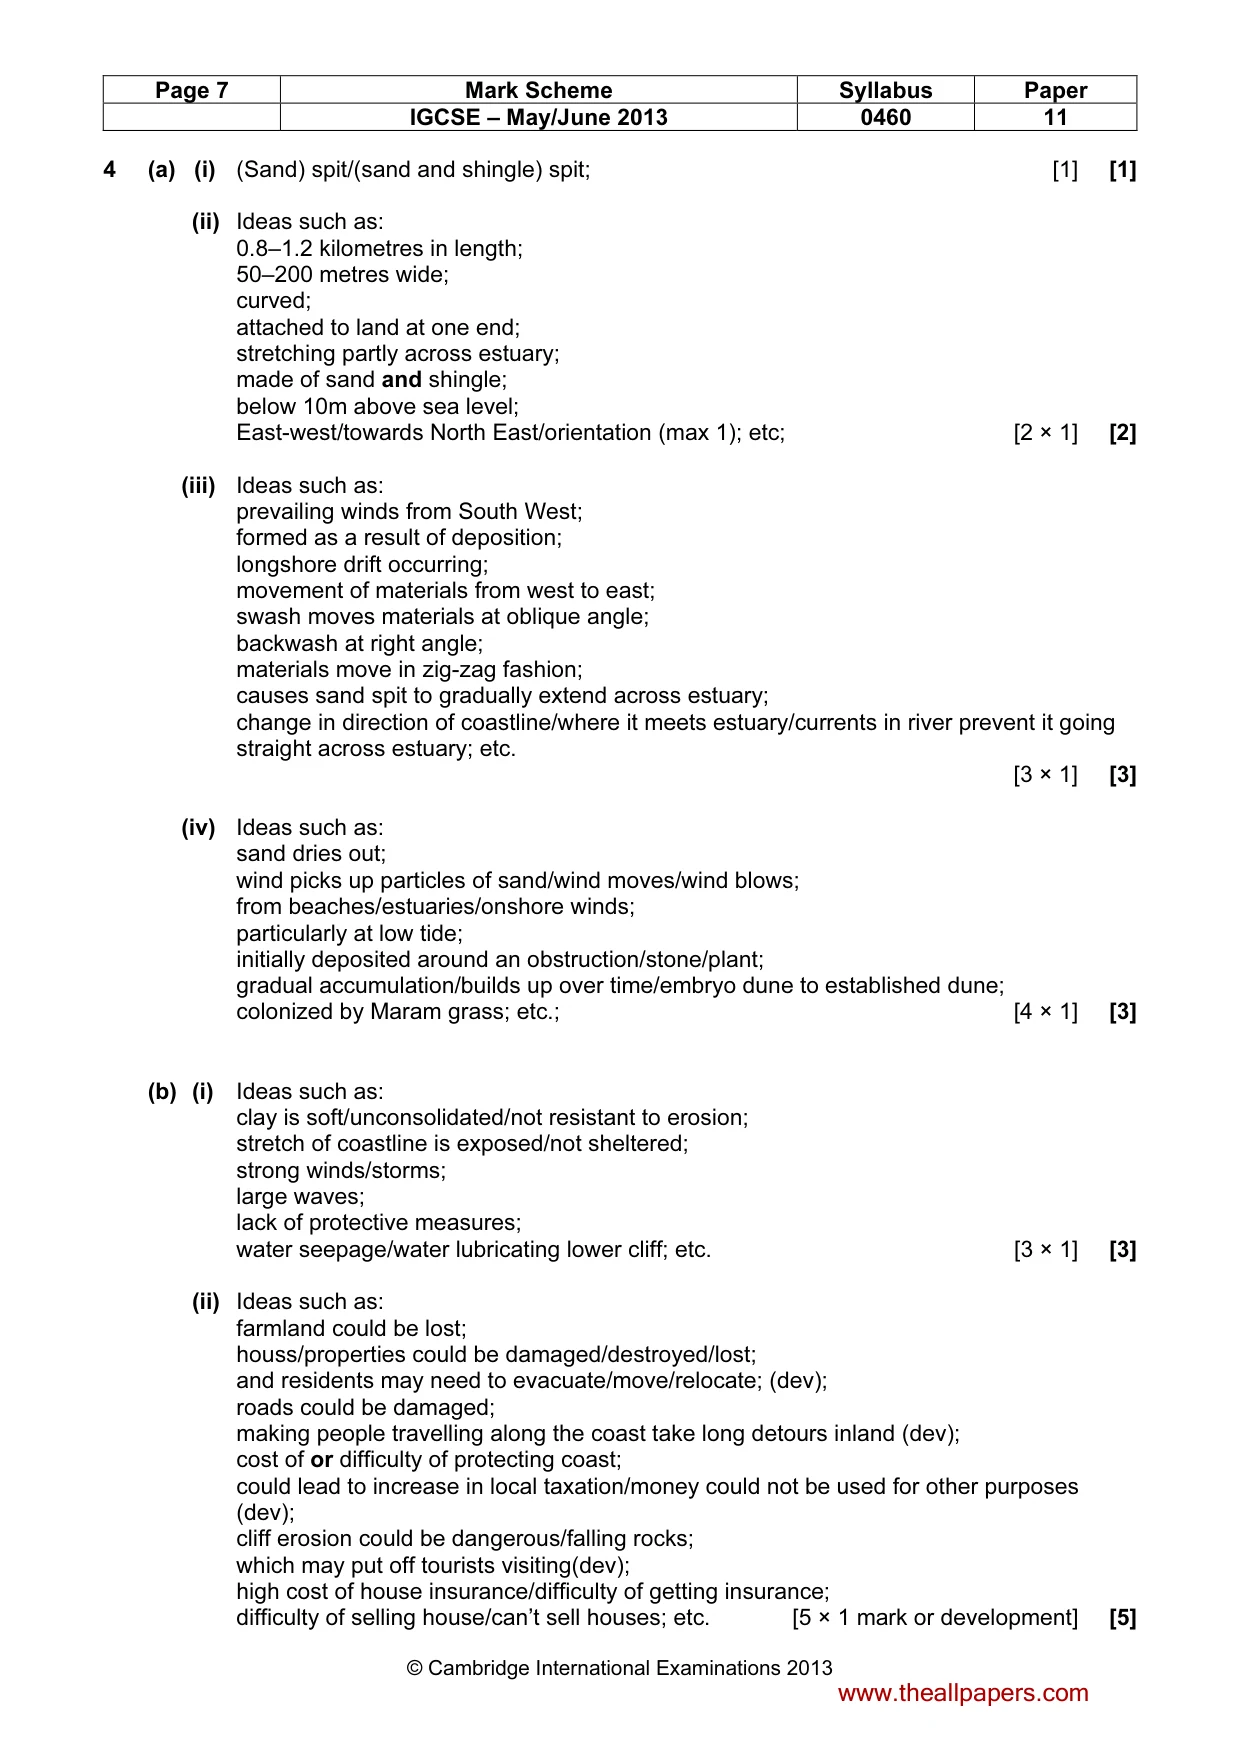
Page 7 Mark Scheme Syllabus Paper IGCSE – May/June 2013 0460 11 © Cambridge International Examinations 2013 4 (a) (i) (Sand) spit/(sand and shingle) spit; [1] [1] (ii) Ideas such as: 0.8–1.2 kilometres in length; 50–200 metres wide; curved; attached to land at one end; stretching partly across estuary; made of sand and shingle; below 10m above sea level; East-west/towards North East/orientation (max 1); etc; [2 × 1] [2] (iii) Ideas such as: prevailing winds from South West; formed as a result of deposition; longshore drift occurring; movement of materials from west to east; swash moves materials at oblique angle; backwash at right angle; materials move in zig-zag fashion; causes sand spit to gradually extend across estuary; change in direction of coastline/where it meets estuary/currents in river prevent it going straight across estuary; etc. [3 × 1] [3] (iv) Ideas such as: sand dries out; wind picks up particles of sand/wind moves/wind blows; from beaches/estuaries/onshore winds; particularly at low tide; initially deposited around an obstruction/stone/plant; gradual accumulation/builds up over time/embryo dune to established dune; colonized by Maram grass; etc.; [4 × 1] [3] (b) (i) Ideas such as: clay is soft/unconsolidated/not resistant to erosion; stretch of coastline is exposed/not sheltered; strong winds/storms; large waves; lack of protective measures; water seepage/water lubricating lower cliff; etc. [3 × 1] [3] (ii) Ideas such as: farmland could be lost; houss/properties could be damaged/destroyed/lost; and residents may need to evacuate/move/relocate; (dev); roads could be damaged; making people travelling along the coast take long detours inland (dev); cost of or difficulty of protecting coast; could lead to increase in local taxation/money could not be used for other purposes (dev); cliff erosion could be dangerous/falling rocks; which may put off tourists visiting(dev); high cost of house insurance/difficulty of getting insurance; difficulty of selling house/can’t sell houses; etc. [5 × 1 mark or development] [5] www.theallpapers.com
Mark scheme, page 8
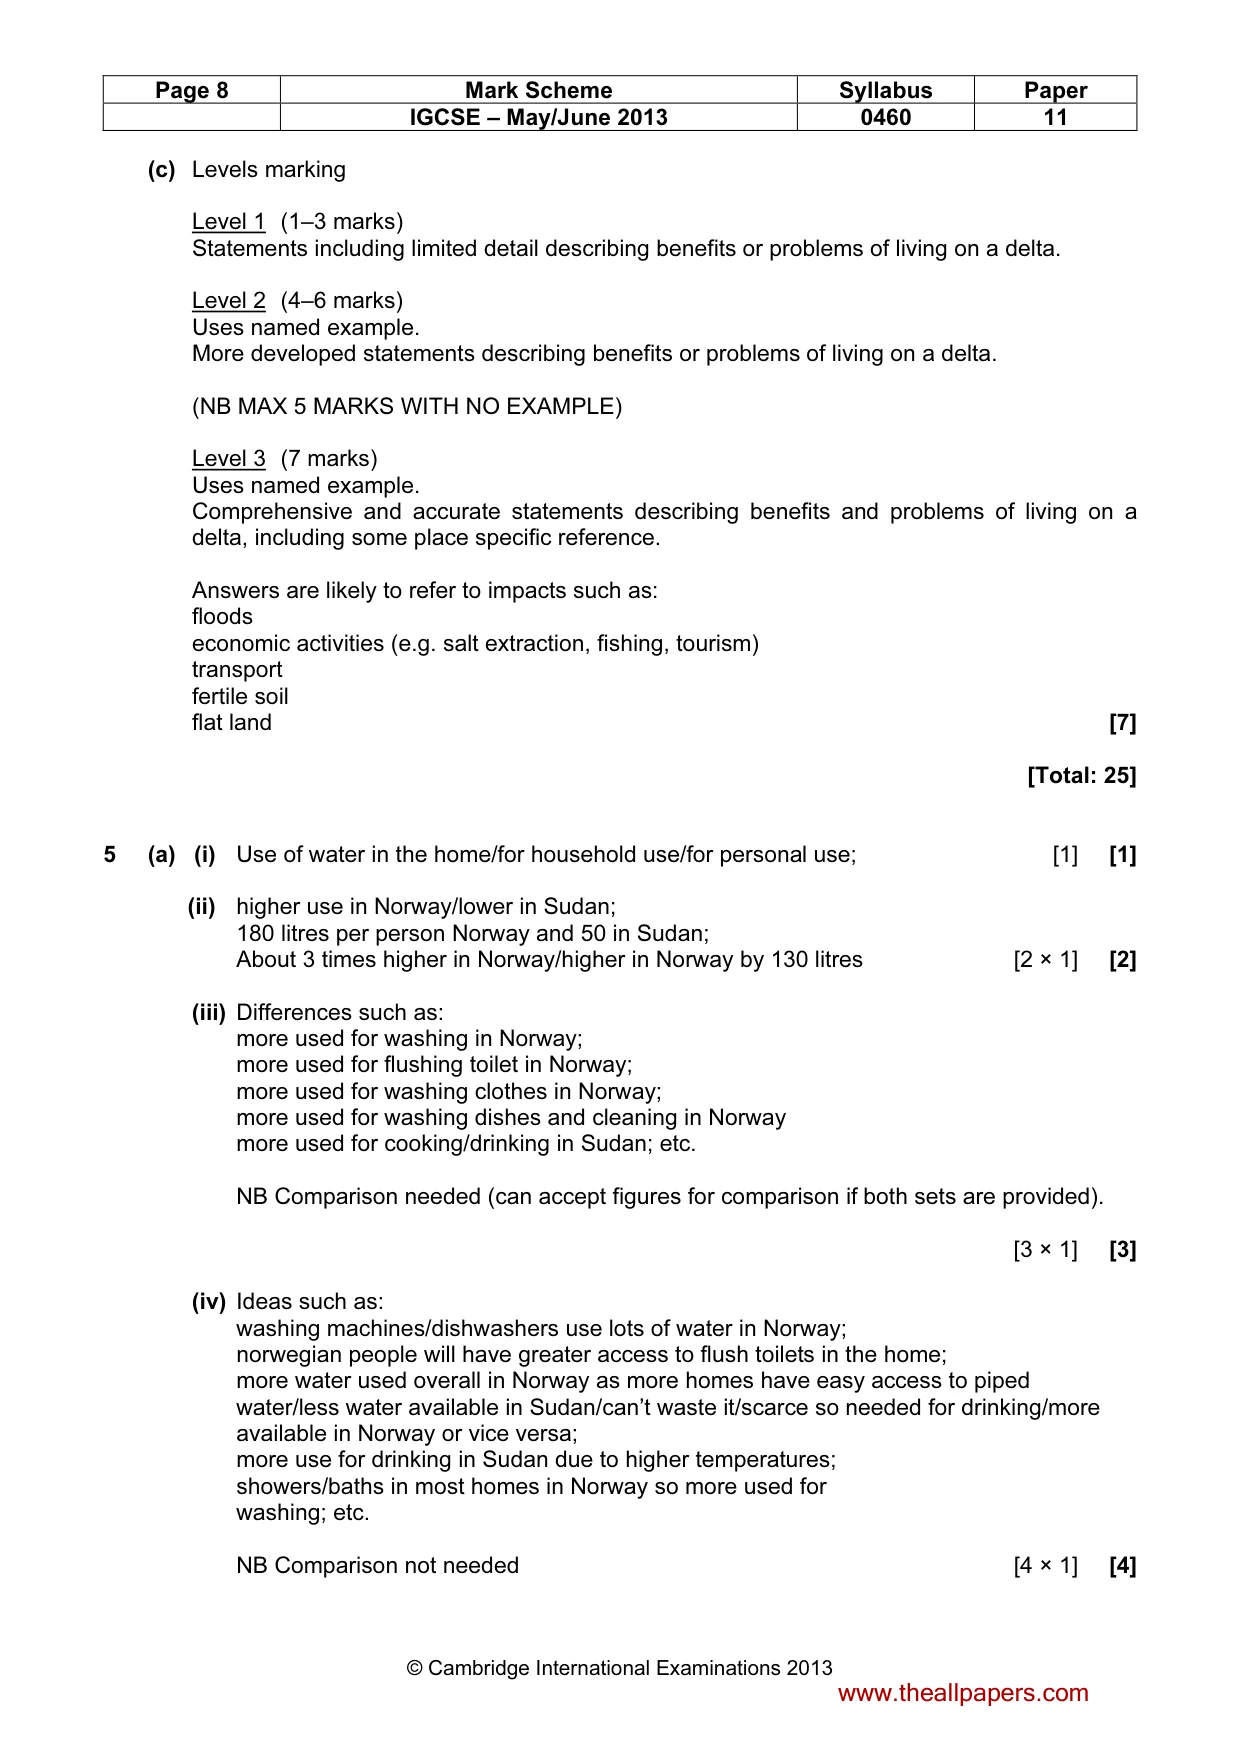
Page 8 Mark Scheme Syllabus Paper IGCSE – May/June 2013 0460 11 © Cambridge International Examinations 2013 (c) Levels marking Level 1 (1–3 marks) Statements including limited detail describing benefits or problems of living on a delta. Level 2 (4–6 marks) Uses named example. More developed statements describing benefits or problems of living on a delta. (NB MAX 5 MARKS WITH NO EXAMPLE) Level 3 (7 marks) Uses named example. Comprehensive and accurate statements describing benefits and problems of living on a delta, including some place specific reference. Answers are likely to refer to impacts such as: floods economic activities (e.g. salt extraction, fishing, tourism) transport fertile soil flat land [7] [Total: 25] 5 (a) (i) Use of water in the home/for household use/for personal use; [1] [1] (ii) higher use in Norway/lower in Sudan; 180 litres per person Norway and 50 in Sudan; About 3 times higher in Norway/higher in Norway by 130 litres [2 × 1] [2] (iii) Differences such as: more used for washing in Norway; more used for flushing toilet in Norway; more used for washing clothes in Norway; more used for washing dishes and cleaning in Norway more used for cooking/drinking in Sudan; etc. NB Comparison needed (can accept figures for comparison if both sets are provided). [3 × 1] [3] (iv) Ideas such as: washing machines/dishwashers use lots of water in Norway; norwegian people will have greater access to flush toilets in the home; more water used overall in Norway as more homes have easy access to piped water/less water available in Sudan/can’t waste it/scarce so needed for drinking/more available in Norway or vice versa; more use for drinking in Sudan due to higher temperatures; showers/baths in most homes in Norway so more used for washing; etc. NB Comparison not needed [4 × 1] [4] www.theallpapers.com
Mark scheme, page 9
Page 9 Mark Scheme Syllabus Paper IGCSE – May/June 2013 0460 11 © Cambridge International Examinations 2013 (b) (i) Ideas such as: north of Mangla; 2/3 km (north of Mangla); South western corner of reservoir; Where River Jhelum flows from reservoir; At northern end of Bangla Canal; etc. NB Credit accurate distance and/or direction from any named feature. [3 × 1] [3] (ii) benefits such as: increased storage of water; therefore less likely to be shortages (dev); employment in construction; increased electricity supplies can be generated; which may attract more manufacturing industry (dev); foreign investment attracted; improved flood protection for areas downstream; etc. problems such as: loss of farmland; vegetation/trees/deforestation for fruit or firewood (must have link to people) etc; greater visual impact of dams; need to re-route some of roads/flood roads; possible flooding of settlements/settlements relocated; therefore people need to be relocated (dev); extra noise/traffic/dust during construction (max 1); costs a lot so taxes increased; etc. [5 × 1 mark or development] [5] (c) Levels marking Level 1 (1–3 marks) Statements including limited detail describing the causes of pollution and/or its effects on the natural environment. Level 2 (4–6 marks) Uses named example. More developed statements describing the causes of pollution and/or its effects on the natural environment. (NB MAX 5 MARKS WITH NO EXAMPLE) Level 3 (7 marks) Uses named example. Comprehensive and accurate statements describing the causes of pollution and its effects on the natural environment, including some place specific reference. Answers are likely to refer to impacts such as: Causes: industry sewage agriculture domestic waste www.theallpapers.com
Mark scheme, page 10
Page 10 Mark Scheme Syllabus Paper IGCSE – May/June 2013 0460 11 © Cambridge International Examinations 2013 Effects: drinking water quality ecosystems food chains impacts on aquatic life [7] [Total: 25] 6 (a) (i) Production of raw materials [1] [1] (ii) Ideas such as: emissions/exhaust gases/greenhouse gases/named gases/air pollution; uses energy/uses fuel/depletes fuels/depletes oil; noise pollution from vehicles; deforestation/loss of habitats for road building; increased road kill or examples; etc. [2 × 1] [2] (iii) Ideas such as: use less packaging/recycled packaging; transport materials in bulk; produce raw materials close to factory; use renewable energy sources (or example); catalytic convertors/ use fuel efficient engines/bio fuels; conserve energy in factory by using…; recycle water; etc. [3 × 1] [3] (iv) Ideas such as: build up in atmosphere; let heat/sun`s rays through, bounces/reflects from earth’s surface; do not allow heat to escape; insulates/acts like a greenhouse; etc. [4 × 1] [4] (b) (i) Ideas such as: Input = energy/chemicals/water/silicon; Process = wafer production/circuit etching/purifying silicon; Output = waste silicon/waste water/silicon chips/waste; [3 × 1] [3] (iii) Ideas such as: few alternative energy sources are available or potentially available; some in early stages of development; limited technology in many areas; expense of development/set up; solar limited by environmental factors/lack of sunshine; wave/tidal limited to coastal locations; geothermal to volcanic regions; much of industry/transport geared up to using fossil fuels; government doesn’t prioritise renewable energy; etc. [5 × 1 mark or development] [5] www.theallpapers.com
Mark scheme, page 11
Page 11 Mark Scheme Syllabus Paper IGCSE – May/June 2013 0460 11 © Cambridge International Examinations 2013 (c) Levels marking Level 1 (1–3 marks) Statements including limited detail explaining location of manufacturing/processing industry. Level 2 (4–6 marks) Uses named example. More developed statements explaining location of manufacturing/processing industry. (NB MAX 5 MARKS WITH NO EXAMPLE) Level 3 (7 marks) Uses named example. Comprehensive and accurate statements including some place specific reference. Answers are likely to refer to impacts such as: large workforce good transport links cheap land raw materials energy supply water supply (market if relevant) [7] [Total: 25] www.theallpapers.com
What you needed in this session
Cambridge’s own grade thresholds for 2013 May/June, Paper 1 · Variant 1. A higher threshold means an easier paper — the bar moves with how the cohort did.