Cambridge IGCSE Geography 0460 — 2013 May/June Paper 1 · Variant 3
0460/13/M/J/13 · 75 marks · ≈84 min
The question paper and its mark scheme, free to read here and free to download. This is Cambridge’s own paper, exactly as it was sat.
Question paper28 pages


Mark scheme13 pages
Answers below. Sit the paper first if you are practising.
Paper as text
Question paper, page 1
This document consists of 26 printed pages, 2 blank pages and 1 Insert. DC (NH/CGW) 63698/5 © UCLES 2013 [Turn over * 5 6 7 9 5 2 6 0 9 2 * GEOGRAPHY 0460/13 Paper 1 May/June 2013 1 hour 45 minutes Candidates answer on the Question Paper. Additional Materials: Ruler Calculator READ THESE INSTRUCTIONS FIRST Write your Centre number, candidate number and name in the spaces provided. Write in dark blue or black pen. You may use a soft pencil for any diagrams, graphs or rough working. Do not use staples, paper clips, highlighters, glue or correction fluid. DO NOT WRITE ON ANY BARCODES. Write your answer to each question in the space provided. If additional space is required, you should use the lined page at the end of this booklet. The question number(s) must be clearly shown. Answer three questions. The Insert contains Photograph A for Question 1, Photograph B for Question 5 and Photograph C for Question 6. The Insert is not required by the Examiner. Sketch maps and diagrams should be drawn whenever they serve to illustrate an answer. At the end of the examination, fasten all your work securely together. The number of marks is given in brackets [ ] at the end of each question or part question. UNIVERSITY OF CAMBRIDGE INTERNATIONAL EXAMINATIONS International General Certificate of Secondary Education For Examiner’s Use Q1 Q2 Q3 Q4 Q5 Q6 Total www.theallpapers.com
Question paper, page 2
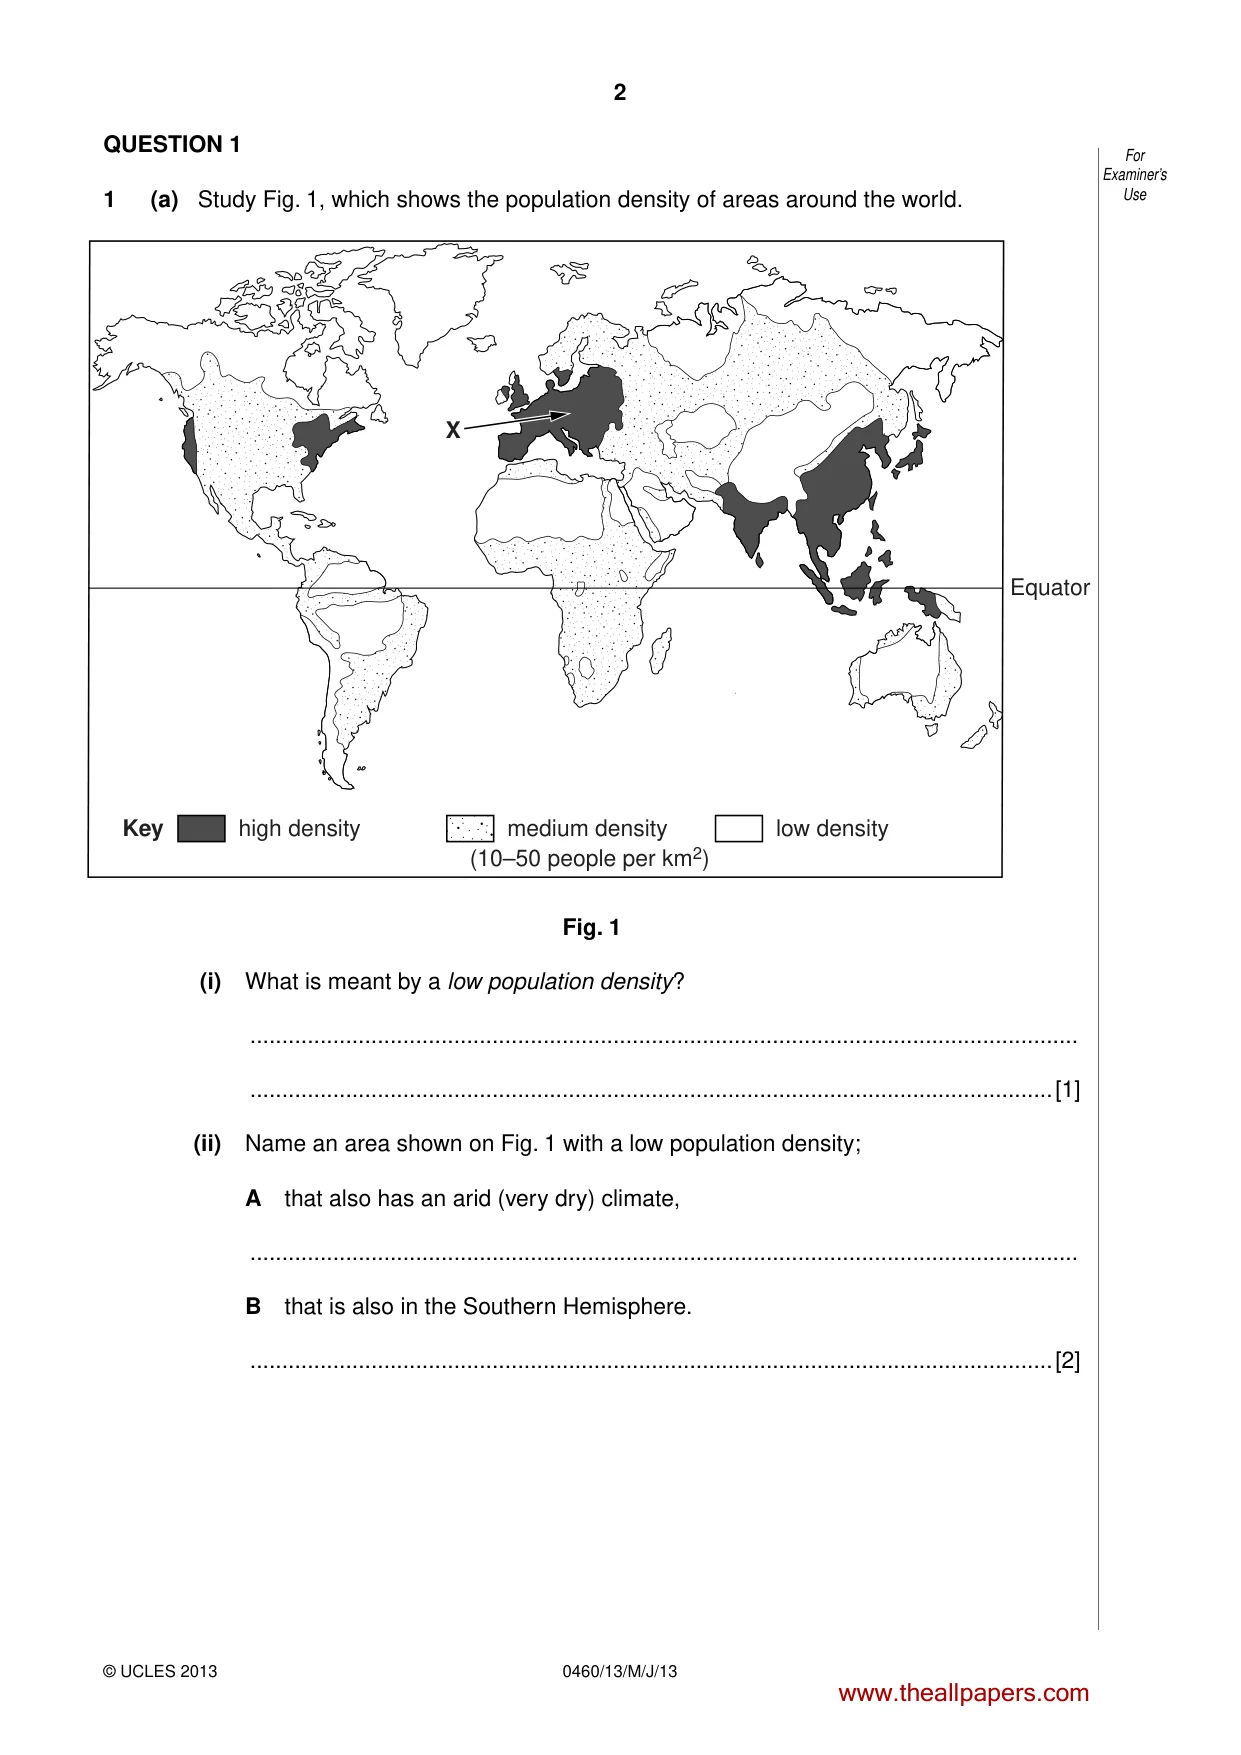
2 0460/13/M/J/13 © UCLES 2013 For Examiner’s Use QUESTION 1 1 (a) Study Fig. 1, which shows the population density of areas around the world. Equator high density Key medium density (10–50 people per km2) low density X Fig. 1 (i) What is meant by a low population density? … …[1] (ii) Name an area shown on Fig. 1 with a low population density; A that also has an arid (very dry) climate, … B that is also in the Southern Hemisphere. …[2] www.theallpapers.com
Question paper, page 3
3 0460/13/M/J/13 © UCLES 2013 [Turn over For Examiner’s Use (iii) Suggest three reasons why the area marked X on Fig. 1 has a high population density. 1 … … 2 … … 3 … …[3] (iv) Overpopulation occurs when there are too many people for the available resources. Describe four different problems which overpopulation may cause in a country. 1 … … 2 … … 3 … … 4 … …[4] www.theallpapers.com
Question paper, page 4
4 0460/13/M/J/13 © UCLES 2013 For Examiner’s Use (b) Study Photograph A (Insert), which shows an area which has a low population density. (i) Give three different reasons why the area shown in Photograph A has a low population density. 1 … … 2 … … 3 … …[3] (ii) Suggest why some people live in areas of low population density, such as the one shown in Photograph A. … … … … … … … … … …[5] www.theallpapers.com
Question paper, page 5
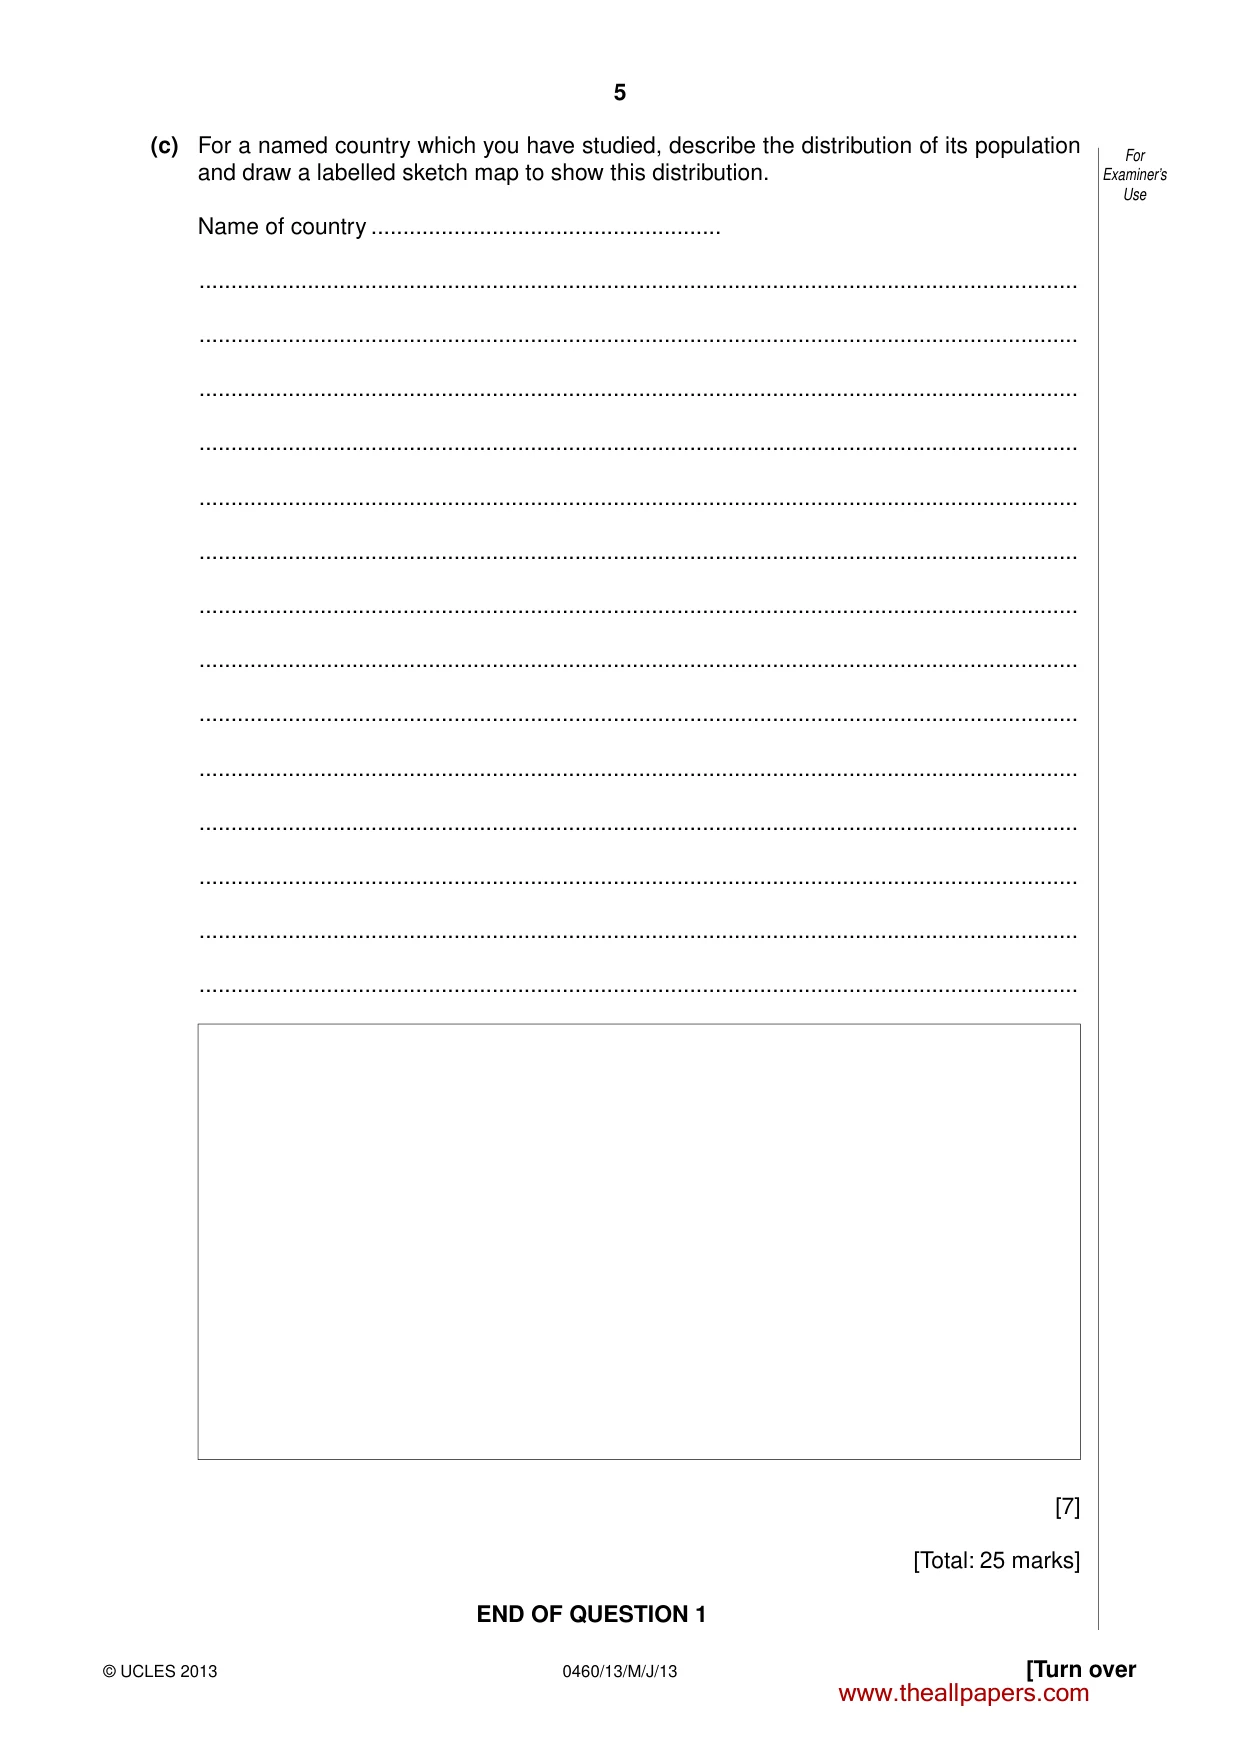
5 0460/13/M/J/13 © UCLES 2013 [Turn over For Examiner’s Use (c) For a named country which you have studied, describe the distribution of its population and draw a labelled sketch map to show this distribution. Name of country … … … … … … … … … … … … … … … [7] [Total: 25 marks] END OF QUESTION 1 www.theallpapers.com
Question paper, page 6
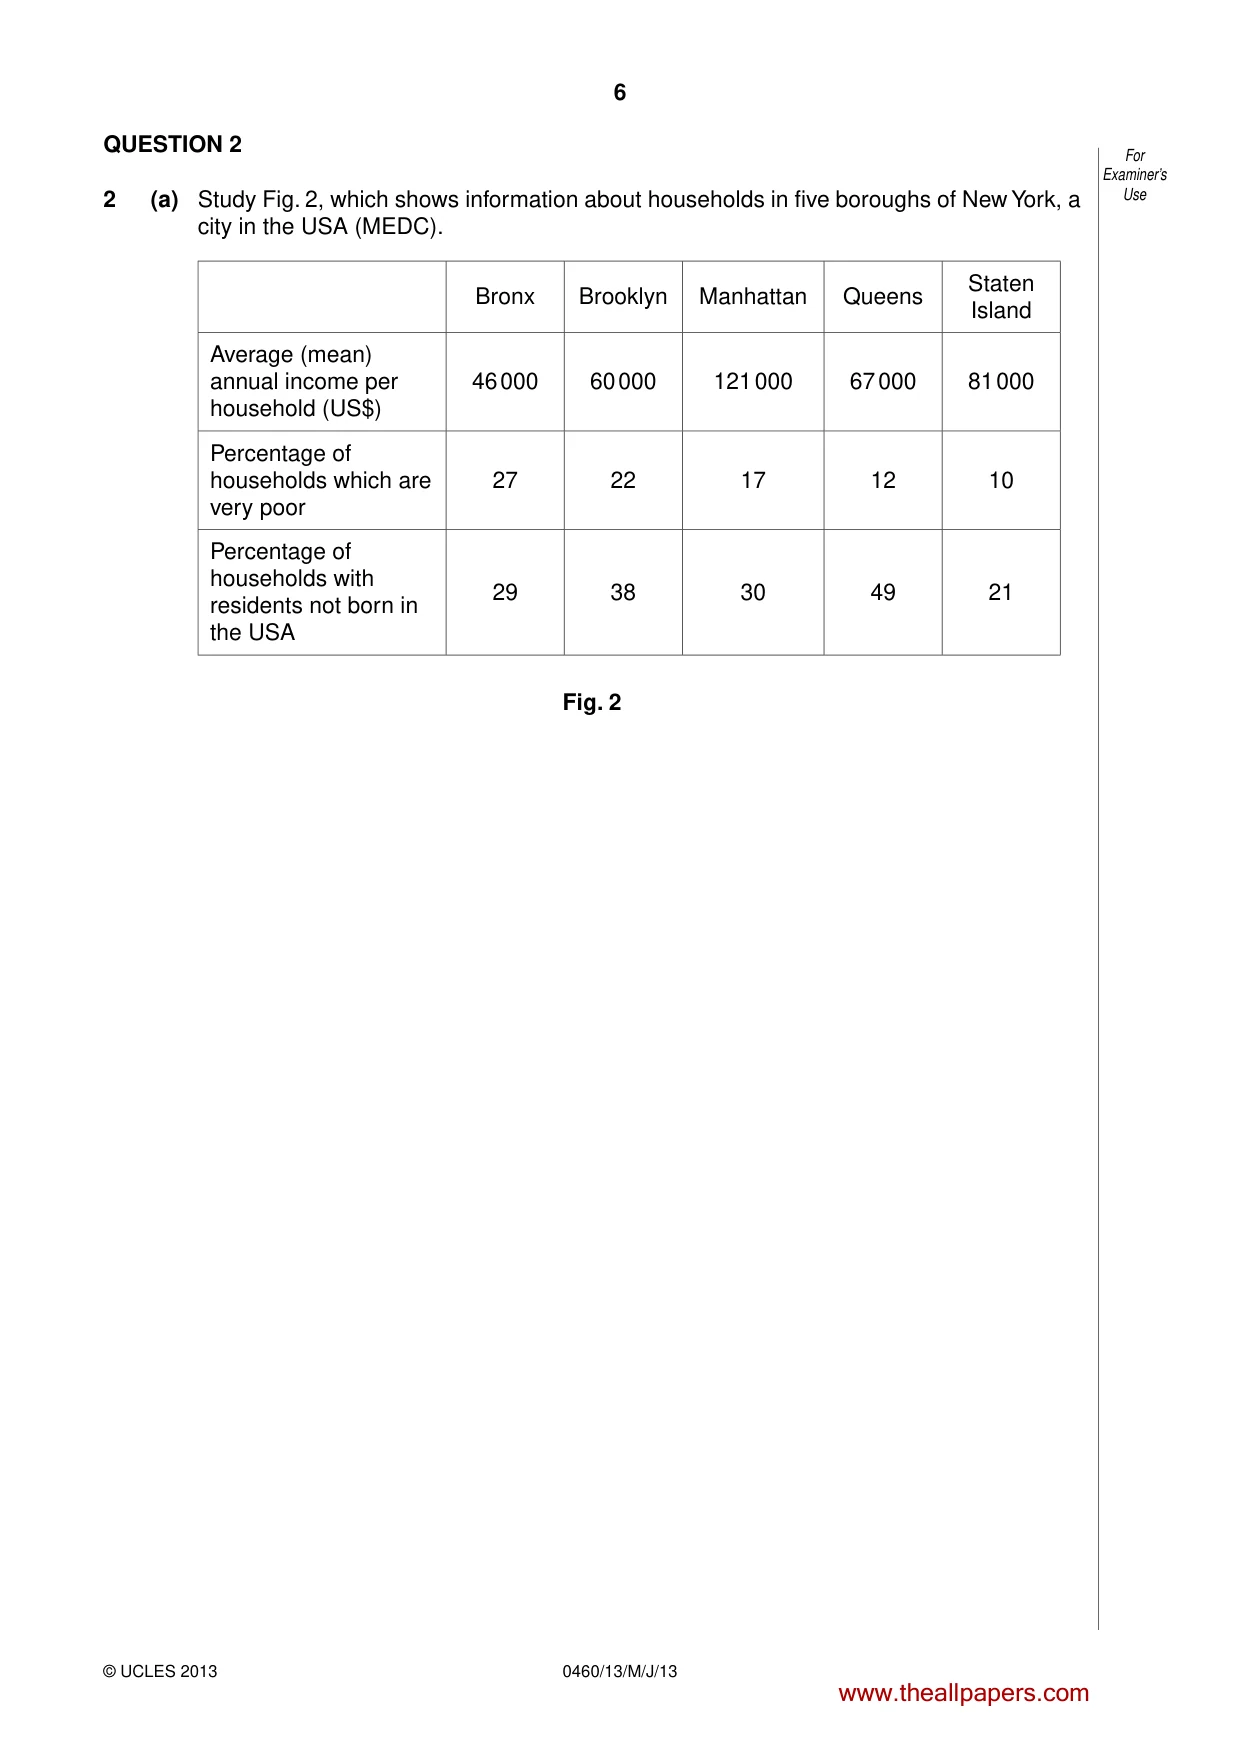
6 0460/13/M/J/13 © UCLES 2013 For Examiner’s Use QUESTION 2 2 (a) Study Fig. 2, which shows information about households in five boroughs of New York, a city in the USA (MEDC). Bronx Brooklyn Manhattan Queens Staten Island Average (mean) annual income per household (US$) 46 000 60 000 121 000 67 000 81 000 Percentage of households which are very poor 27 22 17 12 10 Percentage of households with residents not born in the USA 29 38 30 49 21 Fig. 2 www.theallpapers.com
Question paper, page 7
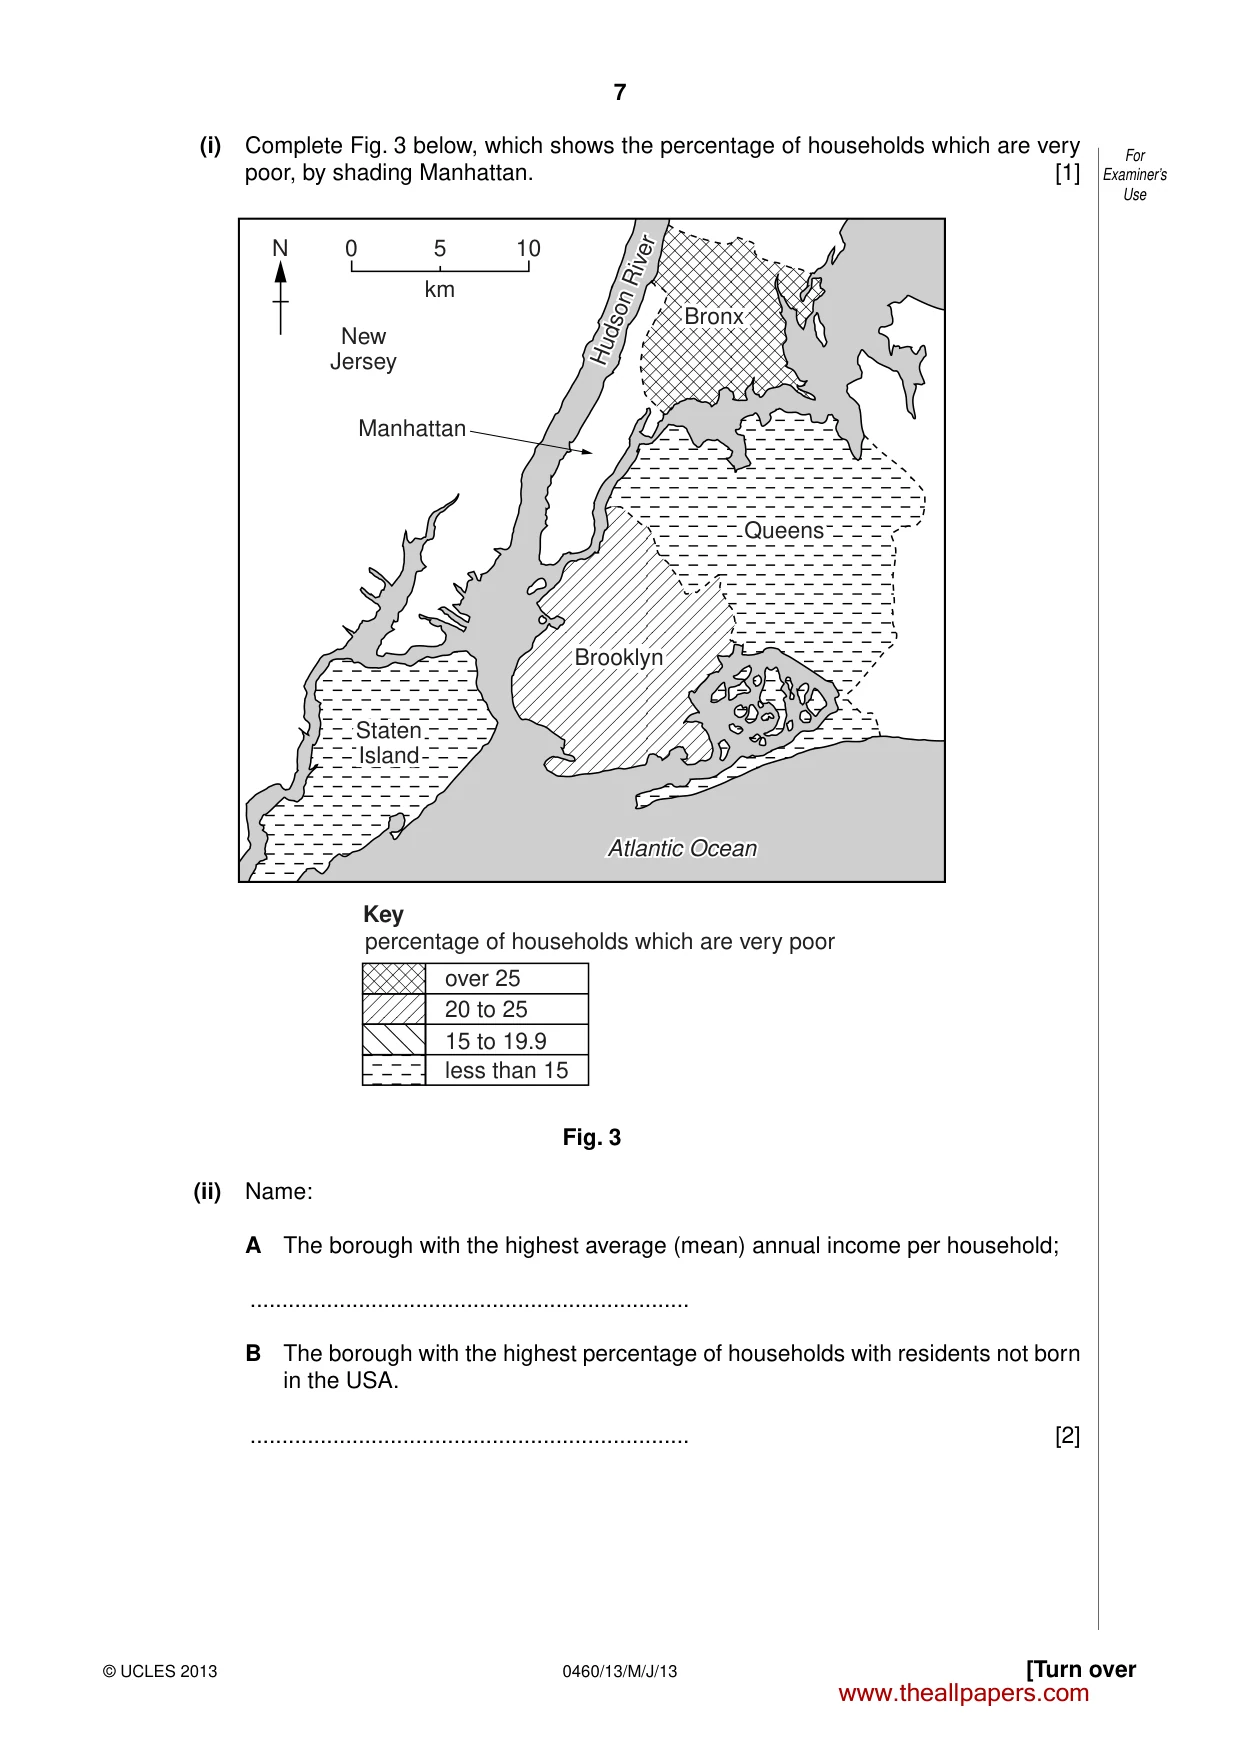
7 0460/13/M/J/13 © UCLES 2013 [Turn over For Examiner’s Use (i) Complete Fig. 3 below, which shows the percentage of households which are very poor, by shading Manhattan. [1] 10 5 N km 0 Bronx Bronx Queens Queens Brooklyn Brooklyn less than 15 Key percentage of households which are very poor Manhattan Hudson River New Jersey Atlantic Ocean Staten Island Staten Island Atlantic Ocean 15 to 19.9 20 to 25 over 25 Hudson River Fig. 3 (ii) Name: A The borough with the highest average (mean) annual income per household; … B The borough with the highest percentage of households with residents not born in the USA. … [2] www.theallpapers.com
Question paper, page 8
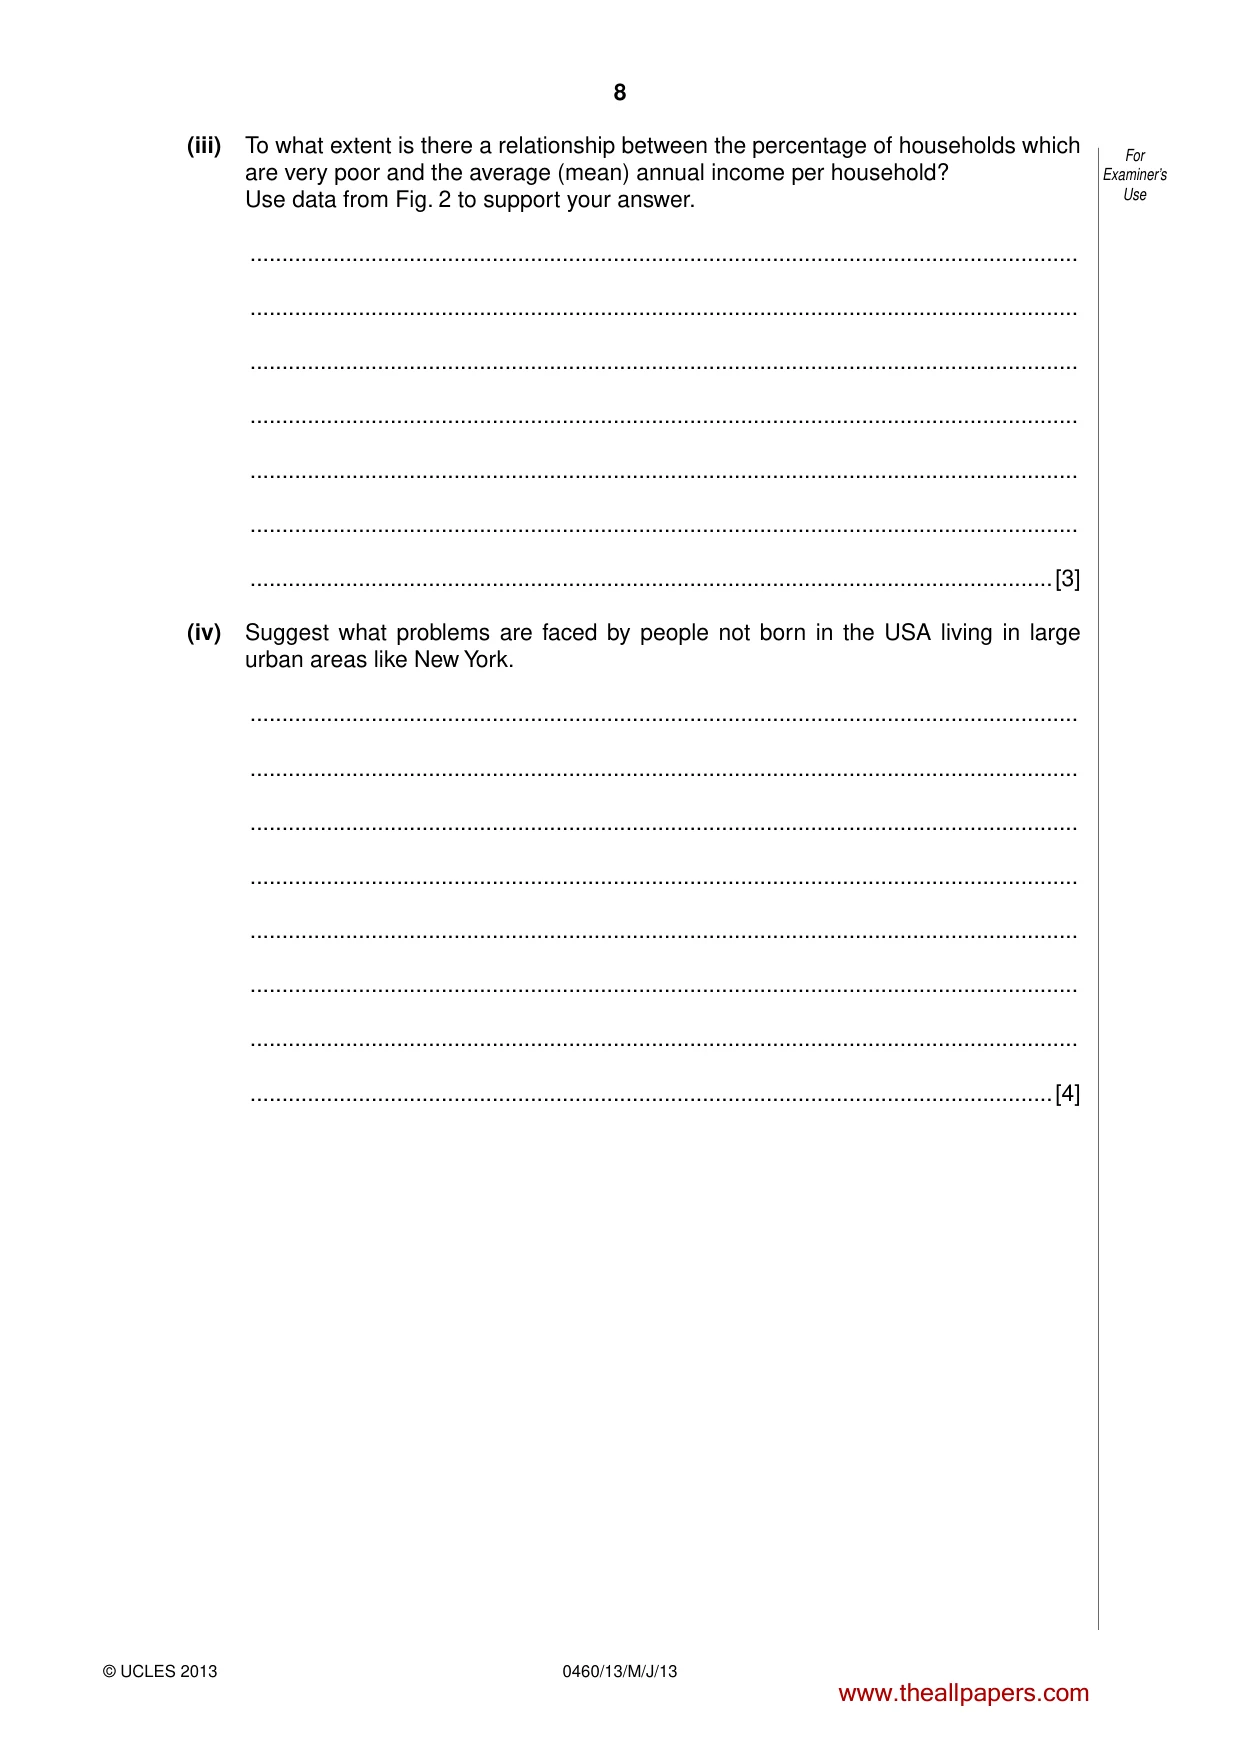
8 0460/13/M/J/13 © UCLES 2013 For Examiner’s Use (iii) To what extent is there a relationship between the percentage of households which are very poor and the average (mean) annual income per household? Use data from Fig. 2 to support your answer. … … … … … … …[3] (iv) Suggest what problems are faced by people not born in the USA living in large urban areas like New York. … … … … … … … …[4] www.theallpapers.com
Question paper, page 9
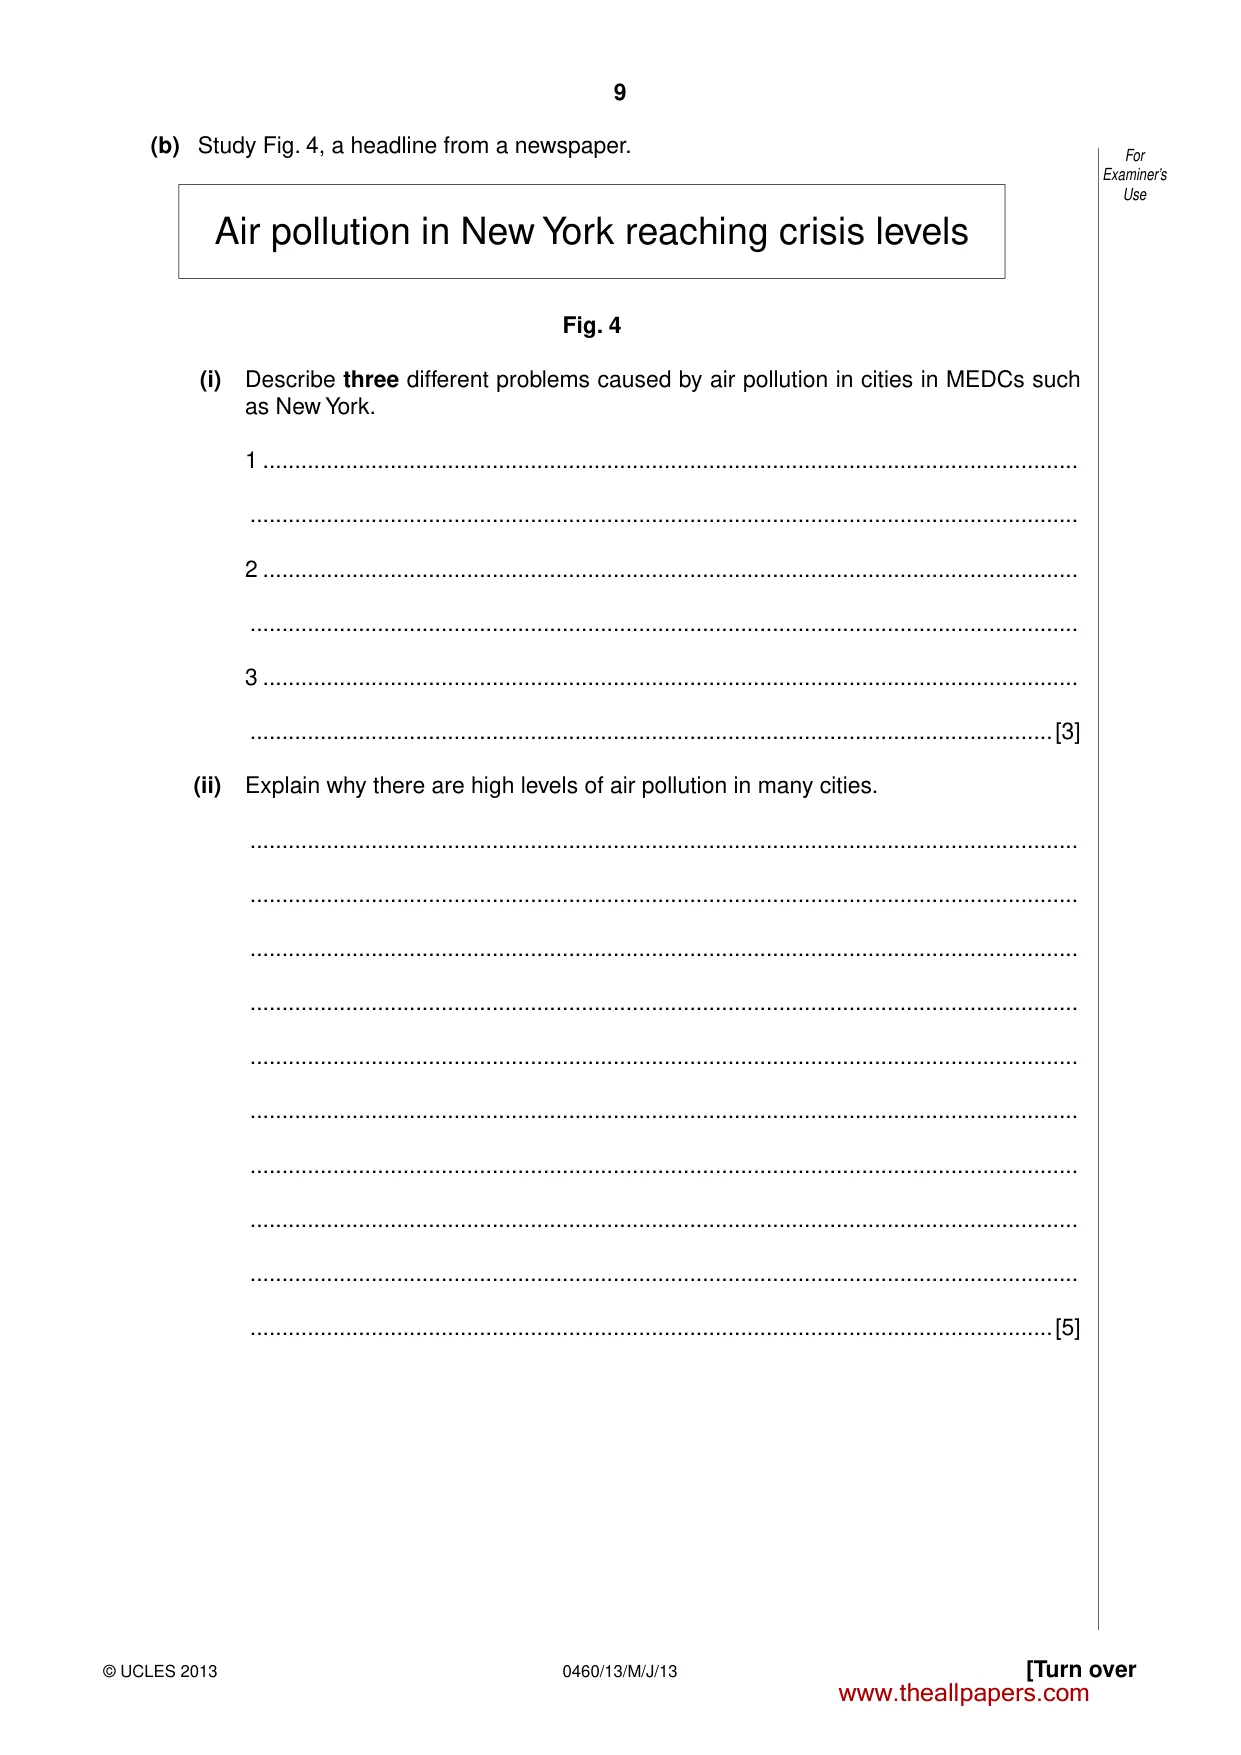
9 0460/13/M/J/13 © UCLES 2013 [Turn over For Examiner’s Use (b) Study Fig. 4, a headline from a newspaper. Air pollution in New York reaching crisis levels Fig. 4 (i) Describe three different problems caused by air pollution in cities in MEDCs such as New York. 1 … … 2 … … 3 … …[3] (ii) Explain why there are high levels of air pollution in many cities. … … … … … … … … … …[5] www.theallpapers.com
Question paper, page 10
10 0460/13/M/J/13 © UCLES 2013 For Examiner’s Use (c) For a named urban area which you have studied describe the main features of one of the following land use zones: Inner city Outer suburbs Rural-urban fringe Name of urban area … Chosen land use zone … … … … … … … … … … … … … … … …[7] [Total: 25 marks] END OF QUESTION 2 www.theallpapers.com
Question paper, page 11
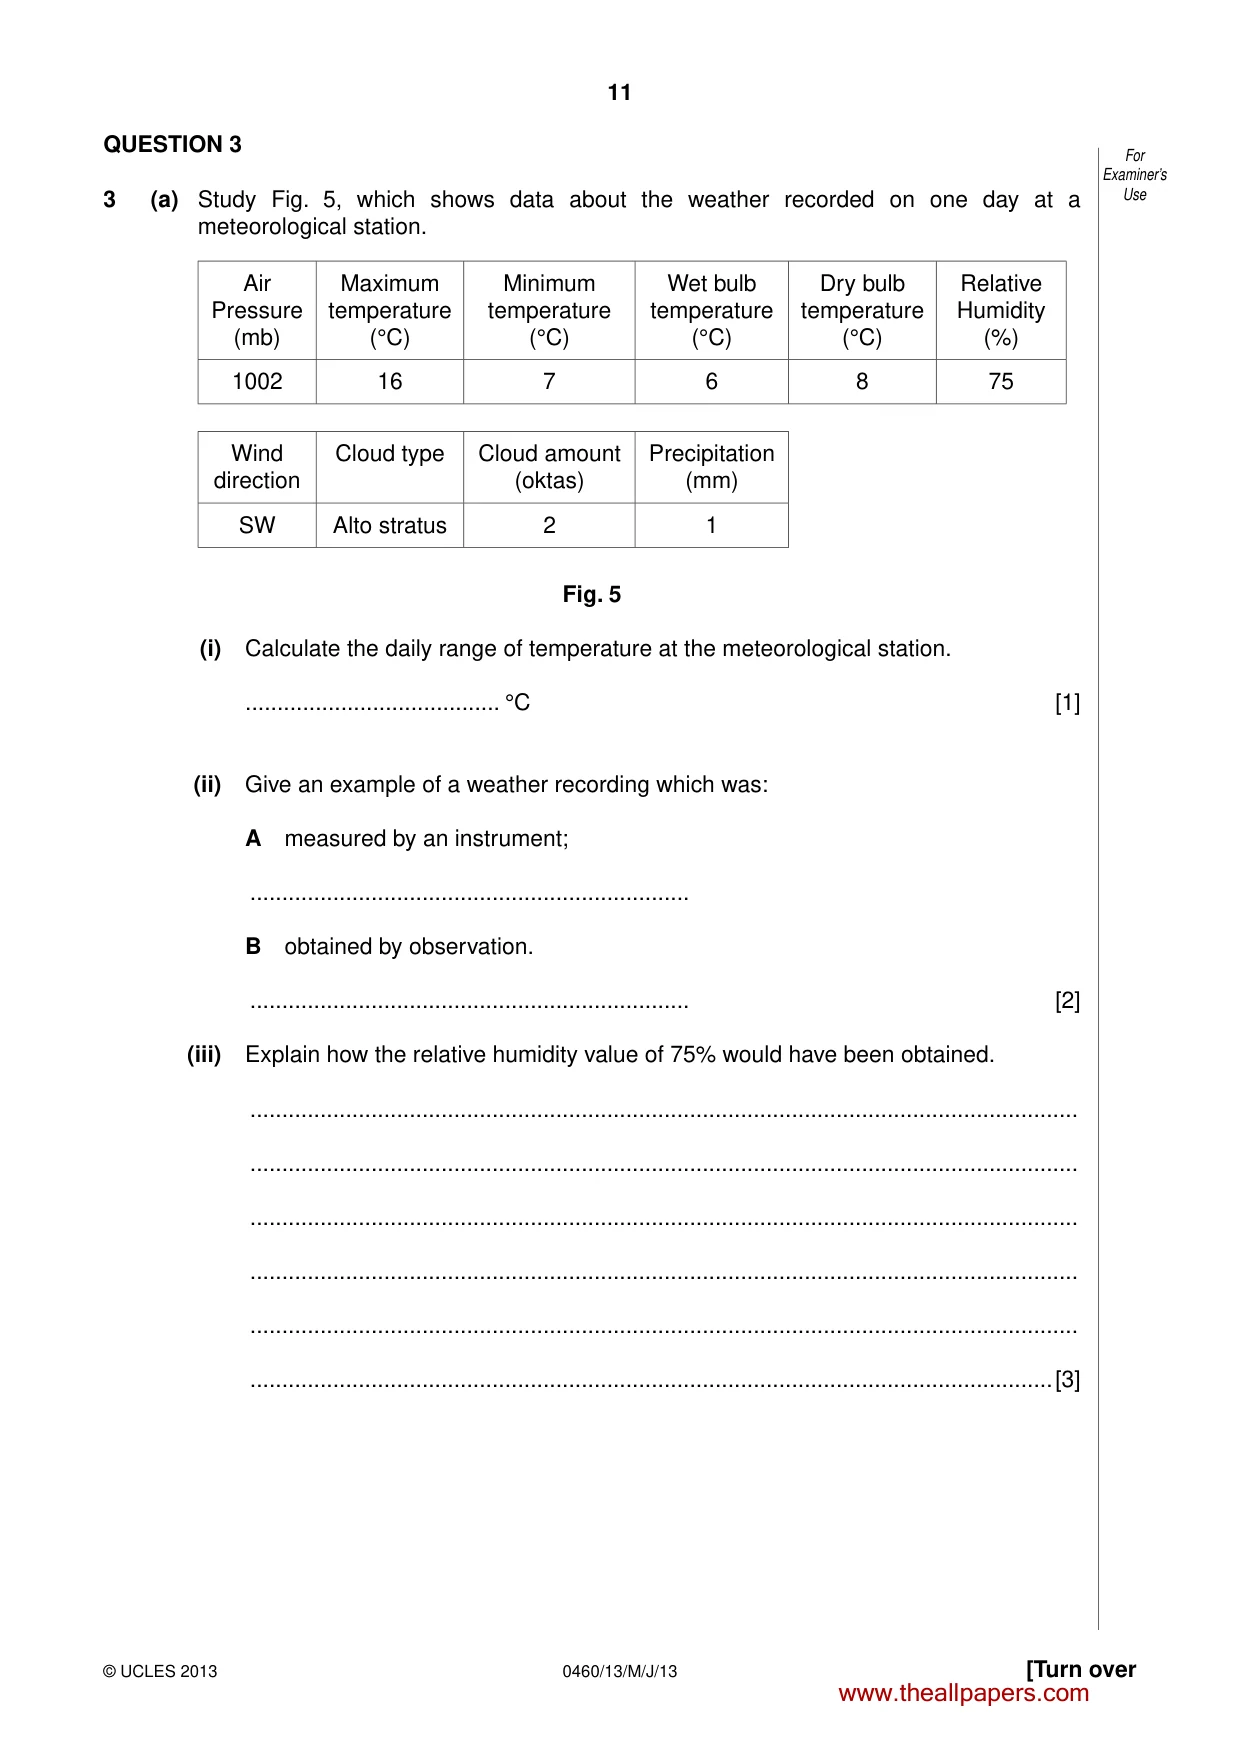
11 0460/13/M/J/13 © UCLES 2013 [Turn over For Examiner’s Use QUESTION 3 3 (a) Study Fig. 5, which shows data about the weather recorded on one day at a meteorological station. Air Pressure (mb) Maximum temperature (°C) Minimum temperature (°C) Wet bulb temperature (°C) Dry bulb temperature (°C) Relative Humidity (%) 1002 16 7 6 8 75 Wind direction Cloud type Cloud amount (oktas) Precipitation (mm) SW Alto stratus 2 1 Fig. 5 (i) Calculate the daily range of temperature at the meteorological station. … °C [1] (ii) Give an example of a weather recording which was: A measured by an instrument; … B obtained by observation. … [2] (iii) Explain how the relative humidity value of 75% would have been obtained. … … … … … …[3] www.theallpapers.com
Question paper, page 12
12 0460/13/M/J/13 © UCLES 2013 For Examiner’s Use (iv) The thermometers used at the meteorological station are kept in a Stevenson Screen. Explain how this ensures that reliable readings are obtained. … … … … … … … …[4] www.theallpapers.com
Question paper, page 13
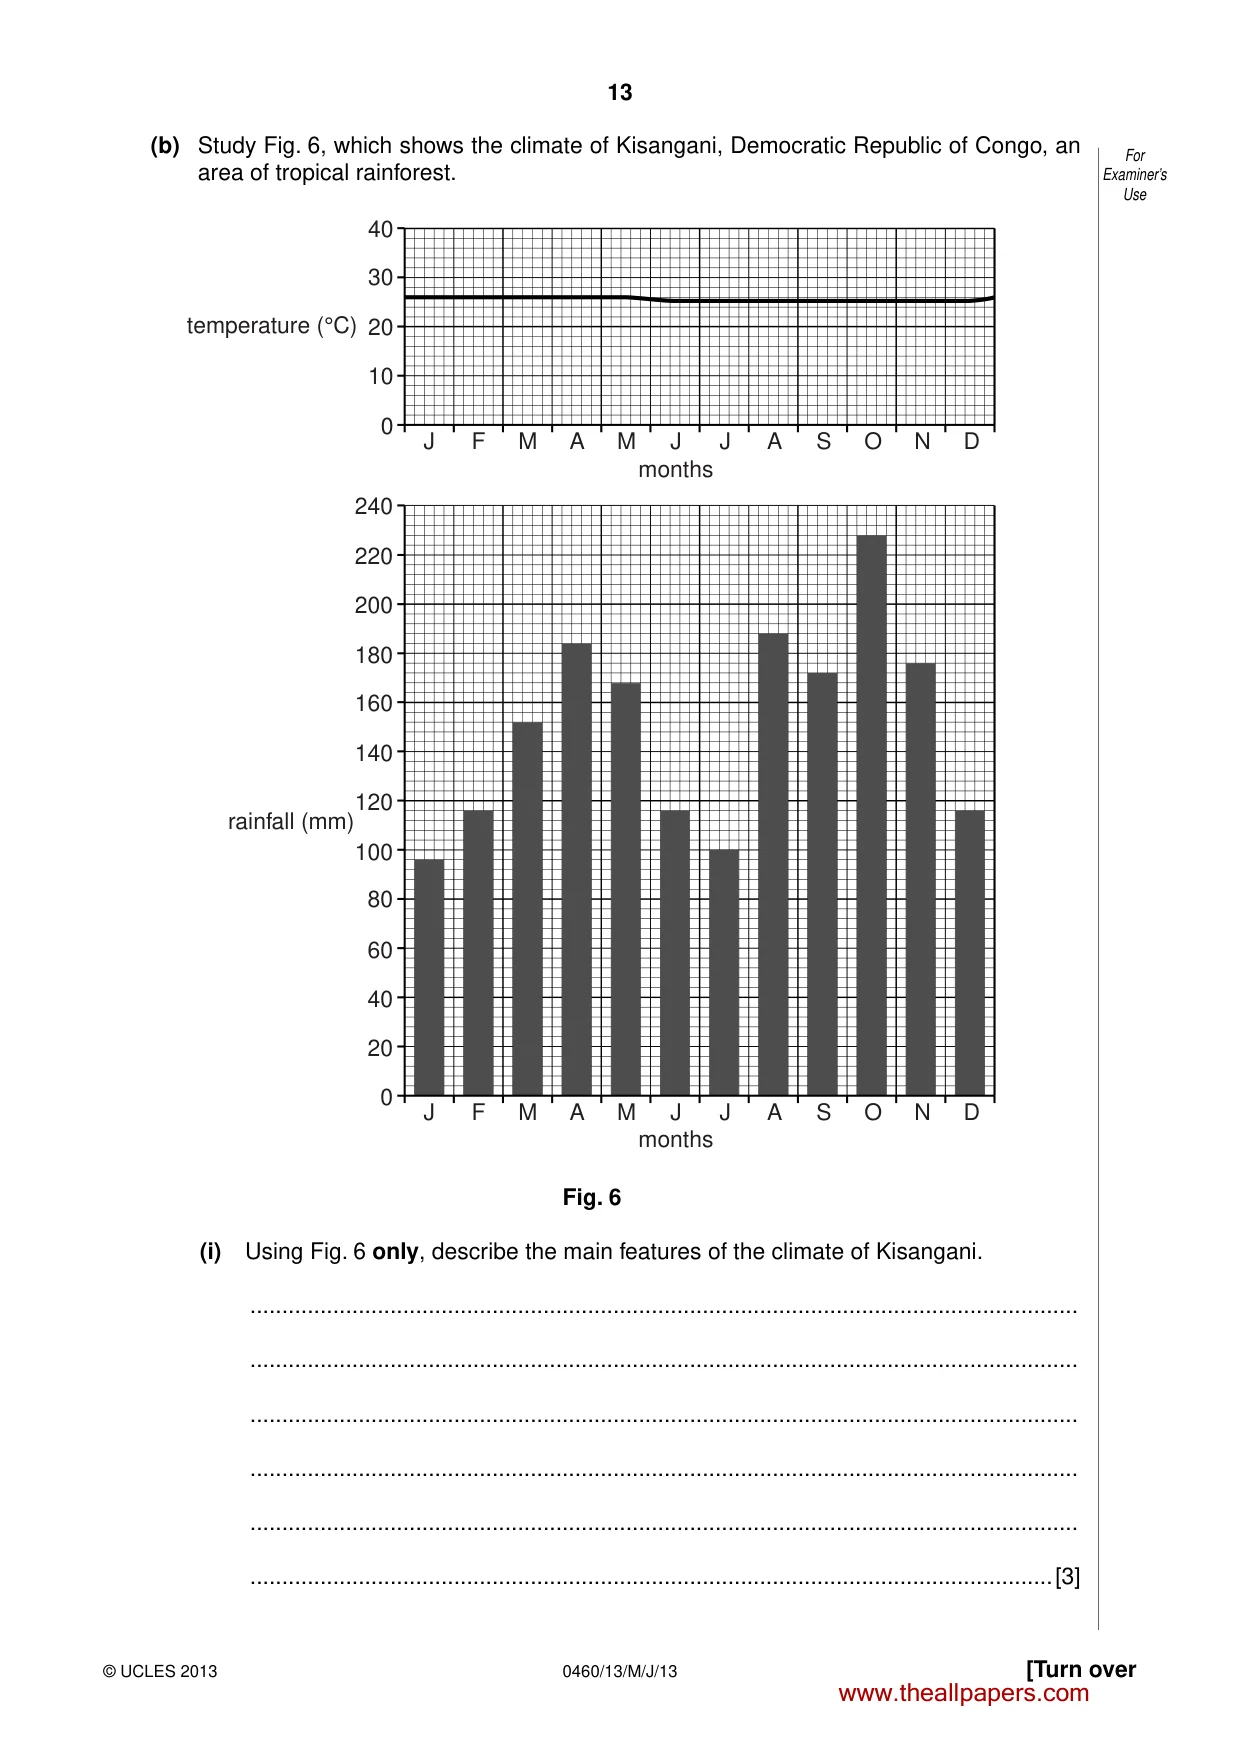
13 0460/13/M/J/13 © UCLES 2013 [Turn over For Examiner’s Use (b) Study Fig. 6, which shows the climate of Kisangani, Democratic Republic of Congo, an area of tropical rainforest. J F M A M J months J A S O N D 0 20 40 60 80 100 120 rainfall (mm) 140 160 180 200 220 240 0 10 20 temperature (°C) 30 40 J F M A M J months J A S O N D Fig. 6 (i) Using Fig. 6 only, describe the main features of the climate of Kisangani. … … … … … …[3] www.theallpapers.com
Question paper, page 14
14 0460/13/M/J/13 © UCLES 2013 For Examiner’s Use (ii) Give reasons for the climate of an area of tropical rainforest such as Kisangani. … … … … … … … … … …[5] www.theallpapers.com
Question paper, page 15
15 0460/13/M/J/13 © UCLES 2013 [Turn over For Examiner’s Use (c) Name an area of tropical rainforest which you have studied and explain why deforestation is taking place there. Name of area … … … … … … … … … … … … … … …[7] [Total: 25 marks] END OF QUESTION 3 www.theallpapers.com
Question paper, page 16
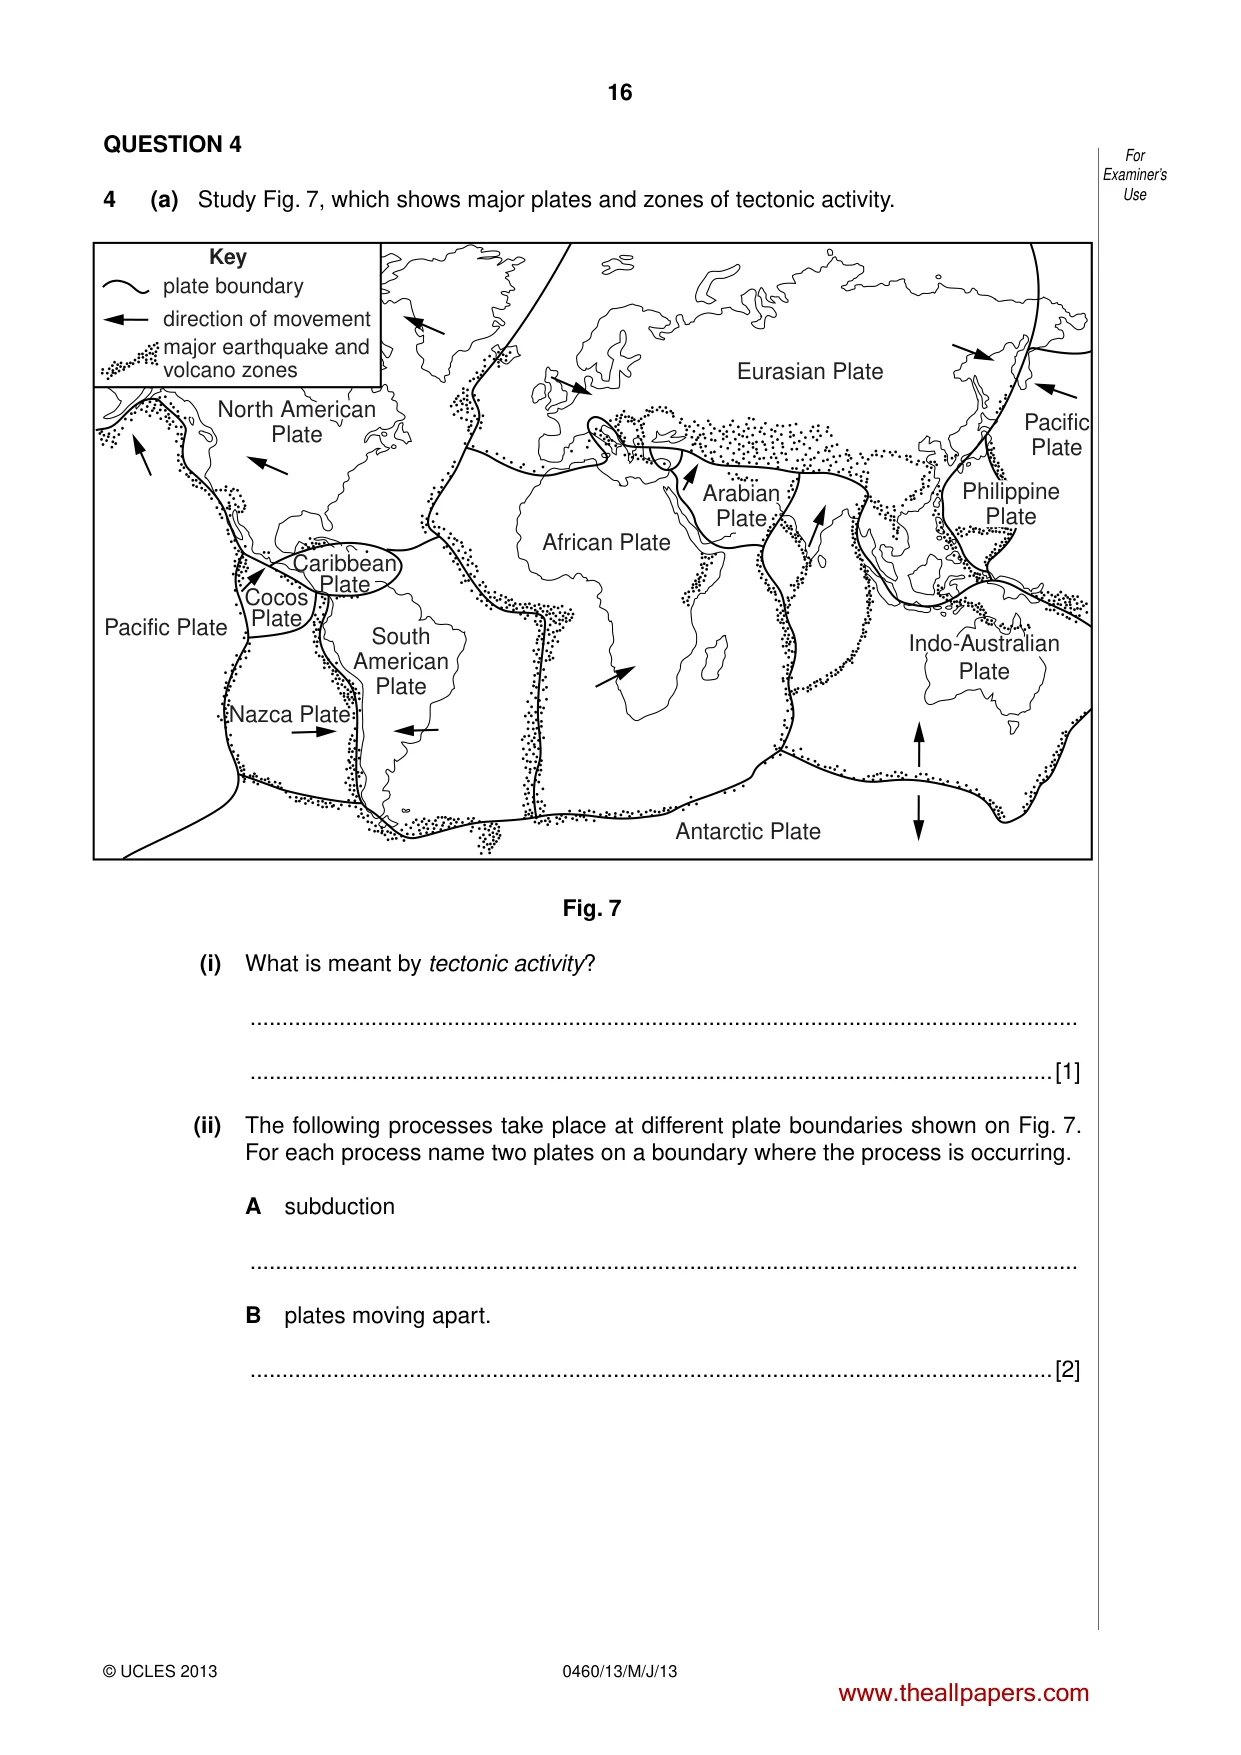
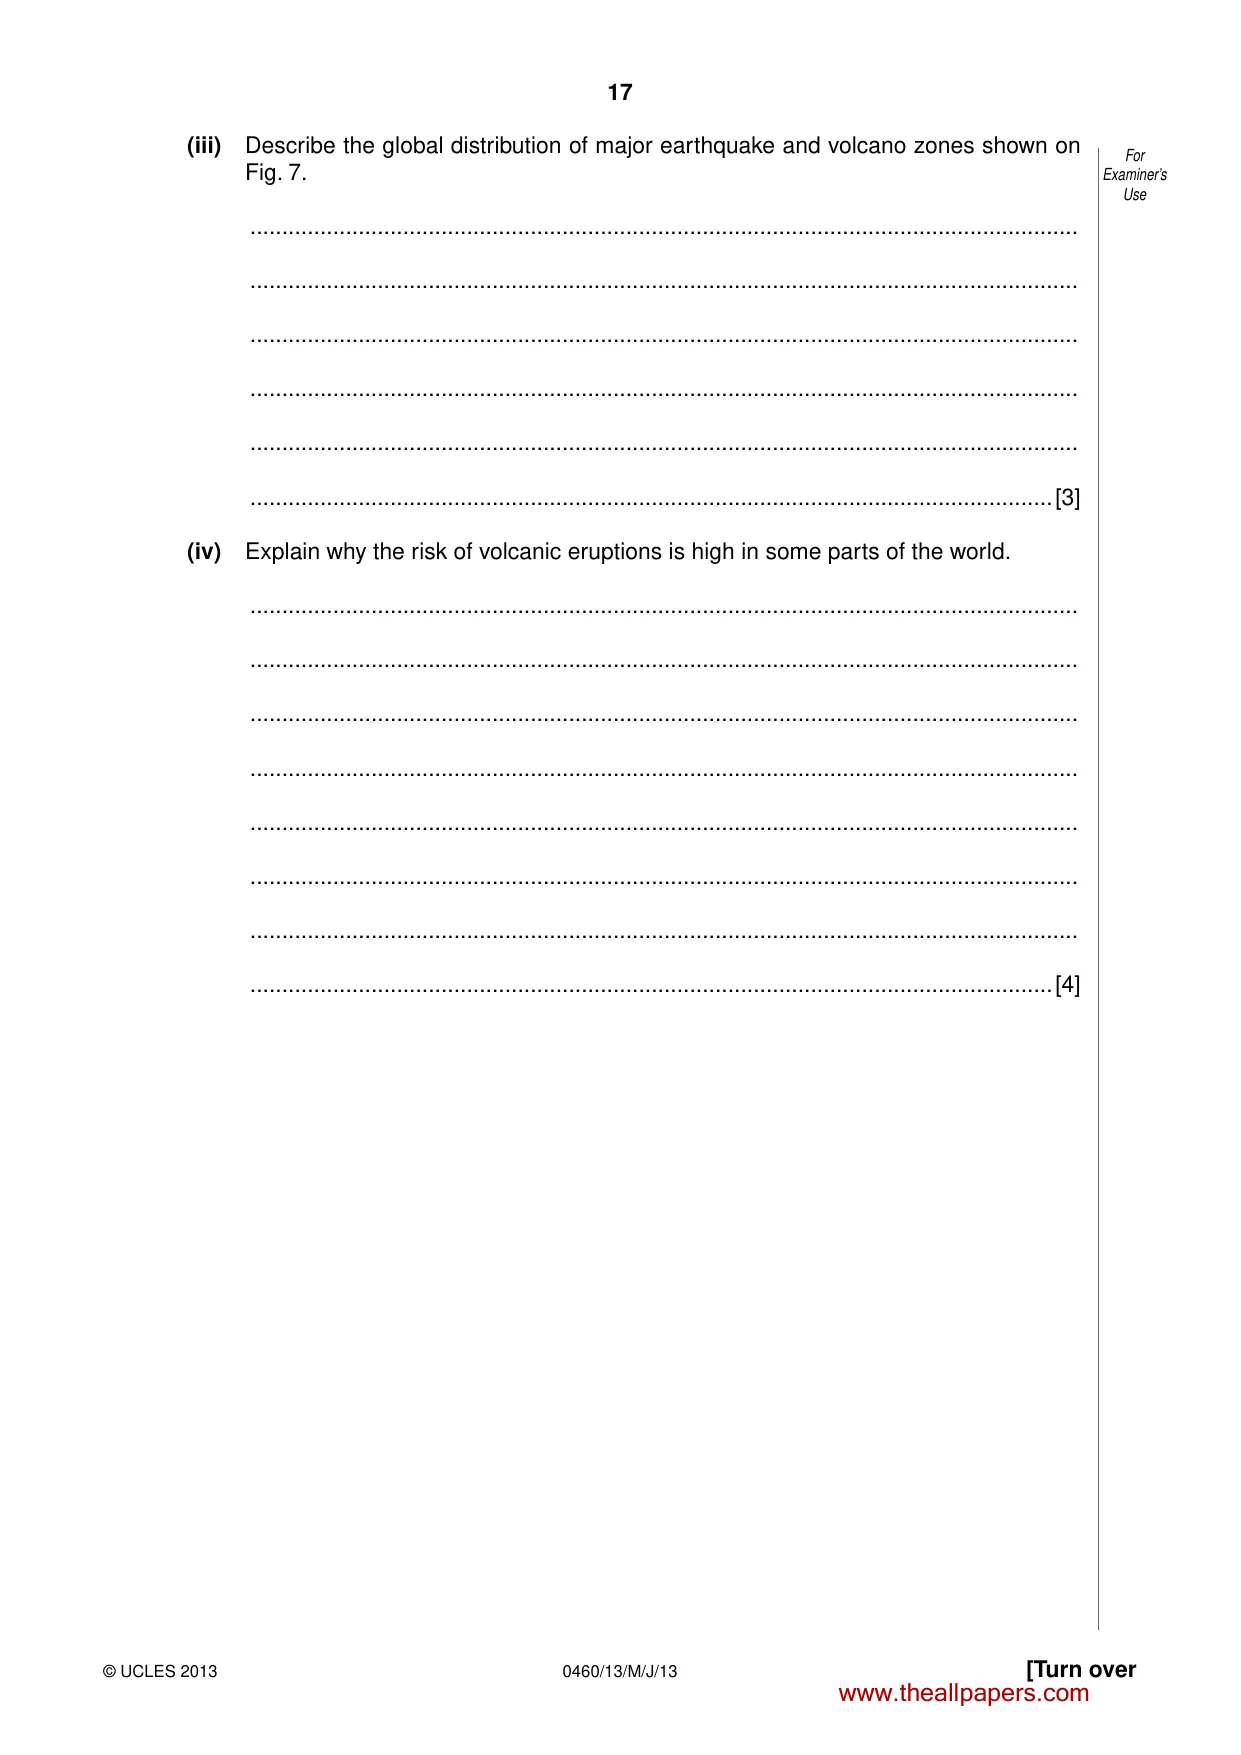
16 0460/13/M/J/13 © UCLES 2013 For Examiner’s Use QUESTION 4 4 (a) Study Fig. 7, which shows major plates and zones of tectonic activity. plate boundary North American Plate South American Plate African Plate Arabian Plate Eurasian Plate Pacific Plate Pacific Plate Antarctic Plate Nazca Plate Cocos Plate Caribbean Plate Key direction of movement major earthquake and volcano zones Philippine Plate Indo-Australian Plate Fig. 7 (i) What is meant by tectonic activity? … …[1] (ii) The following processes take place at different plate boundaries shown on Fig. 7. For each process name two plates on a boundary where the process is occurring. A subduction … B plates moving apart. …[2] www.theallpapers.com
Question paper, page 17
17 0460/13/M/J/13 © UCLES 2013 [Turn over For Examiner’s Use (iii) Describe the global distribution of major earthquake and volcano zones shown on Fig. 7. … … … … … …[3] (iv) Explain why the risk of volcanic eruptions is high in some parts of the world. … … … … … … … …[4] www.theallpapers.com
Question paper, page 18
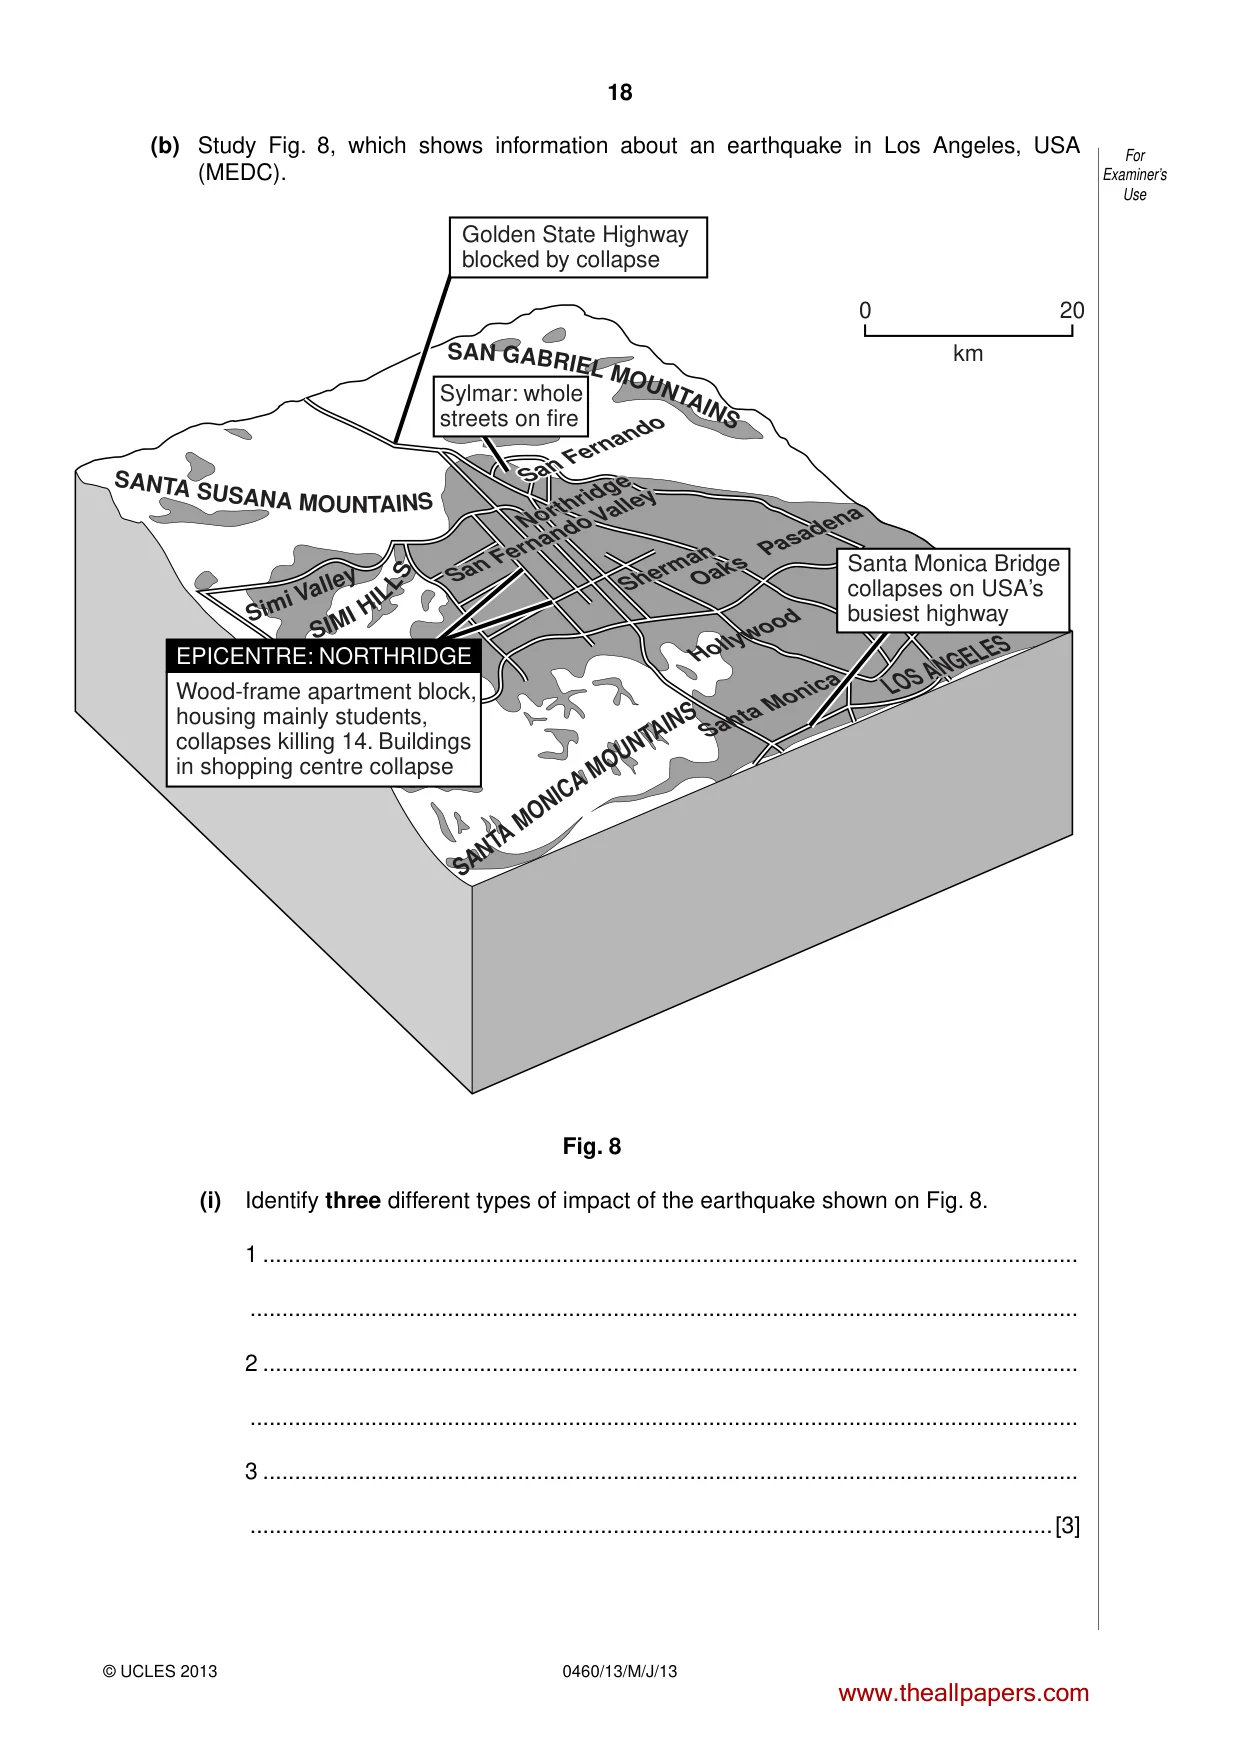
18 0460/13/M/J/13 © UCLES 2013 For Examiner’s Use (b) Study Fig. 8, which shows information about an earthquake in Los Angeles, USA (MEDC). Wood-frame apartment block, housing mainly students, collapses killing 14. Buildings in shopping centre collapse Golden State Highway blocked by collapse SANTA SUSAN A MO UN TA IN S SI M I H I L L S LOS ANGELES SANTA MONIC A MOU NTAINS Simi Valley San Fernando Sherman oaks Pasadena Hollywood Santa Monica San Fernando Valley Sherman Oaks Pasadena SA N G AB RIE L M OU NT AIN S San Fernando LOS ANGELES EPICENTRE: NORTHRIDGE Santa Monica Bridge collapses on USA’s busiest highway Sylmar: whole streets on fire San Fernando Valley Northridge 0 20 km Northridge Fig. 8 (i) Identify three different types of impact of the earthquake shown on Fig. 8. 1 … … 2 … … 3 … …[3] www.theallpapers.com
Question paper, page 19
19 0460/13/M/J/13 © UCLES 2013 [Turn over For Examiner’s Use (ii) Explain why the impacts of earthquakes of similar intensity are likely to be less in MEDCs such as the USA than in LEDCs. … … … … … … … … … …[5] (c) Explain the causes of an earthquake which occurred in a named area which you have studied. Name of area … … … … … … … … … … … … … … [7] [Total: 25 marks] END OF QUESTION 4 www.theallpapers.com
Question paper, page 20
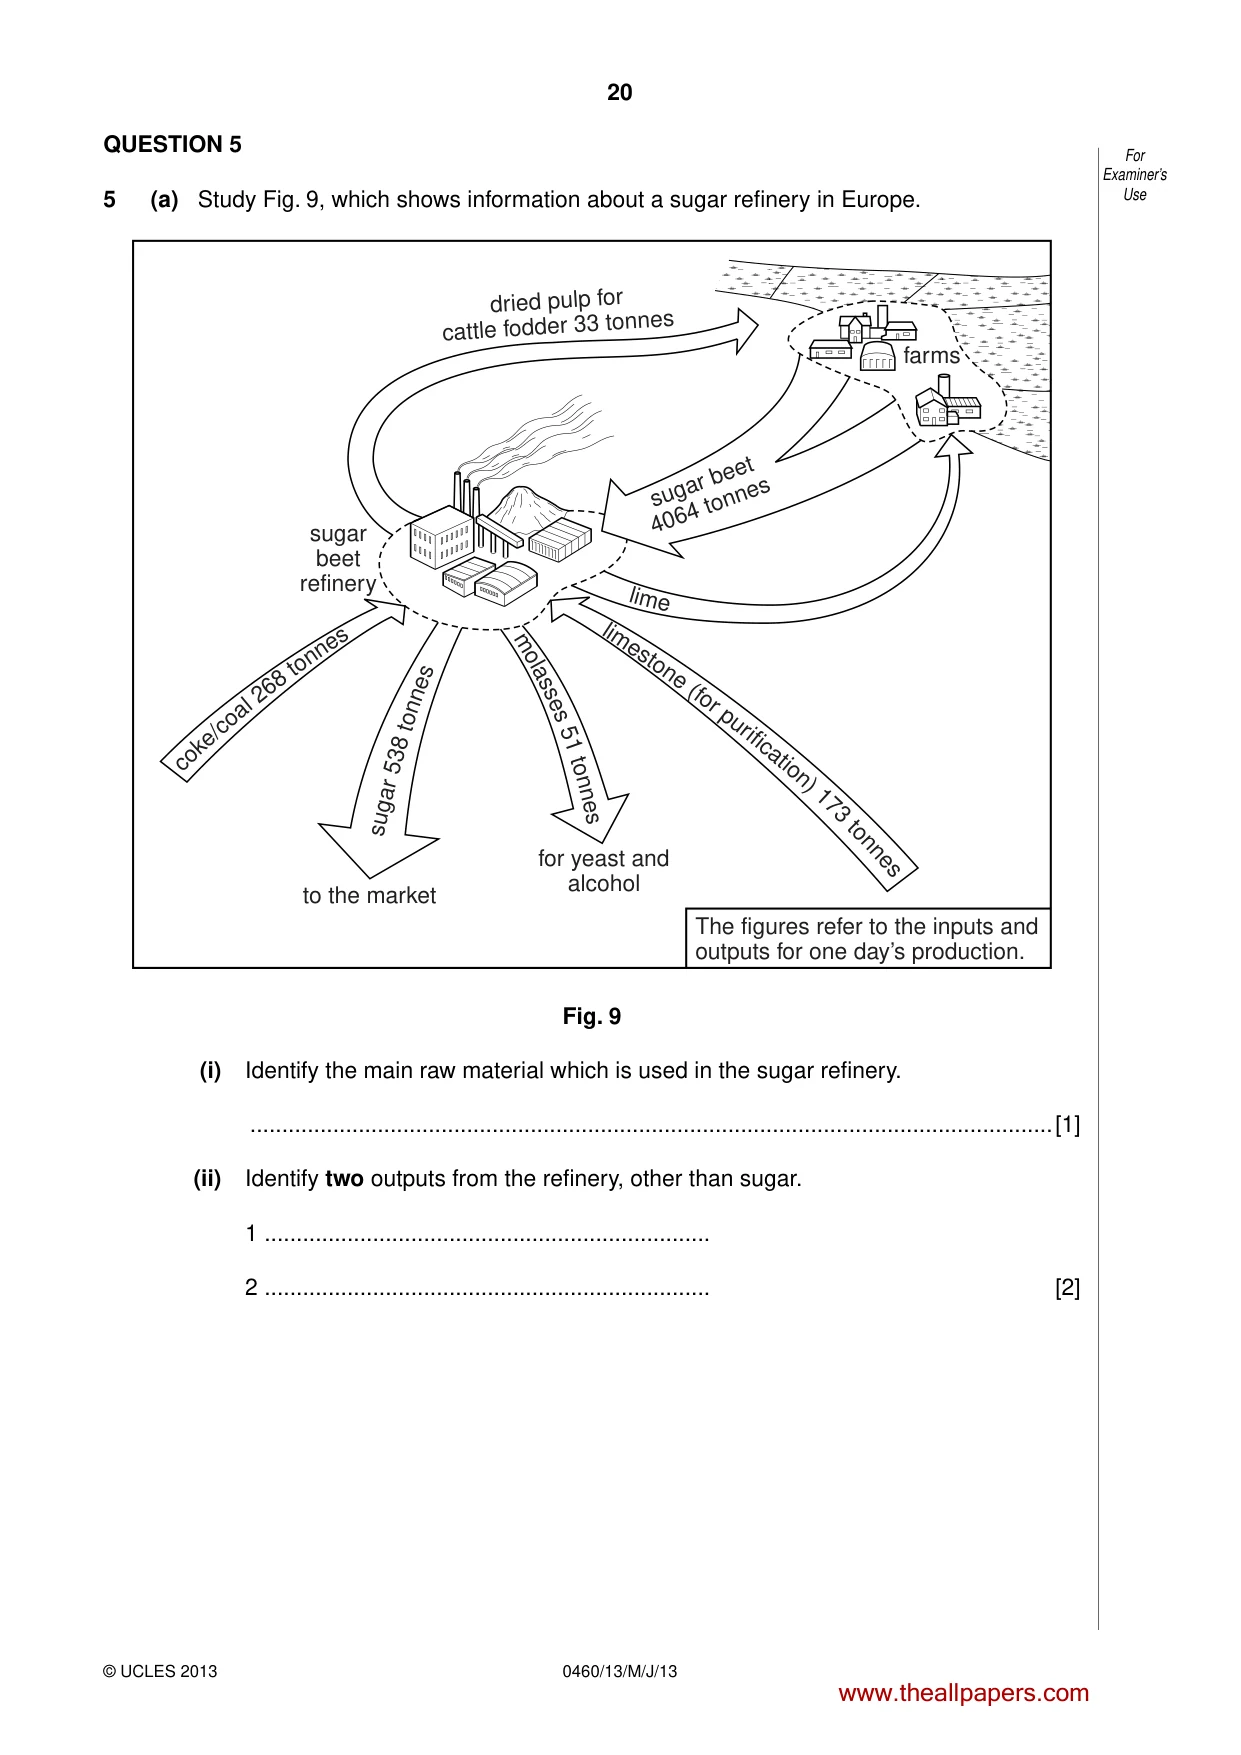
20 0460/13/M/J/13 © UCLES 2013 For Examiner’s Use QUESTION 5 5 (a) Study Fig. 9, which shows information about a sugar refinery in Europe. coke/ coal 268 t onne s lim e sugar 538 tonn es limestone (for pur ificatio n) 17 3 ton nes mo las se s 5 1 t onn es farms sugar beet refinery to the market for yeast and alcohol The figures refer to the inputs and outputs for one day’s production. sugar beet 4064 tonnes dried pulp for cattle fodder 33 tonnes Fig. 9 (i) Identify the main raw material which is used in the sugar refinery. …[1] (ii) Identify two outputs from the refinery, other than sugar. 1 … 2 … [2] www.theallpapers.com
Question paper, page 21
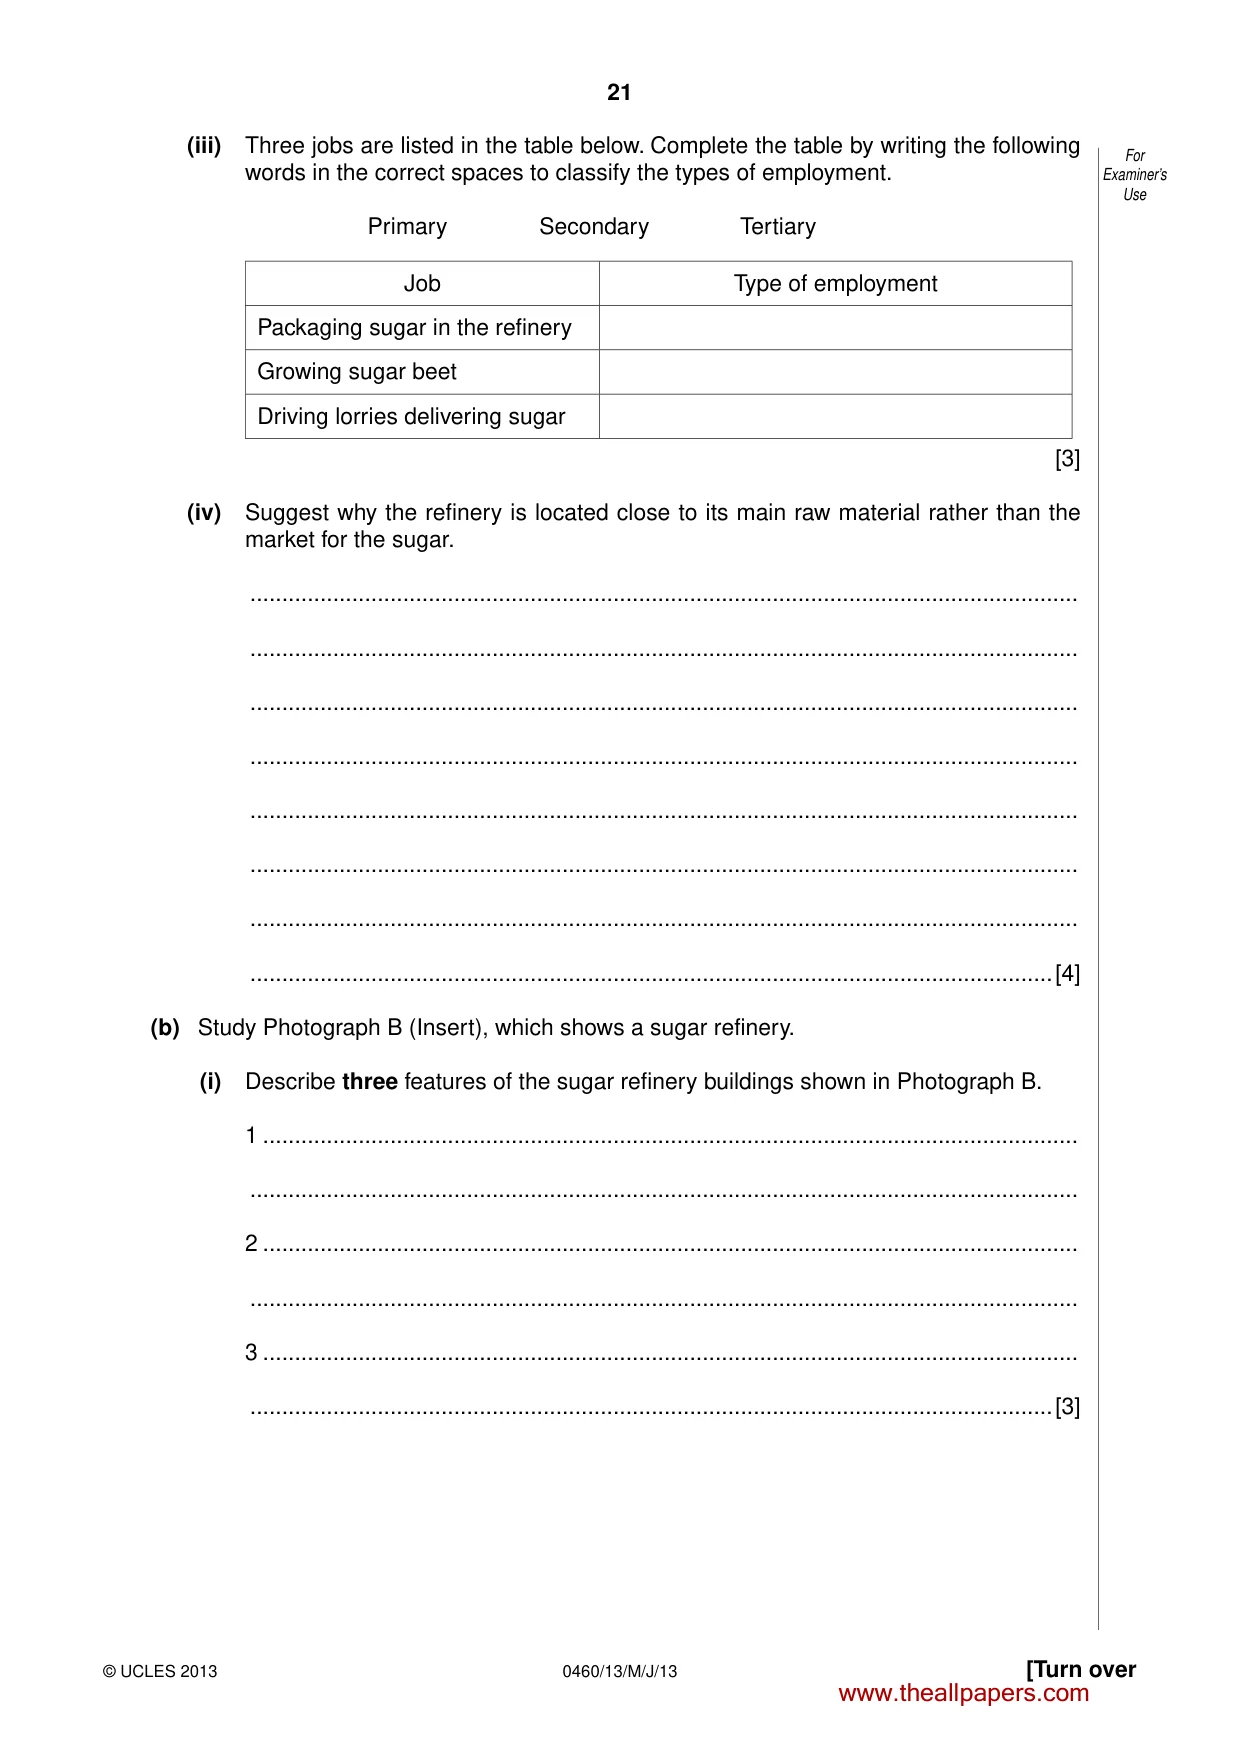
21 0460/13/M/J/13 © UCLES 2013 [Turn over For Examiner’s Use (iii) Three jobs are listed in the table below. Complete the table by writing the following words in the correct spaces to classify the types of employment. Primary Secondary Tertiary Job Type of employment Packaging sugar in the refinery Growing sugar beet Driving lorries delivering sugar [3] (iv) Suggest why the refinery is located close to its main raw material rather than the market for the sugar. … … … … … … … …[4] (b) Study Photograph B (Insert), which shows a sugar refinery. (i) Describe three features of the sugar refinery buildings shown in Photograph B. 1 … … 2 … … 3 … …[3] www.theallpapers.com
Question paper, page 22
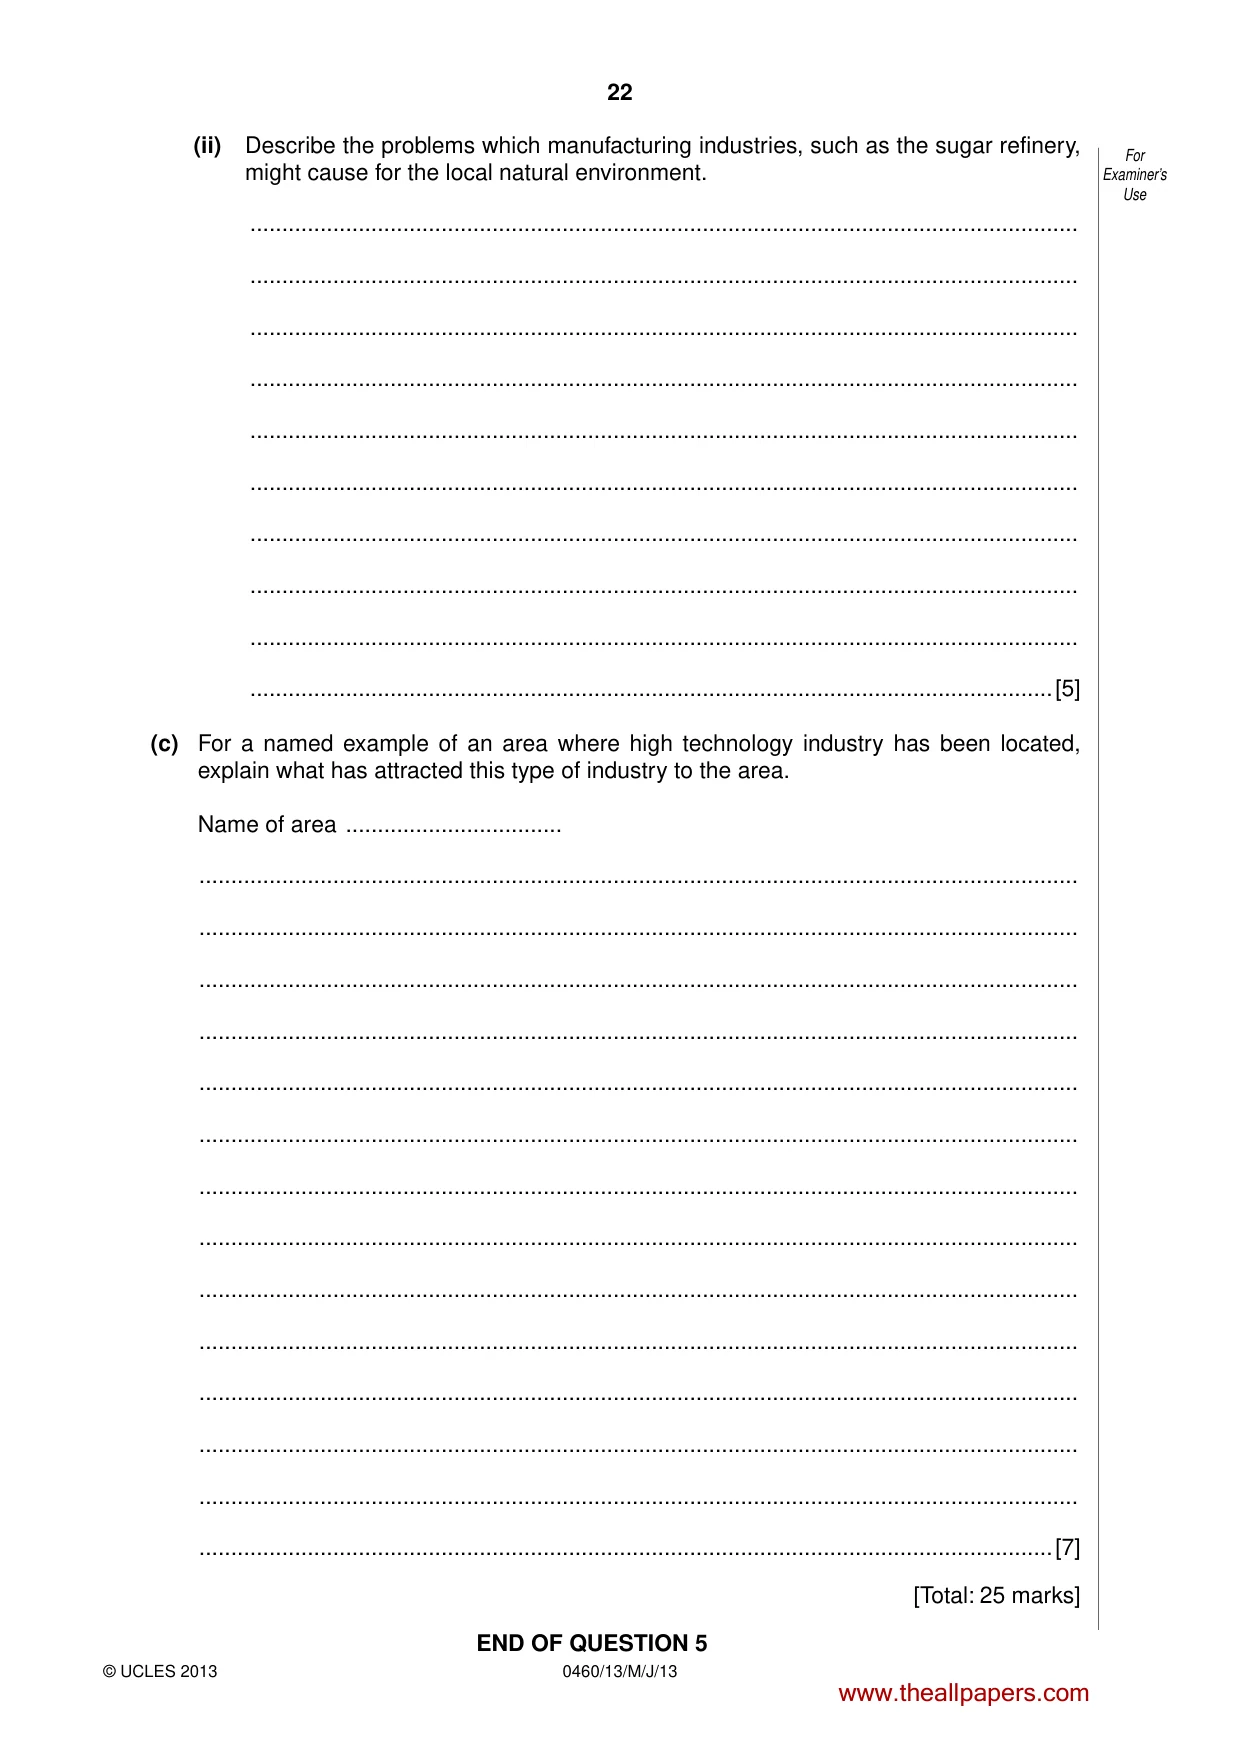
22 0460/13/M/J/13 © UCLES 2013 For Examiner’s Use (ii) Describe the problems which manufacturing industries, such as the sugar refinery, might cause for the local natural environment. … … … … … … … … … …[5] (c) For a named example of an area where high technology industry has been located, explain what has attracted this type of industry to the area. Name of area … … … … … … … … … … … … … … …[7] [Total: 25 marks] END OF QUESTION 5 www.theallpapers.com
Question paper, page 23
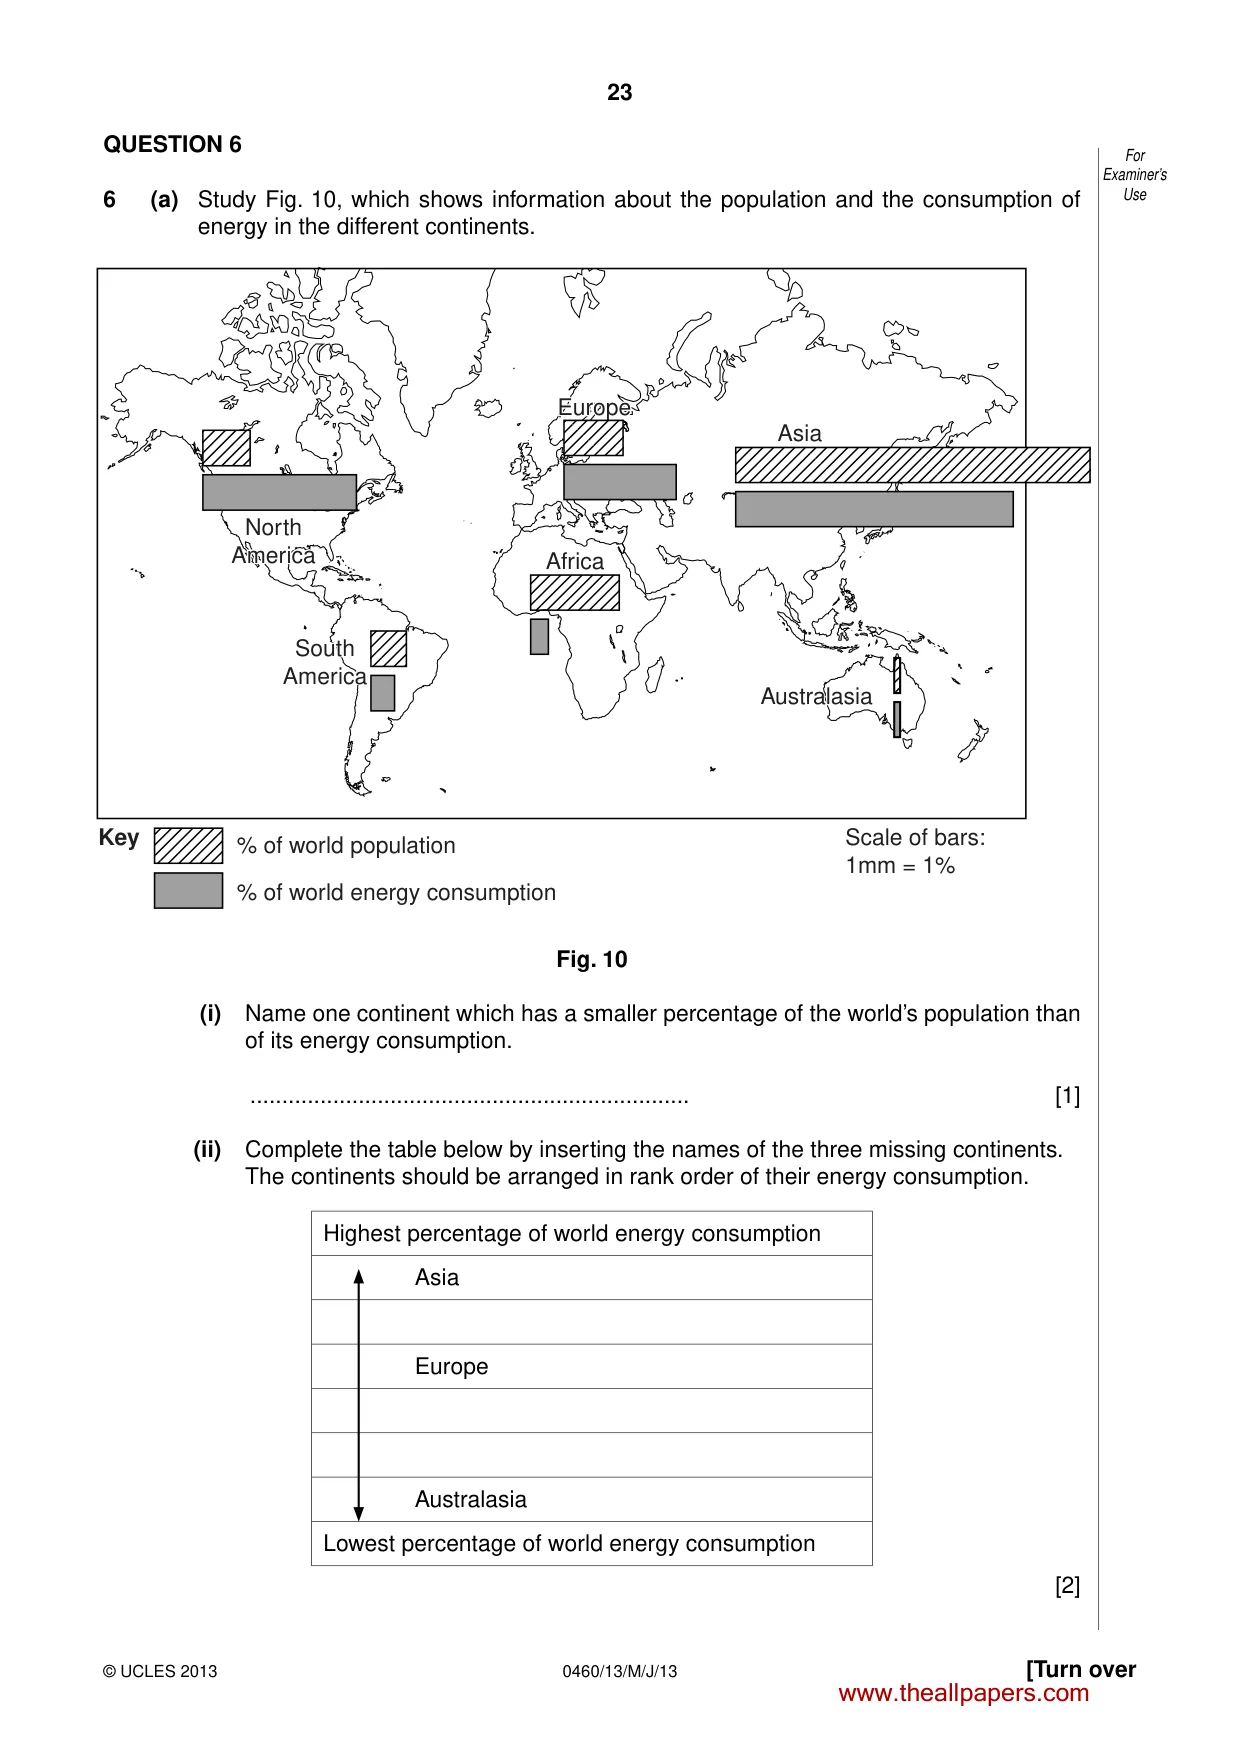
23 0460/13/M/J/13 © UCLES 2013 [Turn over For Examiner’s Use QUESTION 6 6 (a) Study Fig. 10, which shows information about the population and the consumption of energy in the different continents. Key Scale of bars: 1mm = 1% % of world population % of world energy consumption Asia Australasia Australasia Africa Europe Europe South America South America North America North America Fig. 10 (i) Name one continent which has a smaller percentage of the world’s population than of its energy consumption. … [1] (ii) Complete the table below by inserting the names of the three missing continents. The continents should be arranged in rank order of their energy consumption. Highest percentage of world energy consumption Asia Europe Australasia Lowest percentage of world energy consumption [2] www.theallpapers.com
Question paper, page 24
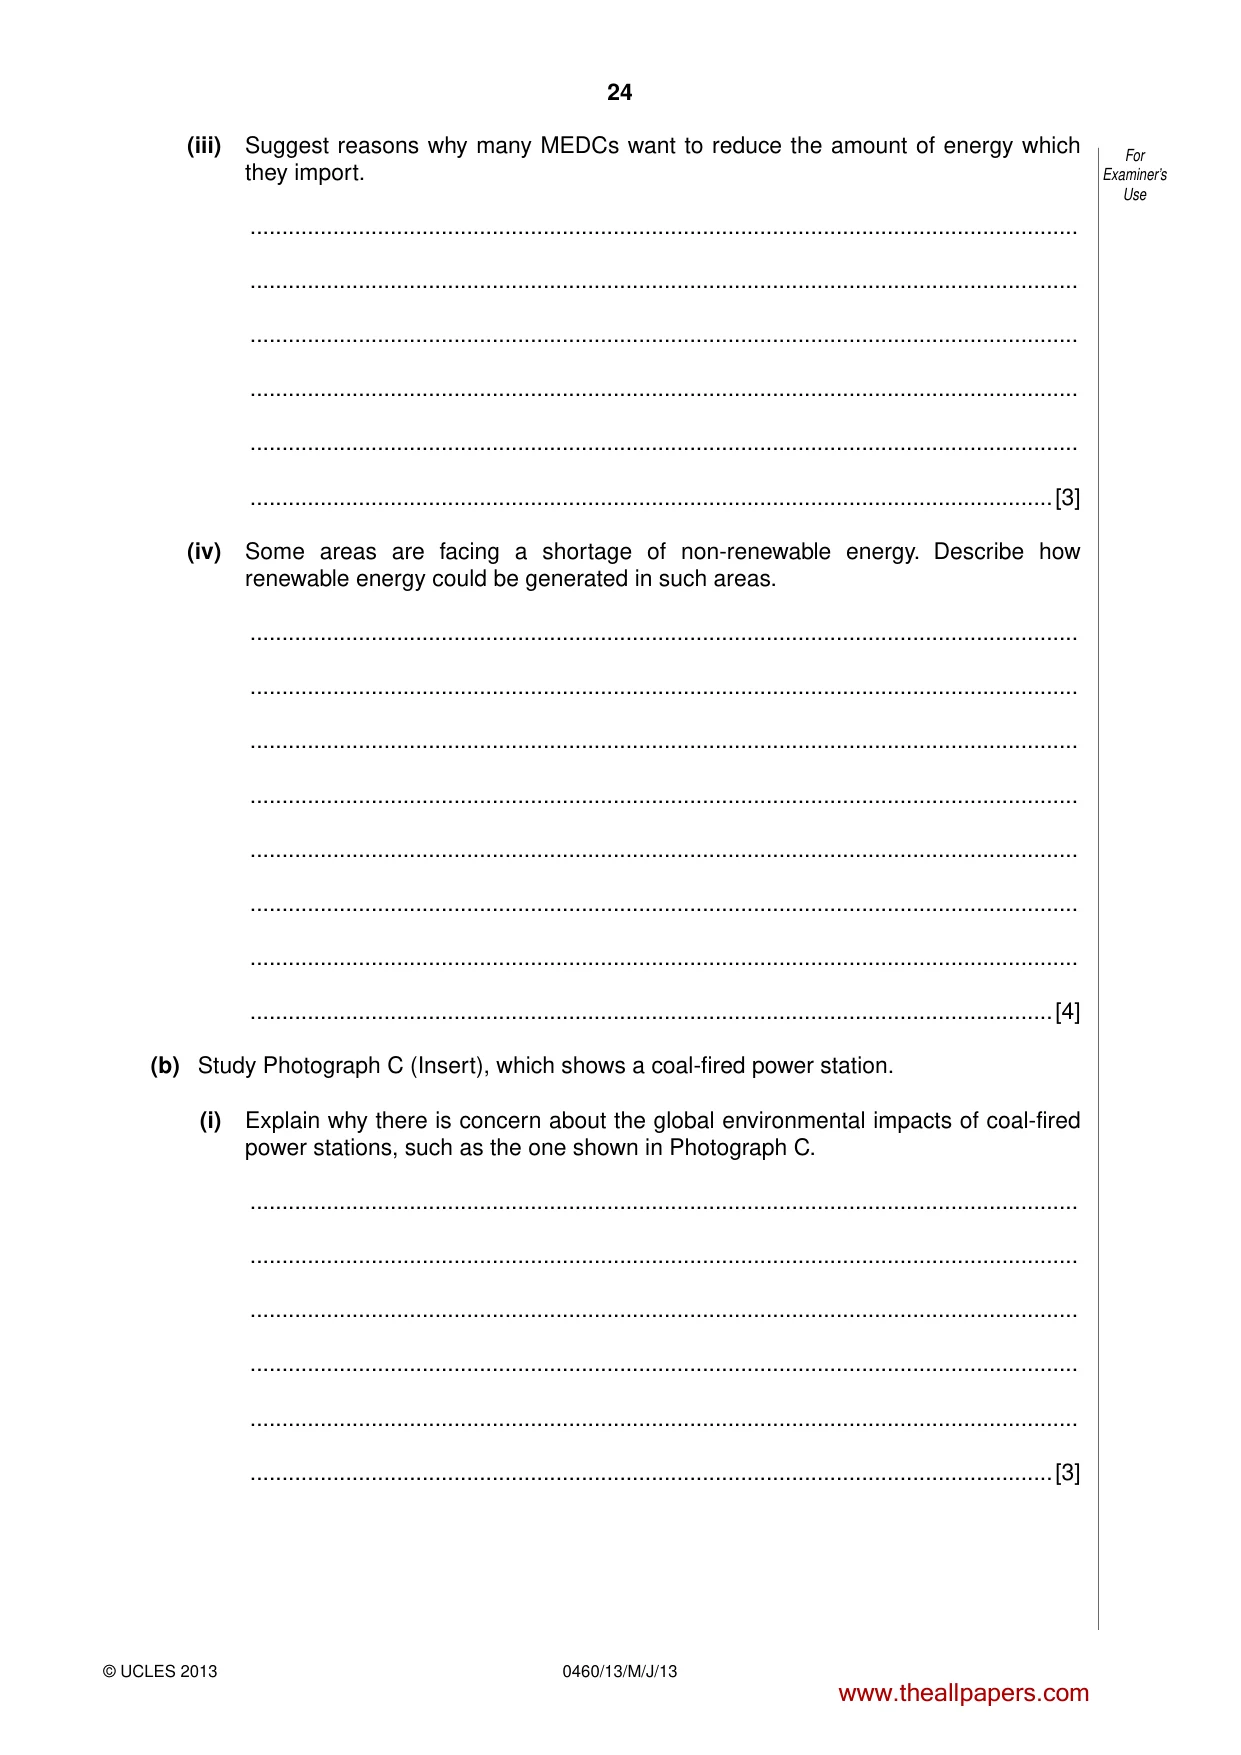
24 0460/13/M/J/13 © UCLES 2013 For Examiner’s Use (iii) Suggest reasons why many MEDCs want to reduce the amount of energy which they import. … … … … … …[3] (iv) Some areas are facing a shortage of non-renewable energy. Describe how renewable energy could be generated in such areas. … … … … … … … …[4] (b) Study Photograph C (Insert), which shows a coal-fired power station. (i) Explain why there is concern about the global environmental impacts of coal-fired power stations, such as the one shown in Photograph C. … … … … … …[3] www.theallpapers.com
Question paper, page 25
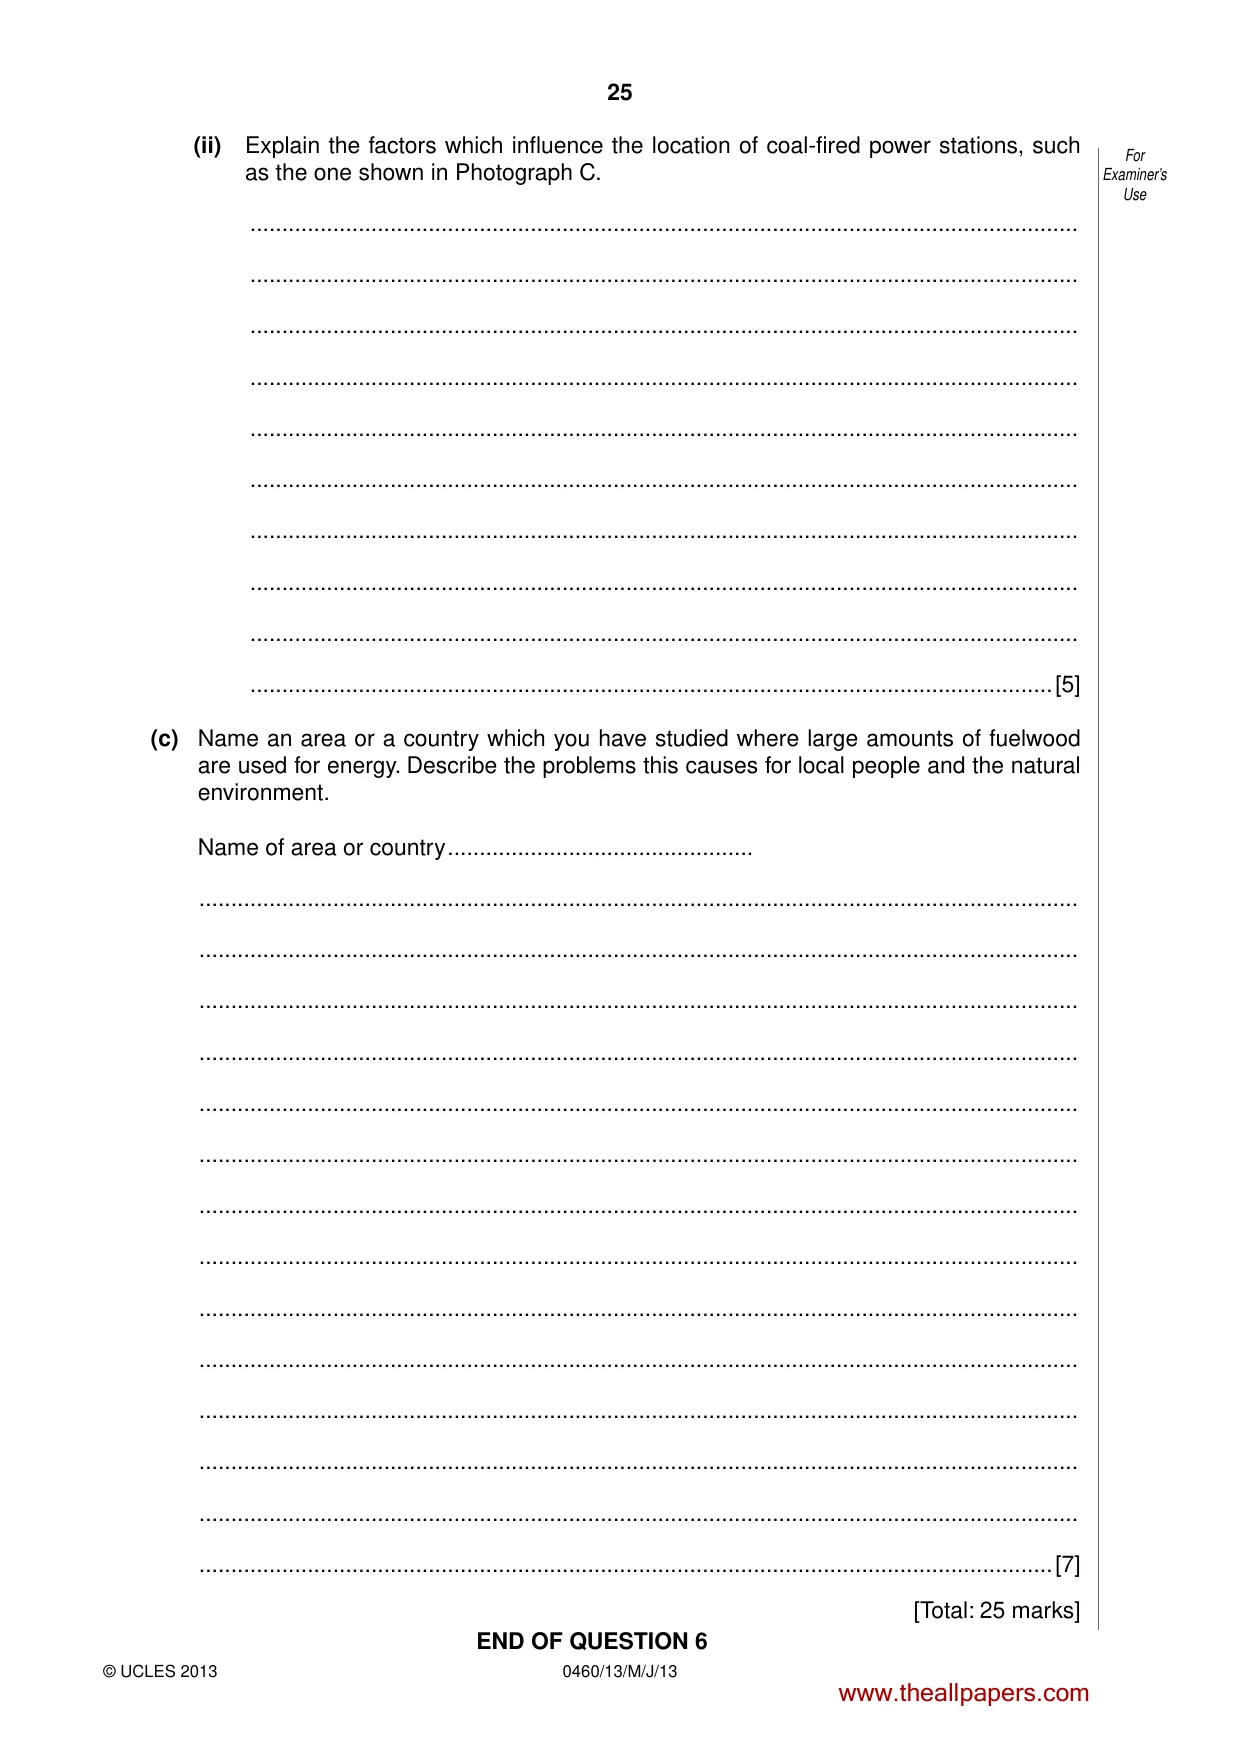
25 0460/13/M/J/13 © UCLES 2013 For Examiner’s Use (ii) Explain the factors which influence the location of coal-fired power stations, such as the one shown in Photograph C. … … … … … … … … … …[5] (c) Name an area or a country which you have studied where large amounts of fuelwood are used for energy. Describe the problems this causes for local people and the natural environment. Name of area or country … … … … … … … … … … … … … … …[7] [Total: 25 marks] END OF QUESTION 6 www.theallpapers.com
Question paper, page 26
26 0460/13/M/J/13 © UCLES 2013 Additional Page If you use the following lined page to complete the answer(s) to any question(s), the question number(s) must be clearly shown. … … … … … … … … … … … … … … … … … … … … … … … … … … www.theallpapers.com
Question paper, page 27
27 0460/13/M/J/13 © UCLES 2013 BLANK PAGE www.theallpapers.com
Question paper, page 28
28 0460/13/M/J/13 © UCLES 2013 BLANK PAGE Copyright Acknowledgements: Question 1 Photograph A S Sibley © UCLES. Question 5 Photograph B S Sibley © UCLES. Question 6 Photograph C S Sibley © UCLES. Permission to reproduce items where third-party owned material protected by copyright is included has been sought and cleared where possible. Every reasonable effort has been made by the publisher (UCLES) to trace copyright holders, but if any items requiring clearance have unwittingly been included, the publisher will be pleased to make amends at the earliest possible opportunity. University of Cambridge International Examinations is part of the Cambridge Assessment Group. Cambridge Assessment is the brand name of University of Cambridge Local Examinations Syndicate (UCLES), which is itself a department of the University of Cambridge. www.theallpapers.com
Mark scheme, page 1
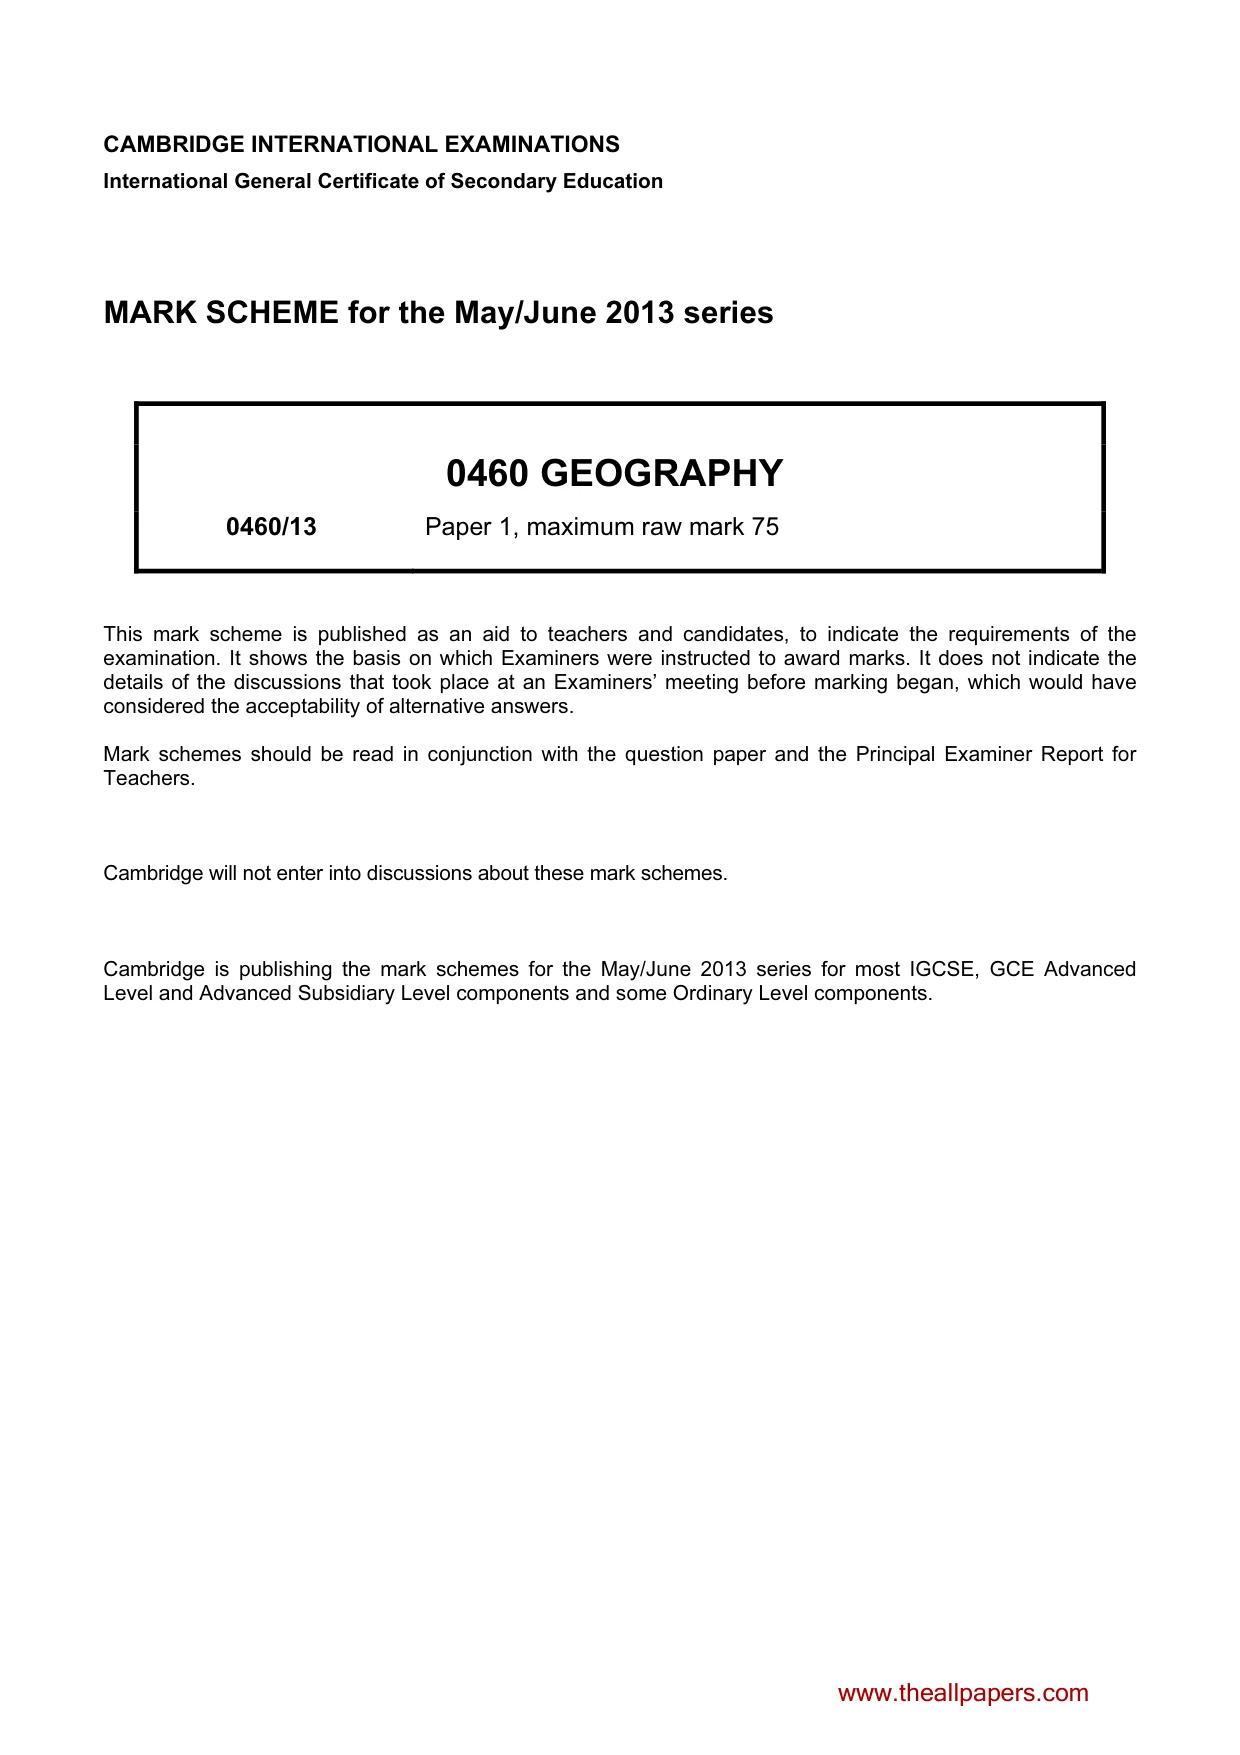
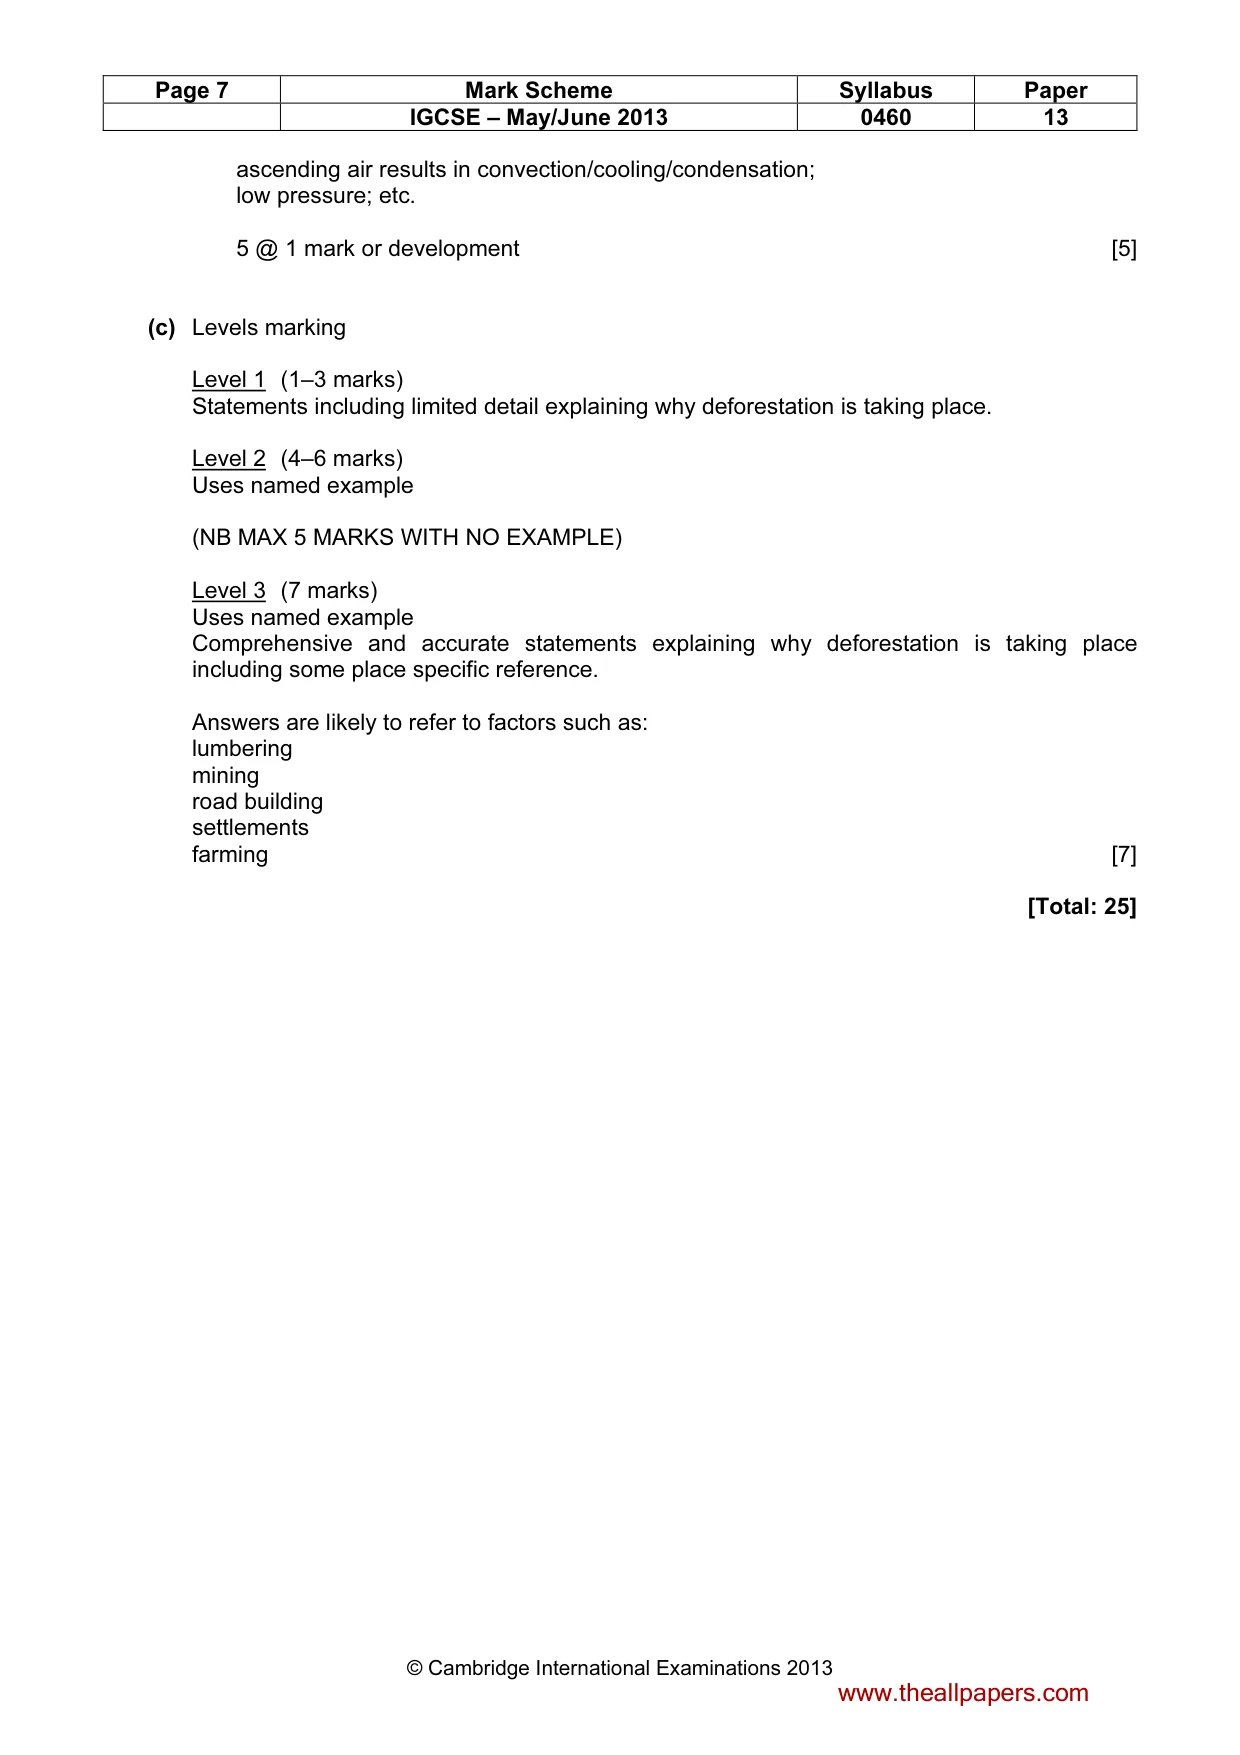
CAMBRIDGE INTERNATIONAL EXAMINATIONS International General Certificate of Secondary Education MARK SCHEME for the May/June 2013 series 0460 GEOGRAPHY 0460/13 Paper 1, maximum raw mark 75 This mark scheme is published as an aid to teachers and candidates, to indicate the requirements of the examination. It shows the basis on which Examiners were instructed to award marks. It does not indicate the details of the discussions that took place at an Examiners’ meeting before marking began, which would have considered the acceptability of alternative answers. Mark schemes should be read in conjunction with the question paper and the Principal Examiner Report for Teachers. Cambridge will not enter into discussions about these mark schemes. Cambridge is publishing the mark schemes for the May/June 2013 series for most IGCSE, GCE Advanced Level and Advanced Subsidiary Level components and some Ordinary Level components. www.theallpapers.com
Mark scheme, page 2
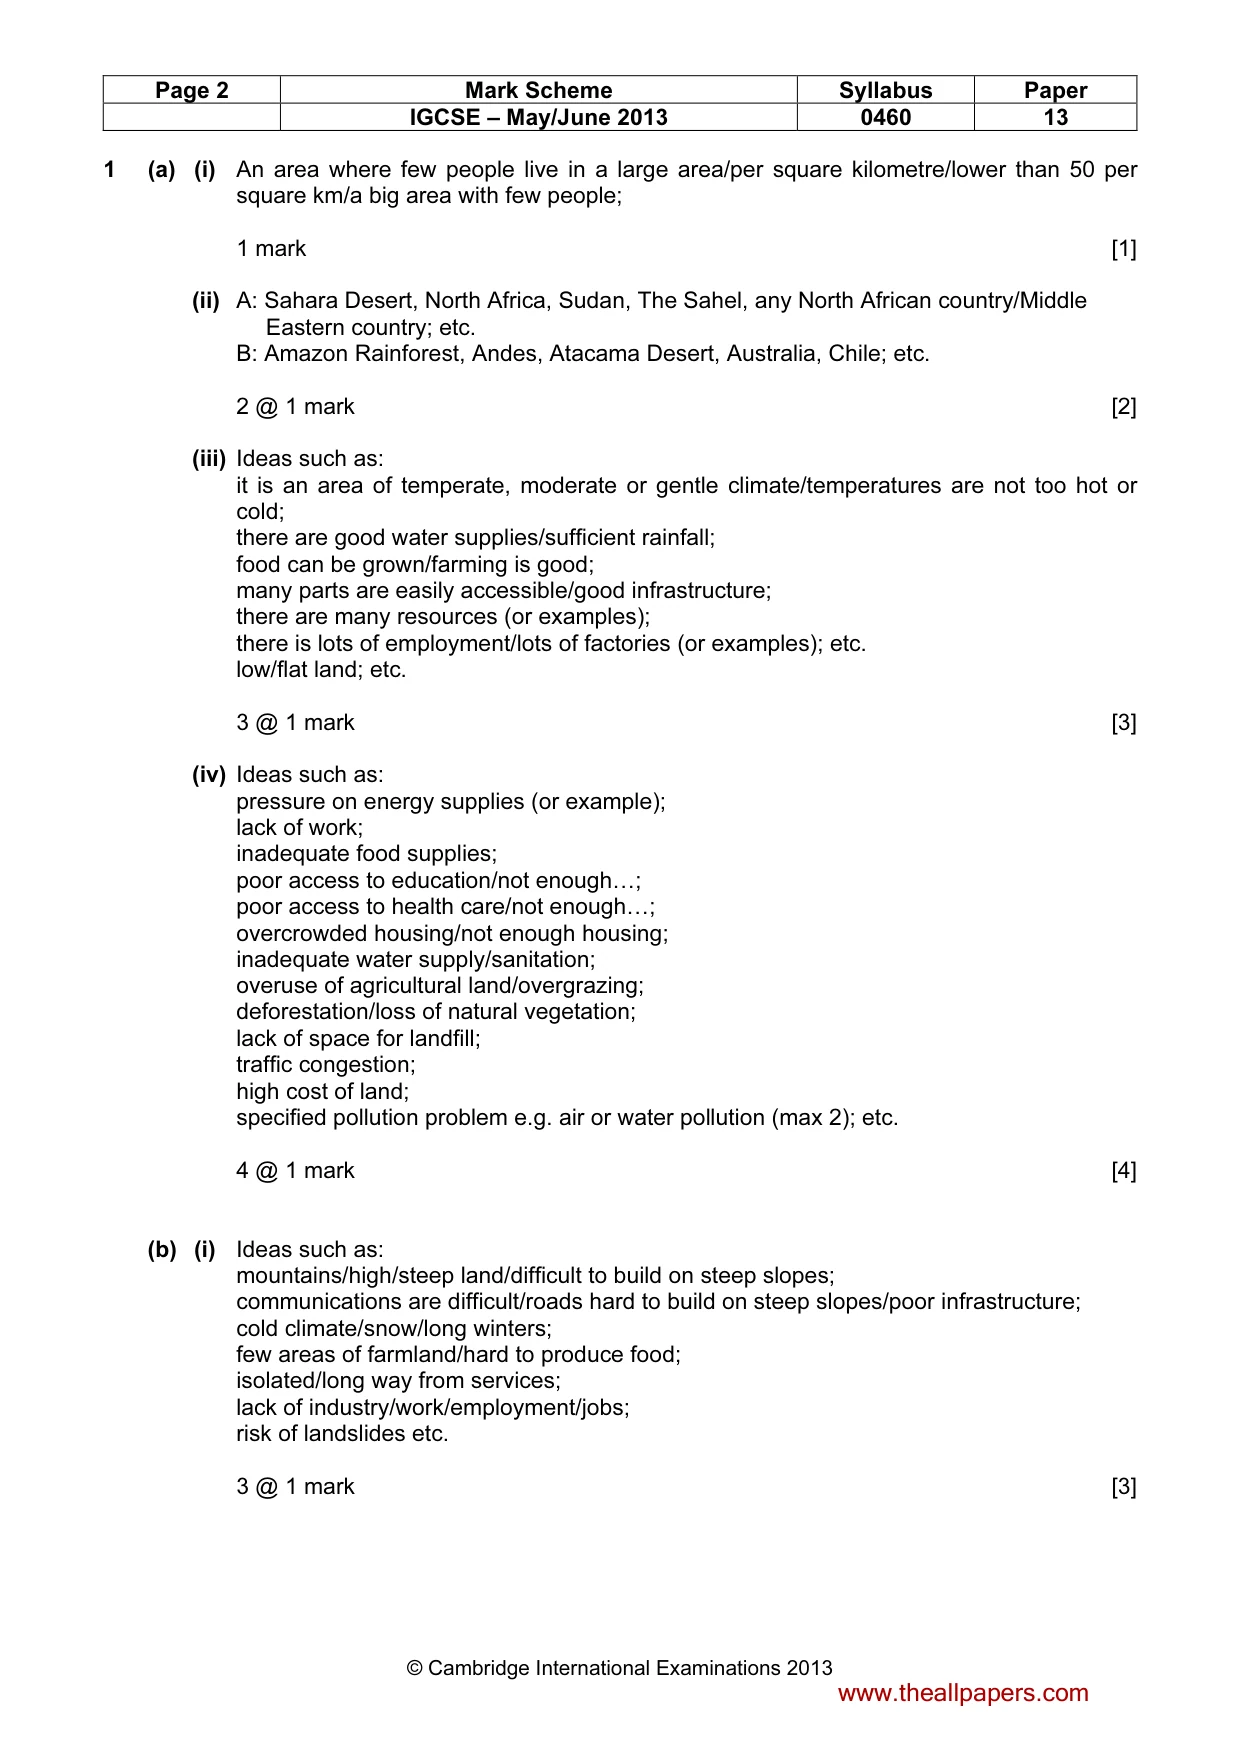
Page 2 Mark Scheme Syllabus Paper IGCSE – May/June 2013 0460 13 © Cambridge International Examinations 2013 1 (a) (i) An area where few people live in a large area/per square kilometre/lower than 50 per square km/a big area with few people; 1 mark [1] (ii) A: Sahara Desert, North Africa, Sudan, The Sahel, any North African country/Middle Eastern country; etc. B: Amazon Rainforest, Andes, Atacama Desert, Australia, Chile; etc. 2 @ 1 mark [2] (iii) Ideas such as: it is an area of temperate, moderate or gentle climate/temperatures are not too hot or cold; there are good water supplies/sufficient rainfall; food can be grown/farming is good; many parts are easily accessible/good infrastructure; there are many resources (or examples); there is lots of employment/lots of factories (or examples); etc. low/flat land; etc. 3 @ 1 mark [3] (iv) Ideas such as: pressure on energy supplies (or example); lack of work; inadequate food supplies; poor access to education/not enough…; poor access to health care/not enough…; overcrowded housing/not enough housing; inadequate water supply/sanitation; overuse of agricultural land/overgrazing; deforestation/loss of natural vegetation; lack of space for landfill; traffic congestion; high cost of land; specified pollution problem e.g. air or water pollution (max 2); etc. 4 @ 1 mark [4] (b) (i) Ideas such as: mountains/high/steep land/difficult to build on steep slopes; communications are difficult/roads hard to build on steep slopes/poor infrastructure; cold climate/snow/long winters; few areas of farmland/hard to produce food; isolated/long way from services; lack of industry/work/employment/jobs; risk of landslides etc. 3 @ 1 mark [3] www.theallpapers.com
Mark scheme, page 3
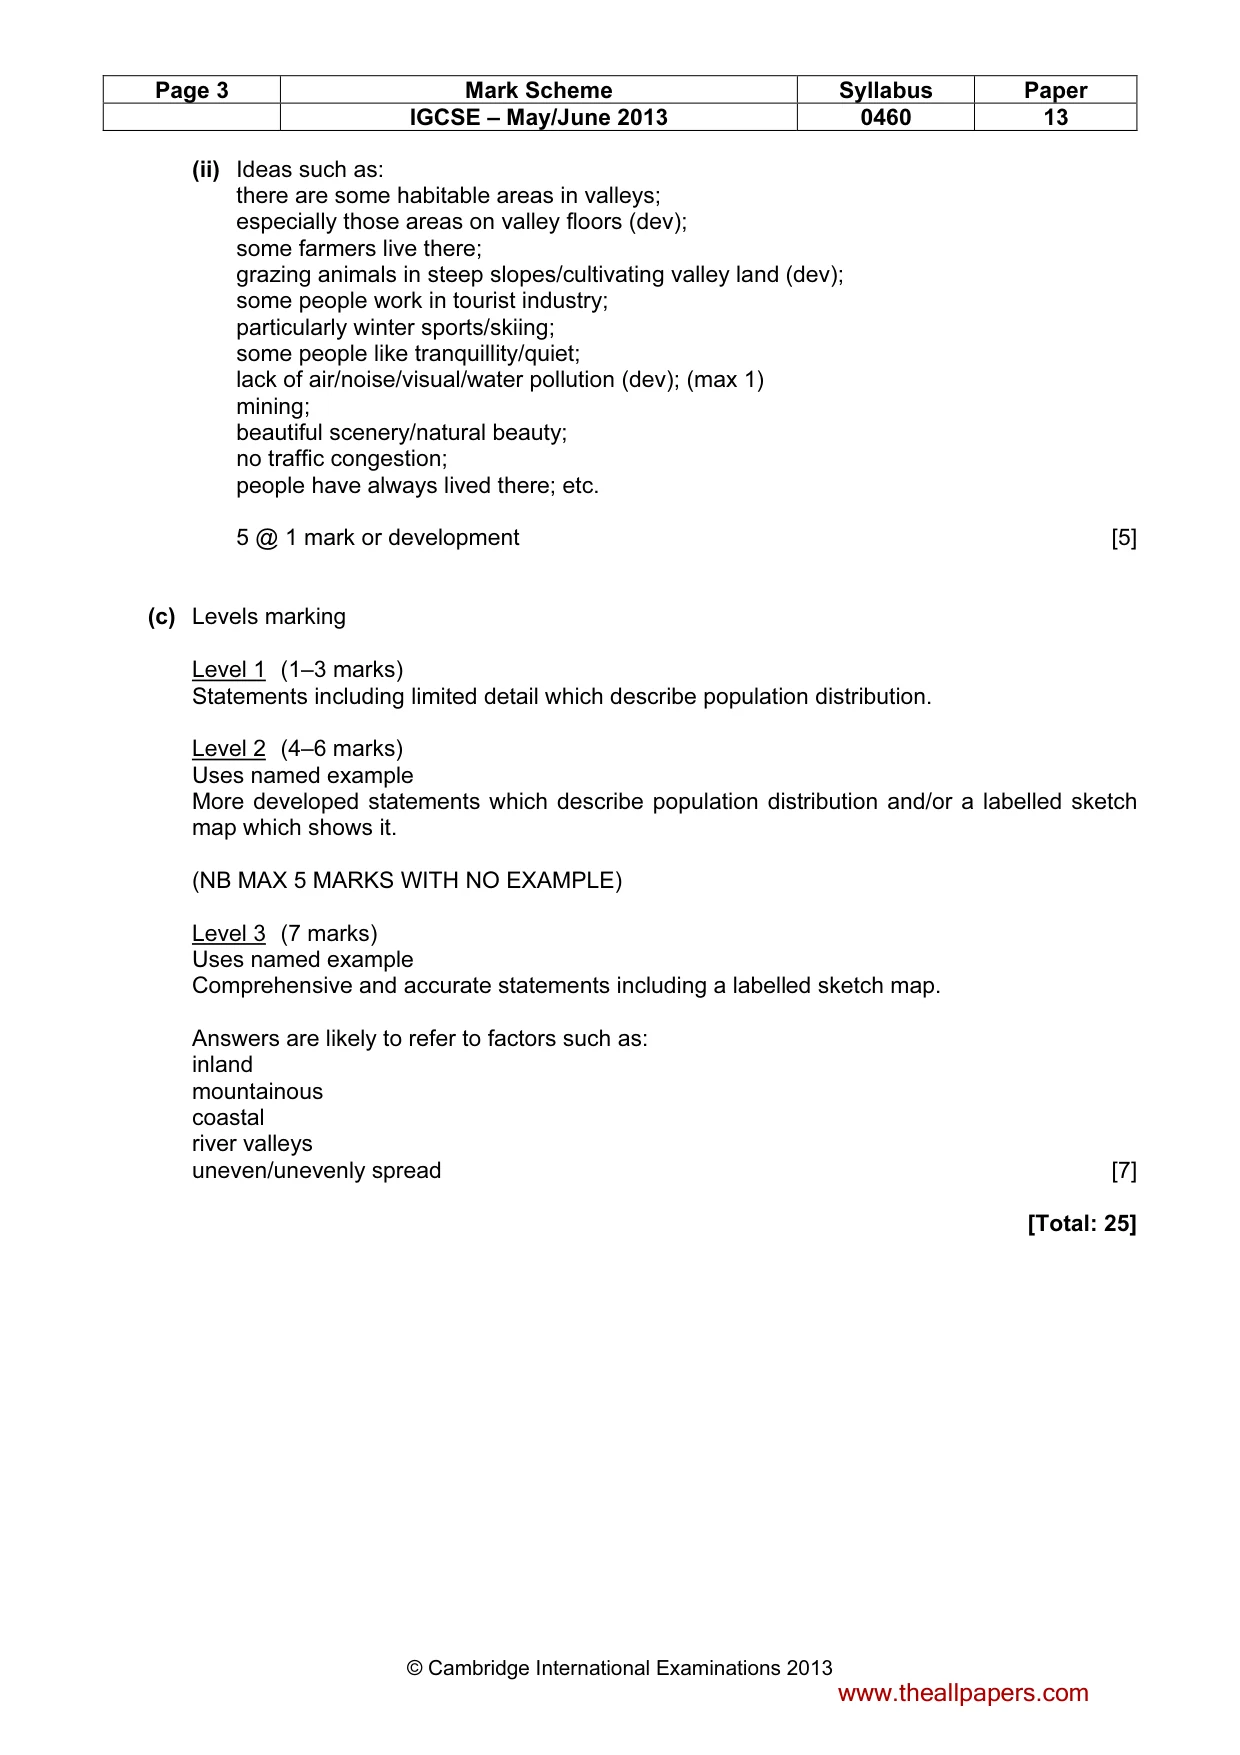
Page 3 Mark Scheme Syllabus Paper IGCSE – May/June 2013 0460 13 © Cambridge International Examinations 2013 (ii) Ideas such as: there are some habitable areas in valleys; especially those areas on valley floors (dev); some farmers live there; grazing animals in steep slopes/cultivating valley land (dev); some people work in tourist industry; particularly winter sports/skiing; some people like tranquillity/quiet; lack of air/noise/visual/water pollution (dev); (max 1) mining; beautiful scenery/natural beauty; no traffic congestion; people have always lived there; etc. 5 @ 1 mark or development [5] (c) Levels marking Level 1 (1–3 marks) Statements including limited detail which describe population distribution. Level 2 (4–6 marks) Uses named example More developed statements which describe population distribution and/or a labelled sketch map which shows it. (NB MAX 5 MARKS WITH NO EXAMPLE) Level 3 (7 marks) Uses named example Comprehensive and accurate statements including a labelled sketch map. Answers are likely to refer to factors such as: inland mountainous coastal river valleys uneven/unevenly spread [7] [Total: 25] www.theallpapers.com
Mark scheme, page 4
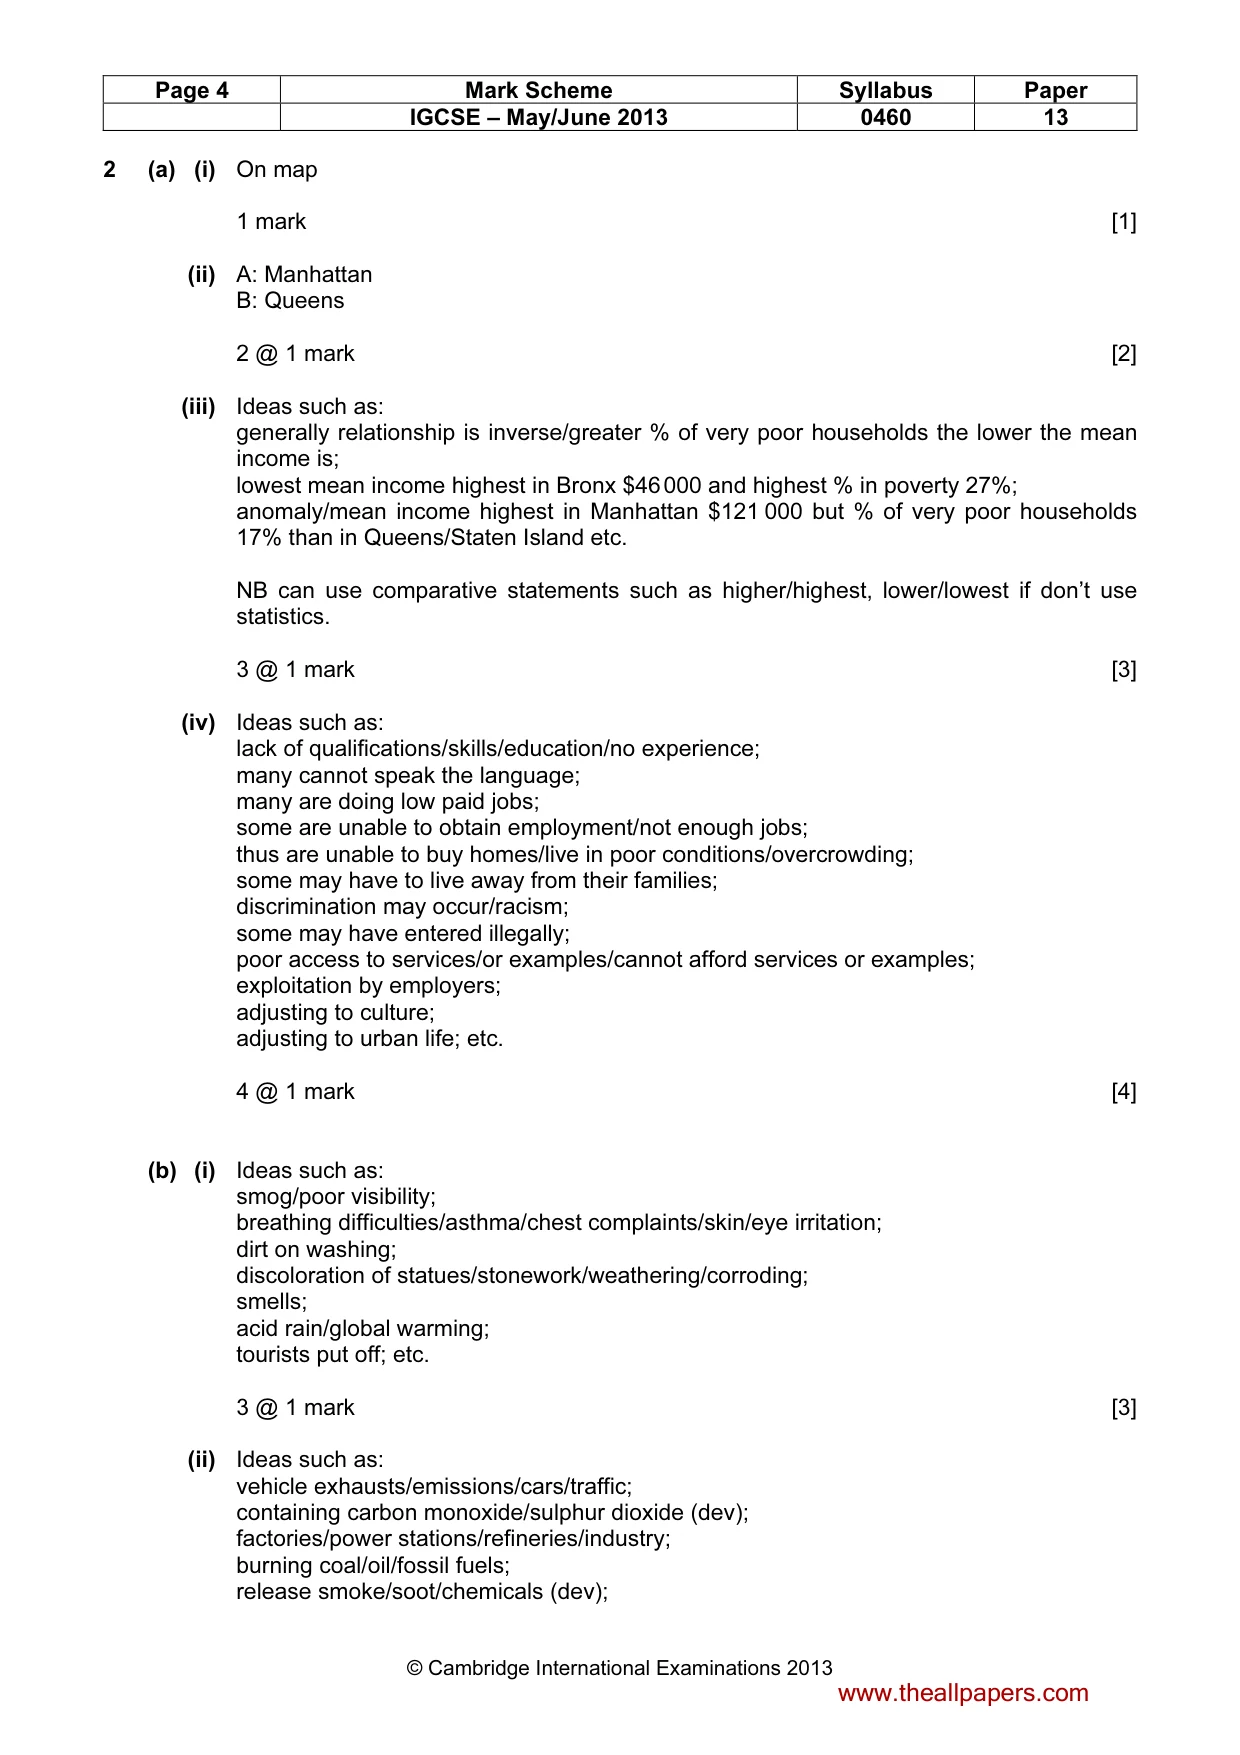
Page 4 Mark Scheme Syllabus Paper IGCSE – May/June 2013 0460 13 © Cambridge International Examinations 2013 2 (a) (i) On map 1 mark [1] (ii) A: Manhattan B: Queens 2 @ 1 mark [2] (iii) Ideas such as: generally relationship is inverse/greater % of very poor households the lower the mean income is; lowest mean income highest in Bronx $46 000 and highest % in poverty 27%; anomaly/mean income highest in Manhattan $121 000 but % of very poor households 17% than in Queens/Staten Island etc. NB can use comparative statements such as higher/highest, lower/lowest if don’t use statistics. 3 @ 1 mark [3] (iv) Ideas such as: lack of qualifications/skills/education/no experience; many cannot speak the language; many are doing low paid jobs; some are unable to obtain employment/not enough jobs; thus are unable to buy homes/live in poor conditions/overcrowding; some may have to live away from their families; discrimination may occur/racism; some may have entered illegally; poor access to services/or examples/cannot afford services or examples; exploitation by employers; adjusting to culture; adjusting to urban life; etc. 4 @ 1 mark [4] (b) (i) Ideas such as: smog/poor visibility; breathing difficulties/asthma/chest complaints/skin/eye irritation; dirt on washing; discoloration of statues/stonework/weathering/corroding; smells; acid rain/global warming; tourists put off; etc. 3 @ 1 mark [3] (ii) Ideas such as: vehicle exhausts/emissions/cars/traffic; containing carbon monoxide/sulphur dioxide (dev); factories/power stations/refineries/industry; burning coal/oil/fossil fuels; release smoke/soot/chemicals (dev); www.theallpapers.com
Mark scheme, page 5
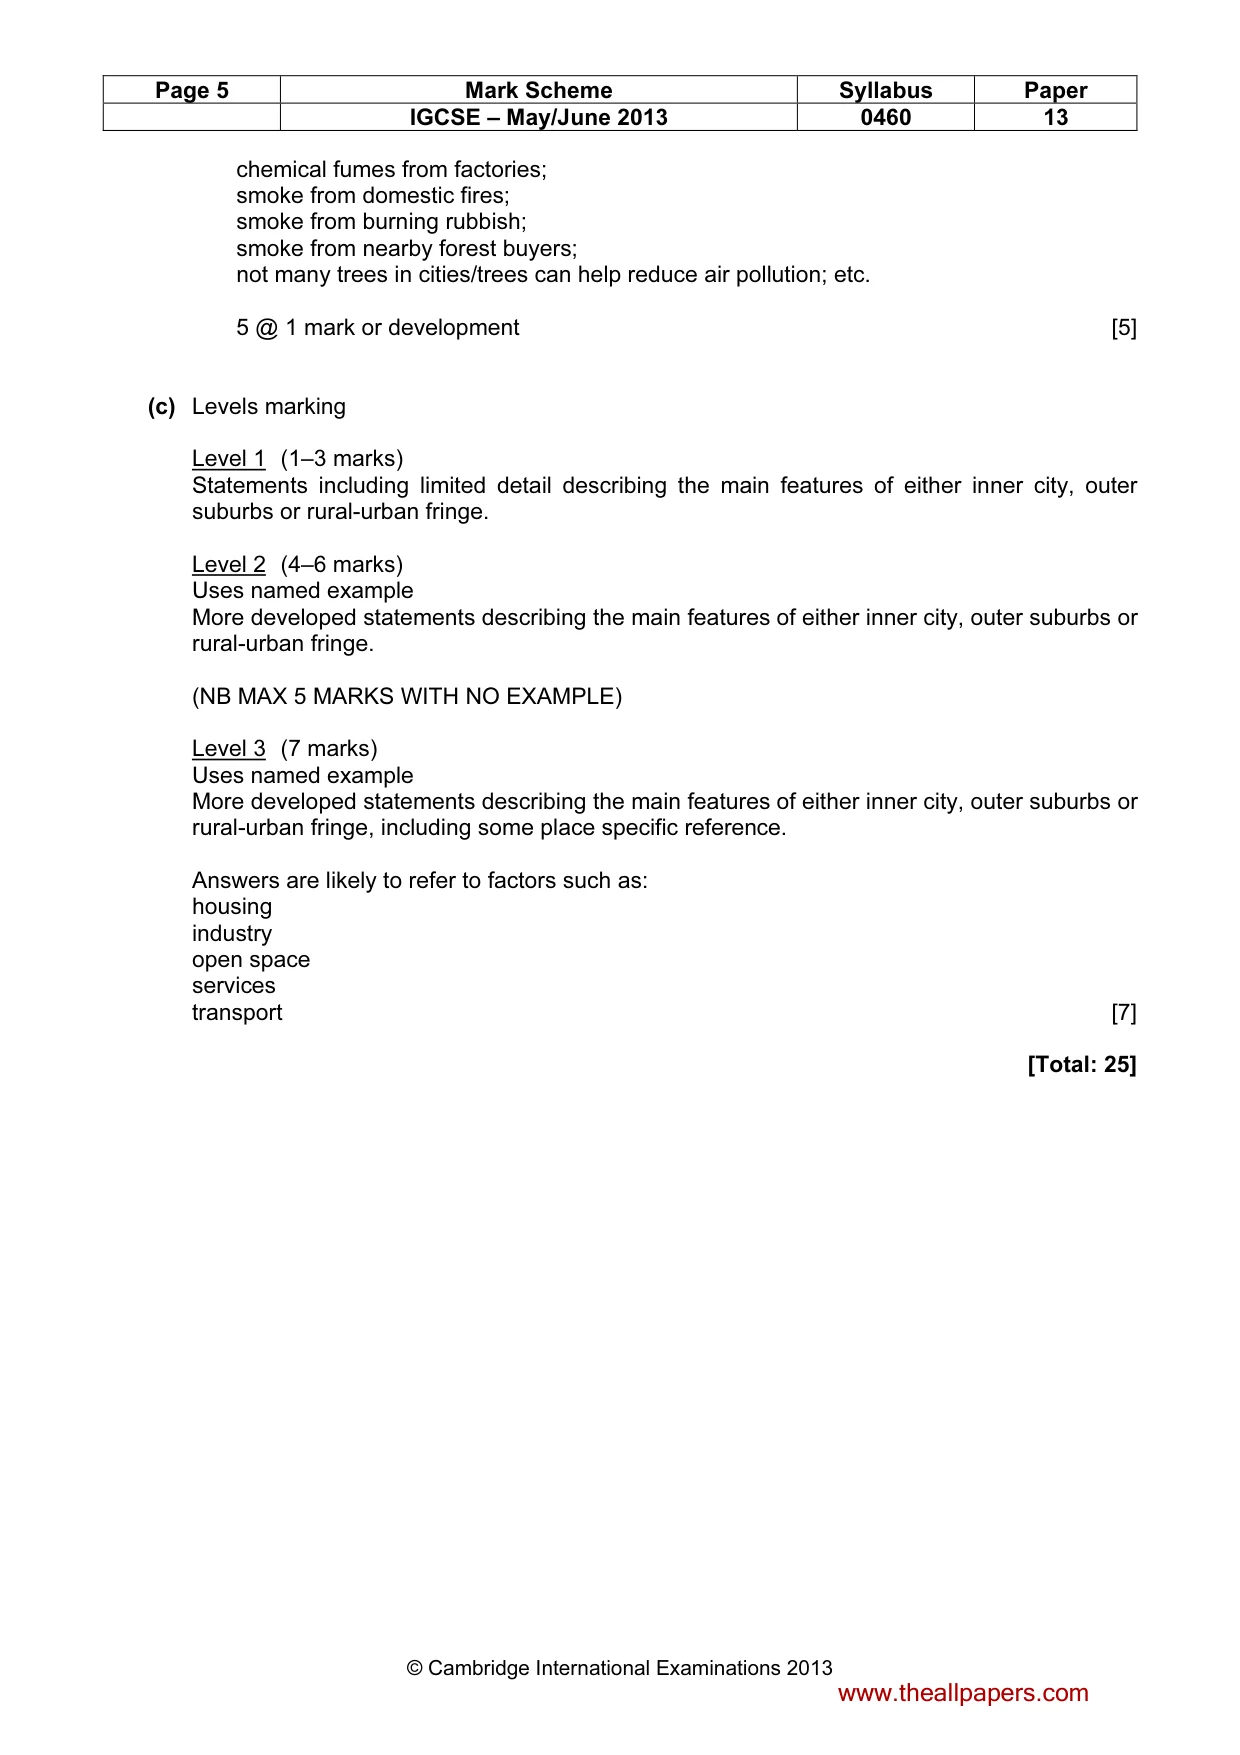
Page 5 Mark Scheme Syllabus Paper IGCSE – May/June 2013 0460 13 © Cambridge International Examinations 2013 chemical fumes from factories; smoke from domestic fires; smoke from burning rubbish; smoke from nearby forest buyers; not many trees in cities/trees can help reduce air pollution; etc. 5 @ 1 mark or development [5] (c) Levels marking Level 1 (1–3 marks) Statements including limited detail describing the main features of either inner city, outer suburbs or rural-urban fringe. Level 2 (4–6 marks) Uses named example More developed statements describing the main features of either inner city, outer suburbs or rural-urban fringe. (NB MAX 5 MARKS WITH NO EXAMPLE) Level 3 (7 marks) Uses named example More developed statements describing the main features of either inner city, outer suburbs or rural-urban fringe, including some place specific reference. Answers are likely to refer to factors such as: housing industry open space services transport [7] [Total: 25] www.theallpapers.com
Mark scheme, page 6
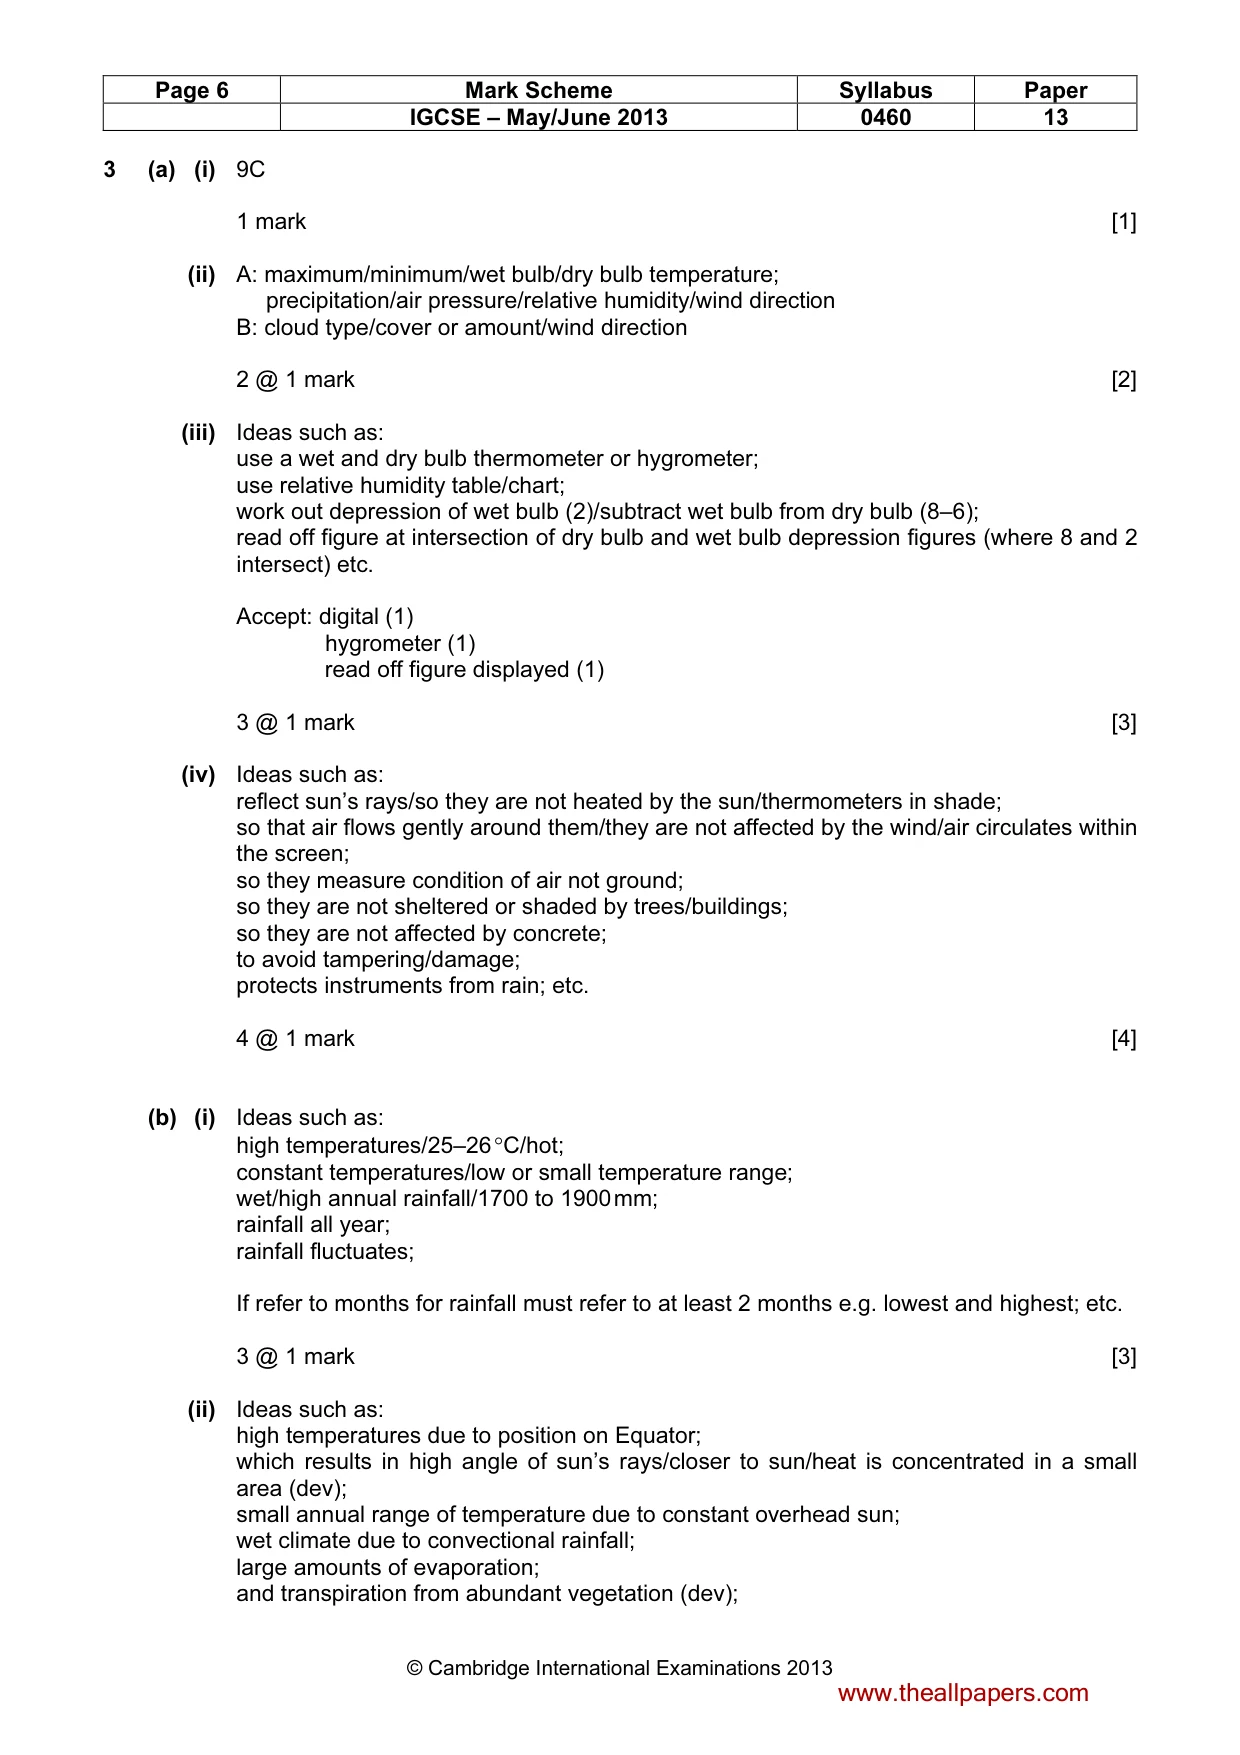
Page 6 Mark Scheme Syllabus Paper IGCSE – May/June 2013 0460 13 © Cambridge International Examinations 2013 3 (a) (i) 9C 1 mark [1] (ii) A: maximum/minimum/wet bulb/dry bulb temperature; precipitation/air pressure/relative humidity/wind direction B: cloud type/cover or amount/wind direction 2 @ 1 mark [2] (iii) Ideas such as: use a wet and dry bulb thermometer or hygrometer; use relative humidity table/chart; work out depression of wet bulb (2)/subtract wet bulb from dry bulb (8–6); read off figure at intersection of dry bulb and wet bulb depression figures (where 8 and 2 intersect) etc. Accept: digital (1) hygrometer (1) read off figure displayed (1) 3 @ 1 mark [3] (iv) Ideas such as: reflect sun’s rays/so they are not heated by the sun/thermometers in shade; so that air flows gently around them/they are not affected by the wind/air circulates within the screen; so they measure condition of air not ground; so they are not sheltered or shaded by trees/buildings; so they are not affected by concrete; to avoid tampering/damage; protects instruments from rain; etc. 4 @ 1 mark [4] (b) (i) Ideas such as: high temperatures/25–26 °C/hot; constant temperatures/low or small temperature range; wet/high annual rainfall/1700 to 1900 mm; rainfall all year; rainfall fluctuates; If refer to months for rainfall must refer to at least 2 months e.g. lowest and highest; etc. 3 @ 1 mark [3] (ii) Ideas such as: high temperatures due to position on Equator; which results in high angle of sun’s rays/closer to sun/heat is concentrated in a small area (dev); small annual range of temperature due to constant overhead sun; wet climate due to convectional rainfall; large amounts of evaporation; and transpiration from abundant vegetation (dev); www.theallpapers.com
Mark scheme, page 7
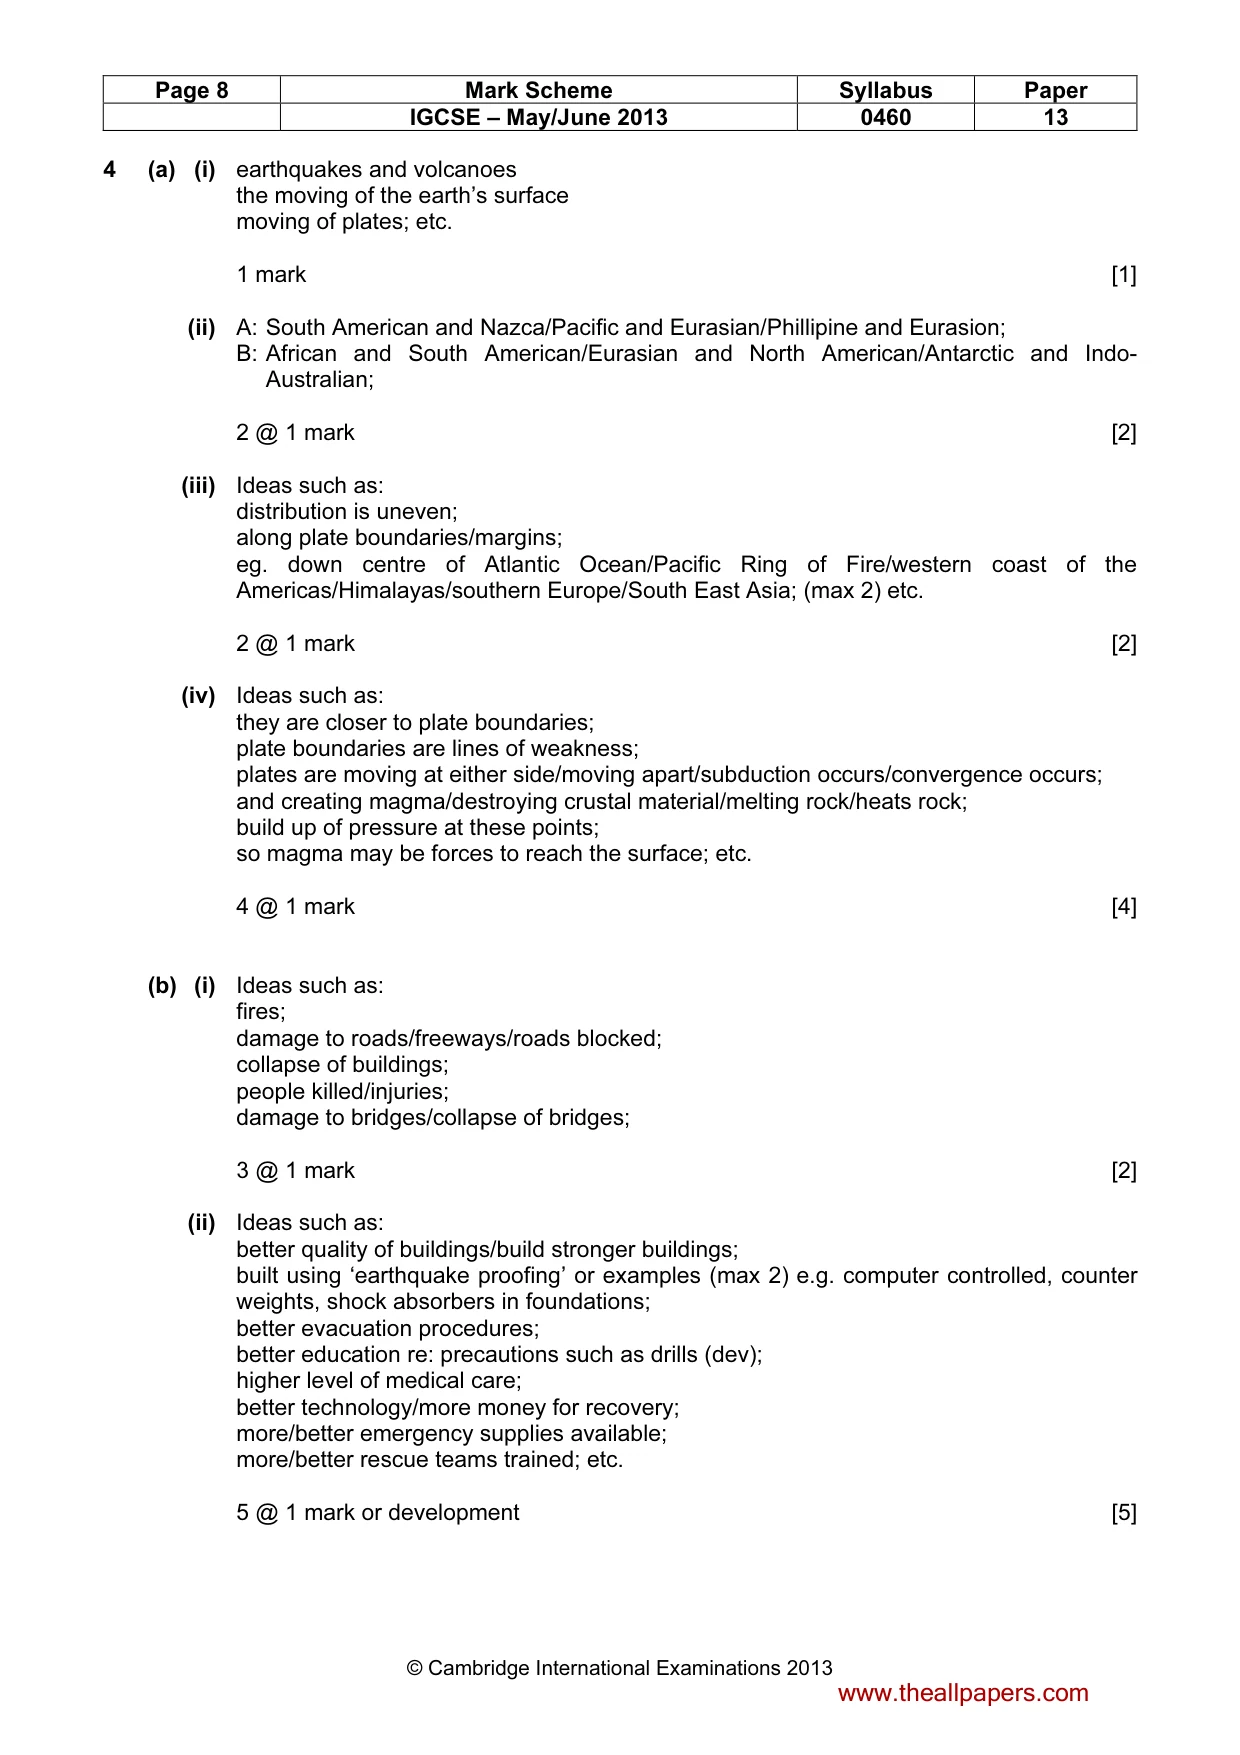
Page 7 Mark Scheme Syllabus Paper IGCSE – May/June 2013 0460 13 © Cambridge International Examinations 2013 ascending air results in convection/cooling/condensation; low pressure; etc. 5 @ 1 mark or development [5] (c) Levels marking Level 1 (1–3 marks) Statements including limited detail explaining why deforestation is taking place. Level 2 (4–6 marks) Uses named example (NB MAX 5 MARKS WITH NO EXAMPLE) Level 3 (7 marks) Uses named example Comprehensive and accurate statements explaining why deforestation is taking place including some place specific reference. Answers are likely to refer to factors such as: lumbering mining road building settlements farming [7] [Total: 25] www.theallpapers.com
Mark scheme, page 8
Page 8 Mark Scheme Syllabus Paper IGCSE – May/June 2013 0460 13 © Cambridge International Examinations 2013 4 (a) (i) earthquakes and volcanoes the moving of the earth’s surface moving of plates; etc. 1 mark [1] (ii) A: South American and Nazca/Pacific and Eurasian/Phillipine and Eurasion; B: African and South American/Eurasian and North American/Antarctic and Indo- Australian; 2 @ 1 mark [2] (iii) Ideas such as: distribution is uneven; along plate boundaries/margins; eg. down centre of Atlantic Ocean/Pacific Ring of Fire/western coast of the Americas/Himalayas/southern Europe/South East Asia; (max 2) etc. 2 @ 1 mark [2] (iv) Ideas such as: they are closer to plate boundaries; plate boundaries are lines of weakness; plates are moving at either side/moving apart/subduction occurs/convergence occurs; and creating magma/destroying crustal material/melting rock/heats rock; build up of pressure at these points; so magma may be forces to reach the surface; etc. 4 @ 1 mark [4] (b) (i) Ideas such as: fires; damage to roads/freeways/roads blocked; collapse of buildings; people killed/injuries; damage to bridges/collapse of bridges; 3 @ 1 mark [2] (ii) Ideas such as: better quality of buildings/build stronger buildings; built using ‘earthquake proofing’ or examples (max 2) e.g. computer controlled, counter weights, shock absorbers in foundations; better evacuation procedures; better education re: precautions such as drills (dev); higher level of medical care; better technology/more money for recovery; more/better emergency supplies available; more/better rescue teams trained; etc. 5 @ 1 mark or development [5] www.theallpapers.com
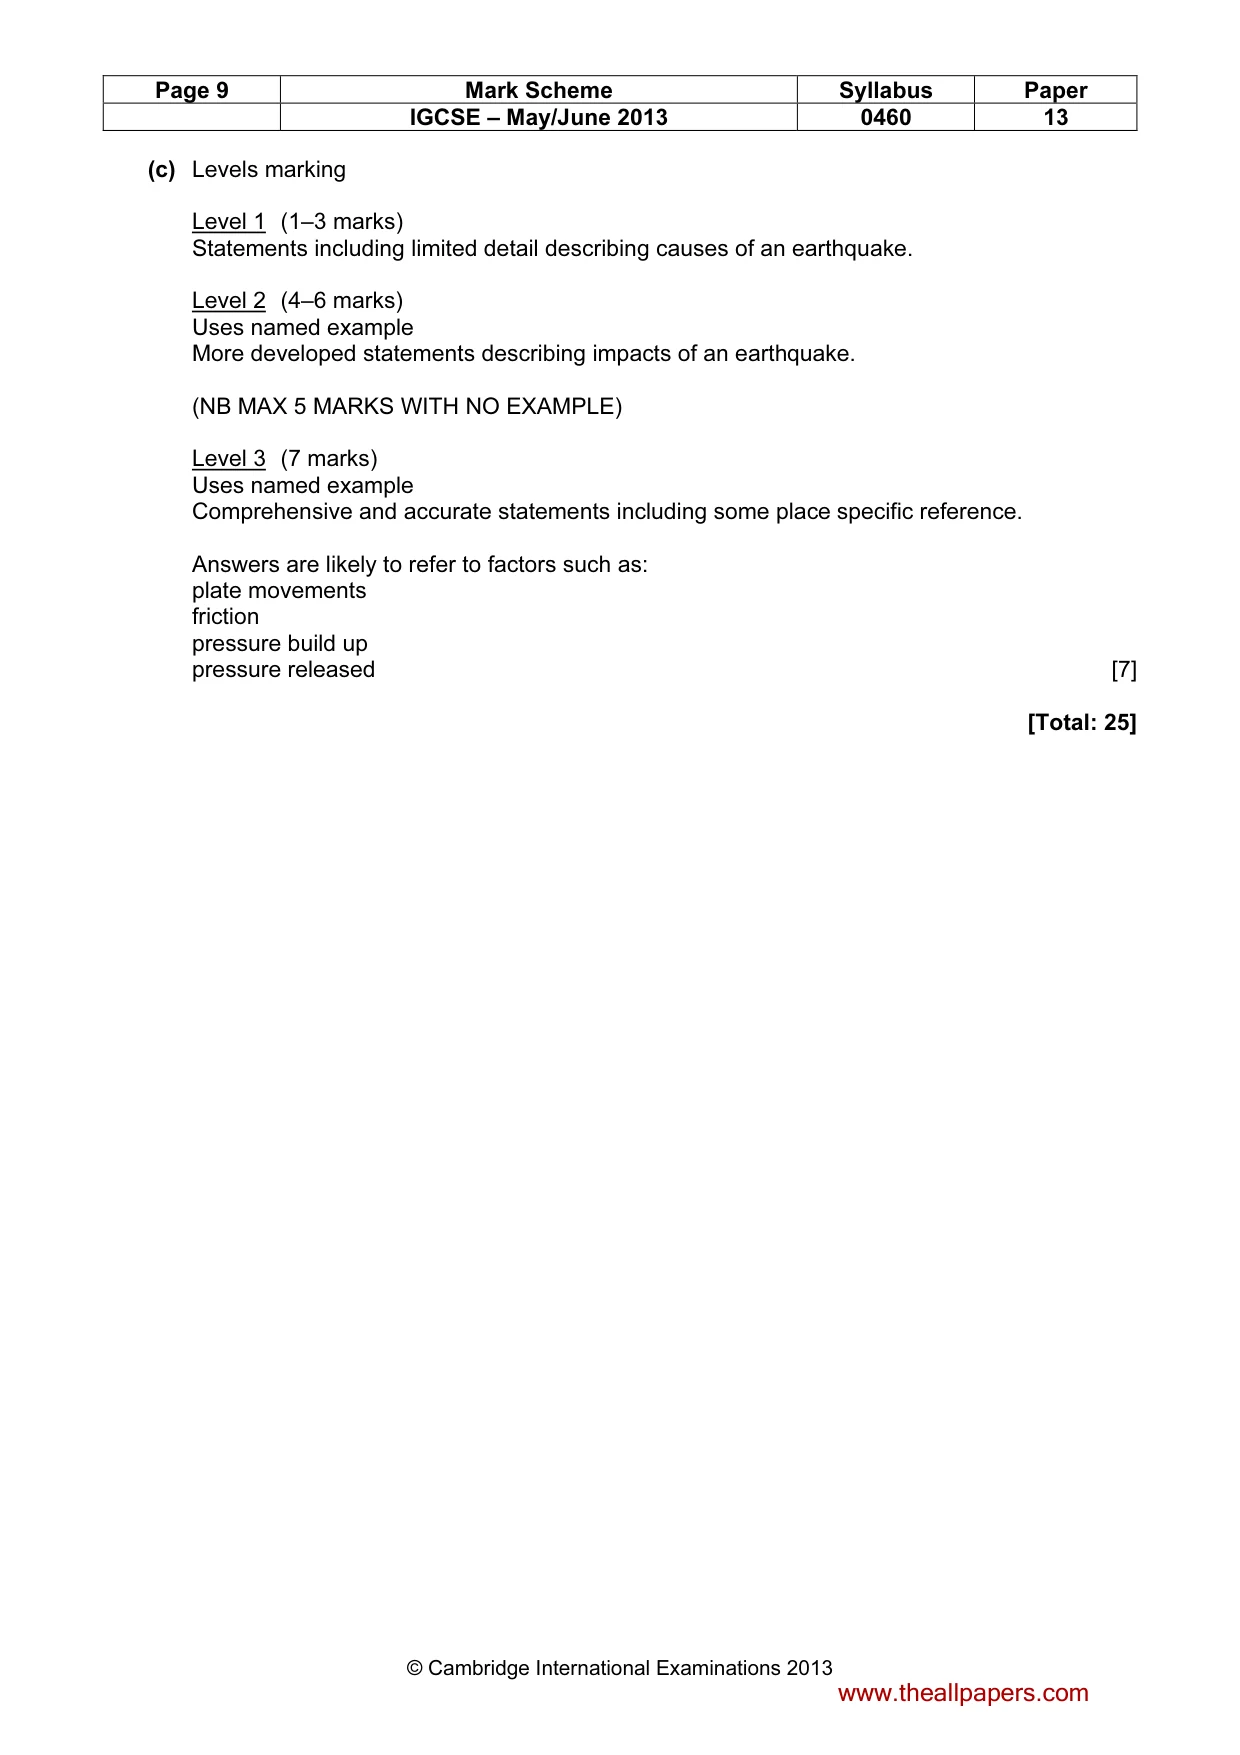
Mark scheme, page 9
Page 9 Mark Scheme Syllabus Paper IGCSE – May/June 2013 0460 13 © Cambridge International Examinations 2013 (c) Levels marking Level 1 (1–3 marks) Statements including limited detail describing causes of an earthquake. Level 2 (4–6 marks) Uses named example More developed statements describing impacts of an earthquake. (NB MAX 5 MARKS WITH NO EXAMPLE) Level 3 (7 marks) Uses named example Comprehensive and accurate statements including some place specific reference. Answers are likely to refer to factors such as: plate movements friction pressure build up pressure released [7] [Total: 25] www.theallpapers.com
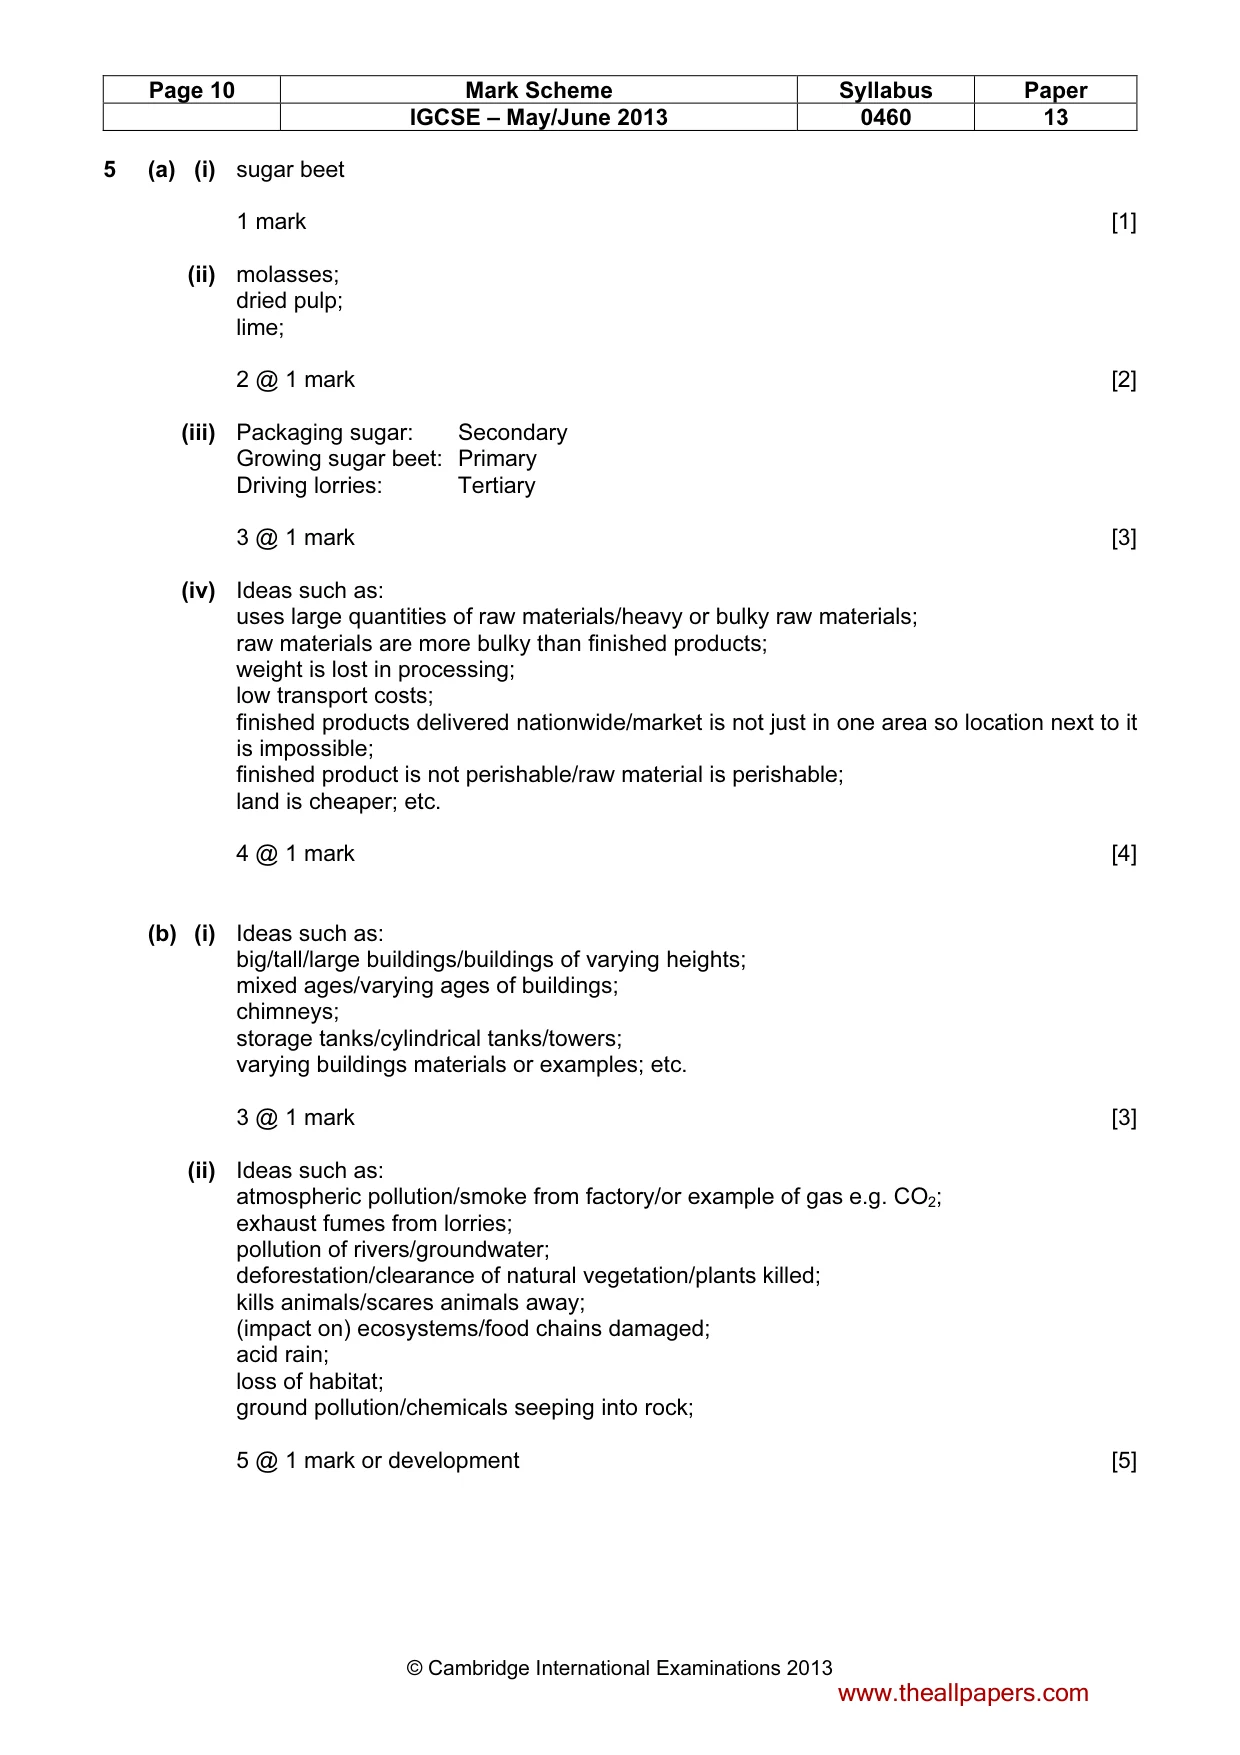
Mark scheme, page 10
Page 10 Mark Scheme Syllabus Paper IGCSE – May/June 2013 0460 13 © Cambridge International Examinations 2013 5 (a) (i) sugar beet 1 mark [1] (ii) molasses; dried pulp; lime; 2 @ 1 mark [2] (iii) Packaging sugar: Secondary Growing sugar beet: Primary Driving lorries: Tertiary 3 @ 1 mark [3] (iv) Ideas such as: uses large quantities of raw materials/heavy or bulky raw materials; raw materials are more bulky than finished products; weight is lost in processing; low transport costs; finished products delivered nationwide/market is not just in one area so location next to it is impossible; finished product is not perishable/raw material is perishable; land is cheaper; etc. 4 @ 1 mark [4] (b) (i) Ideas such as: big/tall/large buildings/buildings of varying heights; mixed ages/varying ages of buildings; chimneys; storage tanks/cylindrical tanks/towers; varying buildings materials or examples; etc. 3 @ 1 mark [3] (ii) Ideas such as: atmospheric pollution/smoke from factory/or example of gas e.g. CO2; exhaust fumes from lorries; pollution of rivers/groundwater; deforestation/clearance of natural vegetation/plants killed; kills animals/scares animals away; (impact on) ecosystems/food chains damaged; acid rain; loss of habitat; ground pollution/chemicals seeping into rock; 5 @ 1 mark or development [5] www.theallpapers.com
Mark scheme, page 11
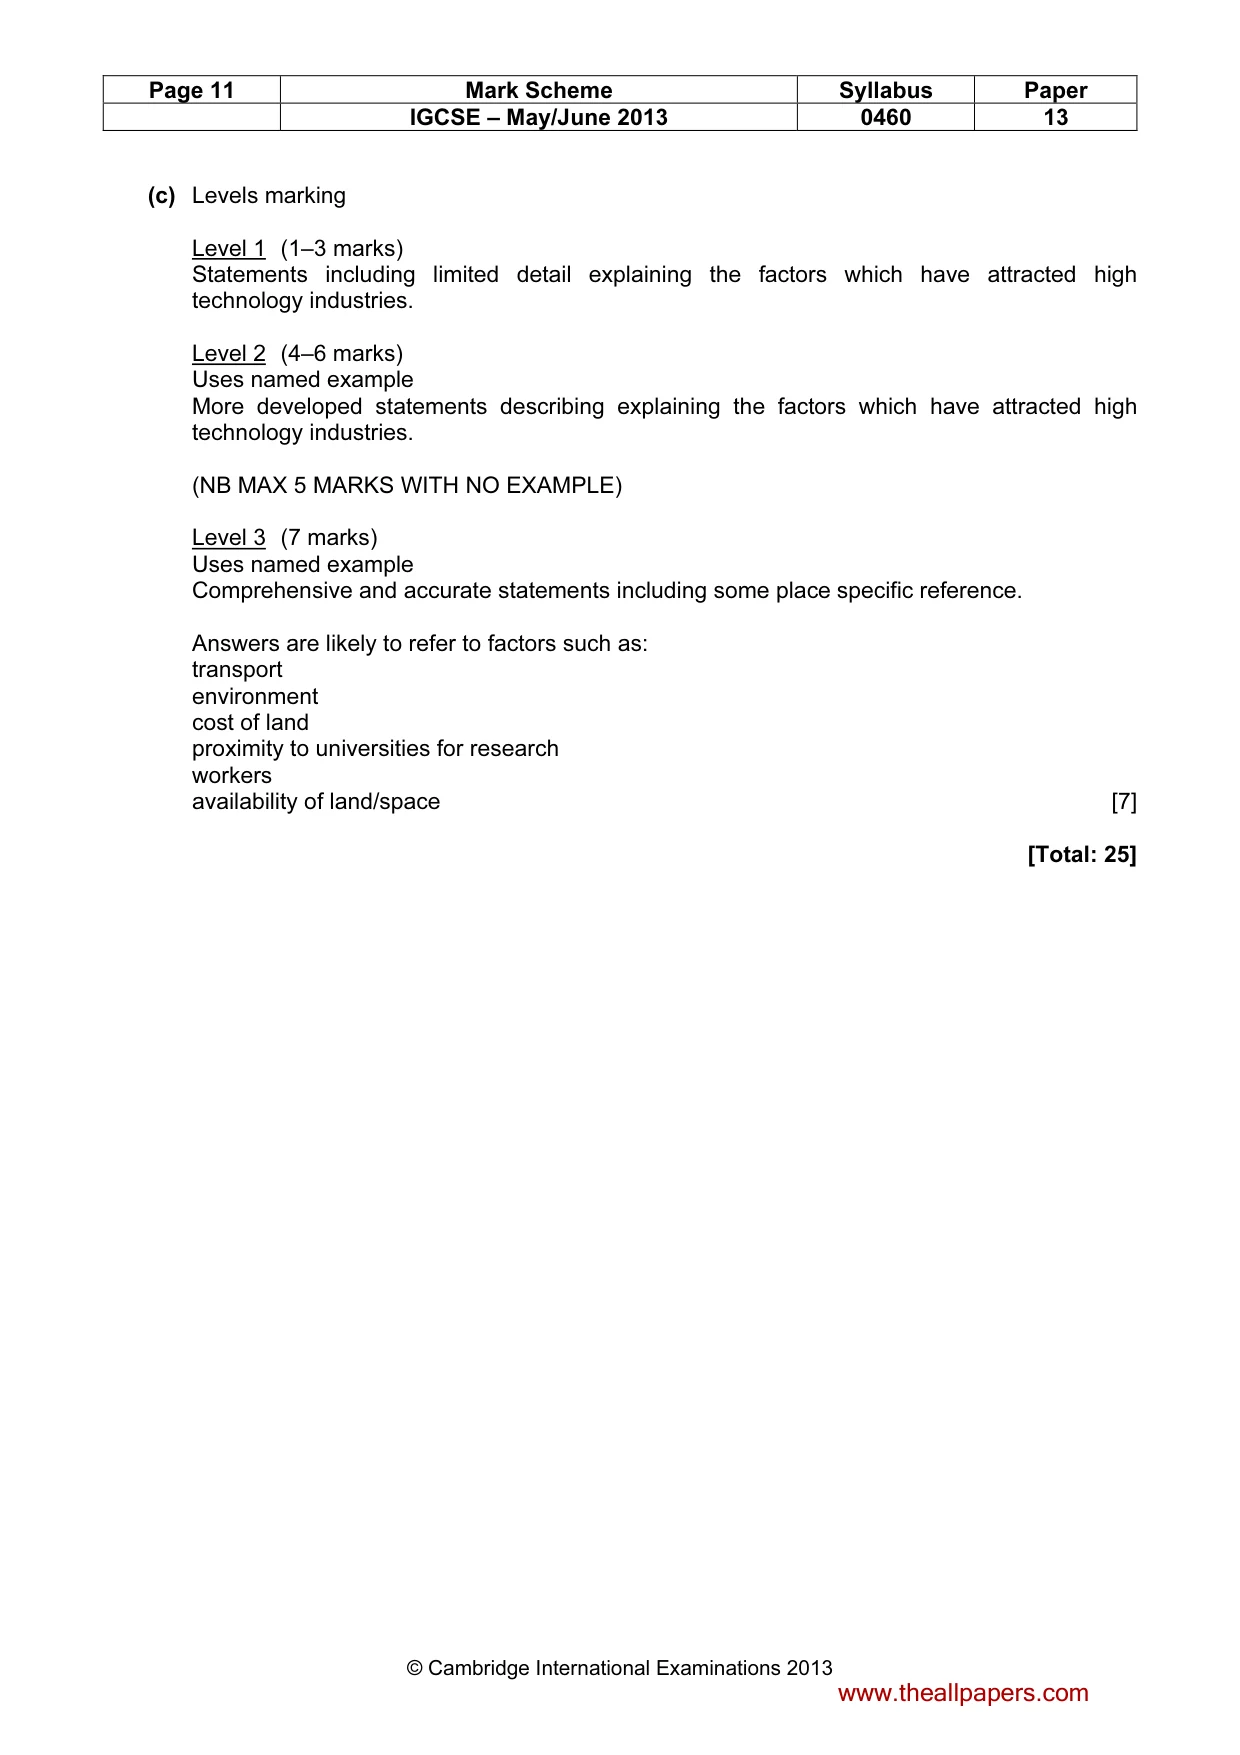
Page 11 Mark Scheme Syllabus Paper IGCSE – May/June 2013 0460 13 © Cambridge International Examinations 2013 (c) Levels marking Level 1 (1–3 marks) Statements including limited detail explaining the factors which have attracted high technology industries. Level 2 (4–6 marks) Uses named example More developed statements describing explaining the factors which have attracted high technology industries. (NB MAX 5 MARKS WITH NO EXAMPLE) Level 3 (7 marks) Uses named example Comprehensive and accurate statements including some place specific reference. Answers are likely to refer to factors such as: transport environment cost of land proximity to universities for research workers availability of land/space [7] [Total: 25] www.theallpapers.com
Mark scheme, page 12
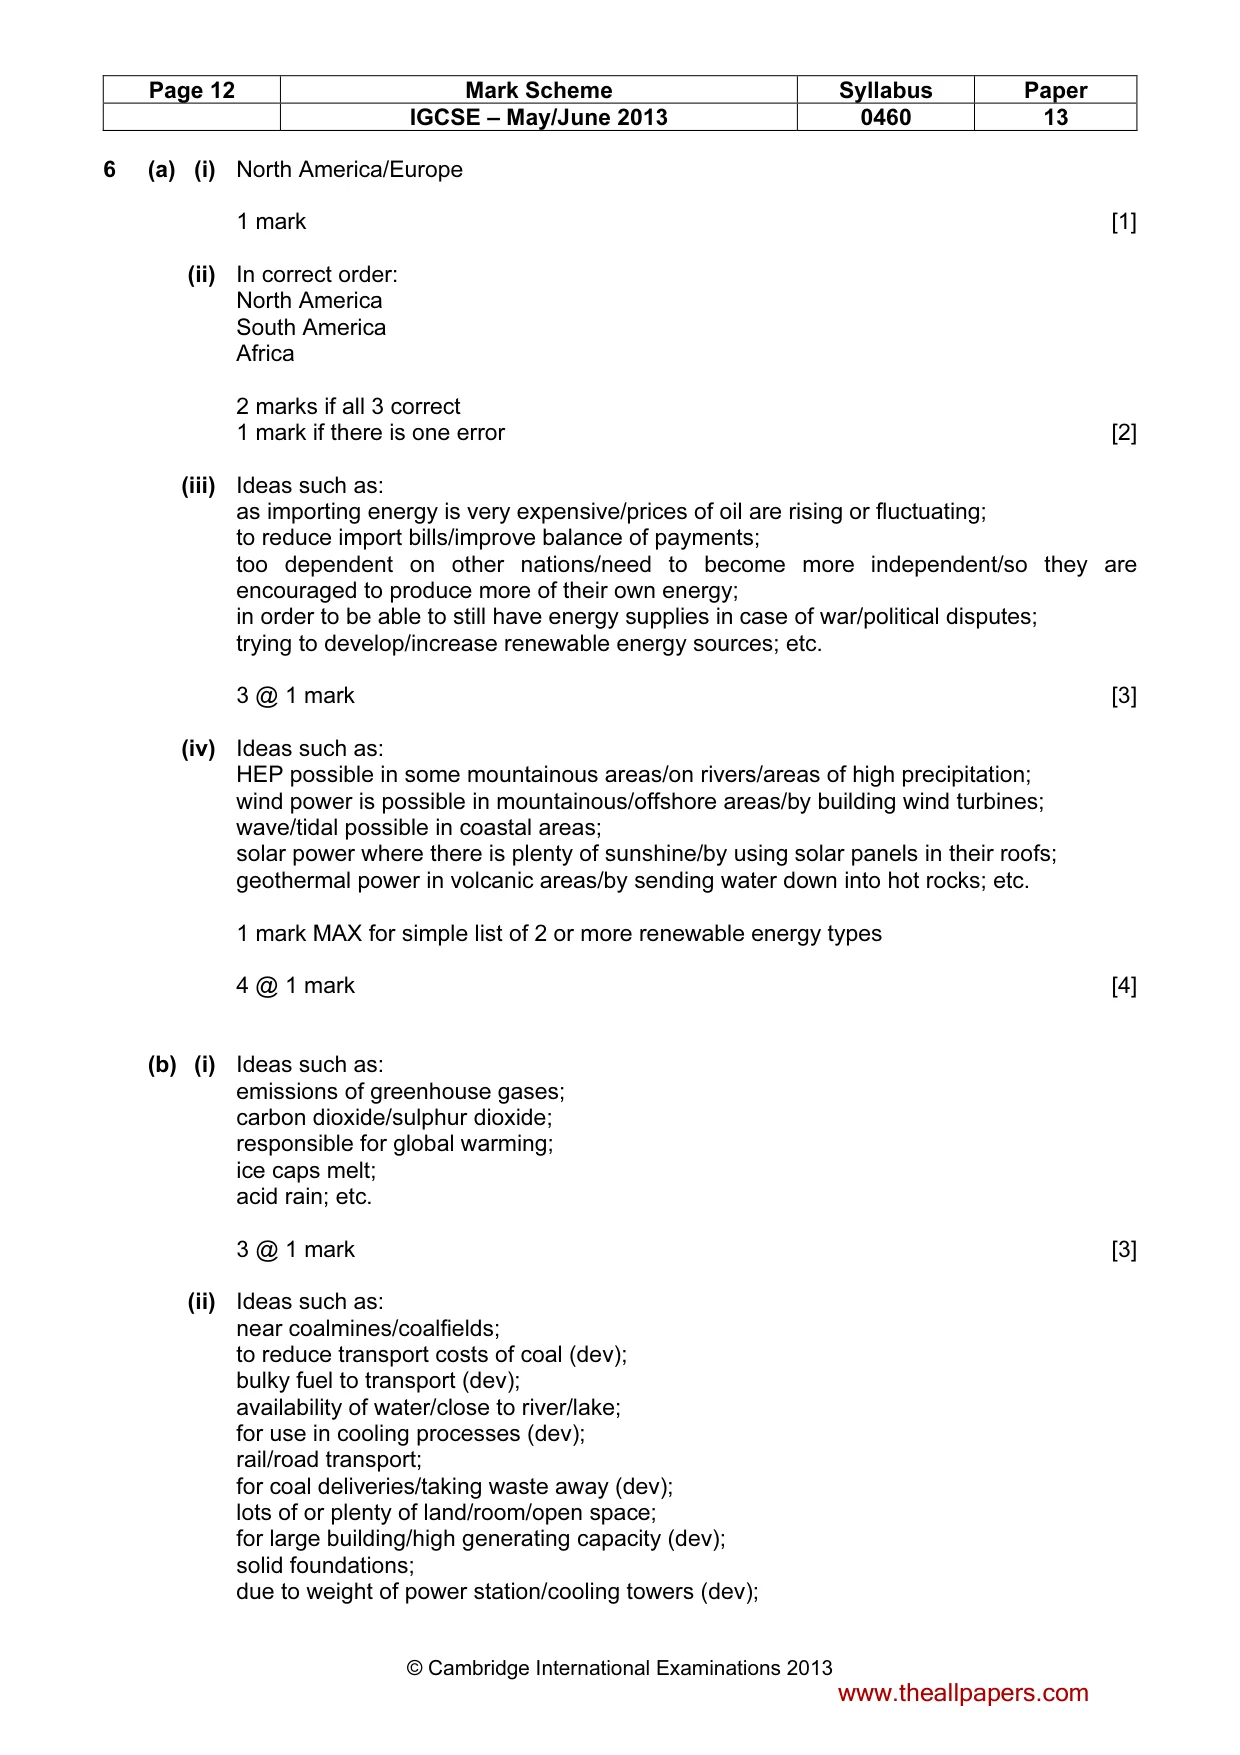
Page 12 Mark Scheme Syllabus Paper IGCSE – May/June 2013 0460 13 © Cambridge International Examinations 2013 6 (a) (i) North America/Europe 1 mark [1] (ii) In correct order: North America South America Africa 2 marks if all 3 correct 1 mark if there is one error [2] (iii) Ideas such as: as importing energy is very expensive/prices of oil are rising or fluctuating; to reduce import bills/improve balance of payments; too dependent on other nations/need to become more independent/so they are encouraged to produce more of their own energy; in order to be able to still have energy supplies in case of war/political disputes; trying to develop/increase renewable energy sources; etc. 3 @ 1 mark [3] (iv) Ideas such as: HEP possible in some mountainous areas/on rivers/areas of high precipitation; wind power is possible in mountainous/offshore areas/by building wind turbines; wave/tidal possible in coastal areas; solar power where there is plenty of sunshine/by using solar panels in their roofs; geothermal power in volcanic areas/by sending water down into hot rocks; etc. 1 mark MAX for simple list of 2 or more renewable energy types 4 @ 1 mark [4] (b) (i) Ideas such as: emissions of greenhouse gases; carbon dioxide/sulphur dioxide; responsible for global warming; ice caps melt; acid rain; etc. 3 @ 1 mark [3] (ii) Ideas such as: near coalmines/coalfields; to reduce transport costs of coal (dev); bulky fuel to transport (dev); availability of water/close to river/lake; for use in cooling processes (dev); rail/road transport; for coal deliveries/taking waste away (dev); lots of or plenty of land/room/open space; for large building/high generating capacity (dev); solid foundations; due to weight of power station/cooling towers (dev); www.theallpapers.com
Mark scheme, page 13
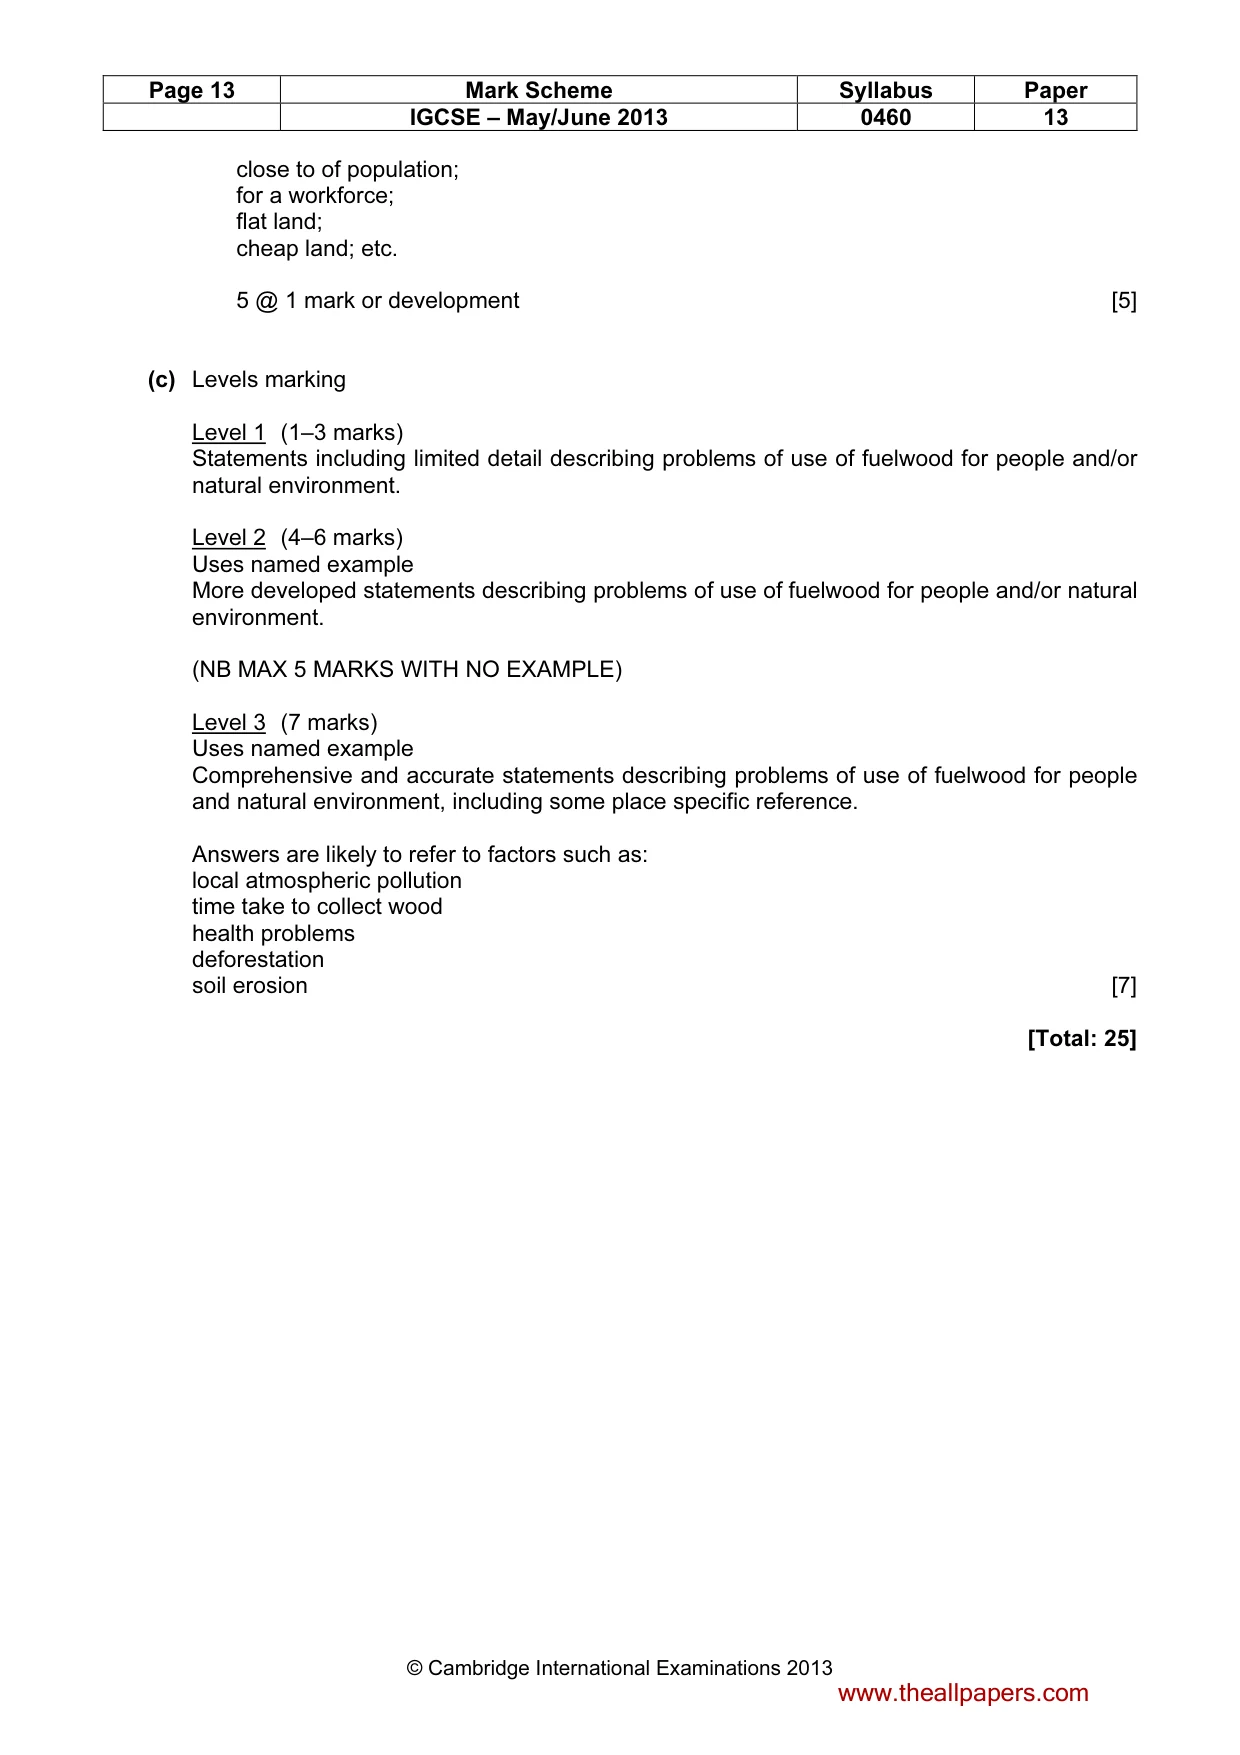
Page 13 Mark Scheme Syllabus Paper IGCSE – May/June 2013 0460 13 © Cambridge International Examinations 2013 close to of population; for a workforce; flat land; cheap land; etc. 5 @ 1 mark or development [5] (c) Levels marking Level 1 (1–3 marks) Statements including limited detail describing problems of use of fuelwood for people and/or natural environment. Level 2 (4–6 marks) Uses named example More developed statements describing problems of use of fuelwood for people and/or natural environment. (NB MAX 5 MARKS WITH NO EXAMPLE) Level 3 (7 marks) Uses named example Comprehensive and accurate statements describing problems of use of fuelwood for people and natural environment, including some place specific reference. Answers are likely to refer to factors such as: local atmospheric pollution time take to collect wood health problems deforestation soil erosion [7] [Total: 25] www.theallpapers.com
What you needed in this session
Cambridge’s own grade thresholds for 2013 May/June, Paper 1 · Variant 3. A higher threshold means an easier paper — the bar moves with how the cohort did.