Cambridge IGCSE Geography 0460 — 2011 Oct/Nov Paper 1 · Variant 1
0460/11/O/N/11 · 75 marks · ≈84 min
The question paper and its mark scheme, free to read here and free to download. This is Cambridge’s own paper, exactly as it was sat.
Question paper24 pages

Mark scheme14 pages
Answers below. Sit the paper first if you are practising.
Paper as text
Question paper, page 1
This document consists of 24 printed pages and 1 Insert. DC (SM/DJ) 32840/8 © UCLES 2011 [Turn over UNIVERSITY OF CAMBRIDGE INTERNATIONAL EXAMINATIONS International General Certificate of Secondary Education * 5 6 6 0 6 4 3 7 8 1 * GEOGRAPHY 0460/11 Paper 1 October/November 2011 1 hour 45 minutes Candidates answer on the Question Paper. Additional Materials: Ruler READ THESE INSTRUCTIONS FIRST Write your Centre number, candidate number and name in the spaces provided. Write in dark blue or black pen. You may use a soft pencil for any diagrams, graphs or rough working. Do not use staples, paper clips, highlighters, glue or correction fluid. DO NOT WRITE ON ANY BARCODES. Write your answer to each question in the space provided. If additional space is required, you should use the lined page at the end of this booklet. The question number(s) must be clearly shown. Answer three questions. The Insert contains Photographs A, B and C for Question 5. Sketch maps and diagrams should be drawn whenever they serve to illustrate an answer. The Insert is not required by the Examiner. The number of marks is given in brackets [ ] at the end of each question or part question. www.theallpapers.com
Question paper, page 2
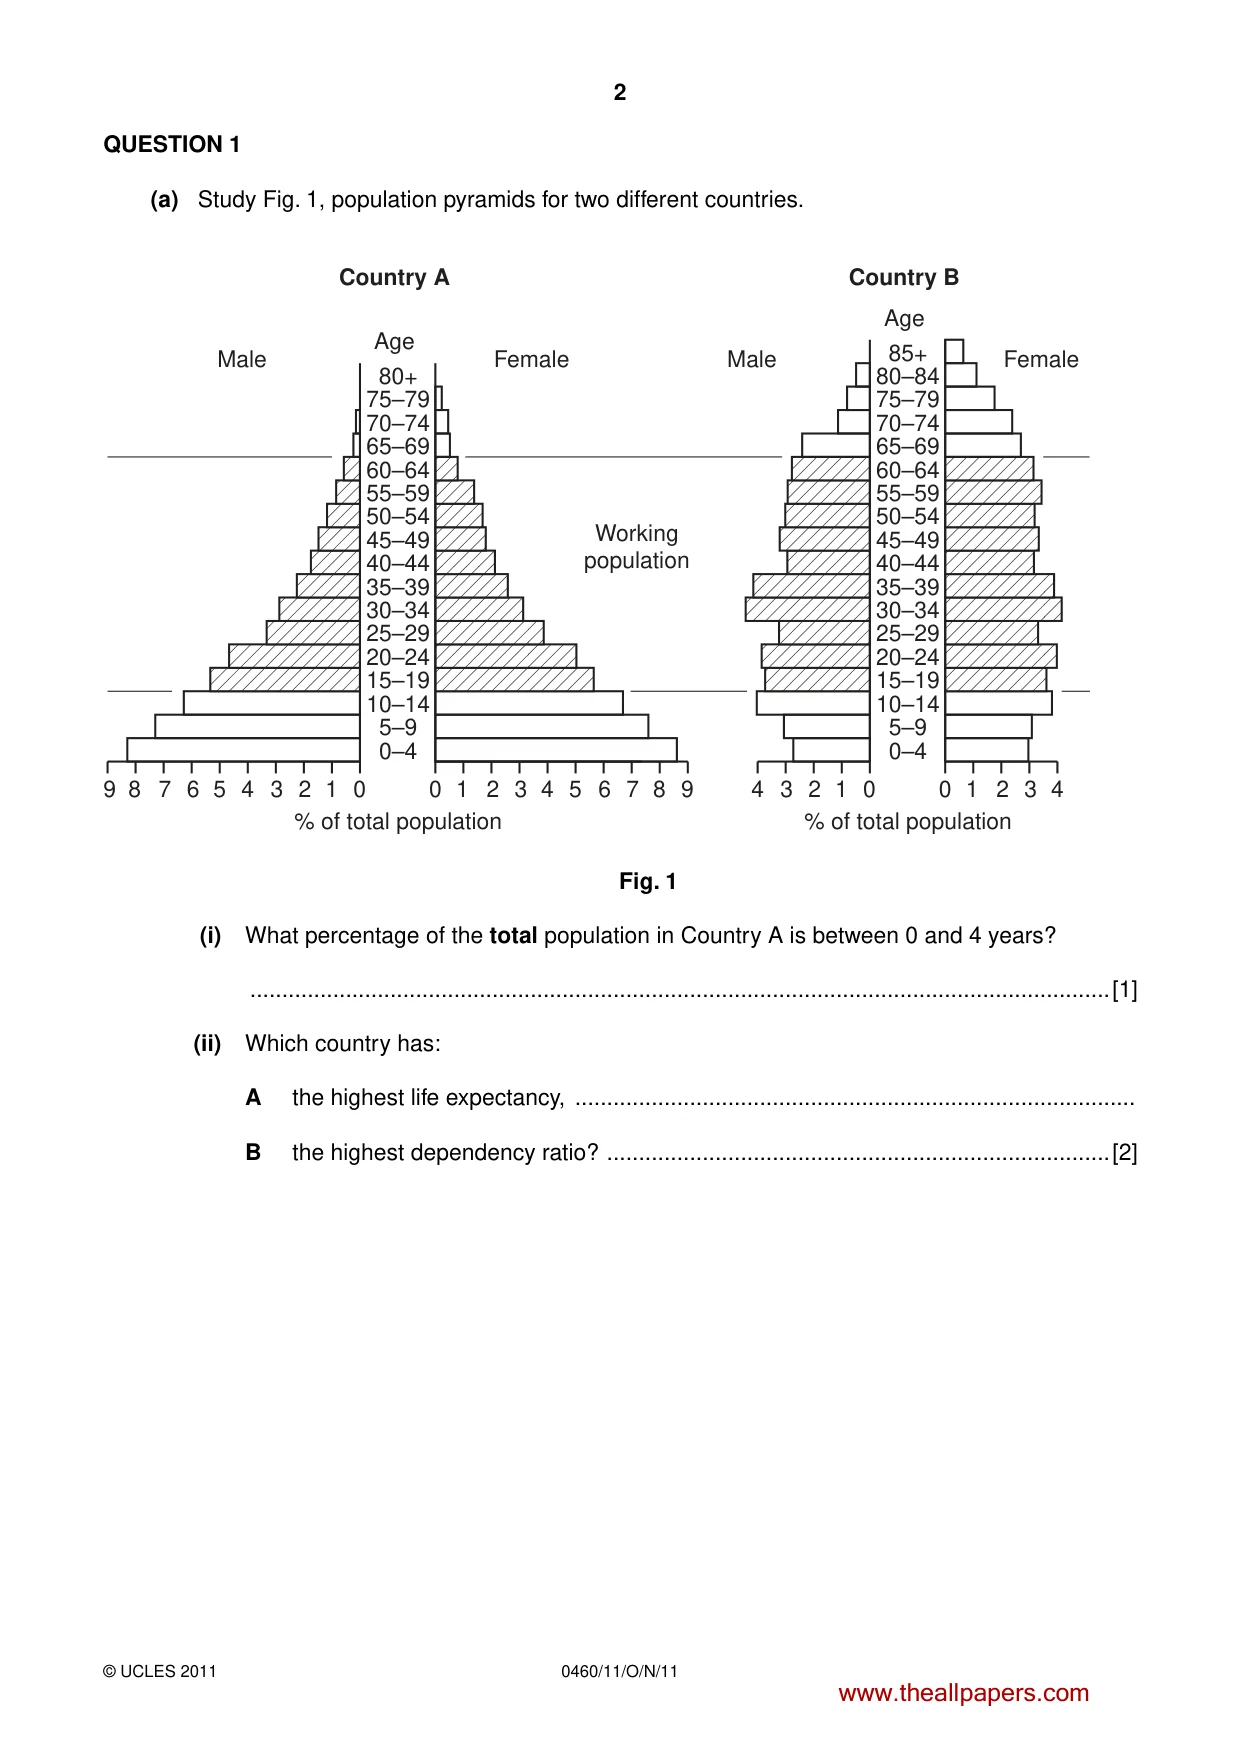
2 0460/11/O/N/11 © UCLES 2011 QUESTION 1 (a) Study Fig. 1, population pyramids for two different countries. % of total population Age Country A Male Female Working population 9 8 6 4 2 0 7 5 3 1 0 1 3 5 7 9 2 4 6 8 0–4 5–9 10–14 15–19 20–24 25–29 30–34 35–39 40–44 45–49 50–54 55–59 60–64 65–69 70–74 75–79 80+ % of total population Country B Male Female 4 2 0 3 1 0 1 3 2 4 0–4 5–9 10–14 15–19 20–24 25–29 30–34 35–39 40–44 45–49 50–54 55–59 60–64 65–69 70–74 75–79 80–84 Age 85+ Fig. 1 (i) What percentage of the total population in Country A is between 0 and 4 years? …[1] (ii) Which country has: A the highest life expectancy, … B the highest dependency ratio? …[2] www.theallpapers.com
Question paper, page 3
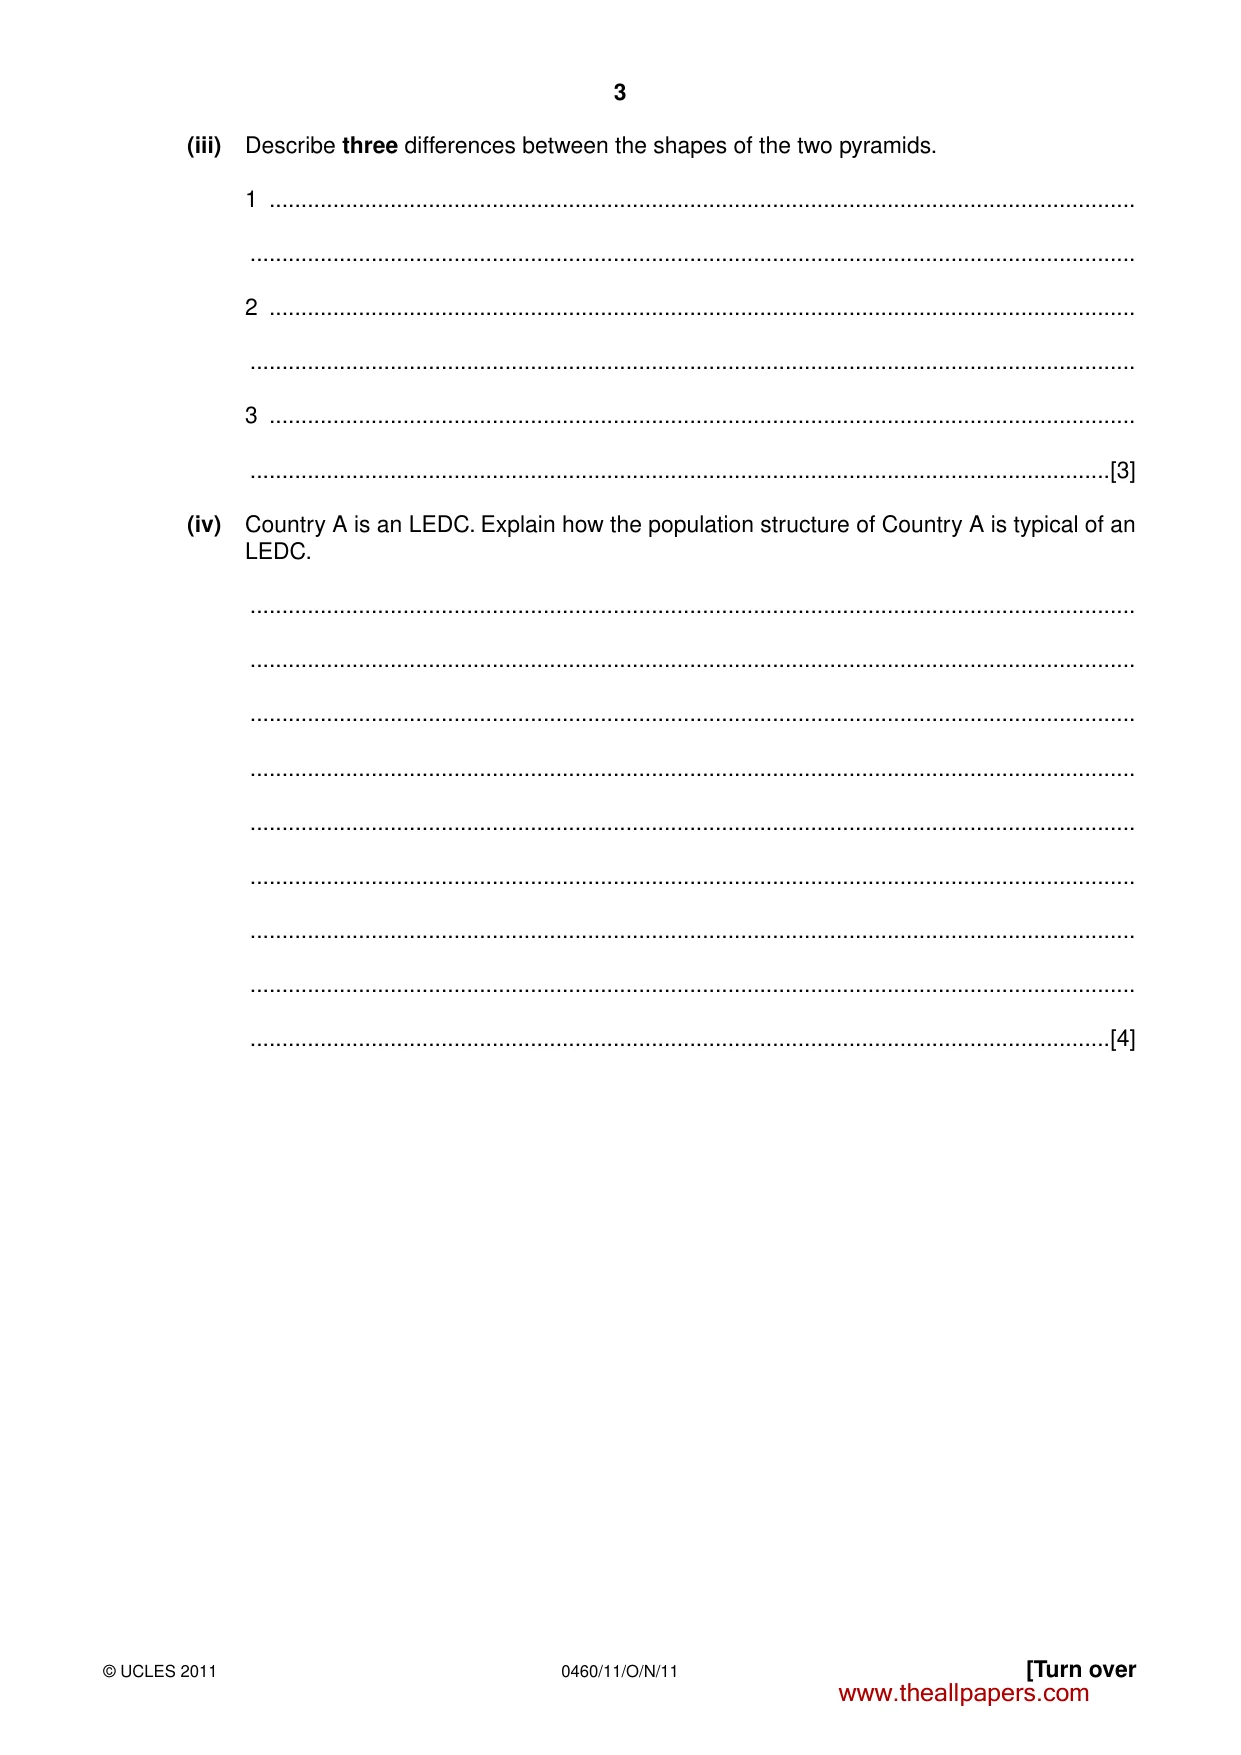
3 0460/11/O/N/11 © UCLES 2011 [Turn over (iii) Describe three differences between the shapes of the two pyramids. 1 … … 2 … … 3 … …[3] (iv) Country A is an LEDC. Explain how the population structure of Country A is typical of an LEDC. … … … … … … … … …[4] www.theallpapers.com
Question paper, page 4
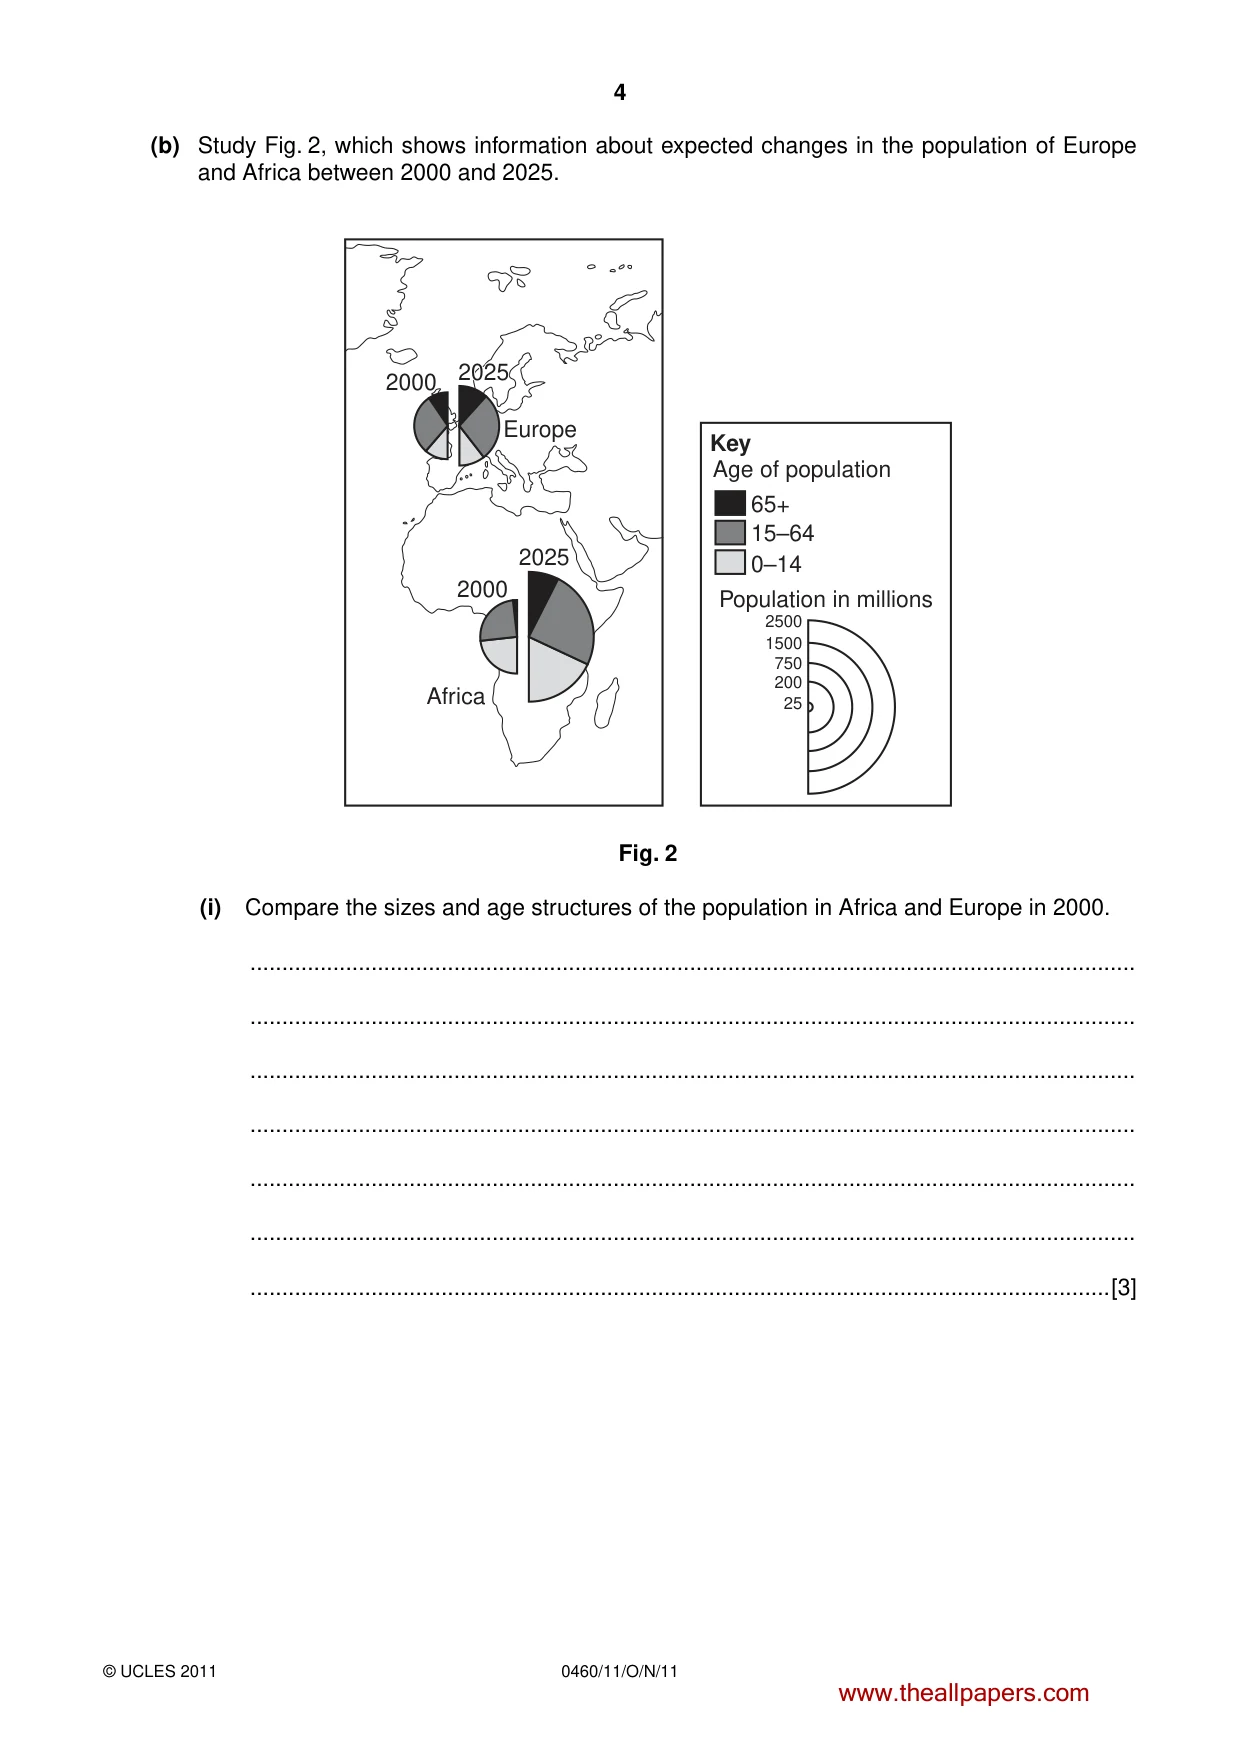
4 0460/11/O/N/11 © UCLES 2011 (b) Study Fig. 2, which shows information about expected changes in the population of Europe and Africa between 2000 and 2025. 2025 2025 2025 2025 2000 2000 Africa Europe Population in millions Age of population 0–14 15–64 65+ 2500 1500 750 200 25 Key Fig. 2 (i) Compare the sizes and age structures of the population in Africa and Europe in 2000. … … … … … … …[3] www.theallpapers.com
Question paper, page 5
5 0460/11/O/N/11 © UCLES 2011 [Turn over (ii) Suggest reasons for the expected increase in the percentage of population over the age of 65 by 2025. … … … … … … … … …[5] (c) For a named country which you have studied, describe the problems caused by an increase in the percentage of people over the age of 65. Name of country … … … … … … … … … … … … … … …[7] [Total: 25 marks] END OF QUESTION 1 www.theallpapers.com
Question paper, page 6
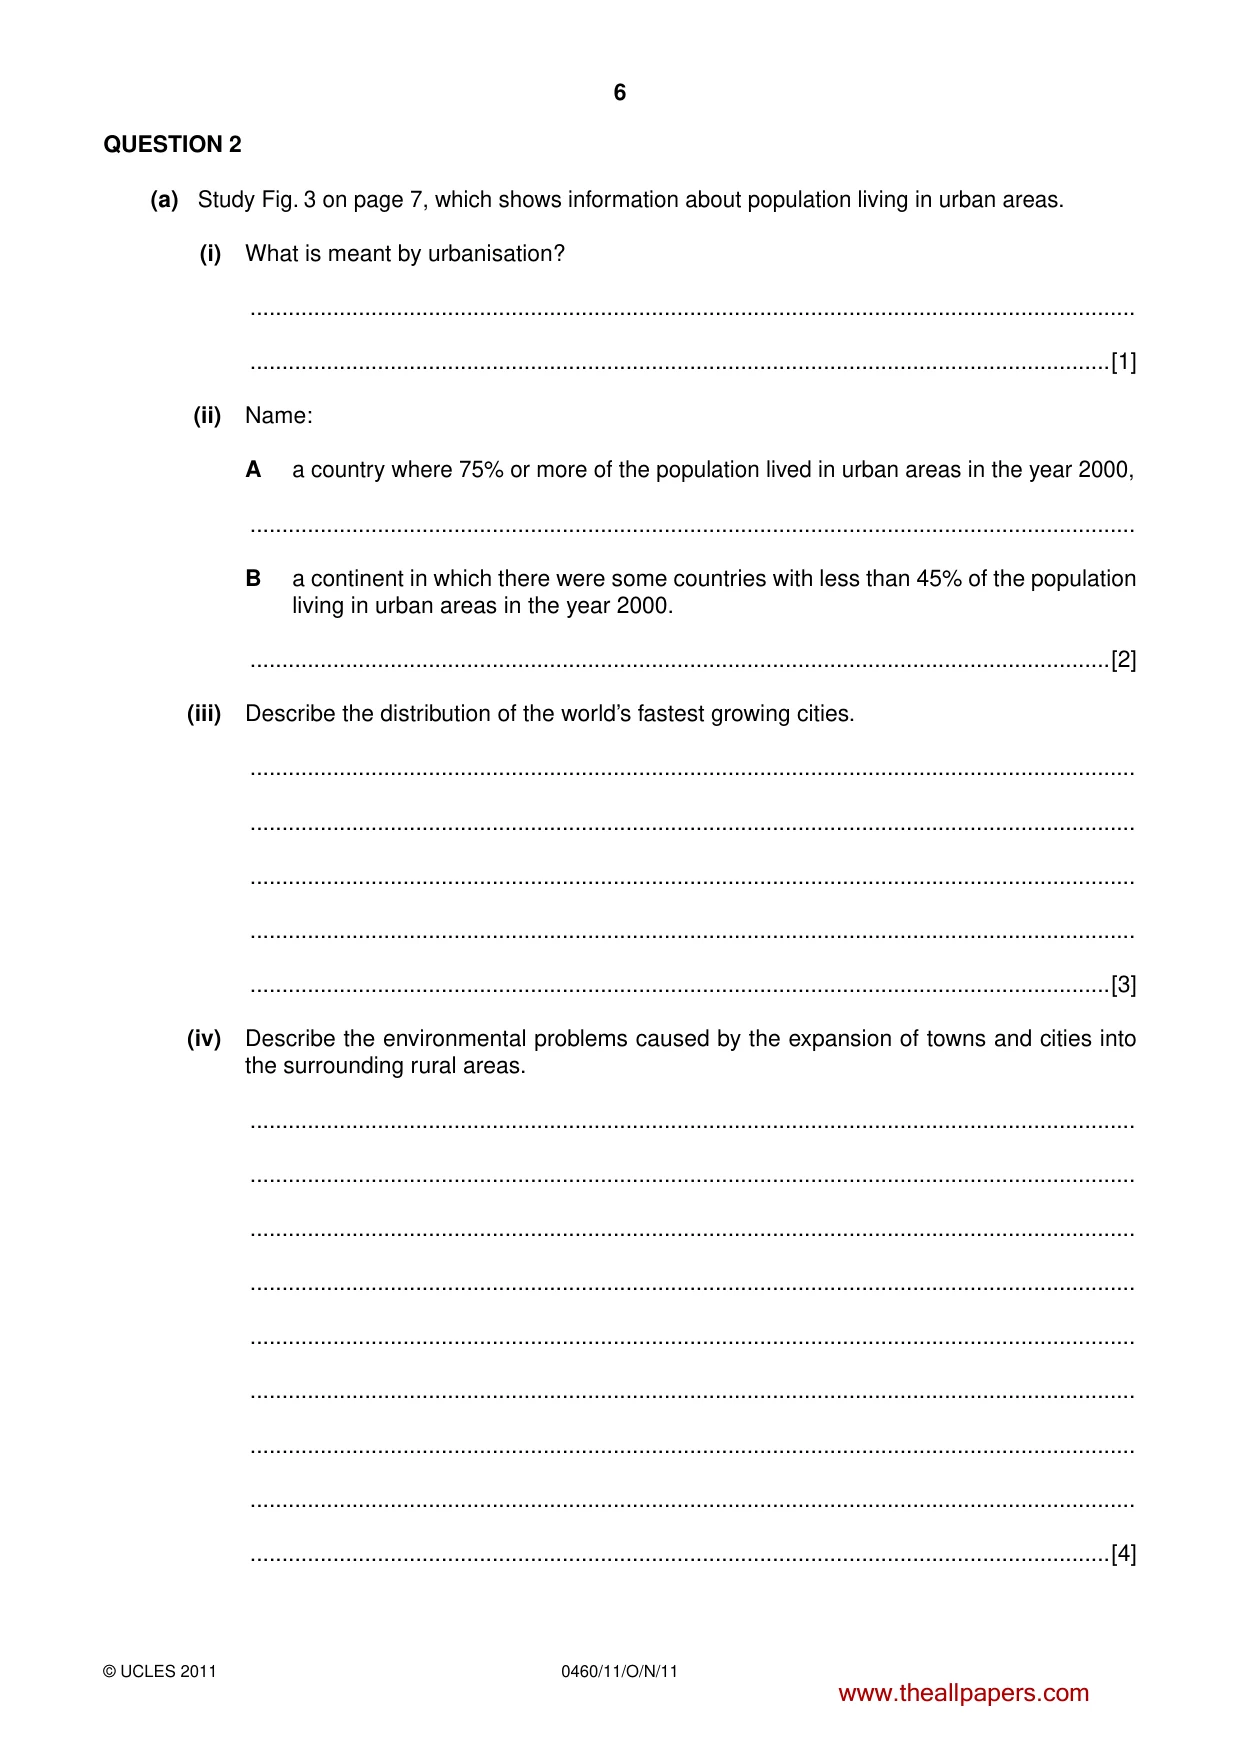
6 0460/11/O/N/11 © UCLES 2011 QUESTION 2 (a) Study Fig. 3 on page 7, which shows information about population living in urban areas. (i) What is meant by urbanisation? … …[1] (ii) Name: A a country where 75% or more of the population lived in urban areas in the year 2000, … B a continent in which there were some countries with less than 45% of the population living in urban areas in the year 2000. …[2] (iii) Describe the distribution of the world’s fastest growing cities. … … … … …[3] (iv) Describe the environmental problems caused by the expansion of towns and cities into the surrounding rural areas. … … … … … … … … …[4] www.theallpapers.com
Question paper, page 7
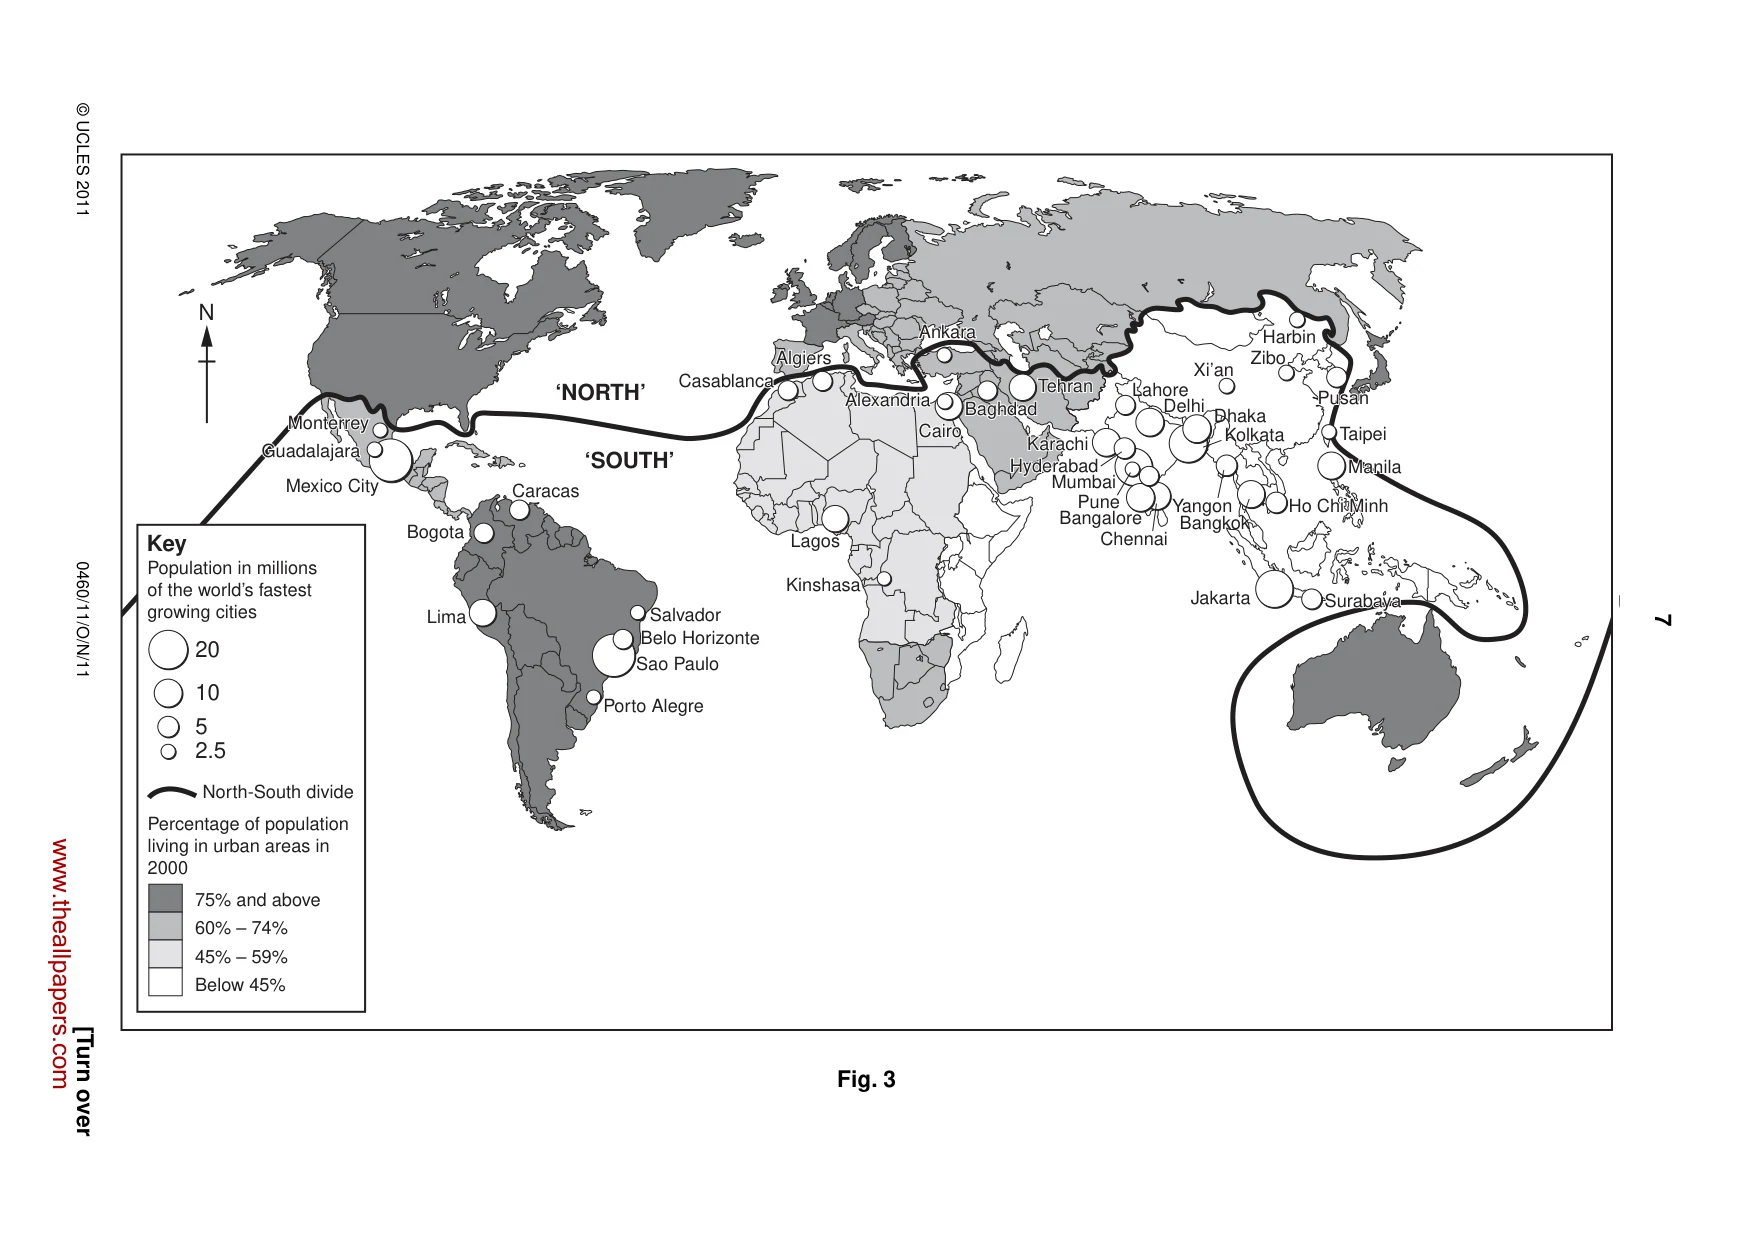
7 0460/11/O/N/11 © UCLES 2011 [Turn over Monterrey Monterrey Guadalajara Guadalajara Monterrey Guadalajara Mexico City Bogota Lima Salvador Belo Horizonte Sao Paulo Porto Alegre Caracas Casablanca Casablanca Algiers Algiers Casablanca Algiers Alexandria Alexandria Cairo Cairo Baghdad Baghdad Tehran Tehran Karachi Karachi Hyderabad Hyderabad Ho Chi Minh Ho Chi Minh Manila Manila Pusan Pusan Alexandria Cairo Lagos Kinshasa Baghdad Tehran Ankara Ankara Ankara Karachi Hyderabad Mumbai Pune Bangalore Chennai Jakarta Surabaya Surabaya Surabaya Ho Chi Minh Manila Taipei Pusan Zibo Harbin Xi’an Lahore Delhi Dhaka Kolkata Yangon Bangkok ‘SOUTH’ ‘NORTH’ Key 20 10 5 2.5 Population in millions of the world’s fastest growing cities Percentage of population living in urban areas in 2000 North-South divide 75% and above 60% – 74% 45% – 59% Below 45% N Fig. 3 www.theallpapers.com
Question paper, page 8
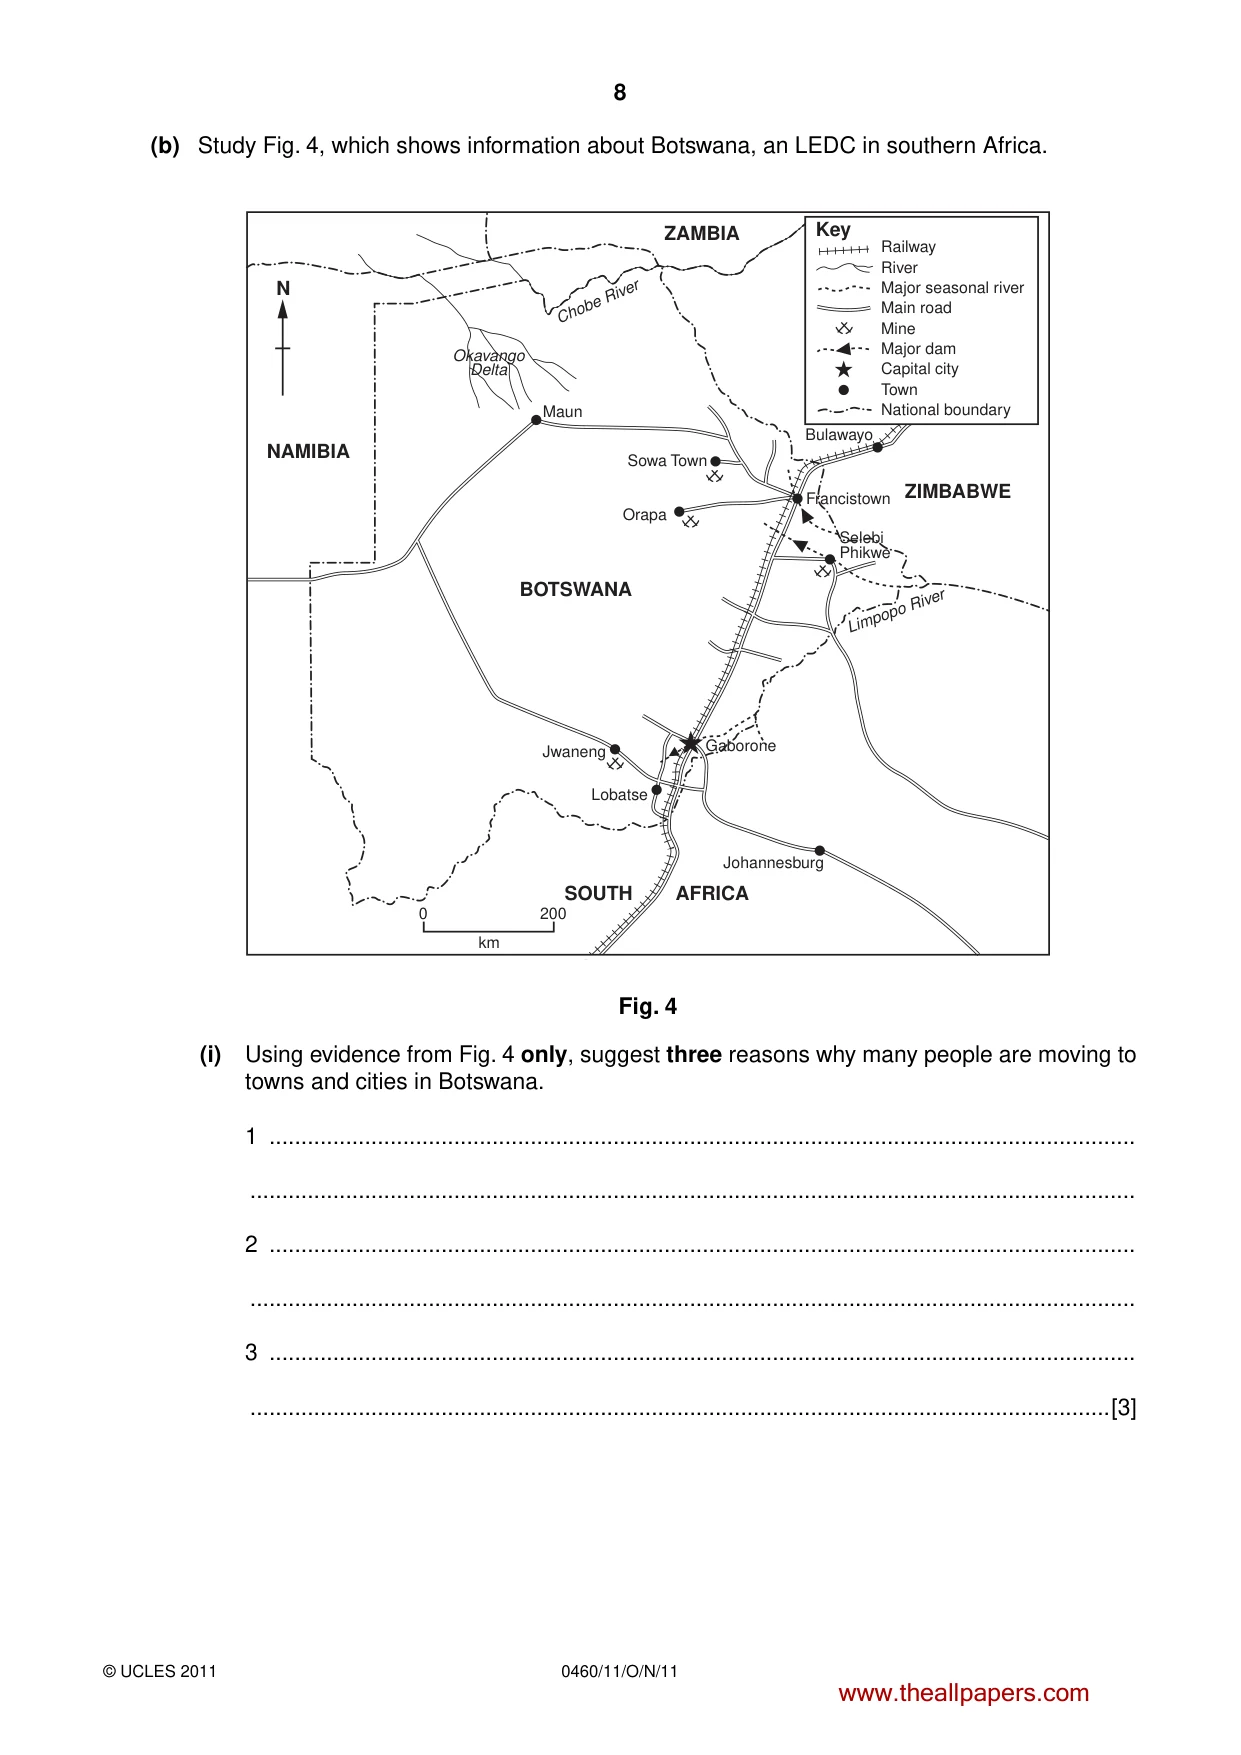
8 0460/11/O/N/11 © UCLES 2011 (b) Study Fig. 4, which shows information about Botswana, an LEDC in southern Africa. N NAMIBIA BOTSWANA ZAMBIA ZIMBABWE SOUTH AFRICA Okavango Delta Maun Sowa Town Orapa Bulawayo Francistown Selebi Phikwe Gaborone Lobatse 0 200 km Jwaneng Johannesburg Limpopo River Chobe River Key Railway River Major seasonal river Main road Mine Major dam Capital city Town National boundary Fig. 4 (i) Using evidence from Fig. 4 only, suggest three reasons why many people are moving to towns and cities in Botswana. 1 … … 2 … … 3 … …[3] www.theallpapers.com
Question paper, page 9
9 0460/11/O/N/11 © UCLES 2011 [Turn over (ii) Gaborone, the capital city of Botswana, was founded in 1964 with a planned population of 20 000. It now has a population of over 200 000. What problems are caused for people who live in such rapidly growing urban areas in LEDCs? … … … … … … … …[5] (c) For a named town or city which you have studied, describe the location and characteristics of two contrasting housing areas. Name of city or town … … … … … … … … … … … … … … …[7] [Total: 25 marks] END OF QUESTION 2 www.theallpapers.com
Question paper, page 10
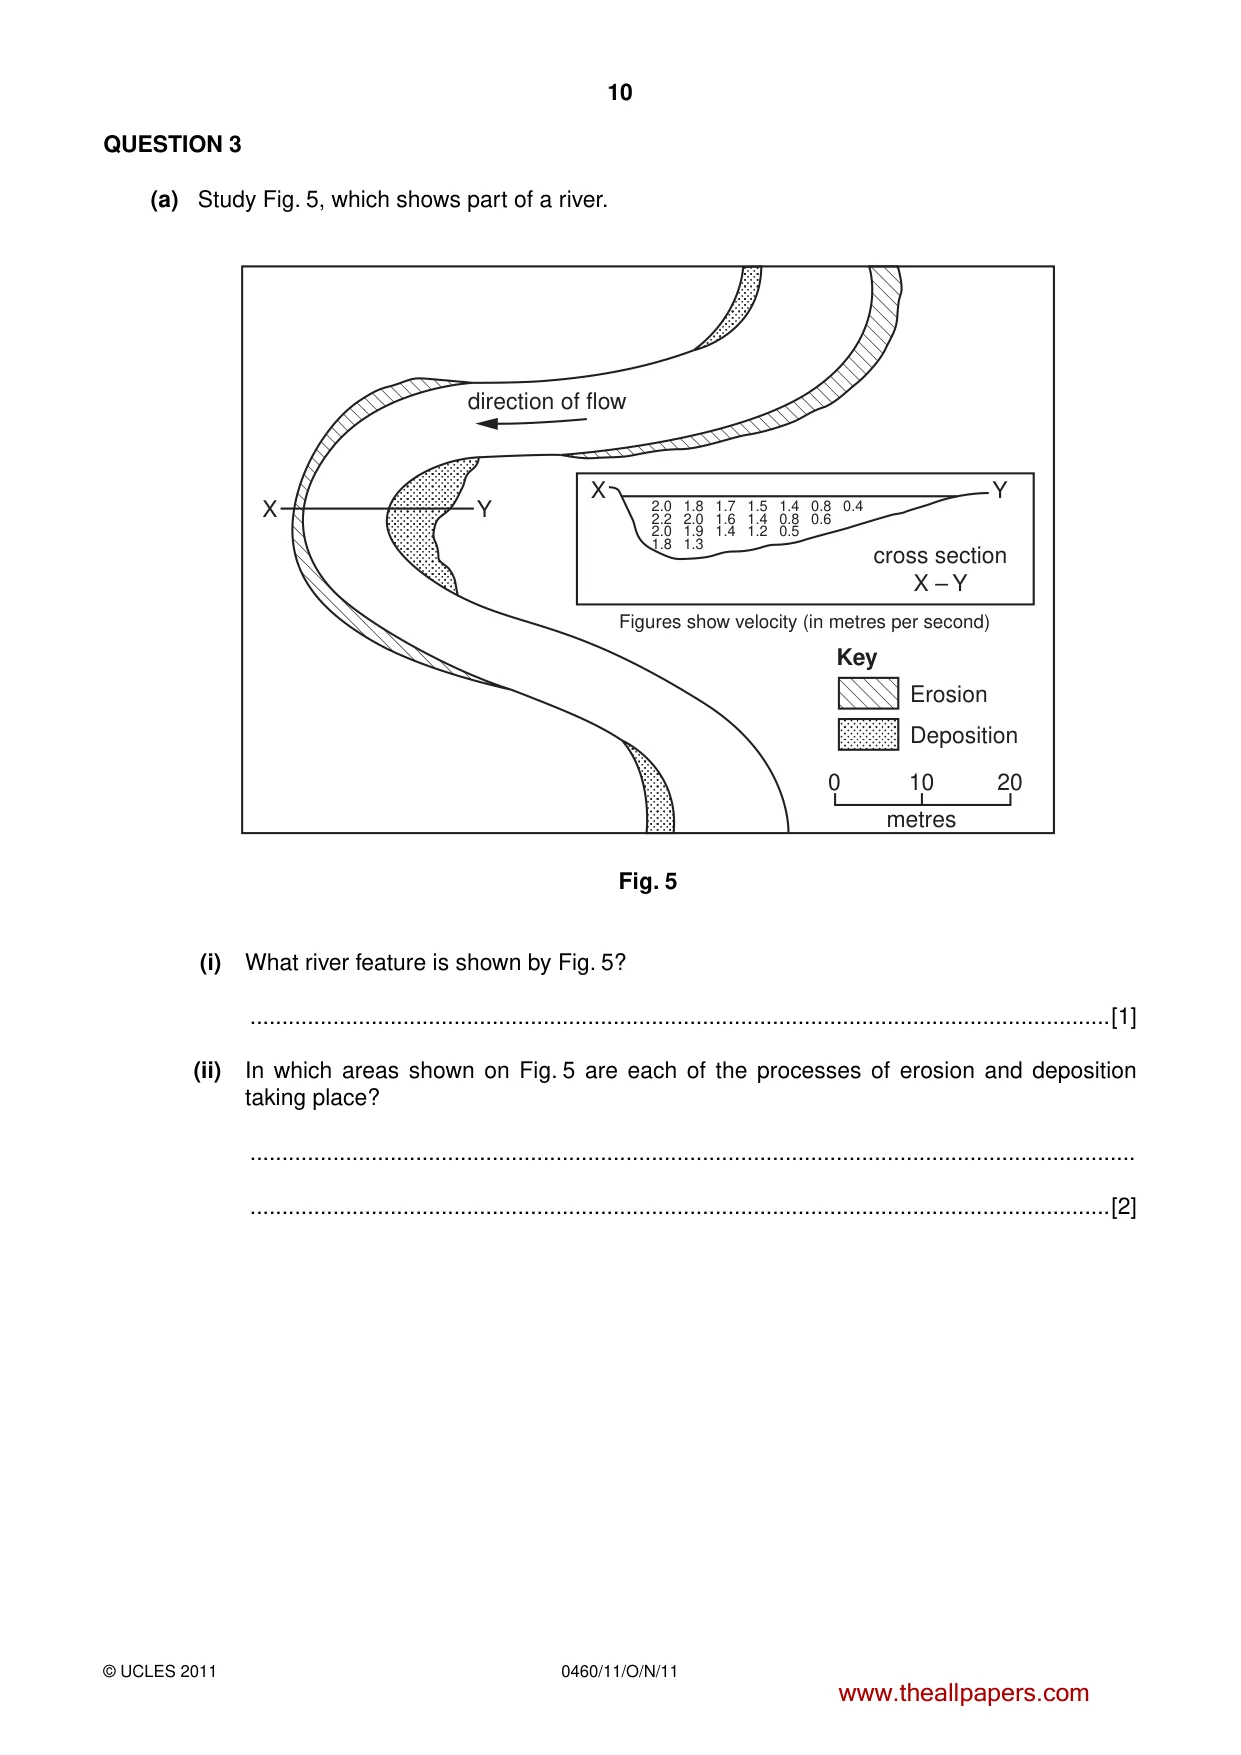
10 0460/11/O/N/11 © UCLES 2011 QUESTION 3 (a) Study Fig. 5, which shows part of a river. direction of flow X X Y Y cross section X – Y Erosion Key 0 10 metres 20 Deposition Figures show velocity (in metres per second) 2.0 2.2 2.0 1.8 1.8 2.0 1.9 1.3 1.7 1.6 1.4 1.5 1.4 1.2 1.4 0.8 0.5 0.8 0.6 0.4 Fig. 5 (i) What river feature is shown by Fig. 5? …[1] (ii) In which areas shown on Fig. 5 are each of the processes of erosion and deposition taking place? … …[2] www.theallpapers.com
Question paper, page 11
11 0460/11/O/N/11 © UCLES 2011 [Turn over (iii) Describe how the velocity varies across the river cross section labelled X–Y. … … … … …[3] (iv) Explain why a flood plain and levees may develop in the lower course of a river. … … … … … … … … …[4] www.theallpapers.com
Question paper, page 12
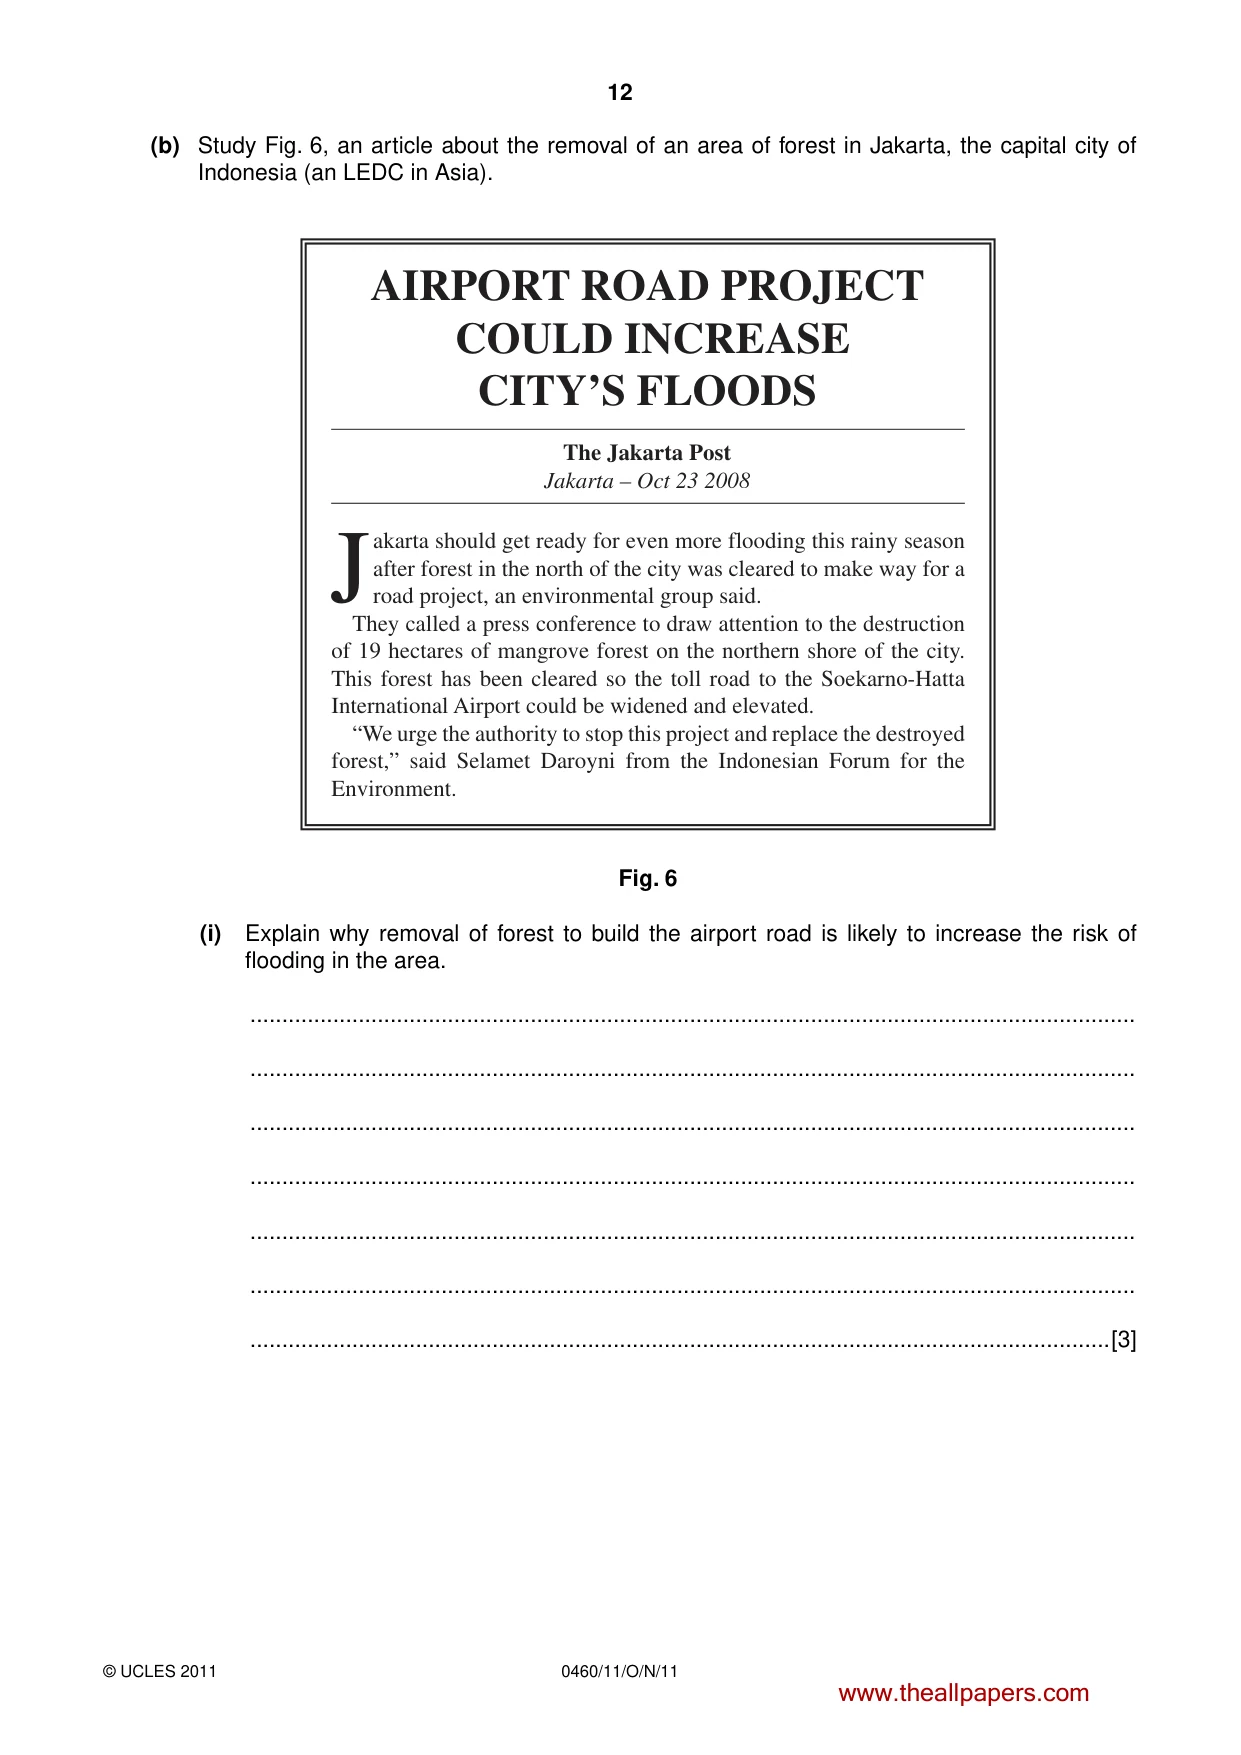
12 0460/11/O/N/11 © UCLES 2011 (b) Study Fig. 6, an article about the removal of an area of forest in Jakarta, the capital city of Indonesia (an LEDC in Asia). AIRPORT ROAD PROJECT COULD INCREASE CITY’S FLOODS The Jakarta Post Jakarta – Oct 23 2008 J akarta should get ready for even more flooding this rainy season after forest in the north of the city was cleared to make way for a road project, an environmental group said. They called a press conference to draw attention to the destruction of 19 hectares of mangrove forest on the northern shore of the city. This forest has been cleared so the toll road to the Soekarno-Hatta International Airport could be widened and elevated. “We urge the authority to stop this project and replace the destroyed forest,” said Selamet Daroyni from the Indonesian Forum for the Environment. Fig. 6 (i) Explain why removal of forest to build the airport road is likely to increase the risk of flooding in the area. … … … … … … …[3] www.theallpapers.com
Question paper, page 13
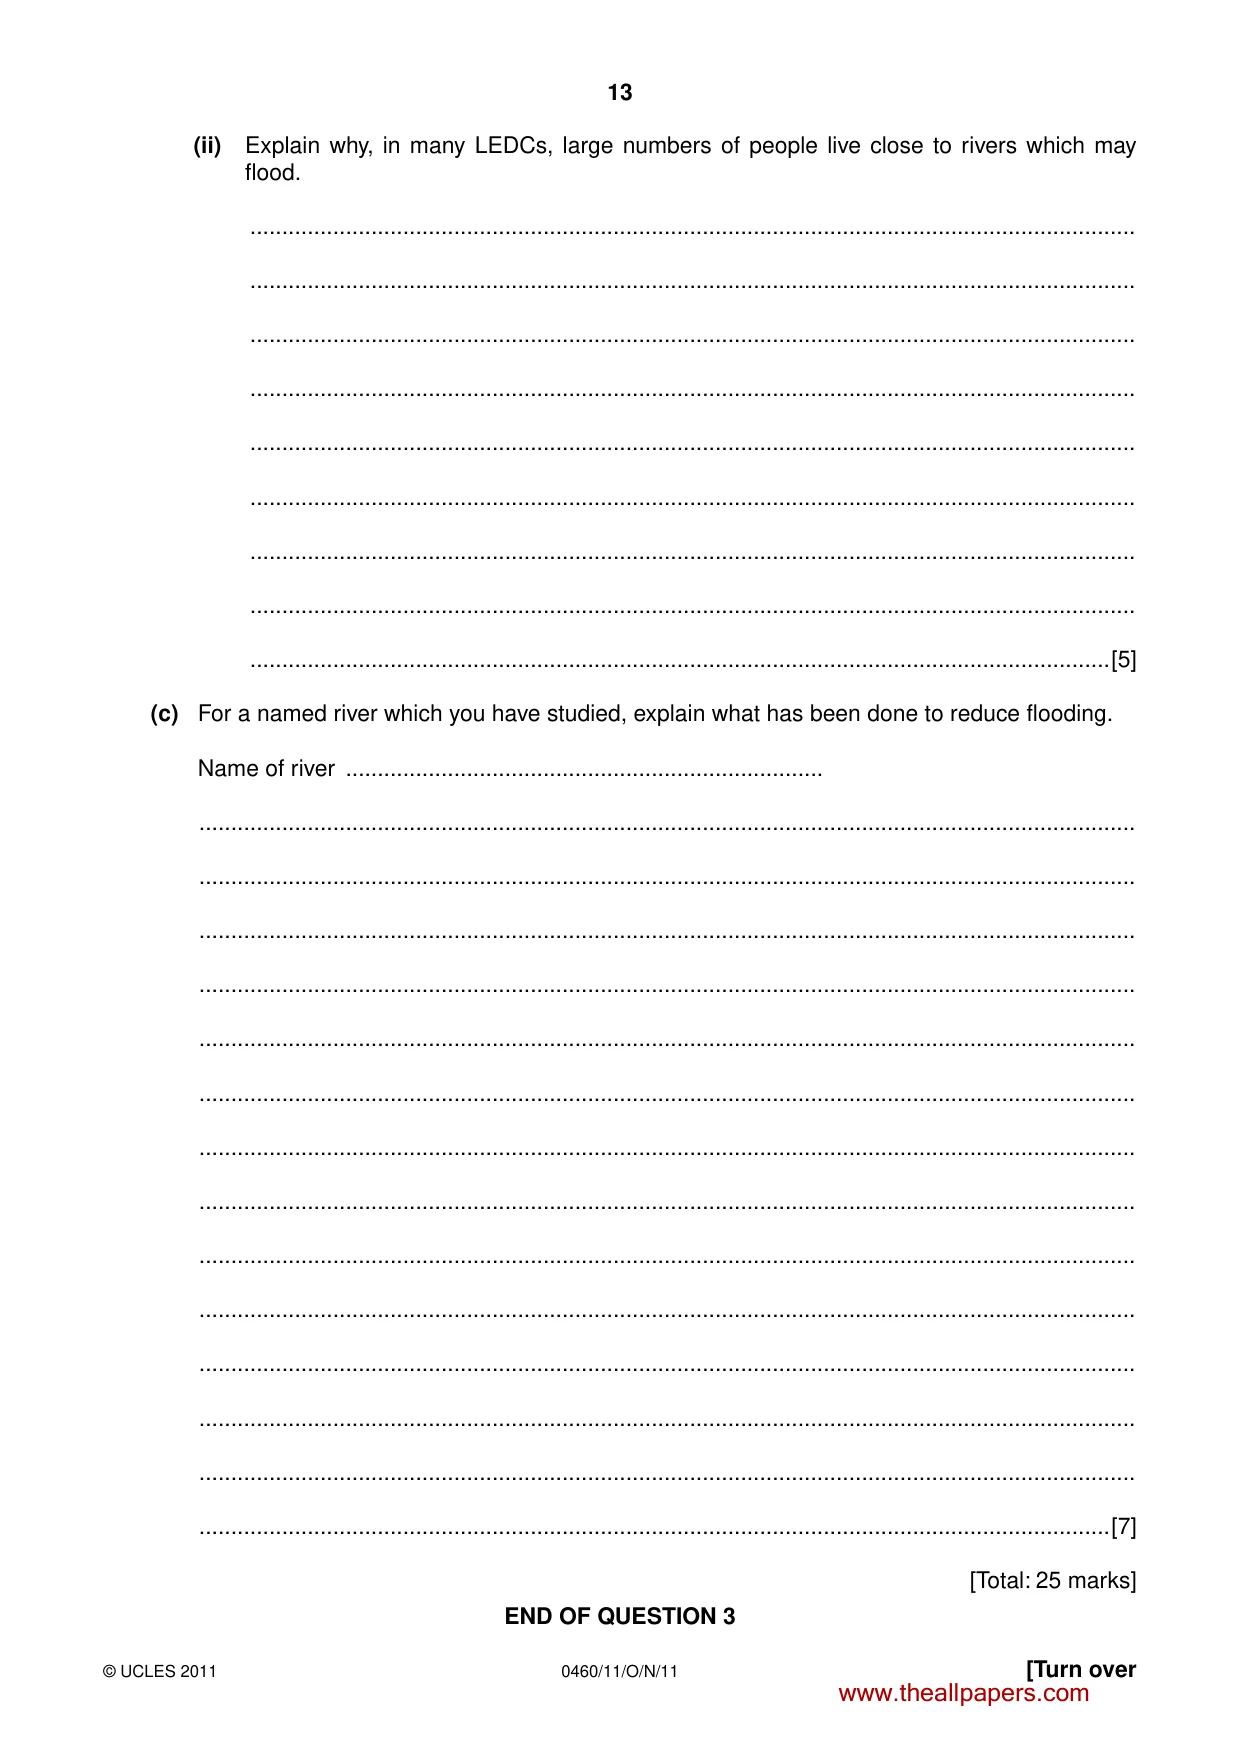
13 0460/11/O/N/11 © UCLES 2011 [Turn over (ii) Explain why, in many LEDCs, large numbers of people live close to rivers which may flood. … … … … … … … … …[5] (c) For a named river which you have studied, explain what has been done to reduce flooding. Name of river … … … … … … … … … … … … … … …[7] [Total: 25 marks] END OF QUESTION 3 www.theallpapers.com
Question paper, page 14
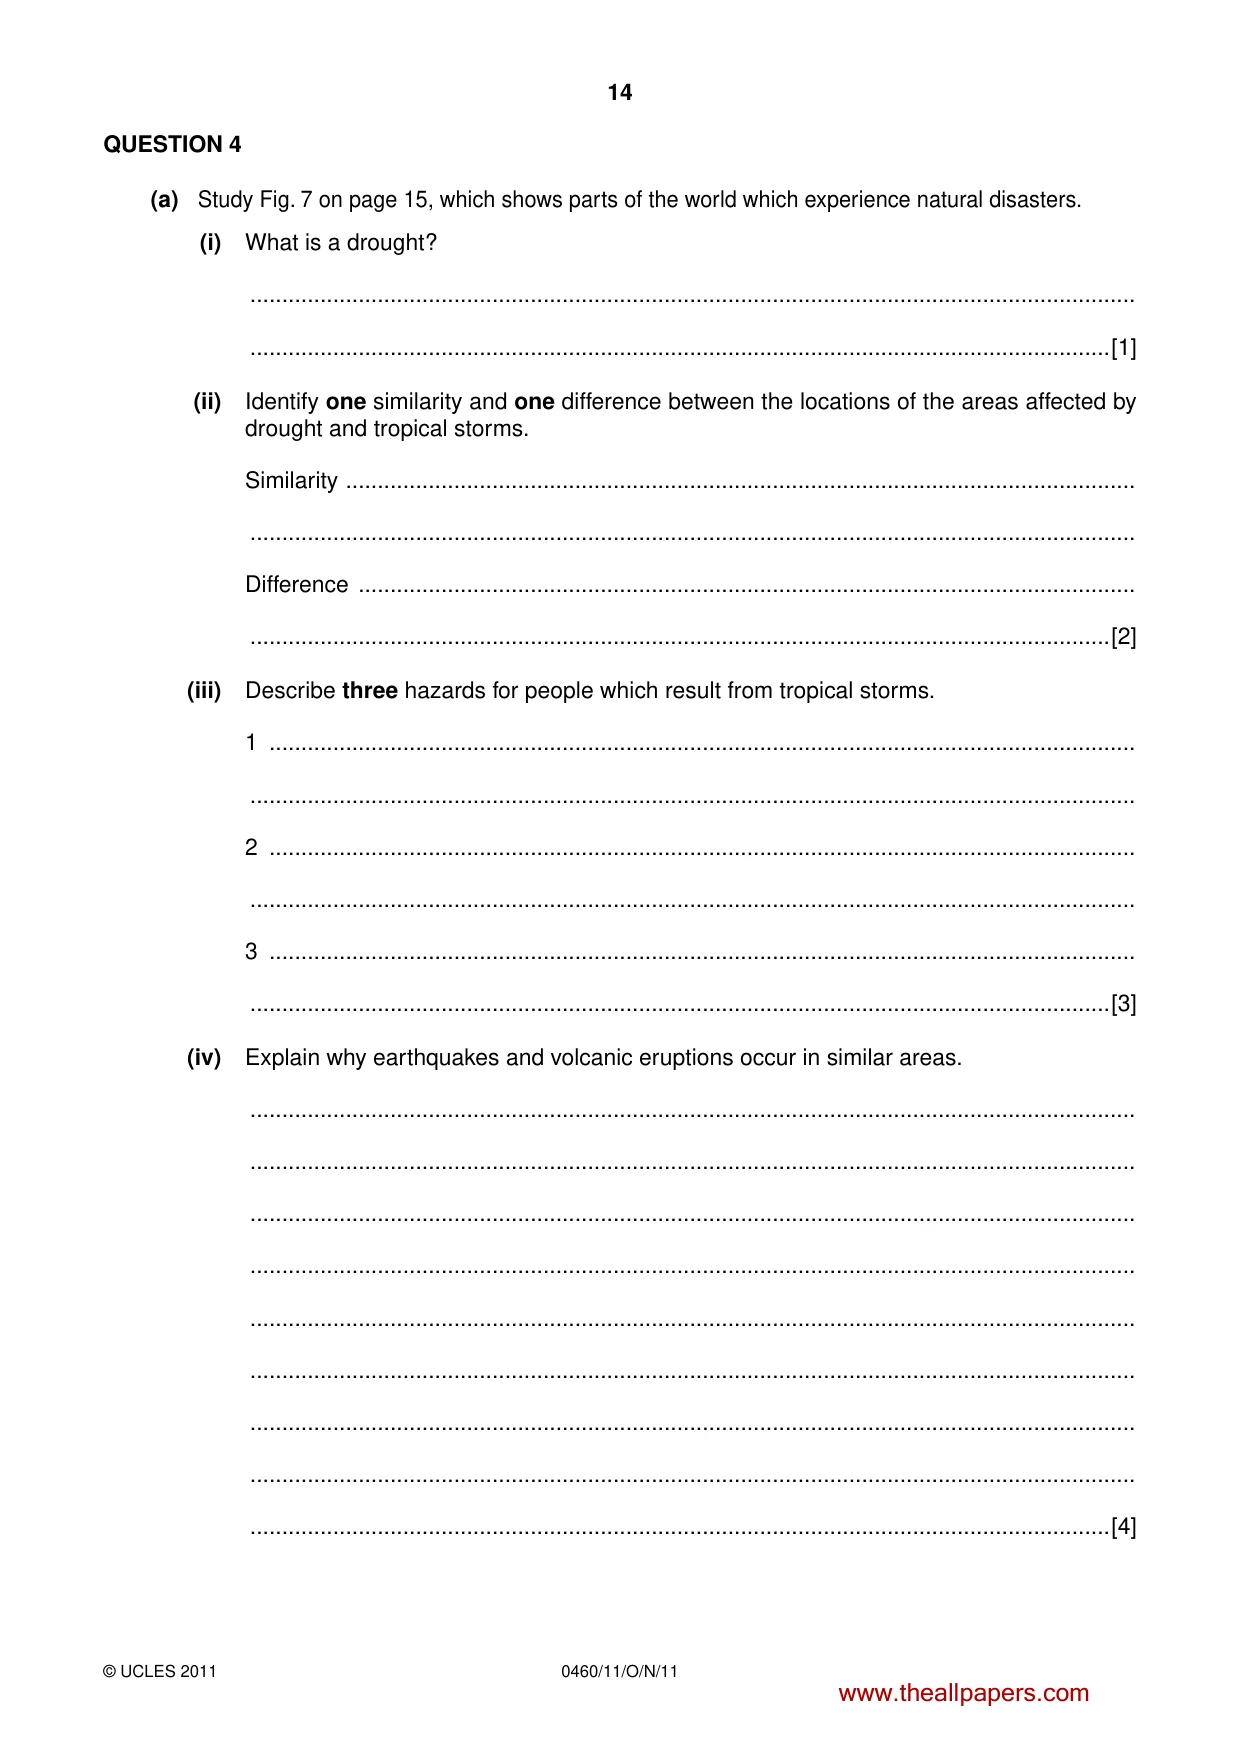
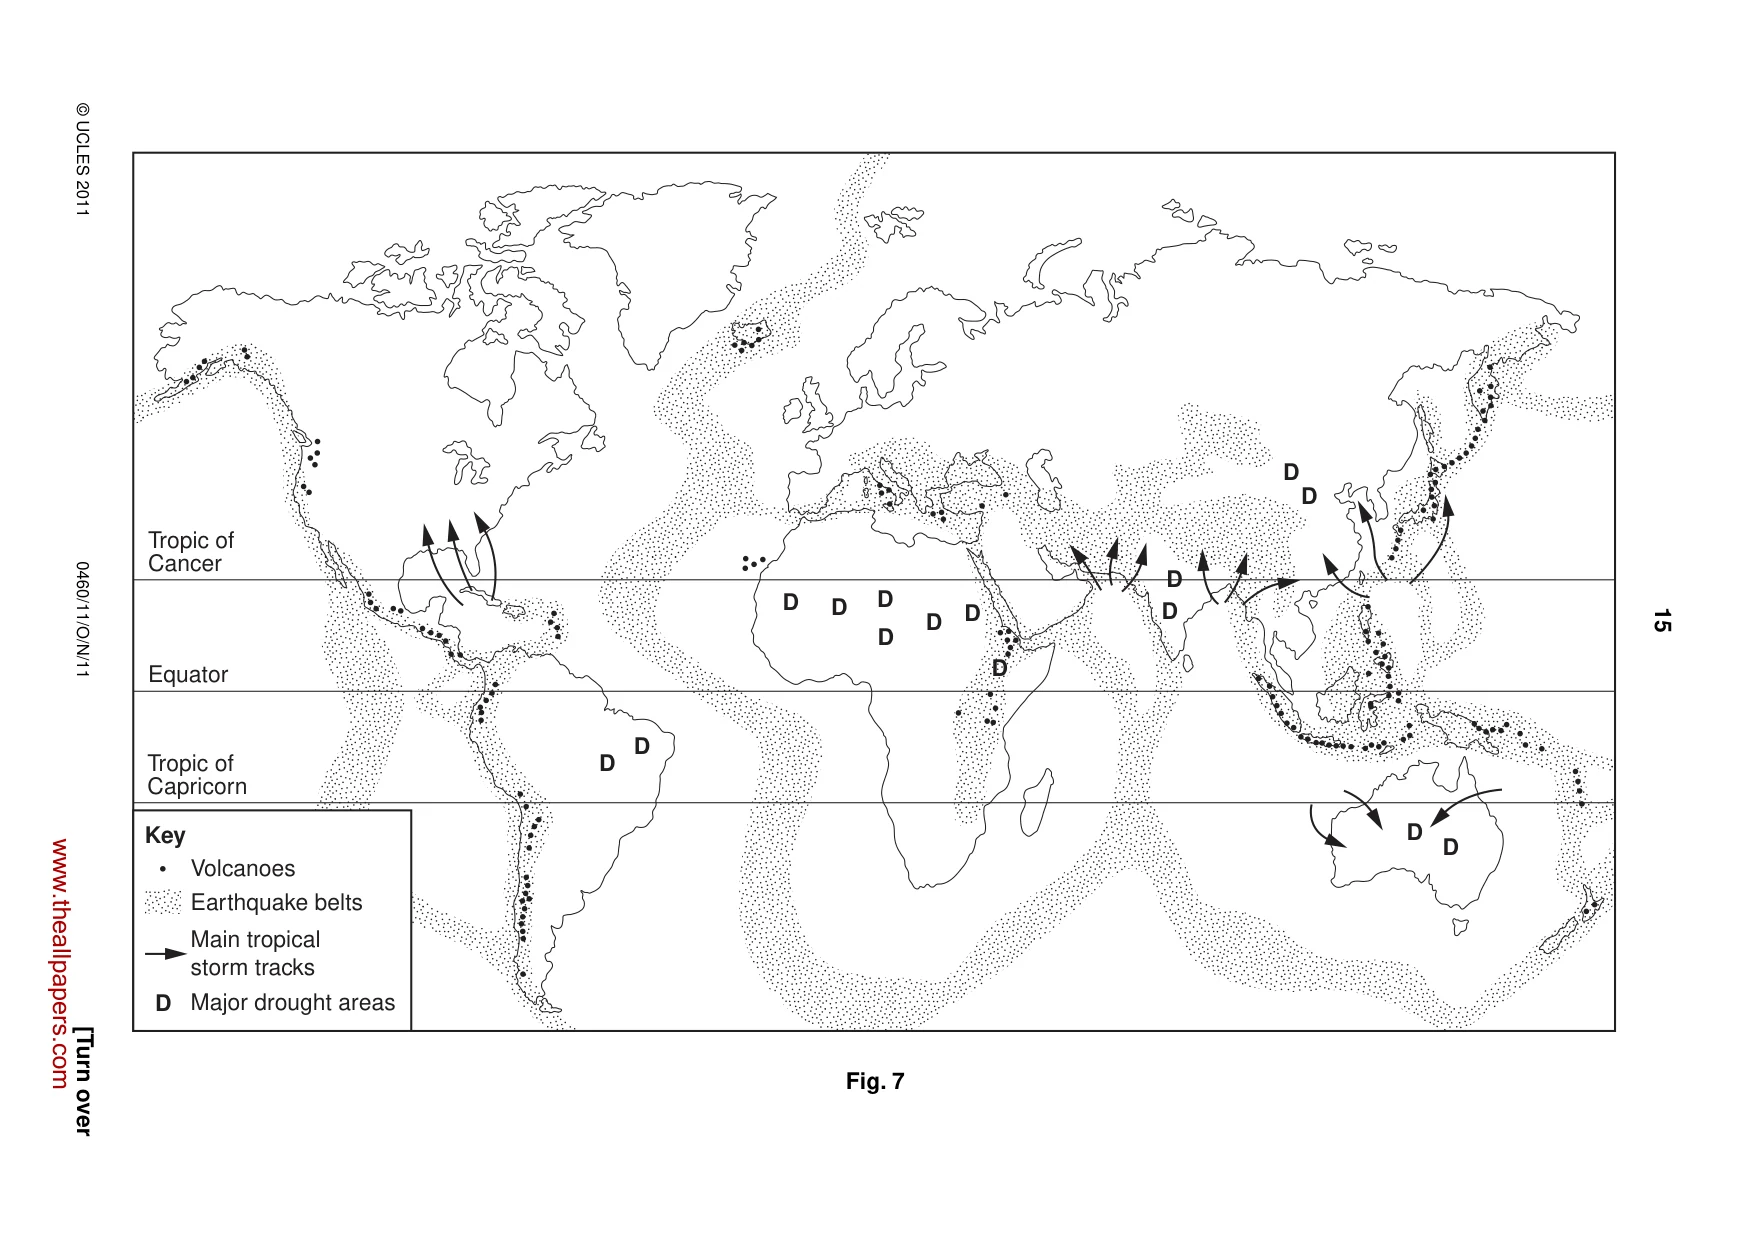
14 0460/11/O/N/11 © UCLES 2011 QUESTION 4 (a) Study Fig. 7 on page 15, which shows parts of the world which experience natural disasters. (i) What is a drought? … …[1] (ii) Identify one similarity and one difference between the locations of the areas affected by drought and tropical storms. Similarity … … Difference … …[2] (iii) Describe three hazards for people which result from tropical storms. 1 … … 2 … … 3 … …[3] (iv) Explain why earthquakes and volcanic eruptions occur in similar areas. … … … … … … … … …[4] www.theallpapers.com
Question paper, page 15
15 0460/11/O/N/11 © UCLES 2011 [Turn over D D D D D D D D D D D D D D D Tropic of Cancer Tropic of Capricorn Volcanoes Key Earthquake belts Main tropical storm tracks Major drought areas Equator D Fig. 7 www.theallpapers.com
Question paper, page 16
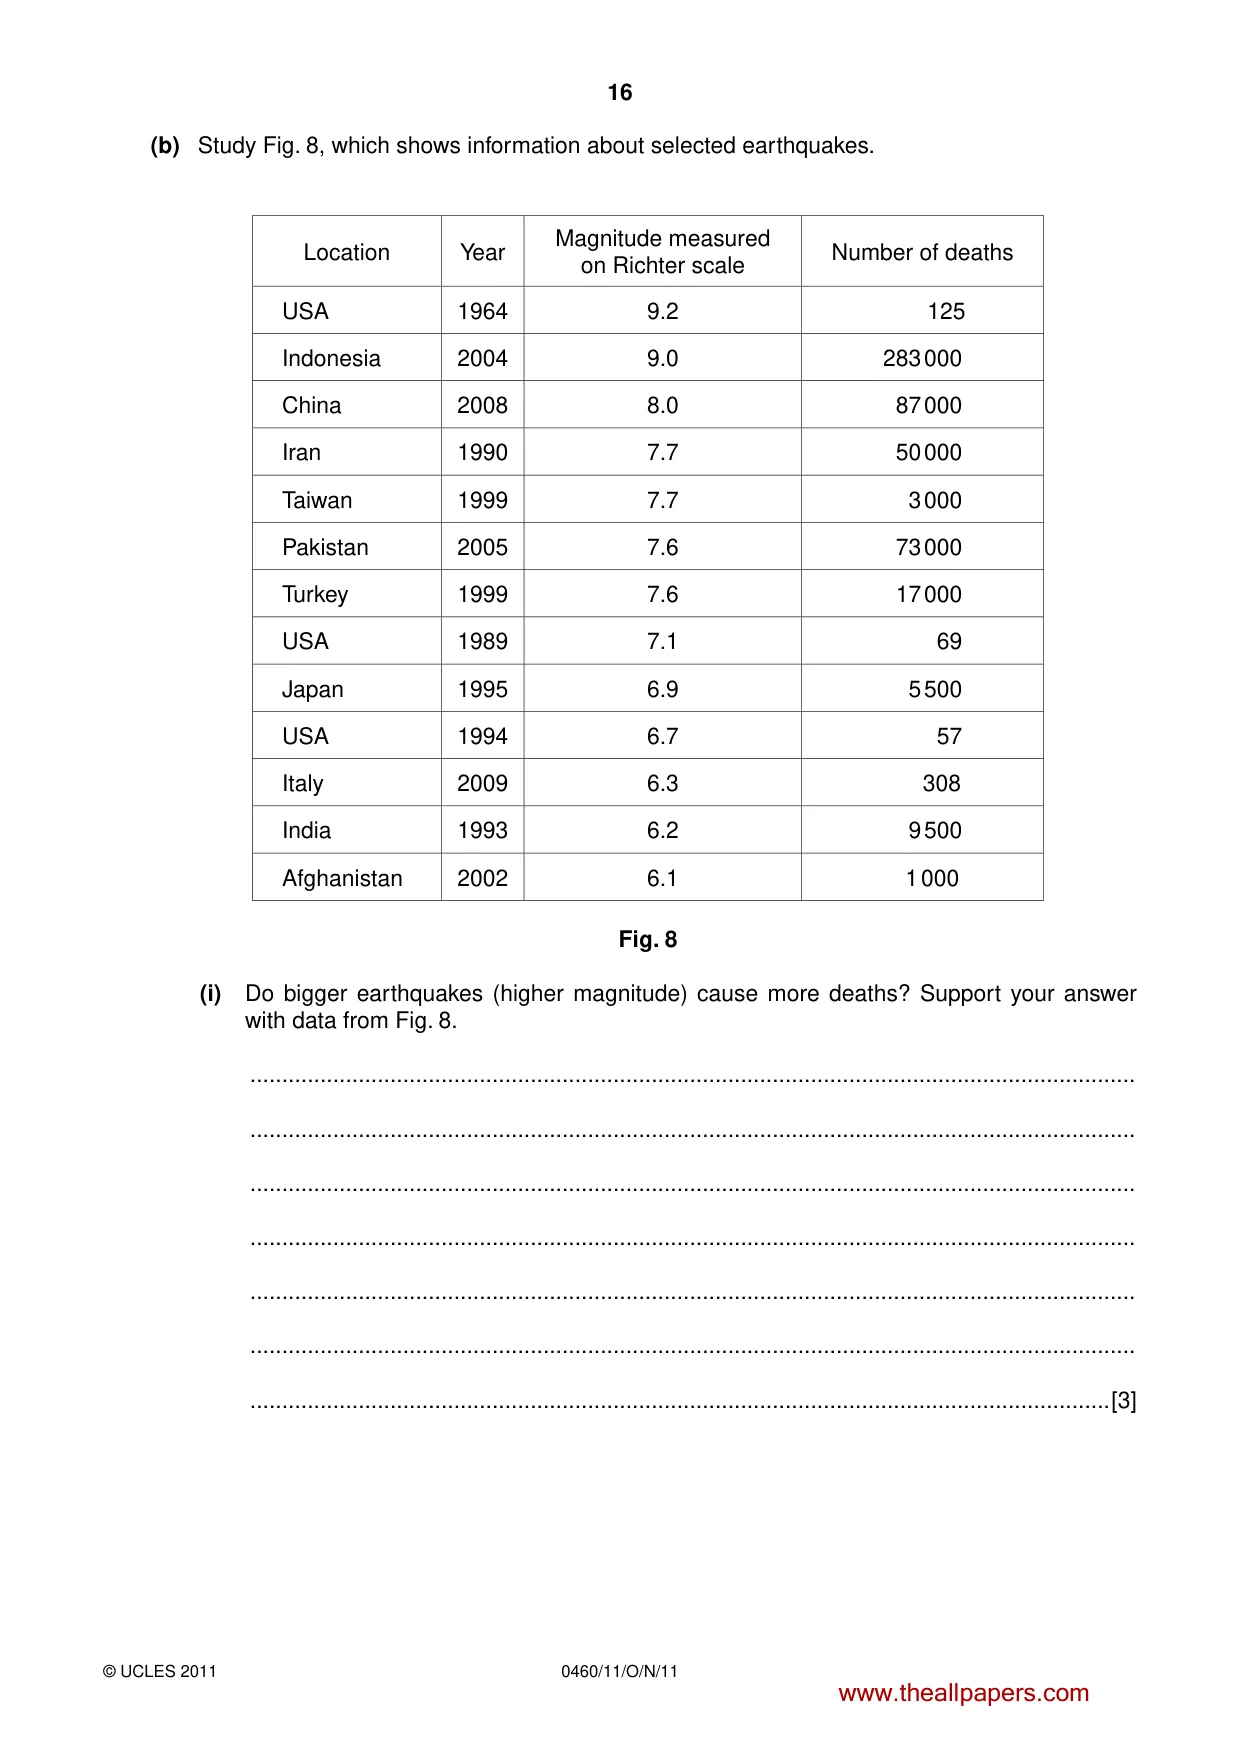
16 0460/11/O/N/11 © UCLES 2011 (b) Study Fig. 8, which shows information about selected earthquakes. Location Year Magnitude measured on Richter scale Number of deaths USA 1964 9.2 125 Indonesia 2004 9.0 283 000 China 2008 8.0 87 000 Iran 1990 7.7 50 000 Taiwan 1999 7.7 3 000 Pakistan 2005 7.6 73 000 Turkey 1999 7.6 17 000 USA 1989 7.1 69 Japan 1995 6.9 5 500 USA 1994 6.7 57 Italy 2009 6.3 308 India 1993 6.2 9 500 Afghanistan 2002 6.1 1 000 Fig. 8 (i) Do bigger earthquakes (higher magnitude) cause more deaths? Support your answer with data from Fig. 8. … … … … … … …[3] www.theallpapers.com
Question paper, page 17
17 0460/11/O/N/11 © UCLES 2011 [Turn over (ii) Suggest reasons for the variation in the number of deaths caused by the earthquakes listed in Fig. 8. … … … … … … … … …[5] (c) Volcanic eruptions are another natural hazard. For a named example of a volcanic eruption which you have studied, describe its effects. Name of volcanic eruption … … … … … … … … … … … … … … …[7] [Total: 25 marks] END OF QUESTION 4 www.theallpapers.com
Question paper, page 18
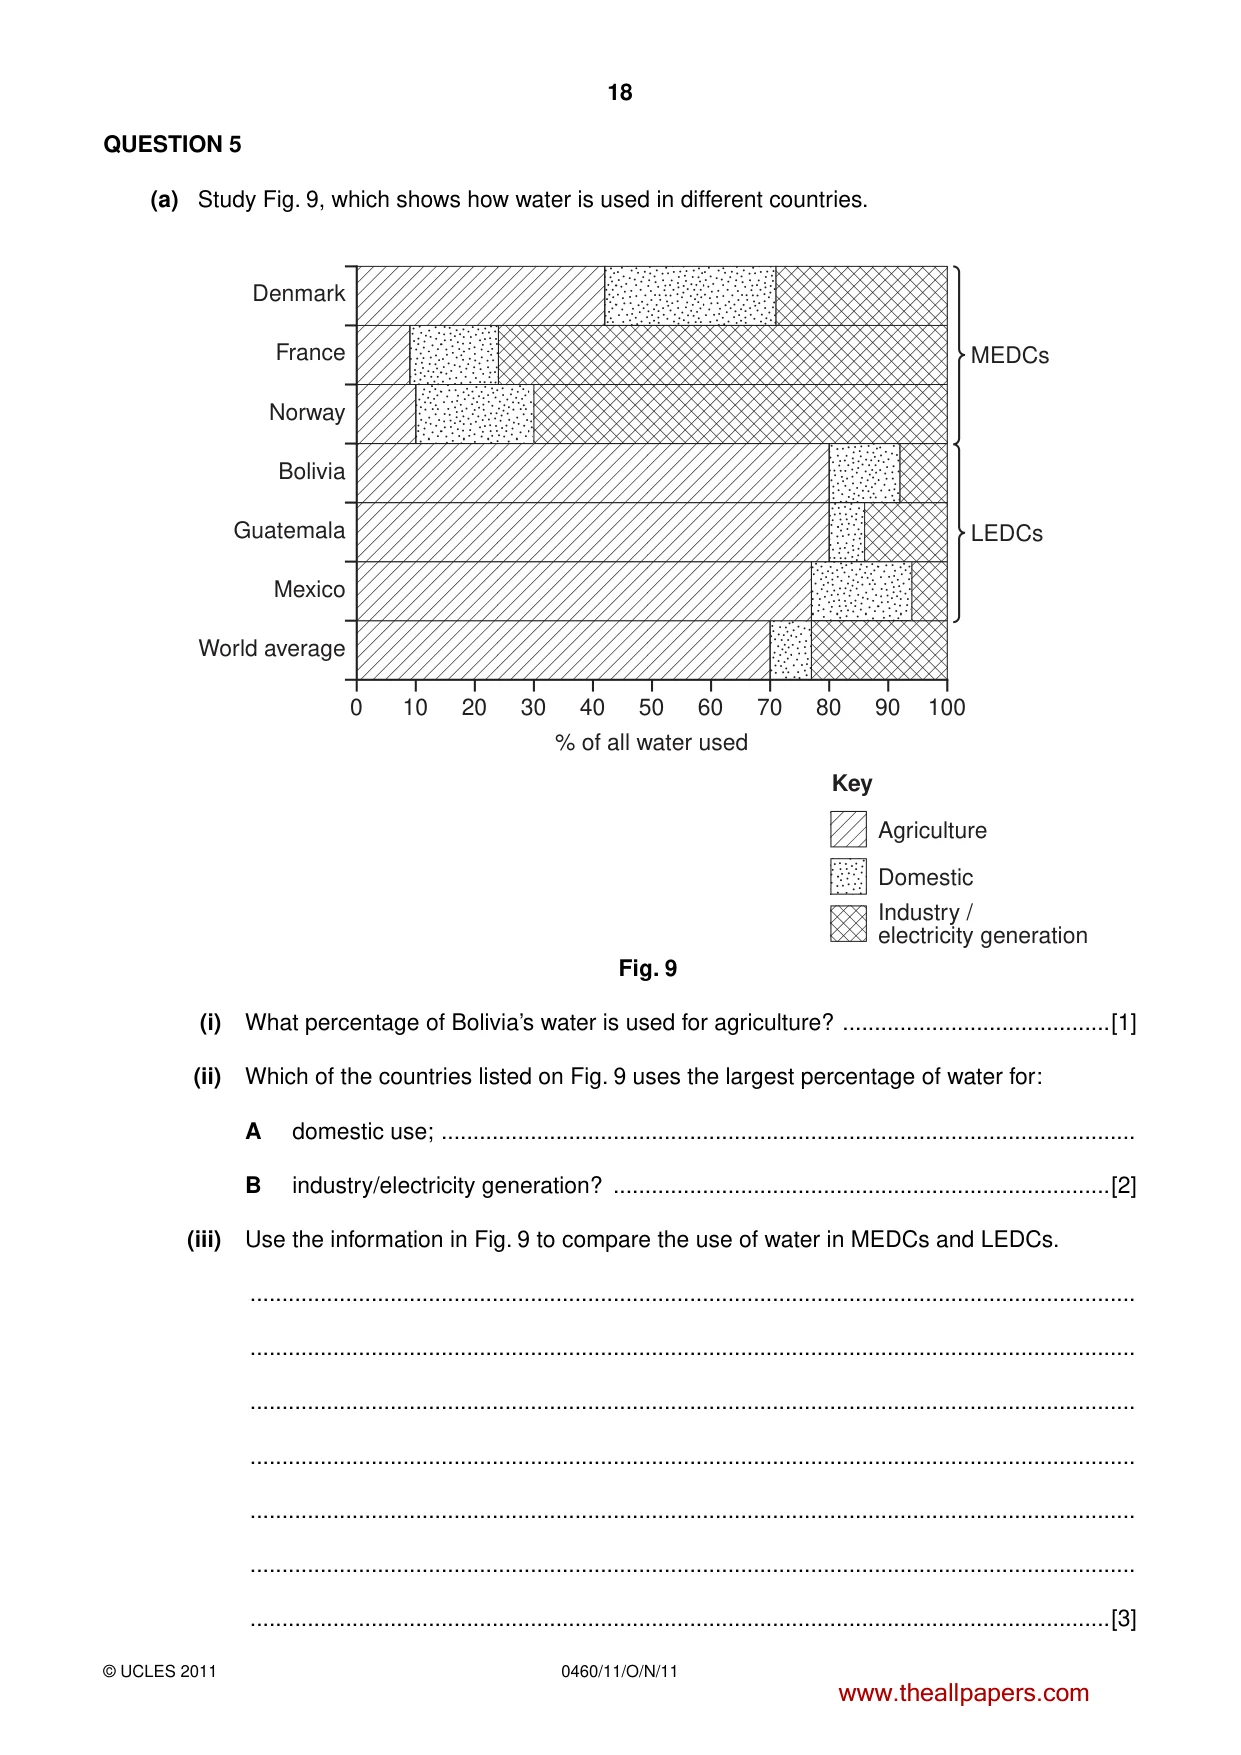
18 0460/11/O/N/11 © UCLES 2011 QUESTION 5 (a) Study Fig. 9, which shows how water is used in different countries. 0 World average Mexico Guatemala Bolivia Norway France Denmark 10 20 30 40 50 % of all water used Key Agriculture Domestic Industry / electricity generation 60 70 80 90 100 MEDCs LEDCs Fig. 9 (i) What percentage of Bolivia’s water is used for agriculture? …[1] (ii) Which of the countries listed on Fig. 9 uses the largest percentage of water for: A domestic use; … B industry/electricity generation? …[2] (iii) Use the information in Fig. 9 to compare the use of water in MEDCs and LEDCs. … … … … … … …[3] www.theallpapers.com
Question paper, page 19
19 0460/11/O/N/11 © UCLES 2011 [Turn over (iv) Suggest reasons for the variation in the use of water between countries at different levels of economic development. … … … … … … …[4] (b) Study Photographs A, B and C (Insert), which show three possible sources of water pollution. (i) State one way in which the economic activity shown in each of the photographs might cause water pollution. Photograph A … … Photograph B … … Photograph C … …[3] (ii) Describe the impacts of water pollution on people and the natural environment. … … … … … … … … … …[5] www.theallpapers.com
Question paper, page 20
20 0460/11/O/N/11 © UCLES 2011 (c) Name an area which you have studied which experiences water shortages. Explain how the water shortages cause problems for the people who live in your chosen area. Area studied … … … … … … … … … … … … … … … …[7] [Total: 25 marks] END OF QUESTION 5 www.theallpapers.com
Question paper, page 21
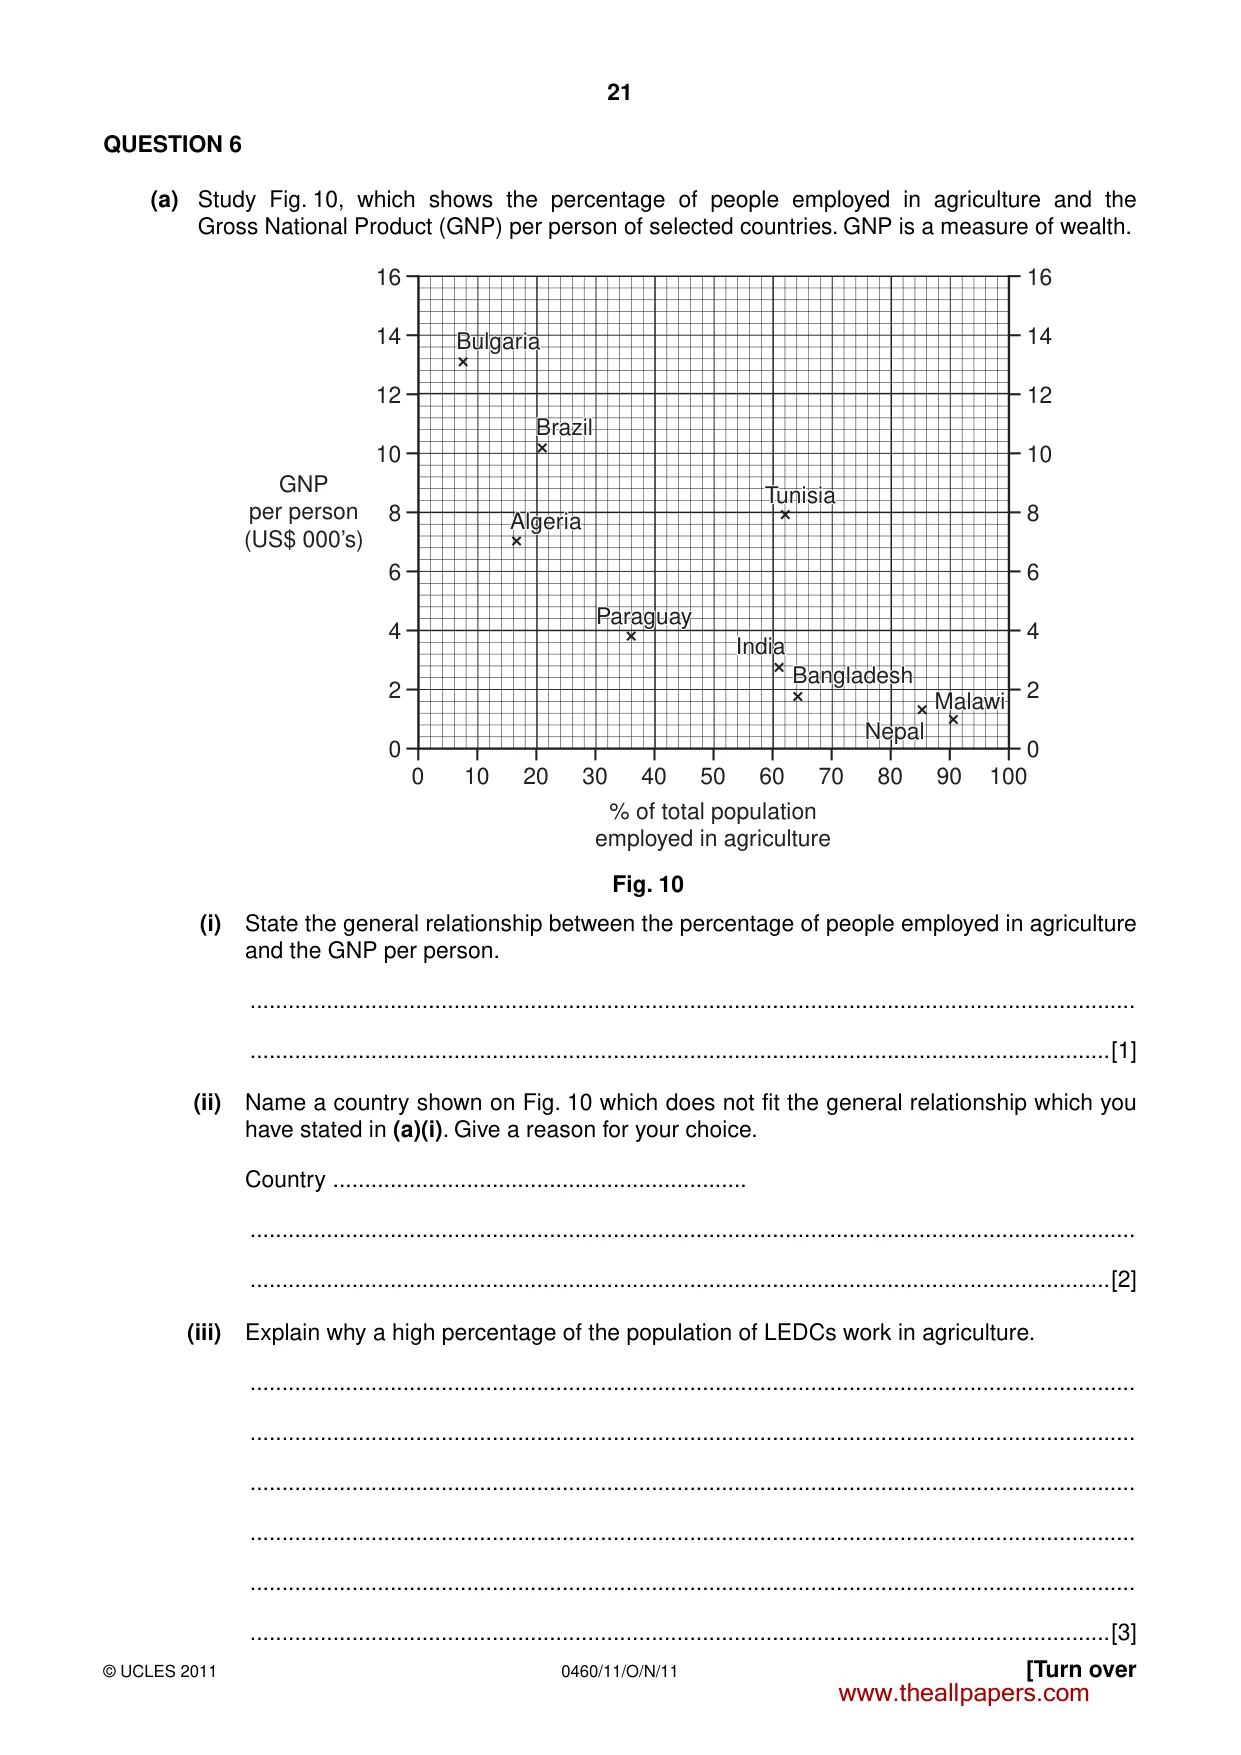
21 0460/11/O/N/11 © UCLES 2011 [Turn over QUESTION 6 (a) Study Fig. 10, which shows the percentage of people employed in agriculture and the Gross National Product (GNP) per person of selected countries. GNP is a measure of wealth. 16 14 12 10 GNP per person (US$ 000’s) 8 6 4 2 0 16 14 12 10 8 6 4 2 0 0 10 20 30 40 50 % of total population employed in agriculture 60 70 80 90 100 Bulgaria Bulgaria Brazil Brazil Algeria Algeria Tunisia Tunisia Paraguay Paraguay India India Bangladesh Bangladesh Nepal Nepal Malawi Malawi Bulgaria Brazil Algeria Tunisia Paraguay India Bangladesh Nepal Malawi Fig. 10 (i) State the general relationship between the percentage of people employed in agriculture and the GNP per person. … …[1] (ii) Name a country shown on Fig. 10 which does not fit the general relationship which you have stated in (a)(i). Give a reason for your choice. Country … … …[2] (iii) Explain why a high percentage of the population of LEDCs work in agriculture. … … … … … …[3] www.theallpapers.com
Question paper, page 22
22 0460/11/O/N/11 © UCLES 2011 (iv) Explain why many LEDCs suffer from food shortages, even though a large percentage of their population are farmers. … … … … … … … …[4] (b) Study Fig. 11, which shows information about the sources of energy used in France (an MEDC in Europe) and Kenya (an LEDC in Africa). 100 0 10 20 30 40 50 60 70 80 90 France Key Oil 100 0 10 20 30 40 50 60 70 80 90 Kenya Gas Electricity Wood Coal Fig. 11 (i) Using Fig. 11 only, identify three differences in energy used between France and Kenya. 1 … … 2 … … 3 … …[3] www.theallpapers.com
Question paper, page 23
23 0460/11/O/N/11 © UCLES 2011 [Turn over (ii) Suggest reasons why the importance of different sources of energy varies from country to country. … … … … … … … …[5] (c) The use of energy may increase global warming. Describe the likely impacts of global warming on named areas which you have studied. You should refer to the impacts on people and the natural environment. Areas studied … … … … … … … … … … … … … … …[7] [Total: 25 marks] END OF QUESTION 6 www.theallpapers.com
Question paper, page 24
24 0460/11/O/N/11 © UCLES 2011 Additional Page If you use the following lined page to complete the answer(s) to any question(s), the question number(s) must be clearly shown. … … … … … … … … … … … … … … … … … … … … … Copyright Acknowledgements: Question 2 Fig. 3 © Robert B. Potter & Sally Lloyd-Evans; The City in the Developing World ; Prentice Hall; 1998. Question 5 Photographs A–C Steve Sibley © UCLES. Permission to reproduce items where third-party owned material protected by copyright is included has been sought and cleared where possible. Every reasonable effort has been made by the publisher (UCLES) to trace copyright holders, but if any items requiring clearance have unwittingly been included, the publisher will be pleased to make amends at the earliest possible opportunity. University of Cambridge International Examinations is part of the Cambridge Assessment Group. Cambridge Assessment is the brand name of University of Cambridge Local Examinations Syndicate (UCLES), which is itself a department of the University of Cambridge. www.theallpapers.com
Mark scheme, page 1
UNIVERSITY OF CAMBRIDGE INTERNATIONAL EXAMINATIONS International General Certificate of Secondary Education MARK SCHEME for the October/November 2011 question paper for the guidance of teachers 0460 GEOGRAPHY 0460/11 Paper 1, maximum raw mark 75 This mark scheme is published as an aid to teachers and candidates, to indicate the requirements of the examination. It shows the basis on which Examiners were instructed to award marks. It does not indicate the details of the discussions that took place at an Examiners’ meeting before marking began, which would have considered the acceptability of alternative answers. Mark schemes must be read in conjunction with the question papers and the report on the examination. • Cambridge will not enter into discussions or correspondence in connection with these mark schemes. Cambridge is publishing the mark schemes for the October/November 2011 question papers for most IGCSE, GCE Advanced Level and Advanced Subsidiary Level syllabuses and some Ordinary Level syllabuses. www.theallpapers.com
Mark scheme, page 2
Page 2 Mark Scheme: Teachers’ version Syllabus Paper IGCSE – October/November 2011 0460 11 © University of Cambridge International Examinations 2011 The features of the marking scheme Each question carries 25 marks. Candidates cannot earn above the maximum marks available within each sub section. The marking scheme attempts to give guidance about the requirements of each answer and lists a number of responses, which will earn marks along with the general principles to be applied when marking each question. It should be noted that candidates can earn marks if their answers are phrased differently provided they convey the same meaning as those in the mark scheme. THE CANDIDATES DO NOT NEED TO USE THE SAME WORDING TO EARN MARKS. The notation ‘etc.’ at the end of an answer in the mark scheme signifies that there may well be other correct responses or examples that can be given credit. Providing the statement is true, relevant to the question asked and not repetition of a previous point made credit should be given. A point made within one sub-section which is an answer to the question set in a different sub-section should not be given credit as each sub-section asks different questions which require independent answers. The mark scheme uses semi colons (;) to separate marks and diagonals to separate alternative answers. Levels of response marking is used for section (c) of each question. Thus it is the quality of the response that determines which level an answer achieves rather than the quantity of statements contained within it. However, once assigned to a level the mark achieved within that level is determined by the number of points made. Levels 1 and 2 are distinguished by whether statements are simple (level 1) or developed/elaborated (level 2). A candidate can immediately enter L2 by making developed points without making any L1 statements. In order to achieve L3 a candidate must have already reached the top end of L2 – in addition his/her answer should have a clear example and the answer is place specific as well (7 marks). Where statements are assigned levels by the examiner this should be indicated by the use of L1 and L2 next to the statements. Ticks should not be used on answers that are marked using levels of response marking. Summary: Level 1 (1 to 3 marks): 1 simple statement (1 mark) 2 simple statements (2 marks) 3 simple statements (3 marks) Level 2 (4 to 6 marks): 1 developed statement (4 marks) 2 developed statements (5 marks) 3 or more developed statements with e.g. (6 marks) No example/inappropriate example = MAX 5 marks Level 3 (7 marks) 3 or more developed statements + named example with at least one piece of place specific detail. www.theallpapers.com
Mark scheme, page 3
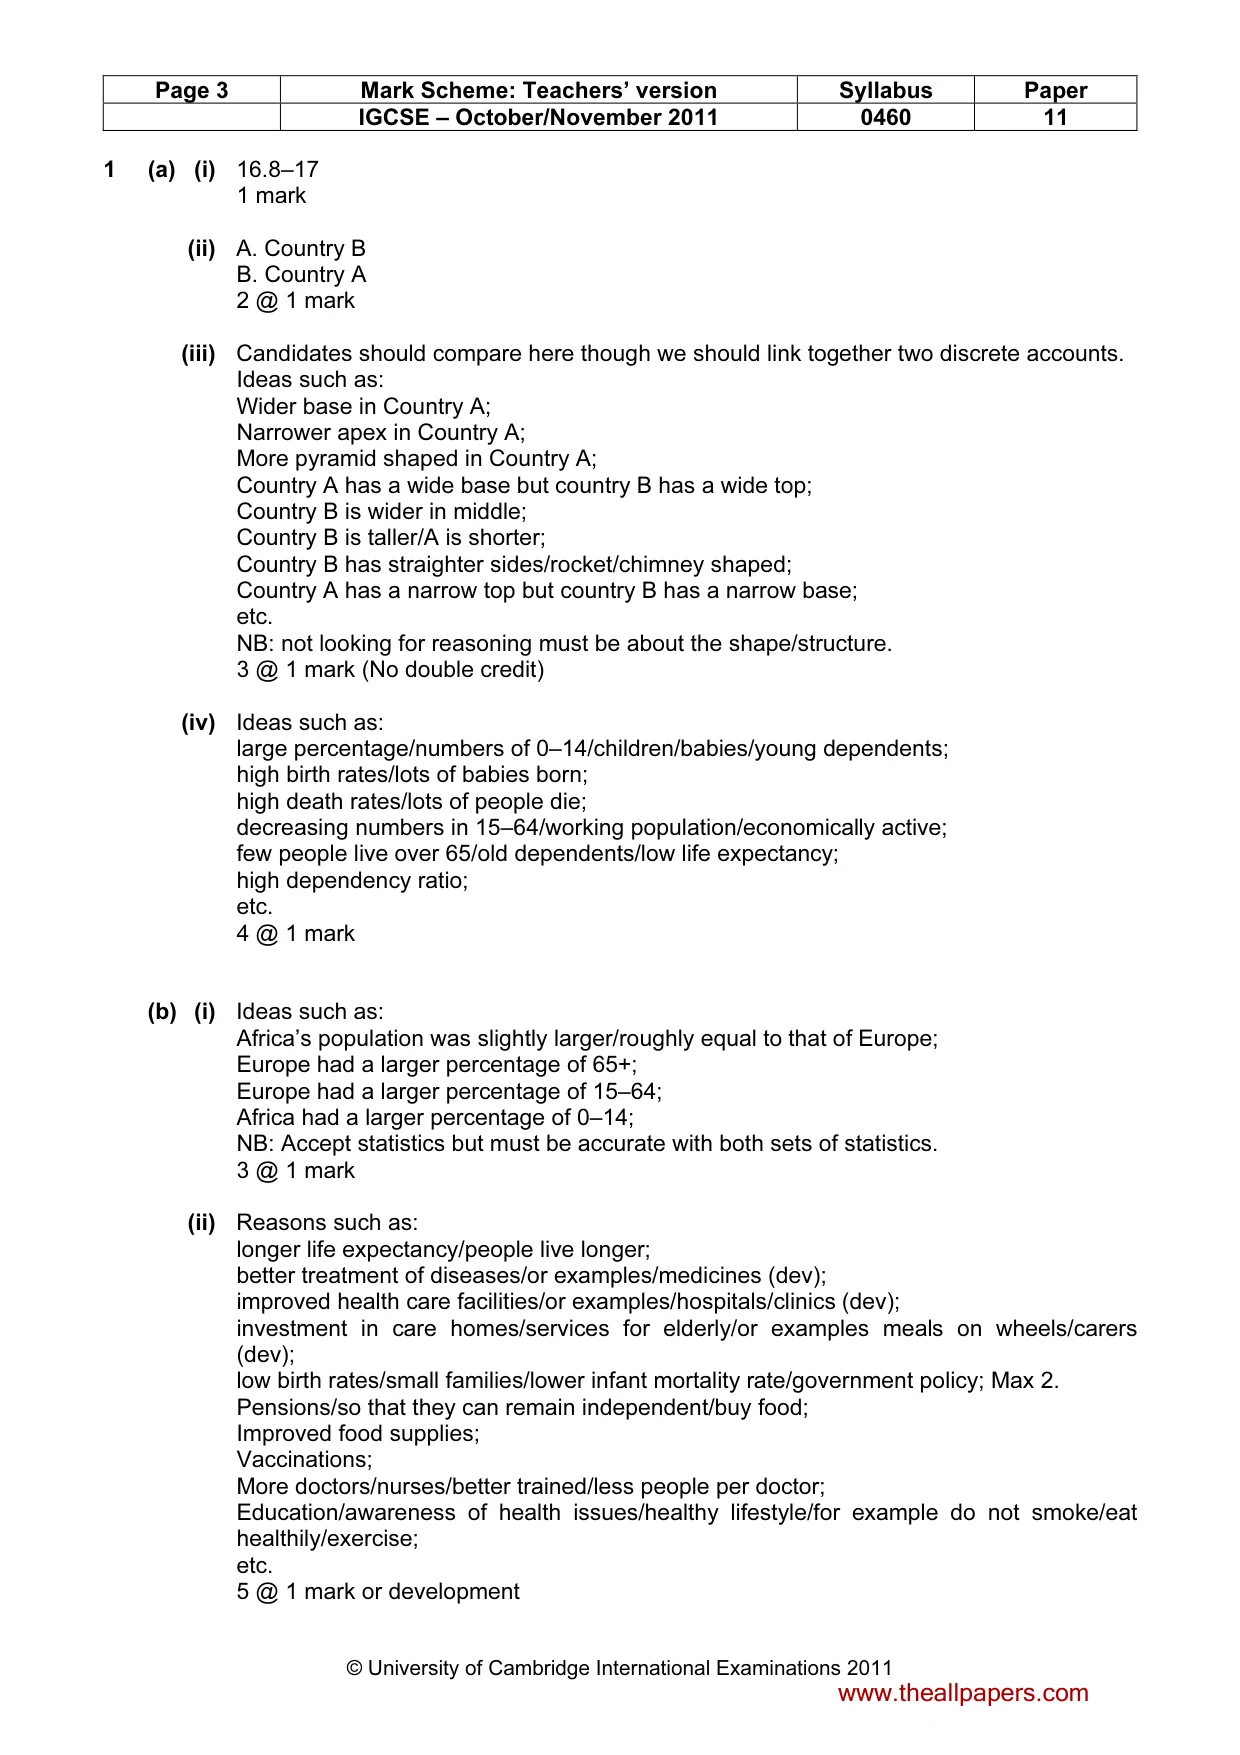
Page 3 Mark Scheme: Teachers’ version Syllabus Paper IGCSE – October/November 2011 0460 11 © University of Cambridge International Examinations 2011 1 (a) (i) 16.8–17 1 mark (ii) A. Country B B. Country A 2 @ 1 mark (iii) Candidates should compare here though we should link together two discrete accounts. Ideas such as: Wider base in Country A; Narrower apex in Country A; More pyramid shaped in Country A; Country A has a wide base but country B has a wide top; Country B is wider in middle; Country B is taller/A is shorter; Country B has straighter sides/rocket/chimney shaped; Country A has a narrow top but country B has a narrow base; etc. NB: not looking for reasoning must be about the shape/structure. 3 @ 1 mark (No double credit) (iv) Ideas such as: large percentage/numbers of 0–14/children/babies/young dependents; high birth rates/lots of babies born; high death rates/lots of people die; decreasing numbers in 15–64/working population/economically active; few people live over 65/old dependents/low life expectancy; high dependency ratio; etc. 4 @ 1 mark (b) (i) Ideas such as: Africa’s population was slightly larger/roughly equal to that of Europe; Europe had a larger percentage of 65+; Europe had a larger percentage of 15–64; Africa had a larger percentage of 0–14; NB: Accept statistics but must be accurate with both sets of statistics. 3 @ 1 mark (ii) Reasons such as: longer life expectancy/people live longer; better treatment of diseases/or examples/medicines (dev); improved health care facilities/or examples/hospitals/clinics (dev); investment in care homes/services for elderly/or examples meals on wheels/carers (dev); low birth rates/small families/lower infant mortality rate/government policy; Max 2. Pensions/so that they can remain independent/buy food; Improved food supplies; Vaccinations; More doctors/nurses/better trained/less people per doctor; Education/awareness of health issues/healthy lifestyle/for example do not smoke/eat healthily/exercise; etc. 5 @ 1 mark or development www.theallpapers.com
Mark scheme, page 4
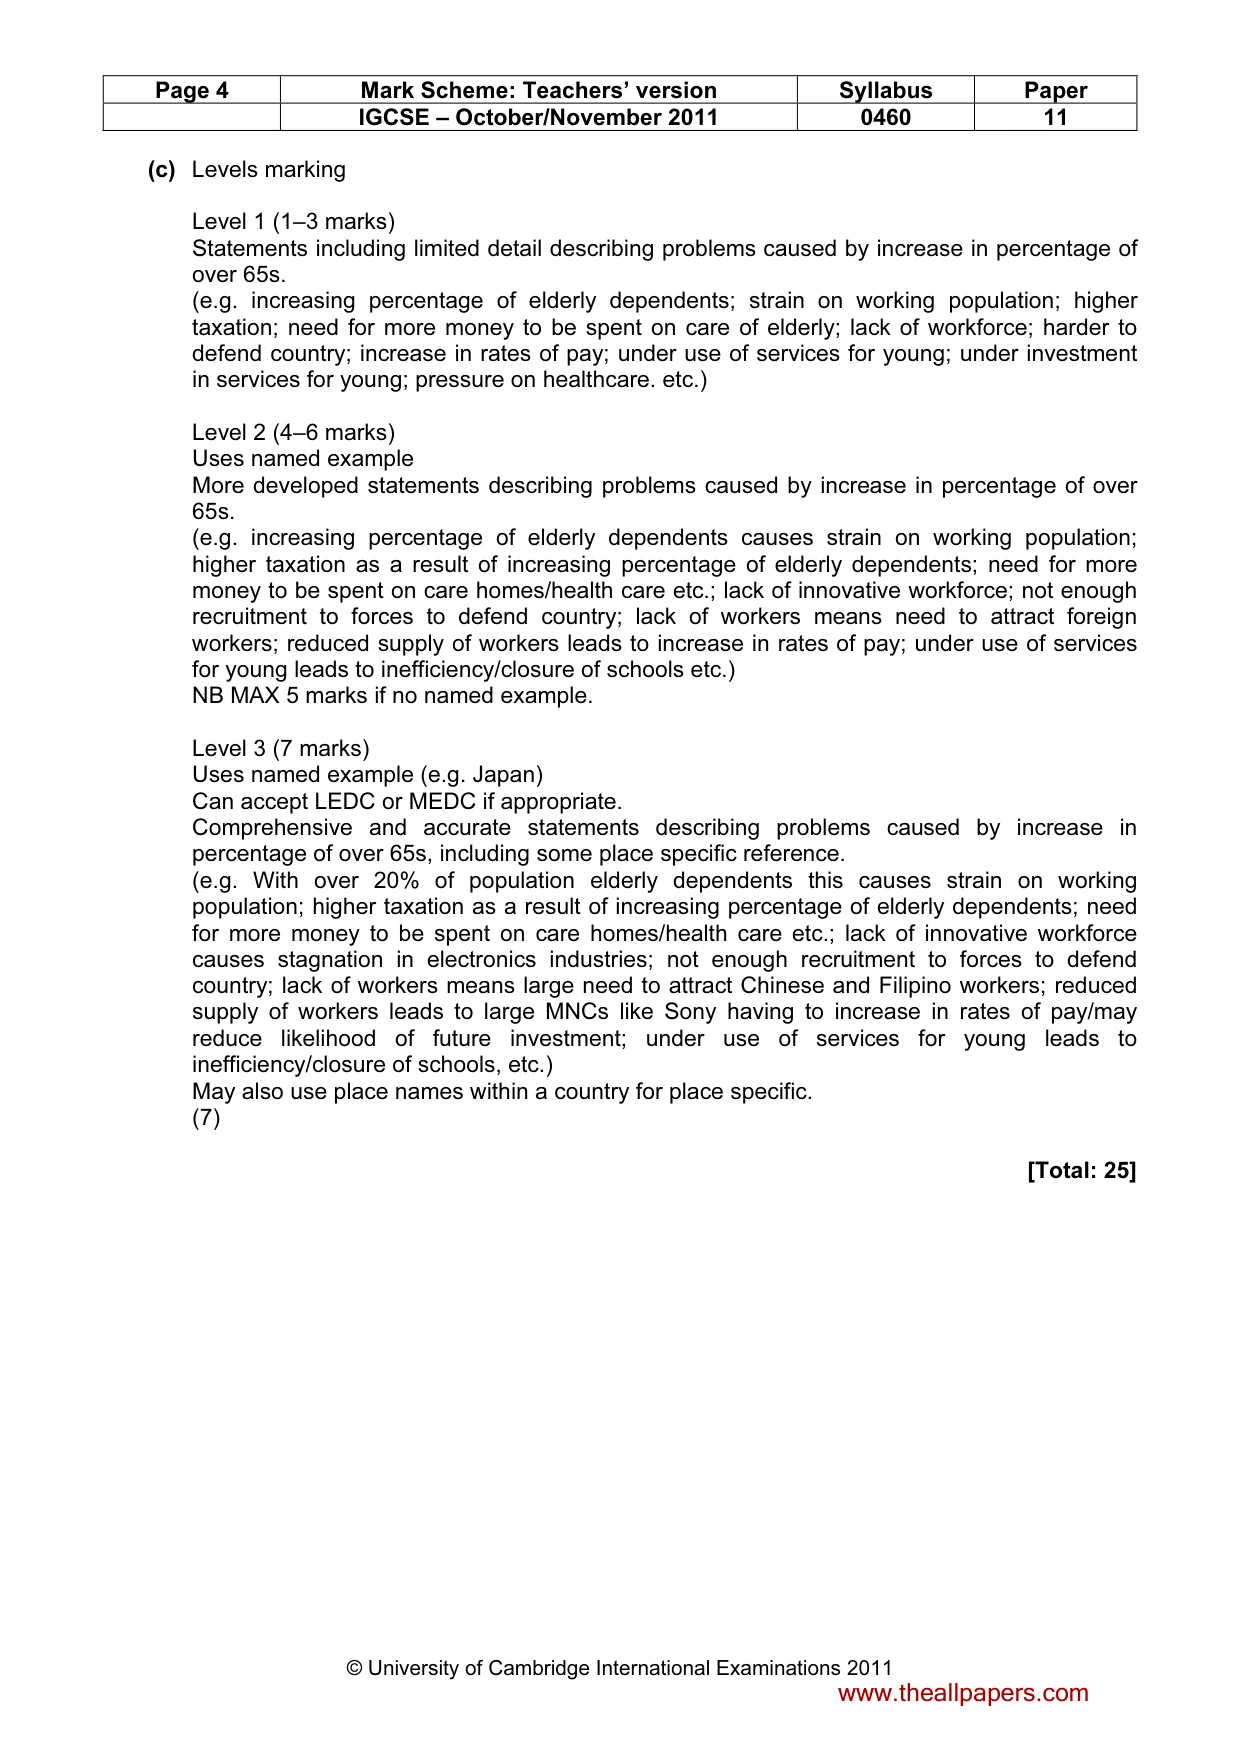
Page 4 Mark Scheme: Teachers’ version Syllabus Paper IGCSE – October/November 2011 0460 11 © University of Cambridge International Examinations 2011 (c) Levels marking Level 1 (1–3 marks) Statements including limited detail describing problems caused by increase in percentage of over 65s. (e.g. increasing percentage of elderly dependents; strain on working population; higher taxation; need for more money to be spent on care of elderly; lack of workforce; harder to defend country; increase in rates of pay; under use of services for young; under investment in services for young; pressure on healthcare. etc.) Level 2 (4–6 marks) Uses named example More developed statements describing problems caused by increase in percentage of over 65s. (e.g. increasing percentage of elderly dependents causes strain on working population; higher taxation as a result of increasing percentage of elderly dependents; need for more money to be spent on care homes/health care etc.; lack of innovative workforce; not enough recruitment to forces to defend country; lack of workers means need to attract foreign workers; reduced supply of workers leads to increase in rates of pay; under use of services for young leads to inefficiency/closure of schools etc.) NB MAX 5 marks if no named example. Level 3 (7 marks) Uses named example (e.g. Japan) Can accept LEDC or MEDC if appropriate. Comprehensive and accurate statements describing problems caused by increase in percentage of over 65s, including some place specific reference. (e.g. With over 20% of population elderly dependents this causes strain on working population; higher taxation as a result of increasing percentage of elderly dependents; need for more money to be spent on care homes/health care etc.; lack of innovative workforce causes stagnation in electronics industries; not enough recruitment to forces to defend country; lack of workers means large need to attract Chinese and Filipino workers; reduced supply of workers leads to large MNCs like Sony having to increase in rates of pay/may reduce likelihood of future investment; under use of services for young leads to inefficiency/closure of schools, etc.) May also use place names within a country for place specific. (7) [Total: 25] www.theallpapers.com
Mark scheme, page 5
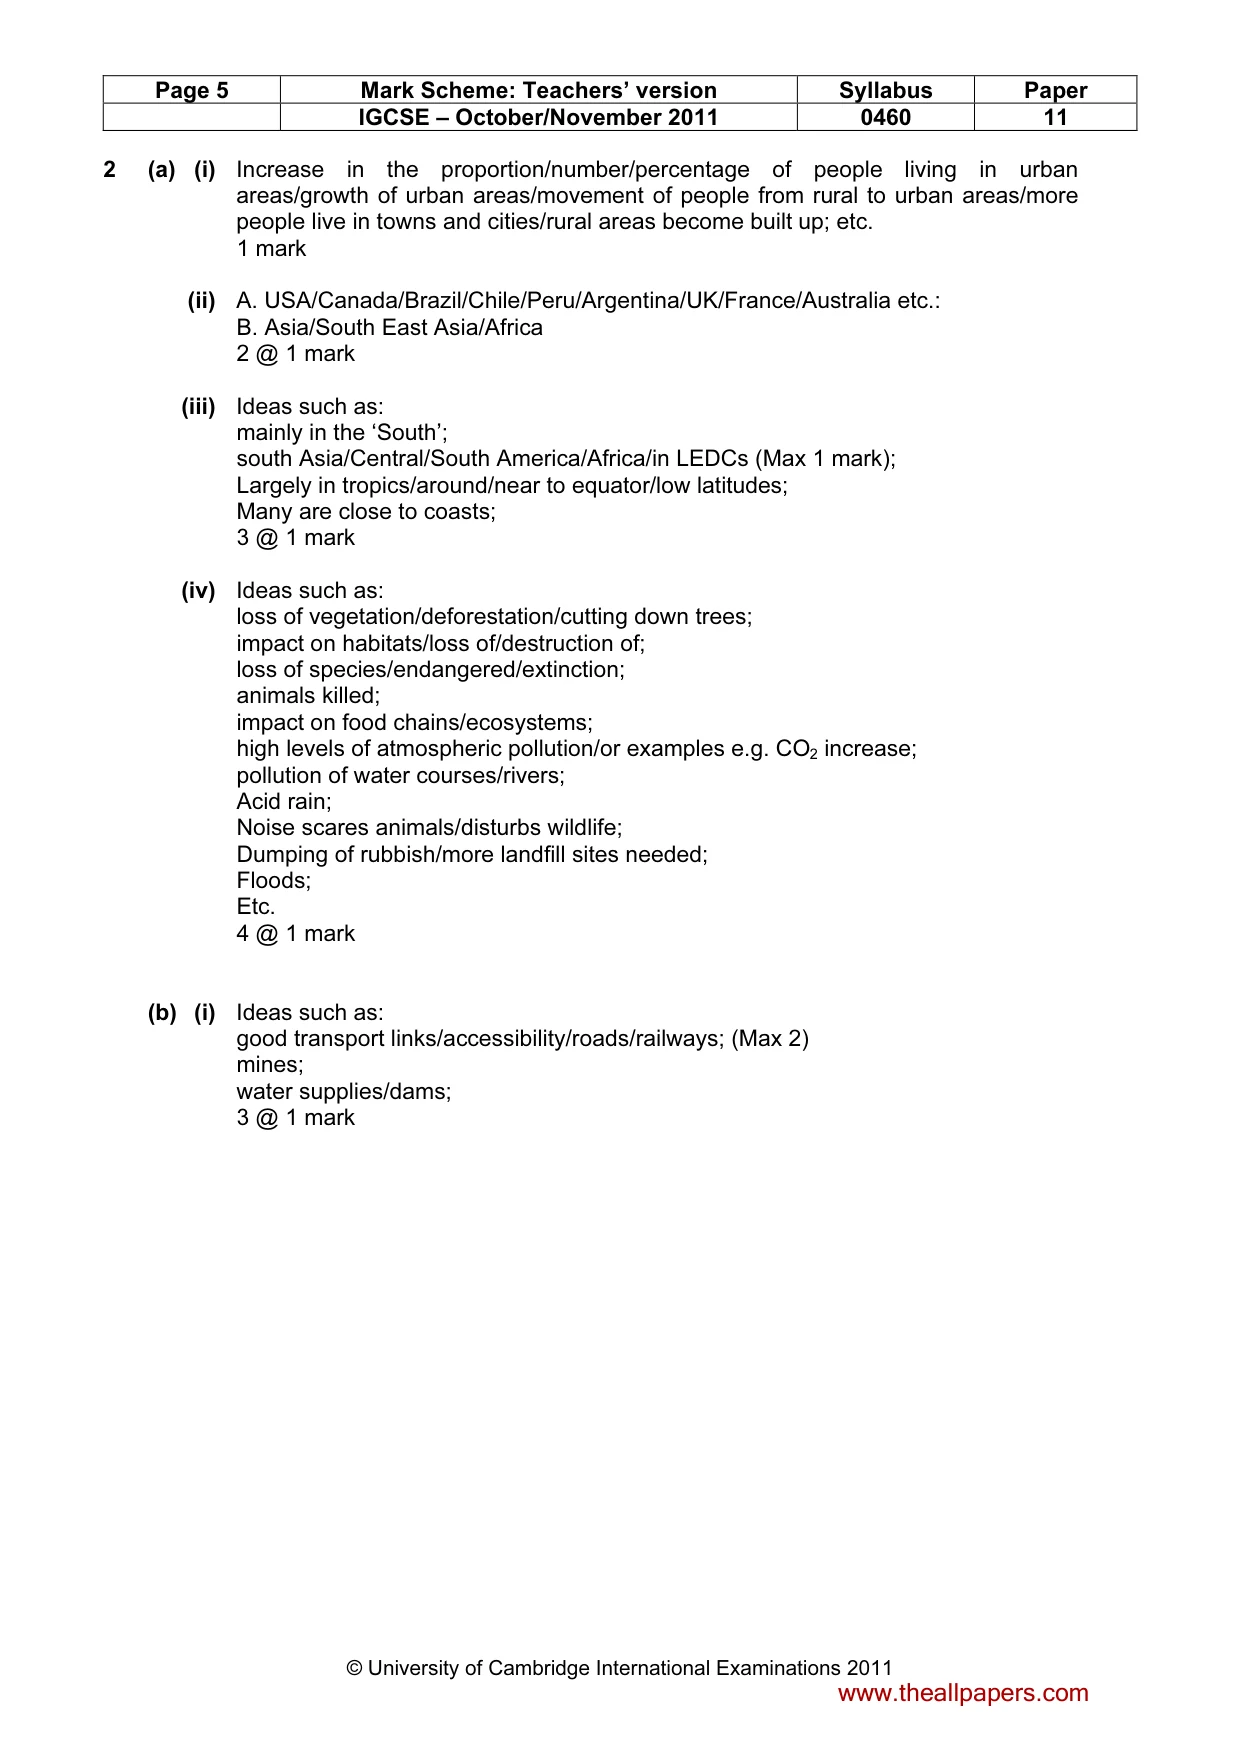
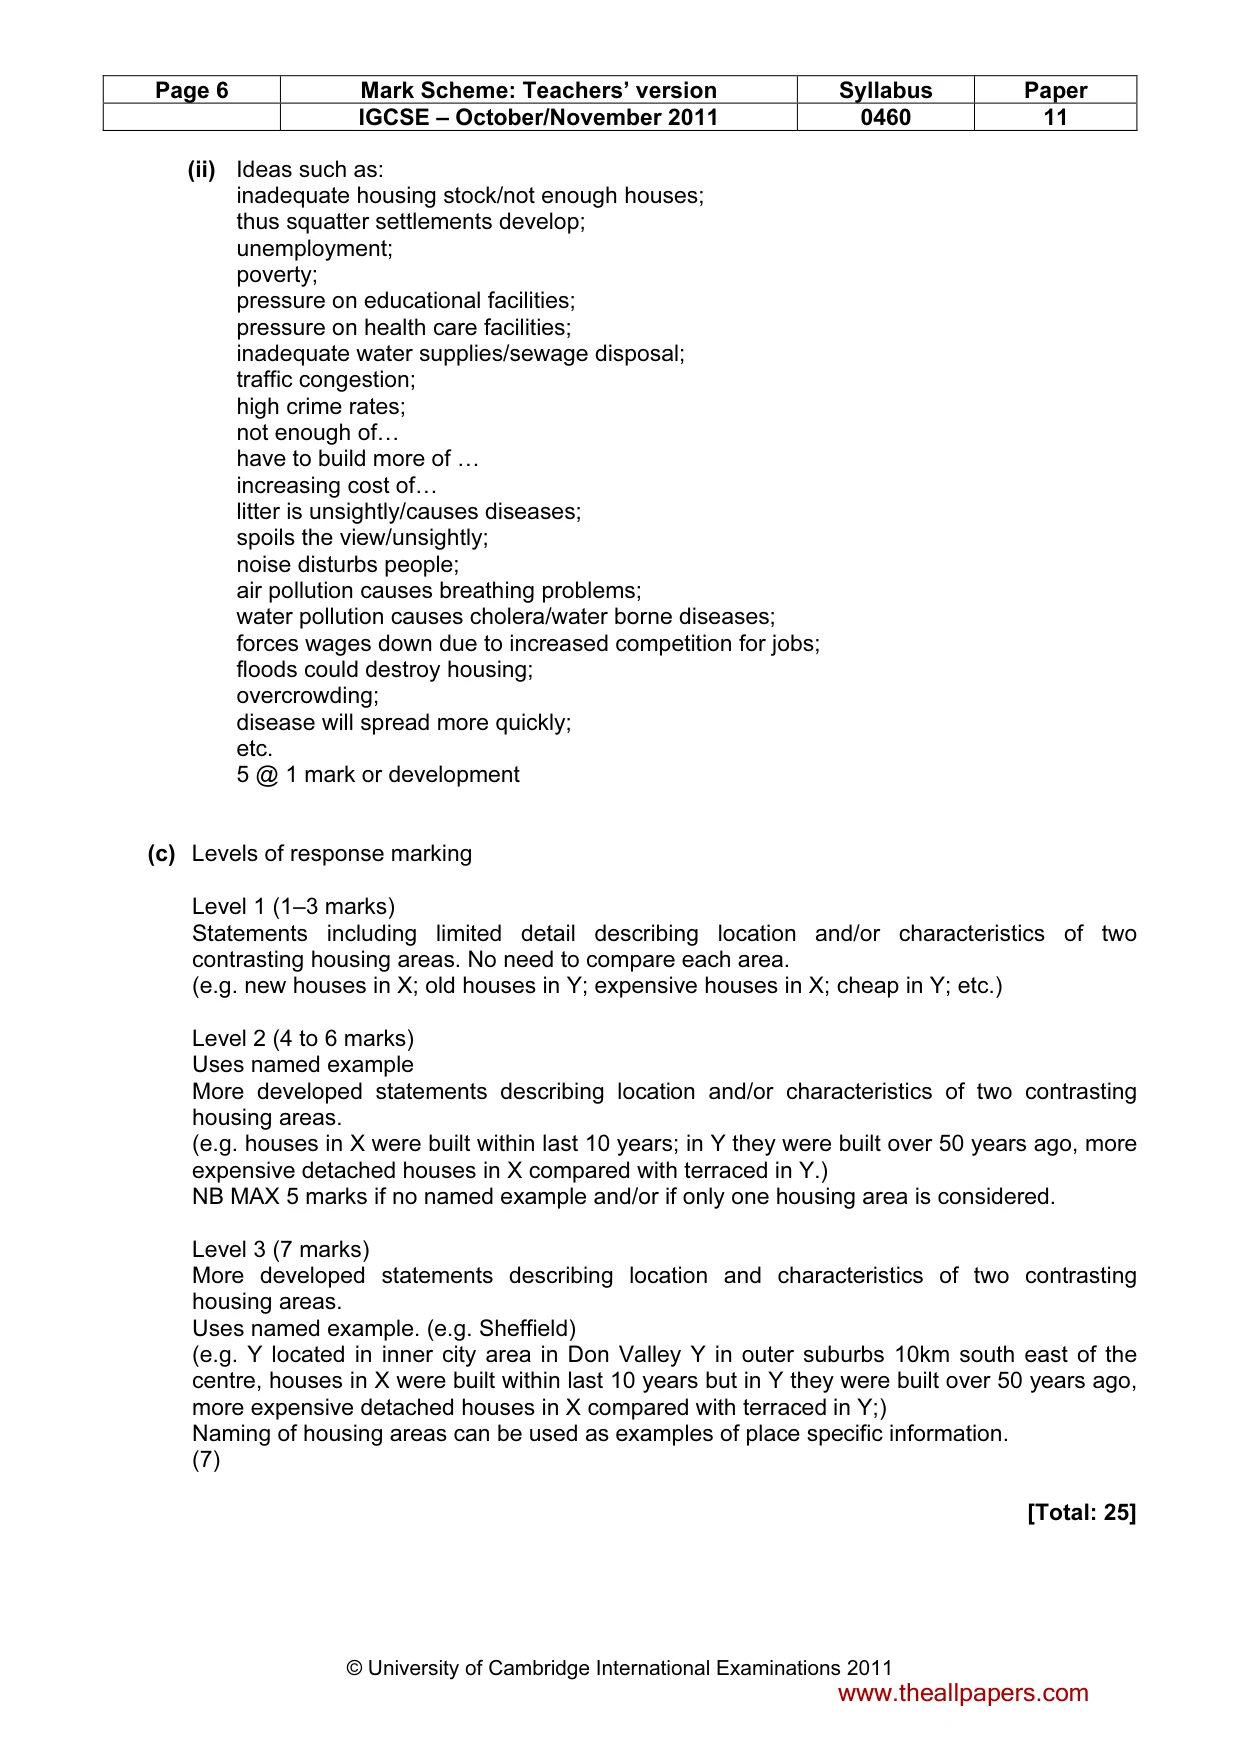
Page 5 Mark Scheme: Teachers’ version Syllabus Paper IGCSE – October/November 2011 0460 11 © University of Cambridge International Examinations 2011 2 (a) (i) Increase in the proportion/number/percentage of people living in urban areas/growth of urban areas/movement of people from rural to urban areas/more people live in towns and cities/rural areas become built up; etc. 1 mark (ii) A. USA/Canada/Brazil/Chile/Peru/Argentina/UK/France/Australia etc.: B. Asia/South East Asia/Africa 2 @ 1 mark (iii) Ideas such as: mainly in the ‘South’; south Asia/Central/South America/Africa/in LEDCs (Max 1 mark); Largely in tropics/around/near to equator/low latitudes; Many are close to coasts; 3 @ 1 mark (iv) Ideas such as: loss of vegetation/deforestation/cutting down trees; impact on habitats/loss of/destruction of; loss of species/endangered/extinction; animals killed; impact on food chains/ecosystems; high levels of atmospheric pollution/or examples e.g. CO2 increase; pollution of water courses/rivers; Acid rain; Noise scares animals/disturbs wildlife; Dumping of rubbish/more landfill sites needed; Floods; Etc. 4 @ 1 mark (b) (i) Ideas such as: good transport links/accessibility/roads/railways; (Max 2) mines; water supplies/dams; 3 @ 1 mark www.theallpapers.com
Mark scheme, page 6
Page 6 Mark Scheme: Teachers’ version Syllabus Paper IGCSE – October/November 2011 0460 11 © University of Cambridge International Examinations 2011 (ii) Ideas such as: inadequate housing stock/not enough houses; thus squatter settlements develop; unemployment; poverty; pressure on educational facilities; pressure on health care facilities; inadequate water supplies/sewage disposal; traffic congestion; high crime rates; not enough of… have to build more of … increasing cost of… litter is unsightly/causes diseases; spoils the view/unsightly; noise disturbs people; air pollution causes breathing problems; water pollution causes cholera/water borne diseases; forces wages down due to increased competition for jobs; floods could destroy housing; overcrowding; disease will spread more quickly; etc. 5 @ 1 mark or development (c) Levels of response marking Level 1 (1–3 marks) Statements including limited detail describing location and/or characteristics of two contrasting housing areas. No need to compare each area. (e.g. new houses in X; old houses in Y; expensive houses in X; cheap in Y; etc.) Level 2 (4 to 6 marks) Uses named example More developed statements describing location and/or characteristics of two contrasting housing areas. (e.g. houses in X were built within last 10 years; in Y they were built over 50 years ago, more expensive detached houses in X compared with terraced in Y.) NB MAX 5 marks if no named example and/or if only one housing area is considered. Level 3 (7 marks) More developed statements describing location and characteristics of two contrasting housing areas. Uses named example. (e.g. Sheffield) (e.g. Y located in inner city area in Don Valley Y in outer suburbs 10km south east of the centre, houses in X were built within last 10 years but in Y they were built over 50 years ago, more expensive detached houses in X compared with terraced in Y;) Naming of housing areas can be used as examples of place specific information. (7) [Total: 25] www.theallpapers.com
Mark scheme, page 7
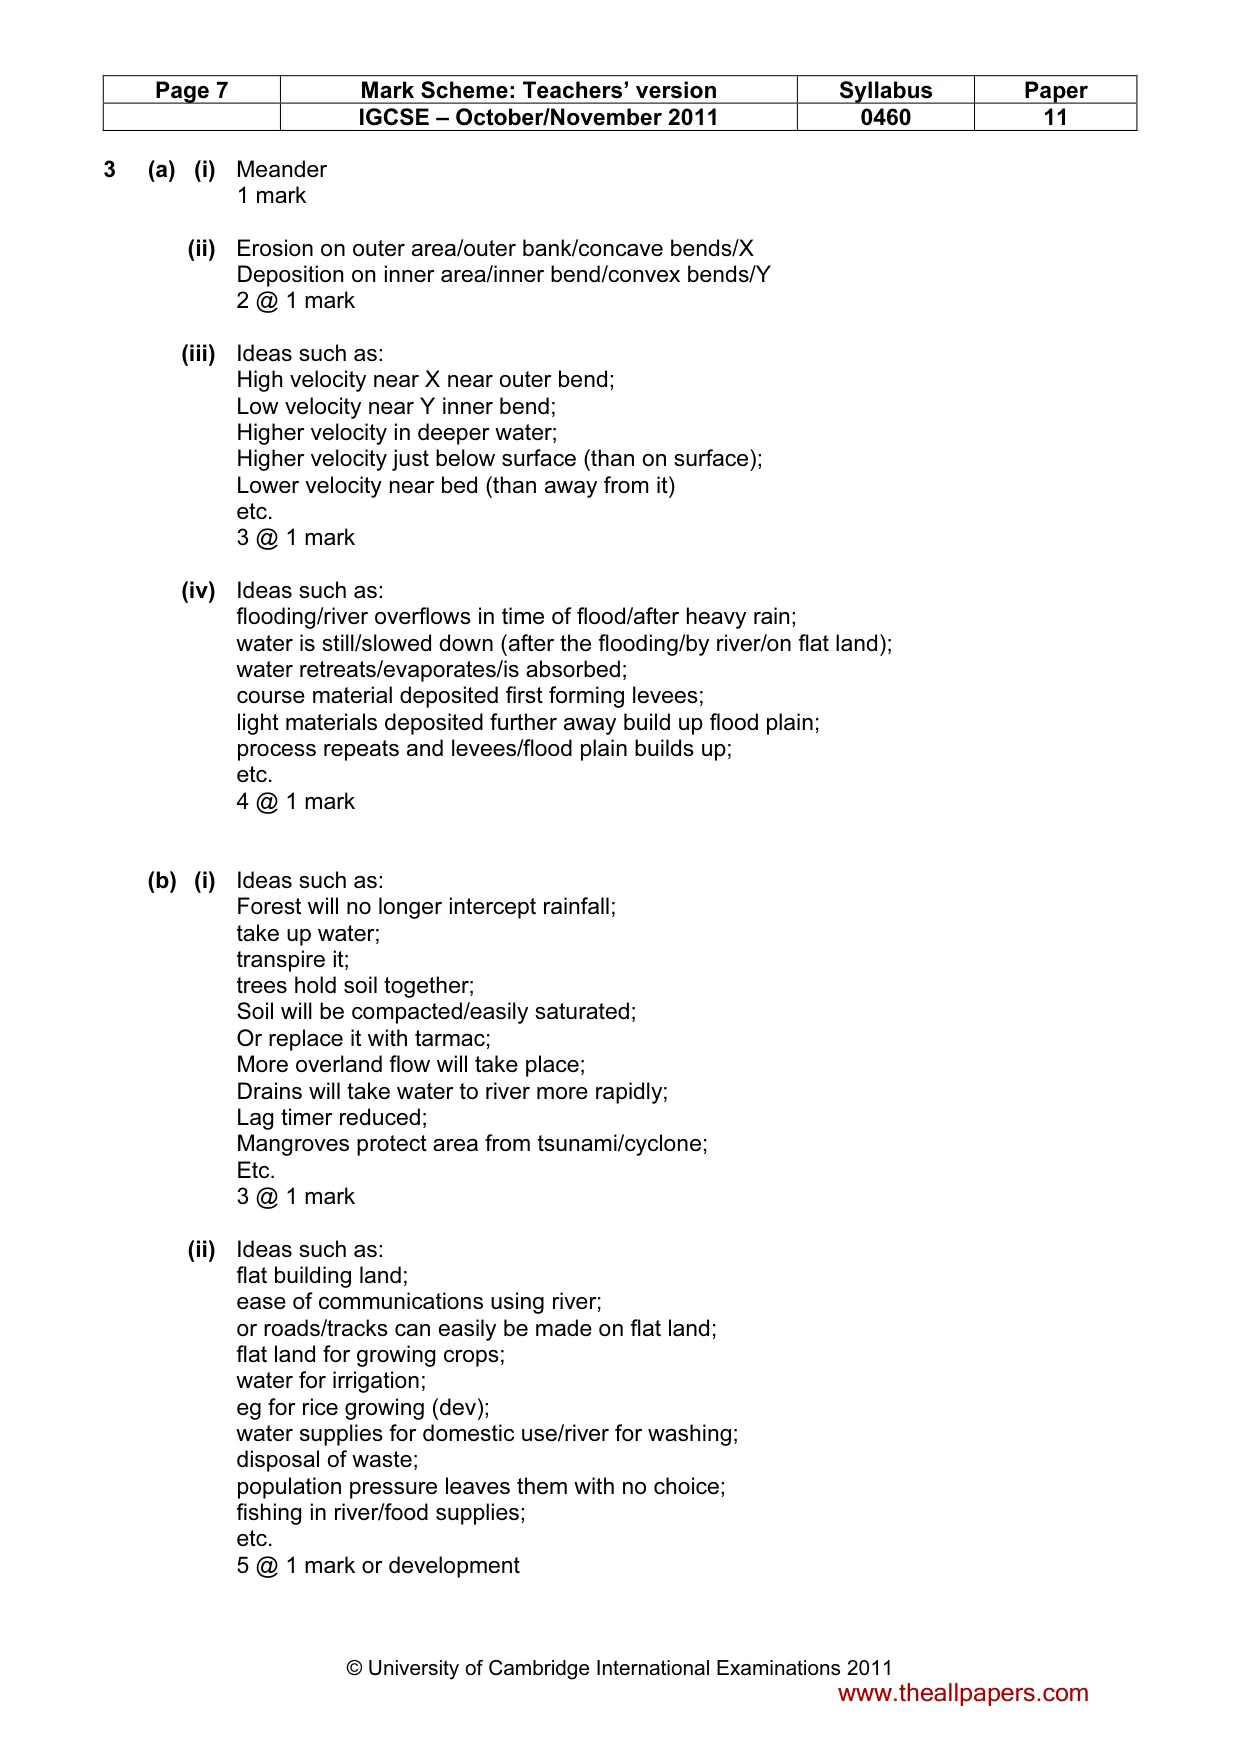
Page 7 Mark Scheme: Teachers’ version Syllabus Paper IGCSE – October/November 2011 0460 11 © University of Cambridge International Examinations 2011 3 (a) (i) Meander 1 mark (ii) Erosion on outer area/outer bank/concave bends/X Deposition on inner area/inner bend/convex bends/Y 2 @ 1 mark (iii) Ideas such as: High velocity near X near outer bend; Low velocity near Y inner bend; Higher velocity in deeper water; Higher velocity just below surface (than on surface); Lower velocity near bed (than away from it) etc. 3 @ 1 mark (iv) Ideas such as: flooding/river overflows in time of flood/after heavy rain; water is still/slowed down (after the flooding/by river/on flat land); water retreats/evaporates/is absorbed; course material deposited first forming levees; light materials deposited further away build up flood plain; process repeats and levees/flood plain builds up; etc. 4 @ 1 mark (b) (i) Ideas such as: Forest will no longer intercept rainfall; take up water; transpire it; trees hold soil together; Soil will be compacted/easily saturated; Or replace it with tarmac; More overland flow will take place; Drains will take water to river more rapidly; Lag timer reduced; Mangroves protect area from tsunami/cyclone; Etc. 3 @ 1 mark (ii) Ideas such as: flat building land; ease of communications using river; or roads/tracks can easily be made on flat land; flat land for growing crops; water for irrigation; eg for rice growing (dev); water supplies for domestic use/river for washing; disposal of waste; population pressure leaves them with no choice; fishing in river/food supplies; etc. 5 @ 1 mark or development www.theallpapers.com
Mark scheme, page 8
Page 8 Mark Scheme: Teachers’ version Syllabus Paper IGCSE – October/November 2011 0460 11 © University of Cambridge International Examinations 2011 (c) Levels marking Level 1 (1–3 marks) Statements including limited detail describing what has been done to reduce flooding. Names the method of protection. (e.g. build higher banks, plant trees in drainage basin, build dams/reservoirs along course of river, straighten river etc.) Level 2 (4–6 marks) Uses named example More developed statements describing the method of protection/what has been done to reduce flooding. (e.g. build higher banks so the river will have a greater capacity, raise banks especially in areas where river flows at a higher level than flood plain, plant trees so flow will not be so flashy/so less water will get to river as more evapo-transpiration occurs; build dams to regulate flow of water, straighten river so water is removed from drainage basin more quickly etc.) NB MAX 5 marks if no named example Level 3 (7 marks) Uses named example (e.g. River Mississippi). Comprehensive and accurate statements including some place specific reference. (e.g. built high levees so the river will have a greater capacity, raised banks protecting cities like Memphis where river flows at a higher level than flood plain, planting trees in Tennessee Valley so flow will not be so flashy/so less water will get to river as more evapotranspiration occurs; much straightening of river/meanders cut off between New Orleans and Memphis etc.) (7) [Total: 25] www.theallpapers.com
Mark scheme, page 9
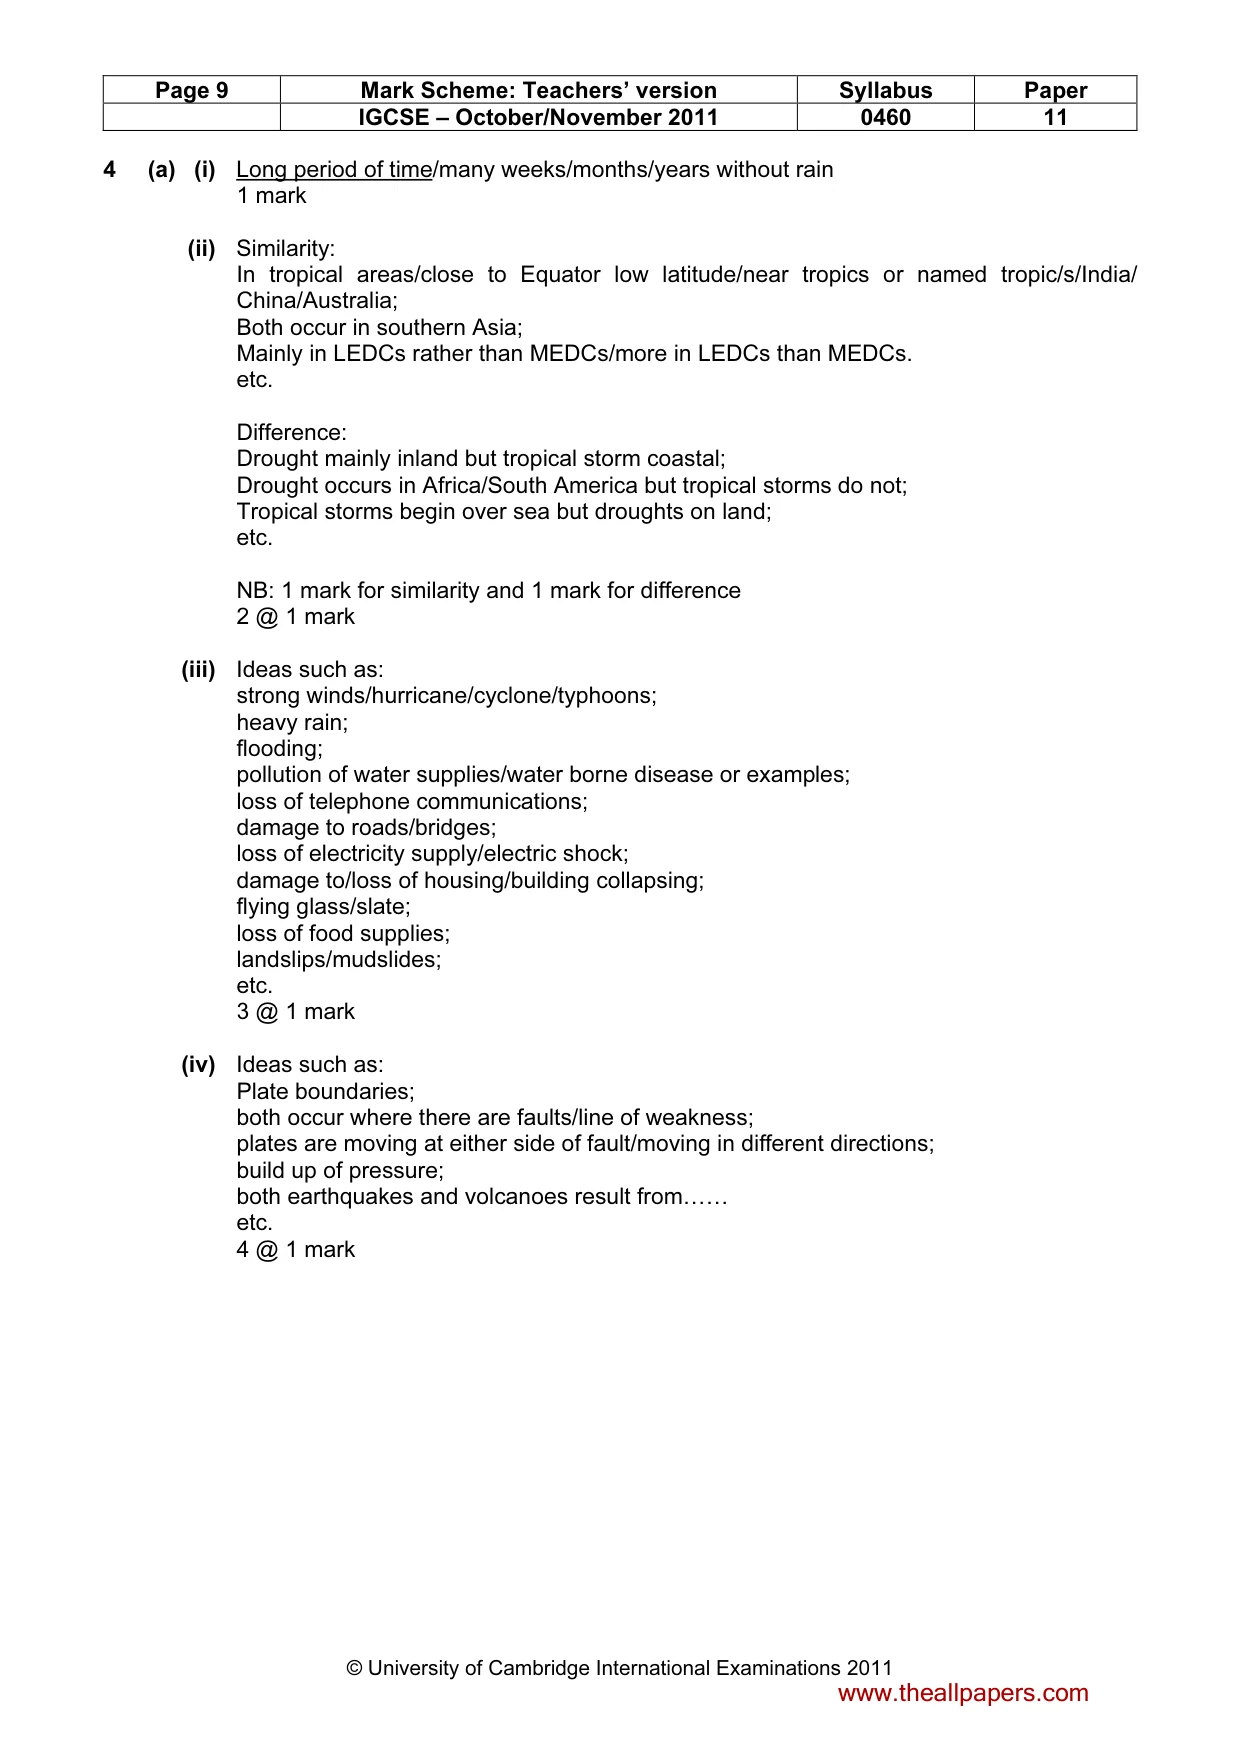
Page 9 Mark Scheme: Teachers’ version Syllabus Paper IGCSE – October/November 2011 0460 11 © University of Cambridge International Examinations 2011 4 (a) (i) Long period of time/many weeks/months/years without rain 1 mark (ii) Similarity: In tropical areas/close to Equator low latitude/near tropics or named tropic/s/India/ China/Australia; Both occur in southern Asia; Mainly in LEDCs rather than MEDCs/more in LEDCs than MEDCs. etc. Difference: Drought mainly inland but tropical storm coastal; Drought occurs in Africa/South America but tropical storms do not; Tropical storms begin over sea but droughts on land; etc. NB: 1 mark for similarity and 1 mark for difference 2 @ 1 mark (iii) Ideas such as: strong winds/hurricane/cyclone/typhoons; heavy rain; flooding; pollution of water supplies/water borne disease or examples; loss of telephone communications; damage to roads/bridges; loss of electricity supply/electric shock; damage to/loss of housing/building collapsing; flying glass/slate; loss of food supplies; landslips/mudslides; etc. 3 @ 1 mark (iv) Ideas such as: Plate boundaries; both occur where there are faults/line of weakness; plates are moving at either side of fault/moving in different directions; build up of pressure; both earthquakes and volcanoes result from…… etc. 4 @ 1 mark www.theallpapers.com
Mark scheme, page 10
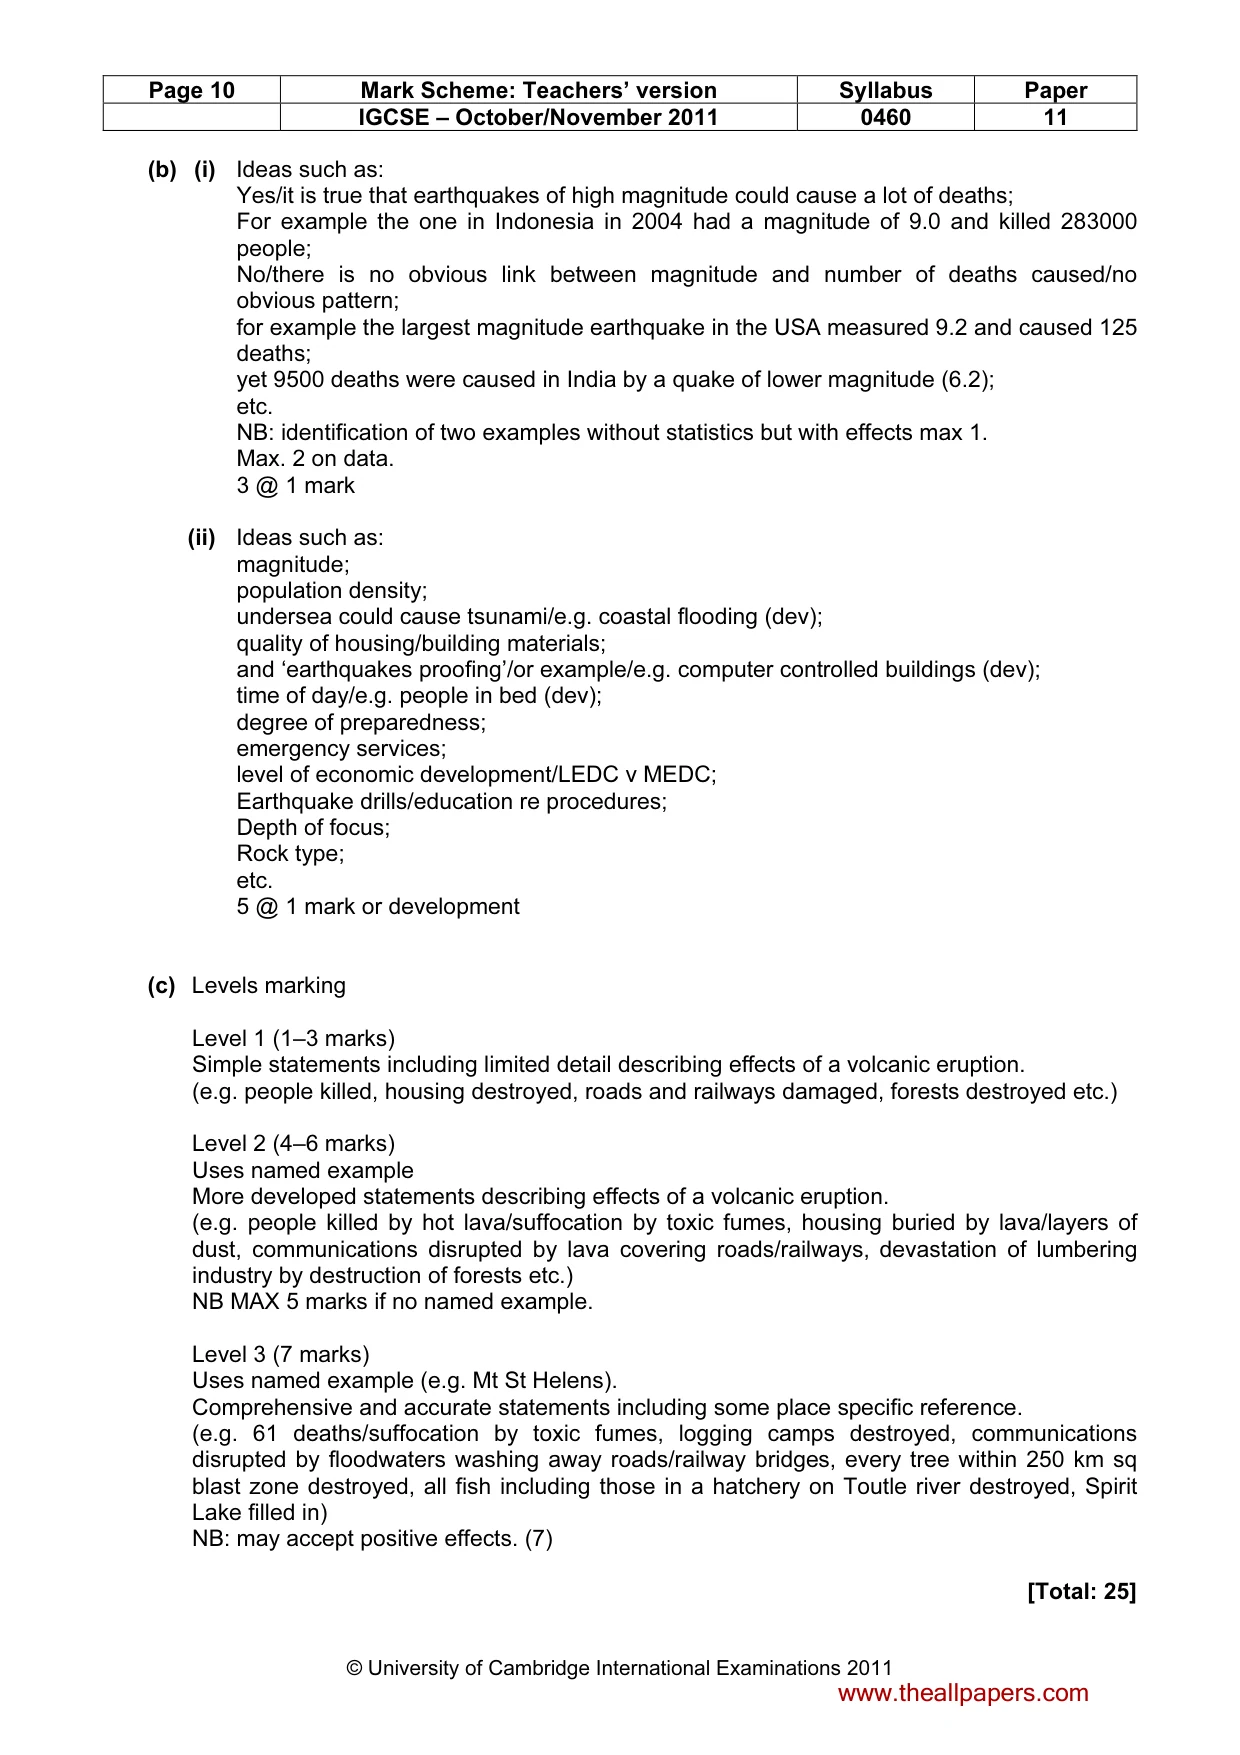
Page 10 Mark Scheme: Teachers’ version Syllabus Paper IGCSE – October/November 2011 0460 11 © University of Cambridge International Examinations 2011 (b) (i) Ideas such as: Yes/it is true that earthquakes of high magnitude could cause a lot of deaths; For example the one in Indonesia in 2004 had a magnitude of 9.0 and killed 283000 people; No/there is no obvious link between magnitude and number of deaths caused/no obvious pattern; for example the largest magnitude earthquake in the USA measured 9.2 and caused 125 deaths; yet 9500 deaths were caused in India by a quake of lower magnitude (6.2); etc. NB: identification of two examples without statistics but with effects max 1. Max. 2 on data. 3 @ 1 mark (ii) Ideas such as: magnitude; population density; undersea could cause tsunami/e.g. coastal flooding (dev); quality of housing/building materials; and ‘earthquakes proofing’/or example/e.g. computer controlled buildings (dev); time of day/e.g. people in bed (dev); degree of preparedness; emergency services; level of economic development/LEDC v MEDC; Earthquake drills/education re procedures; Depth of focus; Rock type; etc. 5 @ 1 mark or development (c) Levels marking Level 1 (1–3 marks) Simple statements including limited detail describing effects of a volcanic eruption. (e.g. people killed, housing destroyed, roads and railways damaged, forests destroyed etc.) Level 2 (4–6 marks) Uses named example More developed statements describing effects of a volcanic eruption. (e.g. people killed by hot lava/suffocation by toxic fumes, housing buried by lava/layers of dust, communications disrupted by lava covering roads/railways, devastation of lumbering industry by destruction of forests etc.) NB MAX 5 marks if no named example. Level 3 (7 marks) Uses named example (e.g. Mt St Helens). Comprehensive and accurate statements including some place specific reference. (e.g. 61 deaths/suffocation by toxic fumes, logging camps destroyed, communications disrupted by floodwaters washing away roads/railway bridges, every tree within 250 km sq blast zone destroyed, all fish including those in a hatchery on Toutle river destroyed, Spirit Lake filled in) NB: may accept positive effects. (7) [Total: 25] www.theallpapers.com
Mark scheme, page 11
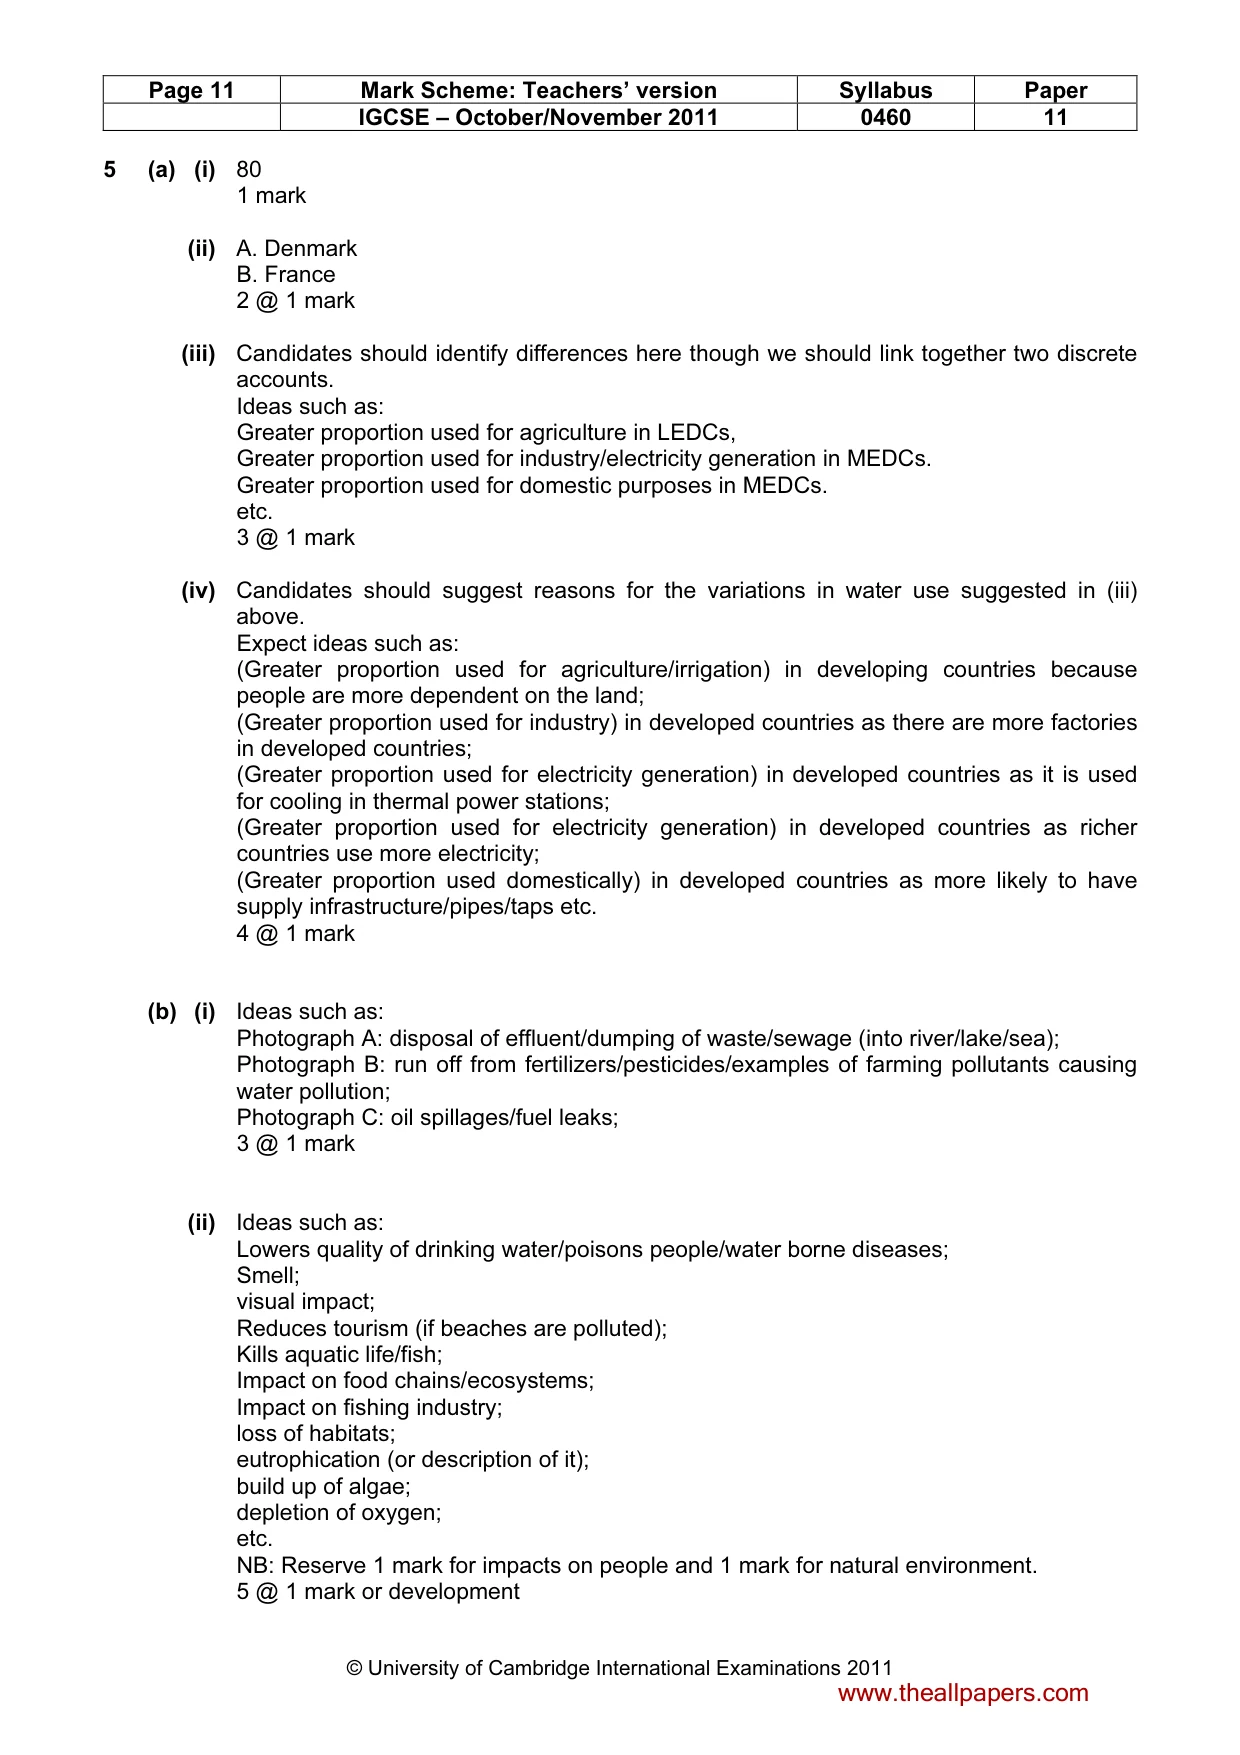
Page 11 Mark Scheme: Teachers’ version Syllabus Paper IGCSE – October/November 2011 0460 11 © University of Cambridge International Examinations 2011 5 (a) (i) 80 1 mark (ii) A. Denmark B. France 2 @ 1 mark (iii) Candidates should identify differences here though we should link together two discrete accounts. Ideas such as: Greater proportion used for agriculture in LEDCs, Greater proportion used for industry/electricity generation in MEDCs. Greater proportion used for domestic purposes in MEDCs. etc. 3 @ 1 mark (iv) Candidates should suggest reasons for the variations in water use suggested in (iii) above. Expect ideas such as: (Greater proportion used for agriculture/irrigation) in developing countries because people are more dependent on the land; (Greater proportion used for industry) in developed countries as there are more factories in developed countries; (Greater proportion used for electricity generation) in developed countries as it is used for cooling in thermal power stations; (Greater proportion used for electricity generation) in developed countries as richer countries use more electricity; (Greater proportion used domestically) in developed countries as more likely to have supply infrastructure/pipes/taps etc. 4 @ 1 mark (b) (i) Ideas such as: Photograph A: disposal of effluent/dumping of waste/sewage (into river/lake/sea); Photograph B: run off from fertilizers/pesticides/examples of farming pollutants causing water pollution; Photograph C: oil spillages/fuel leaks; 3 @ 1 mark (ii) Ideas such as: Lowers quality of drinking water/poisons people/water borne diseases; Smell; visual impact; Reduces tourism (if beaches are polluted); Kills aquatic life/fish; Impact on food chains/ecosystems; Impact on fishing industry; loss of habitats; eutrophication (or description of it); build up of algae; depletion of oxygen; etc. NB: Reserve 1 mark for impacts on people and 1 mark for natural environment. 5 @ 1 mark or development www.theallpapers.com
Mark scheme, page 12
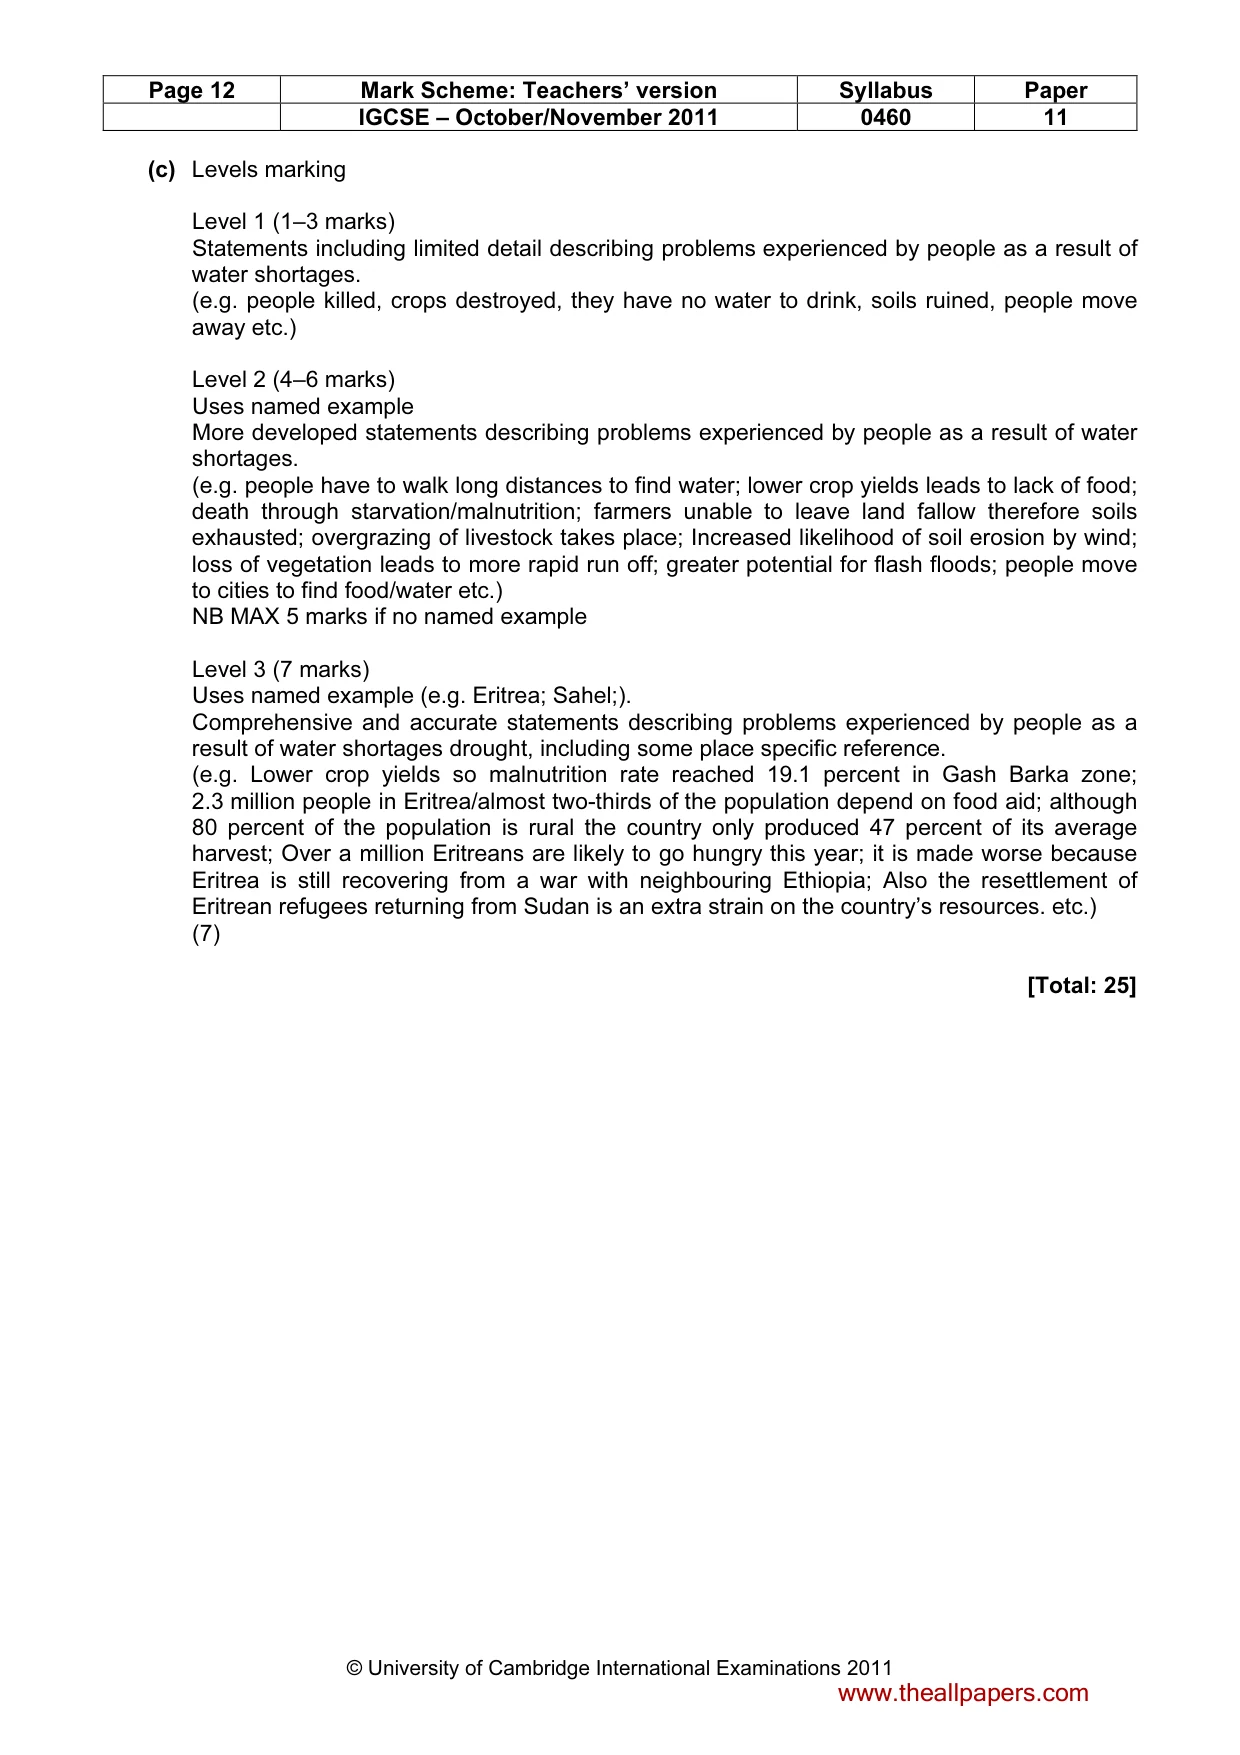
Page 12 Mark Scheme: Teachers’ version Syllabus Paper IGCSE – October/November 2011 0460 11 © University of Cambridge International Examinations 2011 (c) Levels marking Level 1 (1–3 marks) Statements including limited detail describing problems experienced by people as a result of water shortages. (e.g. people killed, crops destroyed, they have no water to drink, soils ruined, people move away etc.) Level 2 (4–6 marks) Uses named example More developed statements describing problems experienced by people as a result of water shortages. (e.g. people have to walk long distances to find water; lower crop yields leads to lack of food; death through starvation/malnutrition; farmers unable to leave land fallow therefore soils exhausted; overgrazing of livestock takes place; Increased likelihood of soil erosion by wind; loss of vegetation leads to more rapid run off; greater potential for flash floods; people move to cities to find food/water etc.) NB MAX 5 marks if no named example Level 3 (7 marks) Uses named example (e.g. Eritrea; Sahel;). Comprehensive and accurate statements describing problems experienced by people as a result of water shortages drought, including some place specific reference. (e.g. Lower crop yields so malnutrition rate reached 19.1 percent in Gash Barka zone; 2.3 million people in Eritrea/almost two-thirds of the population depend on food aid; although 80 percent of the population is rural the country only produced 47 percent of its average harvest; Over a million Eritreans are likely to go hungry this year; it is made worse because Eritrea is still recovering from a war with neighbouring Ethiopia; Also the resettlement of Eritrean refugees returning from Sudan is an extra strain on the country’s resources. etc.) (7) [Total: 25] www.theallpapers.com
Mark scheme, page 13
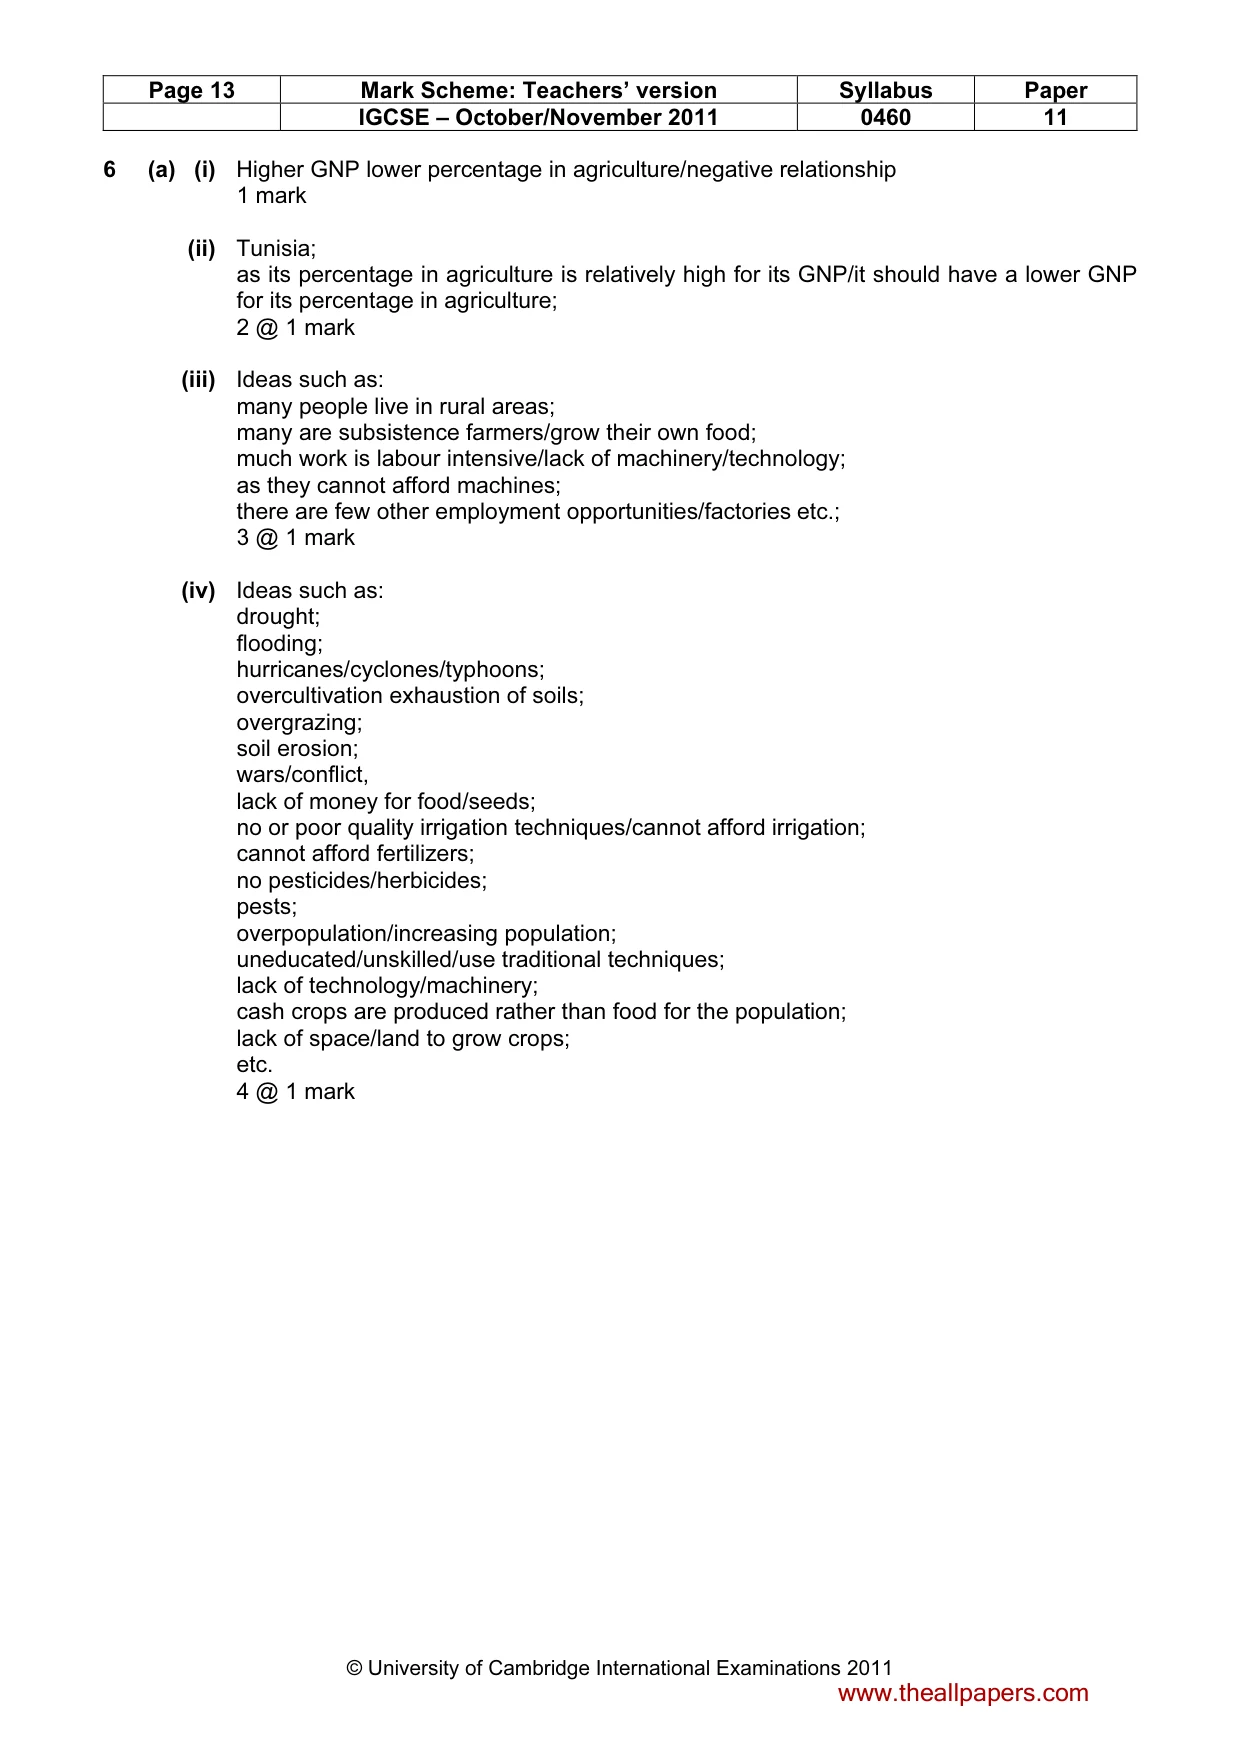
Page 13 Mark Scheme: Teachers’ version Syllabus Paper IGCSE – October/November 2011 0460 11 © University of Cambridge International Examinations 2011 6 (a) (i) Higher GNP lower percentage in agriculture/negative relationship 1 mark (ii) Tunisia; as its percentage in agriculture is relatively high for its GNP/it should have a lower GNP for its percentage in agriculture; 2 @ 1 mark (iii) Ideas such as: many people live in rural areas; many are subsistence farmers/grow their own food; much work is labour intensive/lack of machinery/technology; as they cannot afford machines; there are few other employment opportunities/factories etc.; 3 @ 1 mark (iv) Ideas such as: drought; flooding; hurricanes/cyclones/typhoons; overcultivation exhaustion of soils; overgrazing; soil erosion; wars/conflict, lack of money for food/seeds; no or poor quality irrigation techniques/cannot afford irrigation; cannot afford fertilizers; no pesticides/herbicides; pests; overpopulation/increasing population; uneducated/unskilled/use traditional techniques; lack of technology/machinery; cash crops are produced rather than food for the population; lack of space/land to grow crops; etc. 4 @ 1 mark www.theallpapers.com
Mark scheme, page 14
Page 14 Mark Scheme: Teachers’ version Syllabus Paper IGCSE – October/November 2011 0460 11 © University of Cambridge International Examinations 2011 (b) (i) Ideas such as: more use of oil in France; more use of coal in France; wood used in Kenya but not in France; gas used in France but not Kenya; main fuel in France is oil but in Kenya it is wood; etc. 3 @ 1 mark (ii) Candidates should suggest reasons for the importance of different methods of generating electricity in different countries. Expect ideas such as: Availability of reserves of fossil fuels/coal/oil/natural gas; Level of technology available; Government policy/attitude/towards the environment/e.g. nuclear power; Environmental conditions or examples e.g. opportunity to use solar power, HEP; etc. (to MAX 2) can’t afford to…/finance…/expense…; etc. 5 @ 1 mark or development (c) Levels marking Level 1 (1–3 marks) Statements including limited detail describing likely impacts of global warming on people and/or natural environment. (e.g. loss of species, flooding of lowland areas, climatic change, different crops can be grown, tourists put off, etc.) Level 2 (4–6 marks) (With reference to only one named area up to max 6 marks) More developed statements describing likely impacts of global warming on people and/or natural environment. (e.g. ice melts and therefore loss of species from cold environments, rise in sea level causes Hooding of coastal lowland areas, increased temperatures reduce snowfall in some areas threatening winter sports industries, crops such as vines can be grown in areas which were not previously hot or sunny enough etc.) Level 3 (7 marks) Comprehensive and accurate statements describing likely impacts of global warming on people and natural environment, including some references to named places – two or more. (e.g. Antarctic ice melts and therefore loss of species such as penguins, rise in sea level causes flooding of coastal lowland areas such as Fens/Bangladesh/Netherlands/Maldives, increased temperatures reduce snowfall in Alps threatening winter sports industries, crops such as vines can be grown in areas in Southern England which were not previously hot or sunny enough etc.) (7) [Total: 25] www.theallpapers.com
What you needed in this session
Cambridge’s own grade thresholds for 2011 Oct/Nov, Paper 1 · Variant 1. A higher threshold means an easier paper — the bar moves with how the cohort did.