Cambridge IGCSE Geography 0460 — 2011 Oct/Nov Paper 1 · Variant 3
0460/13/O/N/11 · 75 marks · ≈84 min
The question paper and its mark scheme, free to read here and free to download. This is Cambridge’s own paper, exactly as it was sat.
Question paper24 pages
Mark scheme14 pages
Answers below. Sit the paper first if you are practising.
Paper as text
Question paper, page 1
* 9 1 7 4 3 2 6 2 3 2 * This document consists of 23 printed pages, 1 lined page and 1 Insert. DC (CW/DJ) 34029/7 © UCLES 2011 [Turn over UNIVERSITY OF CAMBRIDGE INTERNATIONAL EXAMINATIONS International General Certificate of Secondary Education GEOGRAPHY 0460/13 Paper 1 October/November 2011 1 hour 45 minutes Candidates answer on the Question Paper. Additional Materials: Ruler READ THESE INSTRUCTIONS FIRST Write your Centre number, candidate number and name in the spaces provided. Write in dark blue or black pen. You may use a soft pencil for any diagrams, graphs or rough working. Do not use staples, paper clips, highlighters, glue or correction fluid. DO NOT WRITE ON ANY BARCODES. Write your answer to each question in the space provided. If additional space is required, you should use the lined page at the end of this booklet. The question number(s) must be clearly shown. Answer three questions. The Insert contains Fig. 4 for Question 2, Photographs A, B, C and D for Question 3 and Photograph E for Question 6. Sketch maps and diagrams should be drawn whenever they serve to illustrate an answer. The Insert is not required by the Examiner. The number of marks is given in brackets [ ] at the end of each question or part question. www.theallpapers.com
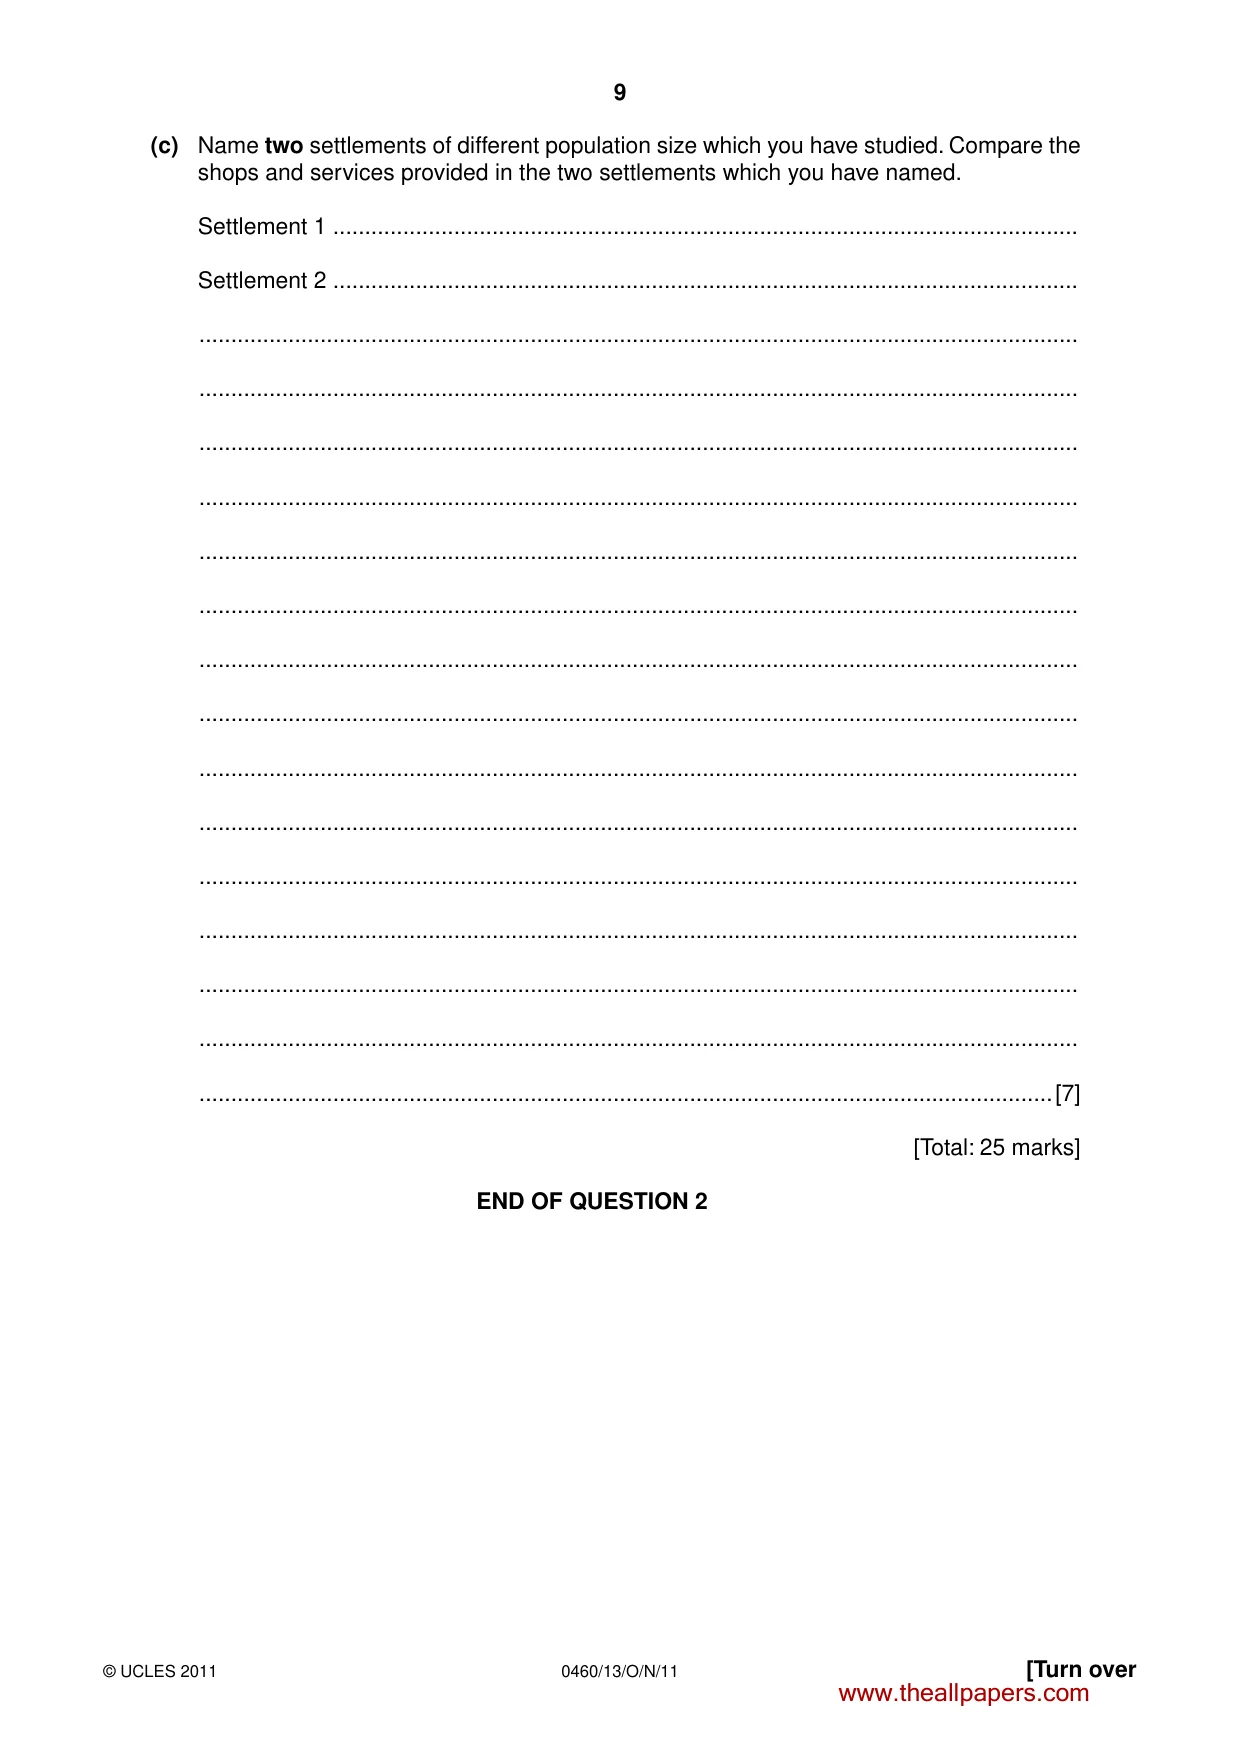
Question paper, page 2
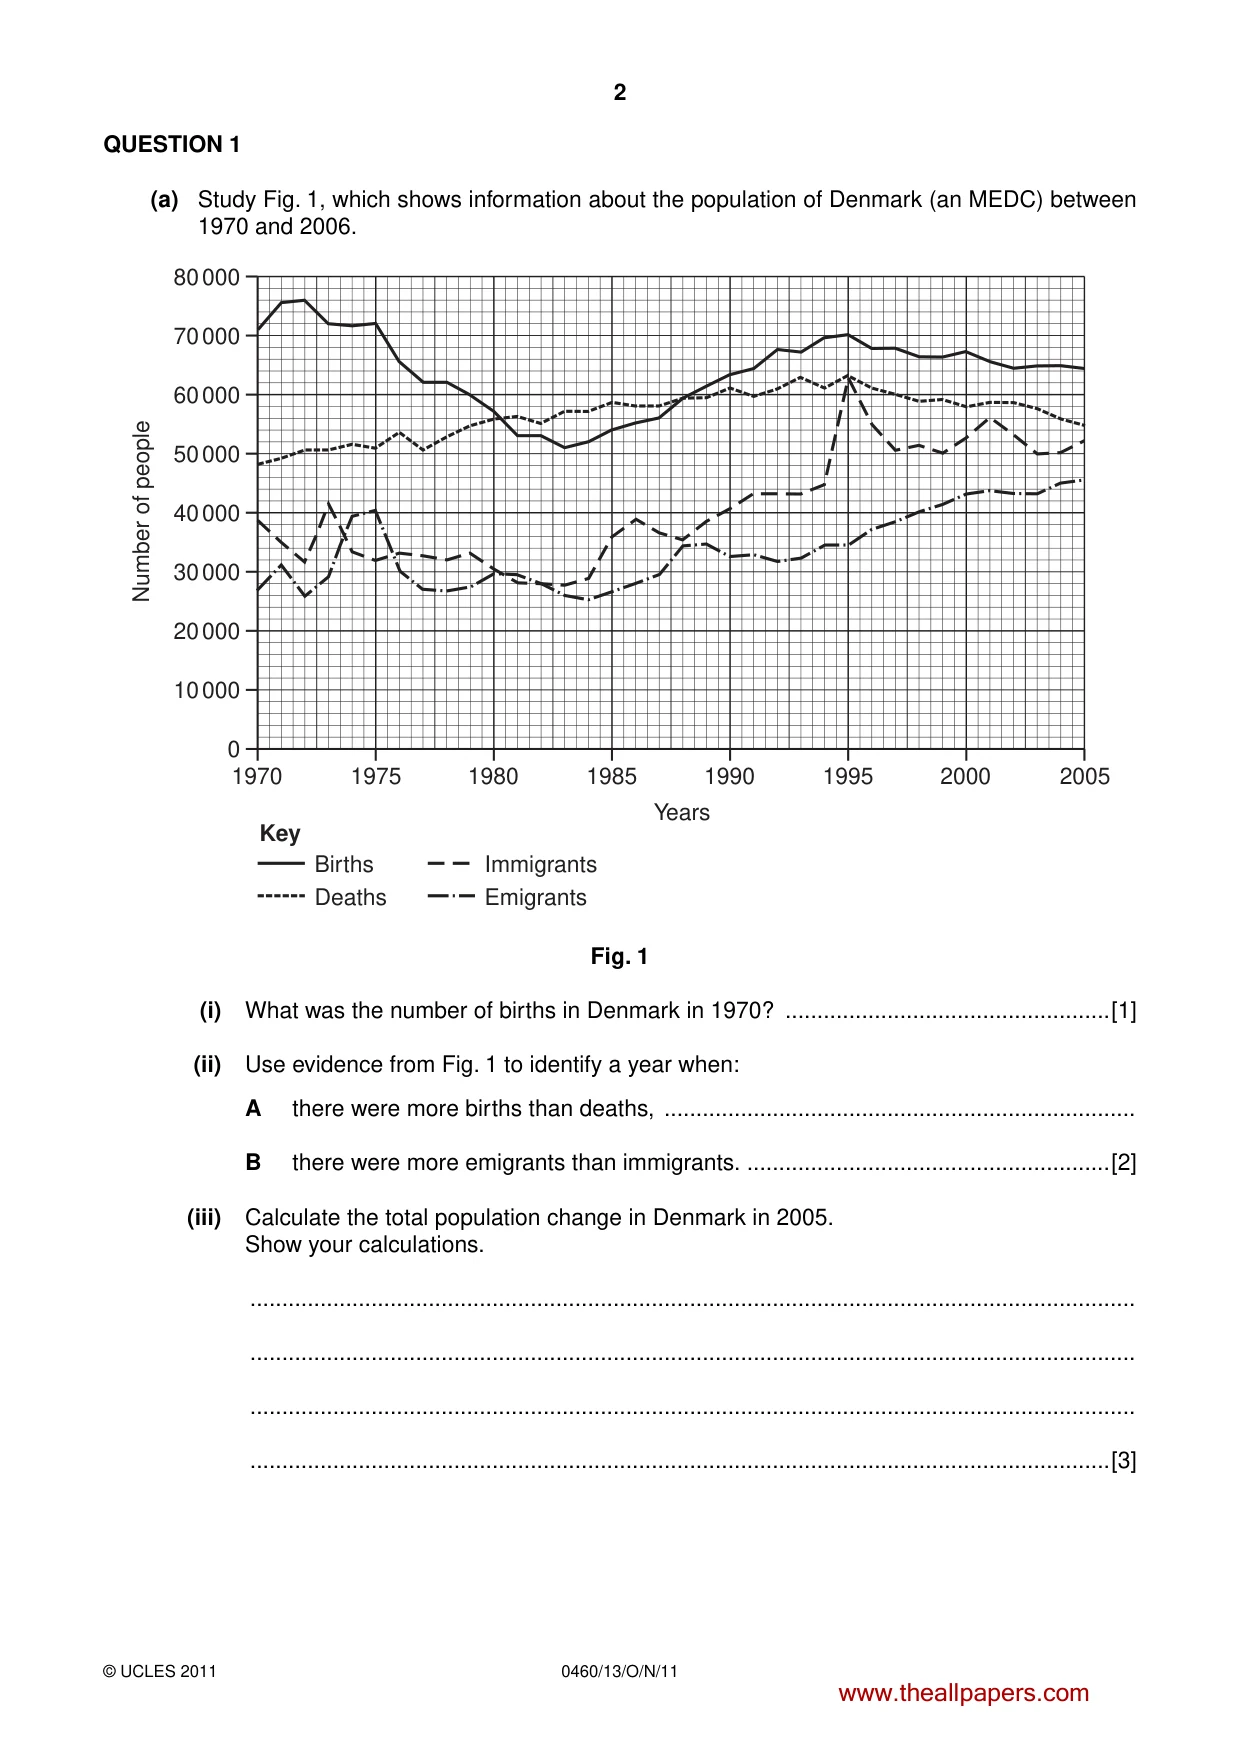
2 0460/13/O/N/11 © UCLES 2011 QUESTION 1 (a) Study Fig. 1, which shows information about the population of Denmark (an MEDC) between 1970 and 2006. 80 000 70 000 60 000 50 000 40 000 30 000 20 000 10 000 0 1970 1975 1985 1995 1980 Years Births Key 1990 2000 2005 Number of people Deaths Immigrants Emigrants Fig. 1 (i) What was the number of births in Denmark in 1970? …[1] (ii) Use evidence from Fig. 1 to identify a year when: A there were more births than deaths, … B there were more emigrants than immigrants. …[2] (iii) Calculate the total population change in Denmark in 2005. Show your calculations. … … … …[3] www.theallpapers.com
Question paper, page 3
3 0460/13/O/N/11 © UCLES 2011 [Turn over (iv) Describe the main trends in migration between 1970 and 2005. Use data from Fig. 1 in your answer. … … … … … … … … …[4] www.theallpapers.com
Question paper, page 4
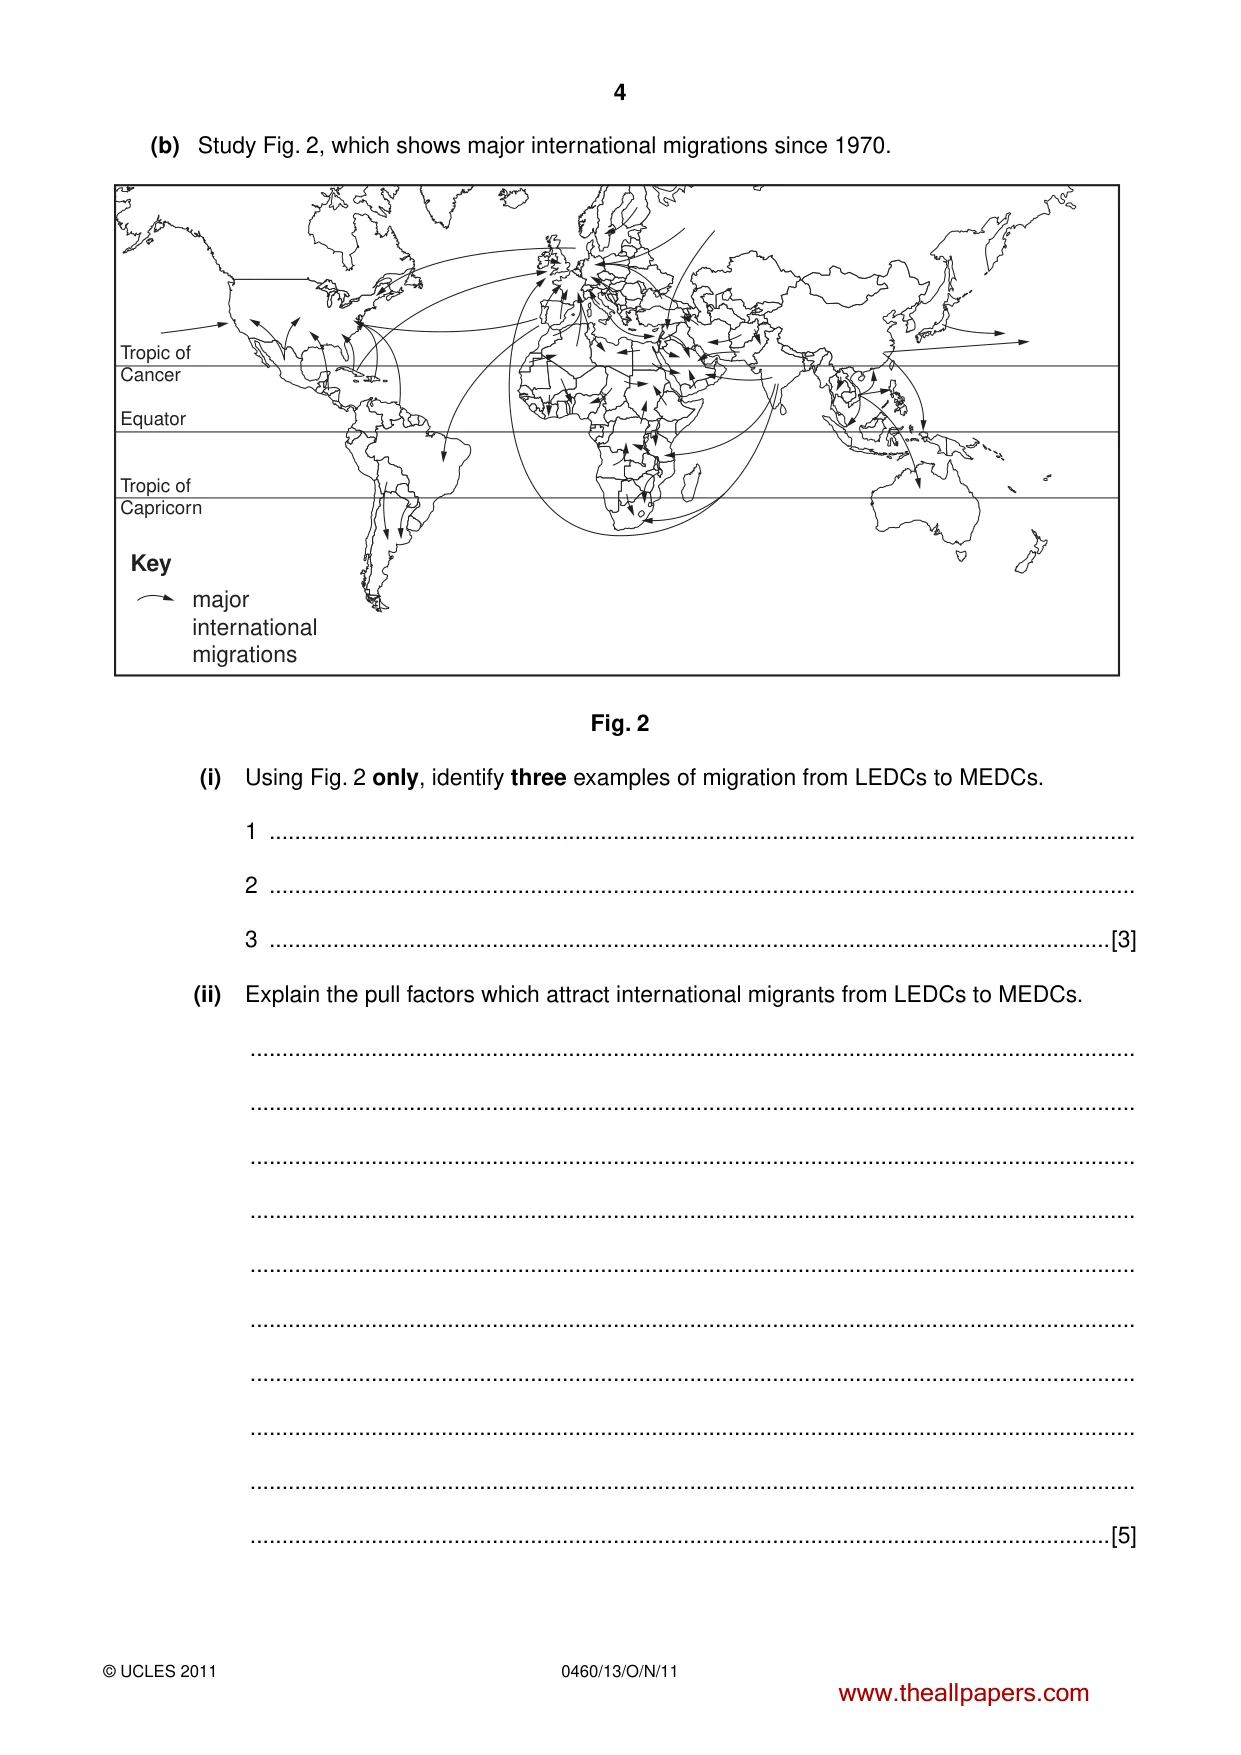
4 0460/13/O/N/11 © UCLES 2011 (b) Study Fig. 2, which shows major international migrations since 1970. Tropic of Cancer Tropic of Capricorn Equator Key major international migrations Fig. 2 (i) Using Fig. 2 only, identify three examples of migration from LEDCs to MEDCs. 1 … 2 … 3 …[3] (ii) Explain the pull factors which attract international migrants from LEDCs to MEDCs. … … … … … … … … … …[5] www.theallpapers.com
Question paper, page 5
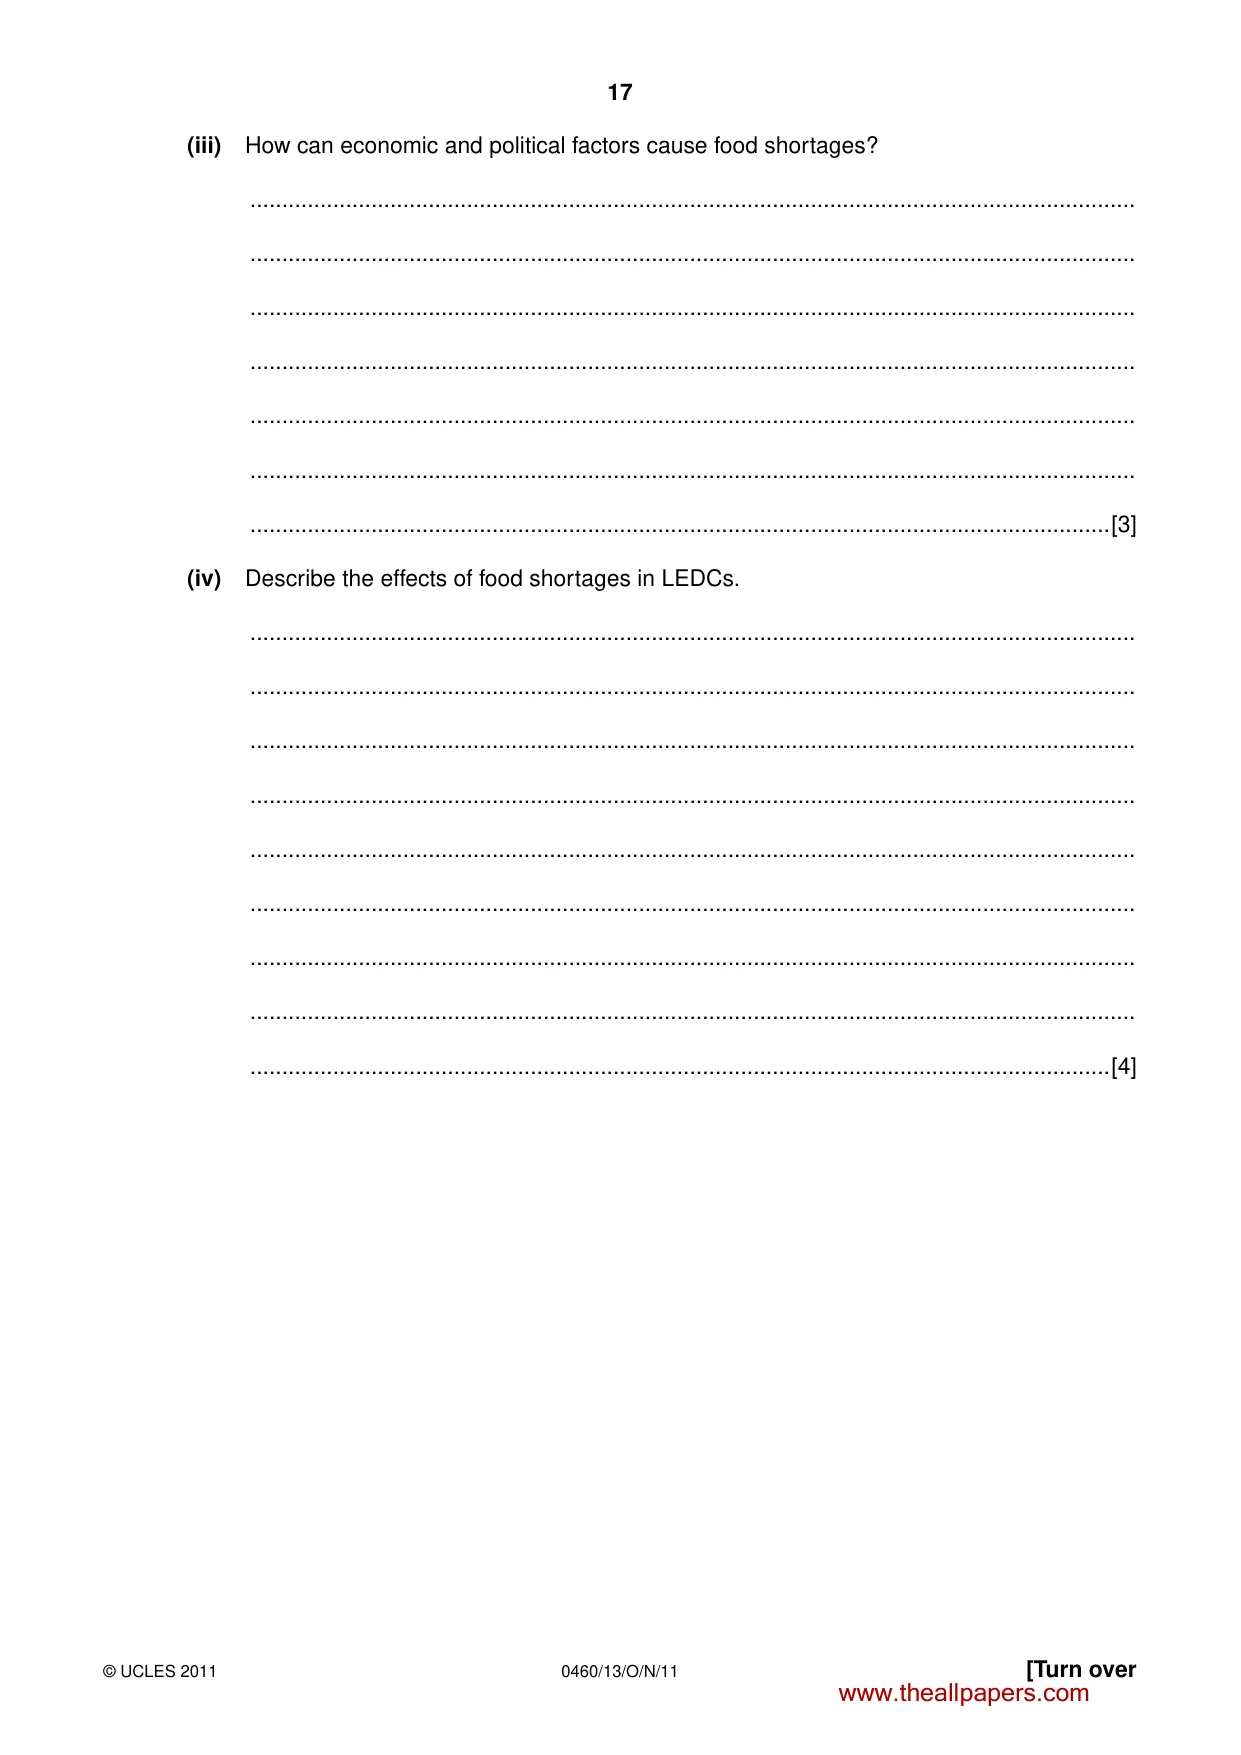
5 0460/13/O/N/11 © UCLES 2011 [Turn over (c) The size of the population in a country may change as a result of natural growth. For a named country which you have studied, explain why the rate of natural population growth is high. Name of country … … … … … … … … … … … … … … … …[7] [Total: 25 marks] END OF QUESTION 1 www.theallpapers.com
Question paper, page 6
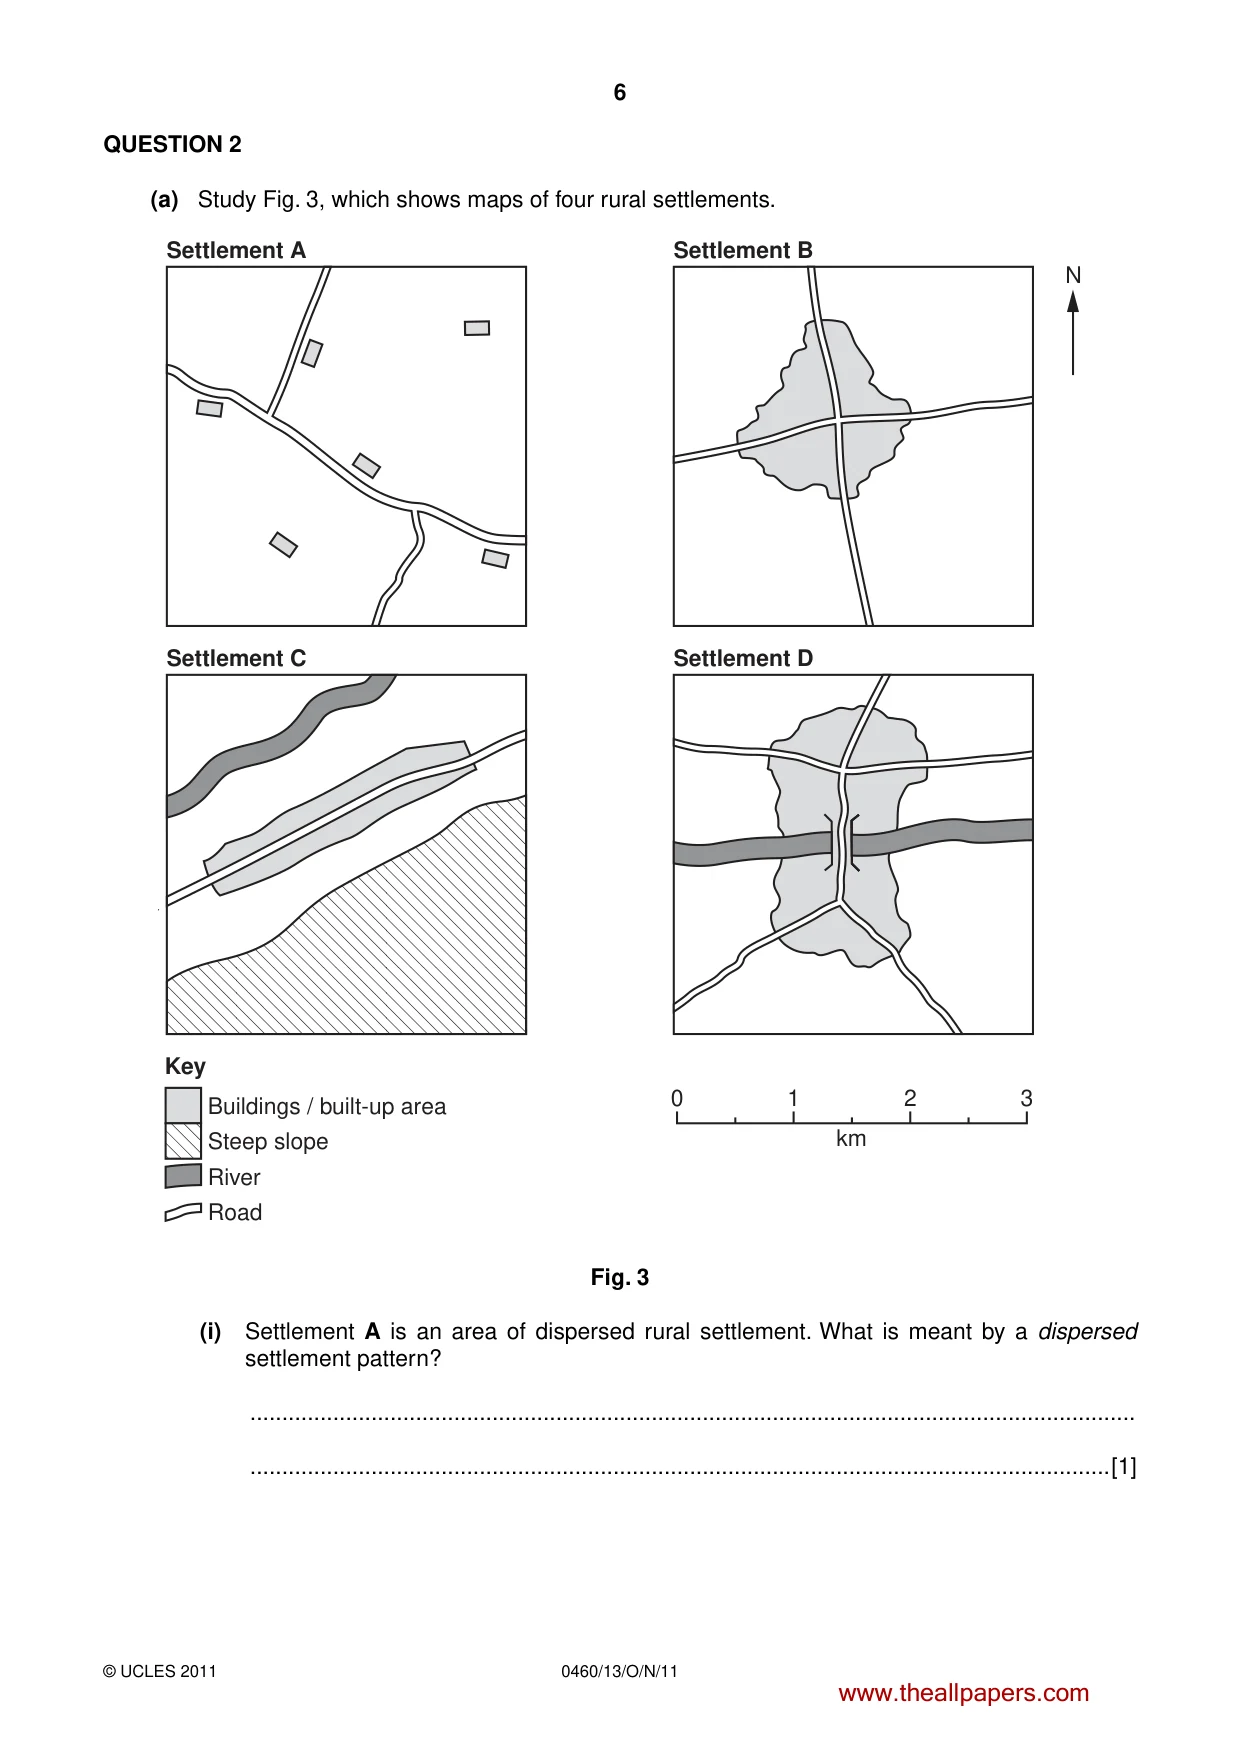
6 0460/13/O/N/11 © UCLES 2011 QUESTION 2 (a) Study Fig. 3, which shows maps of four rural settlements. Settlement A Settlement B N Settlement C Settlement D 0 1 km 2 3 Key Buildings / built-up area Steep slope Road River Fig. 3 (i) Settlement A is an area of dispersed rural settlement. What is meant by a dispersed settlement pattern? … …[1] www.theallpapers.com
Question paper, page 7
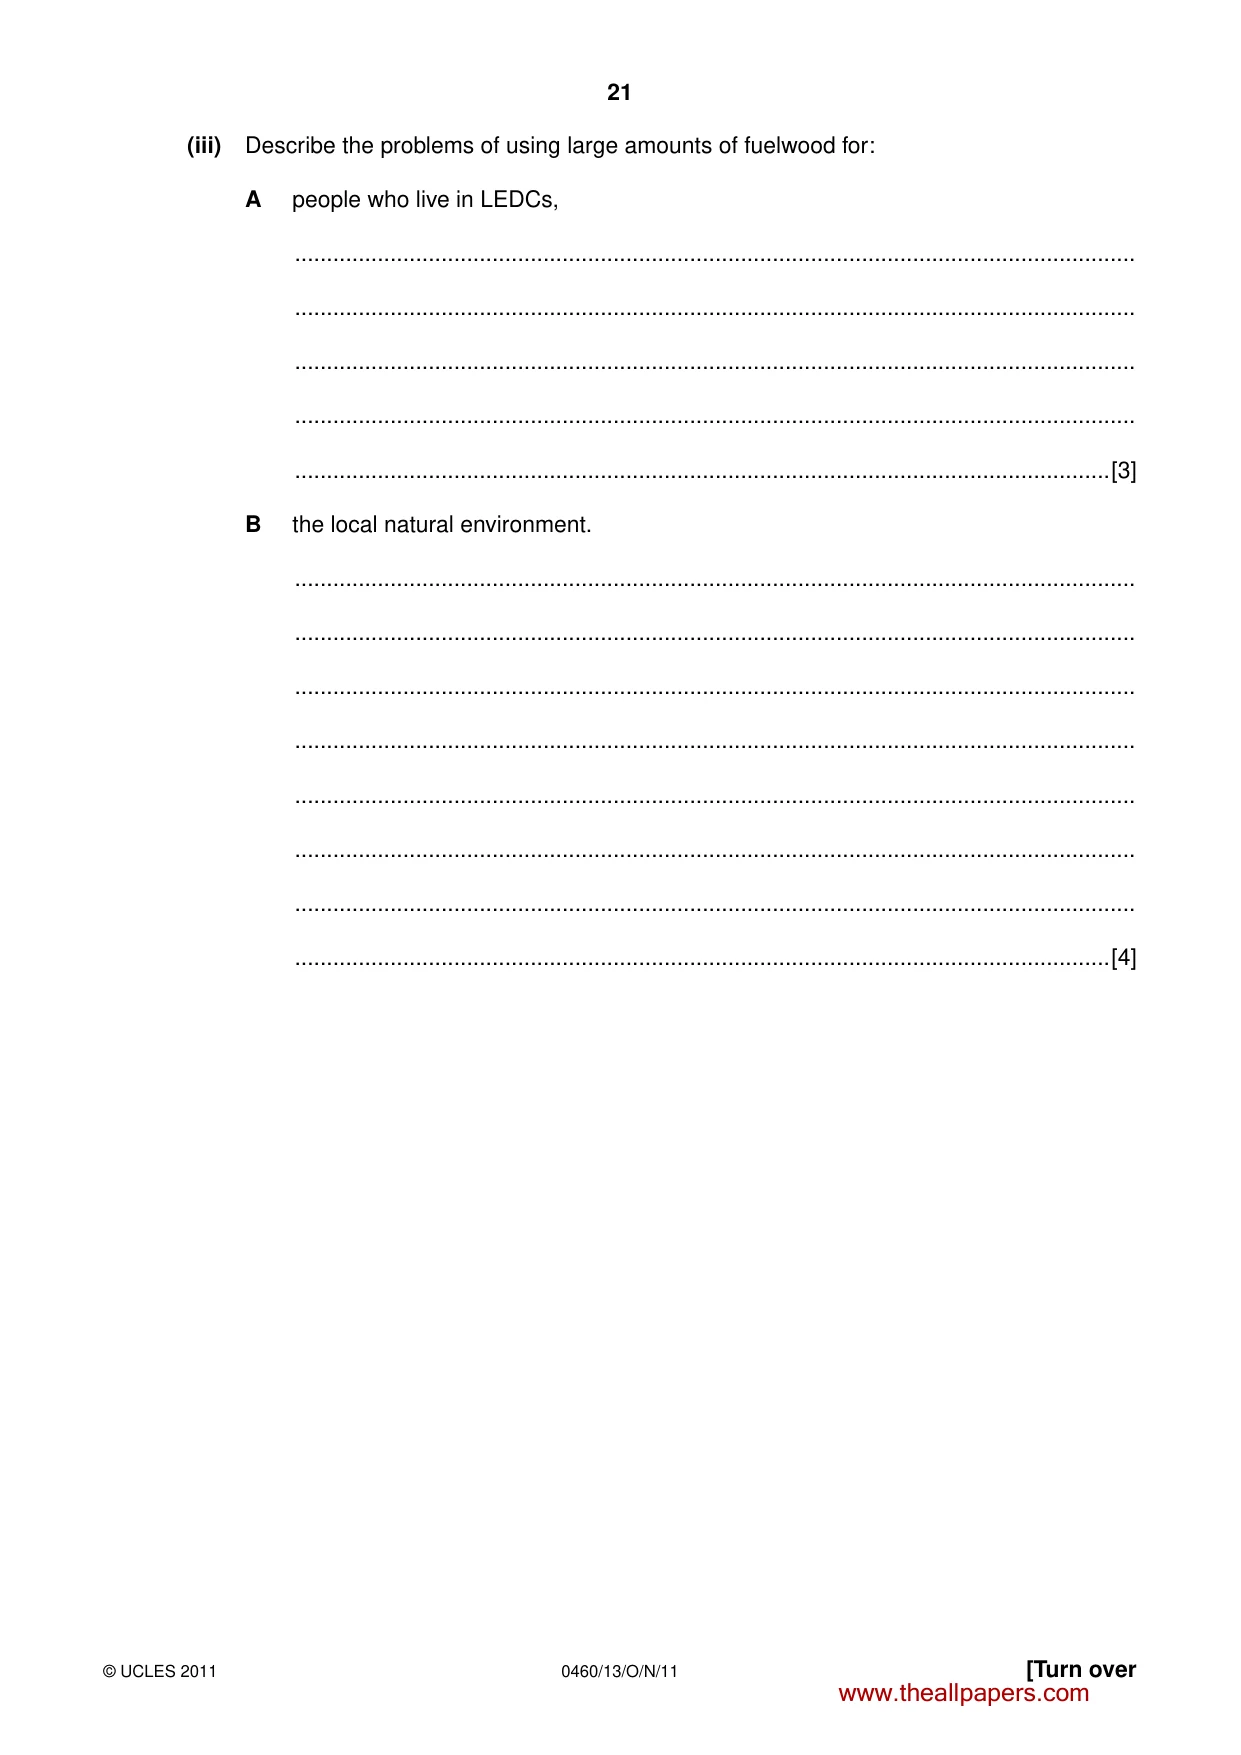
7 0460/13/O/N/11 © UCLES 2011 [Turn over (ii) Describe the shapes of settlements B and C. Settlement B … … Settlement C … …[2] (iii) Suggest reasons for the different shapes of settlements B and C. … … … … … … … …[3] (iv) Suggest reasons why settlement D has developed into a large settlement. … … … … … … … … …[4] www.theallpapers.com
Question paper, page 8
8 0460/13/O/N/11 © UCLES 2011 (b) Study Fig. 4 (Insert), which shows a rural area in Tanzania (an LEDC). (i) Describe three features of the distribution of rural settlement in the area shown by Fig. 4. 1 … … 2 … … 3 … …[3] (ii) Suggest reasons for the distribution of rural settlement in the area shown by Fig. 4. … … … … … … … … … …[5] www.theallpapers.com
Question paper, page 9
9 0460/13/O/N/11 © UCLES 2011 [Turn over (c) Name two settlements of different population size which you have studied. Compare the shops and services provided in the two settlements which you have named. Settlement 1 … Settlement 2 … … … … … … … … … … … … … … … …[7] [Total: 25 marks] END OF QUESTION 2 www.theallpapers.com
Question paper, page 10
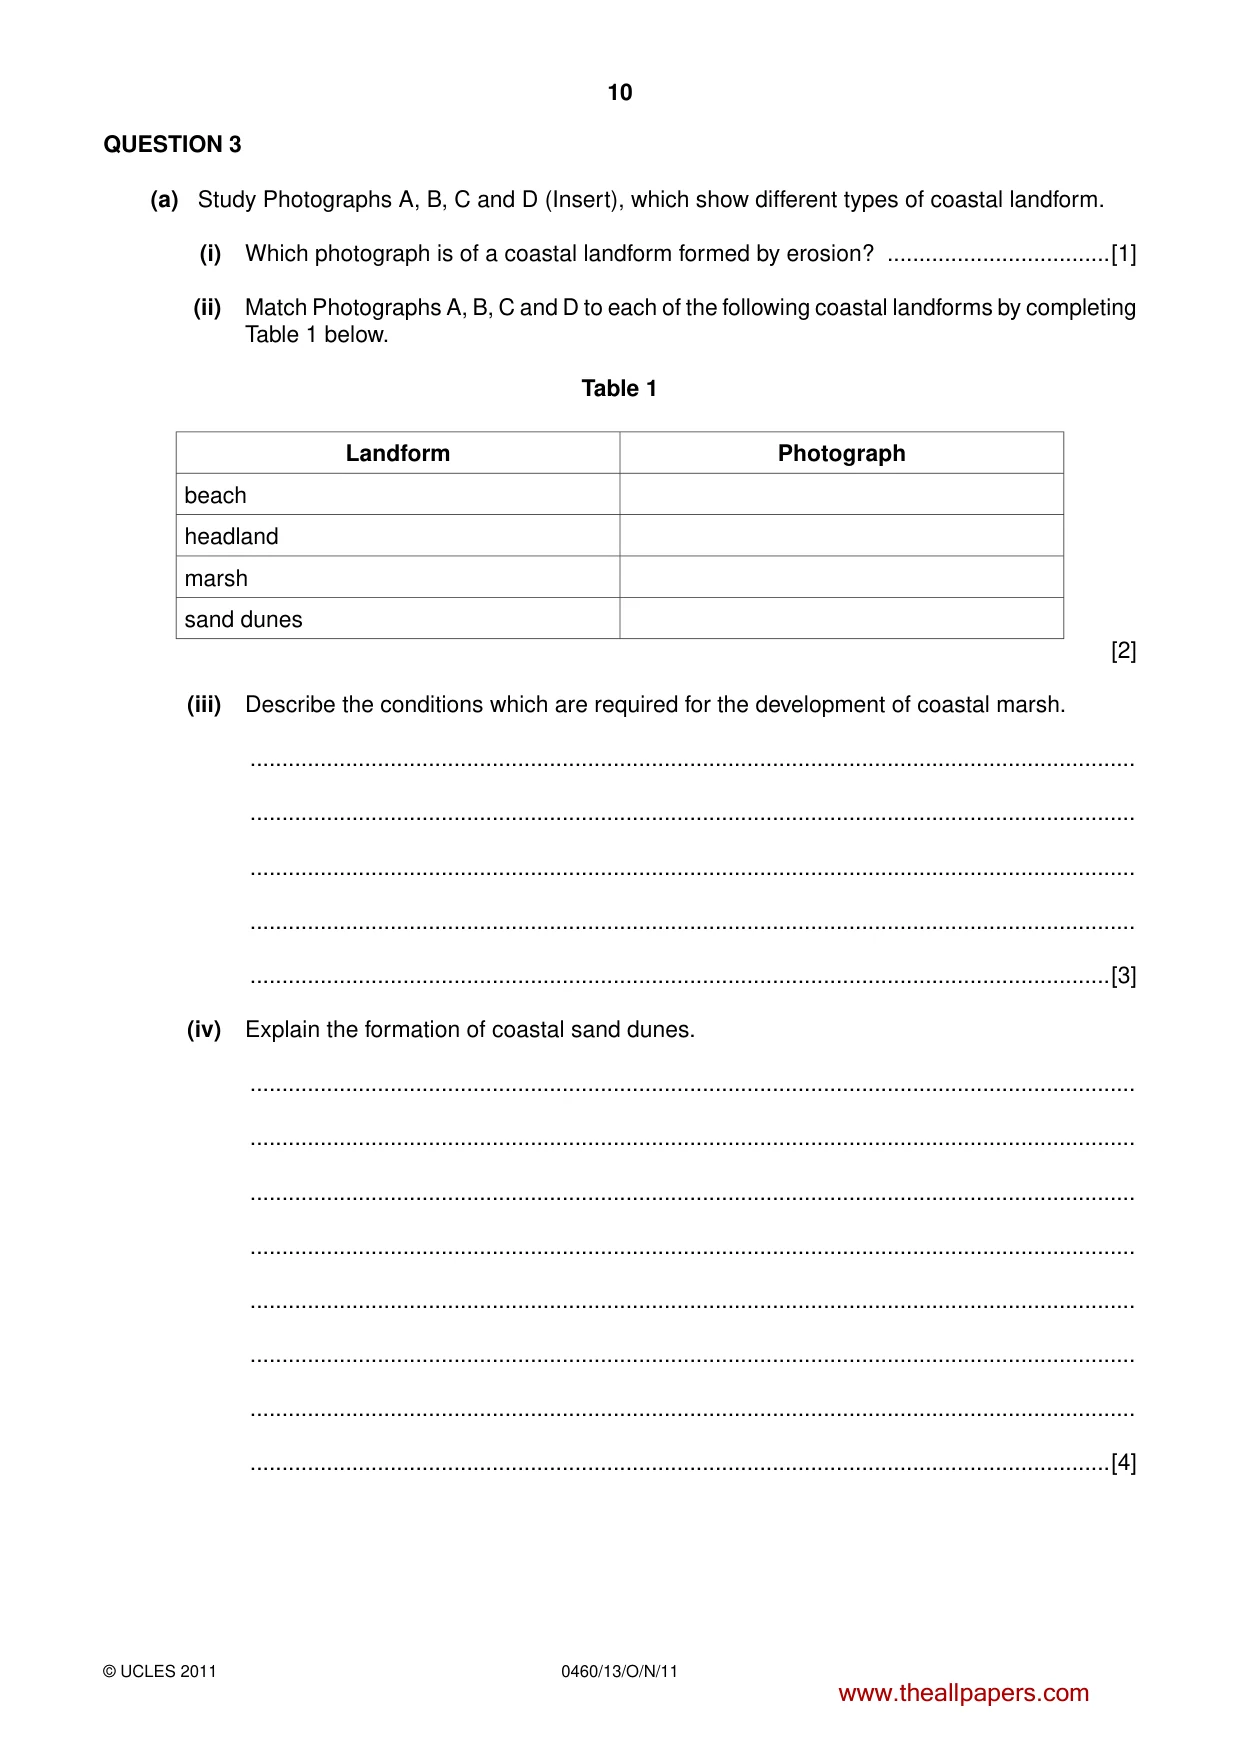
10 0460/13/O/N/11 © UCLES 2011 QUESTION 3 (a) Study Photographs A, B, C and D (Insert), which show different types of coastal landform. (i) Which photograph is of a coastal landform formed by erosion? …[1] (ii) Match Photographs A, B, C and D to each of the following coastal landforms by completing Table 1 below. Table 1 Landform Photograph beach headland marsh sand dunes [2] (iii) Describe the conditions which are required for the development of coastal marsh. … … … … …[3] (iv) Explain the formation of coastal sand dunes. … … … … … … … …[4] www.theallpapers.com
Question paper, page 11
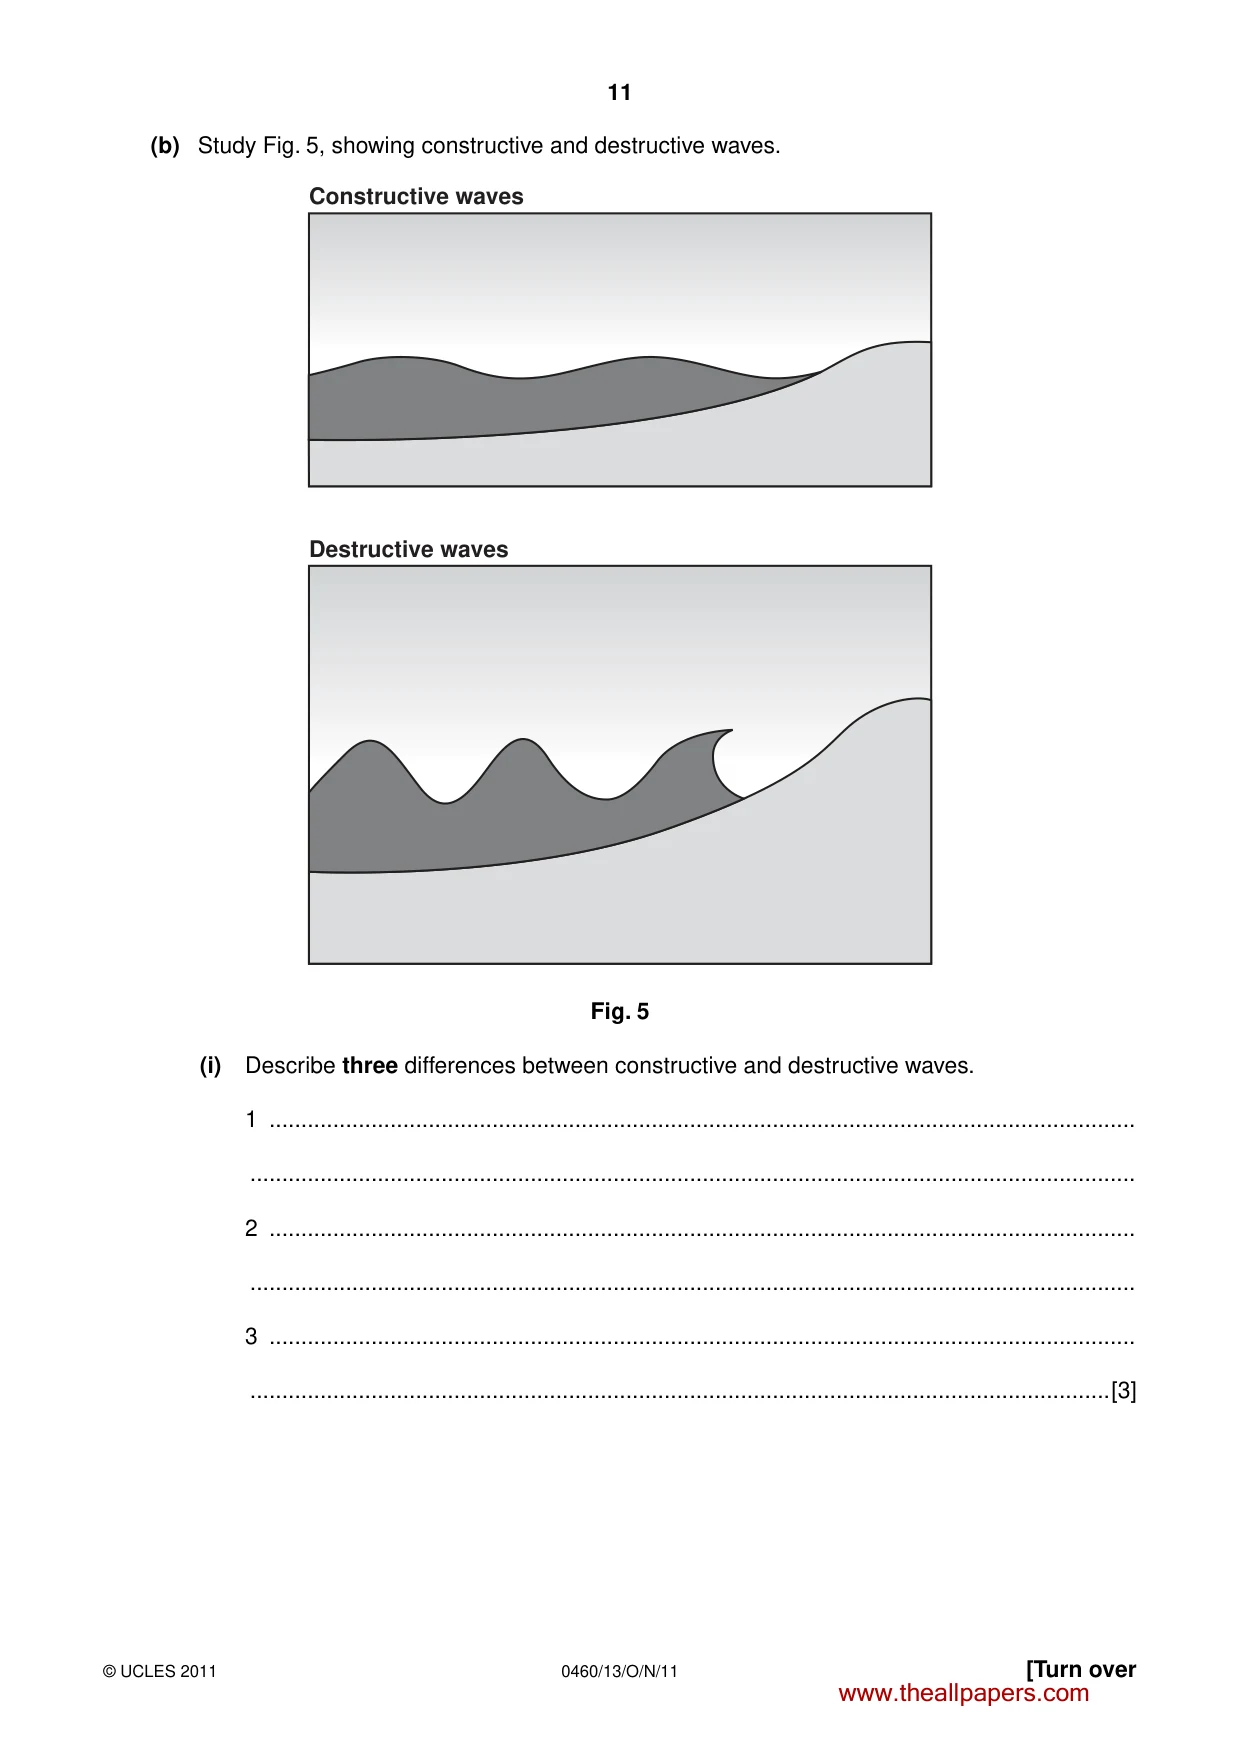
11 0460/13/O/N/11 © UCLES 2011 [Turn over (b) Study Fig. 5, showing constructive and destructive waves. Constructive waves Destructive waves Fig. 5 (i) Describe three differences between constructive and destructive waves. 1 … … 2 … … 3 … …[3] www.theallpapers.com
Question paper, page 12
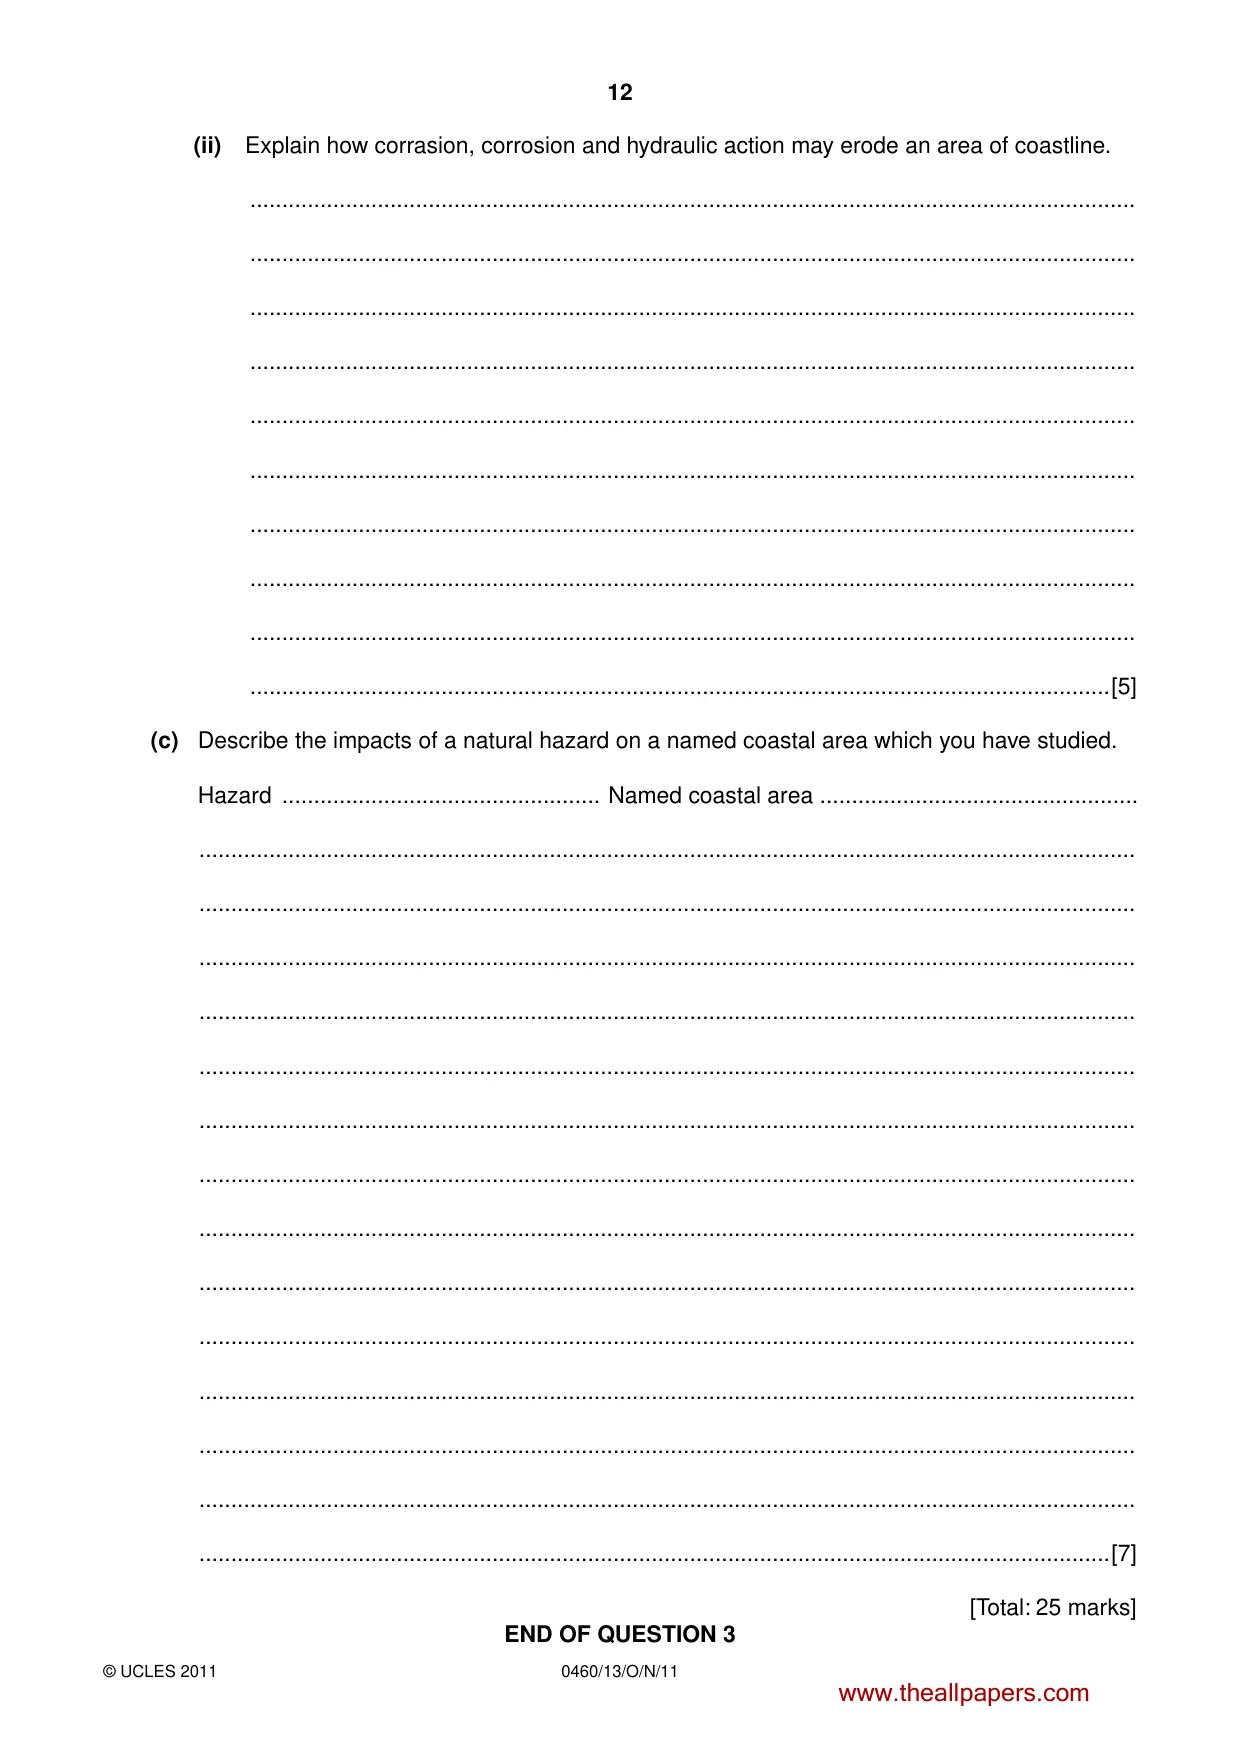
12 0460/13/O/N/11 © UCLES 2011 (ii) Explain how corrasion, corrosion and hydraulic action may erode an area of coastline. … … … … … … … … … …[5] (c) Describe the impacts of a natural hazard on a named coastal area which you have studied. Hazard … Named coastal area … … … … … … … … … … … … … … …[7] [Total: 25 marks] END OF QUESTION 3 www.theallpapers.com
Question paper, page 13
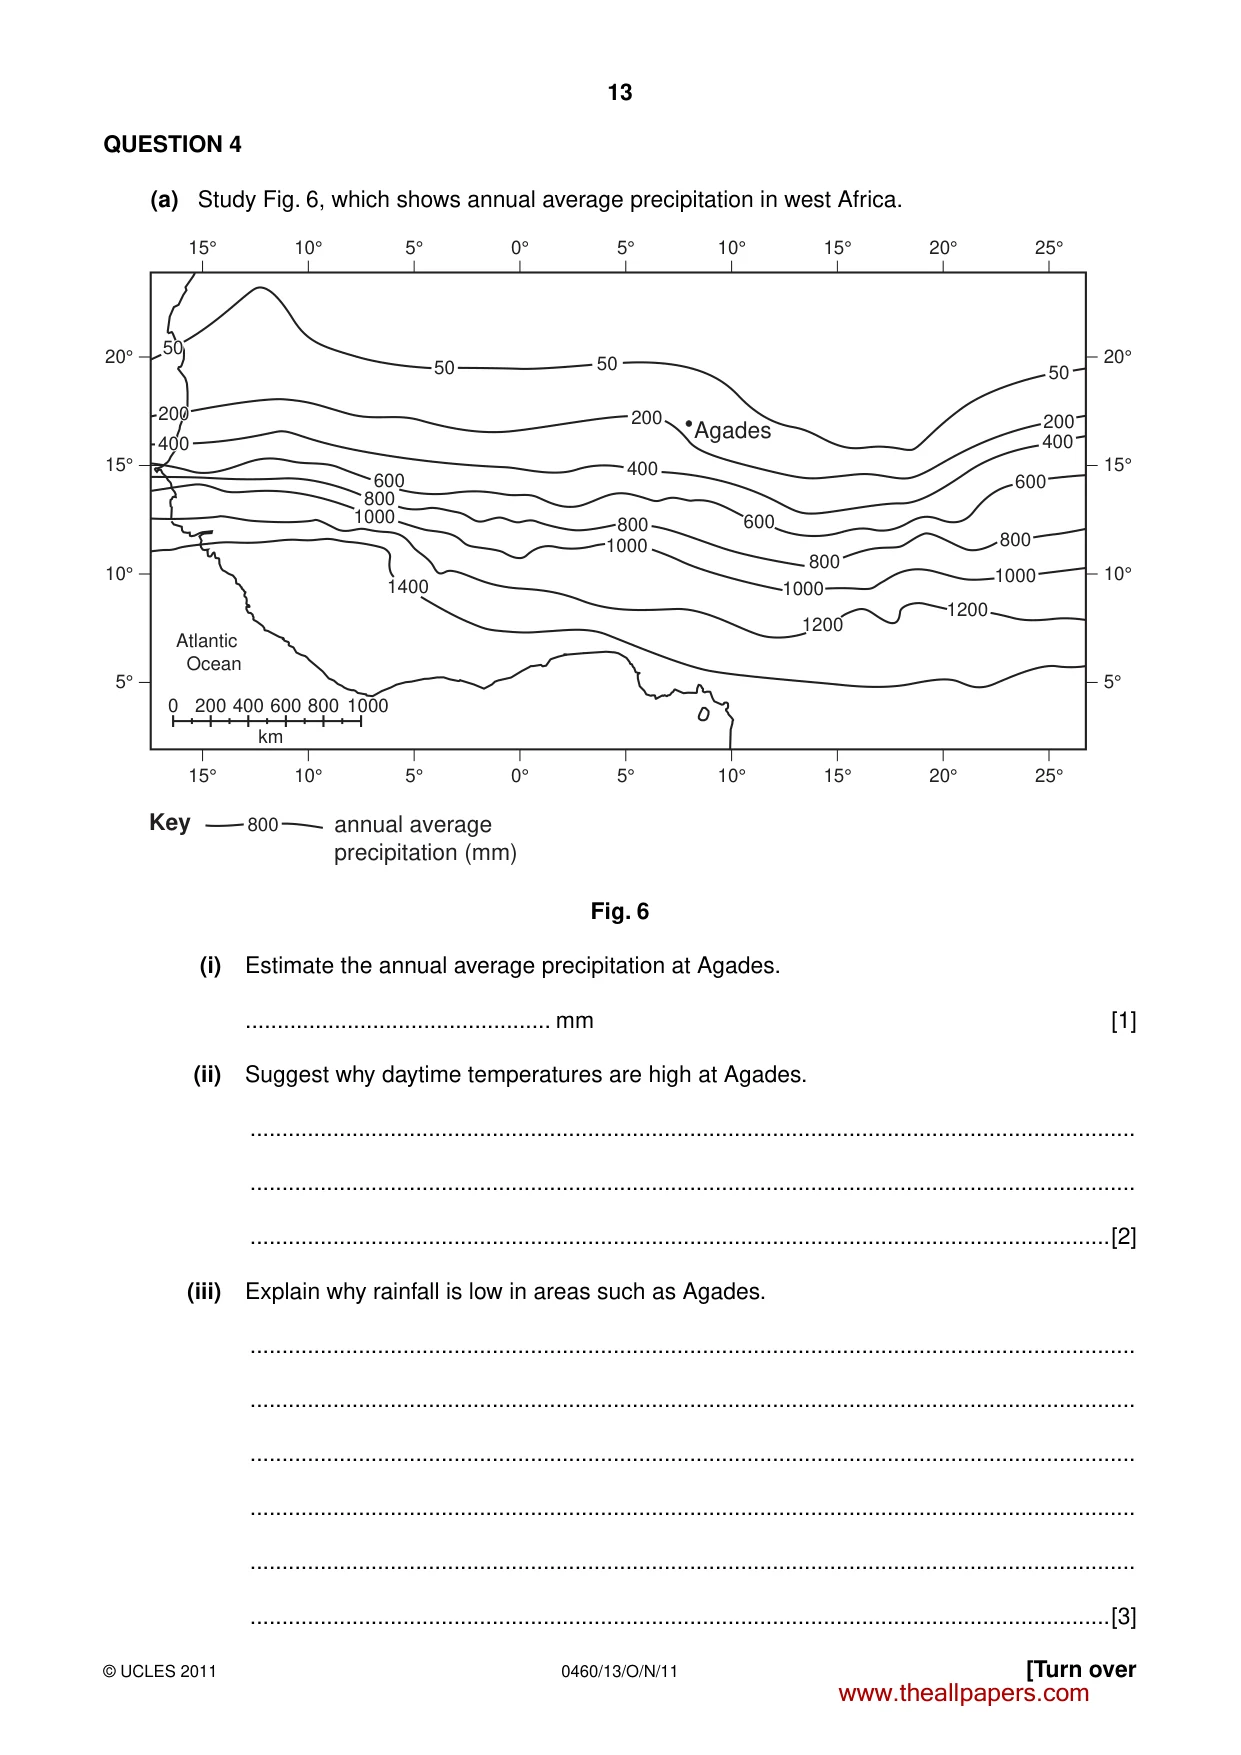
13 0460/13/O/N/11 © UCLES 2011 [Turn over QUESTION 4 (a) Study Fig. 6, which shows annual average precipitation in west Africa. Agades 50 50 50 50 200 200 400 400 600 600 800 800 800 1000 1000 1000 1200 1200 1400 Atlantic Ocean 5° 10° 15° 20° 5° 10° 15° 20° 15° 10° 5° 0° 5° 10° 15° 20° 25° 15° Key annual average precipitation (mm) 0 200 400 600 800 1000 km 10° 5° 0° 5° 10° 15° 20° 25° 1000 800 600 800 50 50 50 200 200 200 400 400 400 Fig. 6 (i) Estimate the annual average precipitation at Agades. … mm [1] (ii) Suggest why daytime temperatures are high at Agades. … … …[2] (iii) Explain why rainfall is low in areas such as Agades. … … … … … …[3] www.theallpapers.com
Question paper, page 14
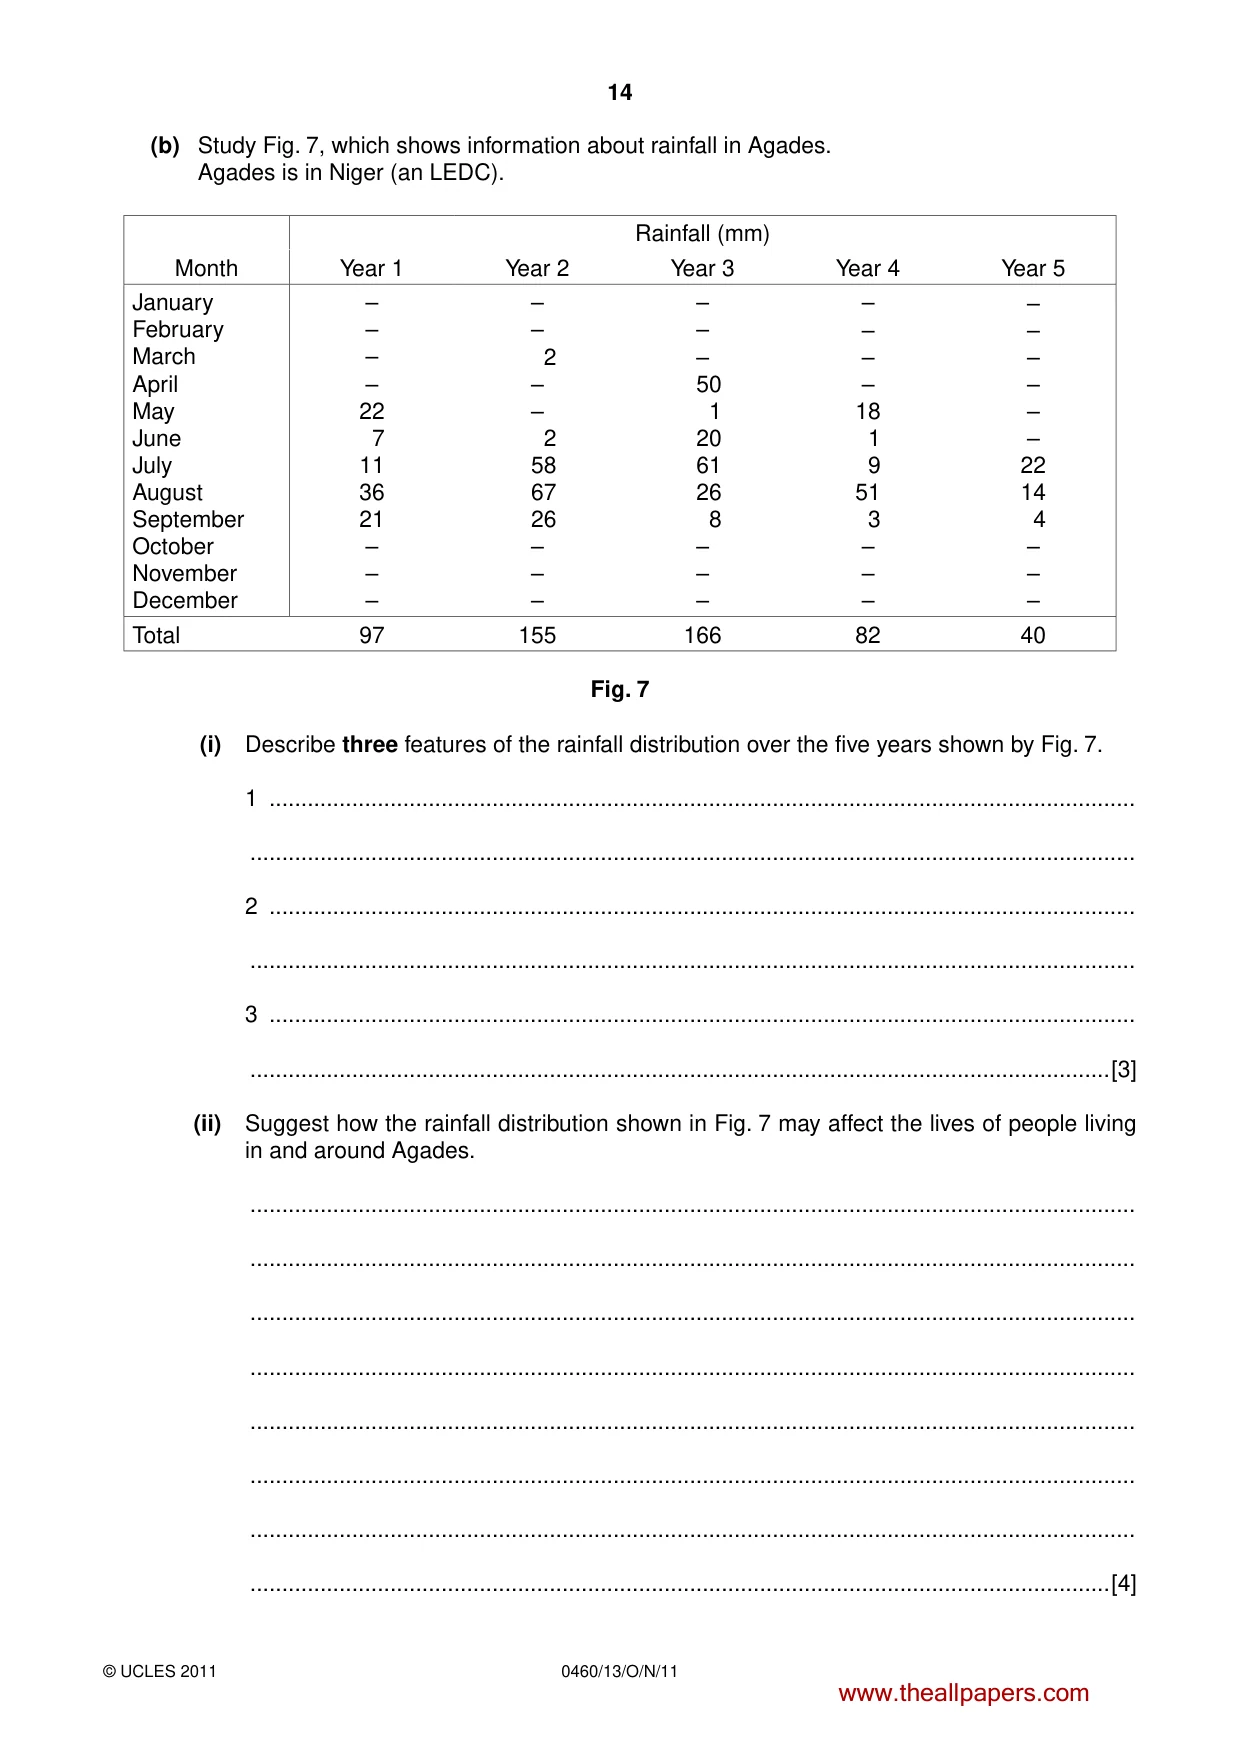
14 0460/13/O/N/11 © UCLES 2011 (b) Study Fig. 7, which shows information about rainfall in Agades. Agades is in Niger (an LEDC). Rainfall (mm) Month Year 1 Year 2 Year 3 Year 4 Year 5 January February March April May June July August September October November December – – – – 22 7 11 36 21 – – – – – 2 – – 2 58 67 26 – – – – – – 50 1 20 61 26 8 – – – – – – – 18 1 9 51 3 – – – – – – – – – 22 14 4 – – – Total 97 155 166 82 40 Fig. 7 (i) Describe three features of the rainfall distribution over the five years shown by Fig. 7. 1 … … 2 … … 3 … …[3] (ii) Suggest how the rainfall distribution shown in Fig. 7 may affect the lives of people living in and around Agades. … … … … … … … …[4] www.theallpapers.com
Question paper, page 15
15 0460/13/O/N/11 © UCLES 2011 [Turn over (iii) The area around Agades is at risk from desertification. This can be defined as ‘the spread of desert-like conditions into nearby regions’. Explain why desertification occurs. … … … … … … … … … …[5] (c) For a named area of tropical desert which you have studied, describe the features of the natural vegetation and explain how it can survive in the desert climate. Tropical Desert studied … … … … … … … … … … … … …[7] [Total: 25 marks] END OF QUESTION 4 www.theallpapers.com
Question paper, page 16
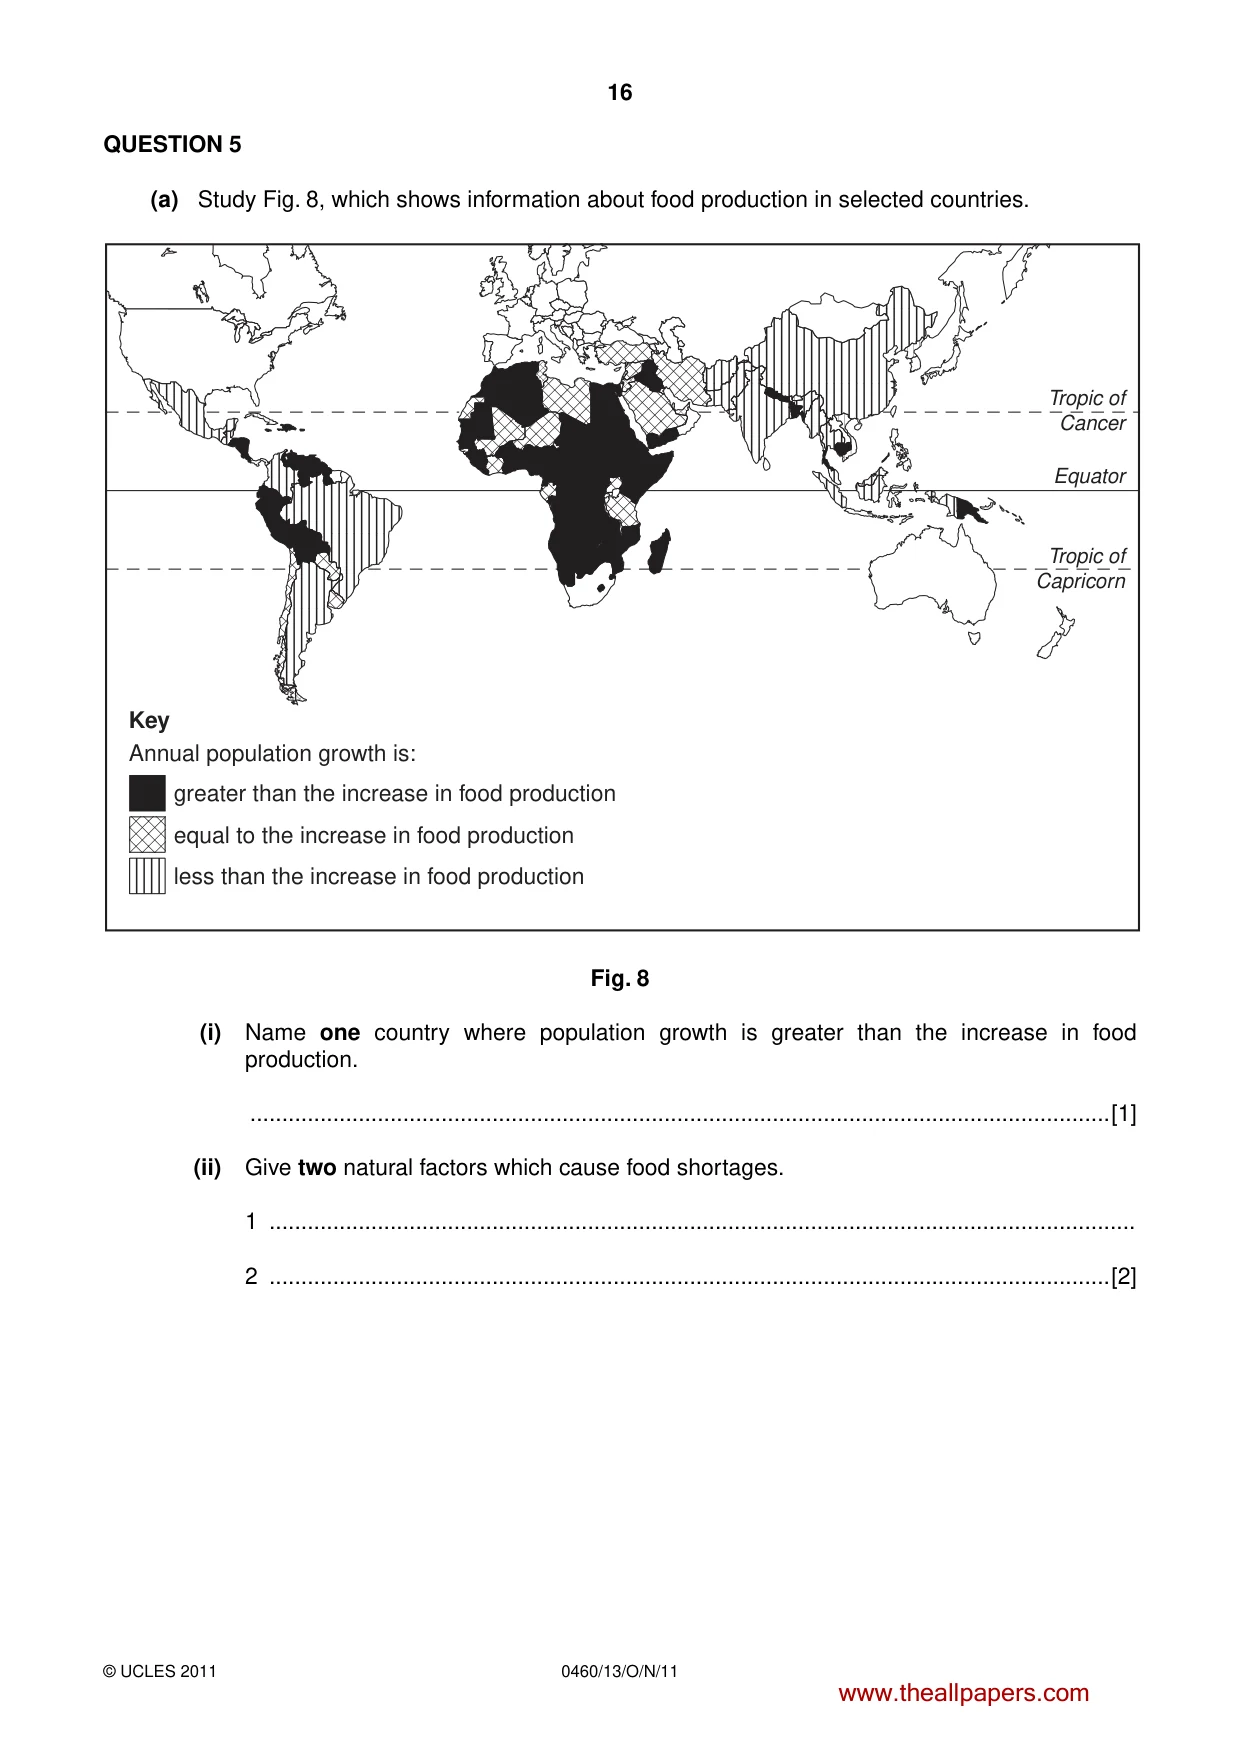
16 0460/13/O/N/11 © UCLES 2011 QUESTION 5 (a) Study Fig. 8, which shows information about food production in selected countries. Tropic of Cancer Tropic of Capricorn Equator Key Annual population growth is: greater than the increase in food production equal to the increase in food production less than the increase in food production Fig. 8 (i) Name one country where population growth is greater than the increase in food production. …[1] (ii) Give two natural factors which cause food shortages. 1 … 2 …[2] www.theallpapers.com
Question paper, page 17
17 0460/13/O/N/11 © UCLES 2011 [Turn over (iii) How can economic and political factors cause food shortages? … … … … … … …[3] (iv) Describe the effects of food shortages in LEDCs. … … … … … … … … …[4] www.theallpapers.com
Question paper, page 18
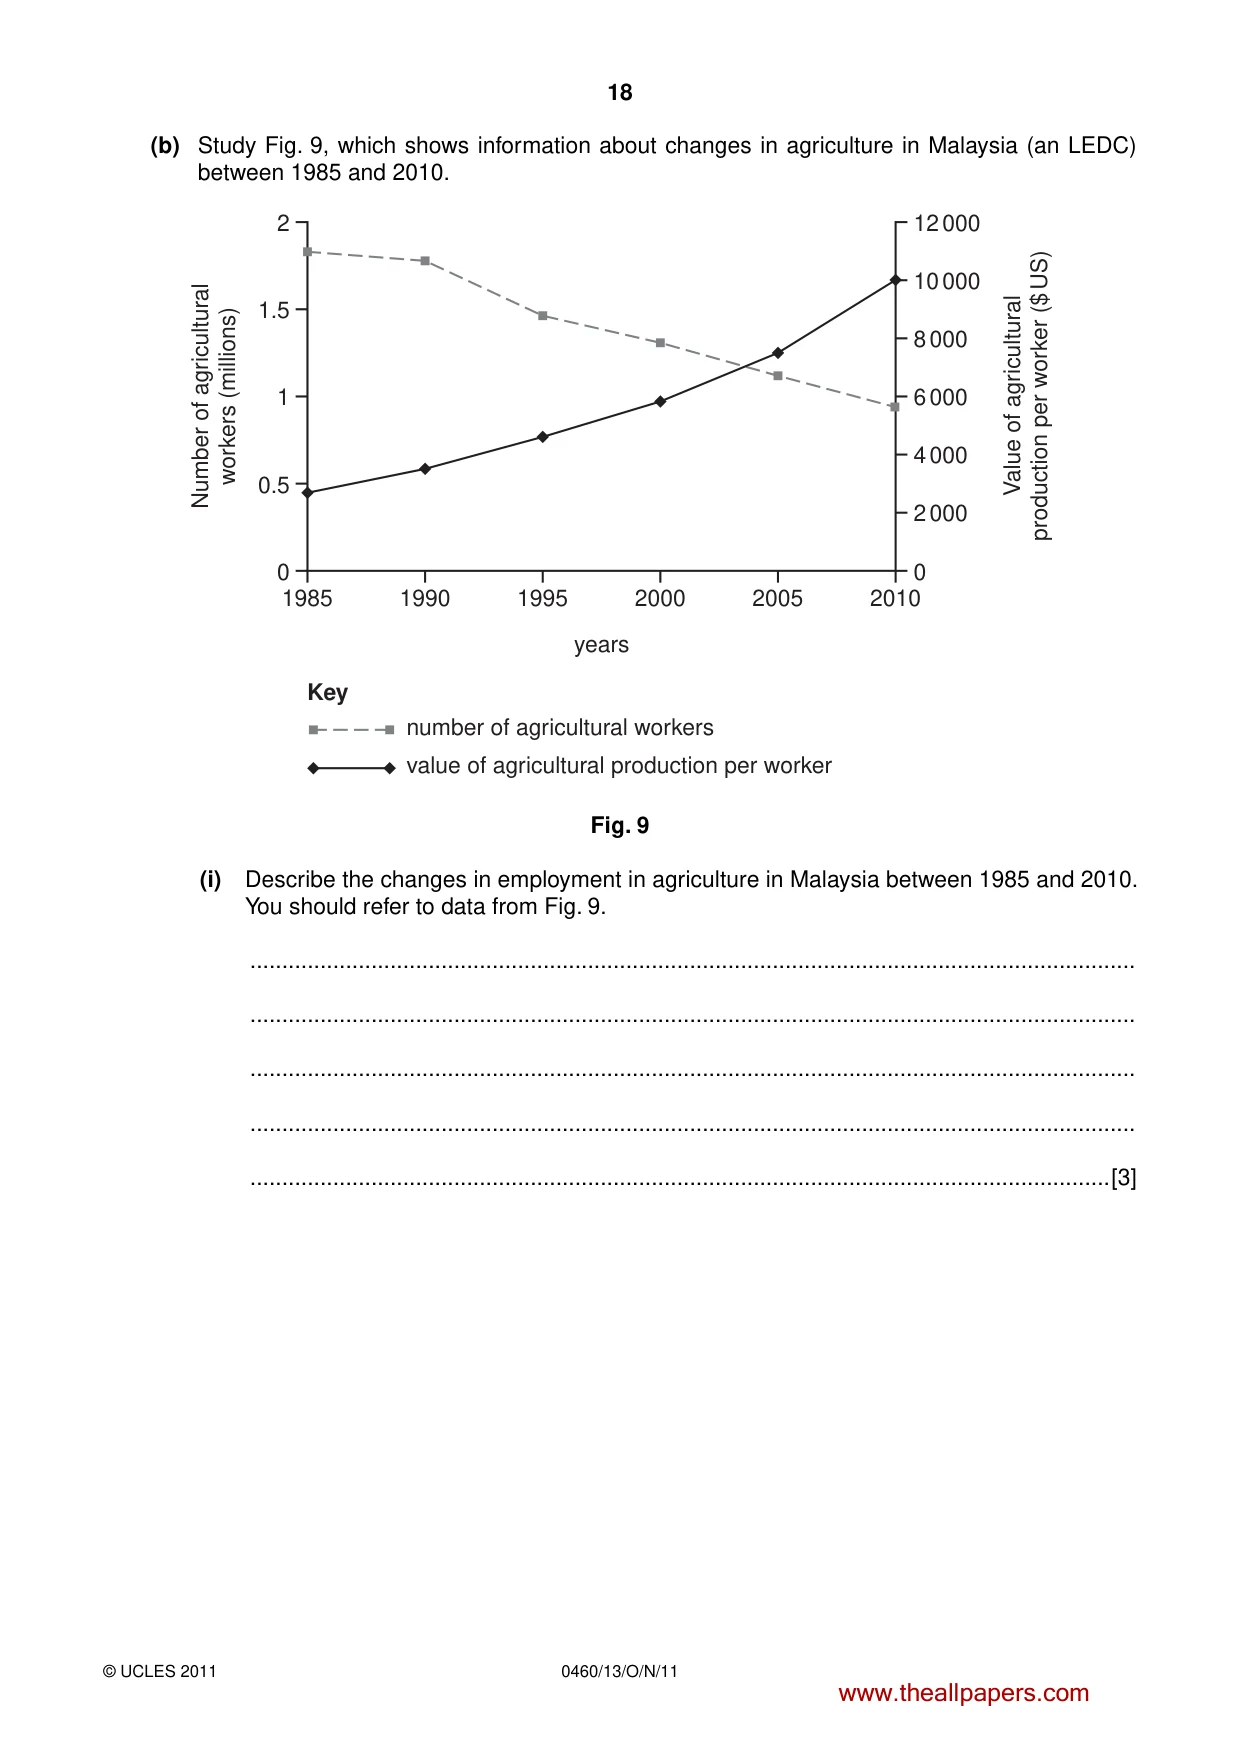
18 0460/13/O/N/11 © UCLES 2011 (b) Study Fig. 9, which shows information about changes in agriculture in Malaysia (an LEDC) between 1985 and 2010. 12 000 2 1.5 Number of agricultural workers (millions) 1 0.5 0 10 000 8 000 6 000 Value of agricultural production per worker ($ US) 4 000 2 000 0 2010 2005 2000 years number of agricultural workers 1995 1990 1985 Key value of agricultural production per worker Fig. 9 (i) Describe the changes in employment in agriculture in Malaysia between 1985 and 2010. You should refer to data from Fig. 9. … … … … …[3] www.theallpapers.com
Question paper, page 19
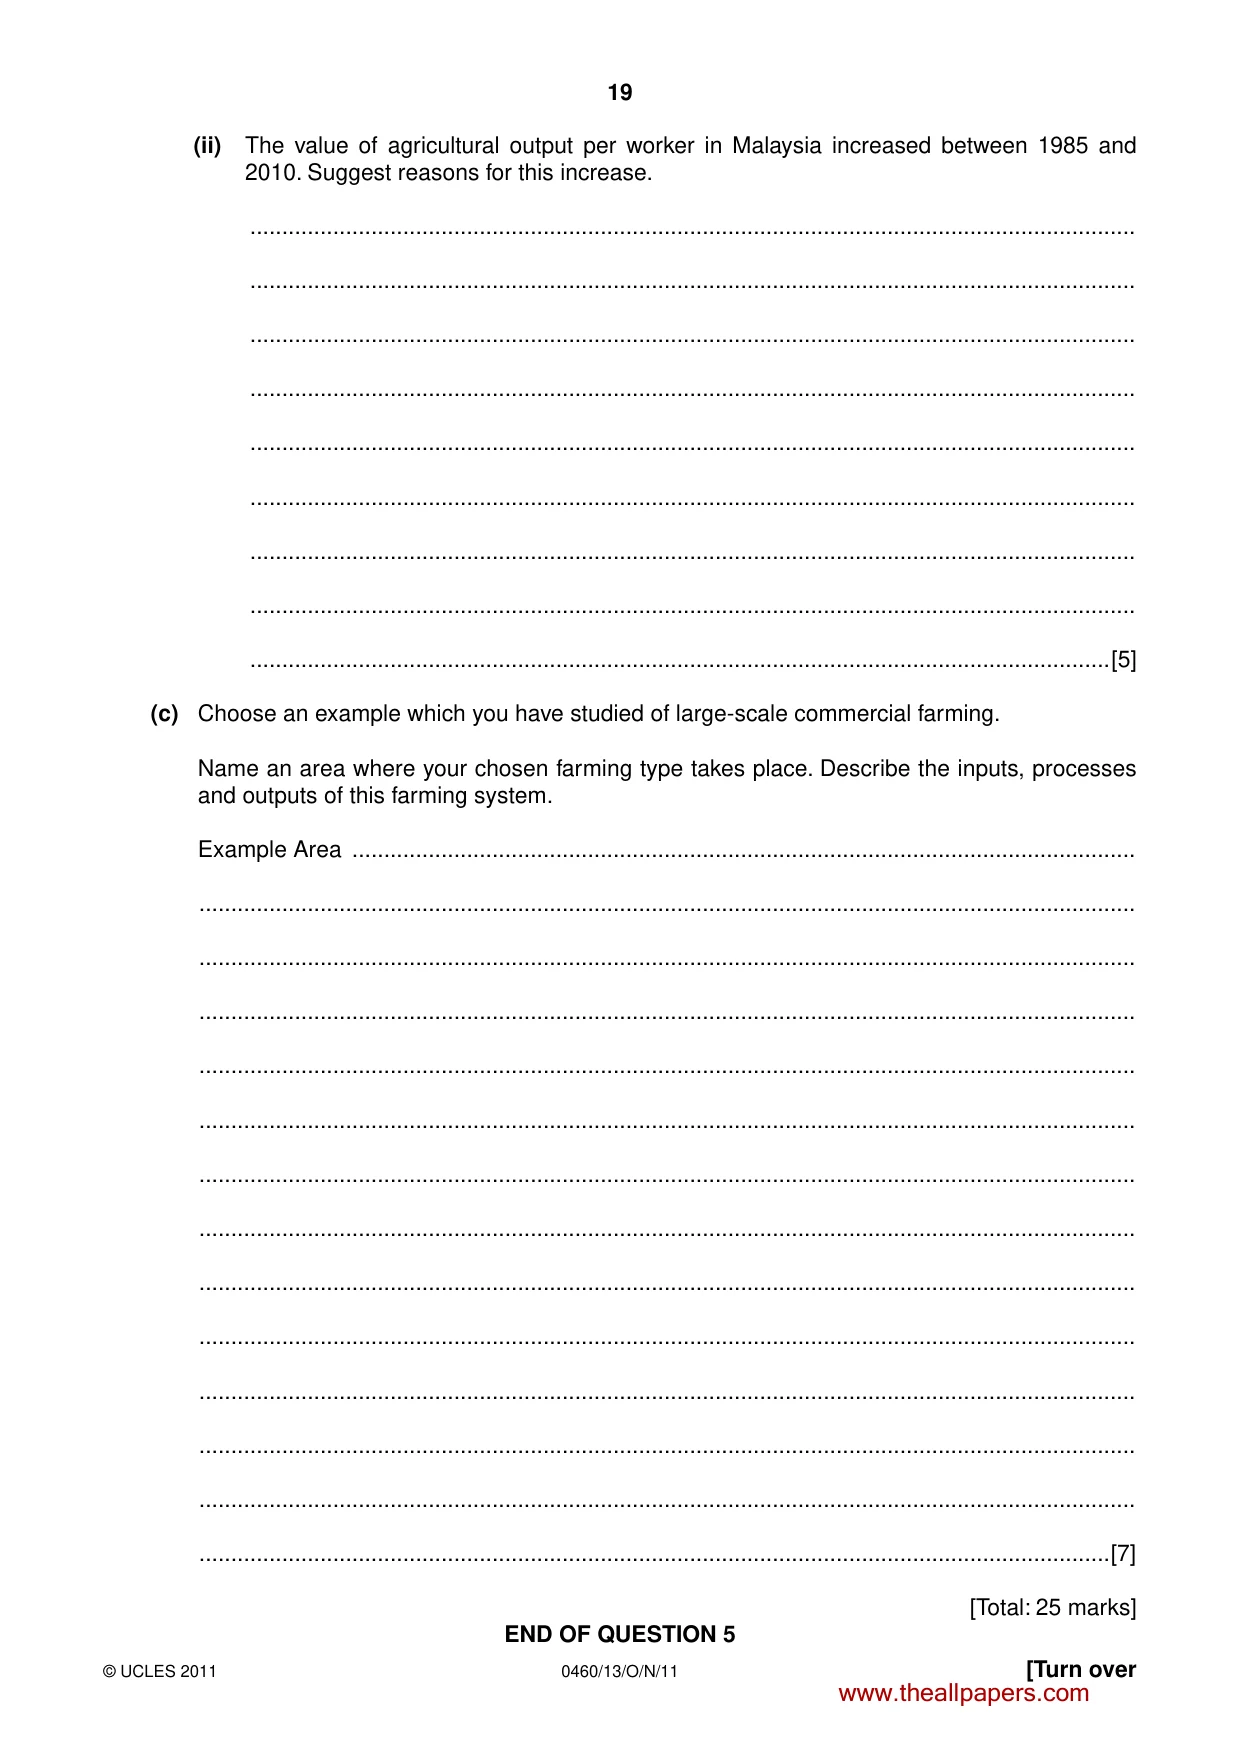
19 0460/13/O/N/11 © UCLES 2011 [Turn over (ii) The value of agricultural output per worker in Malaysia increased between 1985 and 2010. Suggest reasons for this increase. … … … … … … … … …[5] (c) Choose an example which you have studied of large-scale commercial farming. Name an area where your chosen farming type takes place. Describe the inputs, processes and outputs of this farming system. Example Area … … … … … … … … … … … … … …[7] [Total: 25 marks] END OF QUESTION 5 www.theallpapers.com
Question paper, page 20
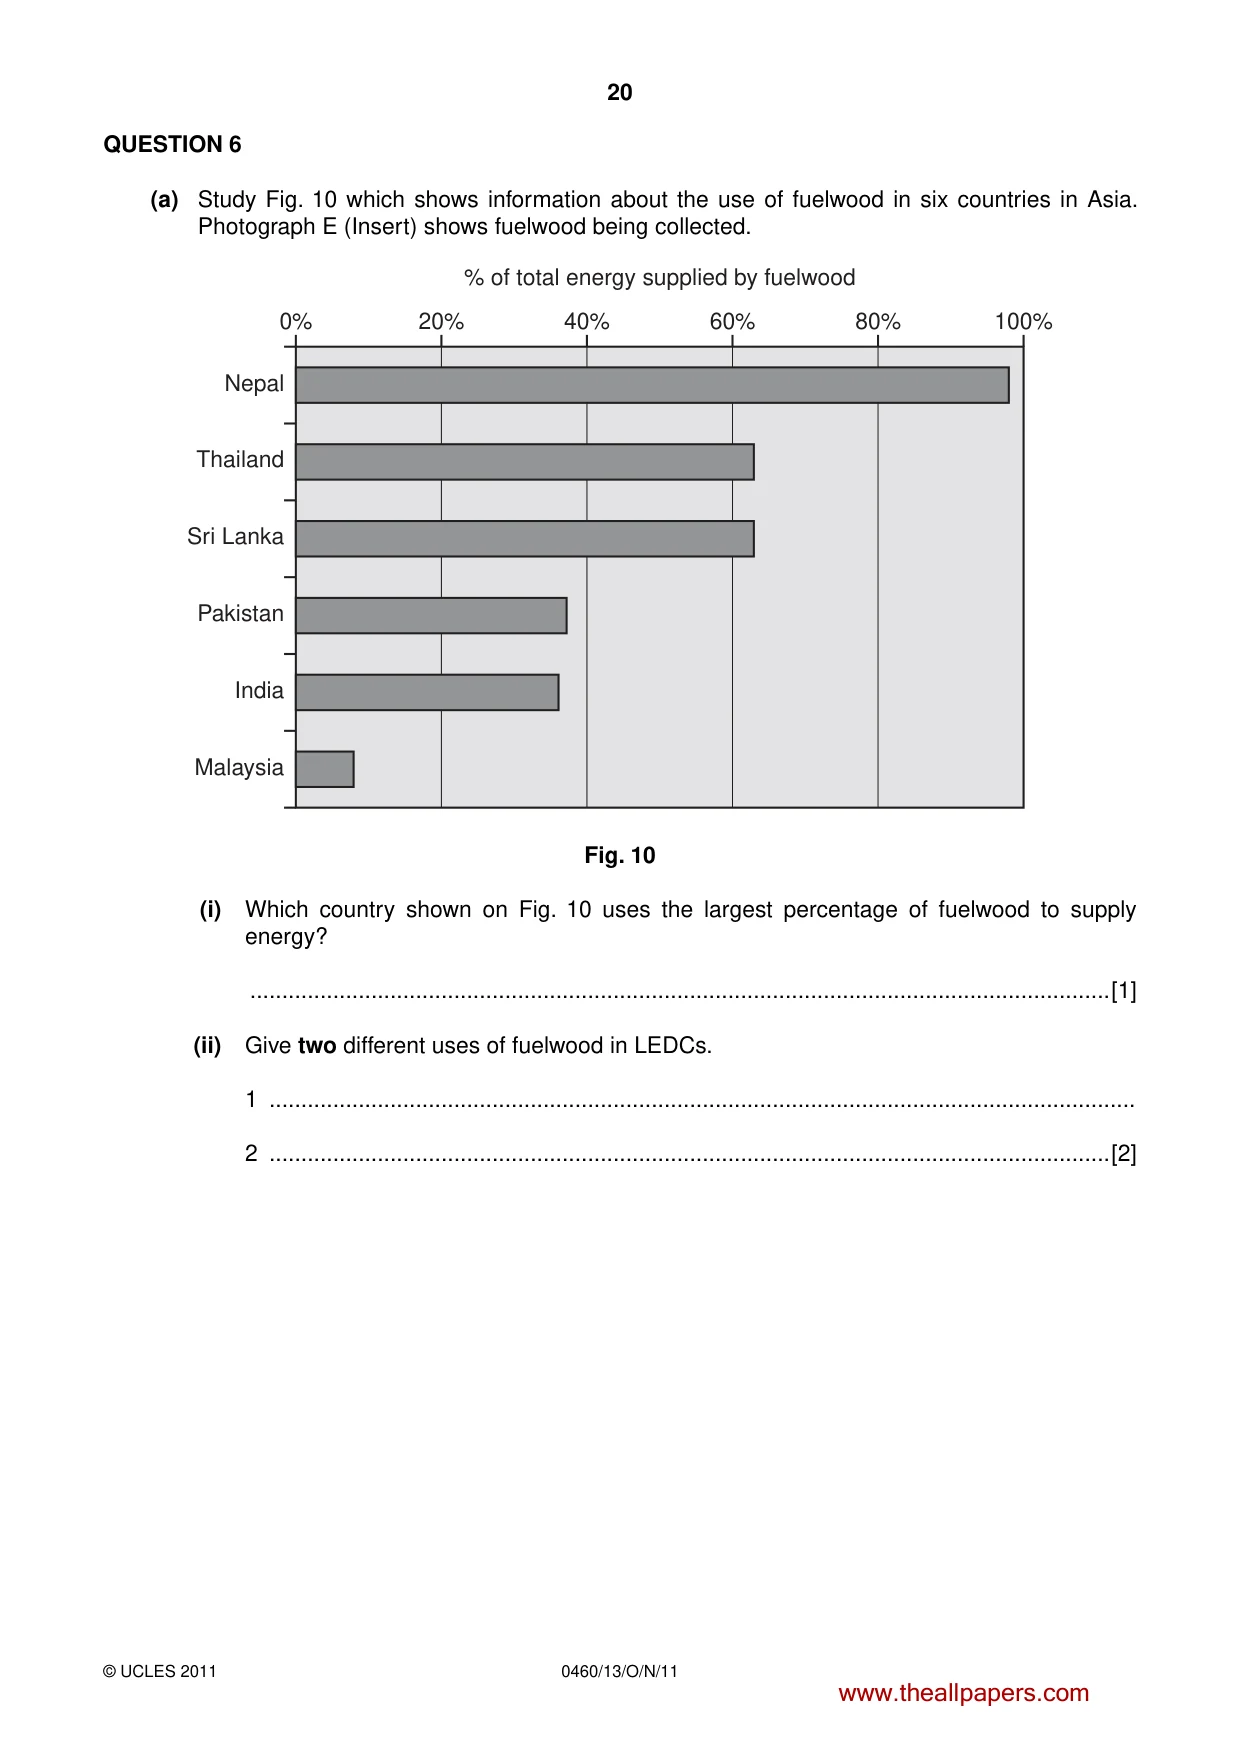
20 0460/13/O/N/11 © UCLES 2011 QUESTION 6 (a) Study Fig. 10 which shows information about the use of fuelwood in six countries in Asia. Photograph E (Insert) shows fuelwood being collected. 0% Nepal 20% 40% % of total energy supplied by fuelwood 60% 80% 100% Thailand Sri Lanka Pakistan India Malaysia Fig. 10 (i) Which country shown on Fig. 10 uses the largest percentage of fuelwood to supply energy? …[1] (ii) Give two different uses of fuelwood in LEDCs. 1 … 2 …[2] www.theallpapers.com
Question paper, page 21
21 0460/13/O/N/11 © UCLES 2011 [Turn over (iii) Describe the problems of using large amounts of fuelwood for: A people who live in LEDCs, … … … … …[3] B the local natural environment. … … … … … … … …[4] www.theallpapers.com
Question paper, page 22
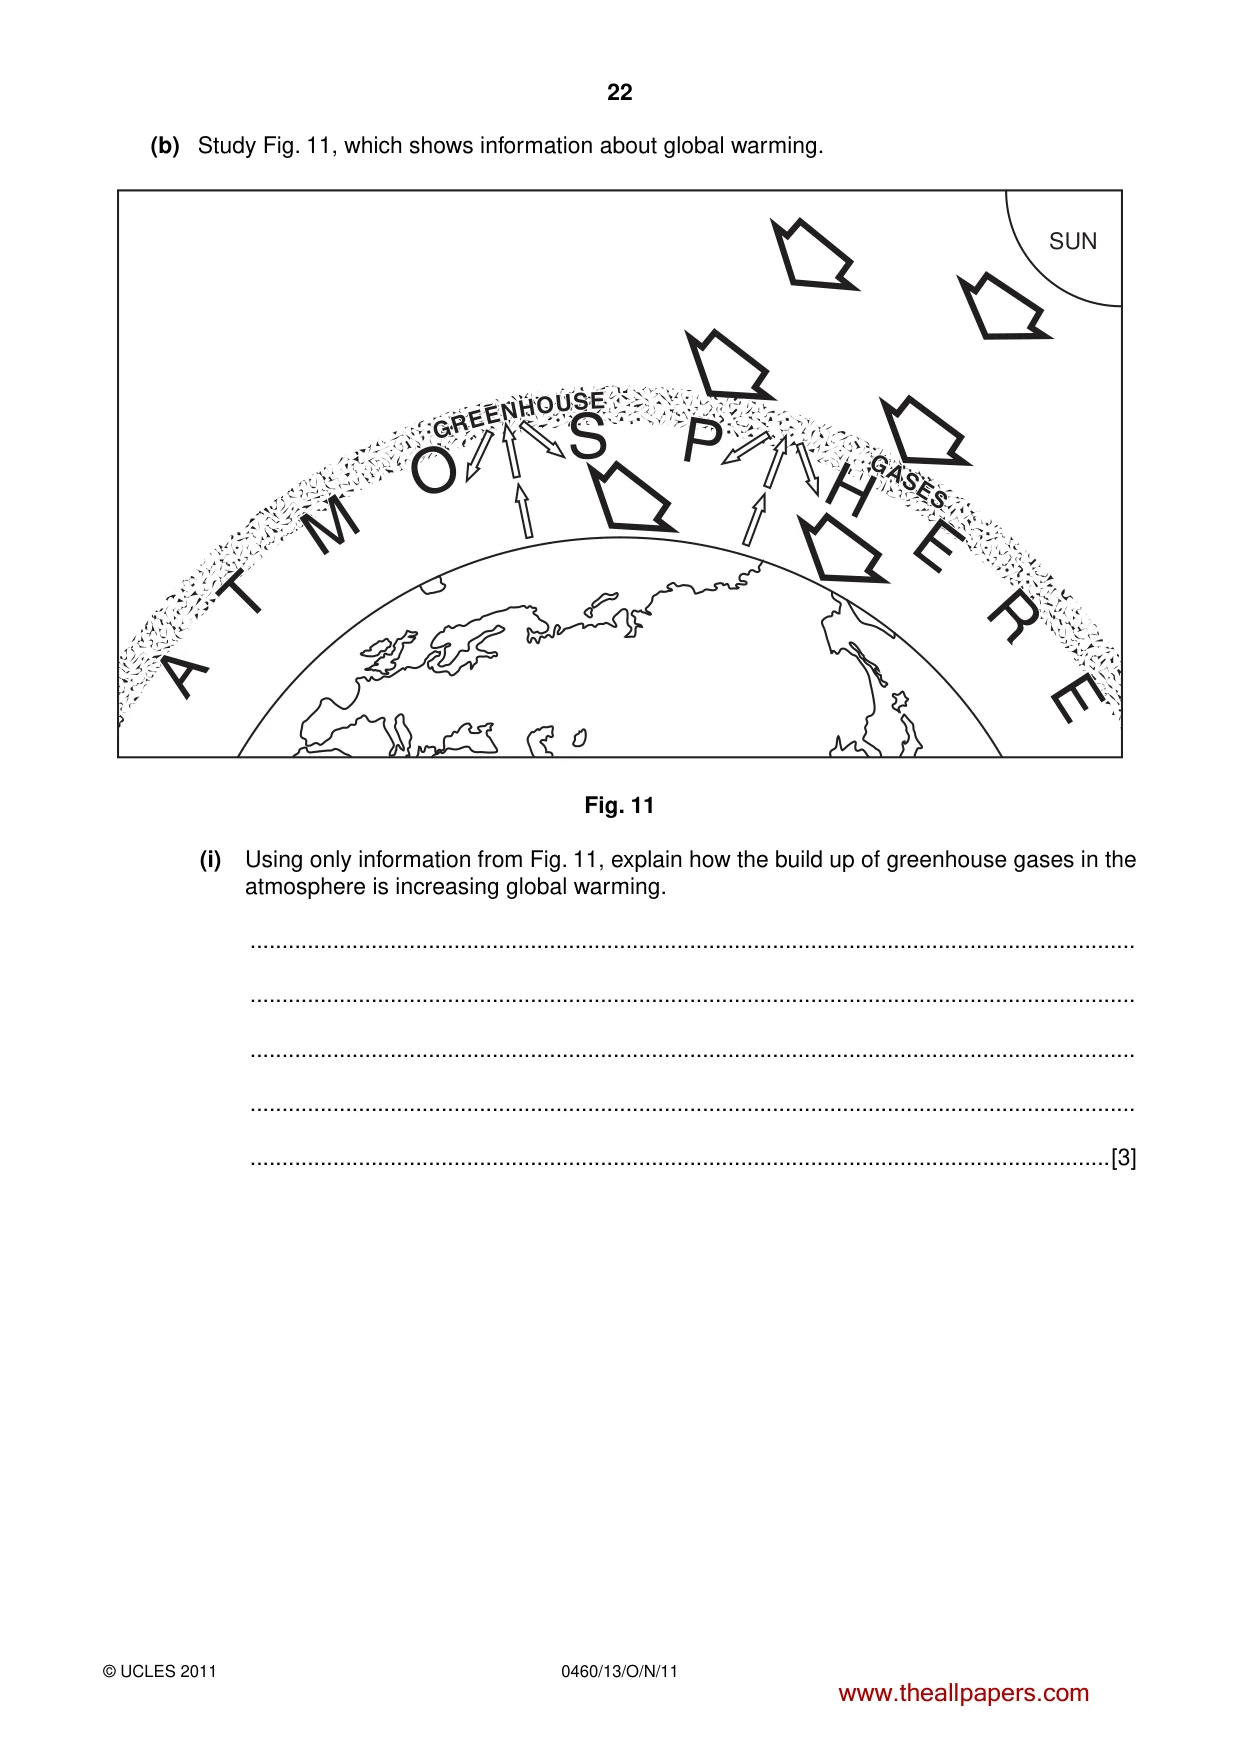
22 0460/13/O/N/11 © UCLES 2011 (b) Study Fig. 11, which shows information about global warming. SUN Fig. 11 (i) Using only information from Fig. 11, explain how the build up of greenhouse gases in the atmosphere is increasing global warming. … … … … …[3] www.theallpapers.com
Question paper, page 23
23 0460/13/O/N/11 © UCLES 2011 (ii) Explain why people are concerned about the impacts of increased global warming. … … … … … … … … …[5] (c) For a named country or area which you have studied, describe the ways in which water supplies are being developed. Name of country or area … … … … … … … … … … … … … … …[7] [Total: 25 marks] END OF QUESTION 6 www.theallpapers.com
Question paper, page 24
24 0460/13/O/N/11 © UCLES 2011 Additional Page If you use the following lined page to complete the answer(s) to any question(s), the question number(s) must be clearly shown. … … … … … … … … … … … … … … … … … … … … Copyright Acknowledgements: Question 1 Fig. 2 © David Waugh; Geography: An integrated Approach ; Nelson Thornes; 2000. Question 4 Fig. 6 © http://www.unu.edu/unupress/unupbooks/80422e/80422E02.htm; 3 August 2010. Question 6 Fig. 10 © http://solarcooking.wikia.com/wiki/Fuelwood; 3 August 2010. Photographs A-E Steve Sibley © UCLES. Permission to reproduce items where third-party owned material protected by copyright is included has been sought and cleared where possible. Every reasonable effort has been made by the publisher (UCLES) to trace copyright holders, but if any items requiring clearance have unwittingly been included, the publisher will be pleased to make amends at the earliest possible opportunity. University of Cambridge International Examinations is part of the Cambridge Assessment Group. Cambridge Assessment is the brand name of University of Cambridge Local Examinations Syndicate (UCLES), which is itself a department of the University of Cambridge. www.theallpapers.com
Mark scheme, page 1
UNIVERSITY OF CAMBRIDGE INTERNATIONAL EXAMINATIONS International General Certificate of Secondary Education MARK SCHEME for the October/November 2011 question paper for the guidance of teachers 0460 GEOGRAPHY 0460/13 Paper 1, maximum raw mark 75 This mark scheme is published as an aid to teachers and candidates, to indicate the requirements of the examination. It shows the basis on which Examiners were instructed to award marks. It does not indicate the details of the discussions that took place at an Examiners’ meeting before marking began, which would have considered the acceptability of alternative answers. Mark schemes must be read in conjunction with the question papers and the report on the examination. • Cambridge will not enter into discussions or correspondence in connection with these mark schemes. Cambridge is publishing the mark schemes for the October/November 2011 question papers for most IGCSE, GCE Advanced Level and Advanced Subsidiary Level syllabuses and some Ordinary Level syllabuses. www.theallpapers.com
Mark scheme, page 2
Page 2 Mark Scheme: Teachers’ version Syllabus Paper IGCSE – October/November 2011 0460 13 © University of Cambridge International Examinations 2011 The features of the marking scheme Each question carries 25 marks. Candidates cannot earn above the maximum marks available within each sub section. The marking scheme attempts to give guidance about the requirements of each answer and lists a number of responses, which will earn marks along with the general principles to be applied when marking each question. It should be noted that candidates can earn marks if their answers are phrased differently provided they convey the same meaning as those in the mark scheme. THE CANDIDATES DO NOT NEED TO USE THE SAME WORDING TO EARN MARKS. The notation ‘etc.’ at the end of an answer in the mark scheme signifies that there may well be other correct responses or examples that can be given credit. Providing the statement is true, relevant to the question asked and not repetition of a previous point made credit should be given. A point made within one sub-section which is an answer to the question set in a different sub-section should not be given credit as each sub-section asks different questions which require independent answers. The mark scheme uses semi colons (;) to separate marks and diagonals to separate alternative answers. Levels of response marking is used for section (c) of each question. Thus it is the quality of the response that determines which level an answer achieves rather than the quantity of statements contained within it. However, once assigned to a level the mark achieved within that level is determined by the number of points made. Levels 1 and 2 are distinguished by whether statements are simple (level 1) or developed/elaborated (level 2). A candidate can immediately enter L2 by making developed points without making any L1 statements. In order to achieve L3 a candidate must have already reached the top end of L2 – in addition his/her answer should have a clear example and the answer is place specific as well (7 marks). Where statements are assigned levels by the examiner this should be indicated by the use of L1 and L2 next to the statements. Ticks should not be used on answers that are marked using levels of response marking. Summary: Level 1 (1 to 3 marks): 1 simple statement (1 mark) 2 simple statements (2 marks) 3 simple statements (3 marks) Level 2 (4 to 6 marks): 1 developed statement (4 marks) 2 developed statements (5 marks) 3 or more developed statements with e.g. (6 marks) No example/inappropriate example = MAX 5 marks Level 3 (7 marks) 3 or more developed statements + named example with at least one piece of place specific detail. www.theallpapers.com
Mark scheme, page 3
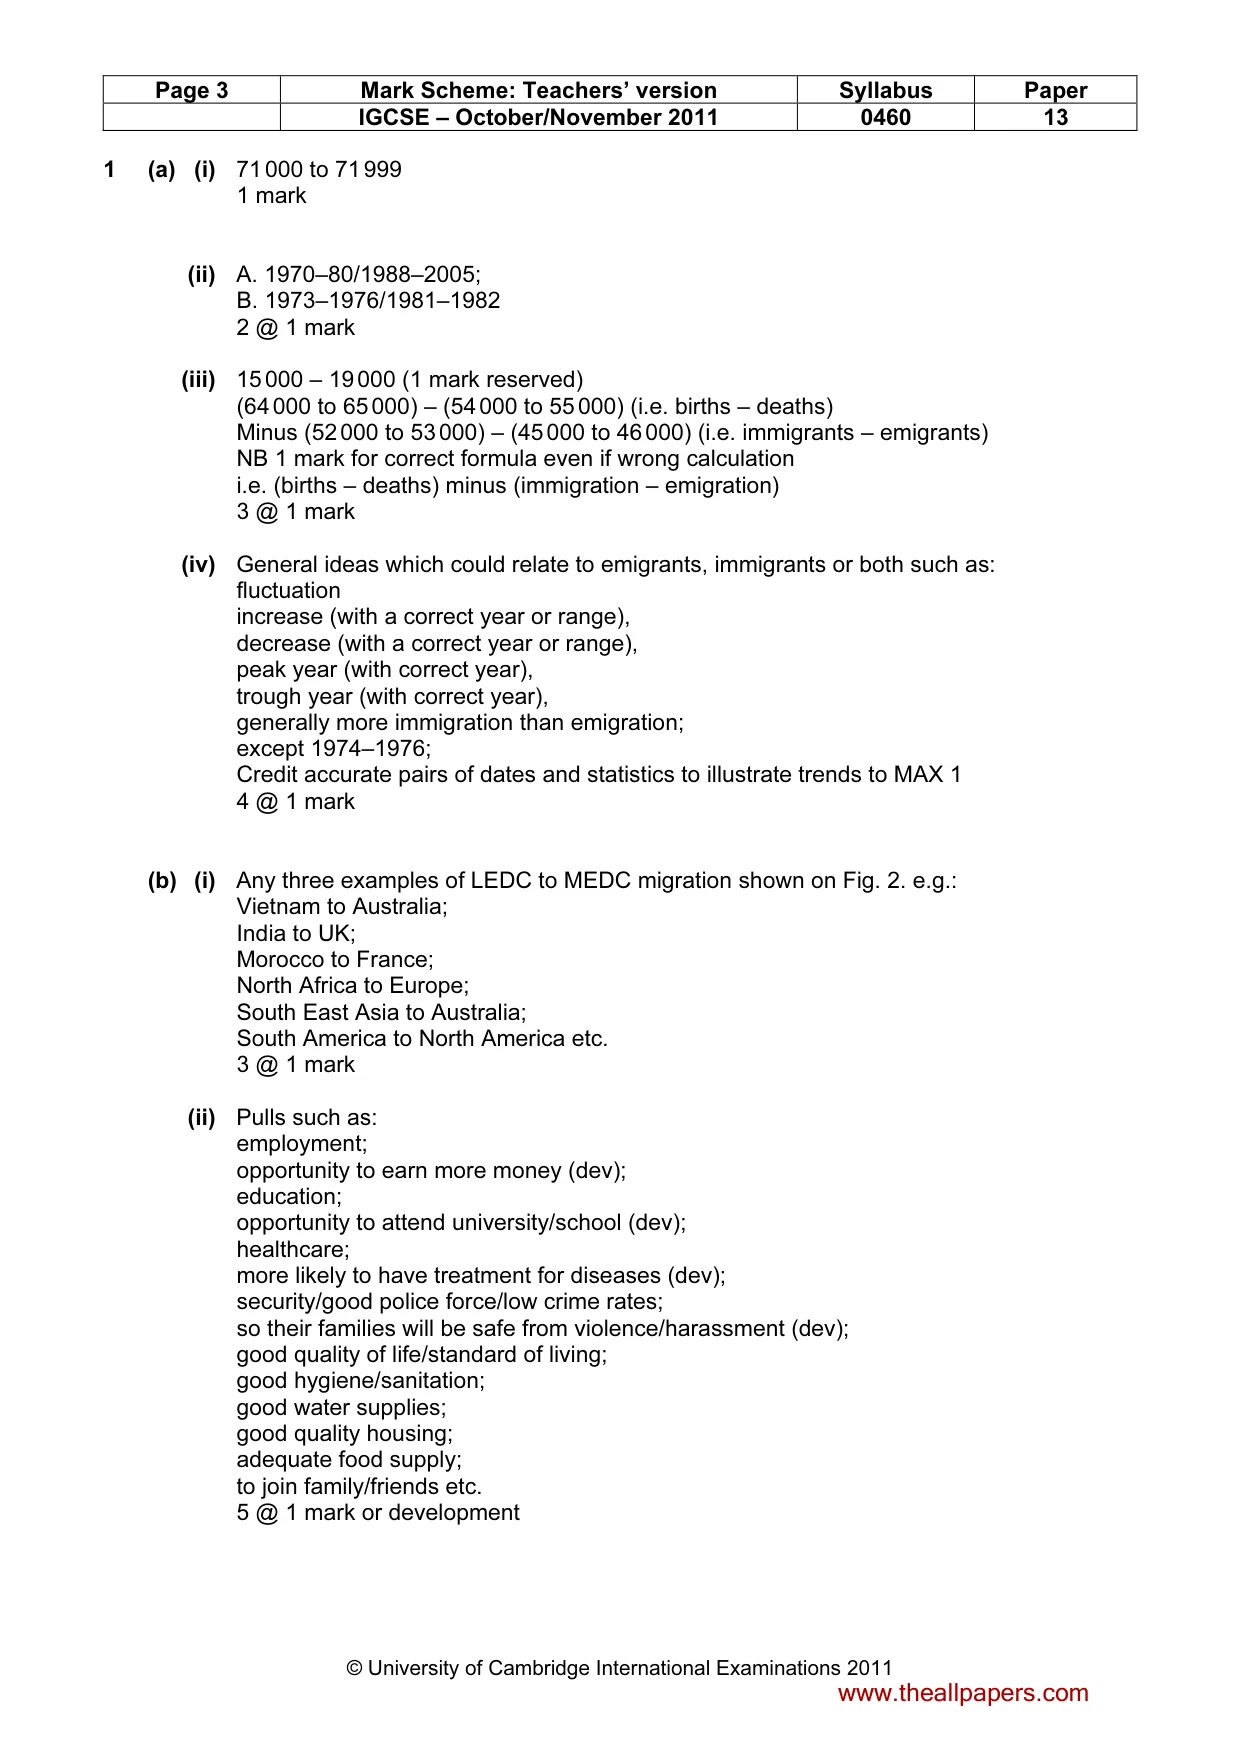
Page 3 Mark Scheme: Teachers’ version Syllabus Paper IGCSE – October/November 2011 0460 13 © University of Cambridge International Examinations 2011 1 (a) (i) 71 000 to 71 999 1 mark (ii) A. 1970–80/1988–2005; B. 1973–1976/1981–1982 2 @ 1 mark (iii) 15 000 – 19 000 (1 mark reserved) (64 000 to 65 000) – (54 000 to 55 000) (i.e. births – deaths) Minus (52 000 to 53 000) – (45 000 to 46 000) (i.e. immigrants – emigrants) NB 1 mark for correct formula even if wrong calculation i.e. (births – deaths) minus (immigration – emigration) 3 @ 1 mark (iv) General ideas which could relate to emigrants, immigrants or both such as: fluctuation increase (with a correct year or range), decrease (with a correct year or range), peak year (with correct year), trough year (with correct year), generally more immigration than emigration; except 1974–1976; Credit accurate pairs of dates and statistics to illustrate trends to MAX 1 4 @ 1 mark (b) (i) Any three examples of LEDC to MEDC migration shown on Fig. 2. e.g.: Vietnam to Australia; India to UK; Morocco to France; North Africa to Europe; South East Asia to Australia; South America to North America etc. 3 @ 1 mark (ii) Pulls such as: employment; opportunity to earn more money (dev); education; opportunity to attend university/school (dev); healthcare; more likely to have treatment for diseases (dev); security/good police force/low crime rates; so their families will be safe from violence/harassment (dev); good quality of life/standard of living; good hygiene/sanitation; good water supplies; good quality housing; adequate food supply; to join family/friends etc. 5 @ 1 mark or development www.theallpapers.com
Mark scheme, page 4
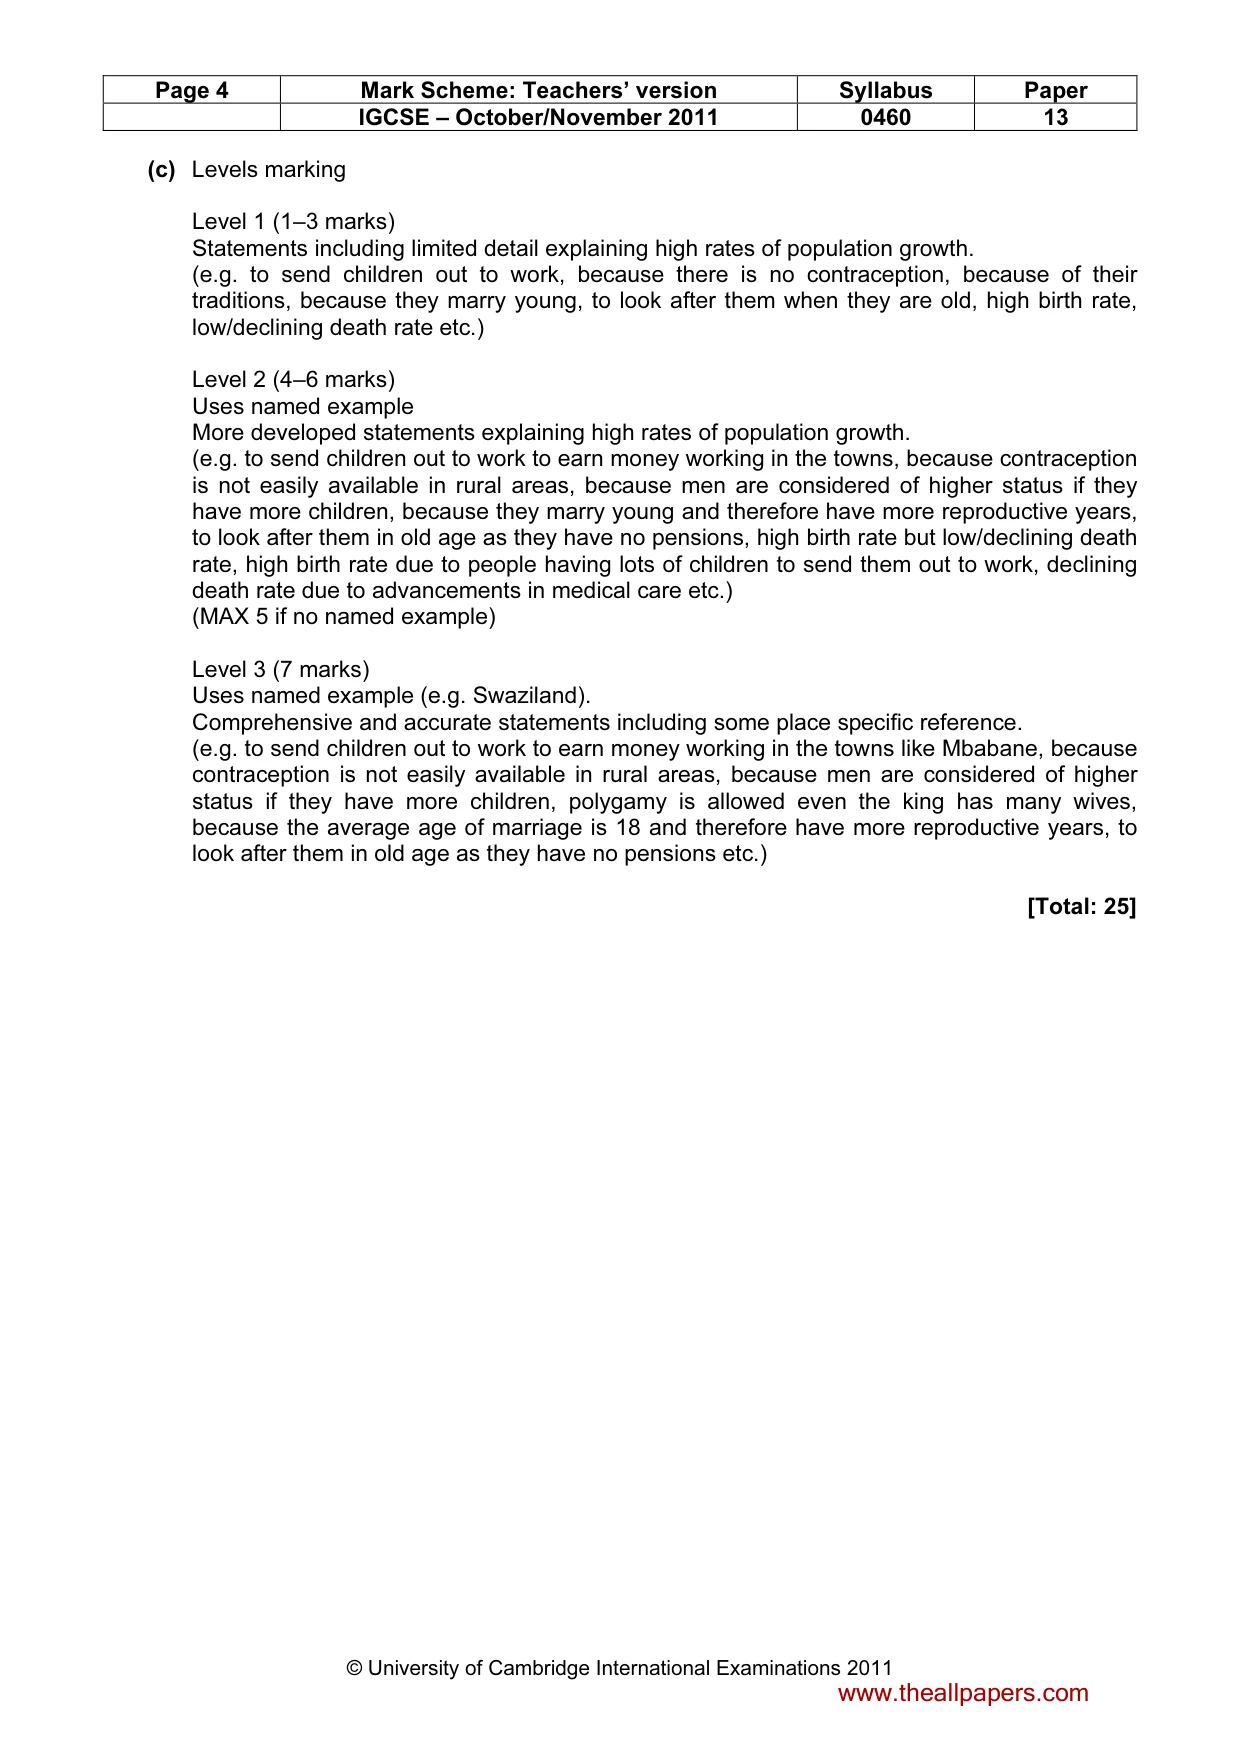
Page 4 Mark Scheme: Teachers’ version Syllabus Paper IGCSE – October/November 2011 0460 13 © University of Cambridge International Examinations 2011 (c) Levels marking Level 1 (1–3 marks) Statements including limited detail explaining high rates of population growth. (e.g. to send children out to work, because there is no contraception, because of their traditions, because they marry young, to look after them when they are old, high birth rate, low/declining death rate etc.) Level 2 (4–6 marks) Uses named example More developed statements explaining high rates of population growth. (e.g. to send children out to work to earn money working in the towns, because contraception is not easily available in rural areas, because men are considered of higher status if they have more children, because they marry young and therefore have more reproductive years, to look after them in old age as they have no pensions, high birth rate but low/declining death rate, high birth rate due to people having lots of children to send them out to work, declining death rate due to advancements in medical care etc.) (MAX 5 if no named example) Level 3 (7 marks) Uses named example (e.g. Swaziland). Comprehensive and accurate statements including some place specific reference. (e.g. to send children out to work to earn money working in the towns like Mbabane, because contraception is not easily available in rural areas, because men are considered of higher status if they have more children, polygamy is allowed even the king has many wives, because the average age of marriage is 18 and therefore have more reproductive years, to look after them in old age as they have no pensions etc.) [Total: 25] www.theallpapers.com
Mark scheme, page 5
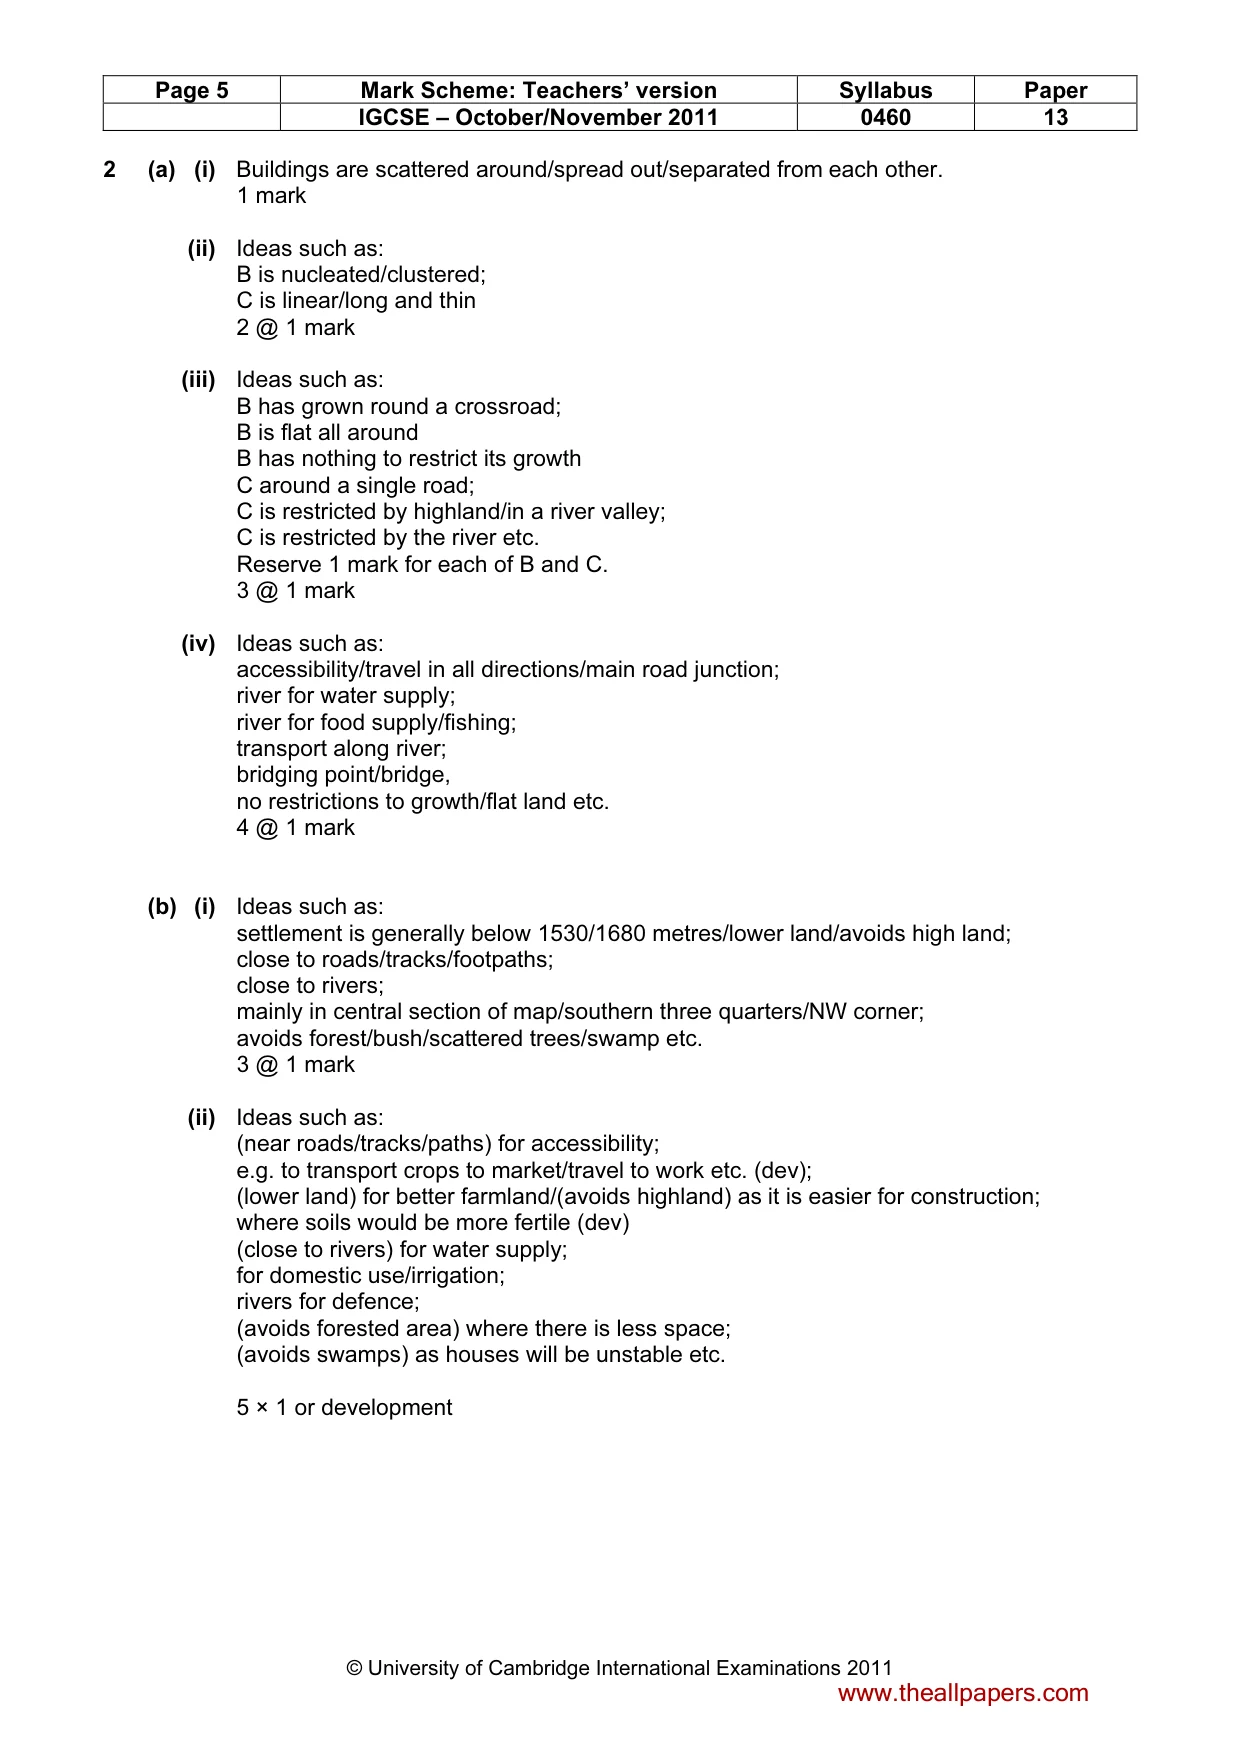
Page 5 Mark Scheme: Teachers’ version Syllabus Paper IGCSE – October/November 2011 0460 13 © University of Cambridge International Examinations 2011 2 (a) (i) Buildings are scattered around/spread out/separated from each other. 1 mark (ii) Ideas such as: B is nucleated/clustered; C is linear/long and thin 2 @ 1 mark (iii) Ideas such as: B has grown round a crossroad; B is flat all around B has nothing to restrict its growth C around a single road; C is restricted by highland/in a river valley; C is restricted by the river etc. Reserve 1 mark for each of B and C. 3 @ 1 mark (iv) Ideas such as: accessibility/travel in all directions/main road junction; river for water supply; river for food supply/fishing; transport along river; bridging point/bridge, no restrictions to growth/flat land etc. 4 @ 1 mark (b) (i) Ideas such as: settlement is generally below 1530/1680 metres/lower land/avoids high land; close to roads/tracks/footpaths; close to rivers; mainly in central section of map/southern three quarters/NW corner; avoids forest/bush/scattered trees/swamp etc. 3 @ 1 mark (ii) Ideas such as: (near roads/tracks/paths) for accessibility; e.g. to transport crops to market/travel to work etc. (dev); (lower land) for better farmland/(avoids highland) as it is easier for construction; where soils would be more fertile (dev) (close to rivers) for water supply; for domestic use/irrigation; rivers for defence; (avoids forested area) where there is less space; (avoids swamps) as houses will be unstable etc. 5 × 1 or development www.theallpapers.com
Mark scheme, page 6
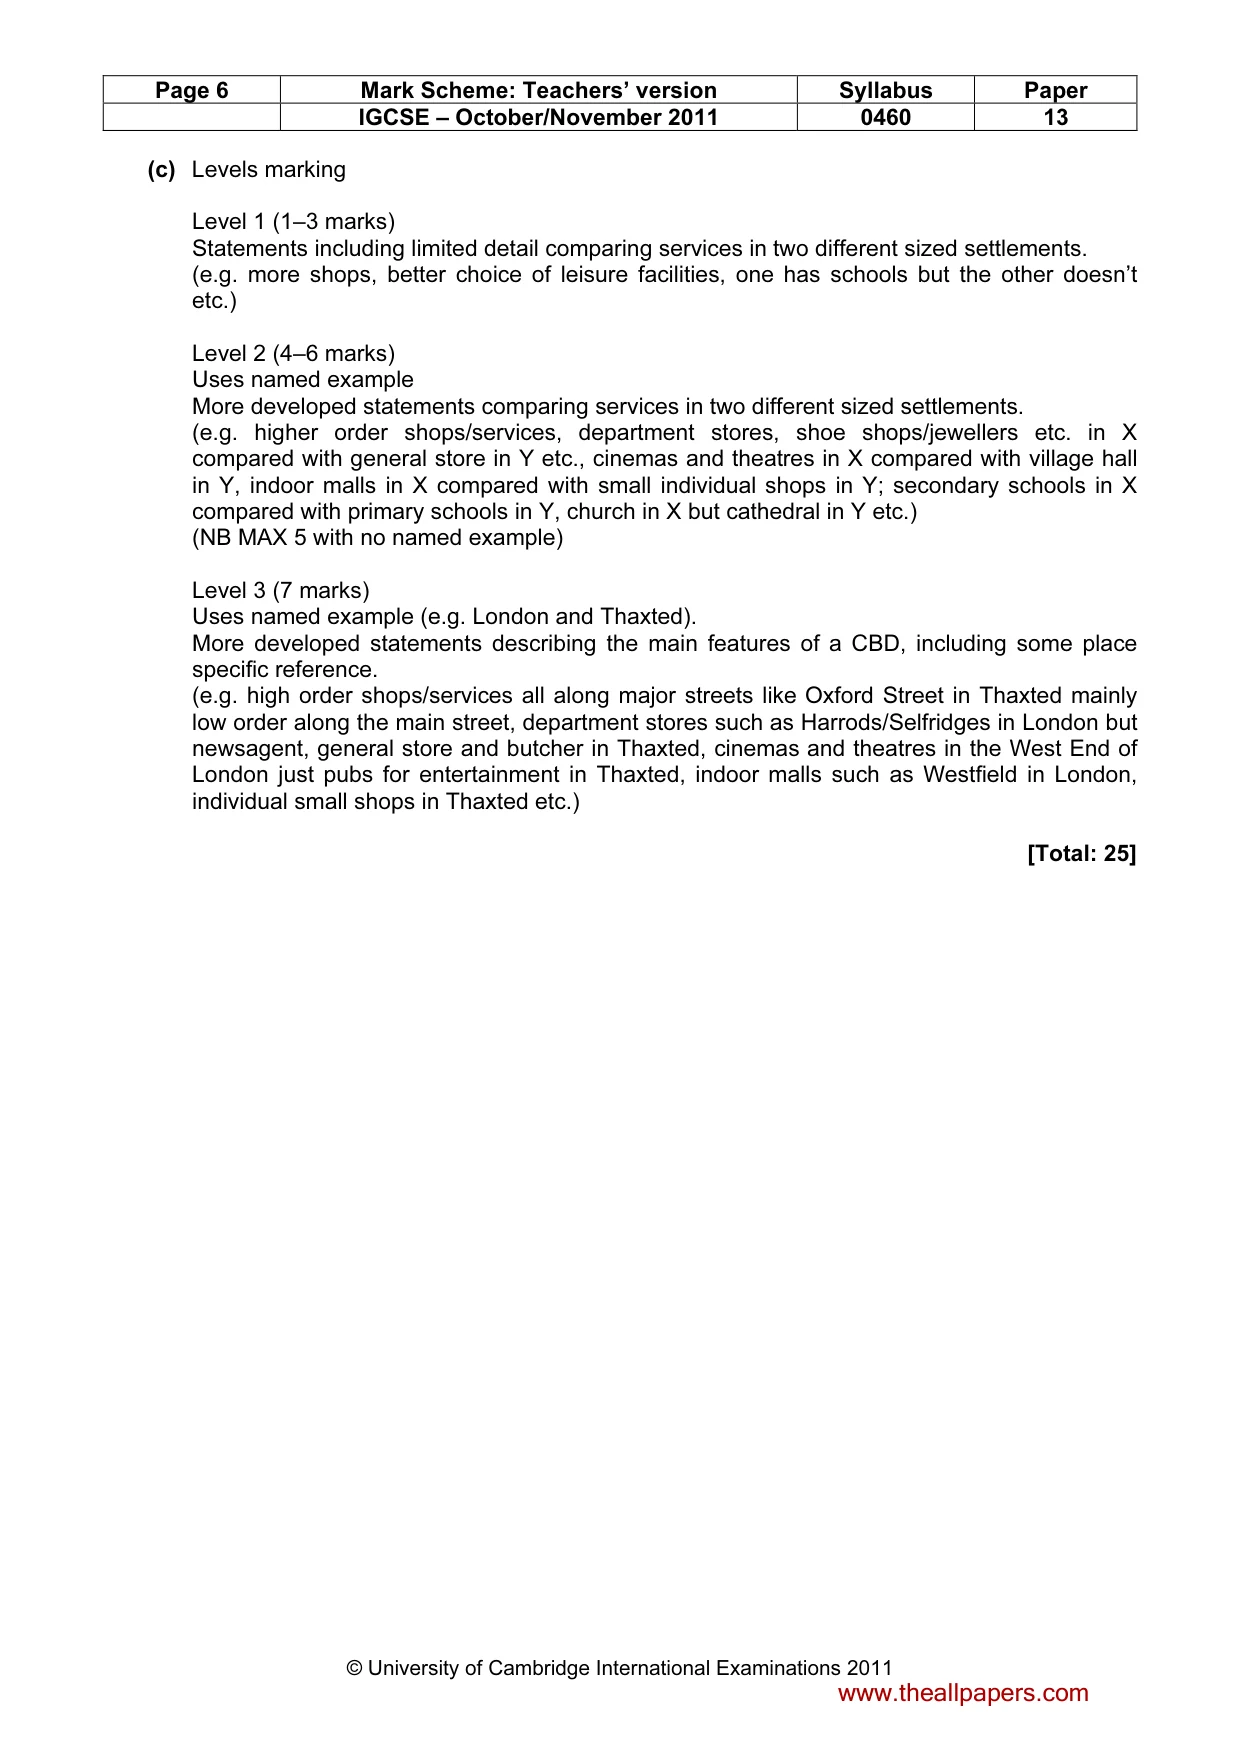
Page 6 Mark Scheme: Teachers’ version Syllabus Paper IGCSE – October/November 2011 0460 13 © University of Cambridge International Examinations 2011 (c) Levels marking Level 1 (1–3 marks) Statements including limited detail comparing services in two different sized settlements. (e.g. more shops, better choice of leisure facilities, one has schools but the other doesn’t etc.) Level 2 (4–6 marks) Uses named example More developed statements comparing services in two different sized settlements. (e.g. higher order shops/services, department stores, shoe shops/jewellers etc. in X compared with general store in Y etc., cinemas and theatres in X compared with village hall in Y, indoor malls in X compared with small individual shops in Y; secondary schools in X compared with primary schools in Y, church in X but cathedral in Y etc.) (NB MAX 5 with no named example) Level 3 (7 marks) Uses named example (e.g. London and Thaxted). More developed statements describing the main features of a CBD, including some place specific reference. (e.g. high order shops/services all along major streets like Oxford Street in Thaxted mainly low order along the main street, department stores such as Harrods/Selfridges in London but newsagent, general store and butcher in Thaxted, cinemas and theatres in the West End of London just pubs for entertainment in Thaxted, indoor malls such as Westfield in London, individual small shops in Thaxted etc.) [Total: 25] www.theallpapers.com
Mark scheme, page 7
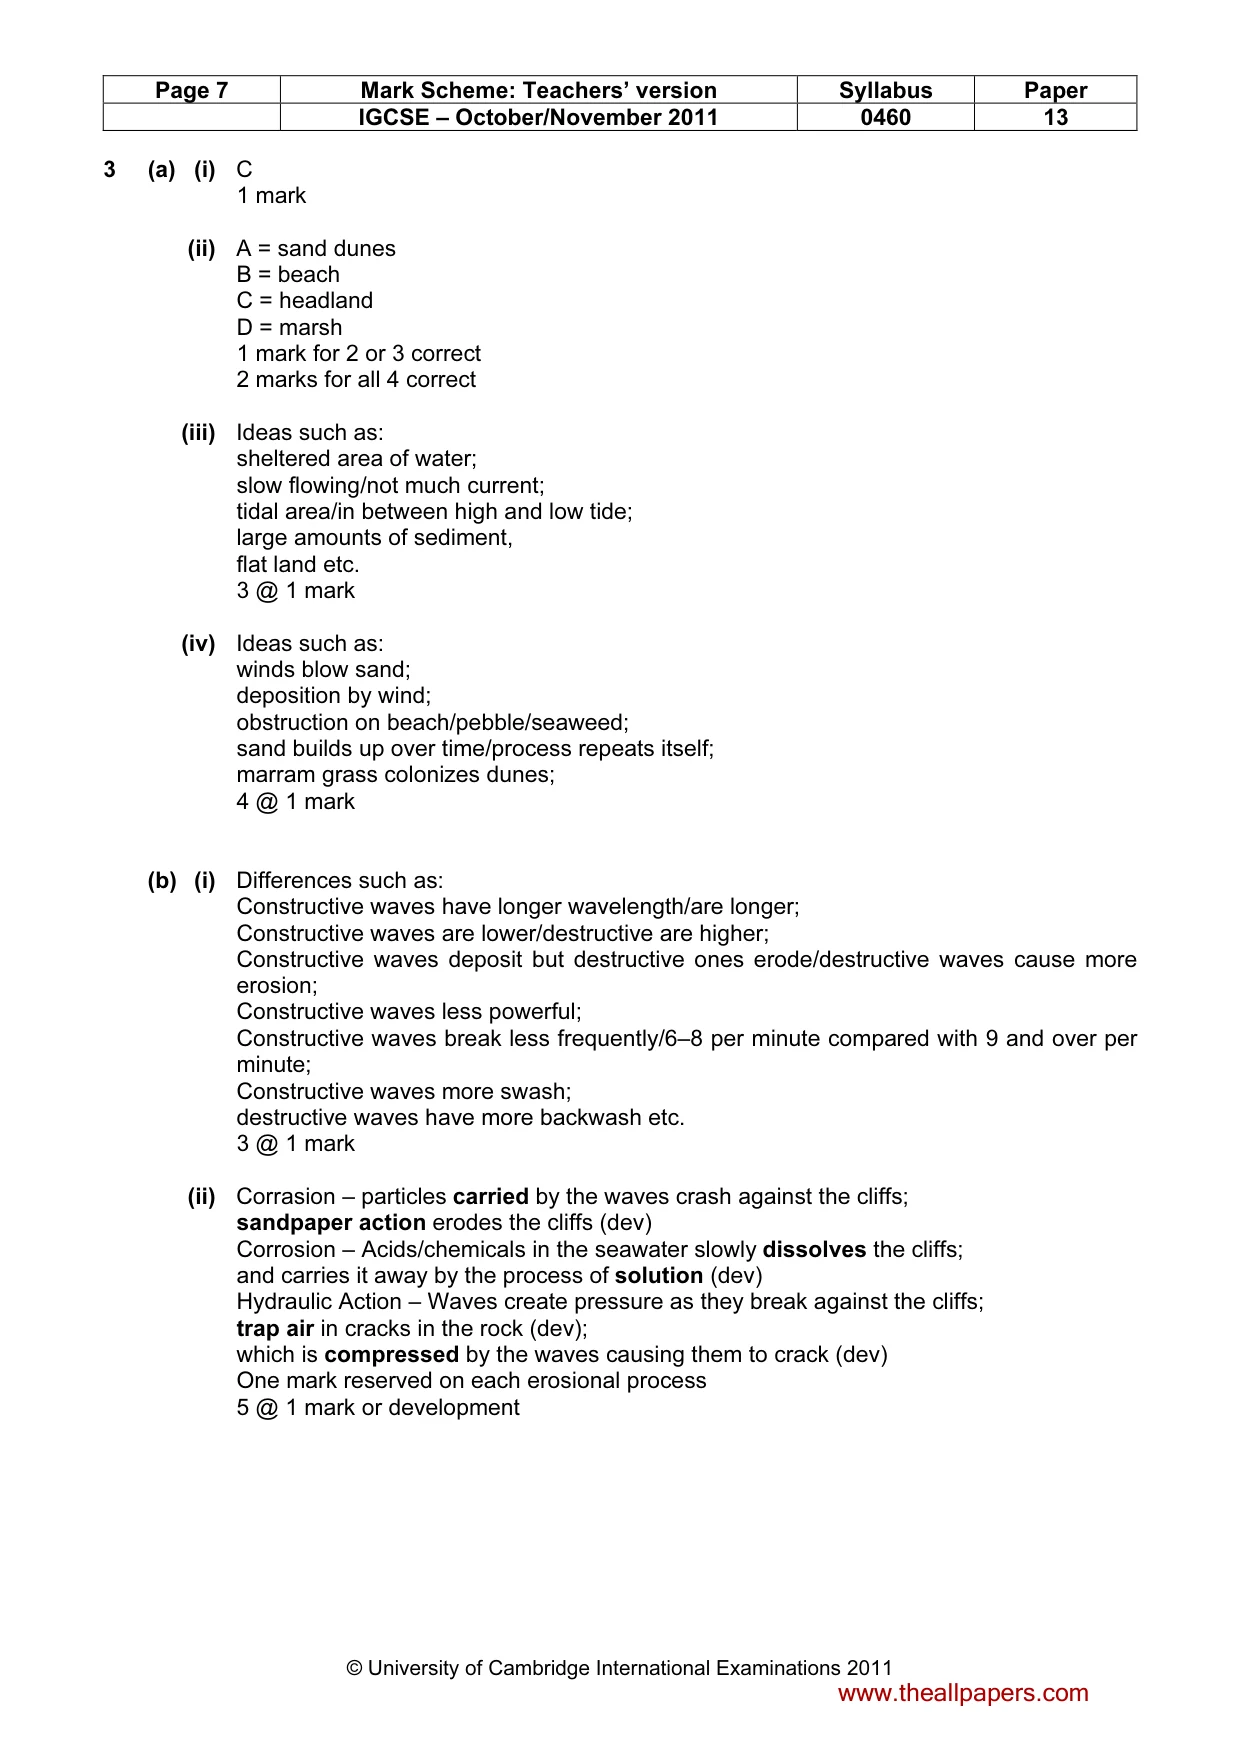
Page 7 Mark Scheme: Teachers’ version Syllabus Paper IGCSE – October/November 2011 0460 13 © University of Cambridge International Examinations 2011 3 (a) (i) C 1 mark (ii) A = sand dunes B = beach C = headland D = marsh 1 mark for 2 or 3 correct 2 marks for all 4 correct (iii) Ideas such as: sheltered area of water; slow flowing/not much current; tidal area/in between high and low tide; large amounts of sediment, flat land etc. 3 @ 1 mark (iv) Ideas such as: winds blow sand; deposition by wind; obstruction on beach/pebble/seaweed; sand builds up over time/process repeats itself; marram grass colonizes dunes; 4 @ 1 mark (b) (i) Differences such as: Constructive waves have longer wavelength/are longer; Constructive waves are lower/destructive are higher; Constructive waves deposit but destructive ones erode/destructive waves cause more erosion; Constructive waves less powerful; Constructive waves break less frequently/6–8 per minute compared with 9 and over per minute; Constructive waves more swash; destructive waves have more backwash etc. 3 @ 1 mark (ii) Corrasion – particles carried by the waves crash against the cliffs; sandpaper action erodes the cliffs (dev) Corrosion – Acids/chemicals in the seawater slowly dissolves the cliffs; and carries it away by the process of solution (dev) Hydraulic Action – Waves create pressure as they break against the cliffs; trap air in cracks in the rock (dev); which is compressed by the waves causing them to crack (dev) One mark reserved on each erosional process 5 @ 1 mark or development www.theallpapers.com
Mark scheme, page 8
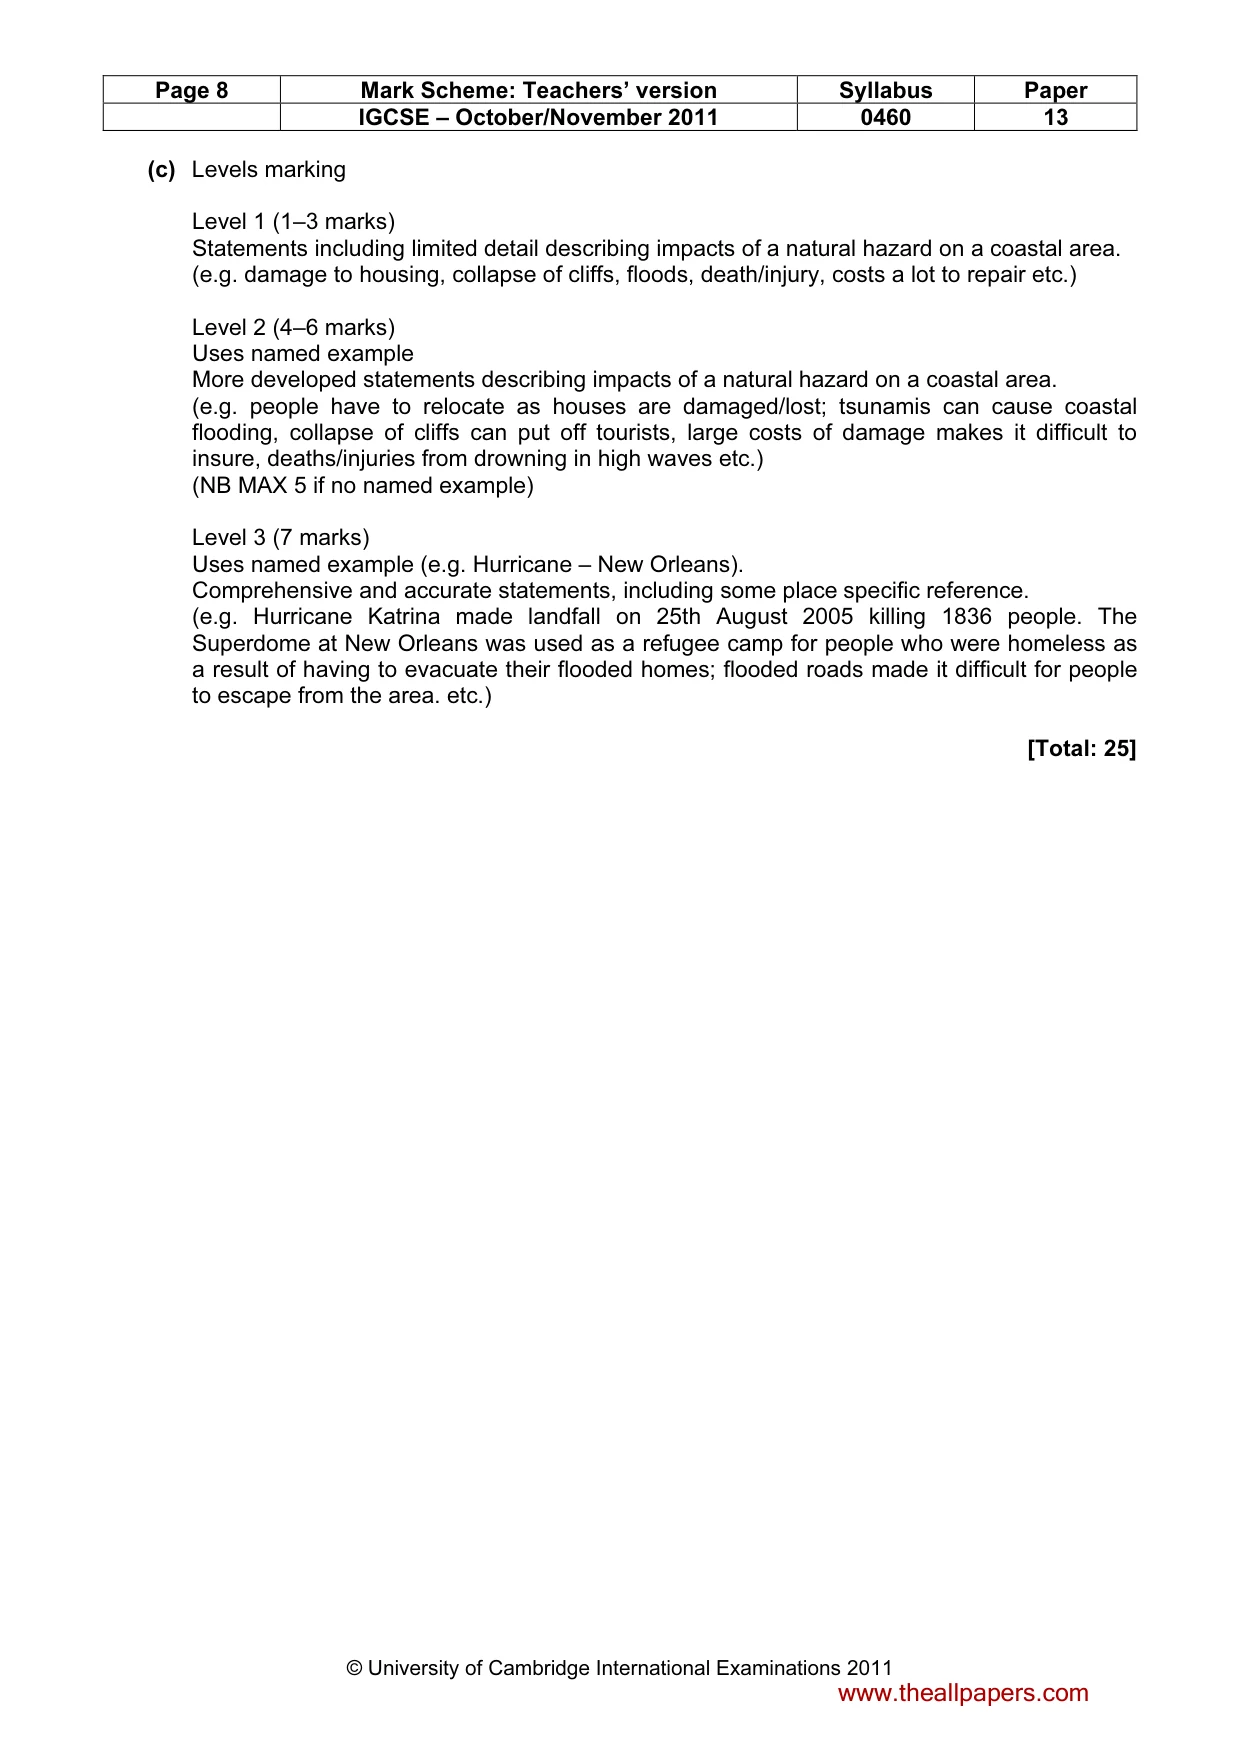
Page 8 Mark Scheme: Teachers’ version Syllabus Paper IGCSE – October/November 2011 0460 13 © University of Cambridge International Examinations 2011 (c) Levels marking Level 1 (1–3 marks) Statements including limited detail describing impacts of a natural hazard on a coastal area. (e.g. damage to housing, collapse of cliffs, floods, death/injury, costs a lot to repair etc.) Level 2 (4–6 marks) Uses named example More developed statements describing impacts of a natural hazard on a coastal area. (e.g. people have to relocate as houses are damaged/lost; tsunamis can cause coastal flooding, collapse of cliffs can put off tourists, large costs of damage makes it difficult to insure, deaths/injuries from drowning in high waves etc.) (NB MAX 5 if no named example) Level 3 (7 marks) Uses named example (e.g. Hurricane – New Orleans). Comprehensive and accurate statements, including some place specific reference. (e.g. Hurricane Katrina made landfall on 25th August 2005 killing 1836 people. The Superdome at New Orleans was used as a refugee camp for people who were homeless as a result of having to evacuate their flooded homes; flooded roads made it difficult for people to escape from the area. etc.) [Total: 25] www.theallpapers.com
Mark scheme, page 9
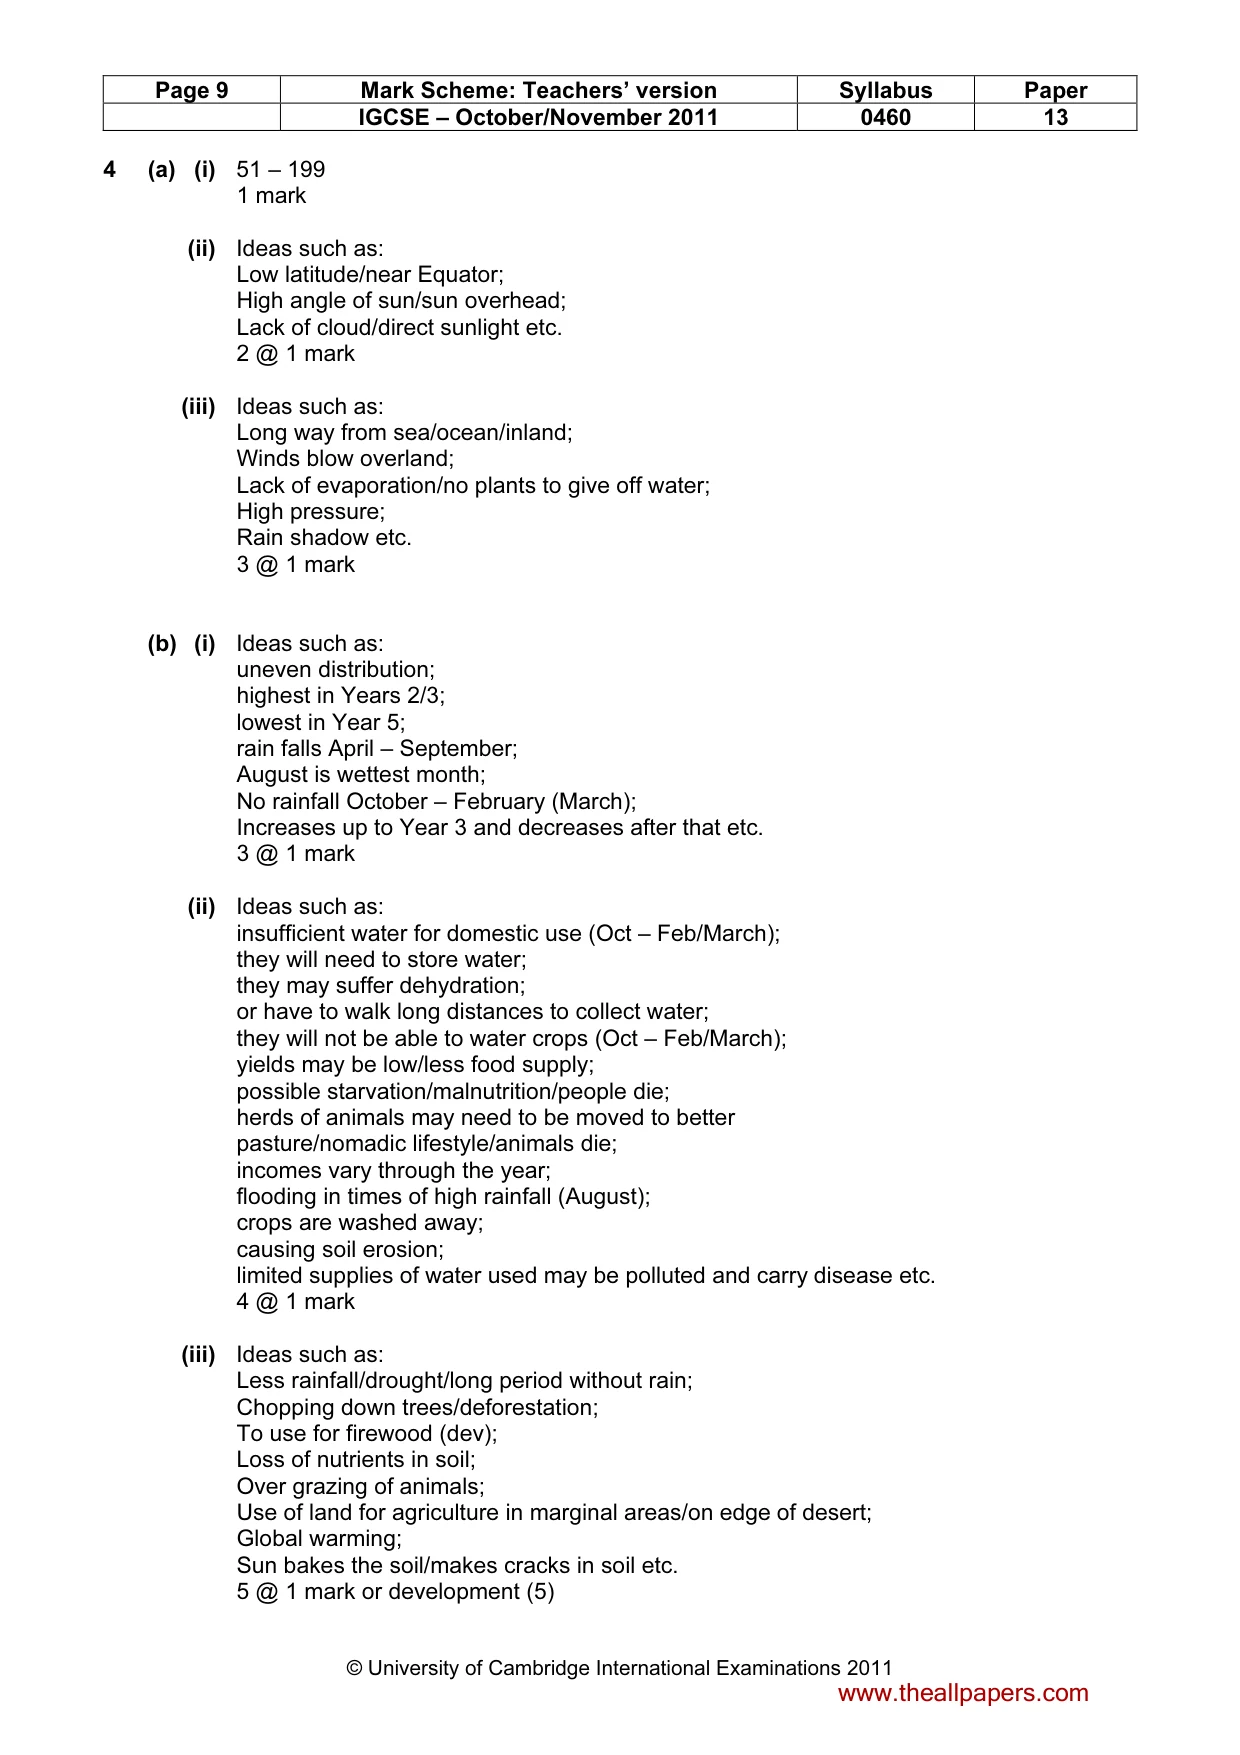
Page 9 Mark Scheme: Teachers’ version Syllabus Paper IGCSE – October/November 2011 0460 13 © University of Cambridge International Examinations 2011 4 (a) (i) 51 – 199 1 mark (ii) Ideas such as: Low latitude/near Equator; High angle of sun/sun overhead; Lack of cloud/direct sunlight etc. 2 @ 1 mark (iii) Ideas such as: Long way from sea/ocean/inland; Winds blow overland; Lack of evaporation/no plants to give off water; High pressure; Rain shadow etc. 3 @ 1 mark (b) (i) Ideas such as: uneven distribution; highest in Years 2/3; lowest in Year 5; rain falls April – September; August is wettest month; No rainfall October – February (March); Increases up to Year 3 and decreases after that etc. 3 @ 1 mark (ii) Ideas such as: insufficient water for domestic use (Oct – Feb/March); they will need to store water; they may suffer dehydration; or have to walk long distances to collect water; they will not be able to water crops (Oct – Feb/March); yields may be low/less food supply; possible starvation/malnutrition/people die; herds of animals may need to be moved to better pasture/nomadic lifestyle/animals die; incomes vary through the year; flooding in times of high rainfall (August); crops are washed away; causing soil erosion; limited supplies of water used may be polluted and carry disease etc. 4 @ 1 mark (iii) Ideas such as: Less rainfall/drought/long period without rain; Chopping down trees/deforestation; To use for firewood (dev); Loss of nutrients in soil; Over grazing of animals; Use of land for agriculture in marginal areas/on edge of desert; Global warming; Sun bakes the soil/makes cracks in soil etc. 5 @ 1 mark or development (5) www.theallpapers.com
Mark scheme, page 10
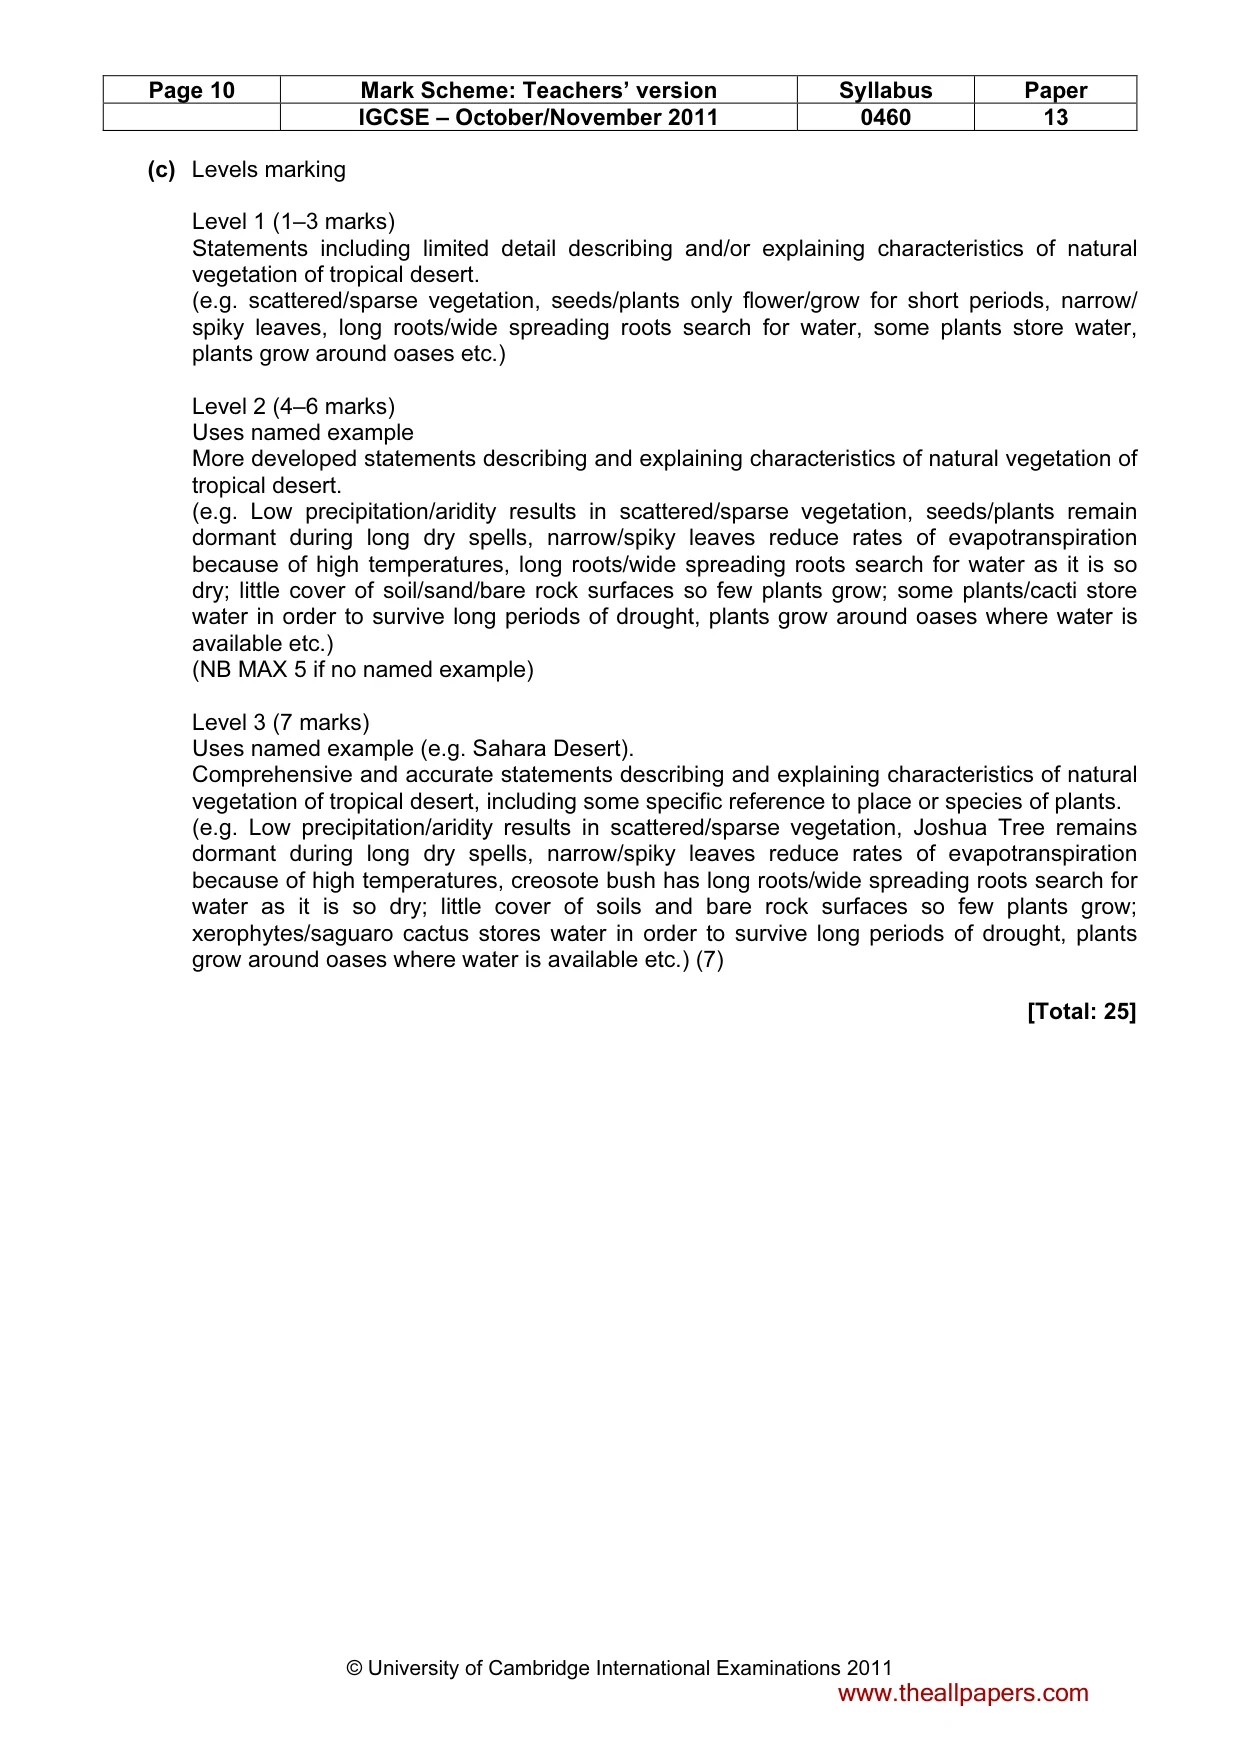
Page 10 Mark Scheme: Teachers’ version Syllabus Paper IGCSE – October/November 2011 0460 13 © University of Cambridge International Examinations 2011 (c) Levels marking Level 1 (1–3 marks) Statements including limited detail describing and/or explaining characteristics of natural vegetation of tropical desert. (e.g. scattered/sparse vegetation, seeds/plants only flower/grow for short periods, narrow/ spiky leaves, long roots/wide spreading roots search for water, some plants store water, plants grow around oases etc.) Level 2 (4–6 marks) Uses named example More developed statements describing and explaining characteristics of natural vegetation of tropical desert. (e.g. Low precipitation/aridity results in scattered/sparse vegetation, seeds/plants remain dormant during long dry spells, narrow/spiky leaves reduce rates of evapotranspiration because of high temperatures, long roots/wide spreading roots search for water as it is so dry; little cover of soil/sand/bare rock surfaces so few plants grow; some plants/cacti store water in order to survive long periods of drought, plants grow around oases where water is available etc.) (NB MAX 5 if no named example) Level 3 (7 marks) Uses named example (e.g. Sahara Desert). Comprehensive and accurate statements describing and explaining characteristics of natural vegetation of tropical desert, including some specific reference to place or species of plants. (e.g. Low precipitation/aridity results in scattered/sparse vegetation, Joshua Tree remains dormant during long dry spells, narrow/spiky leaves reduce rates of evapotranspiration because of high temperatures, creosote bush has long roots/wide spreading roots search for water as it is so dry; little cover of soils and bare rock surfaces so few plants grow; xerophytes/saguaro cactus stores water in order to survive long periods of drought, plants grow around oases where water is available etc.) (7) [Total: 25] www.theallpapers.com
Mark scheme, page 11
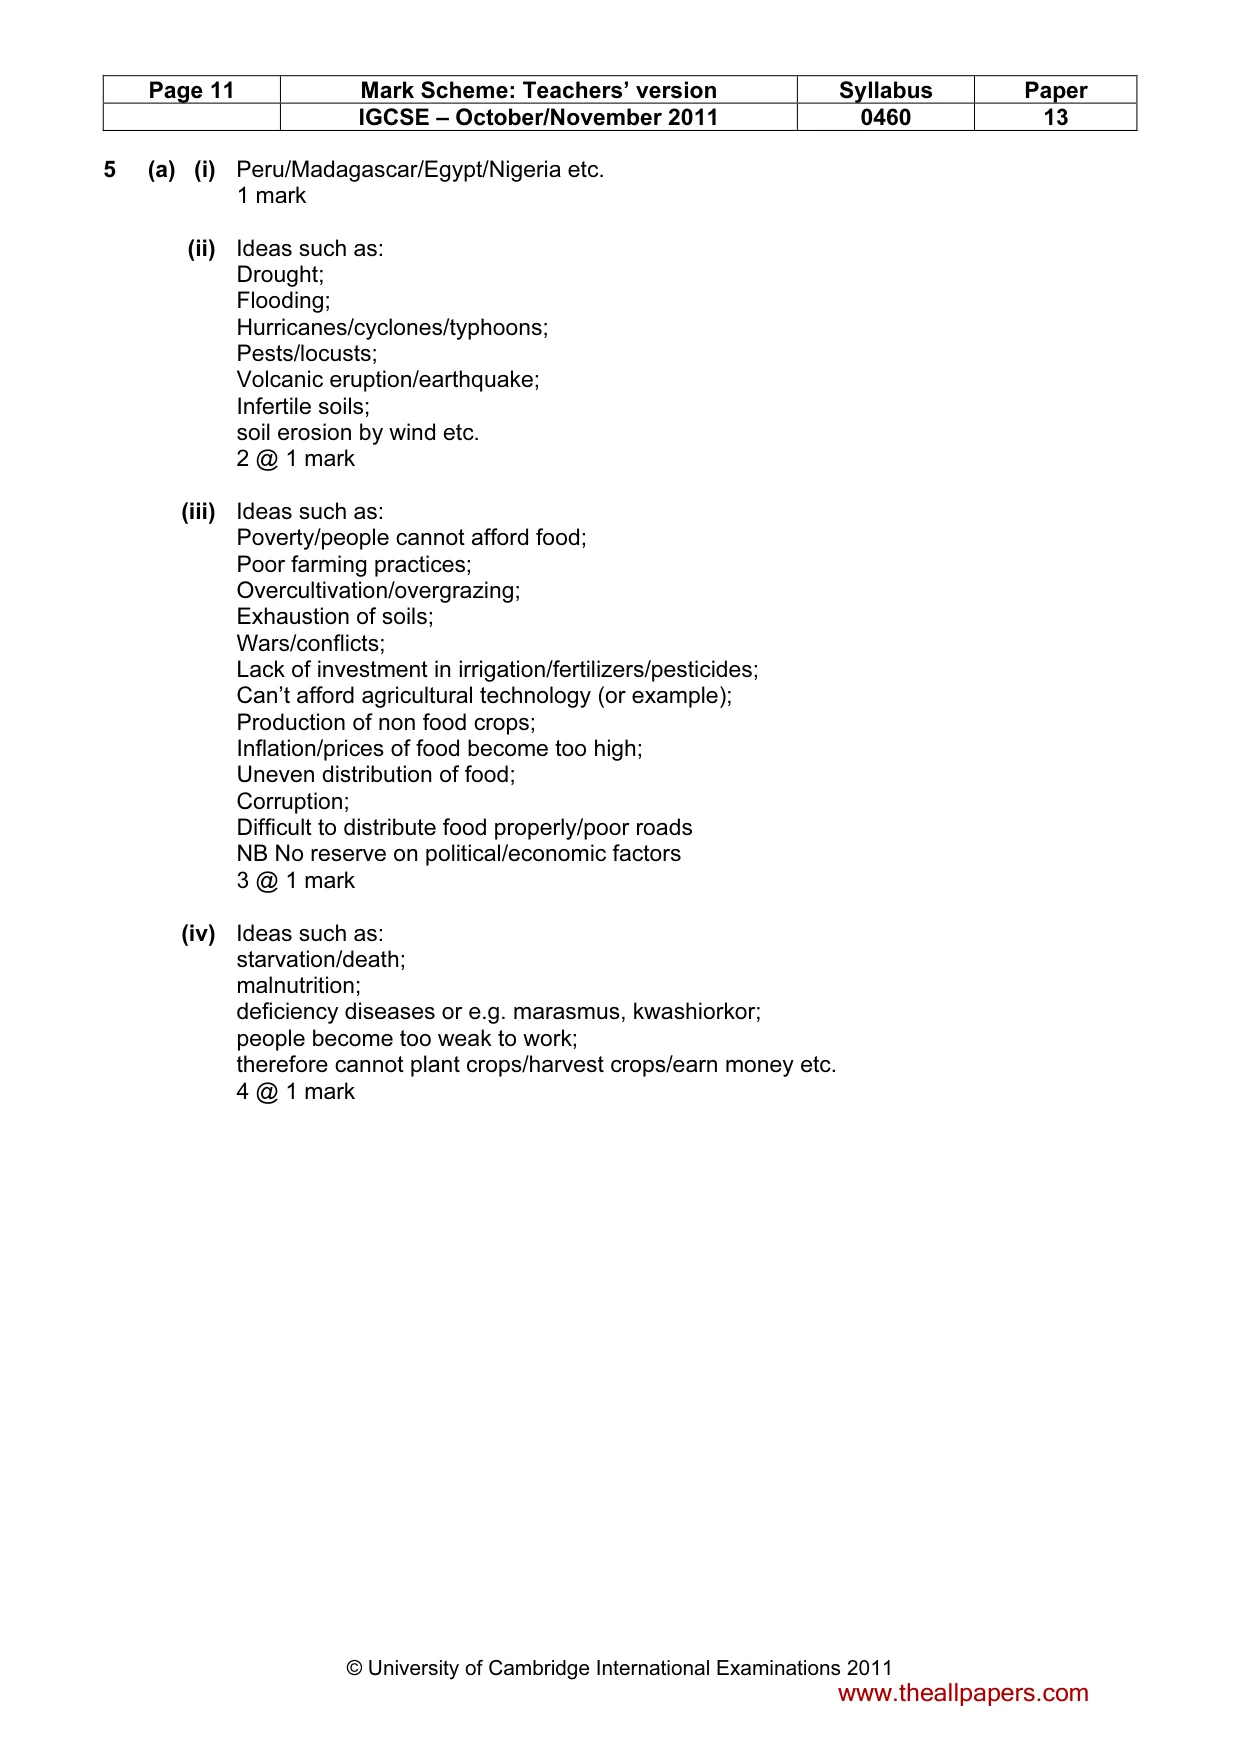
Page 11 Mark Scheme: Teachers’ version Syllabus Paper IGCSE – October/November 2011 0460 13 © University of Cambridge International Examinations 2011 5 (a) (i) Peru/Madagascar/Egypt/Nigeria etc. 1 mark (ii) Ideas such as: Drought; Flooding; Hurricanes/cyclones/typhoons; Pests/locusts; Volcanic eruption/earthquake; Infertile soils; soil erosion by wind etc. 2 @ 1 mark (iii) Ideas such as: Poverty/people cannot afford food; Poor farming practices; Overcultivation/overgrazing; Exhaustion of soils; Wars/conflicts; Lack of investment in irrigation/fertilizers/pesticides; Can’t afford agricultural technology (or example); Production of non food crops; Inflation/prices of food become too high; Uneven distribution of food; Corruption; Difficult to distribute food properly/poor roads NB No reserve on political/economic factors 3 @ 1 mark (iv) Ideas such as: starvation/death; malnutrition; deficiency diseases or e.g. marasmus, kwashiorkor; people become too weak to work; therefore cannot plant crops/harvest crops/earn money etc. 4 @ 1 mark www.theallpapers.com
Mark scheme, page 12
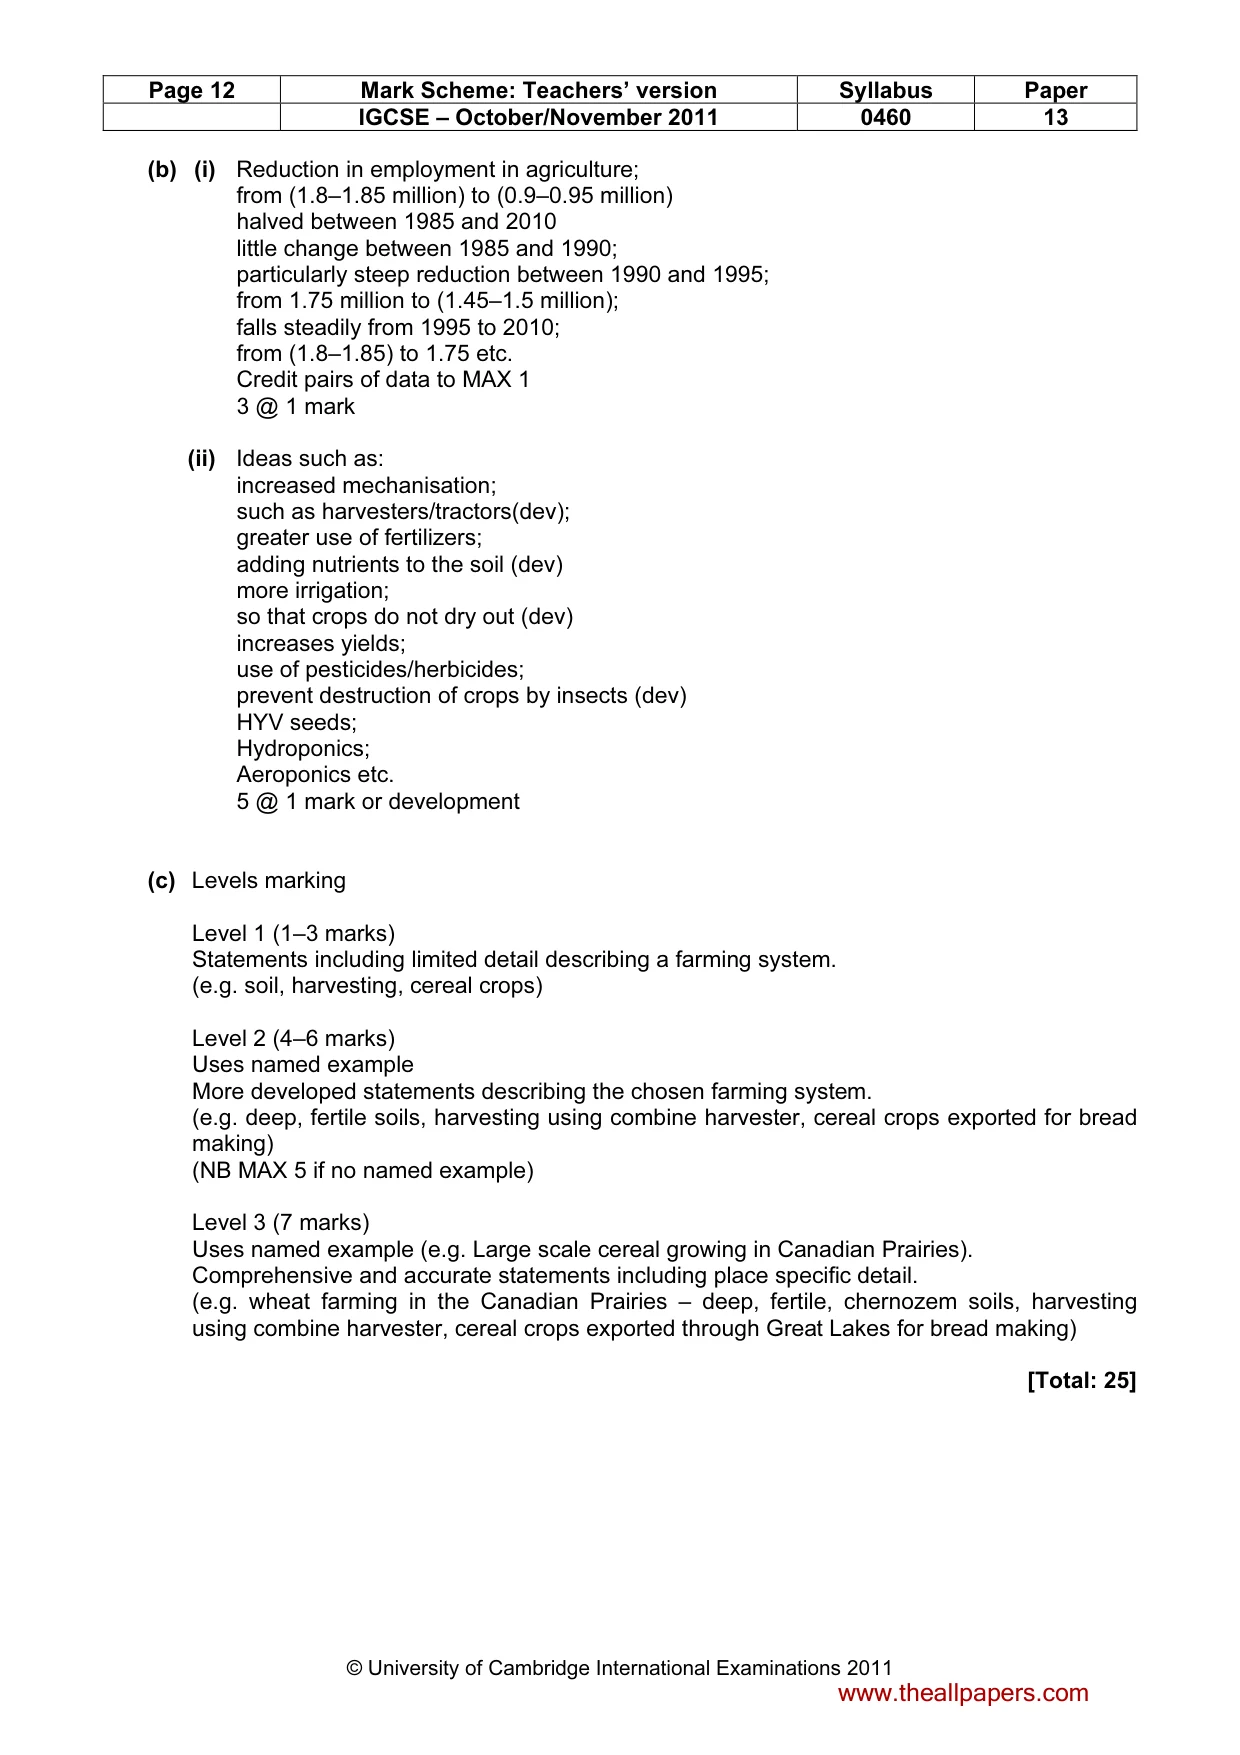
Page 12 Mark Scheme: Teachers’ version Syllabus Paper IGCSE – October/November 2011 0460 13 © University of Cambridge International Examinations 2011 (b) (i) Reduction in employment in agriculture; from (1.8–1.85 million) to (0.9–0.95 million) halved between 1985 and 2010 little change between 1985 and 1990; particularly steep reduction between 1990 and 1995; from 1.75 million to (1.45–1.5 million); falls steadily from 1995 to 2010; from (1.8–1.85) to 1.75 etc. Credit pairs of data to MAX 1 3 @ 1 mark (ii) Ideas such as: increased mechanisation; such as harvesters/tractors(dev); greater use of fertilizers; adding nutrients to the soil (dev) more irrigation; so that crops do not dry out (dev) increases yields; use of pesticides/herbicides; prevent destruction of crops by insects (dev) HYV seeds; Hydroponics; Aeroponics etc. 5 @ 1 mark or development (c) Levels marking Level 1 (1–3 marks) Statements including limited detail describing a farming system. (e.g. soil, harvesting, cereal crops) Level 2 (4–6 marks) Uses named example More developed statements describing the chosen farming system. (e.g. deep, fertile soils, harvesting using combine harvester, cereal crops exported for bread making) (NB MAX 5 if no named example) Level 3 (7 marks) Uses named example (e.g. Large scale cereal growing in Canadian Prairies). Comprehensive and accurate statements including place specific detail. (e.g. wheat farming in the Canadian Prairies – deep, fertile, chernozem soils, harvesting using combine harvester, cereal crops exported through Great Lakes for bread making) [Total: 25] www.theallpapers.com
Mark scheme, page 13
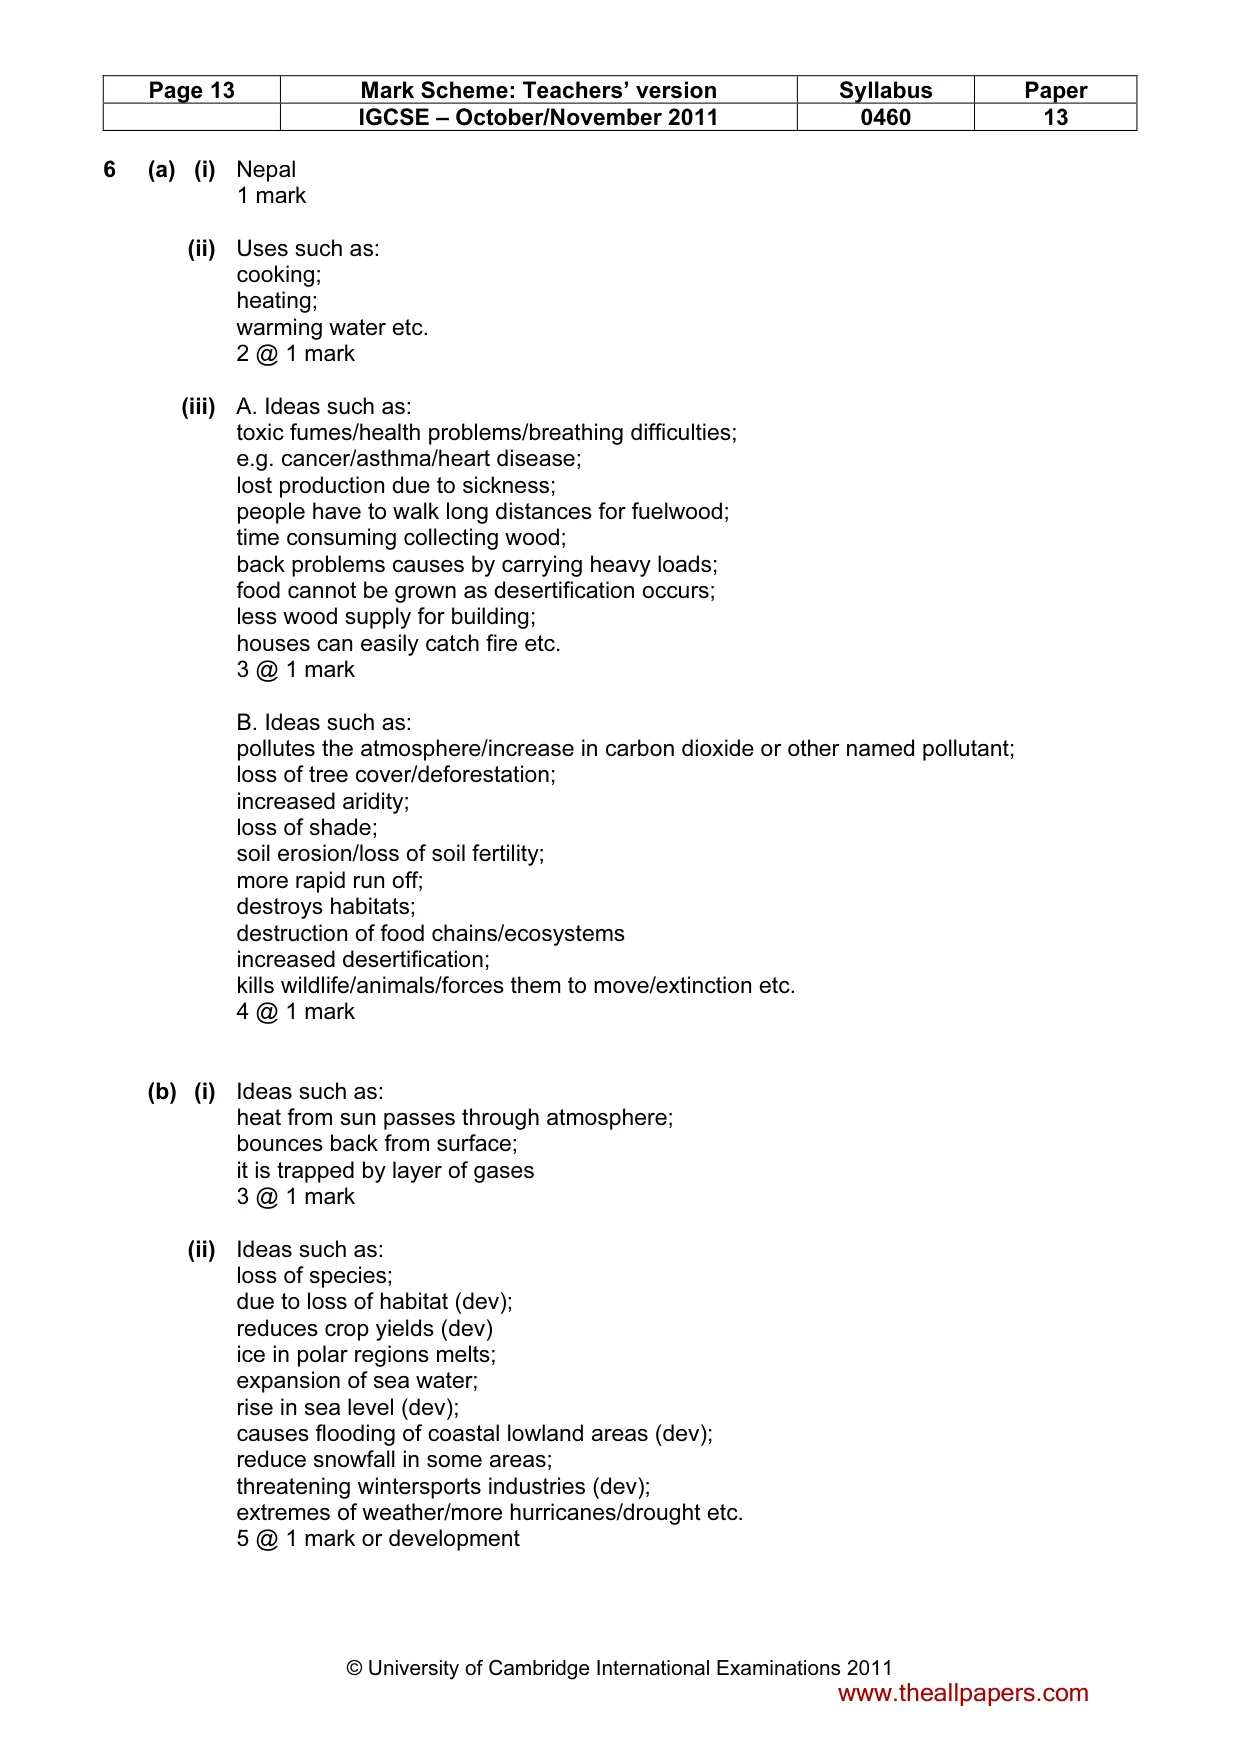
Page 13 Mark Scheme: Teachers’ version Syllabus Paper IGCSE – October/November 2011 0460 13 © University of Cambridge International Examinations 2011 6 (a) (i) Nepal 1 mark (ii) Uses such as: cooking; heating; warming water etc. 2 @ 1 mark (iii) A. Ideas such as: toxic fumes/health problems/breathing difficulties; e.g. cancer/asthma/heart disease; lost production due to sickness; people have to walk long distances for fuelwood; time consuming collecting wood; back problems causes by carrying heavy loads; food cannot be grown as desertification occurs; less wood supply for building; houses can easily catch fire etc. 3 @ 1 mark B. Ideas such as: pollutes the atmosphere/increase in carbon dioxide or other named pollutant; loss of tree cover/deforestation; increased aridity; loss of shade; soil erosion/loss of soil fertility; more rapid run off; destroys habitats; destruction of food chains/ecosystems increased desertification; kills wildlife/animals/forces them to move/extinction etc. 4 @ 1 mark (b) (i) Ideas such as: heat from sun passes through atmosphere; bounces back from surface; it is trapped by layer of gases 3 @ 1 mark (ii) Ideas such as: loss of species; due to loss of habitat (dev); reduces crop yields (dev) ice in polar regions melts; expansion of sea water; rise in sea level (dev); causes flooding of coastal lowland areas (dev); reduce snowfall in some areas; threatening wintersports industries (dev); extremes of weather/more hurricanes/drought etc. 5 @ 1 mark or development www.theallpapers.com
Mark scheme, page 14
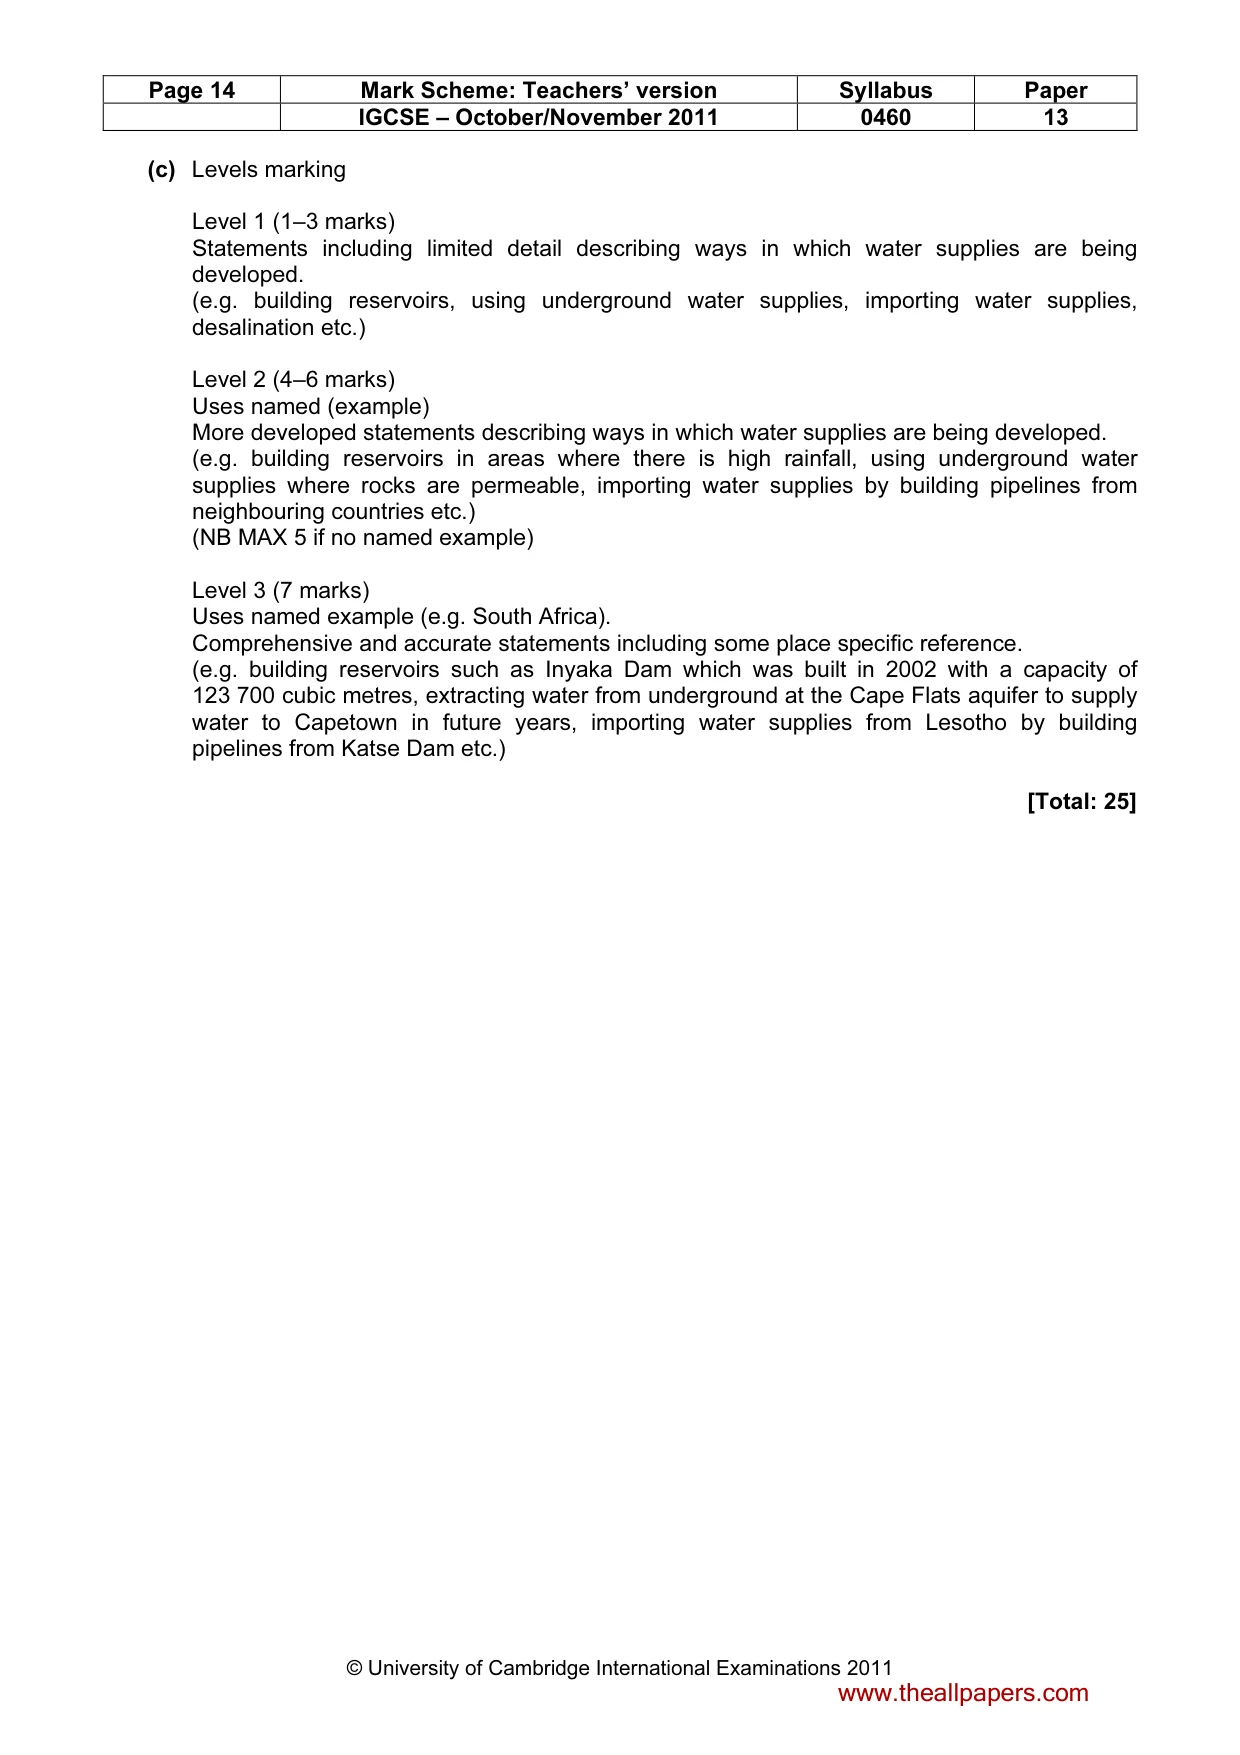
Page 14 Mark Scheme: Teachers’ version Syllabus Paper IGCSE – October/November 2011 0460 13 © University of Cambridge International Examinations 2011 (c) Levels marking Level 1 (1–3 marks) Statements including limited detail describing ways in which water supplies are being developed. (e.g. building reservoirs, using underground water supplies, importing water supplies, desalination etc.) Level 2 (4–6 marks) Uses named (example) More developed statements describing ways in which water supplies are being developed. (e.g. building reservoirs in areas where there is high rainfall, using underground water supplies where rocks are permeable, importing water supplies by building pipelines from neighbouring countries etc.) (NB MAX 5 if no named example) Level 3 (7 marks) Uses named example (e.g. South Africa). Comprehensive and accurate statements including some place specific reference. (e.g. building reservoirs such as Inyaka Dam which was built in 2002 with a capacity of 123 700 cubic metres, extracting water from underground at the Cape Flats aquifer to supply water to Capetown in future years, importing water supplies from Lesotho by building pipelines from Katse Dam etc.) [Total: 25] www.theallpapers.com
What you needed in this session
Cambridge’s own grade thresholds for 2011 Oct/Nov, Paper 1 · Variant 3. A higher threshold means an easier paper — the bar moves with how the cohort did.