Cambridge IGCSE Geography 0460 — 2010 Oct/Nov Paper 1 · Variant 1
0460/11/O/N/10 · 75 marks · ≈84 min
The question paper and its mark scheme, free to read here and free to download. This is Cambridge’s own paper, exactly as it was sat.
Question paper11 pages


Mark scheme12 pages
Answers below. Sit the paper first if you are practising.
Paper as text
Question paper, page 1
UNIVERSITY OF CAMBRIDGE INTERNATIONAL EXAMINATIONS International General Certificate of Secondary Education * 2 3 8 9 3 1 0 3 3 0 * GEOGRAPHY 0460/11 Paper 1 October/November 2010 1 hour 45 minutes Additional Materials: Answer Booklet/Paper This document consists of 12 printed pages and 1 Insert. DC (DR/DR) 11725/5 © UCLES 2010 [Turn over READ THESE INSTRUCTIONS FIRST If you have been given an Answer Booklet, follow the instructions on the front cover of the Booklet. Write your Centre number, candidate number and name on all the work you hand in. Write in dark blue or black pen. You may use a soft pencil for any diagrams, graphs or rough working. Do not use staples, paper clips, highlighters, glue or correction fluid. Answer three questions. Sketch maps and diagrams should be drawn whenever they serve to illustrate an answer. The Insert contains Fig. 3 for Question 2, Photograph A for Question 3, Photograph B for Question 4 and Photographs C, D and E for Question 6. At the end of the examination, fasten all your work securely together. The number of marks is given in brackets [ ] at the end of each question or part question. www.theallpapers.com
Question paper, page 2
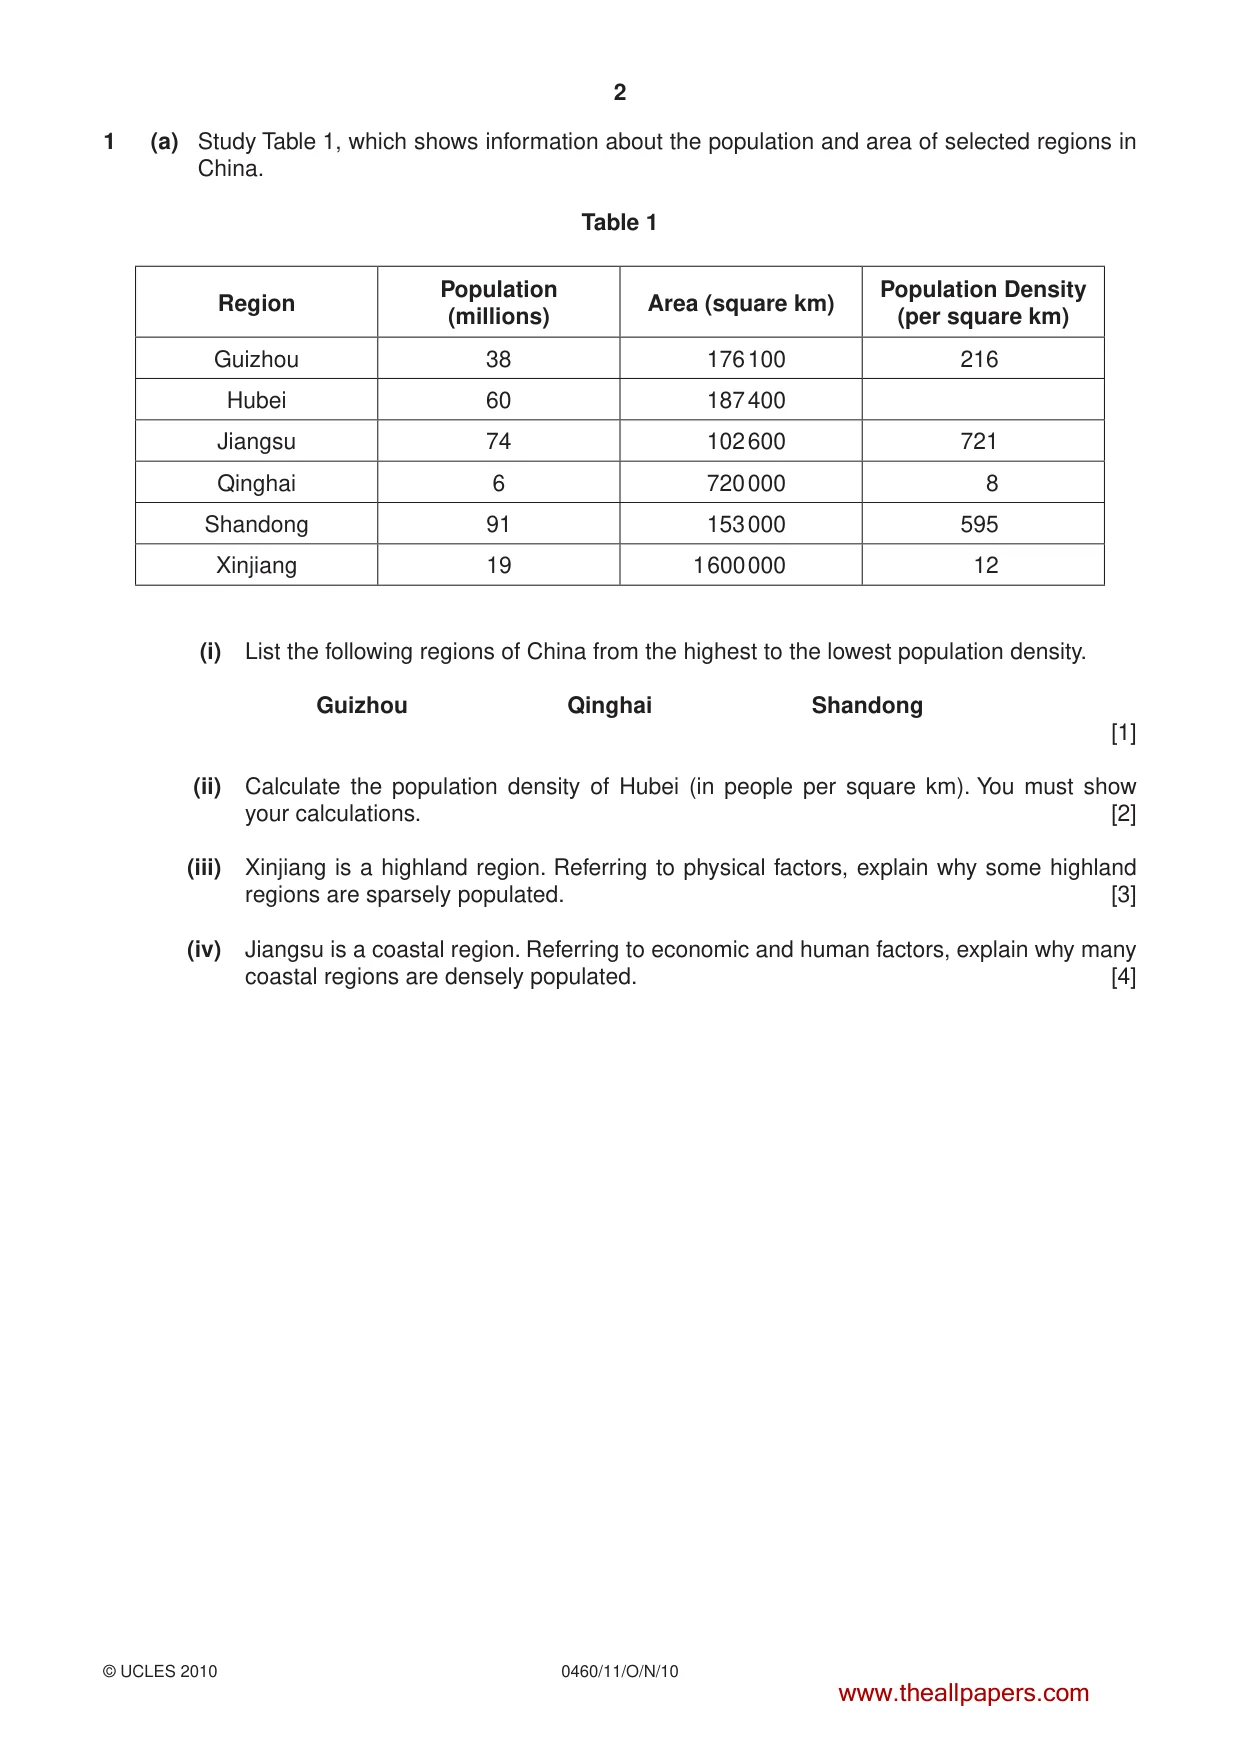
2 0460/11/O/N/10 © UCLES 2010 1 (a) Study Table 1, which shows information about the population and area of selected regions in China. Table 1 Region Population (millions) Area (square km) Population Density (per square km) Guizhou 38 176 100 216 Hubei 60 187 400 Jiangsu 74 102 600 721 Qinghai 6 720 000 8 Shandong 91 153 000 595 Xinjiang 19 1600000 12 (i) List the following regions of China from the highest to the lowest population density. Guizhou Qinghai Shandong [1] (ii) Calculate the population density of Hubei (in people per square km). You must show your calculations. [2] (iii) Xinjiang is a highland region. Referring to physical factors, explain why some highland regions are sparsely populated. [3] (iv) Jiangsu is a coastal region. Referring to economic and human factors, explain why many coastal regions are densely populated. [4] www.theallpapers.com
Question paper, page 3
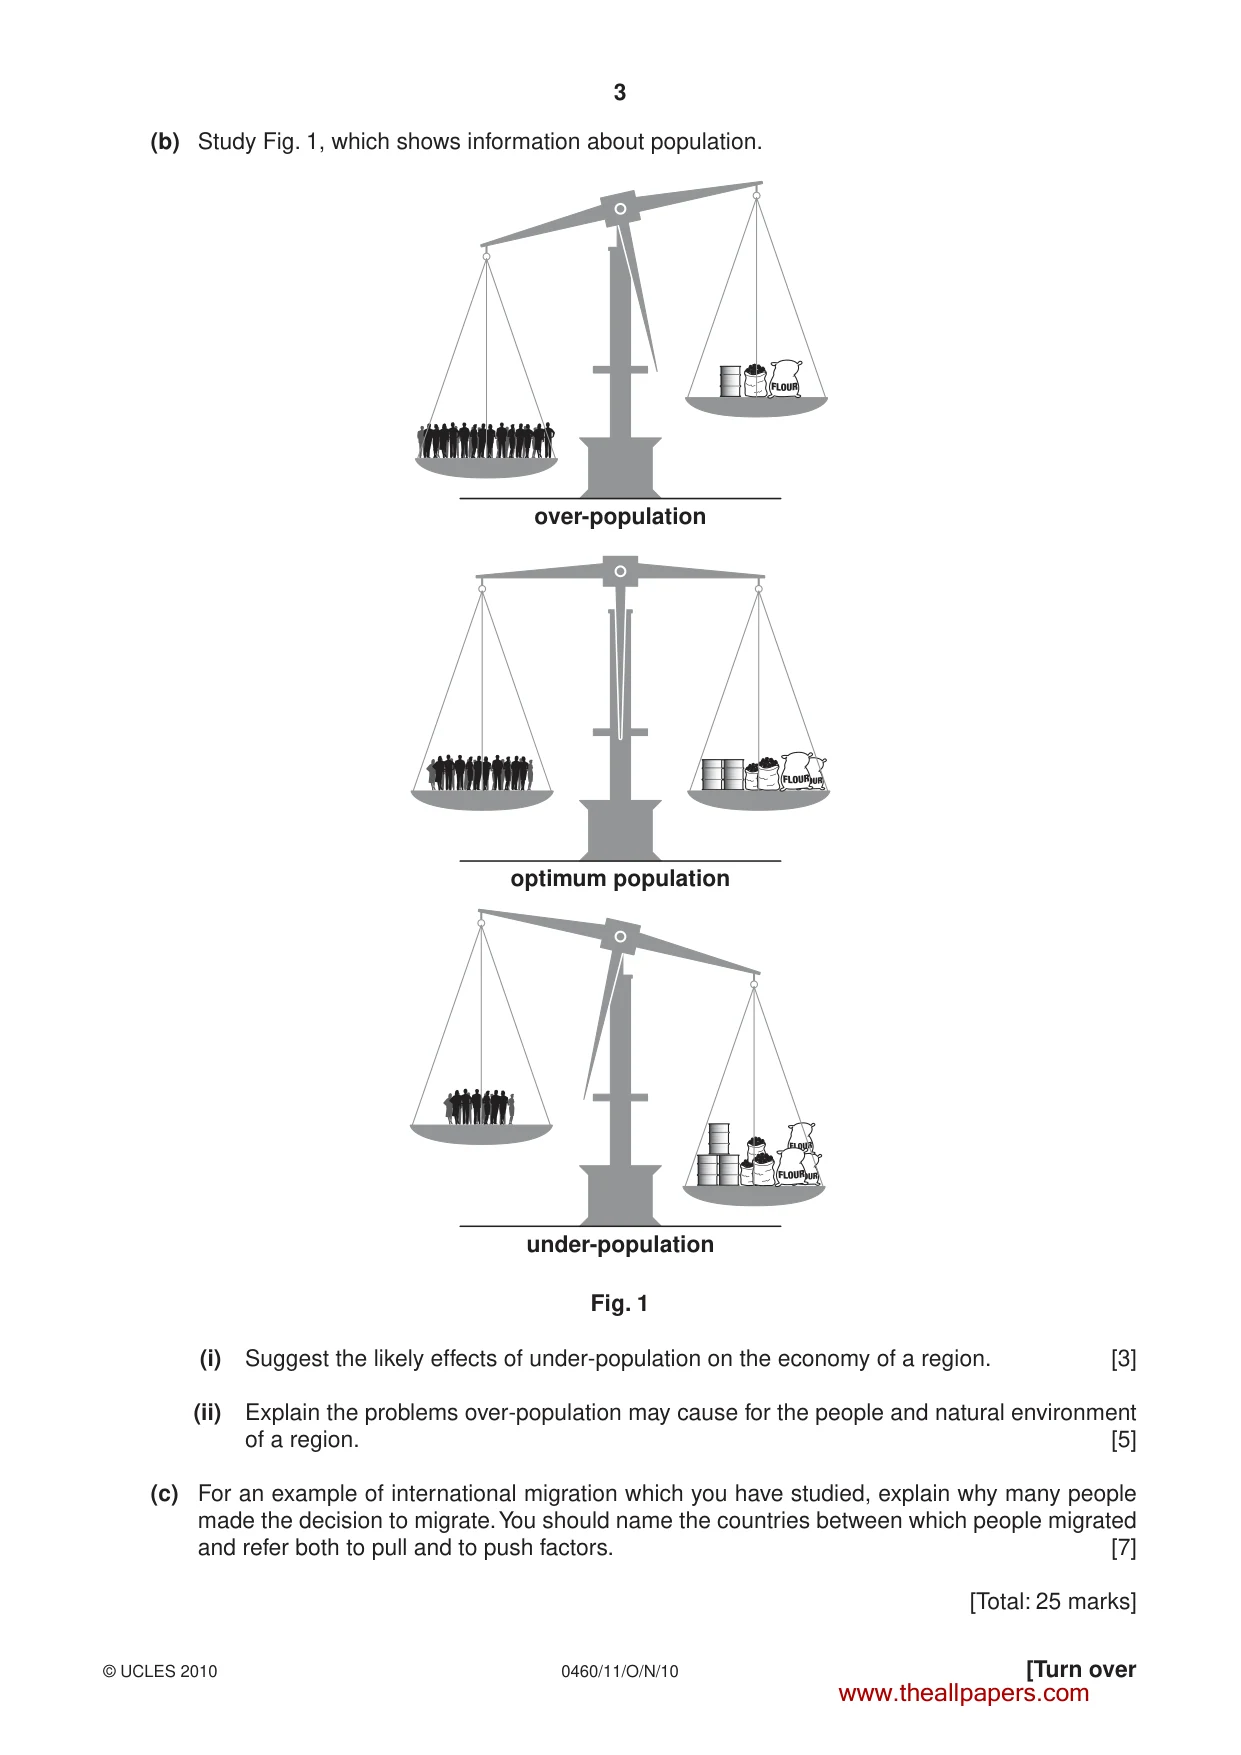
3 0460/11/O/N/10 © UCLES 2010 [Turn over (b) Study Fig. 1, which shows information about population. optimum population over-population under-population Fig. 1 (i) Suggest the likely effects of under-population on the economy of a region. [3] (ii) Explain the problems over-population may cause for the people and natural environment of a region. [5] (c) For an example of international migration which you have studied, explain why many people made the decision to migrate. You should name the countries between which people migrated and refer both to pull and to push factors. [7] [Total: 25 marks] www.theallpapers.com
Question paper, page 4
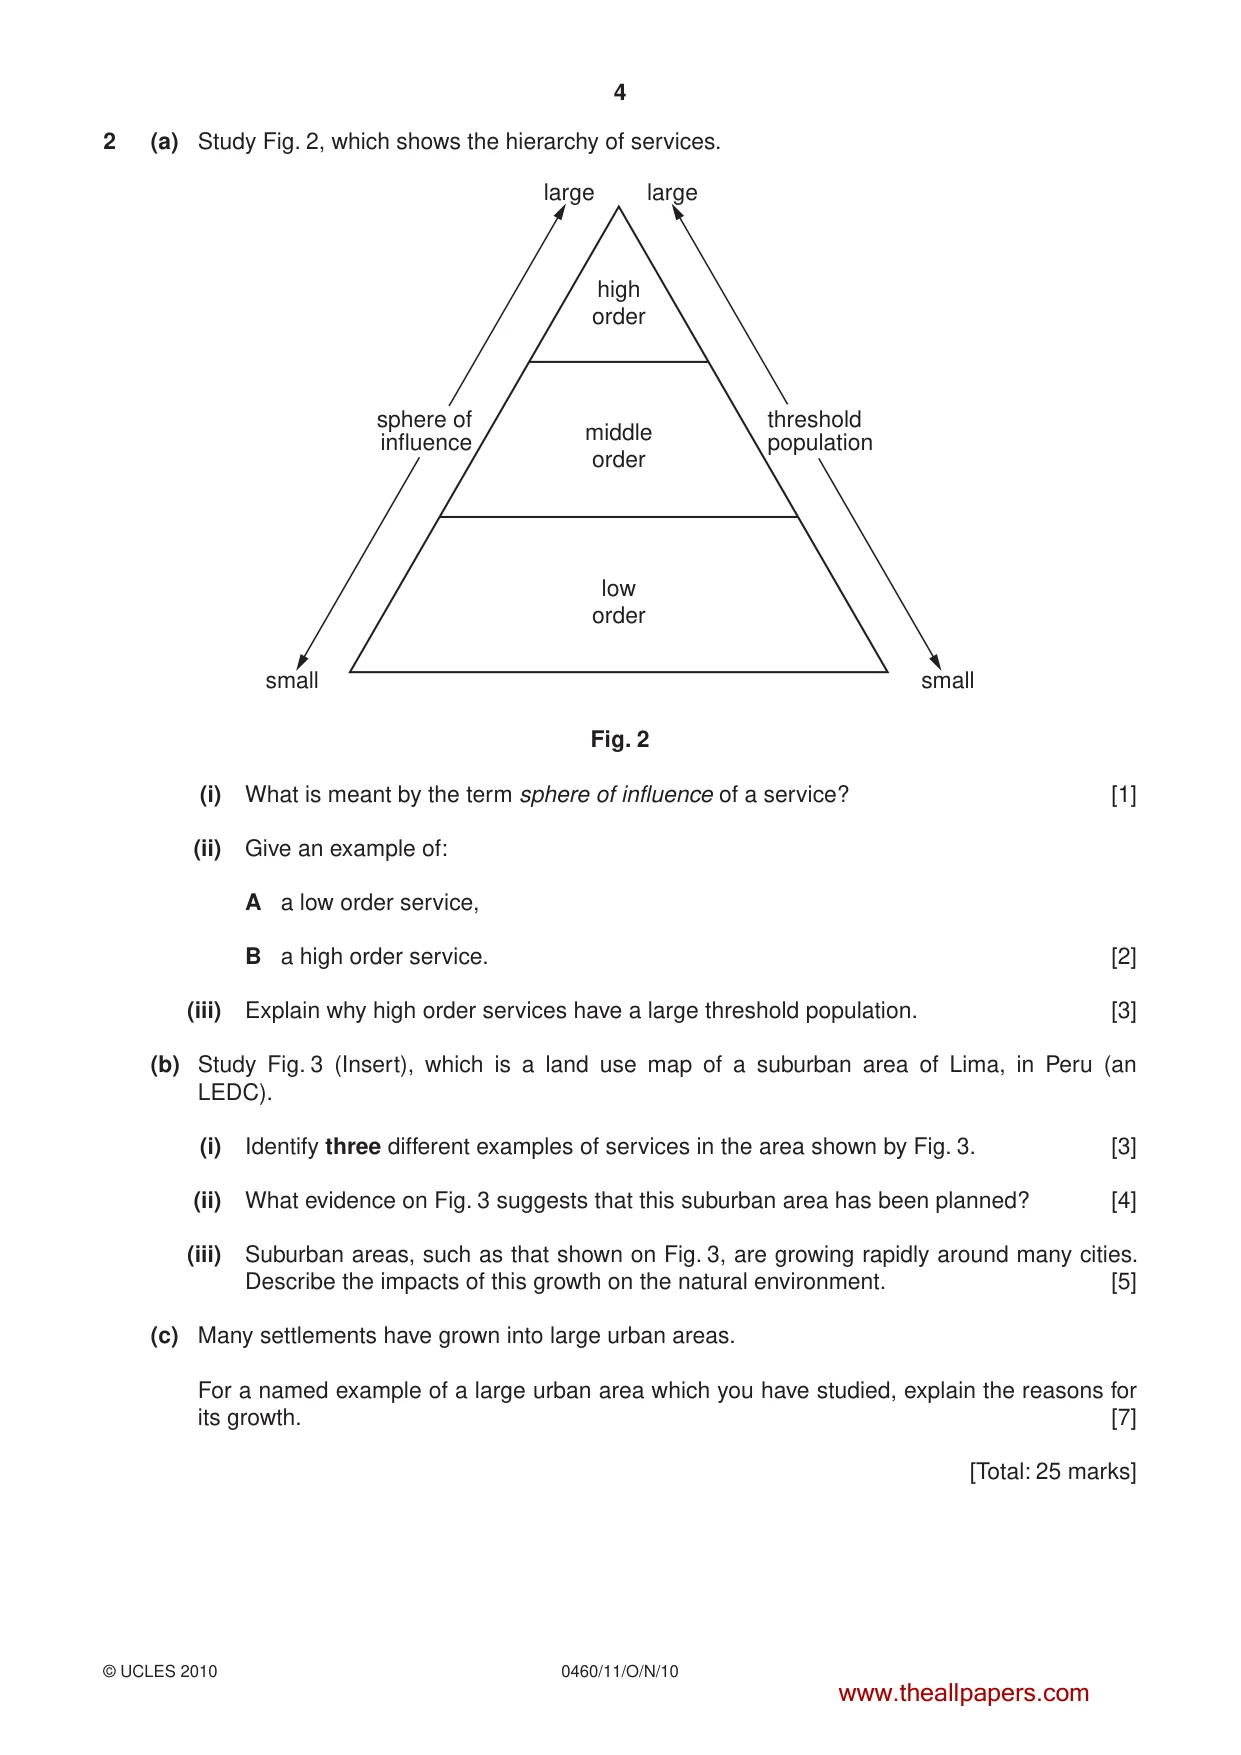
4 0460/11/O/N/10 © UCLES 2010 2 (a) Study Fig. 2, which shows the hierarchy of services. large large small small sphere of influence threshold population high order middle order low order Fig. 2 (i) What is meant by the term sphere of influence of a service? [1] (ii) Give an example of: A a low order service, B a high order service. [2] (iii) Explain why high order services have a large threshold population. [3] (b) Study Fig. 3 (Insert), which is a land use map of a suburban area of Lima, in Peru (an LEDC). (i) Identify three different examples of services in the area shown by Fig. 3. [3] (ii) What evidence on Fig. 3 suggests that this suburban area has been planned? [4] (iii) Suburban areas, such as that shown on Fig. 3, are growing rapidly around many cities. Describe the impacts of this growth on the natural environment. [5] (c) Many settlements have grown into large urban areas. For a named example of a large urban area which you have studied, explain the reasons for its growth. [7] [Total: 25 marks] www.theallpapers.com
Question paper, page 5
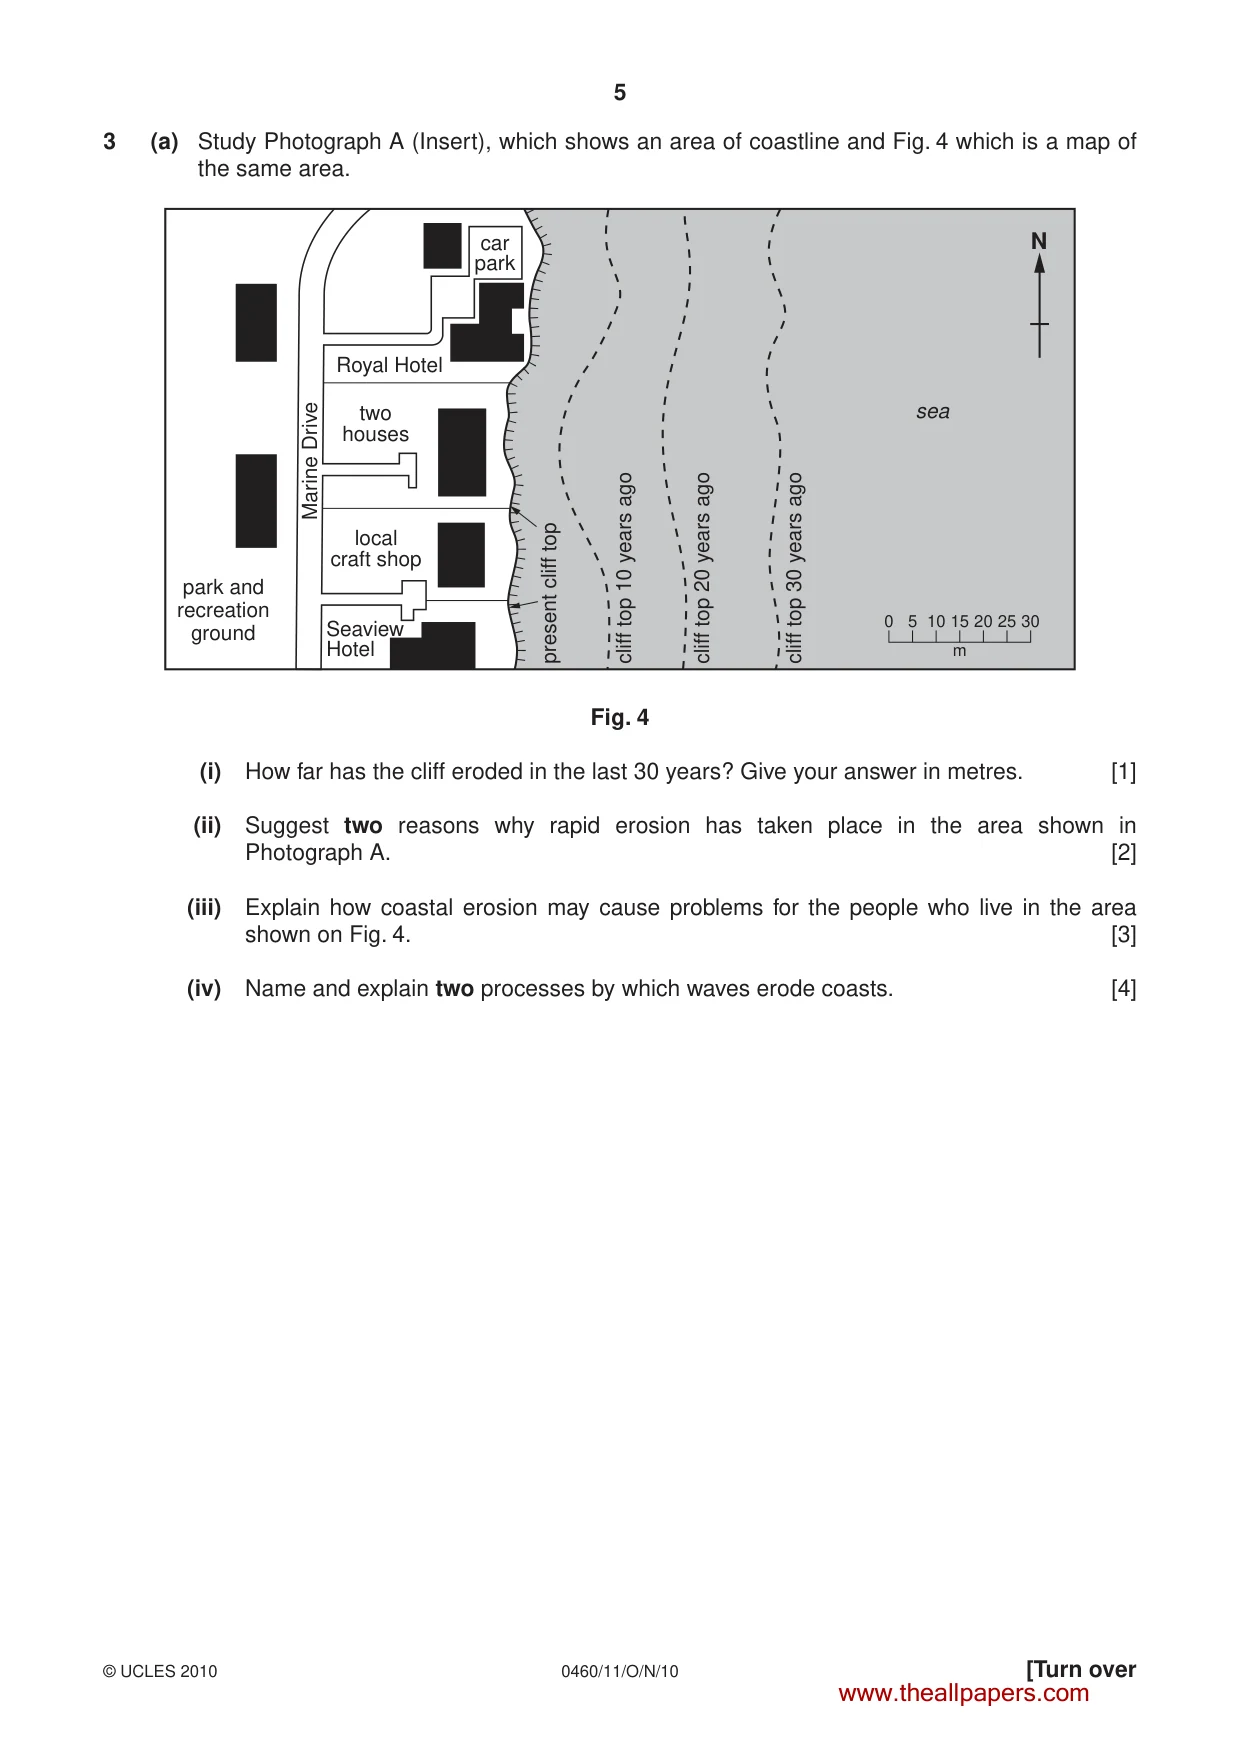
5 0460/11/O/N/10 © UCLES 2010 [Turn over 3 (a) Study Photograph A (Insert), which shows an area of coastline and Fig. 4 which is a map of the same area. car park Royal Hotel two houses local craft shop Seaview Hotel park and recreation ground sea present cliff top cliff top 10 years ago cliff top 20 years ago Marine Drive cliff top 30 years ago m 0 5 10 15 20 25 30 N Fig. 4 (i) How far has the cliff eroded in the last 30 years? Give your answer in metres. [1] (ii) Suggest two reasons why rapid erosion has taken place in the area shown in Photograph A. [2] (iii) Explain how coastal erosion may cause problems for the people who live in the area shown on Fig. 4. [3] (iv) Name and explain two processes by which waves erode coasts. [4] www.theallpapers.com
Question paper, page 6
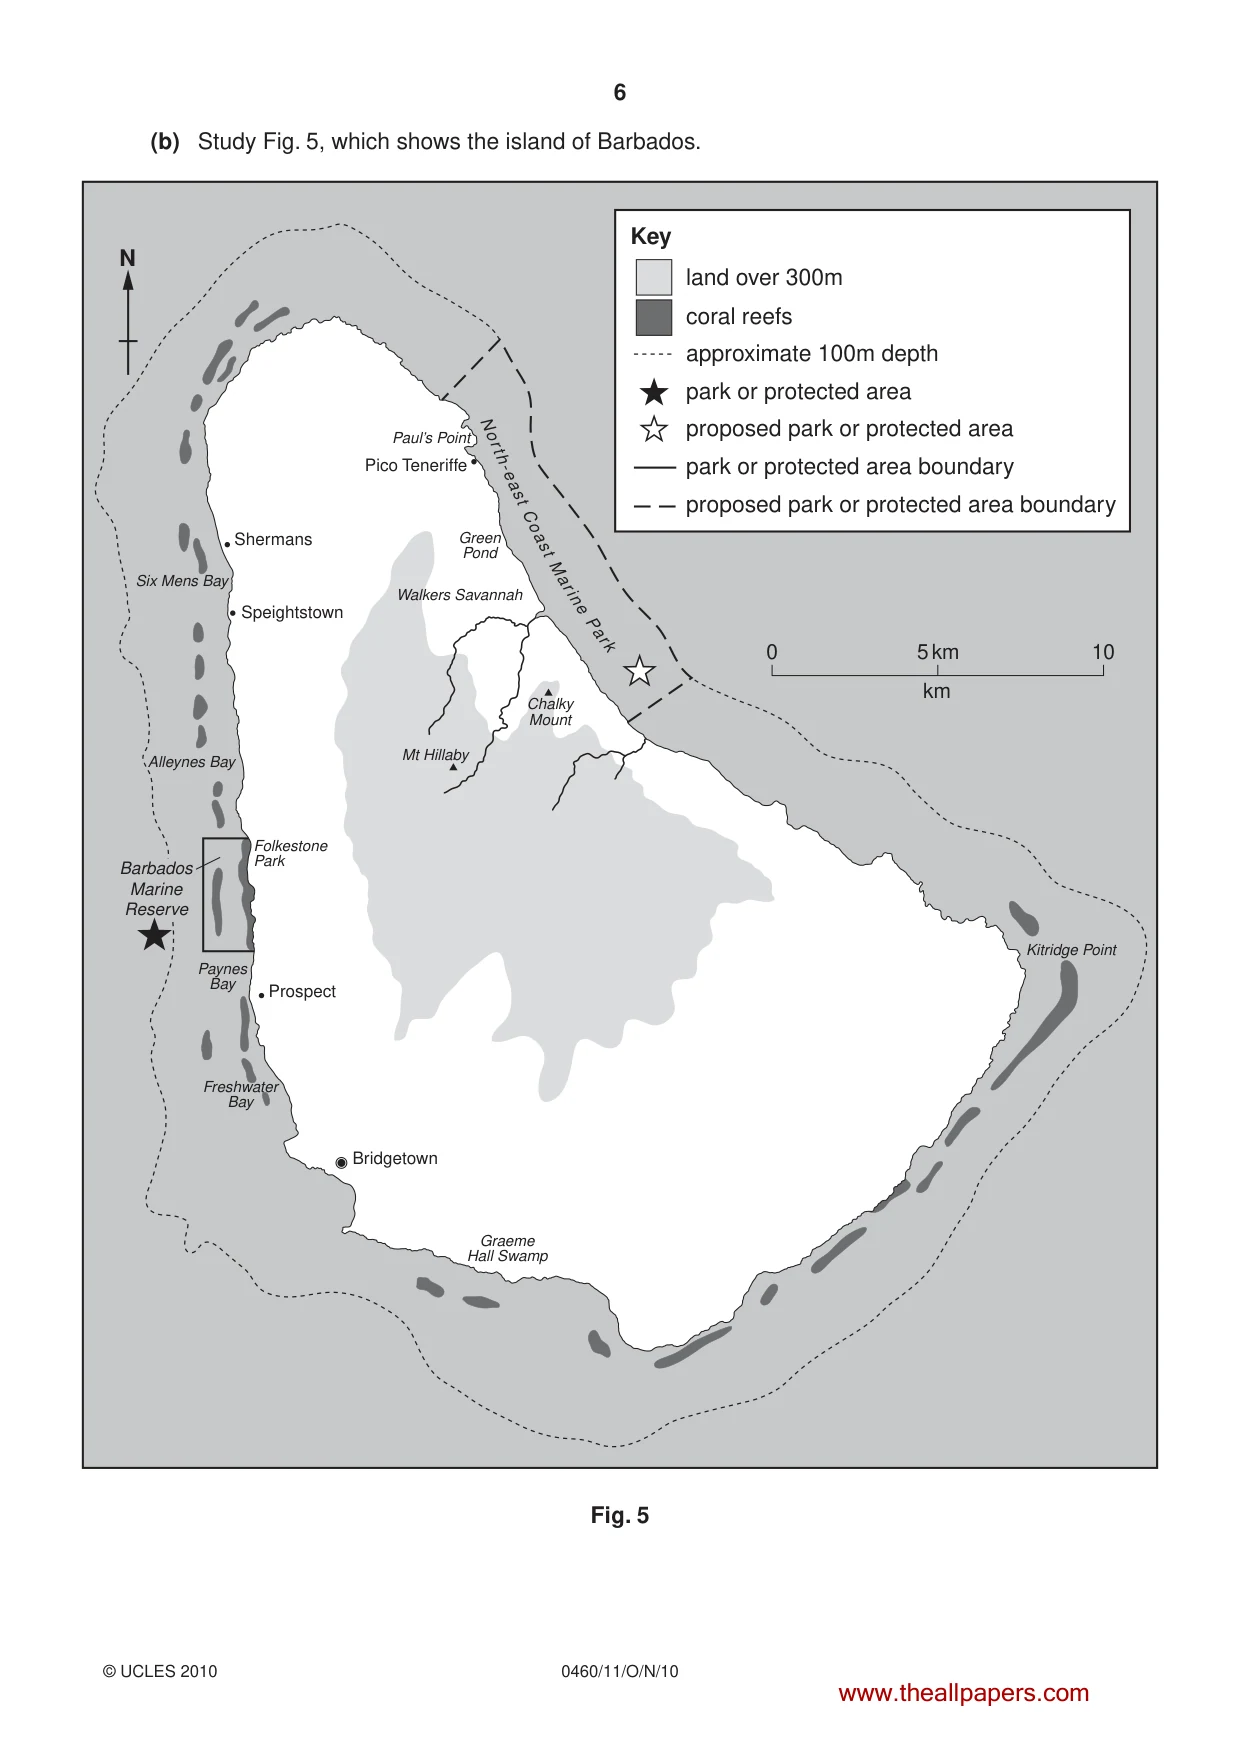
6 0460/11/O/N/10 © UCLES 2010 (b) Study Fig. 5, which shows the island of Barbados. Pico Teneriffe Shermans Speightstown Prospect Bridgetown Graeme Hall Swamp Green Pond Paul’s Point Walkers Savannah Kitridge Point Mt Hillaby Chalky Mount Paynes Bay Freshwater Bay Folkestone Park Six Mens Bay Alleynes Bay 0 5 km 10 km Key No rth-ea st Coast M arine Par k Barbados Marine Reserve land over 300m approximate 100m depth coral reefs park or protected area proposed park or protected area park or protected area boundary proposed park or protected area boundary N Fig. 5 www.theallpapers.com
Question paper, page 7
7 0460/11/O/N/10 © UCLES 2010 [Turn over (i) Describe the distribution of coral reefs shown on Fig. 5. [3] (ii) Describe the conditions required for the development of a coral reef. [5] (c) Explain how one of the following has formed in a named area which you have studied: • a spit; • an area of coastal sand dunes. You should use labelled diagrams in your answer. [7] [Total: 25 marks] www.theallpapers.com
Question paper, page 8
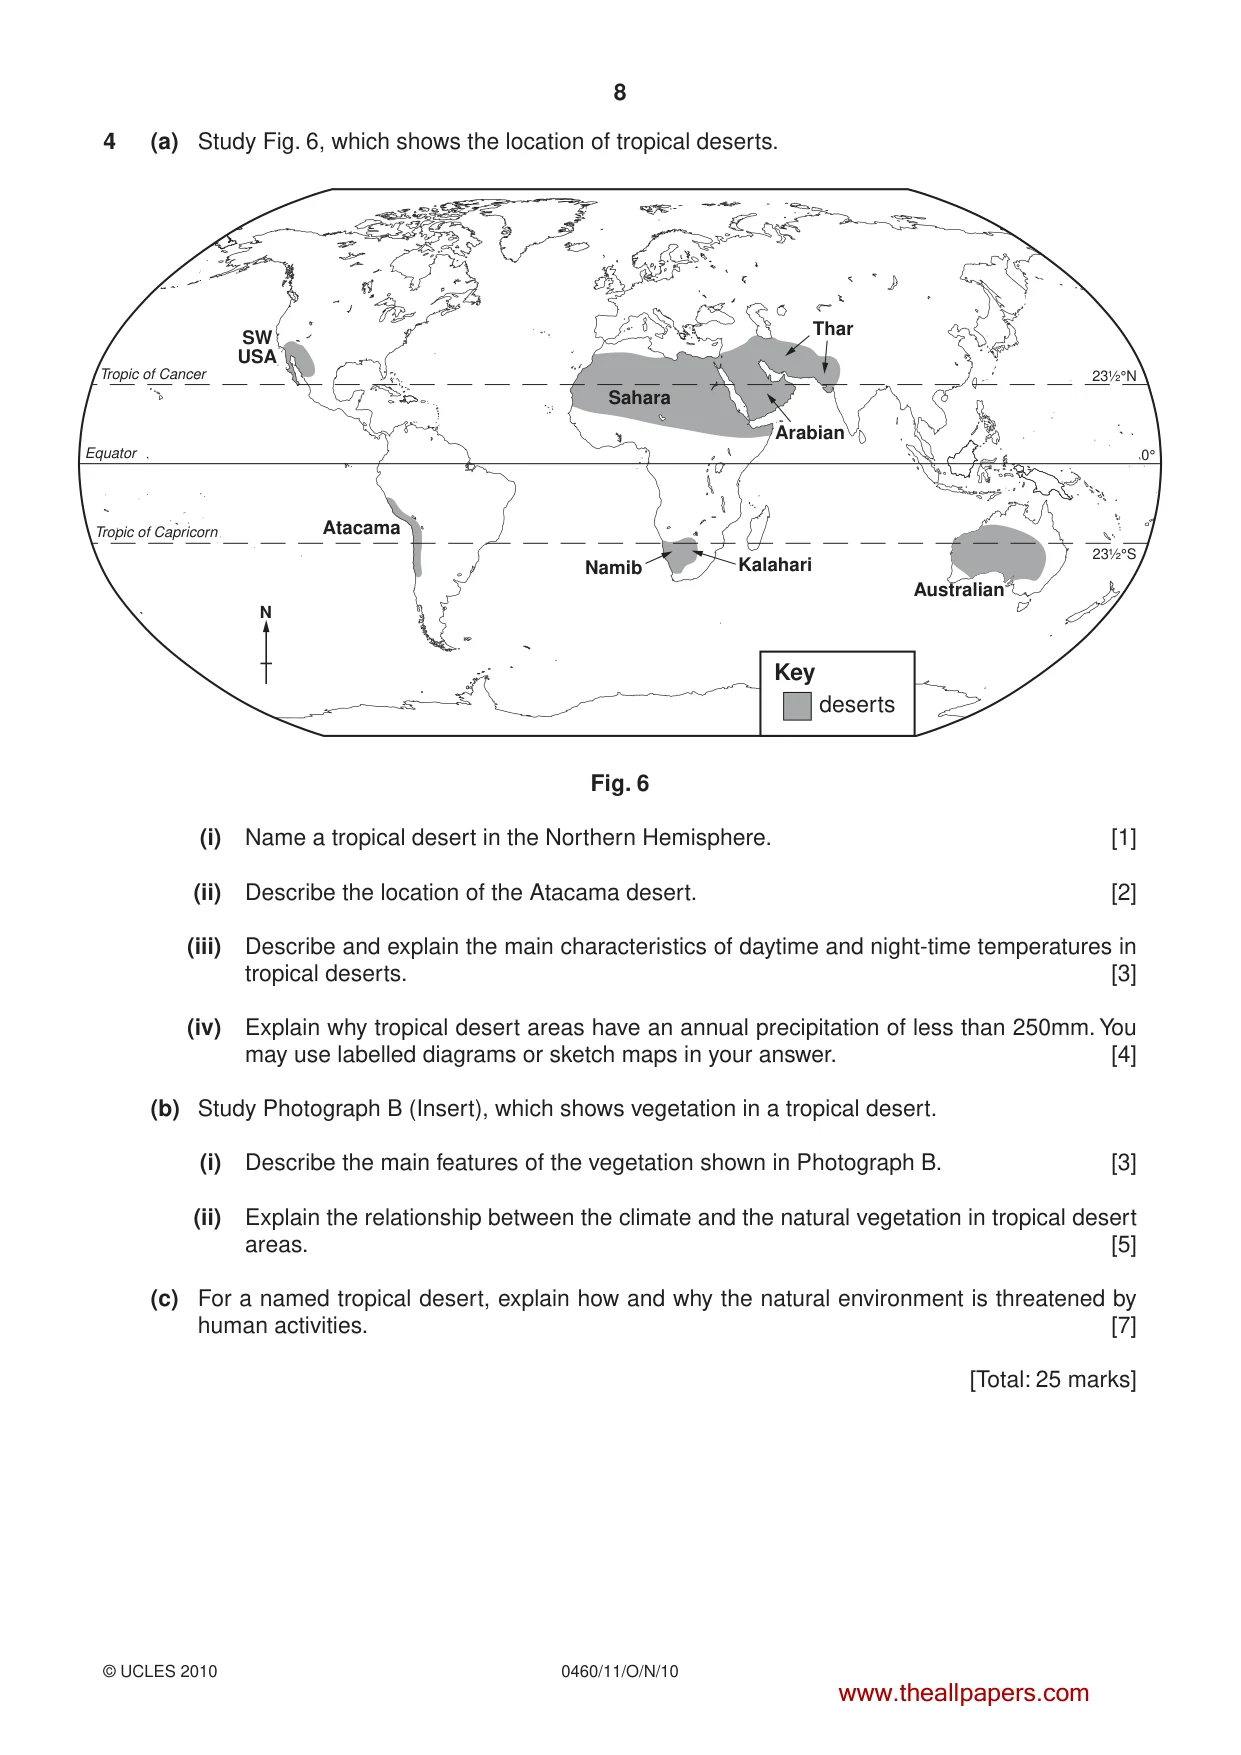
8 0460/11/O/N/10 © UCLES 2010 4 (a) Study Fig. 6, which shows the location of tropical deserts. 23½°N 0° 23½°S Tropic of Cancer Equator Tropic of Capricorn Key deserts N Thar Sahara Arabian Namib Kalahari Australian SW USA Atacama Fig. 6 (i) Name a tropical desert in the Northern Hemisphere. [1] (ii) Describe the location of the Atacama desert. [2] (iii) Describe and explain the main characteristics of daytime and night-time temperatures in tropical deserts. [3] (iv) Explain why tropical desert areas have an annual precipitation of less than 250mm. You may use labelled diagrams or sketch maps in your answer. [4] (b) Study Photograph B (Insert), which shows vegetation in a tropical desert. (i) Describe the main features of the vegetation shown in Photograph B. [3] (ii) Explain the relationship between the climate and the natural vegetation in tropical desert areas. [5] (c) For a named tropical desert, explain how and why the natural environment is threatened by human activities. [7] [Total: 25 marks] www.theallpapers.com
Question paper, page 9
Content removed due to copyright restrictions www.theallpapers.com
Question paper, page 10
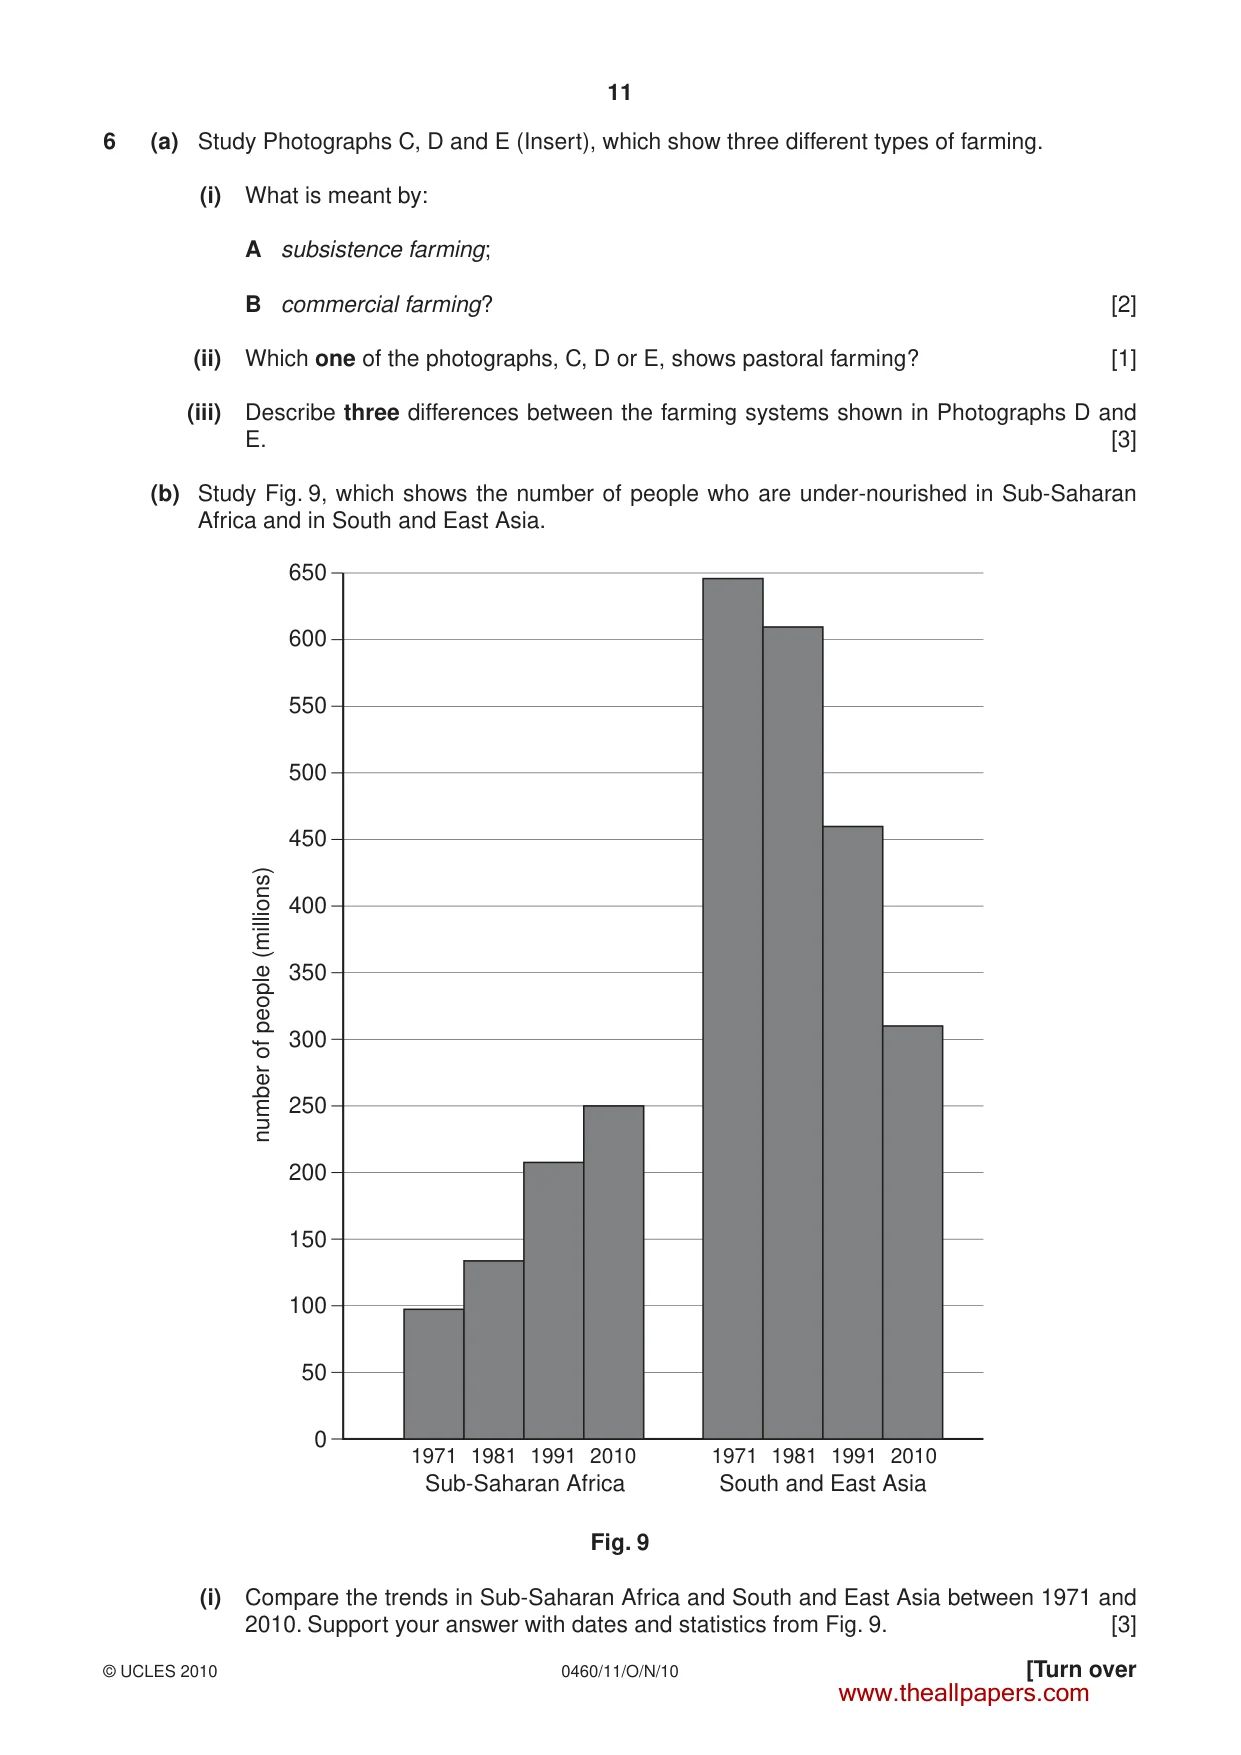
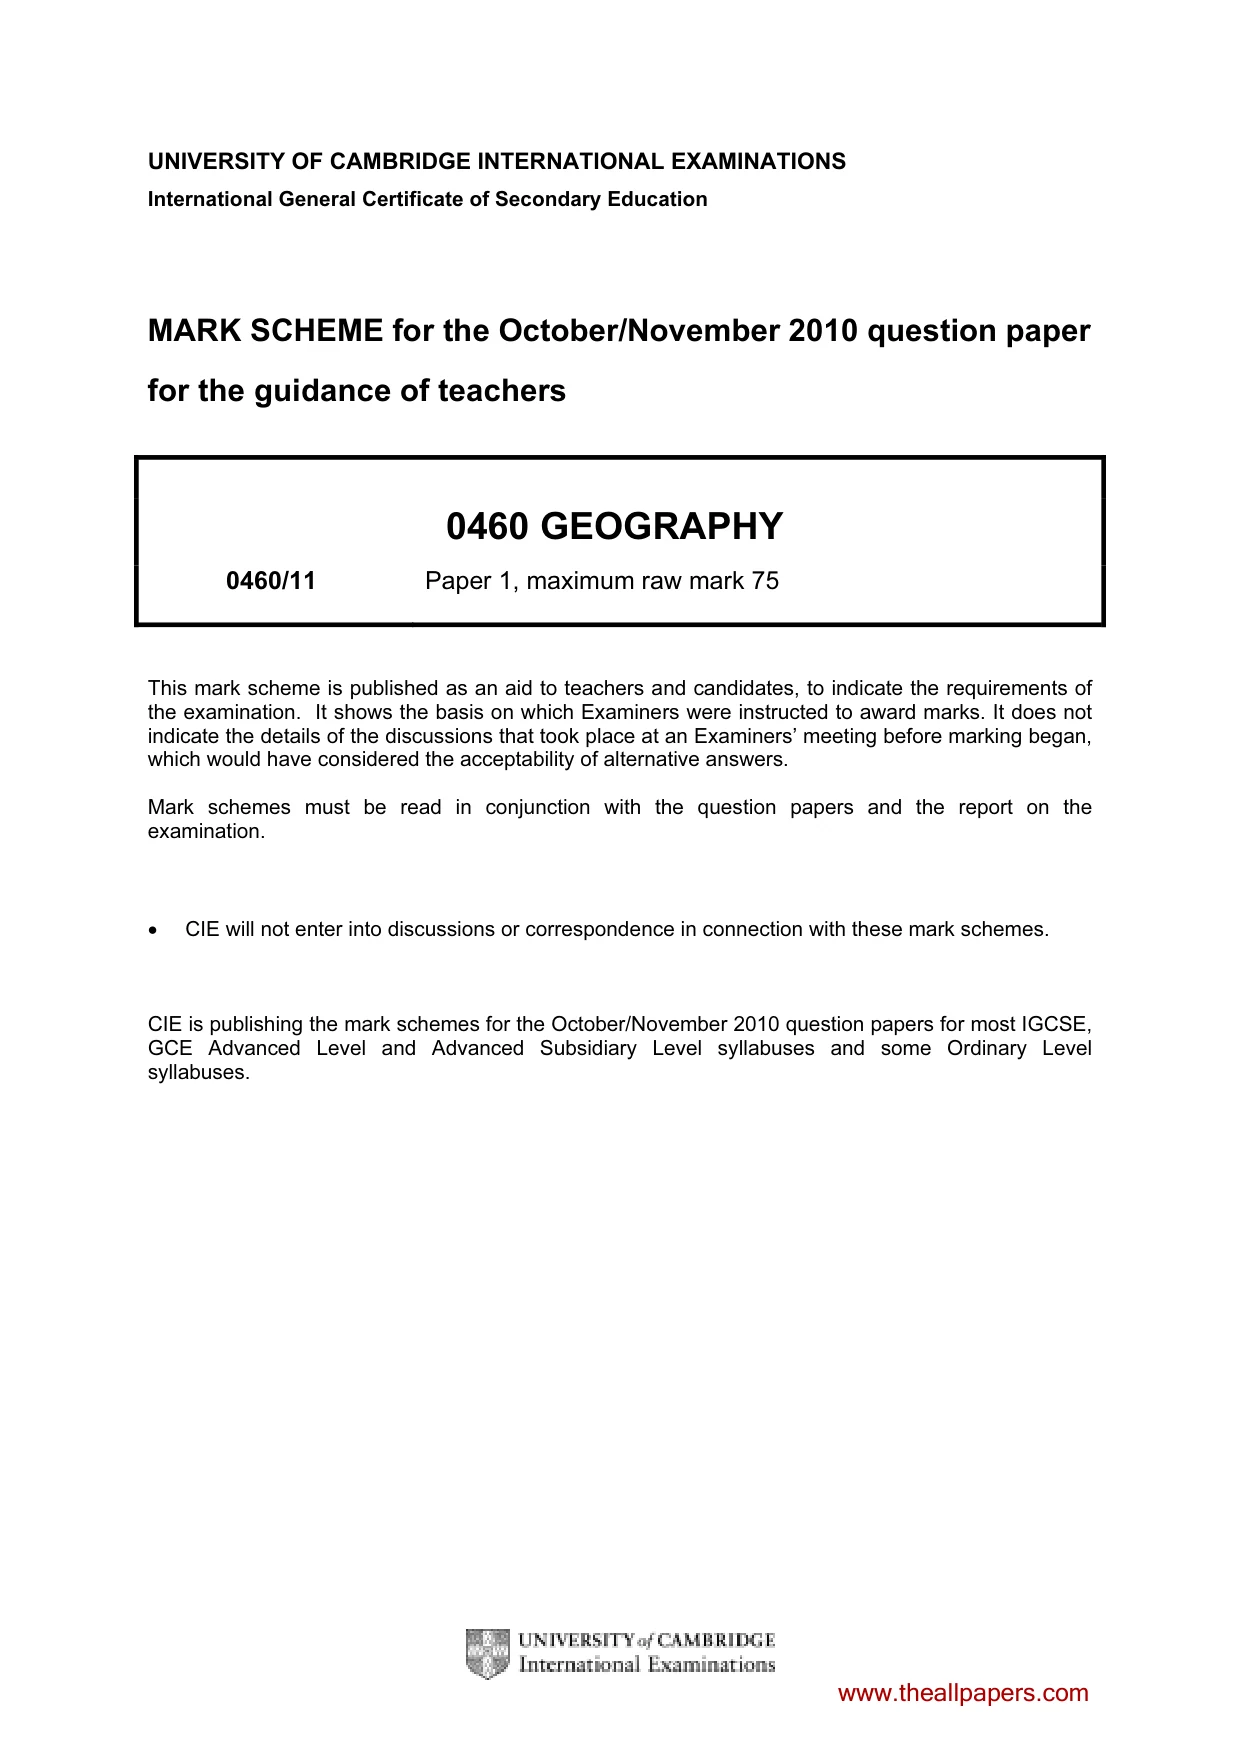
11 0460/11/O/N/10 © UCLES 2010 [Turn over 6 (a) Study Photographs C, D and E (Insert), which show three different types of farming. (i) What is meant by: A subsistence farming; B commercial farming? [2] (ii) Which one of the photographs, C, D or E, shows pastoral farming? [1] (iii) Describe three differences between the farming systems shown in Photographs D and E. [3] (b) Study Fig. 9, which shows the number of people who are under-nourished in Sub-Saharan Africa and in South and East Asia. 1971 1981 1991 2010 1971 1981 1991 2010 Sub-Saharan Africa South and East Asia 0 50 100 150 200 250 300 350 400 450 500 550 600 650 number of people (millions) Fig. 9 (i) Compare the trends in Sub-Saharan Africa and South and East Asia between 1971 and 2010. Support your answer with dates and statistics from Fig. 9. [3] www.theallpapers.com
Question paper, page 11
12 0460/11/O/N/10 © UCLES 2010 (ii) Explain how food shortages can be caused by the natural environment. [4] (iii) Explain how subsistence farmers in LEDCs (less economically developed countries) would benefit if they increased their production of food. [5] (c) All farming systems have inputs, processes and outputs. Name an area where small-scale subsistence farming takes place. Describe the inputs, processes and outputs of this farming system. [7] [Total: 25 marks] Copyright Acknowledgements: Question 1 Figure 1 © S Royle and D R Phillips; Geography Review; Philip Allan Publishers; September 1997. Question 2 Figure 3 © Simon Post; Essential Mapwork Skills; Nelson Thornes Ltd; 2002. Question 3 Photograph A S. Sibley © UCLES Question 3 Figure 5 © UNEP/IUCN (1988); Coral Reefs of the World, Volume 1: Atlantic and Eastern Pacific; UNEP Regional Seas Directories and Bibliographies. IUCN, Gland, Switzerland and Cambridge, UK/UNEP, Nairobi, Kenya; ISBN 2 88032 943 4. Question 4 Photograph B S. Sibley © UCLES Question 5 Figures 7 & 8 © Understanding Geography; Book 4; Longman Singapore; 1998. Question 6 Photograph C-E S. Sibley © UCLES Permission to reproduce items where third-party owned material protected by copyright is included has been sought and cleared where possible. Every reasonable effort has been made by the publisher (UCLES) to trace copyright holders, but if any items requiring clearance have unwittingly been included, the publisher will be pleased to make amends at the earliest possible opportunity. University of Cambridge International Examinations is part of the Cambridge Assessment Group. Cambridge Assessment is the brand name of University of Cambridge Local Examinations Syndicate (UCLES), which is itself a department of the University of Cambridge. www.theallpapers.com
Mark scheme, page 1
UNIVERSITY OF CAMBRIDGE INTERNATIONAL EXAMINATIONS International General Certificate of Secondary Education MARK SCHEME for the October/November 2010 question paper for the guidance of teachers 0460 GEOGRAPHY 0460/11 Paper 1, maximum raw mark 75 This mark scheme is published as an aid to teachers and candidates, to indicate the requirements of the examination. It shows the basis on which Examiners were instructed to award marks. It does not indicate the details of the discussions that took place at an Examiners’ meeting before marking began, which would have considered the acceptability of alternative answers. Mark schemes must be read in conjunction with the question papers and the report on the examination. • CIE will not enter into discussions or correspondence in connection with these mark schemes. CIE is publishing the mark schemes for the October/November 2010 question papers for most IGCSE, GCE Advanced Level and Advanced Subsidiary Level syllabuses and some Ordinary Level syllabuses. www.theallpapers.com
Mark scheme, page 2
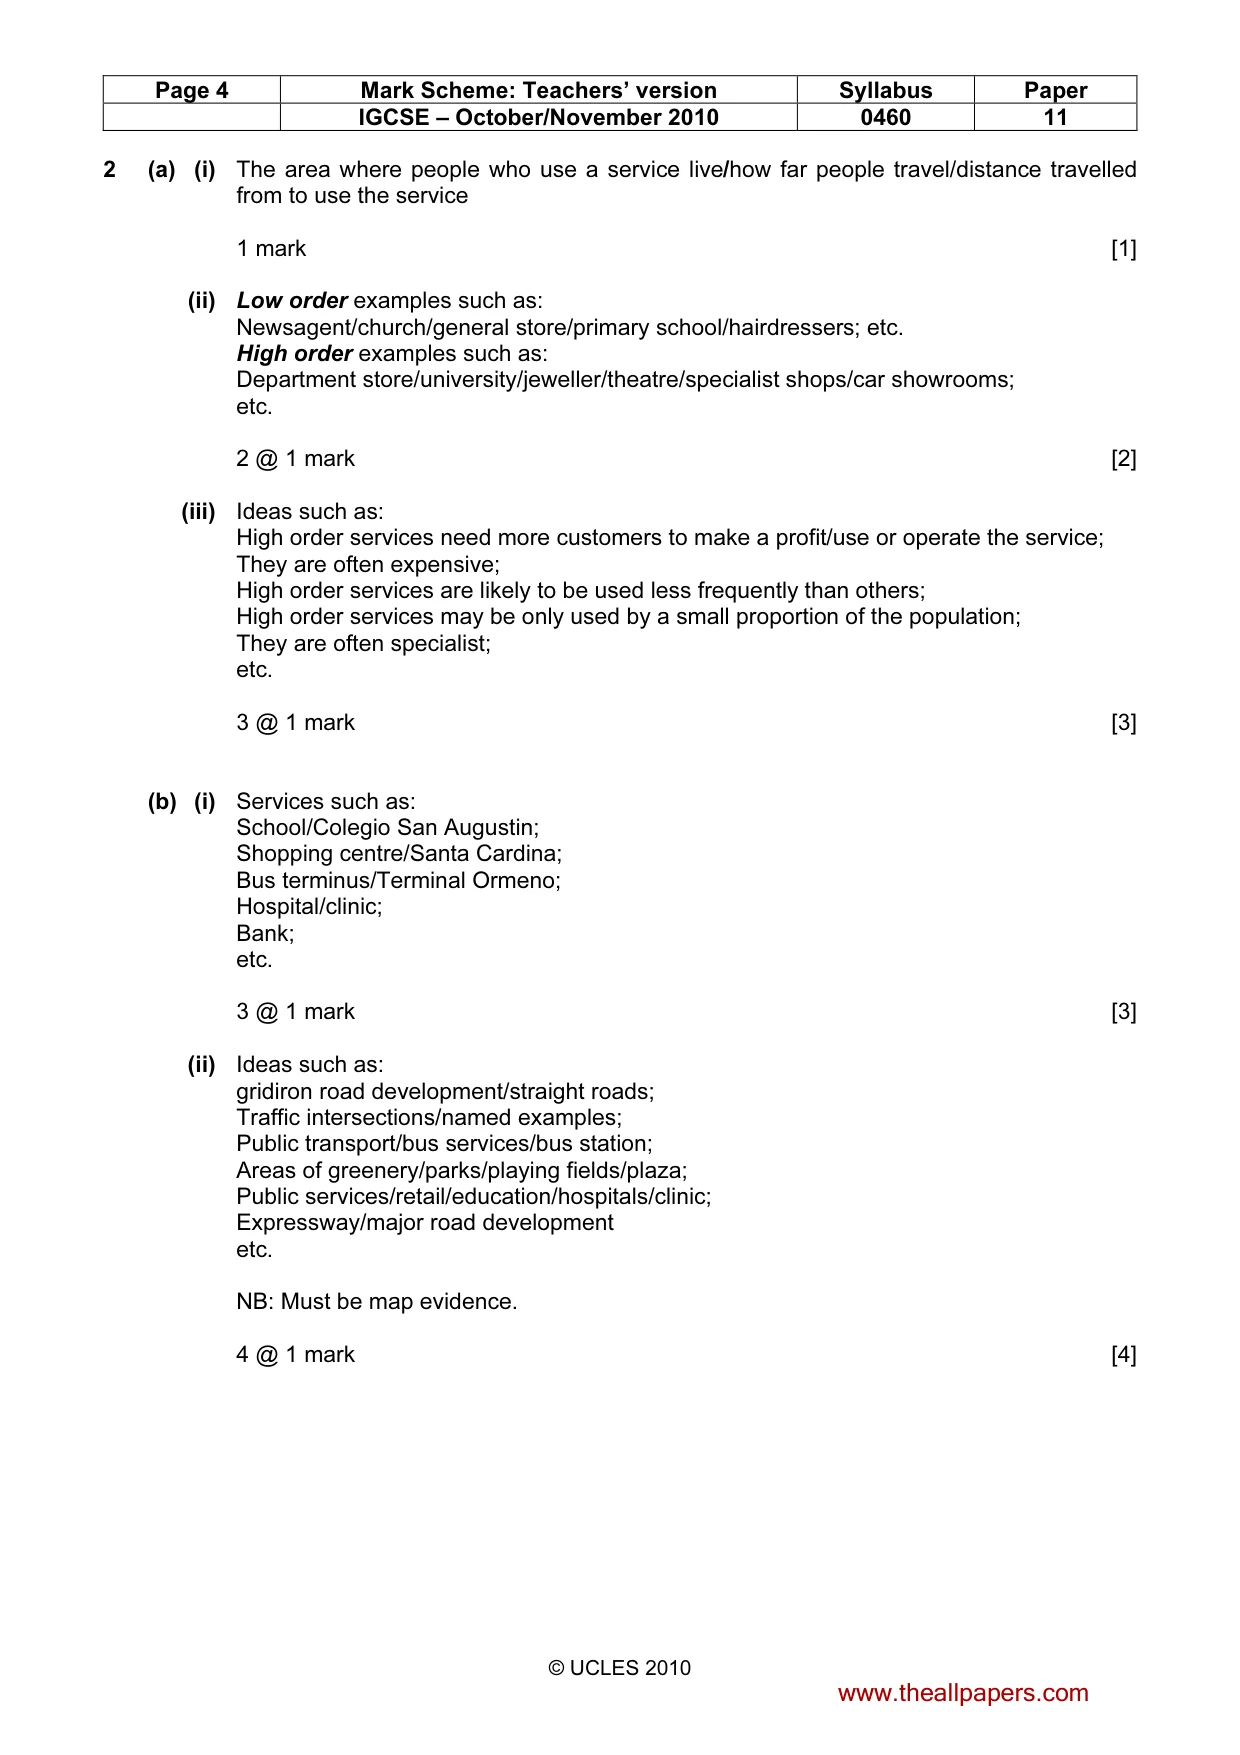
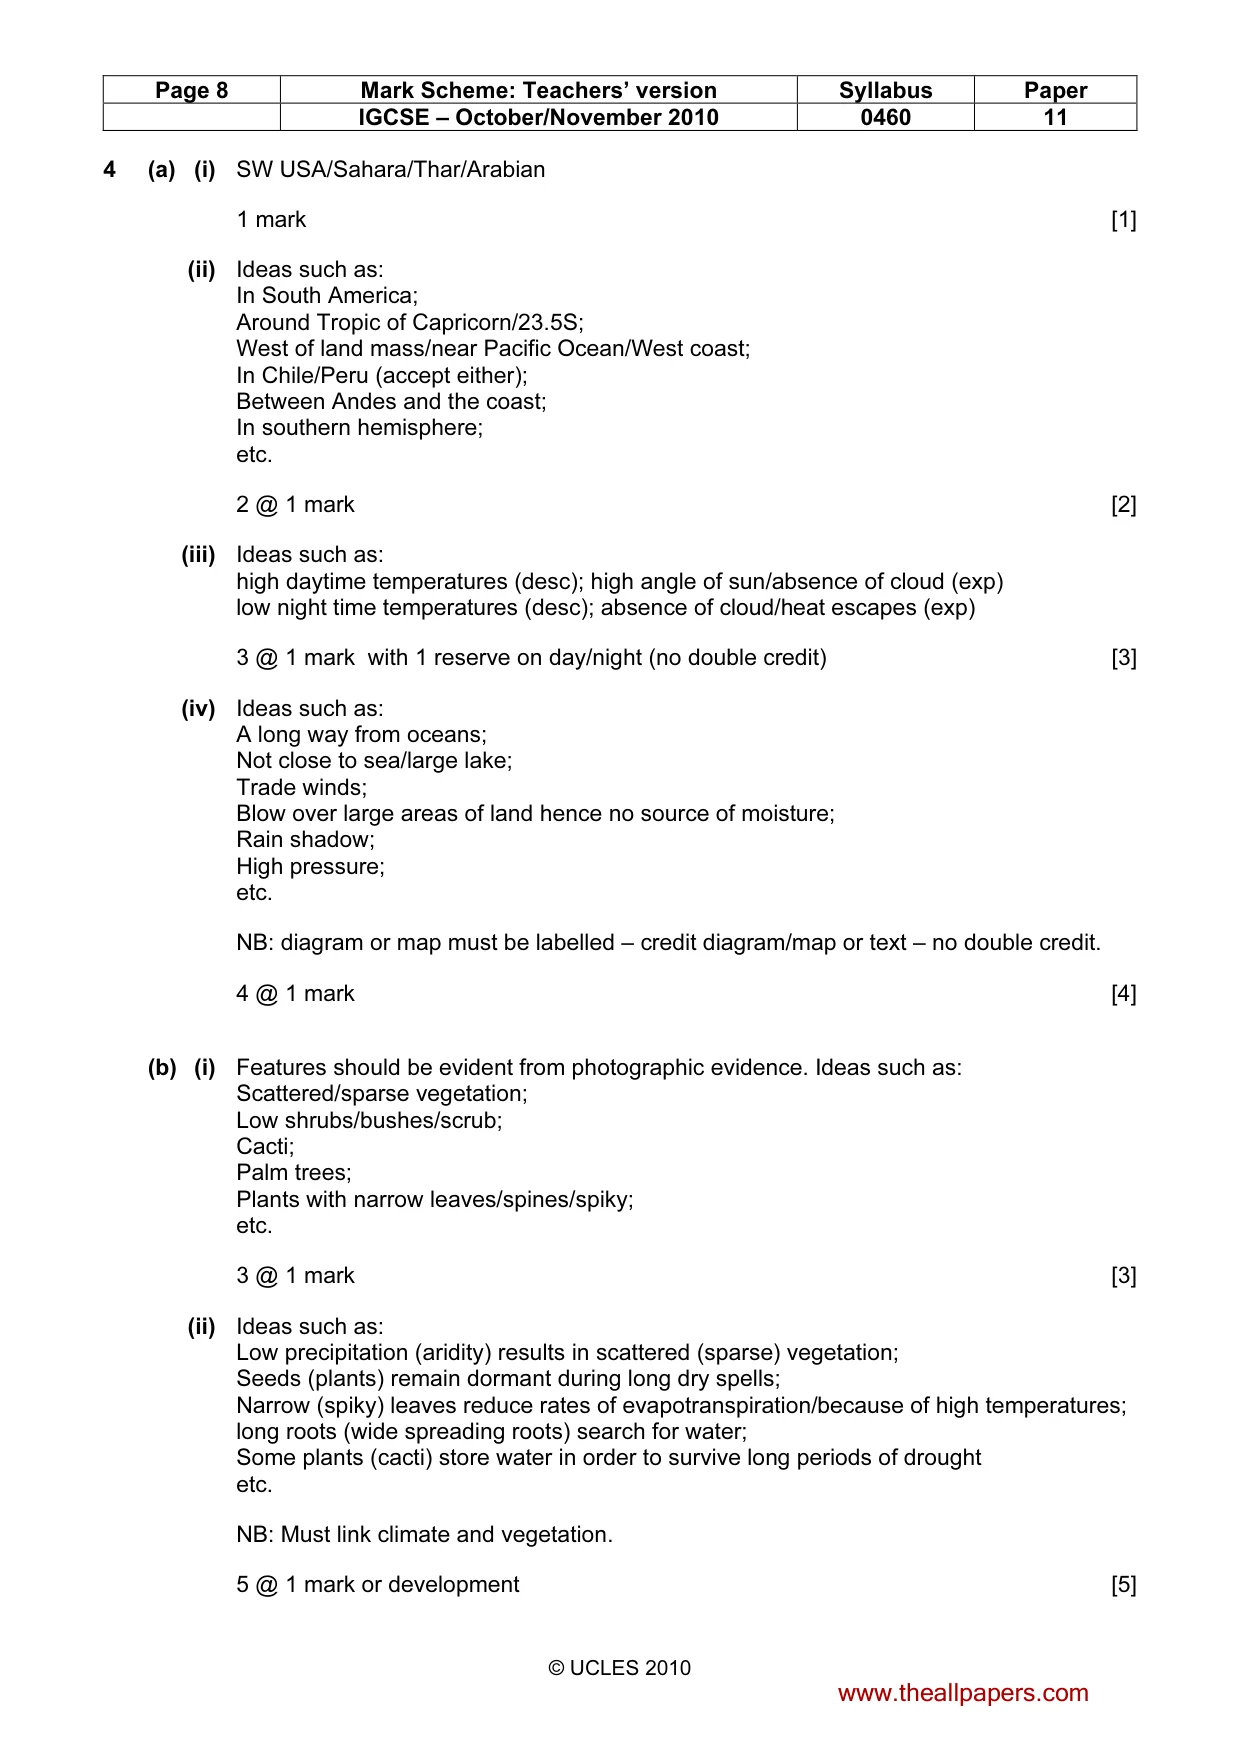
Page 2 Mark Scheme: Teachers’ version Syllabus Paper IGCSE – October/November 2010 0460 11 © UCLES 2010 1 (a) (i) Shandong….Guizhou….Qinghai 1 mark for correct order [1] (ii) 60 million divided by 187,400 (1 mark for method) = 320 (.17) / (.2) (1 mark for correct answer) 2 @ 1 mark [2] (iii) Ideas such as: communications are difficult/roads hard to build; difficult to build on (steeply sloping land); isolation/far away from CBD/cities/towns; agriculture is poor in mountains/food hard to produce/shortage of food; climate often cold/snow/icy/or implications; poor soils/infertile; wet/windy; N.B: Must relate to physical factors 3 @ 1 mark [3] (iv) Ideas such as: Settlements developed around ports/harbours/easier to travel abroad; trade opportunities/imports/exports; much industrial development/factories; employment/job opportunities; coastal areas have good communications/roads/rail links/transportation; growth of tourism/examples of jobs in tourism; fishing industry/food from sea; first regions to be settled idea; etc. 4 @ 1 mark [4] (b) (i) Ideas such as: insufficient workforce/not enough people to work/need to pay higher salaries; resources cannot be fully exploited; low production/of e.g. food/consumer goods; negative balance of payments; low GNP/national income/weak economy/economy fails/slow growth; difficult to defend country; businesses may move out; high immigrant population/need to attract migrants; underuse of services or examples or implications e.g. closure of schools; lack of investment in named services; etc. 3 @ 1 mark [3] www.theallpapers.com
Mark scheme, page 3
Page 3 Mark Scheme: Teachers’ version Syllabus Paper IGCSE – October/November 2010 0460 11 © UCLES 2010 (ii) Ideas such as: people do not have enough resources/examples of resources (dev); lack of work; inadequate food supplies; poor access to education; poor access to health care; overcrowded housing; traffic congestion; atmospheric pollution/(illness e.g. asthma – dev); inadequate water supply; sanitation; overuse of agricultural land/overgrazing/overcultivation/(desertification – dev) deforestation/loss of natural vegetation/habitats destruction/(desertification – dev) but no double credit. etc. Reserve 1 mark people/natural environment 5 @ 1 mark or development [5] (c) Levels marking Level 1 (1–3 marks) Statements including limited detail which suggest reasons for international migration. (e.g. more jobs, better services, schools, hospitals, clinics, not enough food, improved standard of living, better quality of life, war, drought etc.) Level 2 (4–6 marks) Max 5 if no named example. 3 × developed statements plus named example for 6 marks. More developed statements which explain reasons for international migration. (e.g. more jobs in destination country where they can work in service sector/factories, better or more schools/hospitals/clinics so that…., can buy food from shops rather than rely on unproductive farmland, refugees fleeing from war torn areas in fear of their lives, drought prevents them from producing enough food to feed their families etc.) Level 3 (7 marks) must include place specific information for 7 marks. Uses named example (e.g. Turkey to Germany). Comprehensive and accurate statements including some place specific reference. (e.g. more jobs in Germany where they were employed in rebuilding cities like Dresden after World War 2, greater access to schools/hospitals/clinics than in remote mountainous areas of Turkey, refugees fleeing from war torn areas close to Iraqi border in fear of their lives, drought in regions such as central Anatolia prevents them from producing enough food to feed their families etc.) NB: Level 3 response must refer to both push and pull factors. [7] [Total: 25] www.theallpapers.com
Mark scheme, page 4
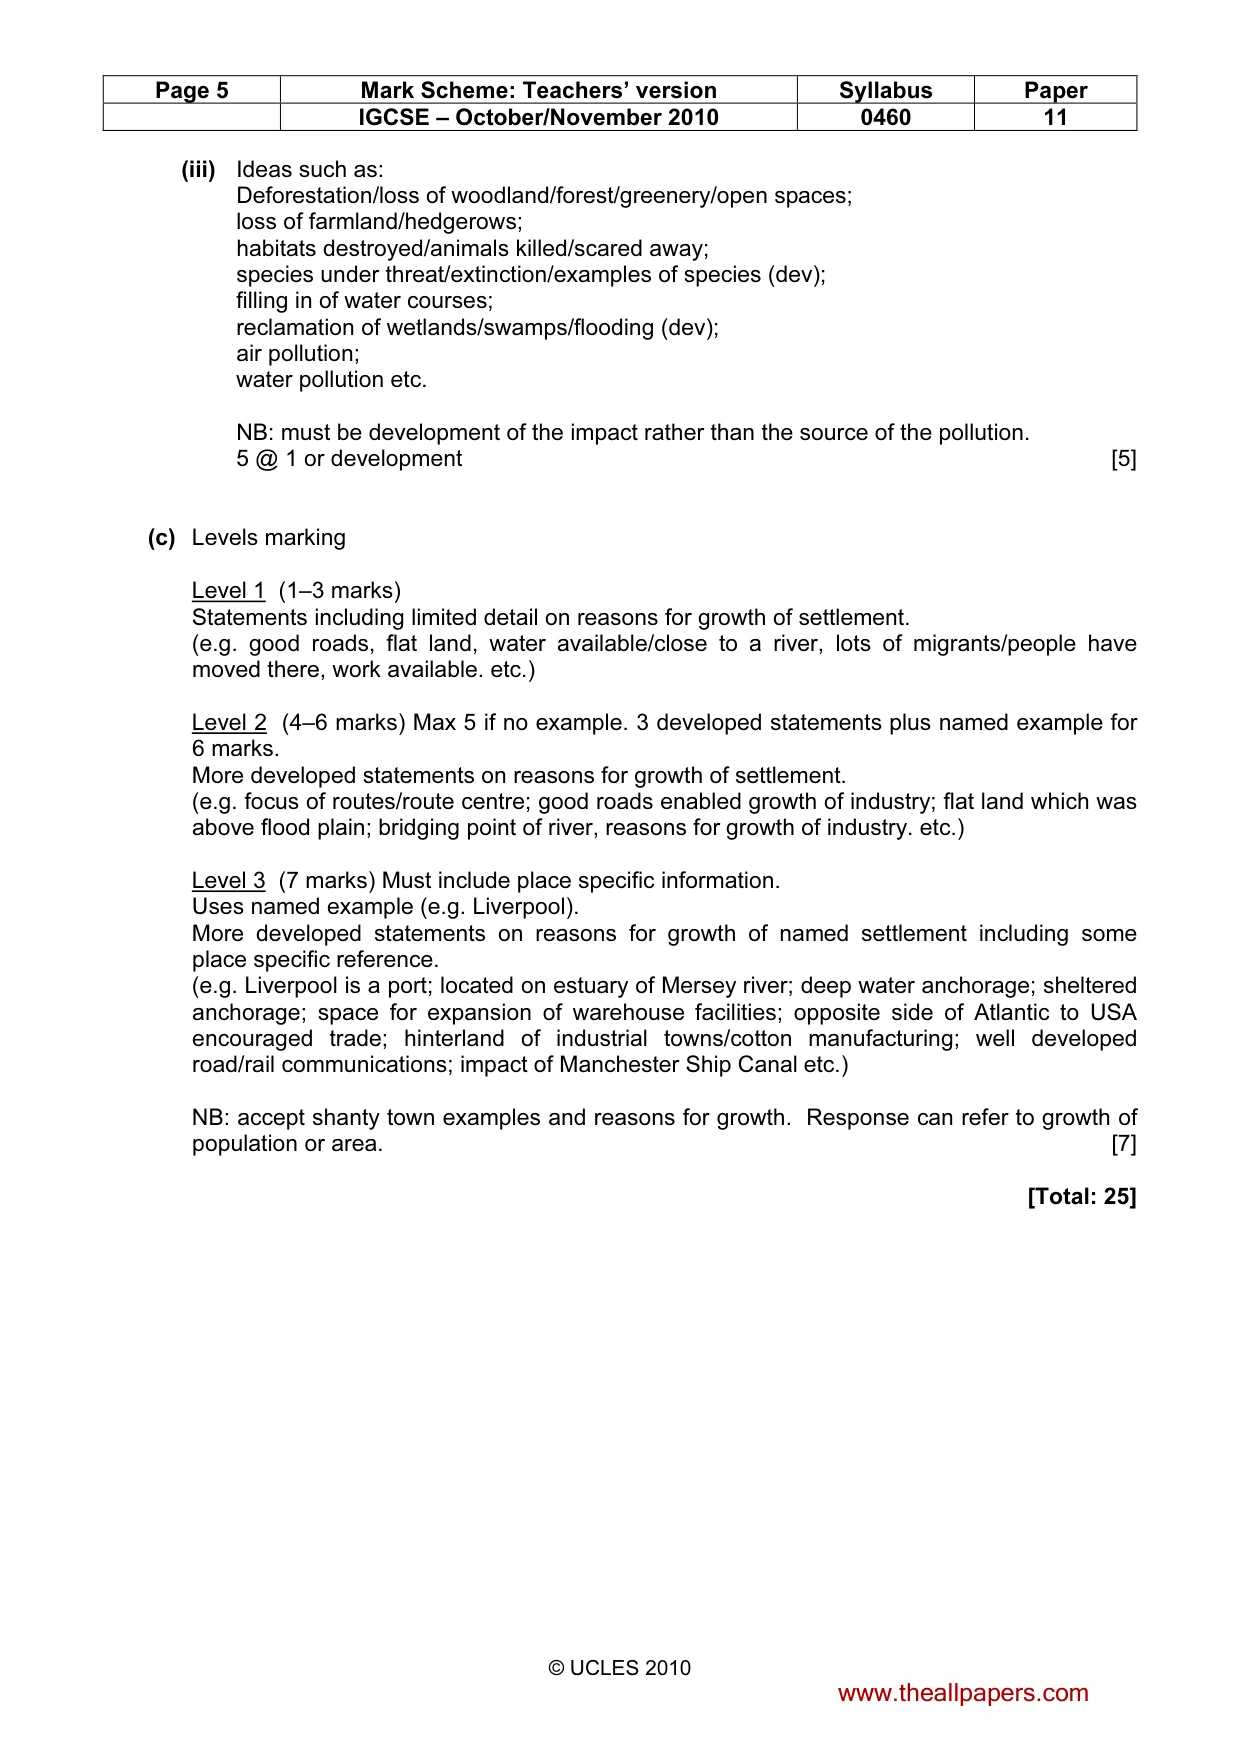
Page 4 Mark Scheme: Teachers’ version Syllabus Paper IGCSE – October/November 2010 0460 11 © UCLES 2010 2 (a) (i) The area where people who use a service live/how far people travel/distance travelled from to use the service 1 mark [1] (ii) Low order examples such as: Newsagent/church/general store/primary school/hairdressers; etc. High order examples such as: Department store/university/jeweller/theatre/specialist shops/car showrooms; etc. 2 @ 1 mark [2] (iii) Ideas such as: High order services need more customers to make a profit/use or operate the service; They are often expensive; High order services are likely to be used less frequently than others; High order services may be only used by a small proportion of the population; They are often specialist; etc. 3 @ 1 mark [3] (b) (i) Services such as: School/Colegio San Augustin; Shopping centre/Santa Cardina; Bus terminus/Terminal Ormeno; Hospital/clinic; Bank; etc. 3 @ 1 mark [3] (ii) Ideas such as: gridiron road development/straight roads; Traffic intersections/named examples; Public transport/bus services/bus station; Areas of greenery/parks/playing fields/plaza; Public services/retail/education/hospitals/clinic; Expressway/major road development etc. NB: Must be map evidence. 4 @ 1 mark [4] www.theallpapers.com
Mark scheme, page 5
Page 5 Mark Scheme: Teachers’ version Syllabus Paper IGCSE – October/November 2010 0460 11 © UCLES 2010 (iii) Ideas such as: Deforestation/loss of woodland/forest/greenery/open spaces; loss of farmland/hedgerows; habitats destroyed/animals killed/scared away; species under threat/extinction/examples of species (dev); filling in of water courses; reclamation of wetlands/swamps/flooding (dev); air pollution; water pollution etc. NB: must be development of the impact rather than the source of the pollution. 5 @ 1 or development [5] (c) Levels marking Level 1 (1–3 marks) Statements including limited detail on reasons for growth of settlement. (e.g. good roads, flat land, water available/close to a river, lots of migrants/people have moved there, work available. etc.) Level 2 (4–6 marks) Max 5 if no example. 3 developed statements plus named example for 6 marks. More developed statements on reasons for growth of settlement. (e.g. focus of routes/route centre; good roads enabled growth of industry; flat land which was above flood plain; bridging point of river, reasons for growth of industry. etc.) Level 3 (7 marks) Must include place specific information. Uses named example (e.g. Liverpool). More developed statements on reasons for growth of named settlement including some place specific reference. (e.g. Liverpool is a port; located on estuary of Mersey river; deep water anchorage; sheltered anchorage; space for expansion of warehouse facilities; opposite side of Atlantic to USA encouraged trade; hinterland of industrial towns/cotton manufacturing; well developed road/rail communications; impact of Manchester Ship Canal etc.) NB: accept shanty town examples and reasons for growth. Response can refer to growth of population or area. [7] [Total: 25] www.theallpapers.com
Mark scheme, page 6
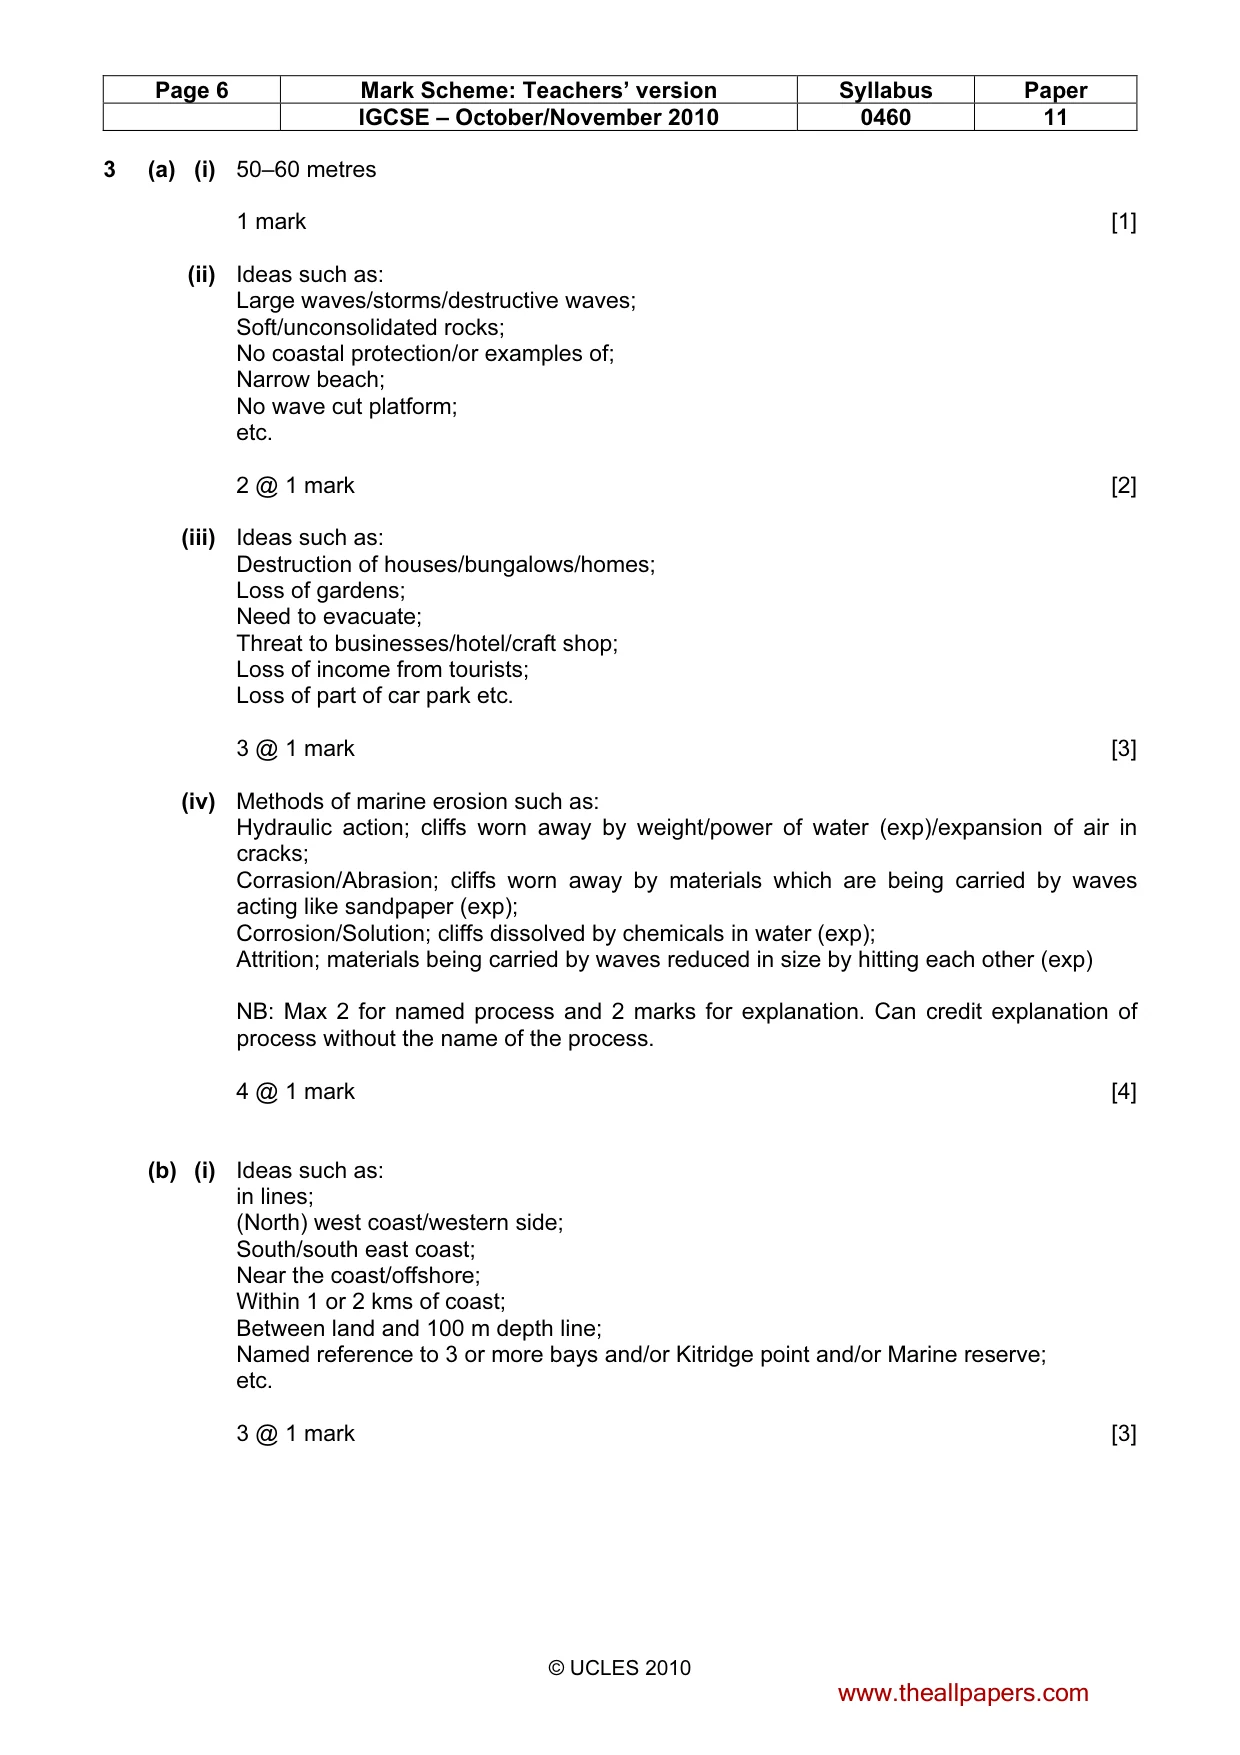
Page 6 Mark Scheme: Teachers’ version Syllabus Paper IGCSE – October/November 2010 0460 11 © UCLES 2010 3 (a) (i) 50–60 metres 1 mark [1] (ii) Ideas such as: Large waves/storms/destructive waves; Soft/unconsolidated rocks; No coastal protection/or examples of; Narrow beach; No wave cut platform; etc. 2 @ 1 mark [2] (iii) Ideas such as: Destruction of houses/bungalows/homes; Loss of gardens; Need to evacuate; Threat to businesses/hotel/craft shop; Loss of income from tourists; Loss of part of car park etc. 3 @ 1 mark [3] (iv) Methods of marine erosion such as: Hydraulic action; cliffs worn away by weight/power of water (exp)/expansion of air in cracks; Corrasion/Abrasion; cliffs worn away by materials which are being carried by waves acting like sandpaper (exp); Corrosion/Solution; cliffs dissolved by chemicals in water (exp); Attrition; materials being carried by waves reduced in size by hitting each other (exp) NB: Max 2 for named process and 2 marks for explanation. Can credit explanation of process without the name of the process. 4 @ 1 mark [4] (b) (i) Ideas such as: in lines; (North) west coast/western side; South/south east coast; Near the coast/offshore; Within 1 or 2 kms of coast; Between land and 100 m depth line; Named reference to 3 or more bays and/or Kitridge point and/or Marine reserve; etc. 3 @ 1 mark [3] www.theallpapers.com
Mark scheme, page 7
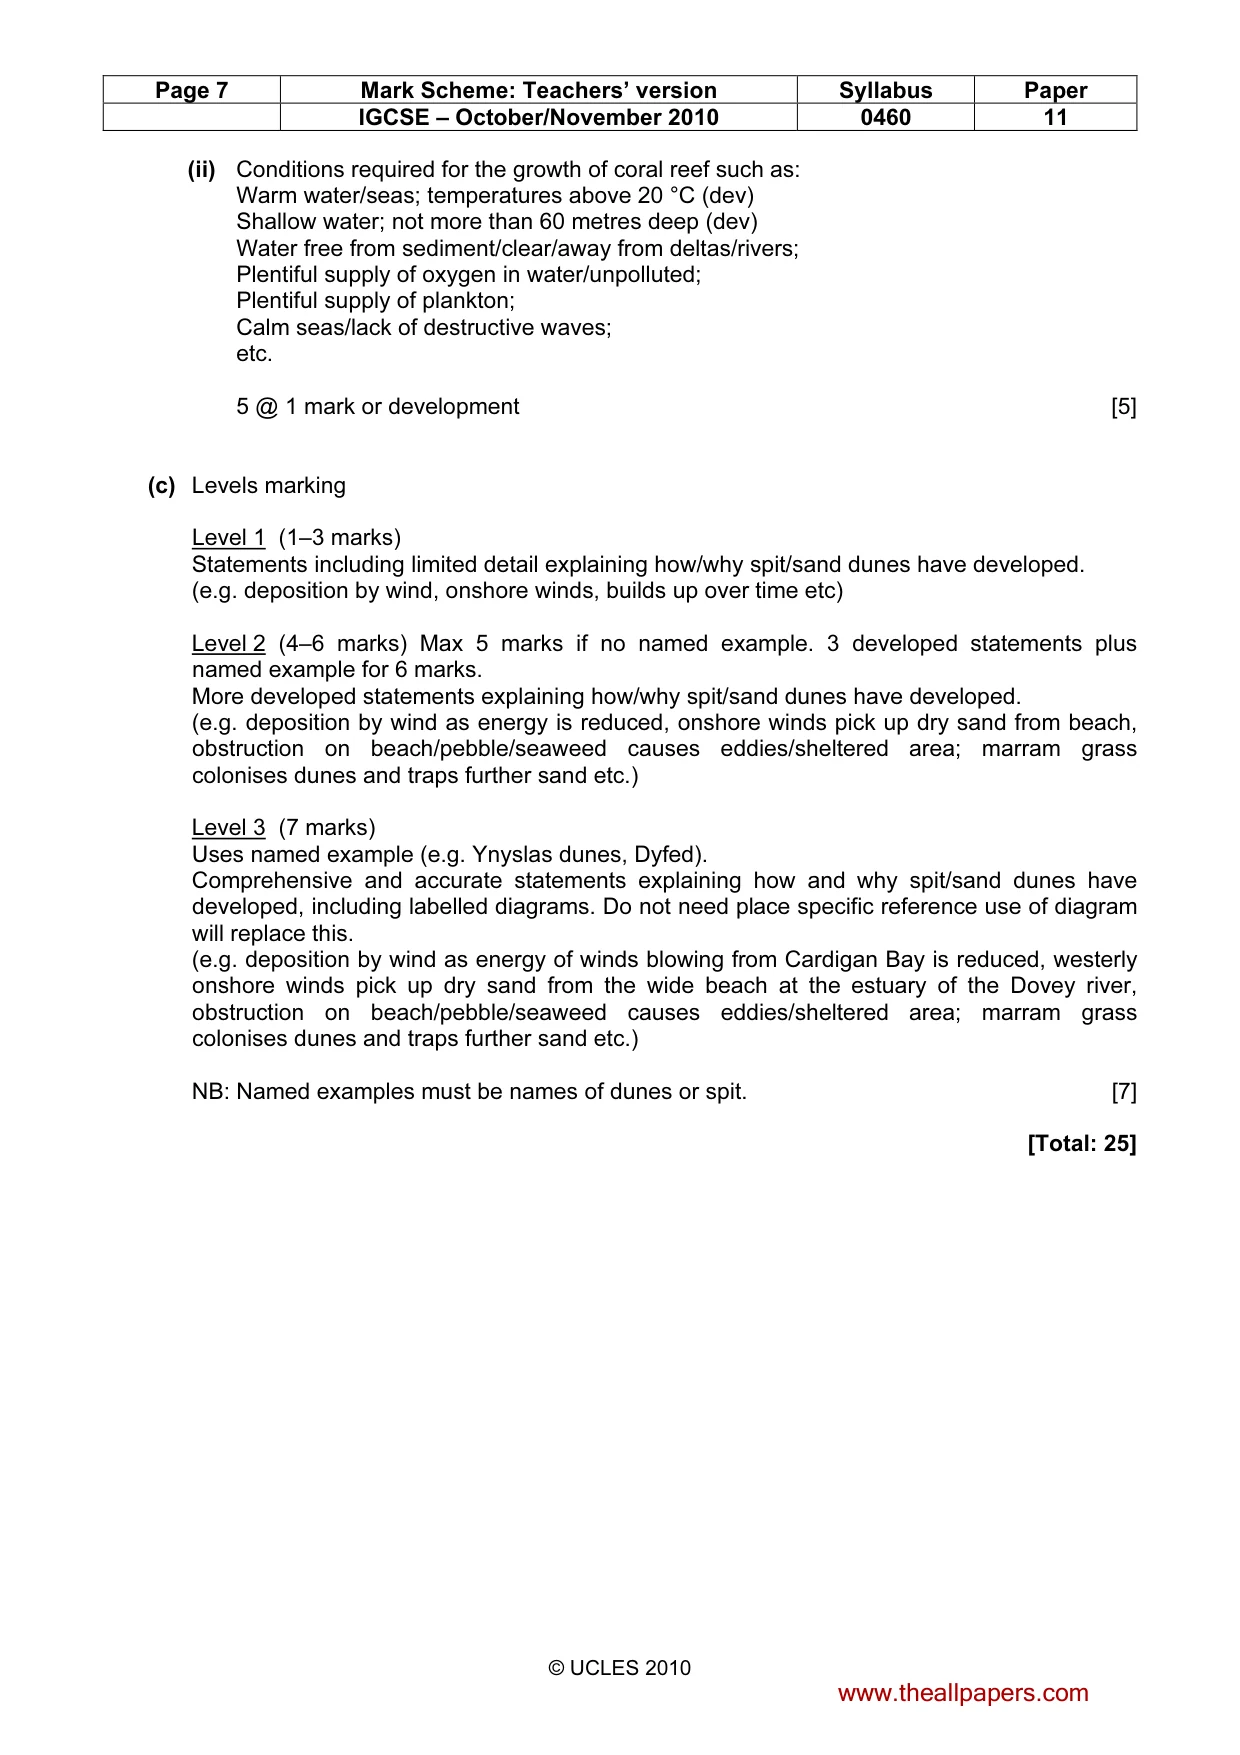
Page 7 Mark Scheme: Teachers’ version Syllabus Paper IGCSE – October/November 2010 0460 11 © UCLES 2010 (ii) Conditions required for the growth of coral reef such as: Warm water/seas; temperatures above 20 °C (dev) Shallow water; not more than 60 metres deep (dev) Water free from sediment/clear/away from deltas/rivers; Plentiful supply of oxygen in water/unpolluted; Plentiful supply of plankton; Calm seas/lack of destructive waves; etc. 5 @ 1 mark or development [5] (c) Levels marking Level 1 (1–3 marks) Statements including limited detail explaining how/why spit/sand dunes have developed. (e.g. deposition by wind, onshore winds, builds up over time etc) Level 2 (4–6 marks) Max 5 marks if no named example. 3 developed statements plus named example for 6 marks. More developed statements explaining how/why spit/sand dunes have developed. (e.g. deposition by wind as energy is reduced, onshore winds pick up dry sand from beach, obstruction on beach/pebble/seaweed causes eddies/sheltered area; marram grass colonises dunes and traps further sand etc.) Level 3 (7 marks) Uses named example (e.g. Ynyslas dunes, Dyfed). Comprehensive and accurate statements explaining how and why spit/sand dunes have developed, including labelled diagrams. Do not need place specific reference use of diagram will replace this. (e.g. deposition by wind as energy of winds blowing from Cardigan Bay is reduced, westerly onshore winds pick up dry sand from the wide beach at the estuary of the Dovey river, obstruction on beach/pebble/seaweed causes eddies/sheltered area; marram grass colonises dunes and traps further sand etc.) NB: Named examples must be names of dunes or spit. [7] [Total: 25] www.theallpapers.com
Mark scheme, page 8
Page 8 Mark Scheme: Teachers’ version Syllabus Paper IGCSE – October/November 2010 0460 11 © UCLES 2010 4 (a) (i) SW USA/Sahara/Thar/Arabian 1 mark [1] (ii) Ideas such as: In South America; Around Tropic of Capricorn/23.5S; West of land mass/near Pacific Ocean/West coast; In Chile/Peru (accept either); Between Andes and the coast; In southern hemisphere; etc. 2 @ 1 mark [2] (iii) Ideas such as: high daytime temperatures (desc); high angle of sun/absence of cloud (exp) low night time temperatures (desc); absence of cloud/heat escapes (exp) 3 @ 1 mark with 1 reserve on day/night (no double credit) [3] (iv) Ideas such as: A long way from oceans; Not close to sea/large lake; Trade winds; Blow over large areas of land hence no source of moisture; Rain shadow; High pressure; etc. NB: diagram or map must be labelled – credit diagram/map or text – no double credit. 4 @ 1 mark [4] (b) (i) Features should be evident from photographic evidence. Ideas such as: Scattered/sparse vegetation; Low shrubs/bushes/scrub; Cacti; Palm trees; Plants with narrow leaves/spines/spiky; etc. 3 @ 1 mark [3] (ii) Ideas such as: Low precipitation (aridity) results in scattered (sparse) vegetation; Seeds (plants) remain dormant during long dry spells; Narrow (spiky) leaves reduce rates of evapotranspiration/because of high temperatures; long roots (wide spreading roots) search for water; Some plants (cacti) store water in order to survive long periods of drought etc. NB: Must link climate and vegetation. 5 @ 1 mark or development [5] www.theallpapers.com
Mark scheme, page 9
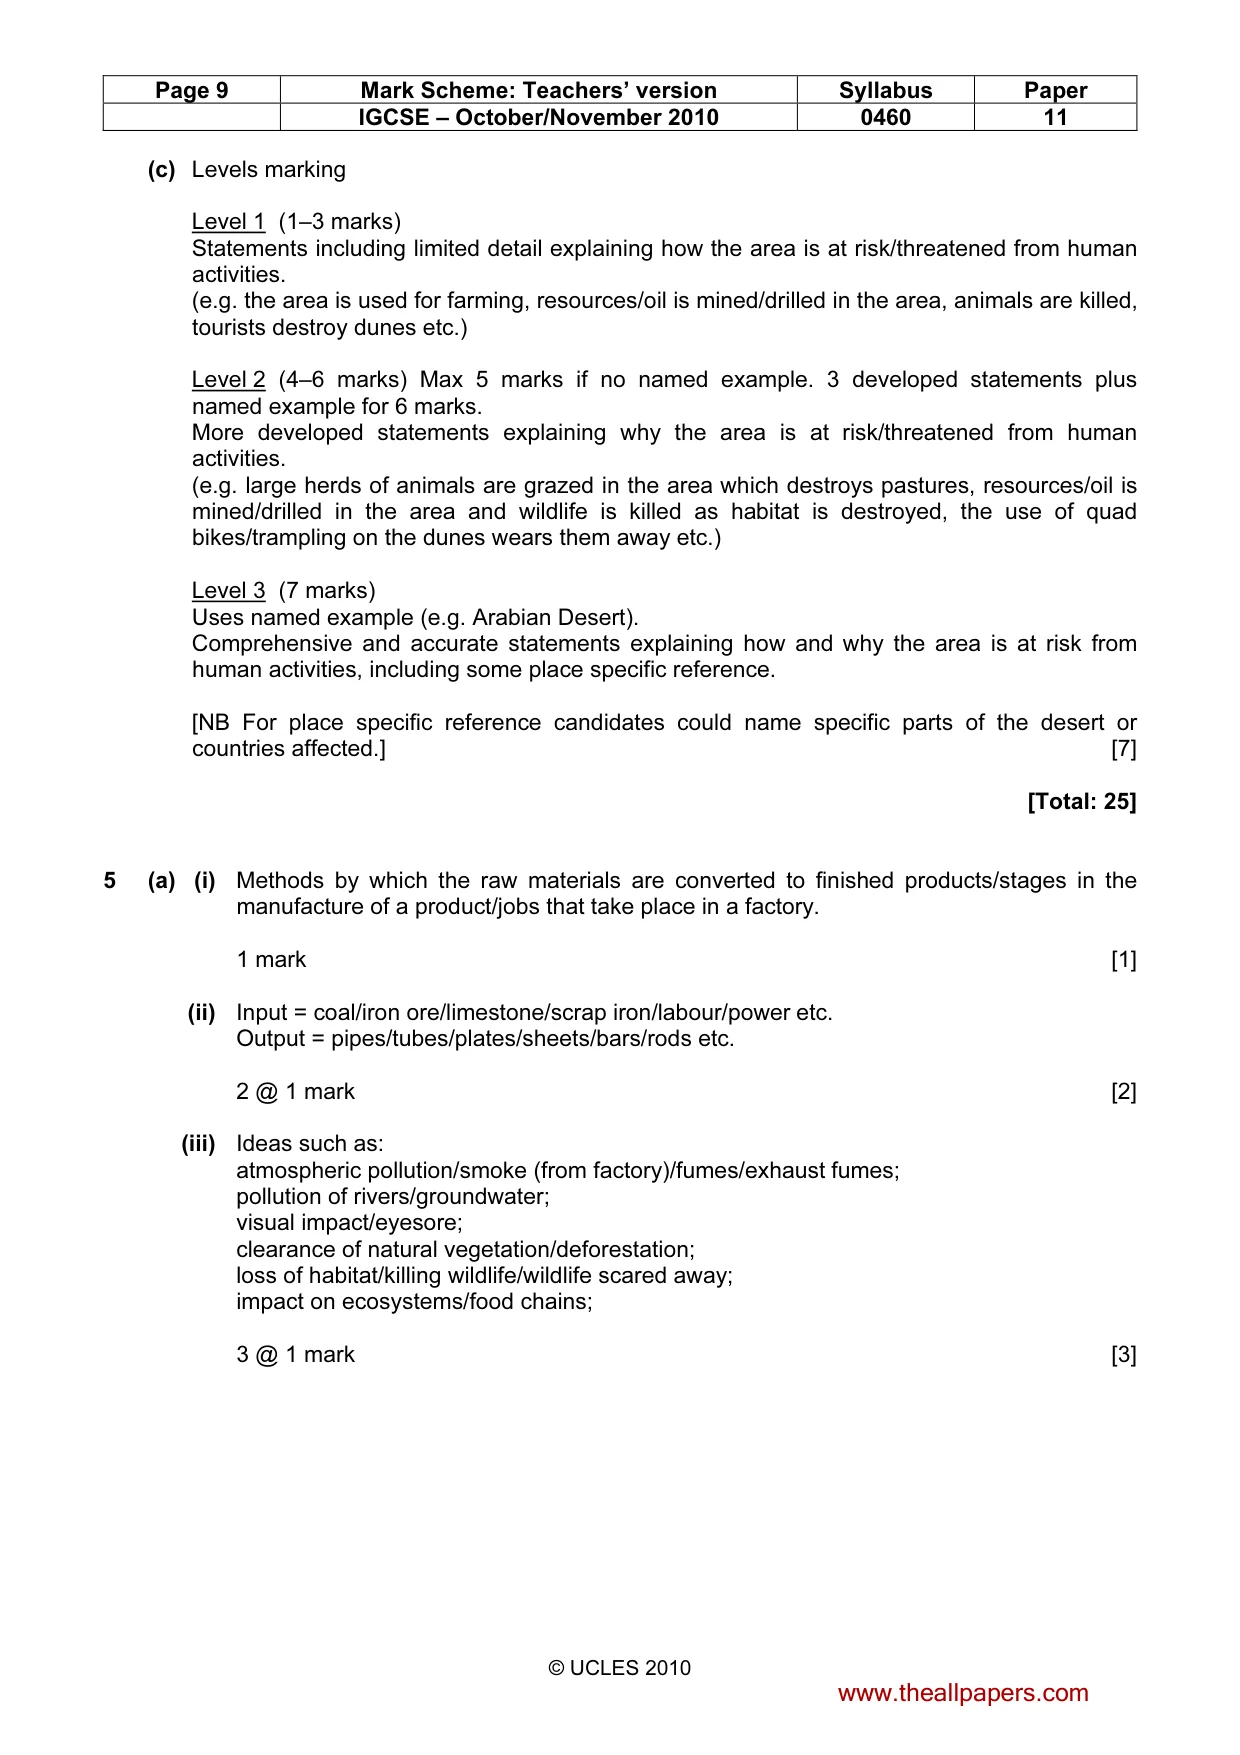
Page 9 Mark Scheme: Teachers’ version Syllabus Paper IGCSE – October/November 2010 0460 11 © UCLES 2010 (c) Levels marking Level 1 (1–3 marks) Statements including limited detail explaining how the area is at risk/threatened from human activities. (e.g. the area is used for farming, resources/oil is mined/drilled in the area, animals are killed, tourists destroy dunes etc.) Level 2 (4–6 marks) Max 5 marks if no named example. 3 developed statements plus named example for 6 marks. More developed statements explaining why the area is at risk/threatened from human activities. (e.g. large herds of animals are grazed in the area which destroys pastures, resources/oil is mined/drilled in the area and wildlife is killed as habitat is destroyed, the use of quad bikes/trampling on the dunes wears them away etc.) Level 3 (7 marks) Uses named example (e.g. Arabian Desert). Comprehensive and accurate statements explaining how and why the area is at risk from human activities, including some place specific reference. [NB For place specific reference candidates could name specific parts of the desert or countries affected.] [7] [Total: 25] 5 (a) (i) Methods by which the raw materials are converted to finished products/stages in the manufacture of a product/jobs that take place in a factory. 1 mark [1] (ii) Input = coal/iron ore/limestone/scrap iron/labour/power etc. Output = pipes/tubes/plates/sheets/bars/rods etc. 2 @ 1 mark [2] (iii) Ideas such as: atmospheric pollution/smoke (from factory)/fumes/exhaust fumes; pollution of rivers/groundwater; visual impact/eyesore; clearance of natural vegetation/deforestation; loss of habitat/killing wildlife/wildlife scared away; impact on ecosystems/food chains; 3 @ 1 mark [3] www.theallpapers.com
Mark scheme, page 10
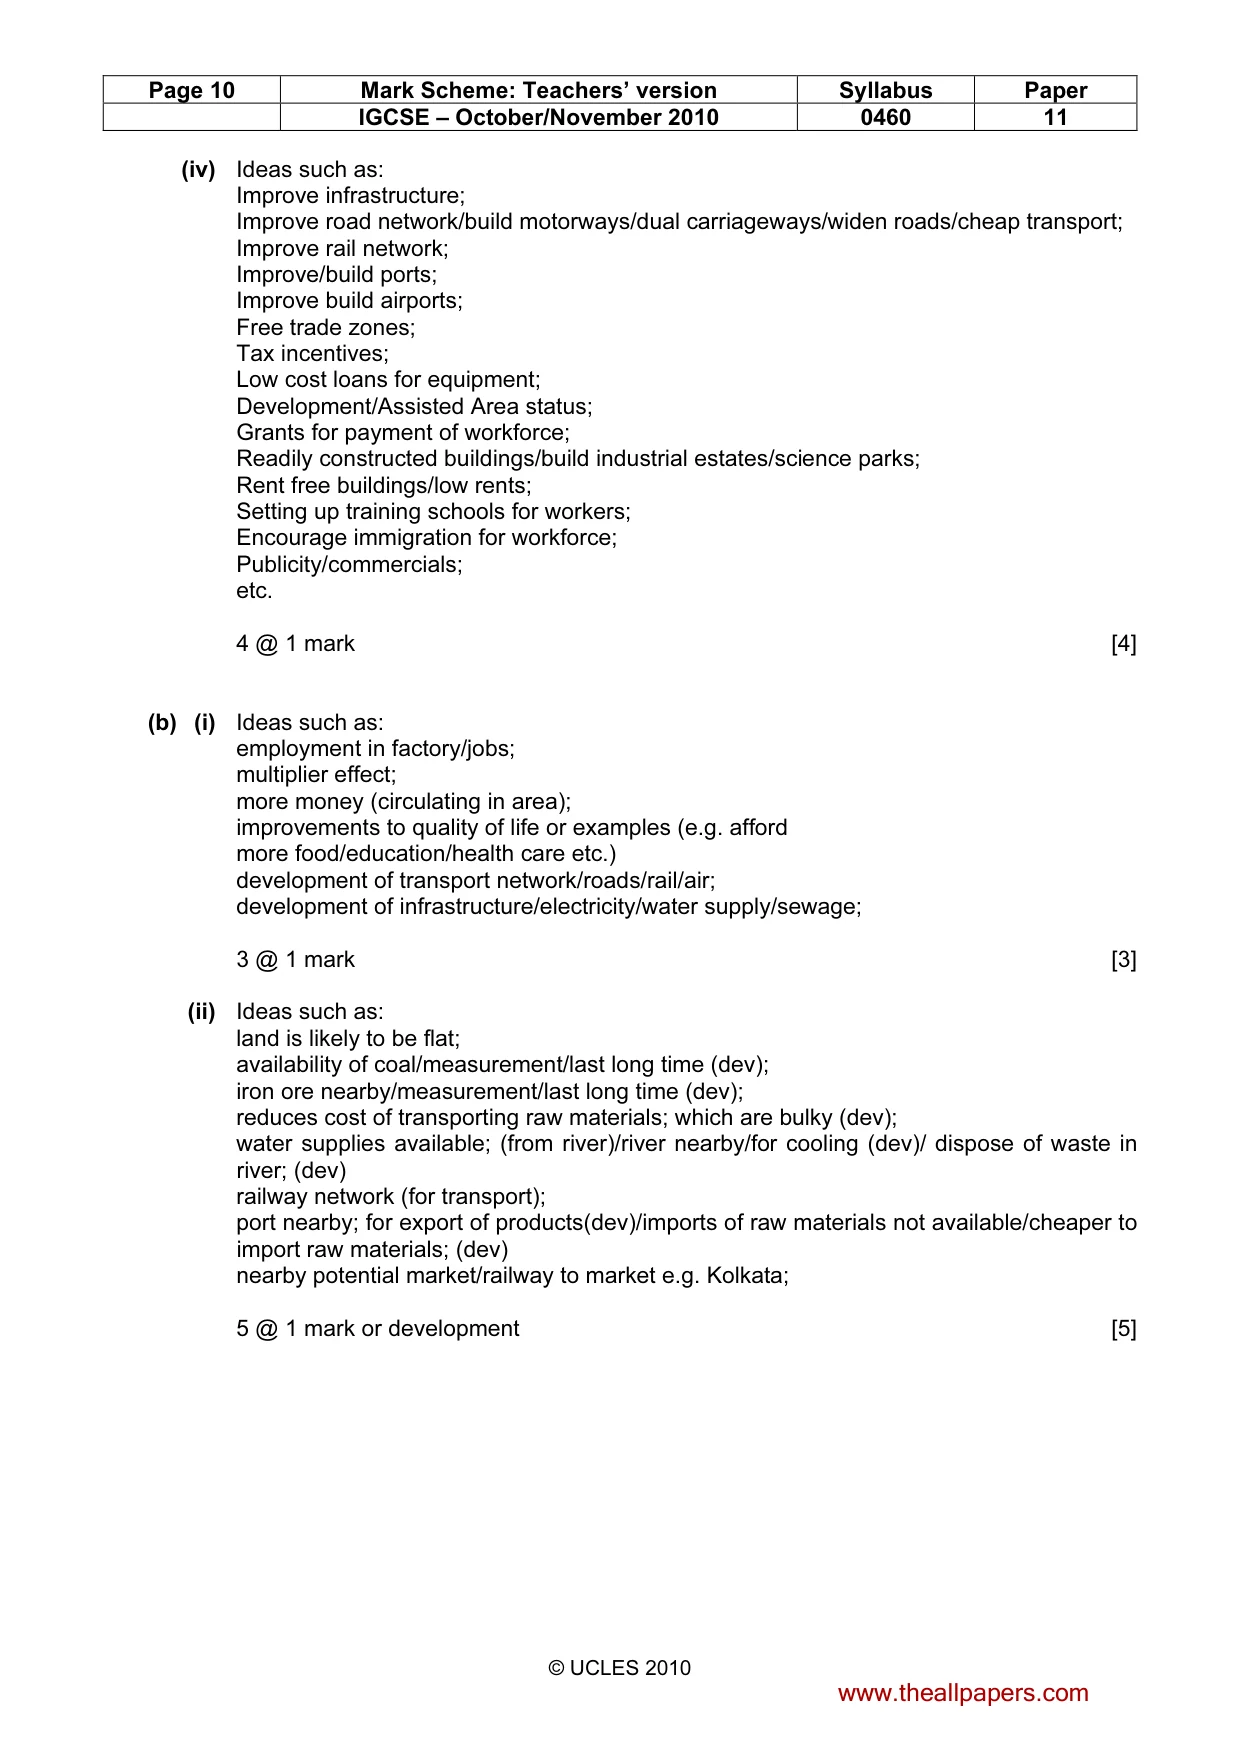
Page 10 Mark Scheme: Teachers’ version Syllabus Paper IGCSE – October/November 2010 0460 11 © UCLES 2010 (iv) Ideas such as: Improve infrastructure; Improve road network/build motorways/dual carriageways/widen roads/cheap transport; Improve rail network; Improve/build ports; Improve build airports; Free trade zones; Tax incentives; Low cost loans for equipment; Development/Assisted Area status; Grants for payment of workforce; Readily constructed buildings/build industrial estates/science parks; Rent free buildings/low rents; Setting up training schools for workers; Encourage immigration for workforce; Publicity/commercials; etc. 4 @ 1 mark [4] (b) (i) Ideas such as: employment in factory/jobs; multiplier effect; more money (circulating in area); improvements to quality of life or examples (e.g. afford more food/education/health care etc.) development of transport network/roads/rail/air; development of infrastructure/electricity/water supply/sewage; 3 @ 1 mark [3] (ii) Ideas such as: land is likely to be flat; availability of coal/measurement/last long time (dev); iron ore nearby/measurement/last long time (dev); reduces cost of transporting raw materials; which are bulky (dev); water supplies available; (from river)/river nearby/for cooling (dev)/ dispose of waste in river; (dev) railway network (for transport); port nearby; for export of products(dev)/imports of raw materials not available/cheaper to import raw materials; (dev) nearby potential market/railway to market e.g. Kolkata; 5 @ 1 mark or development [5] www.theallpapers.com
Mark scheme, page 11
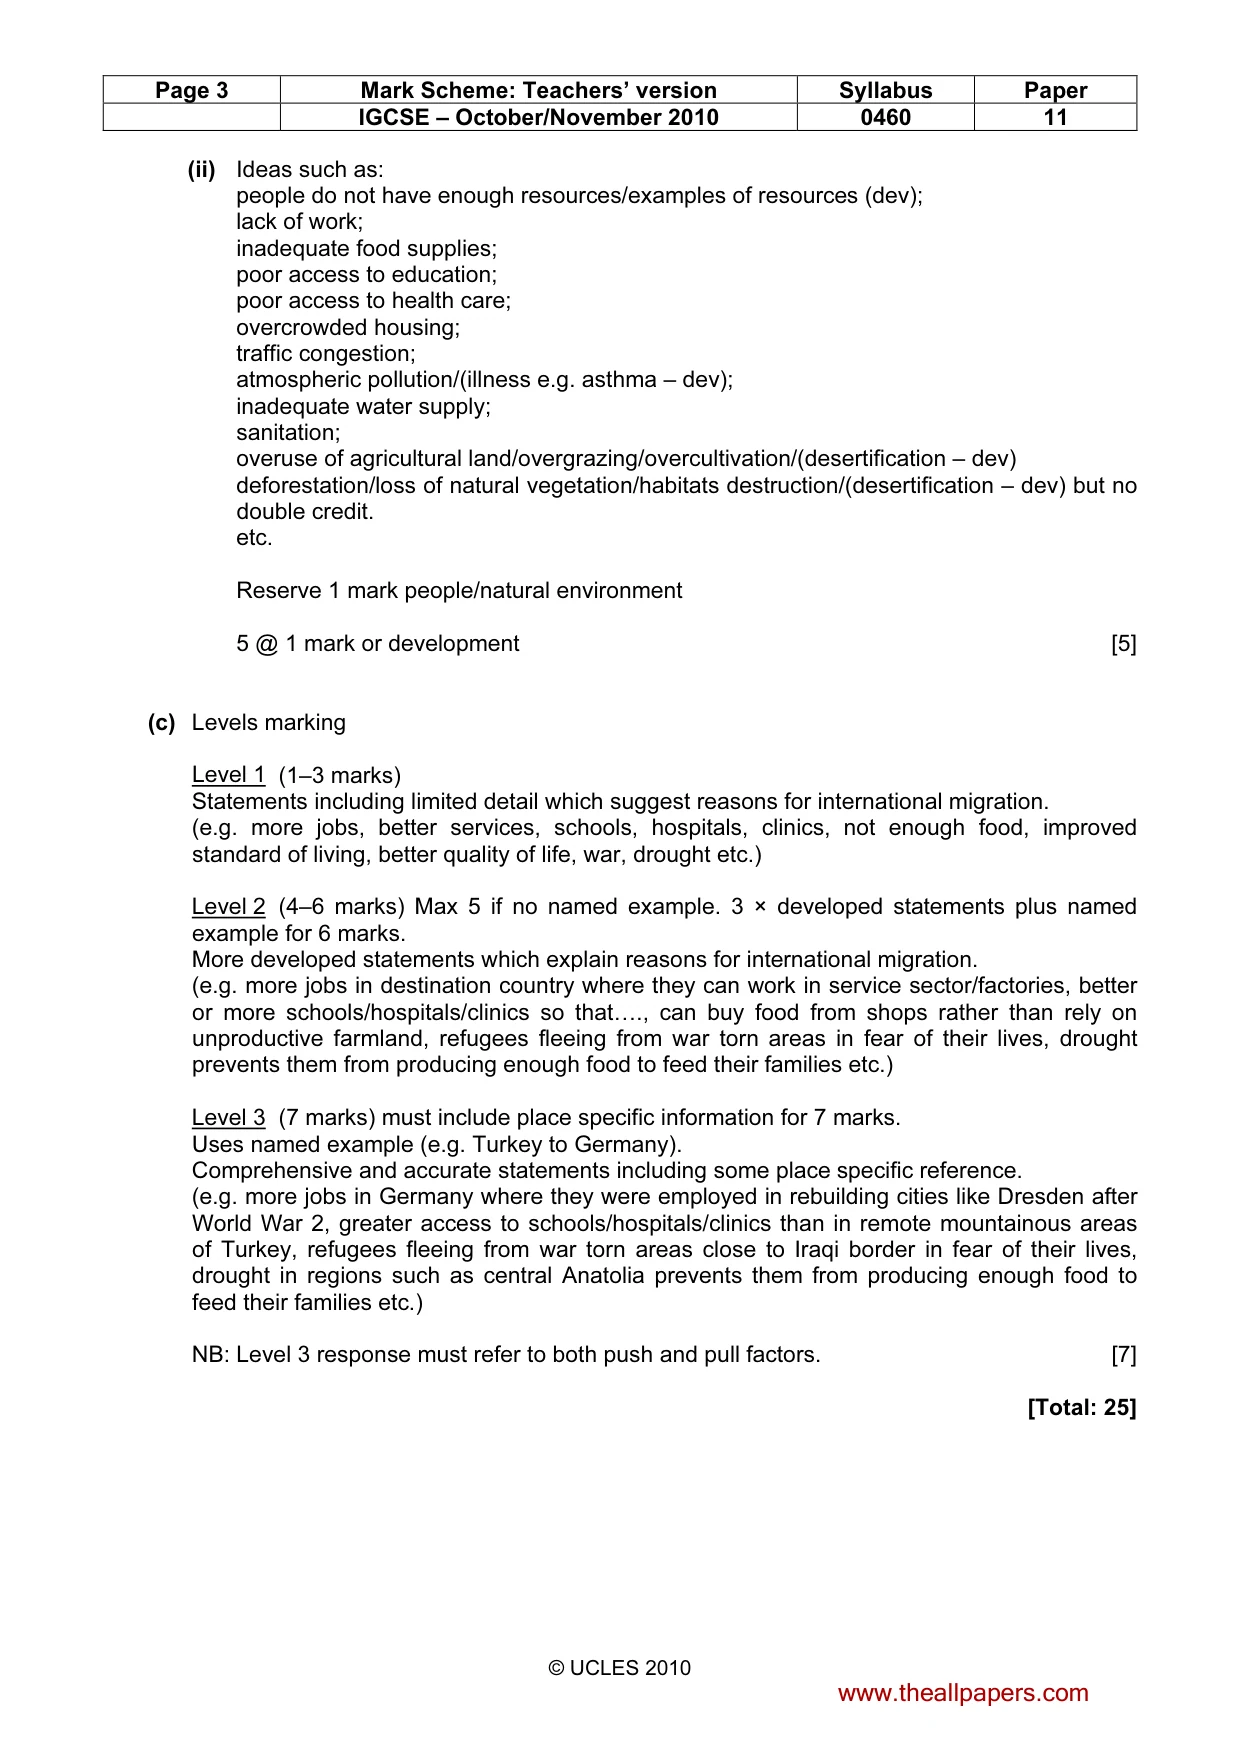
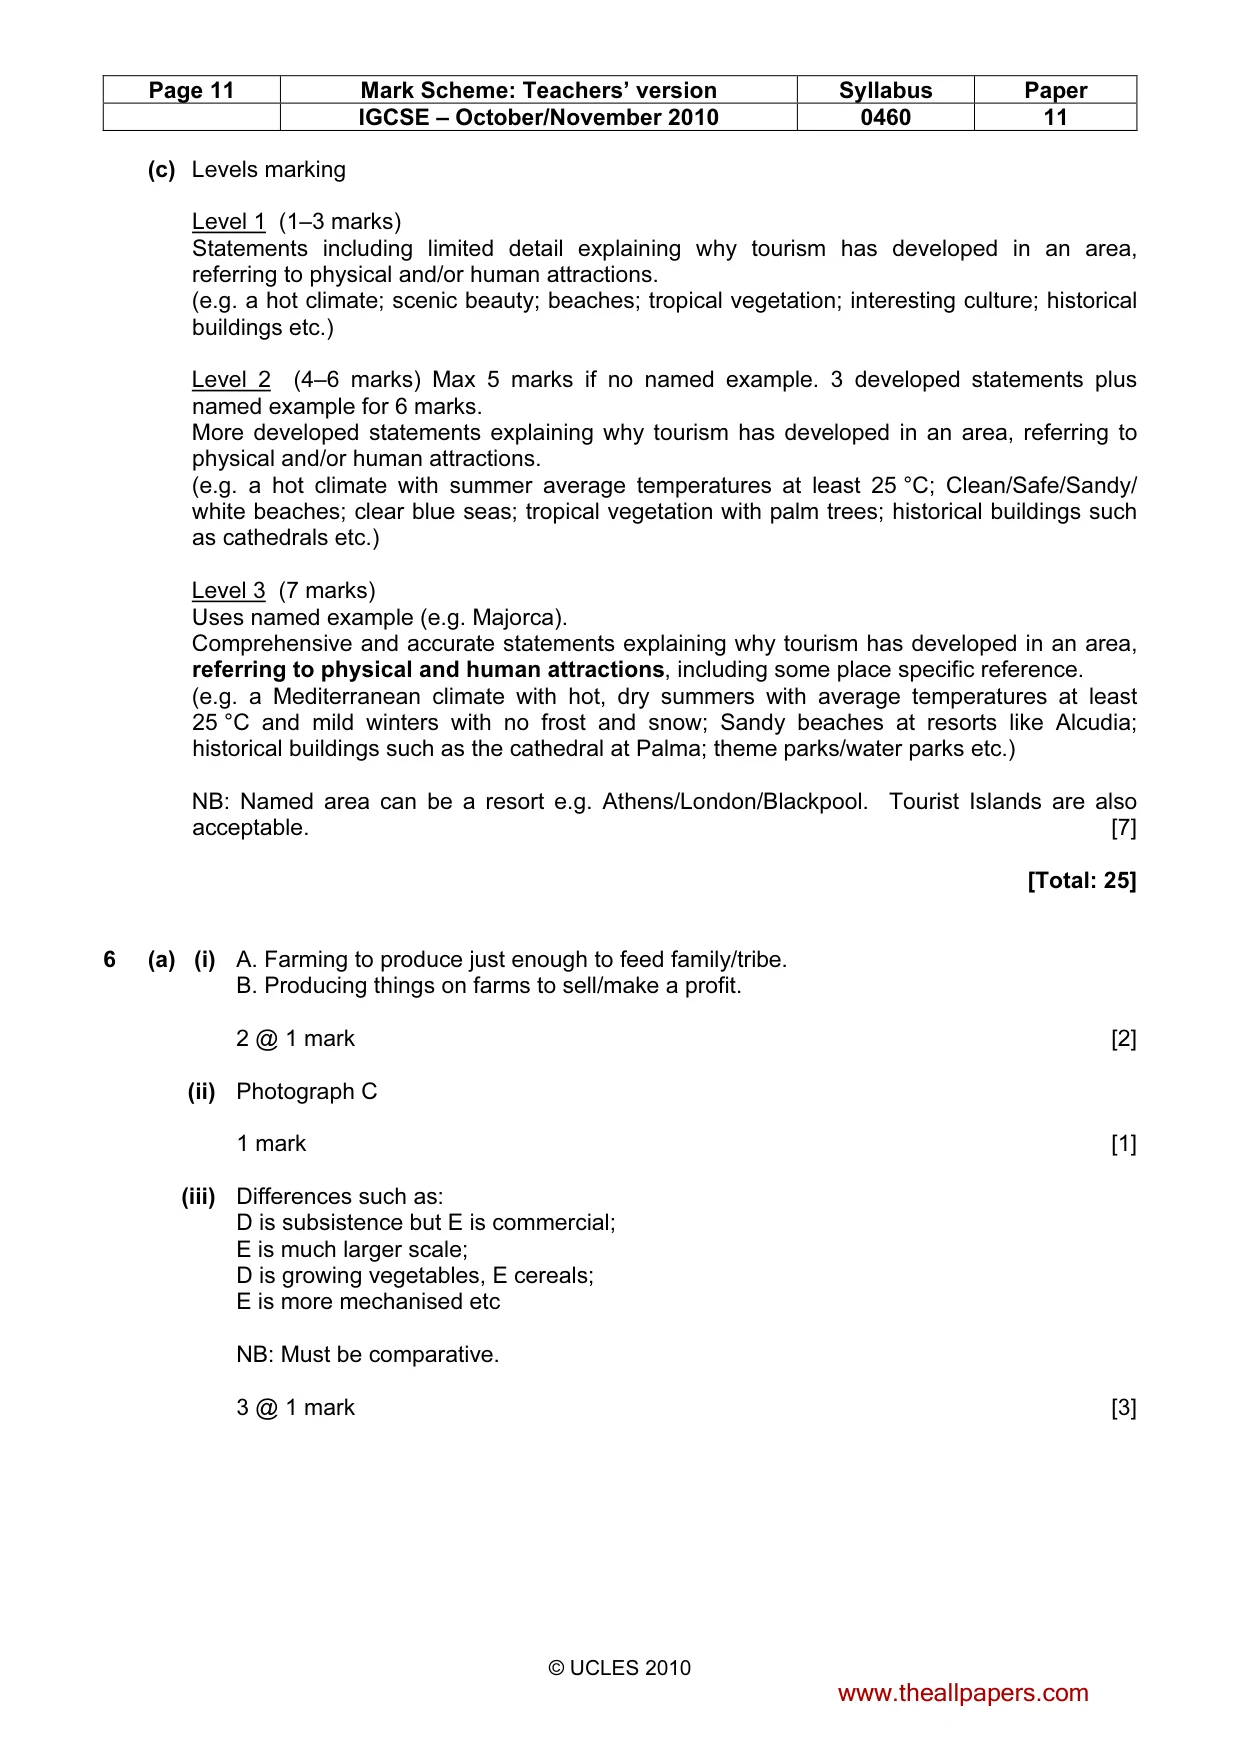
Page 11 Mark Scheme: Teachers’ version Syllabus Paper IGCSE – October/November 2010 0460 11 © UCLES 2010 (c) Levels marking Level 1 (1–3 marks) Statements including limited detail explaining why tourism has developed in an area, referring to physical and/or human attractions. (e.g. a hot climate; scenic beauty; beaches; tropical vegetation; interesting culture; historical buildings etc.) Level 2 (4–6 marks) Max 5 marks if no named example. 3 developed statements plus named example for 6 marks. More developed statements explaining why tourism has developed in an area, referring to physical and/or human attractions. (e.g. a hot climate with summer average temperatures at least 25 °C; Clean/Safe/Sandy/ white beaches; clear blue seas; tropical vegetation with palm trees; historical buildings such as cathedrals etc.) Level 3 (7 marks) Uses named example (e.g. Majorca). Comprehensive and accurate statements explaining why tourism has developed in an area, referring to physical and human attractions, including some place specific reference. (e.g. a Mediterranean climate with hot, dry summers with average temperatures at least 25 °C and mild winters with no frost and snow; Sandy beaches at resorts like Alcudia; historical buildings such as the cathedral at Palma; theme parks/water parks etc.) NB: Named area can be a resort e.g. Athens/London/Blackpool. Tourist Islands are also acceptable. [7] [Total: 25] 6 (a) (i) A. Farming to produce just enough to feed family/tribe. B. Producing things on farms to sell/make a profit. 2 @ 1 mark [2] (ii) Photograph C 1 mark [1] (iii) Differences such as: D is subsistence but E is commercial; E is much larger scale; D is growing vegetables, E cereals; E is more mechanised etc NB: Must be comparative. 3 @ 1 mark [3] www.theallpapers.com
Mark scheme, page 12
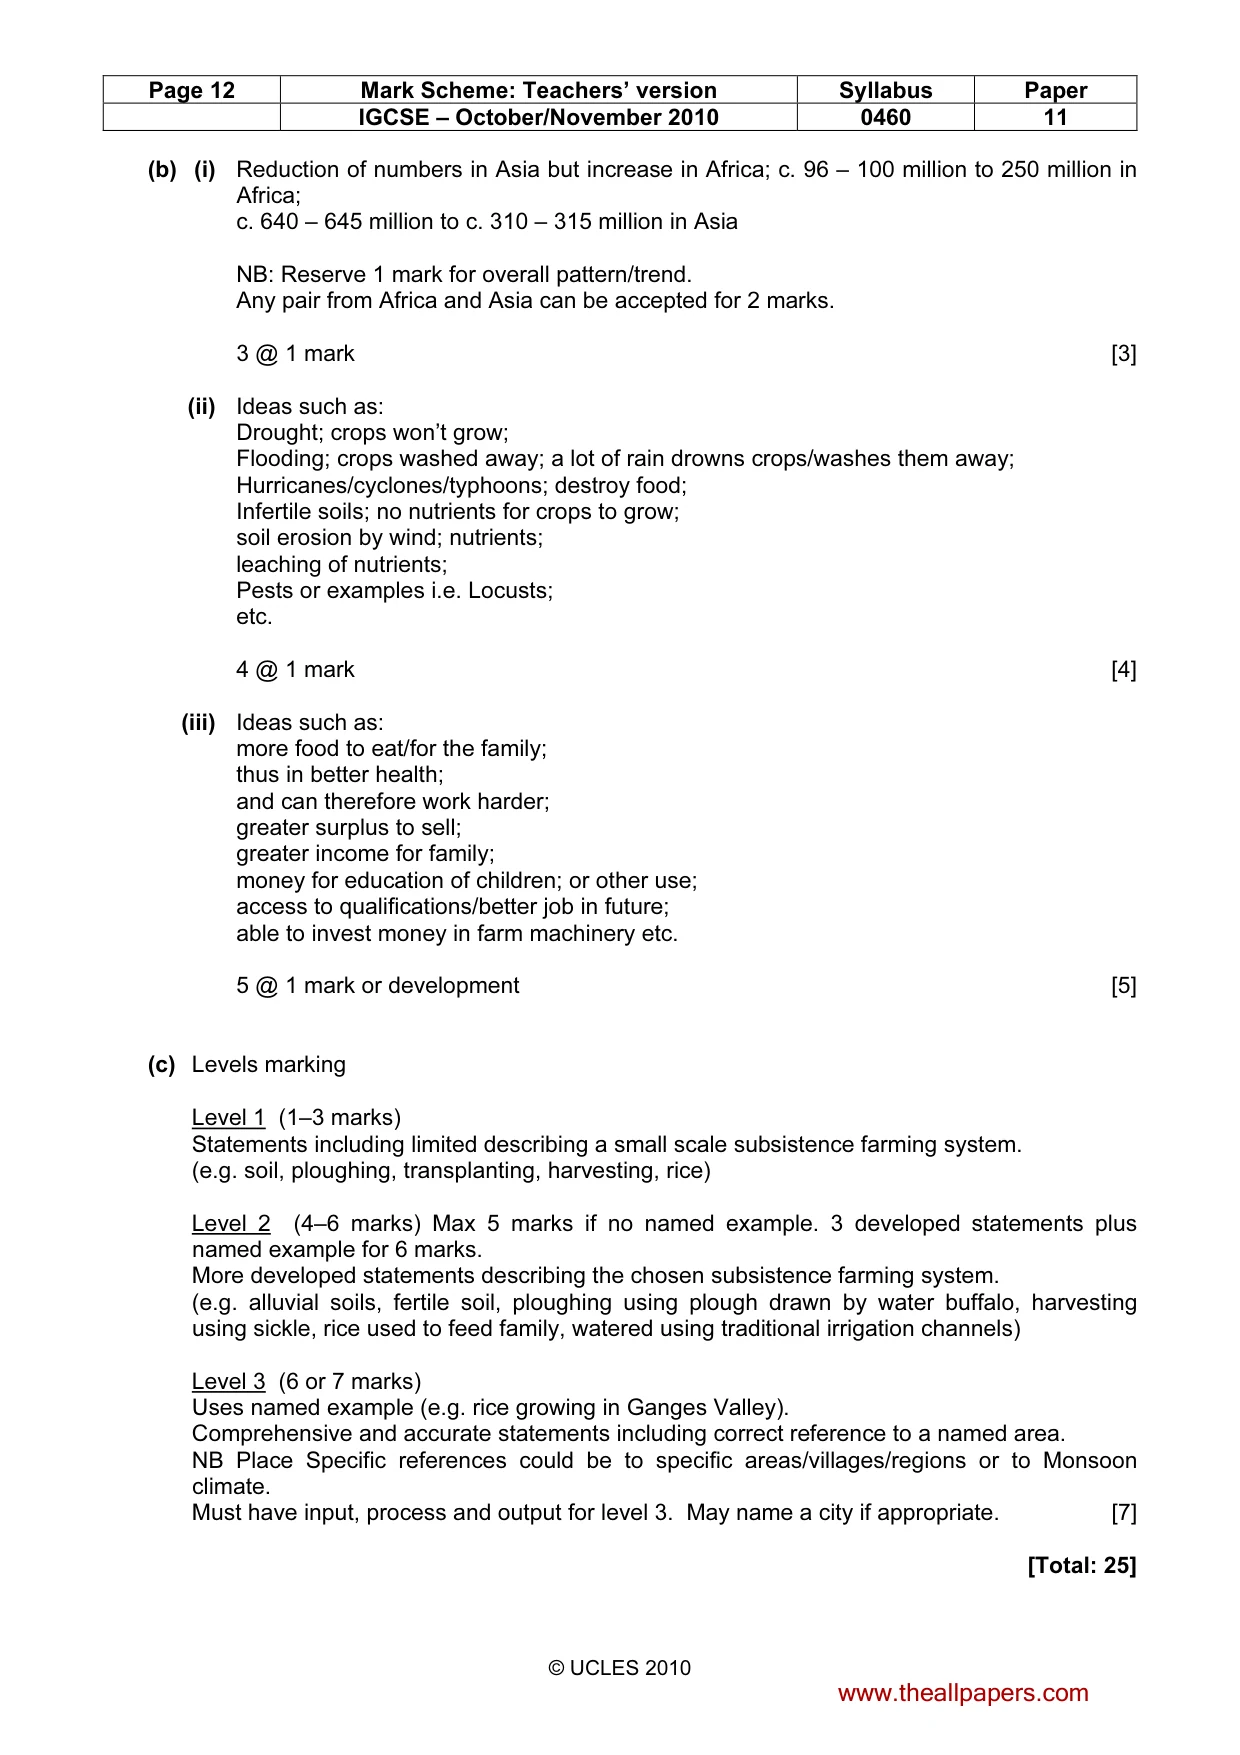
Page 12 Mark Scheme: Teachers’ version Syllabus Paper IGCSE – October/November 2010 0460 11 © UCLES 2010 (b) (i) Reduction of numbers in Asia but increase in Africa; c. 96 – 100 million to 250 million in Africa; c. 640 – 645 million to c. 310 – 315 million in Asia NB: Reserve 1 mark for overall pattern/trend. Any pair from Africa and Asia can be accepted for 2 marks. 3 @ 1 mark [3] (ii) Ideas such as: Drought; crops won’t grow; Flooding; crops washed away; a lot of rain drowns crops/washes them away; Hurricanes/cyclones/typhoons; destroy food; Infertile soils; no nutrients for crops to grow; soil erosion by wind; nutrients; leaching of nutrients; Pests or examples i.e. Locusts; etc. 4 @ 1 mark [4] (iii) Ideas such as: more food to eat/for the family; thus in better health; and can therefore work harder; greater surplus to sell; greater income for family; money for education of children; or other use; access to qualifications/better job in future; able to invest money in farm machinery etc. 5 @ 1 mark or development [5] (c) Levels marking Level 1 (1–3 marks) Statements including limited describing a small scale subsistence farming system. (e.g. soil, ploughing, transplanting, harvesting, rice) Level 2 (4–6 marks) Max 5 marks if no named example. 3 developed statements plus named example for 6 marks. More developed statements describing the chosen subsistence farming system. (e.g. alluvial soils, fertile soil, ploughing using plough drawn by water buffalo, harvesting using sickle, rice used to feed family, watered using traditional irrigation channels) Level 3 (6 or 7 marks) Uses named example (e.g. rice growing in Ganges Valley). Comprehensive and accurate statements including correct reference to a named area. NB Place Specific references could be to specific areas/villages/regions or to Monsoon climate. Must have input, process and output for level 3. May name a city if appropriate. [7] [Total: 25] www.theallpapers.com
What you needed in this session
Cambridge’s own grade thresholds for 2010 Oct/Nov, Paper 1 · Variant 1. A higher threshold means an easier paper — the bar moves with how the cohort did.