Cambridge IGCSE Geography 0460 — 2010 Oct/Nov Paper 1 · Variant 3
0460/13/O/N/10 · 75 marks · ≈84 min
The question paper and its mark scheme, free to read here and free to download. This is Cambridge’s own paper, exactly as it was sat.
Question paper12 pages


Mark scheme13 pages
Answers below. Sit the paper first if you are practising.
Paper as text
Question paper, page 1
This document consists of 11 printed pages, 1 blank page and 1 Insert. DC (CW/SW) 23285/5 © UCLES 2010 [Turn over UNIVERSITY OF CAMBRIDGE INTERNATIONAL EXAMINATIONS International General Certificate of Secondary Education READ THESE INSTRUCTIONS FIRST If you have been given an Answer Booklet, follow the instructions on the front cover of the Booklet. Write your Centre number, candidate number and name on all the work you hand in. Write in dark blue or black pen. You may use a soft pencil for any diagrams, graphs, or rough working. Do not use staples, paper clips, highlighters, glue or correction fluid. Answer three questions. Sketch maps and diagrams should be drawn whenever they serve to illustrate an answer. The Insert contains Photographs A and B for Question 2, Photograph C for Question 4, Figs 8A and 8B for Question 5 and Photograph D for Question 6. At the end of the examination, fasten all your work securely together. The number of marks is given in brackets [ ] at the end of each question or part question. * 1 3 7 6 5 4 1 0 1 3 * GEOGRAPHY 0460/13 Paper 1 October/November 2010 1 hour 45 minutes Additional Materials: Answer Booklet/Paper www.theallpapers.com
Question paper, page 2
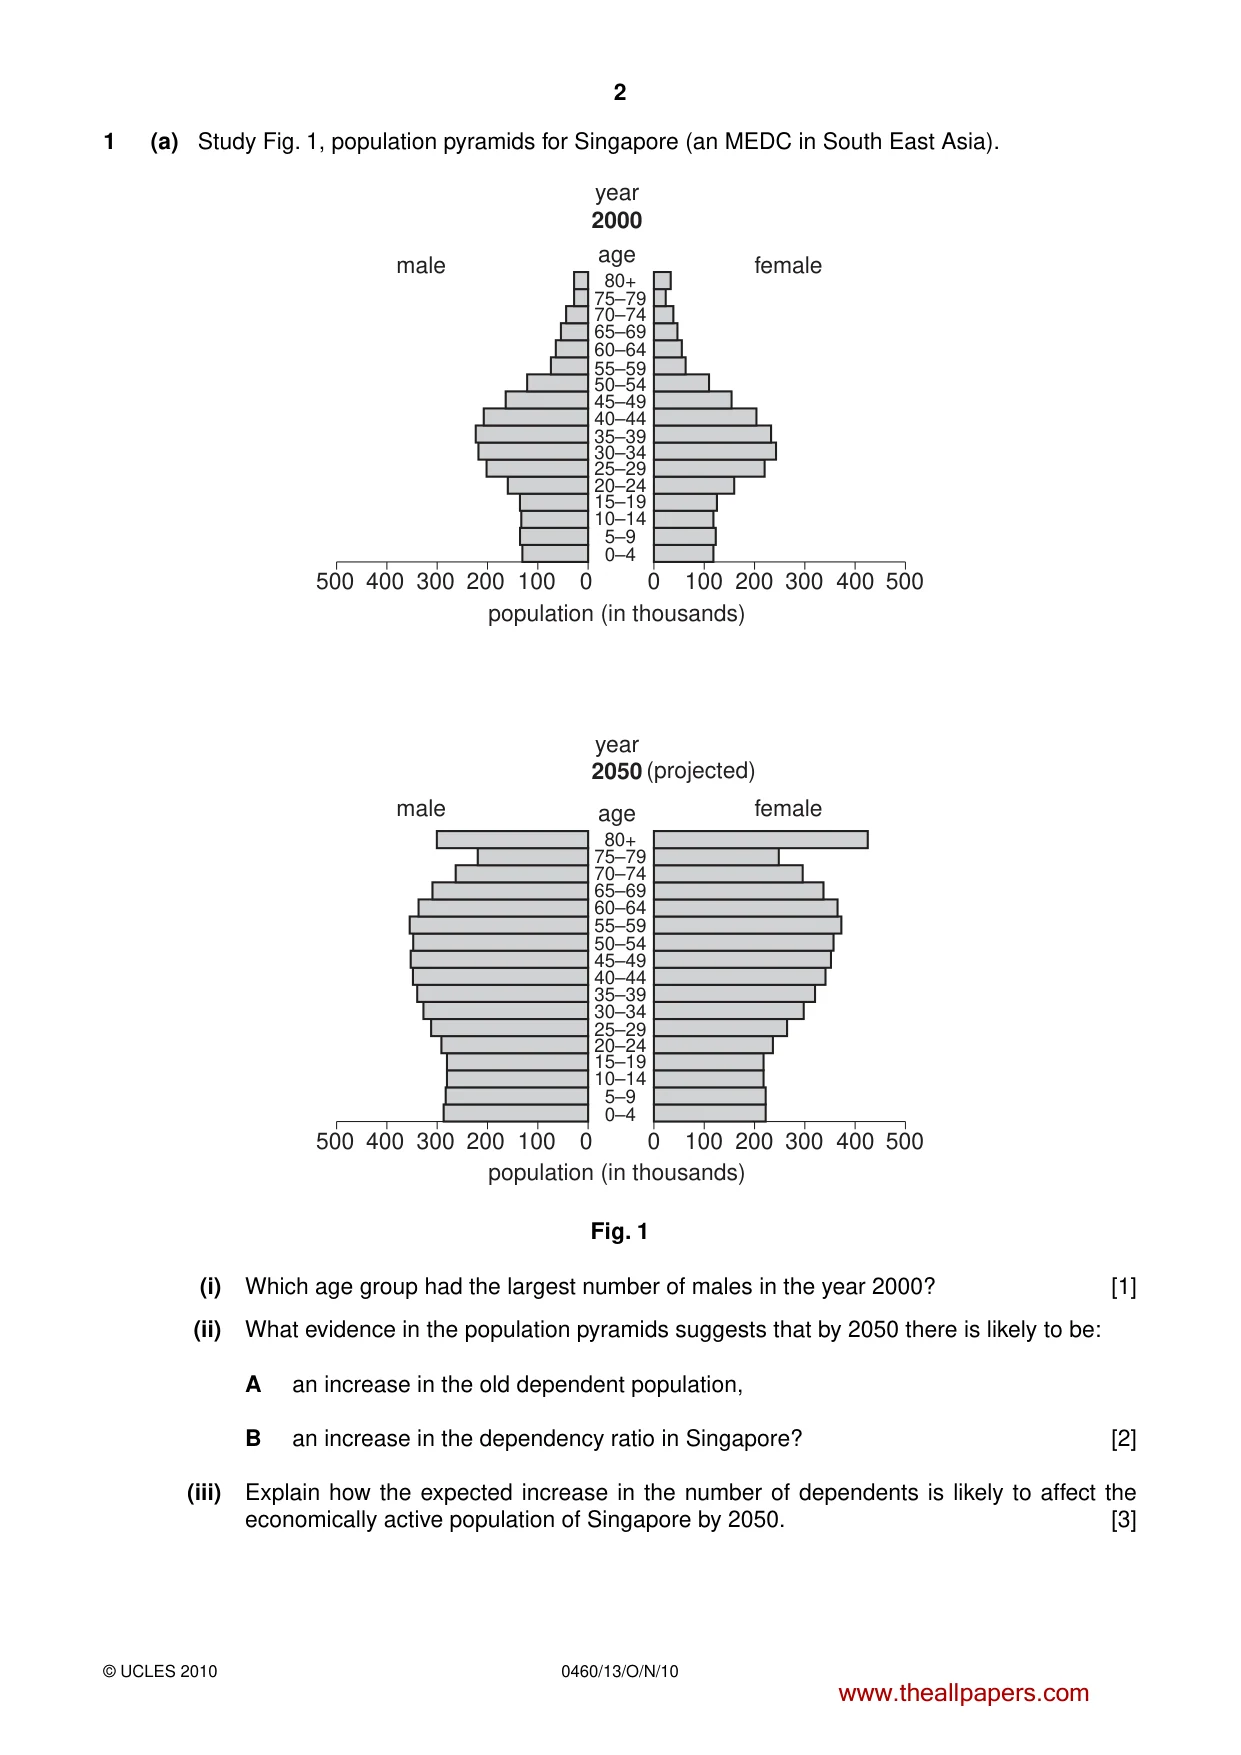
2 0460/13/O/N/10 © UCLES 2010 1 (a) Study Fig. 1, population pyramids for Singapore (an MEDC in South East Asia). 0–4 0 population (in thousands) year 2000 age age male female 100 200 300 400 500 500 400 300 200 100 0 5–9 10–14 15–19 20–24 25–29 30–34 35–39 40–44 45–49 50–54 55–59 60–64 65–69 70–74 75–79 80+ 0–4 0 population (in thousands) year 2050 (projected) male female 100 200 300 400 500 500 400 300 200 100 0 5–9 10–14 15–19 20–24 25–29 30–34 35–39 40–44 45–49 50–54 55–59 60–64 65–69 70–74 75–79 80+ Fig. 1 (i) Which age group had the largest number of males in the year 2000? [1] (ii) What evidence in the population pyramids suggests that by 2050 there is likely to be: A an increase in the old dependent population, B an increase in the dependency ratio in Singapore? [2] (iii) Explain how the expected increase in the number of dependents is likely to affect the economically active population of Singapore by 2050. [3] www.theallpapers.com
Question paper, page 3
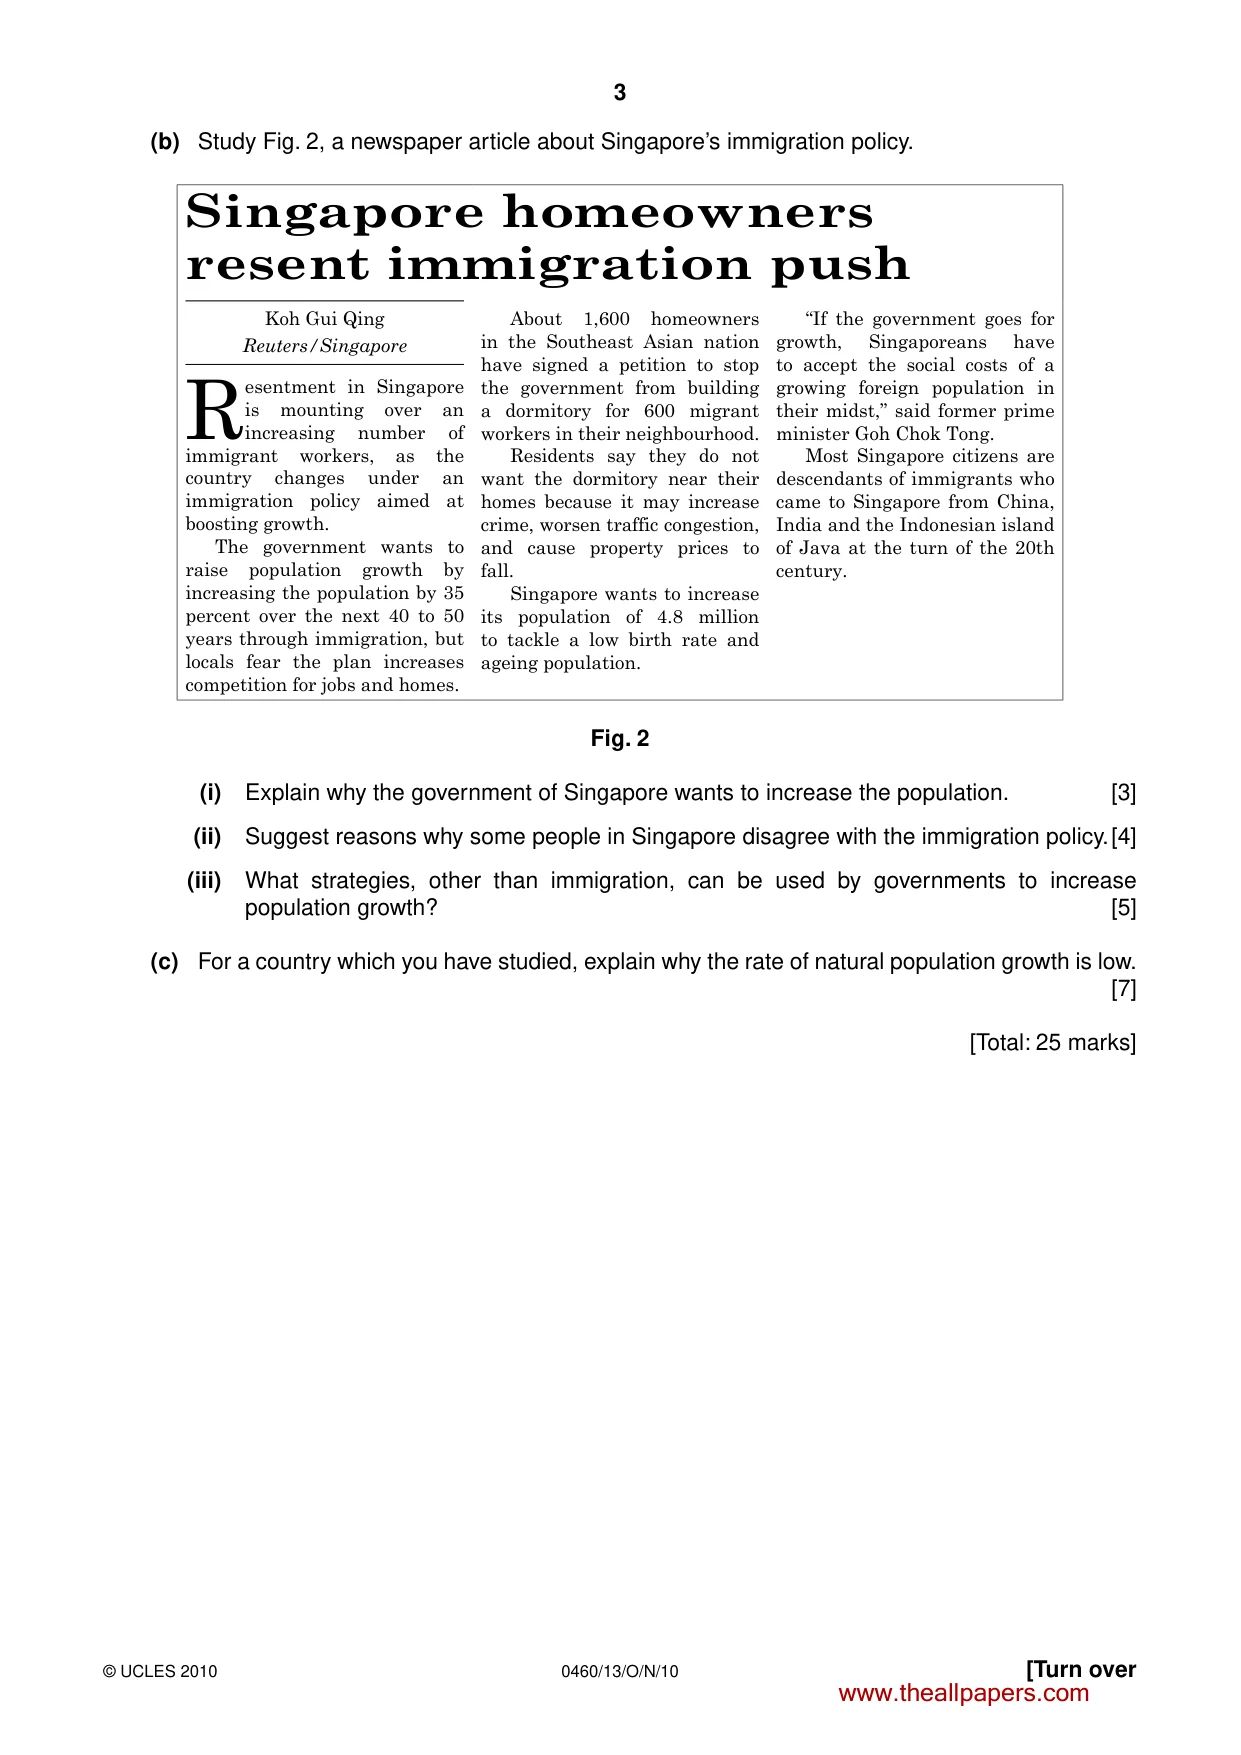
3 0460/13/O/N/10 © UCLES 2010 [Turn over (b) Study Fig. 2, a newspaper article about Singapore’s immigration policy. Singapore homeowners resent immigration push Koh Gui Qing Reuters/Singapore R esentment in Singapore is mounting over an increasing number of immigrant workers, as the country changes under an immigration policy aimed at boosting growth. The government wants to raise population growth by increasing the population by 35 percent over the next 40 to 50 years through immigration, but locals fear the plan increases competition for jobs and homes. About 1,600 homeowners in the Southeast Asian nation have signed a petition to stop the government from building a dormitory for 600 migrant workers in their neighbourhood. Residents say they do not want the dormitory near their homes because it may increase crime, worsen traffic congestion, and cause property prices to fall. Singapore wants to increase its population of 4.8 million to tackle a low birth rate and ageing population. “If the government goes for growth, Singaporeans have to accept the social costs of a growing foreign population in their midst,” said former prime minister Goh Chok Tong. Most Singapore citizens are descendants of immigrants who came to Singapore from China, India and the Indonesian island of Java at the turn of the 20th century. Fig. 2 (i) Explain why the government of Singapore wants to increase the population. [3] (ii) Suggest reasons why some people in Singapore disagree with the immigration policy. [4] (iii) What strategies, other than immigration, can be used by governments to increase population growth? [5] (c) For a country which you have studied, explain why the rate of natural population growth is low. [7] [Total: 25 marks] www.theallpapers.com
Question paper, page 4
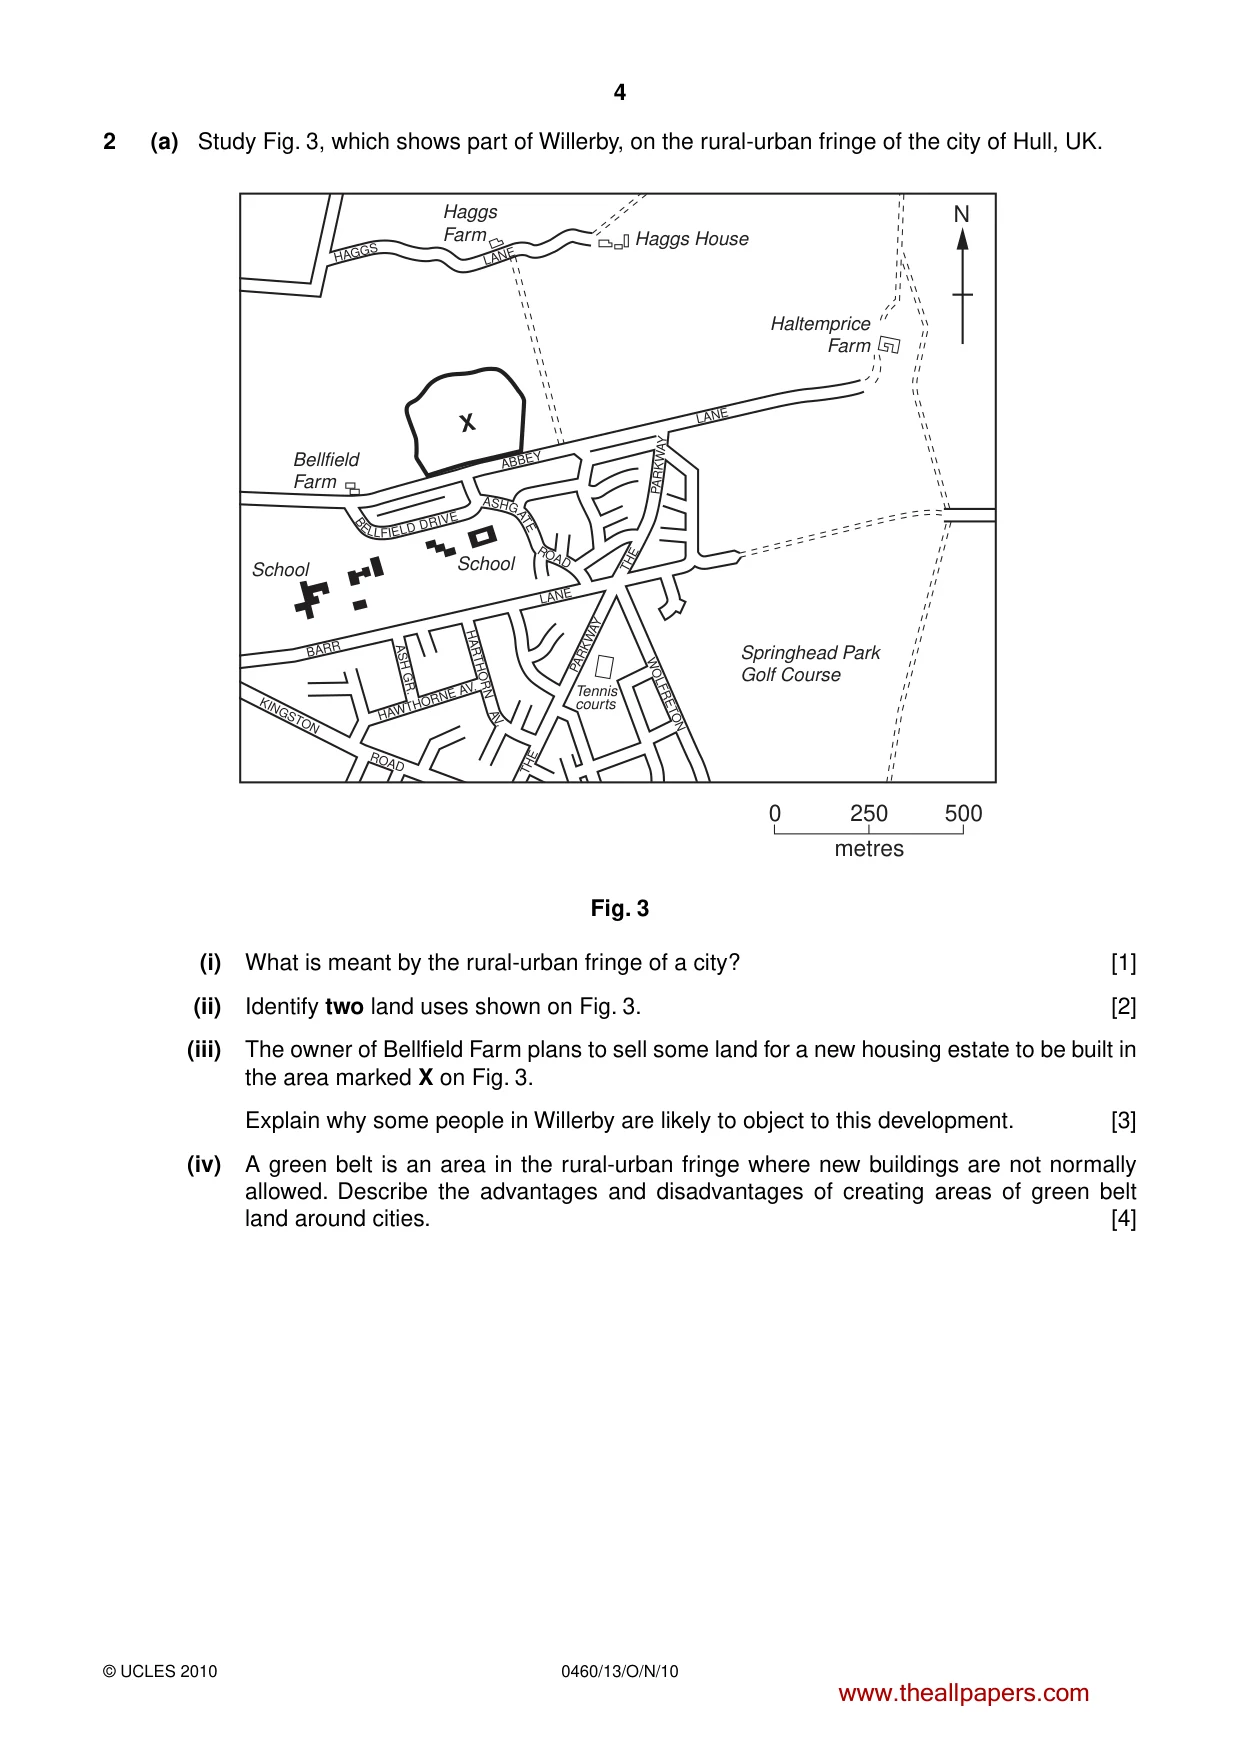
4 0460/13/O/N/10 © UCLES 2010 2 (a) Study Fig. 3, which shows part of Willerby, on the rural-urban fringe of the city of Hull, UK. B E L L F I ELD DRIVE Haggs House Haggs Farm Bellfield Farm School Tennis courts KINGSTON HAWTHORNE AV. ASH GR. WOLFRETON ROAD BARR LANE PARKWAY THE PARKWAY LANE ABBEY HAGGS LANE X THE School Springhead Park Golf Course 0 250 metres 500 Haltemprice Farm N AS H G A T E R O A D HARTHORN A V . Fig. 3 (i) What is meant by the rural-urban fringe of a city? [1] (ii) Identify two land uses shown on Fig. 3. [2] (iii) The owner of Bellfield Farm plans to sell some land for a new housing estate to be built in the area marked X on Fig. 3. Explain why some people in Willerby are likely to object to this development. [3] (iv) A green belt is an area in the rural-urban fringe where new buildings are not normally allowed. Describe the advantages and disadvantages of creating areas of green belt land around cities. [4] www.theallpapers.com
Question paper, page 5
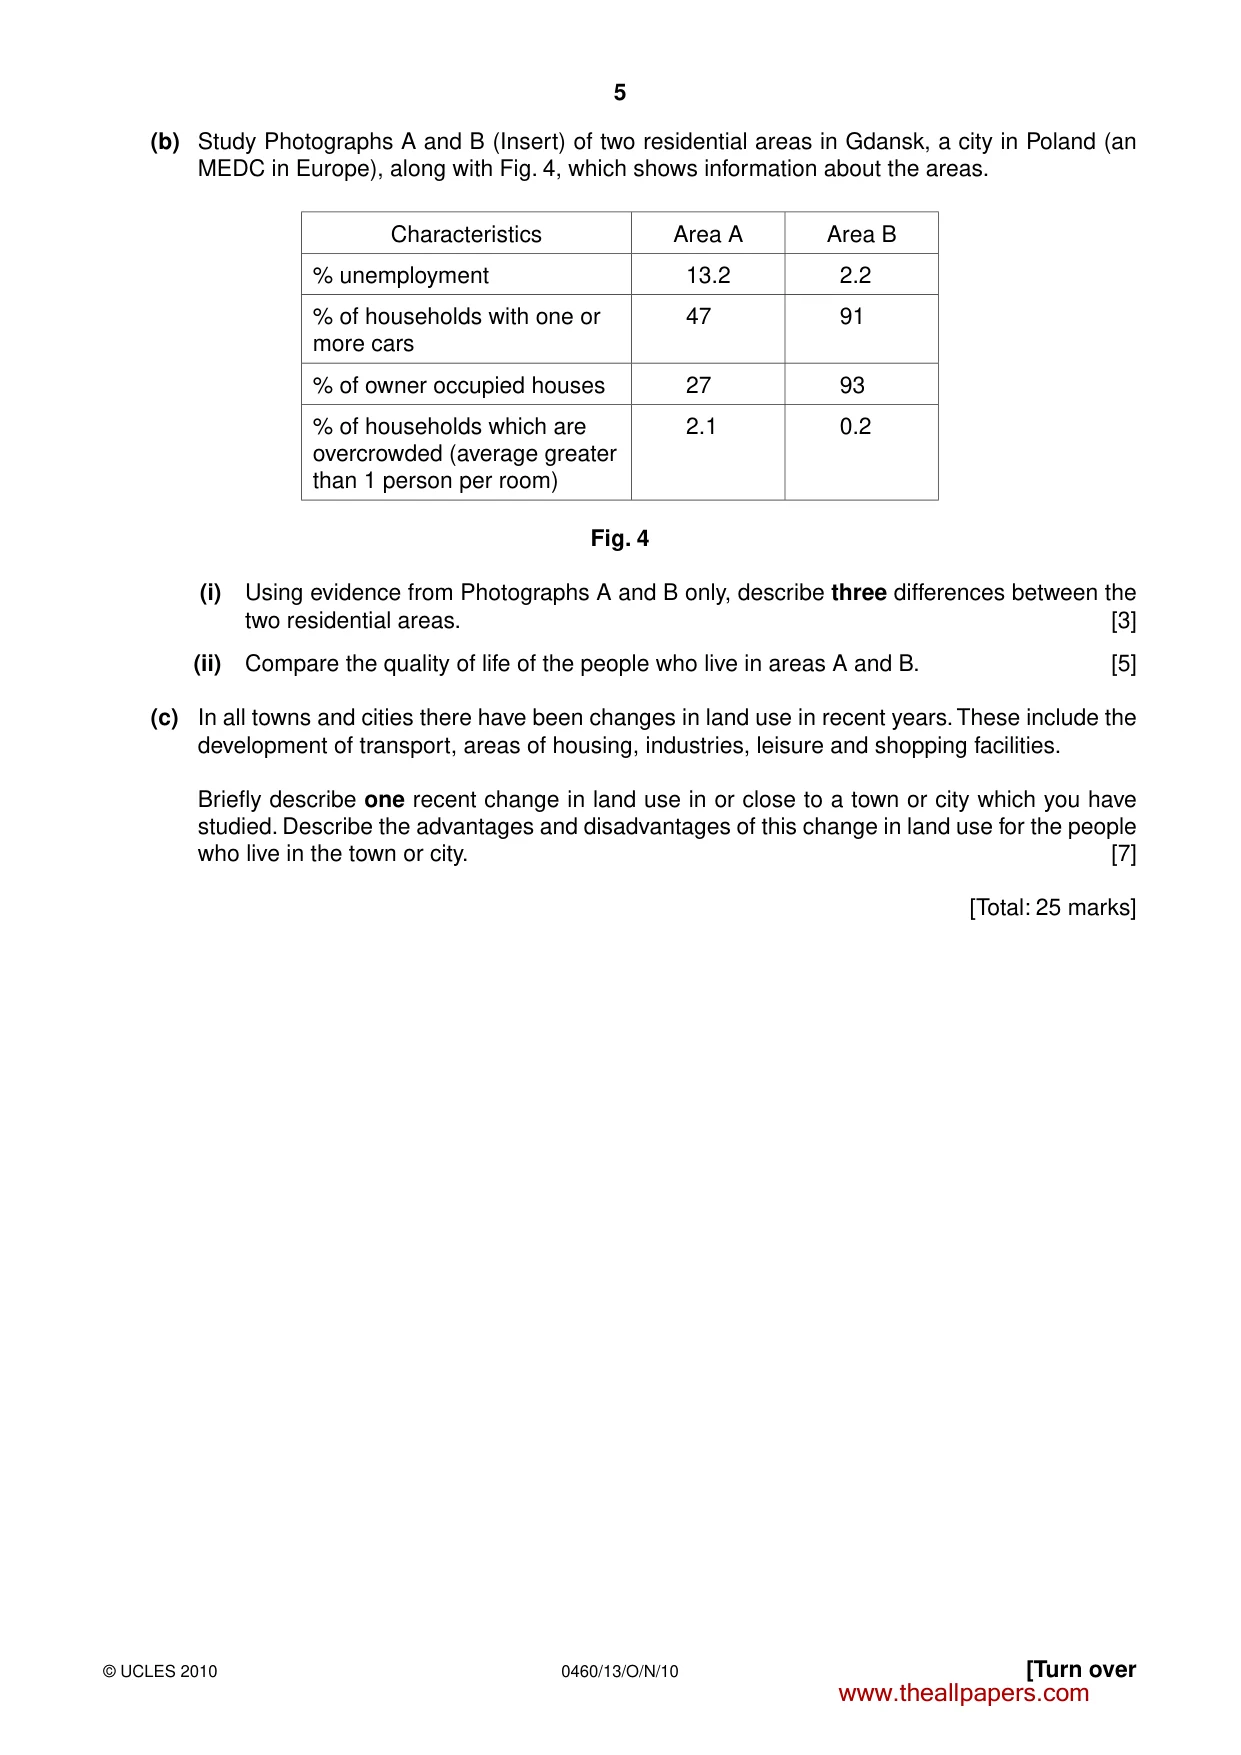
5 0460/13/O/N/10 © UCLES 2010 [Turn over (b) Study Photographs A and B (Insert) of two residential areas in Gdansk, a city in Poland (an MEDC in Europe), along with Fig. 4, which shows information about the areas. Characteristics Area A Area B % unemployment 13.2 2.2 % of households with one or more cars 47 91 % of owner occupied houses 27 93 % of households which are overcrowded (average greater than 1 person per room) 2.1 0.2 Fig. 4 (i) Using evidence from Photographs A and B only, describe three differences between the two residential areas. [3] (ii) Compare the quality of life of the people who live in areas A and B. [5] (c) In all towns and cities there have been changes in land use in recent years. These include the development of transport, areas of housing, industries, leisure and shopping facilities. Briefly describe one recent change in land use in or close to a town or city which you have studied. Describe the advantages and disadvantages of this change in land use for the people who live in the town or city. [7] [Total: 25 marks] www.theallpapers.com
Question paper, page 6
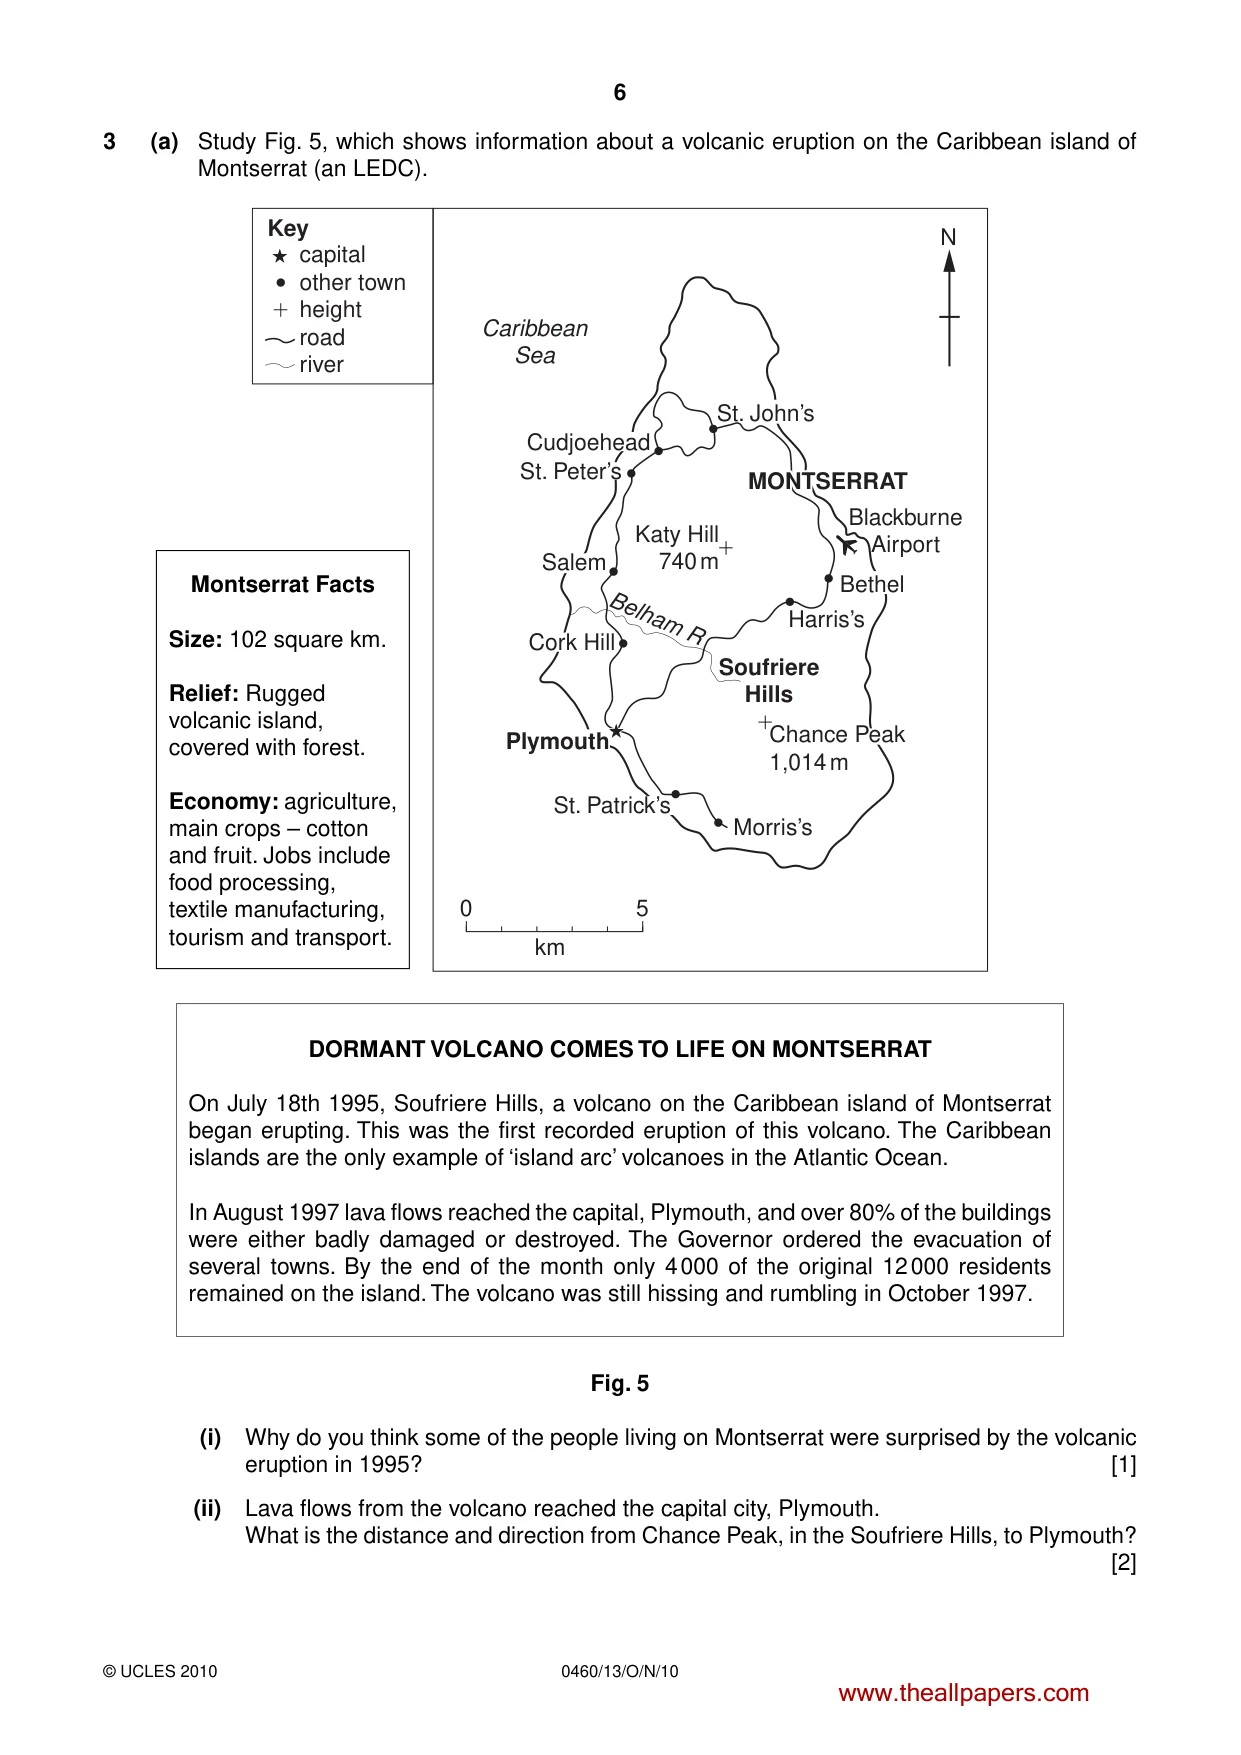
6 0460/13/O/N/10 © UCLES 2010 3 (a) Study Fig. 5, which shows information about a volcanic eruption on the Caribbean island of Montserrat (an LEDC). Katy Hill 740 m Chance Peak 1,014 m Morris’s 5 0 km St. Patrick’s Cork Hill Salem Belham R St. Peter’s Cudjoehead St. John’s Bethel Harris’s Blackburne Airport MONTSERRAT MONTSERRAT Caribbean Sea Plymouth Soufriere Hills capital other town height road river Key N DORMANT VOLCANO COMES TO LIFE ON MONTSERRAT On July 18th 1995, Soufriere Hills, a volcano on the Caribbean island of Montserrat began erupting. This was the first recorded eruption of this volcano. The Caribbean islands are the only example of ‘island arc’ volcanoes in the Atlantic Ocean. In August 1997 lava flows reached the capital, Plymouth, and over 80% of the buildings were either badly damaged or destroyed. The Governor ordered the evacuation of several towns. By the end of the month only 4 000 of the original 12 000 residents remained on the island. The volcano was still hissing and rumbling in October 1997. Fig. 5 (i) Why do you think some of the people living on Montserrat were surprised by the volcanic eruption in 1995? [1] (ii) Lava flows from the volcano reached the capital city, Plymouth. What is the distance and direction from Chance Peak, in the Soufriere Hills, to Plymouth? [2] Montserrat Facts Size: 102 square km. Relief: Rugged volcanic island, covered with forest. Economy: agriculture, main crops – cotton and fruit. Jobs include food processing, textile manufacturing, tourism and transport. www.theallpapers.com
Question paper, page 7
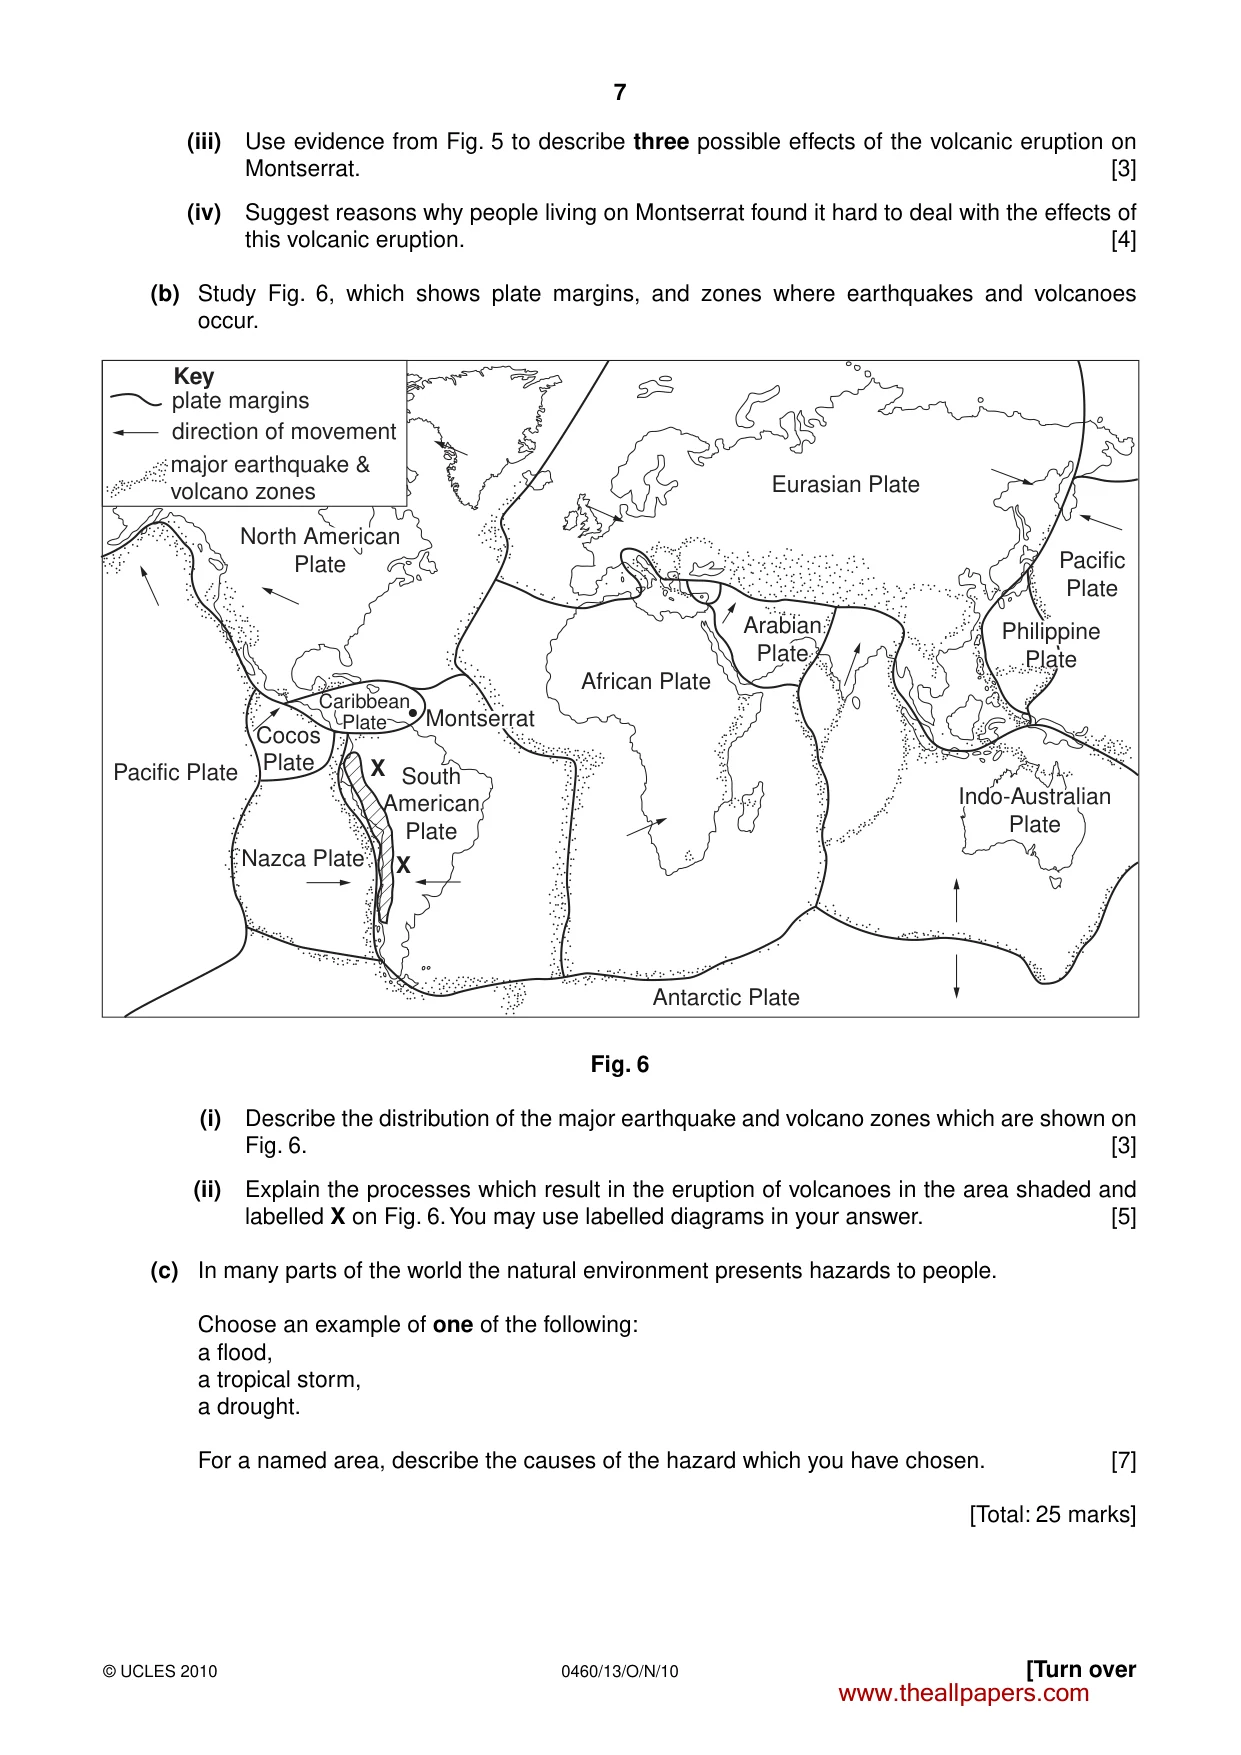
7 0460/13/O/N/10 © UCLES 2010 [Turn over (iii) Use evidence from Fig. 5 to describe three possible effects of the volcanic eruption on Montserrat. [3] (iv) Suggest reasons why people living on Montserrat found it hard to deal with the effects of this volcanic eruption. [4] (b) Study Fig. 6, which shows plate margins, and zones where earthquakes and volcanoes occur. plate margins direction of movement Key major earthquake & volcano zones African Plate Arabian Plate Eurasian Plate Pacific Plate Philippine Plate Indo-Australian Plate Antarctic Plate South American Plate X X Nazca Plate Pacific Plate North American Plate Cocos Plate Montserrat Caribbean Plate Fig. 6 (i) Describe the distribution of the major earthquake and volcano zones which are shown on Fig. 6. [3] (ii) Explain the processes which result in the eruption of volcanoes in the area shaded and labelled X on Fig. 6. You may use labelled diagrams in your answer. [5] (c) In many parts of the world the natural environment presents hazards to people. Choose an example of one of the following: a flood, a tropical storm, a drought. For a named area, describe the causes of the hazard which you have chosen. [7] [Total: 25 marks] www.theallpapers.com
Question paper, page 8
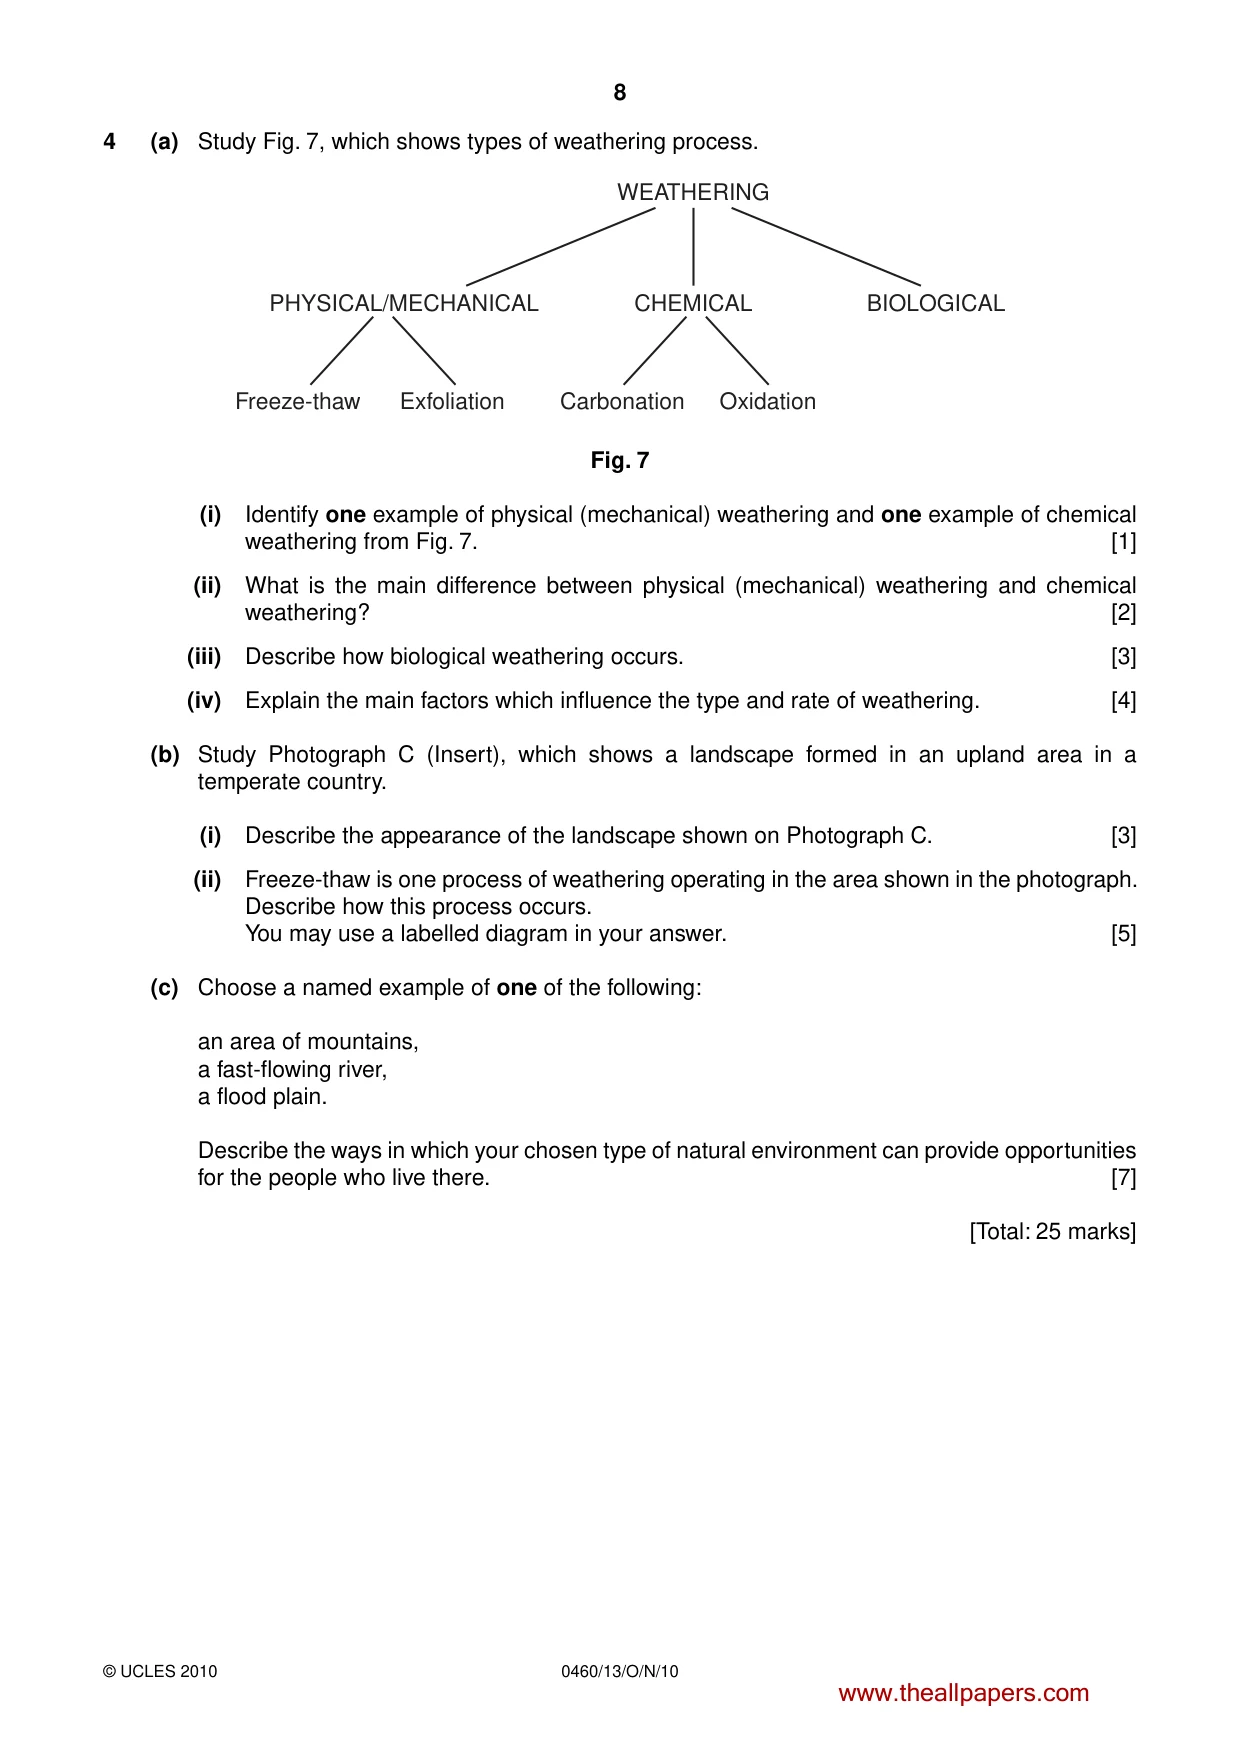
8 0460/13/O/N/10 © UCLES 2010 4 (a) Study Fig. 7, which shows types of weathering process. WEATHERING CHEMICAL PHYSICAL/MECHANICAL Freeze-thaw Exfoliation Carbonation Oxidation BIOLOGICAL Fig. 7 (i) Identify one example of physical (mechanical) weathering and one example of chemical weathering from Fig. 7. [1] (ii) What is the main difference between physical (mechanical) weathering and chemical weathering? [2] (iii) Describe how biological weathering occurs. [3] (iv) Explain the main factors which influence the type and rate of weathering. [4] (b) Study Photograph C (Insert), which shows a landscape formed in an upland area in a temperate country. (i) Describe the appearance of the landscape shown on Photograph C. [3] (ii) Freeze-thaw is one process of weathering operating in the area shown in the photograph. Describe how this process occurs. You may use a labelled diagram in your answer. [5] (c) Choose a named example of one of the following: an area of mountains, a fast-flowing river, a flood plain. Describe the ways in which your chosen type of natural environment can provide opportunities for the people who live there. [7] [Total: 25 marks] www.theallpapers.com
Question paper, page 9
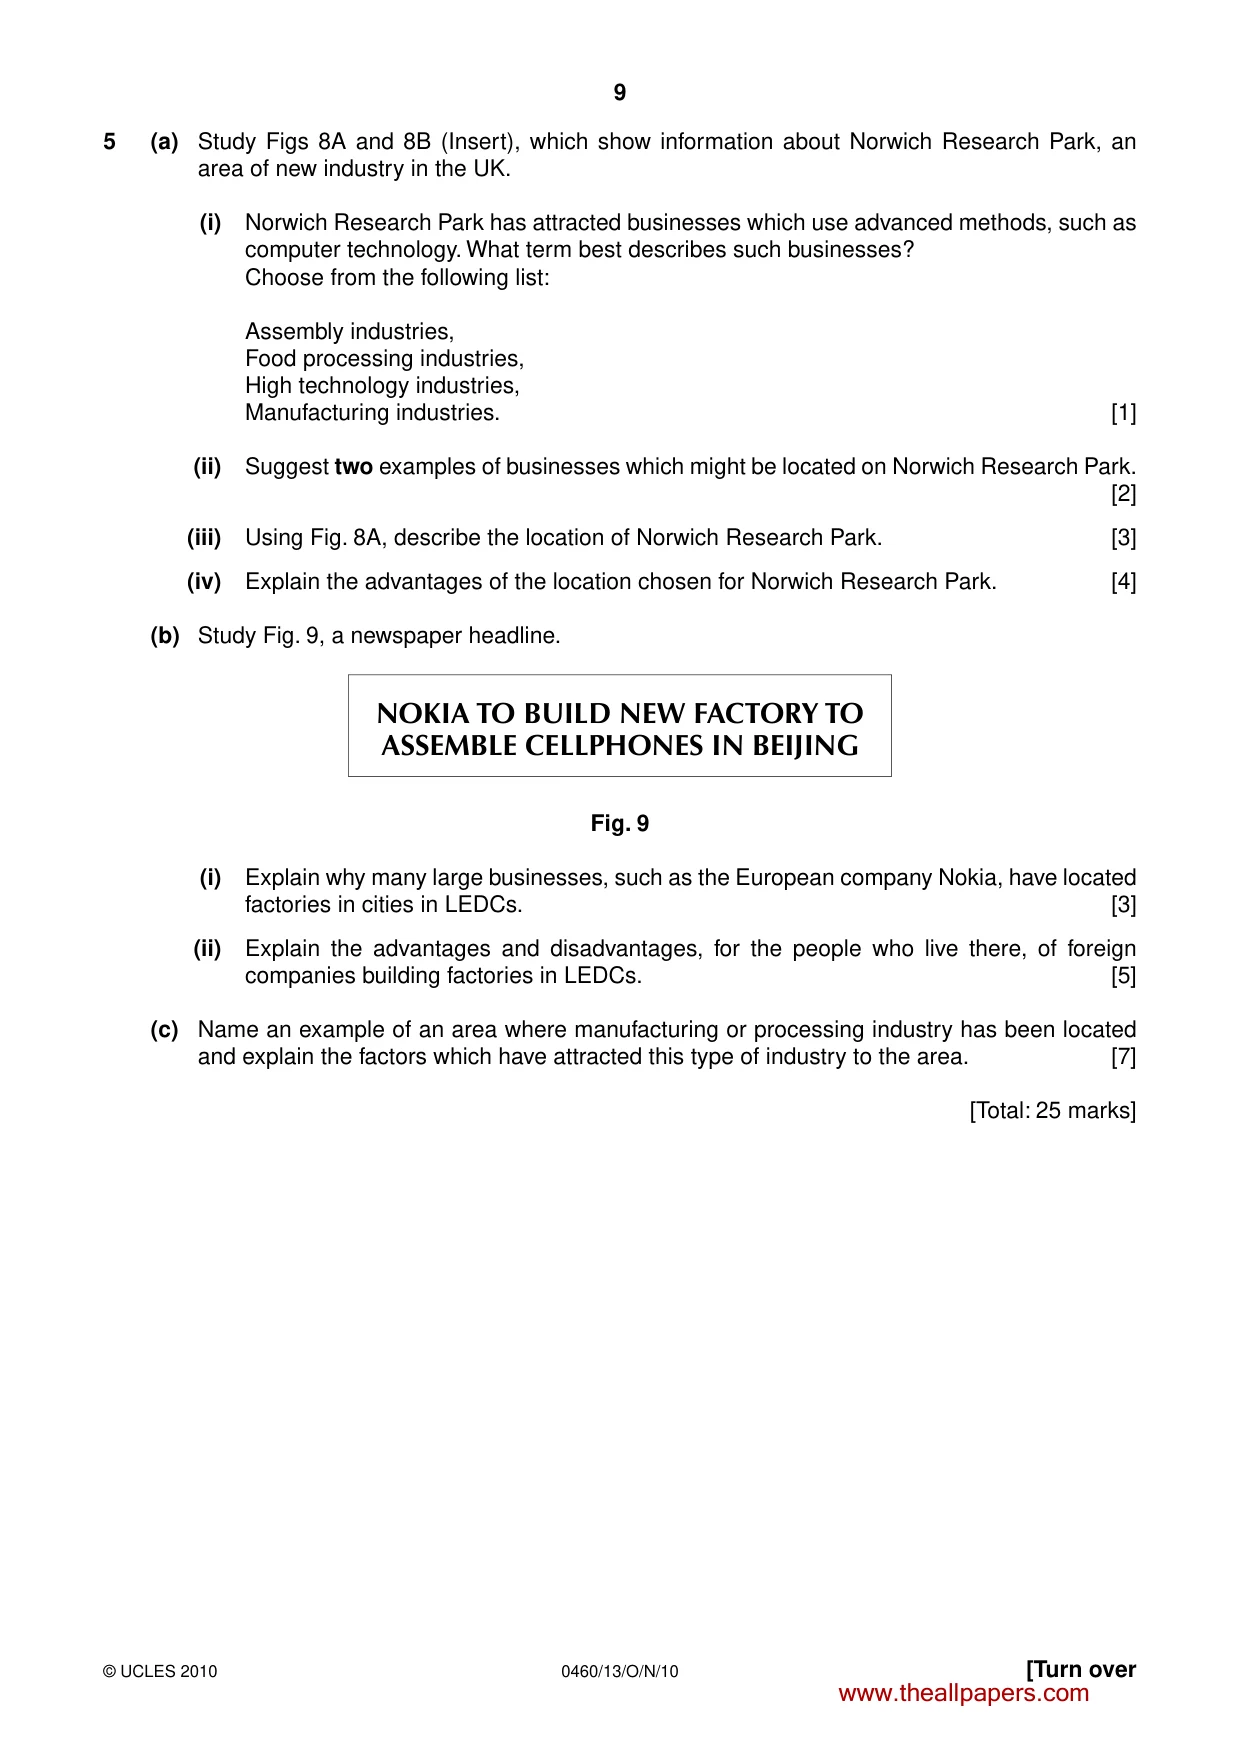
9 0460/13/O/N/10 © UCLES 2010 [Turn over 5 (a) Study Figs 8A and 8B (Insert), which show information about Norwich Research Park, an area of new industry in the UK. (i) Norwich Research Park has attracted businesses which use advanced methods, such as computer technology. What term best describes such businesses? Choose from the following list: Assembly industries, Food processing industries, High technology industries, Manufacturing industries. [1] (ii) Suggest two examples of businesses which might be located on Norwich Research Park. [2] (iii) Using Fig. 8A, describe the location of Norwich Research Park. [3] (iv) Explain the advantages of the location chosen for Norwich Research Park. [4] (b) Study Fig. 9, a newspaper headline. NOKIA TO BUILD NEW FACTORY TO ASSEMBLE CELLPHONES IN BEIJING Fig. 9 (i) Explain why many large businesses, such as the European company Nokia, have located factories in cities in LEDCs. [3] (ii) Explain the advantages and disadvantages, for the people who live there, of foreign companies building factories in LEDCs. [5] (c) Name an example of an area where manufacturing or processing industry has been located and explain the factors which have attracted this type of industry to the area. [7] [Total: 25 marks] www.theallpapers.com
Question paper, page 10
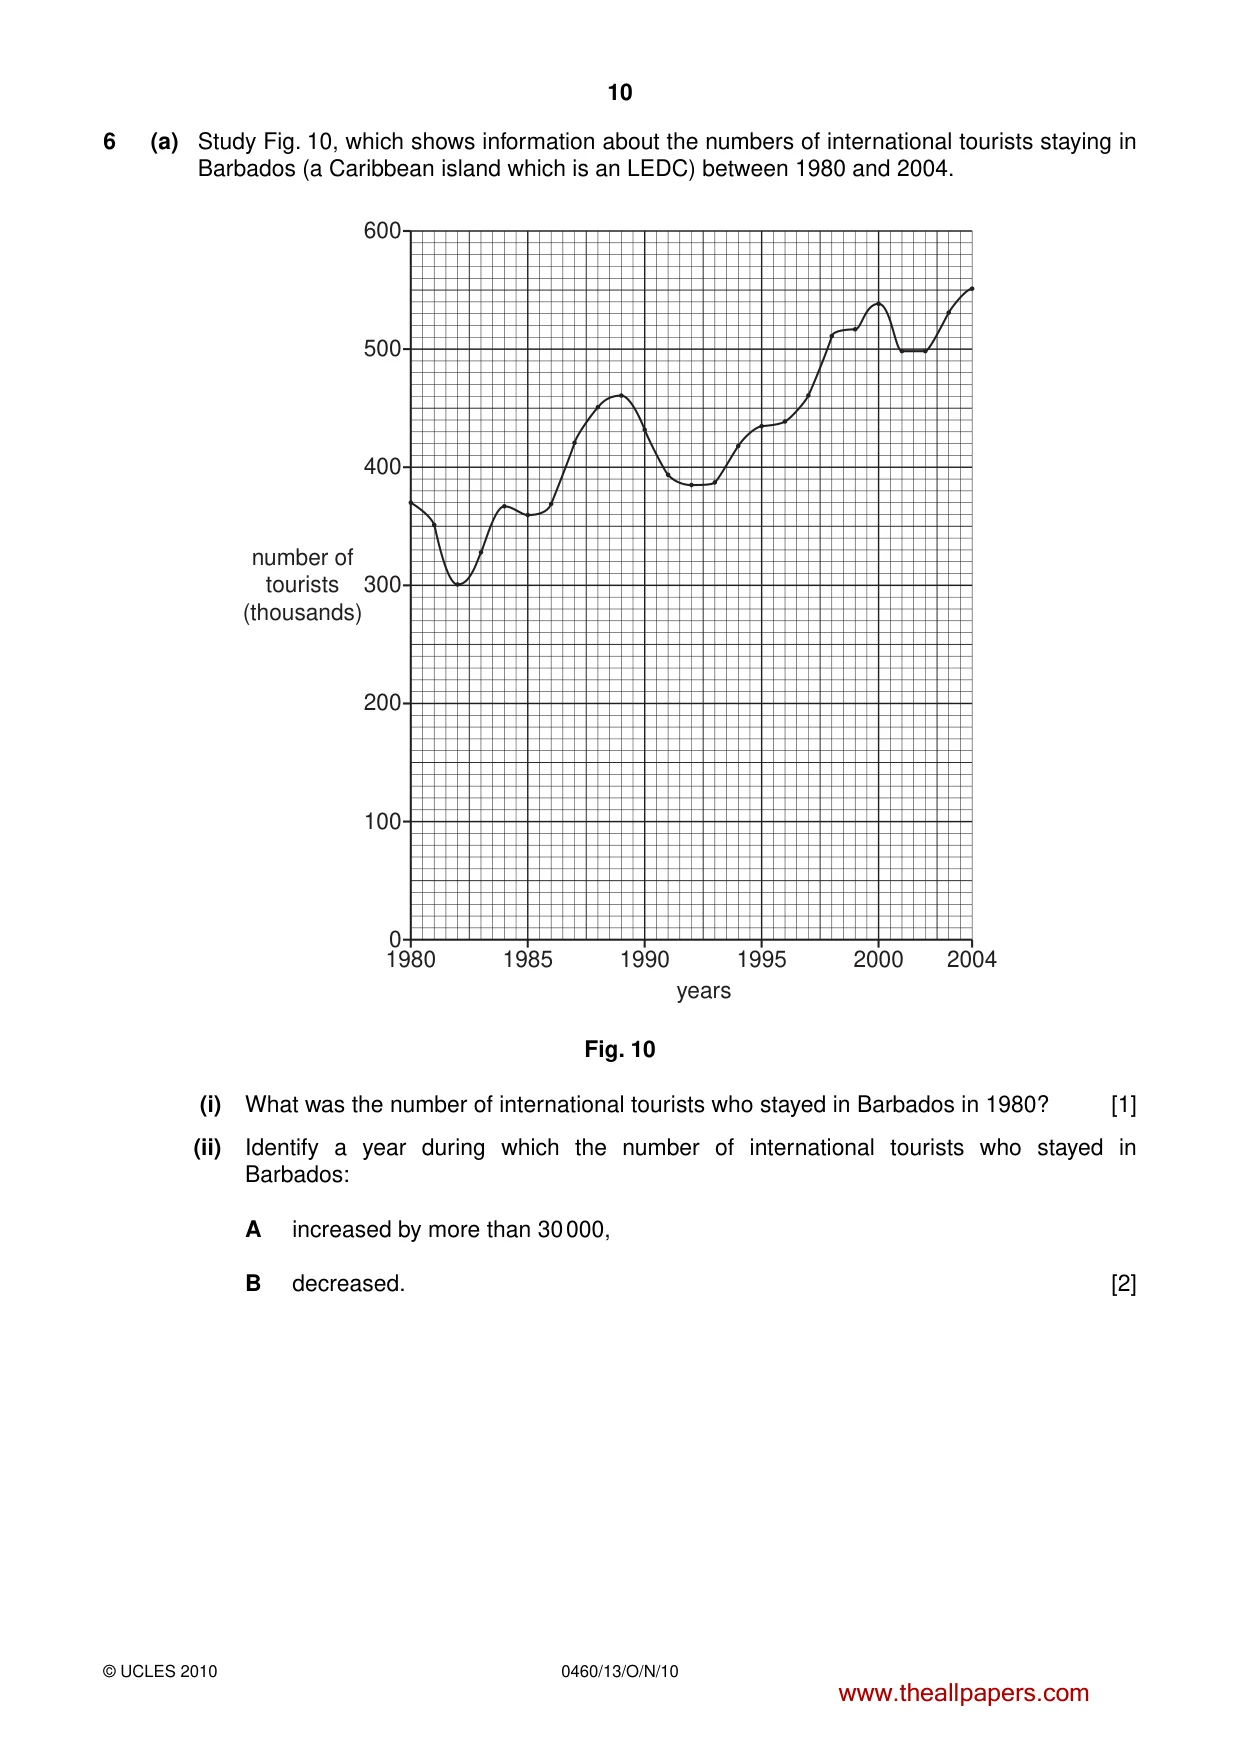
10 0460/13/O/N/10 © UCLES 2010 6 (a) Study Fig. 10, which shows information about the numbers of international tourists staying in Barbados (a Caribbean island which is an LEDC) between 1980 and 2004. 1980 1985 1990 1995 2000 2004 0 100 200 300 400 number of tourists (thousands) years 500 600 Fig. 10 (i) What was the number of international tourists who stayed in Barbados in 1980? [1] (ii) Identify a year during which the number of international tourists who stayed in Barbados: A increased by more than 30 000, B decreased. [2] www.theallpapers.com
Question paper, page 11
11 0460/13/O/N/10 © UCLES 2010 (iii) Describe the overall trend in the numbers of international tourists who stayed in Barbados between 1980 and 2004. Refer to statistics and years in your answer. [3] (iv) Explain why more holidays are now being offered in LEDCs than were offered in 1980. [4] (b) Study Photograph D (Insert), which shows local people selling products to tourists on a beach in an LEDC. (i) Explain why many people in tourist areas in LEDCs work in the informal sector. [3] (ii) Explain other benefits for local people which tourism brings to an LEDC. [5] (c) For a named area which you have studied, explain why the tourist industry has developed there. You should refer to the area’s natural and built attractions. [7] [Total: 25 marks] www.theallpapers.com
Question paper, page 12
12 0460/13/O/N/10 © UCLES 2010 BLANK PAGE Copyright Acknowledgements: Question 1 Figure 2 © Amended from the Jakarta Post; 24 October 2008. Question 2 Photographs A, B and C S. Sibley © UCLES. Question 5 Figures 8A & 8B © Wideworld Magazine; November 2004. Question 6 Photograph D S. Sibley © UCLES. Permission to reproduce items where third-party owned material protected by copyright is included has been sought and cleared where possible. Every reasonable effort has been made by the publisher (UCLES) to trace copyright holders, but if any items requiring clearance have unwittingly been included, the publisher will be pleased to make amends at the earliest possible opportunity. University of Cambridge International Examinations is part of the Cambridge Assessment Group. Cambridge Assessment is the brand name of University of Cambridge Local Examinations Syndicate (UCLES), which is itself a department of the University of Cambridge. www.theallpapers.com
Mark scheme, page 1
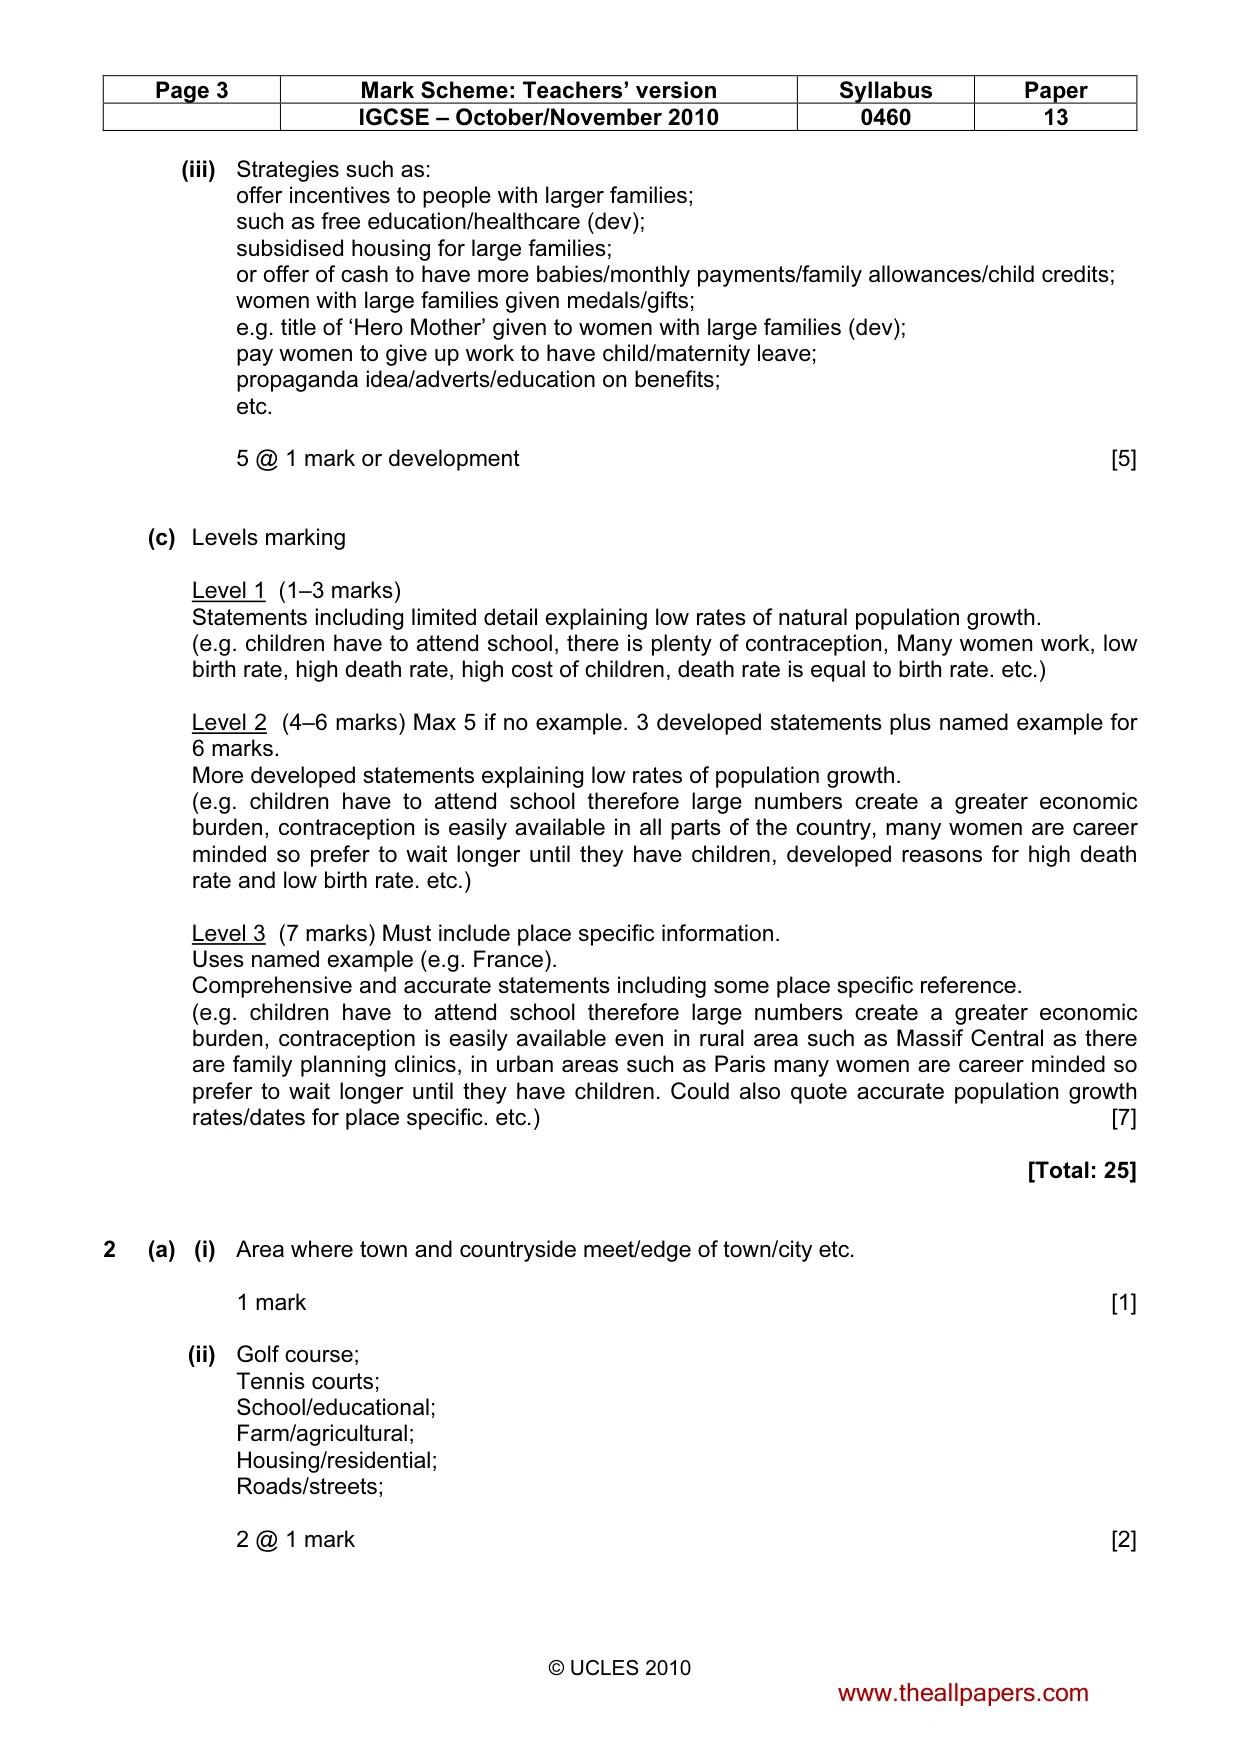
UNIVERSITY OF CAMBRIDGE INTERNATIONAL EXAMINATIONS International General Certificate of Secondary Education MARK SCHEME for the October/November 2010 question paper for the guidance of teachers 0460 GEOGRAPHY 0460/13 Paper 1, maximum raw mark 75 This mark scheme is published as an aid to teachers and candidates, to indicate the requirements of the examination. It shows the basis on which Examiners were instructed to award marks. It does not indicate the details of the discussions that took place at an Examiners’ meeting before marking began, which would have considered the acceptability of alternative answers. Mark schemes must be read in conjunction with the question papers and the report on the examination. • CIE will not enter into discussions or correspondence in connection with these mark schemes. CIE is publishing the mark schemes for the October/November 2010 question papers for most IGCSE, GCE Advanced Level and Advanced Subsidiary Level syllabuses and some Ordinary Level syllabuses. www.theallpapers.com
Mark scheme, page 2
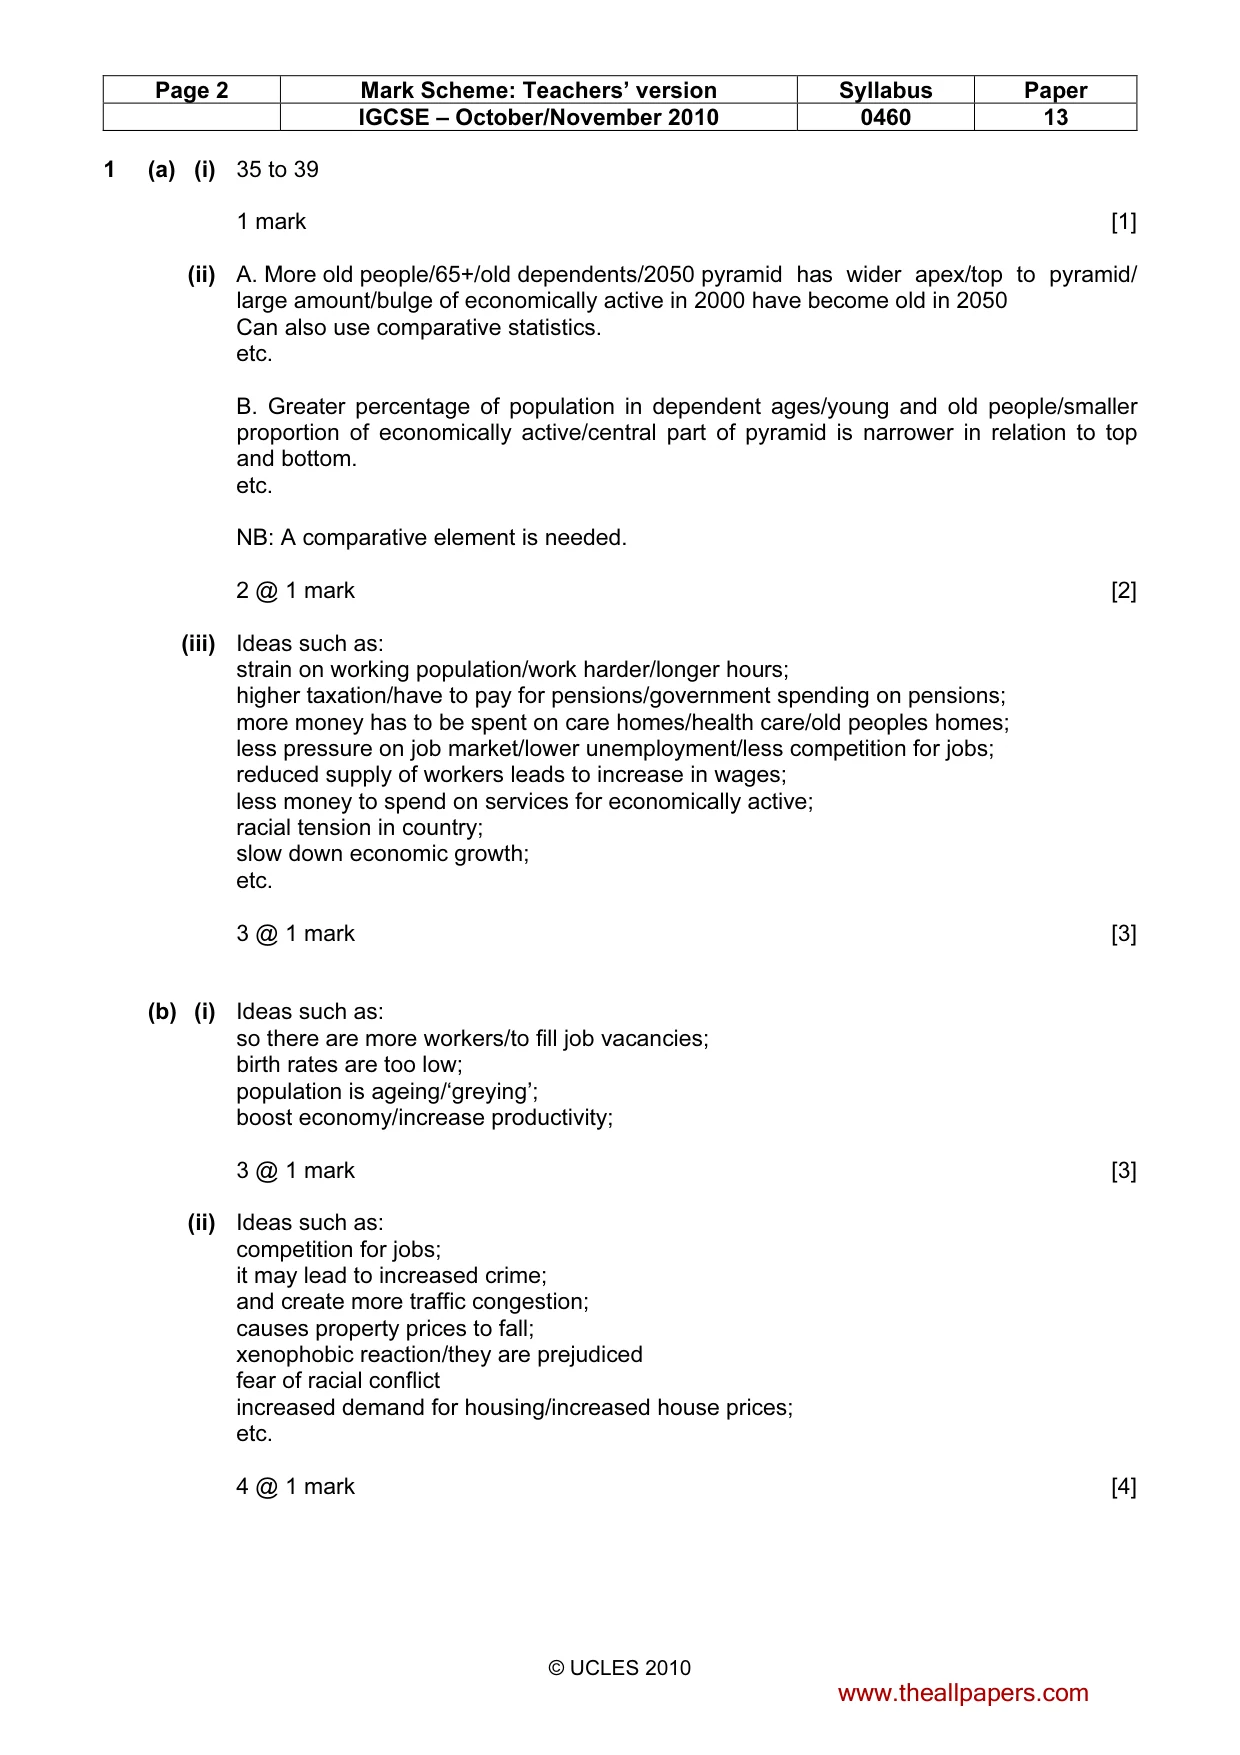
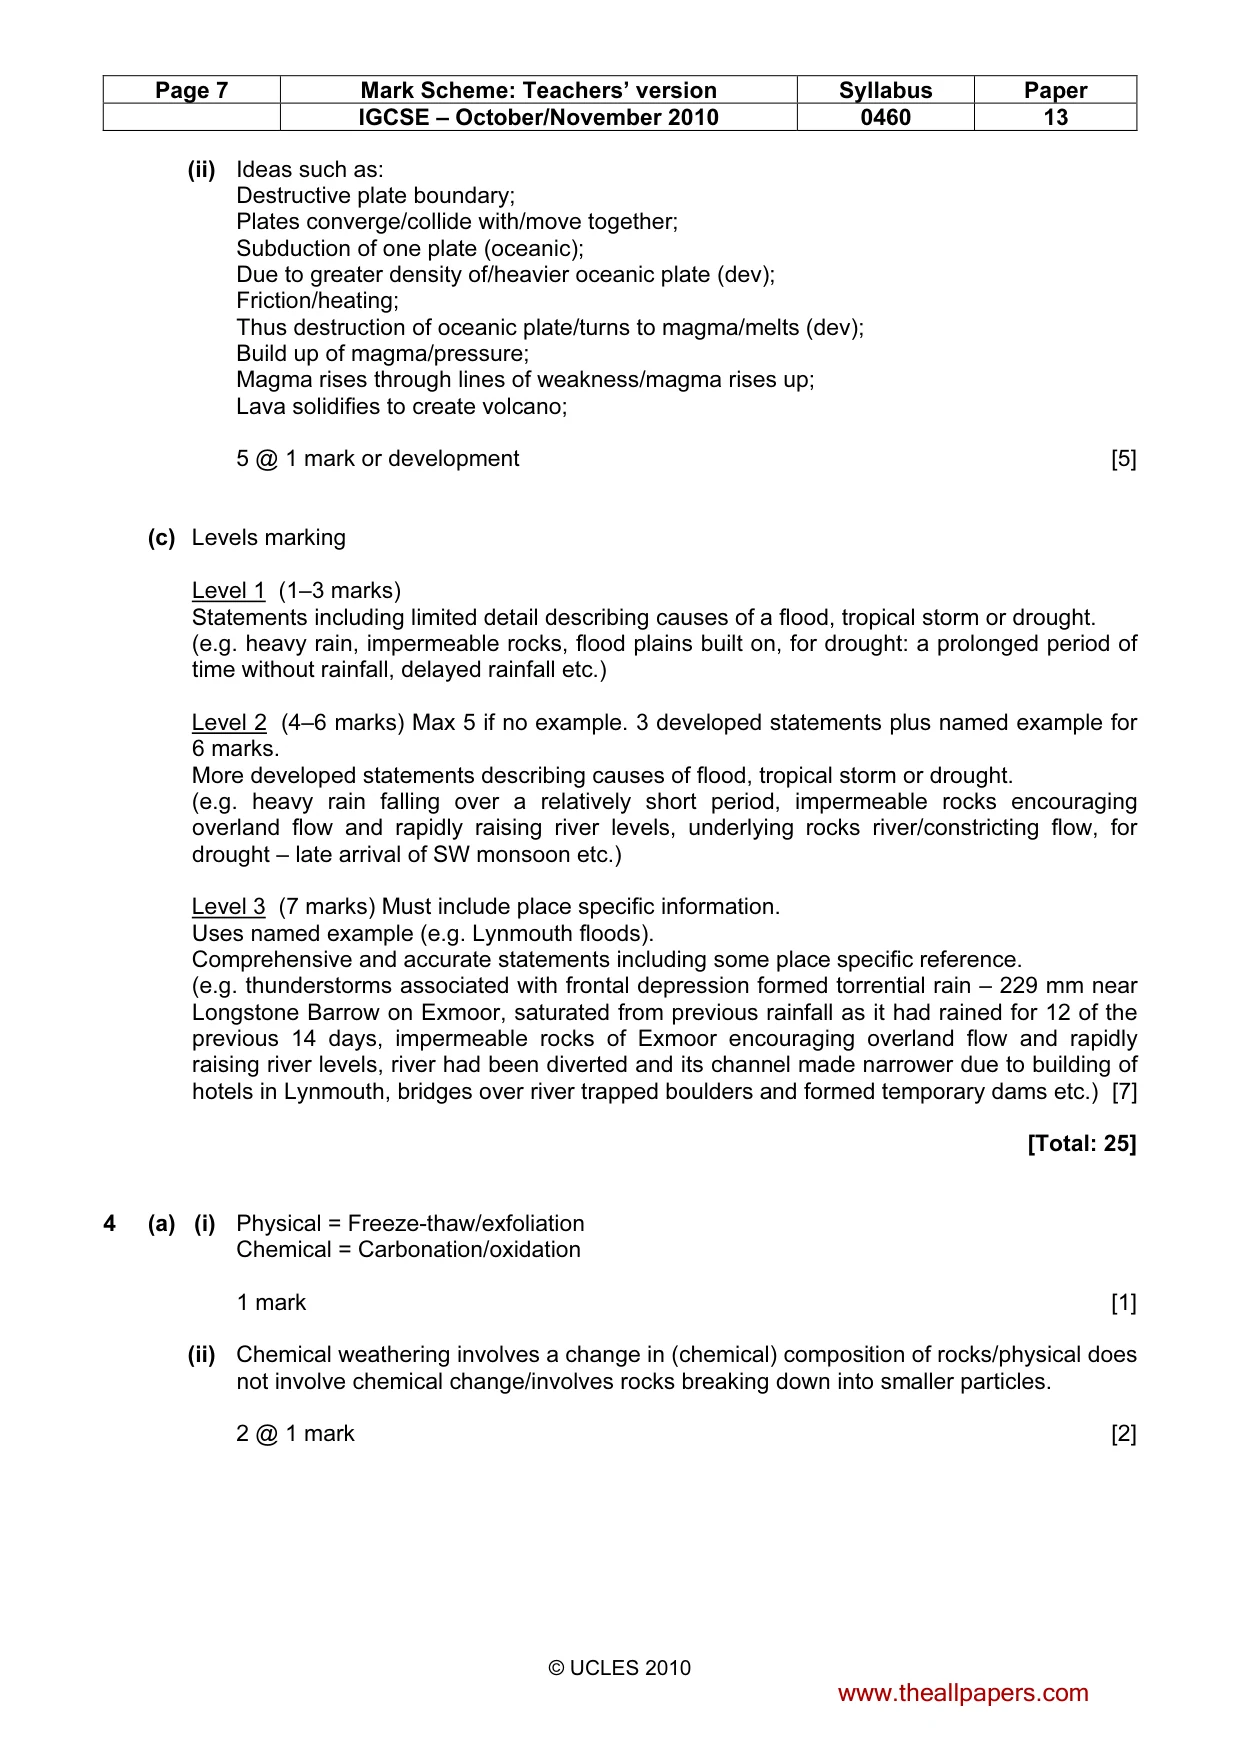
Page 2 Mark Scheme: Teachers’ version Syllabus Paper IGCSE – October/November 2010 0460 13 © UCLES 2010 1 (a) (i) 35 to 39 1 mark [1] (ii) A. More old people/65+/old dependents/2050 pyramid has wider apex/top to pyramid/ large amount/bulge of economically active in 2000 have become old in 2050 Can also use comparative statistics. etc. B. Greater percentage of population in dependent ages/young and old people/smaller proportion of economically active/central part of pyramid is narrower in relation to top and bottom. etc. NB: A comparative element is needed. 2 @ 1 mark [2] (iii) Ideas such as: strain on working population/work harder/longer hours; higher taxation/have to pay for pensions/government spending on pensions; more money has to be spent on care homes/health care/old peoples homes; less pressure on job market/lower unemployment/less competition for jobs; reduced supply of workers leads to increase in wages; less money to spend on services for economically active; racial tension in country; slow down economic growth; etc. 3 @ 1 mark [3] (b) (i) Ideas such as: so there are more workers/to fill job vacancies; birth rates are too low; population is ageing/‘greying’; boost economy/increase productivity; 3 @ 1 mark [3] (ii) Ideas such as: competition for jobs; it may lead to increased crime; and create more traffic congestion; causes property prices to fall; xenophobic reaction/they are prejudiced fear of racial conflict increased demand for housing/increased house prices; etc. 4 @ 1 mark [4] www.theallpapers.com
Mark scheme, page 3
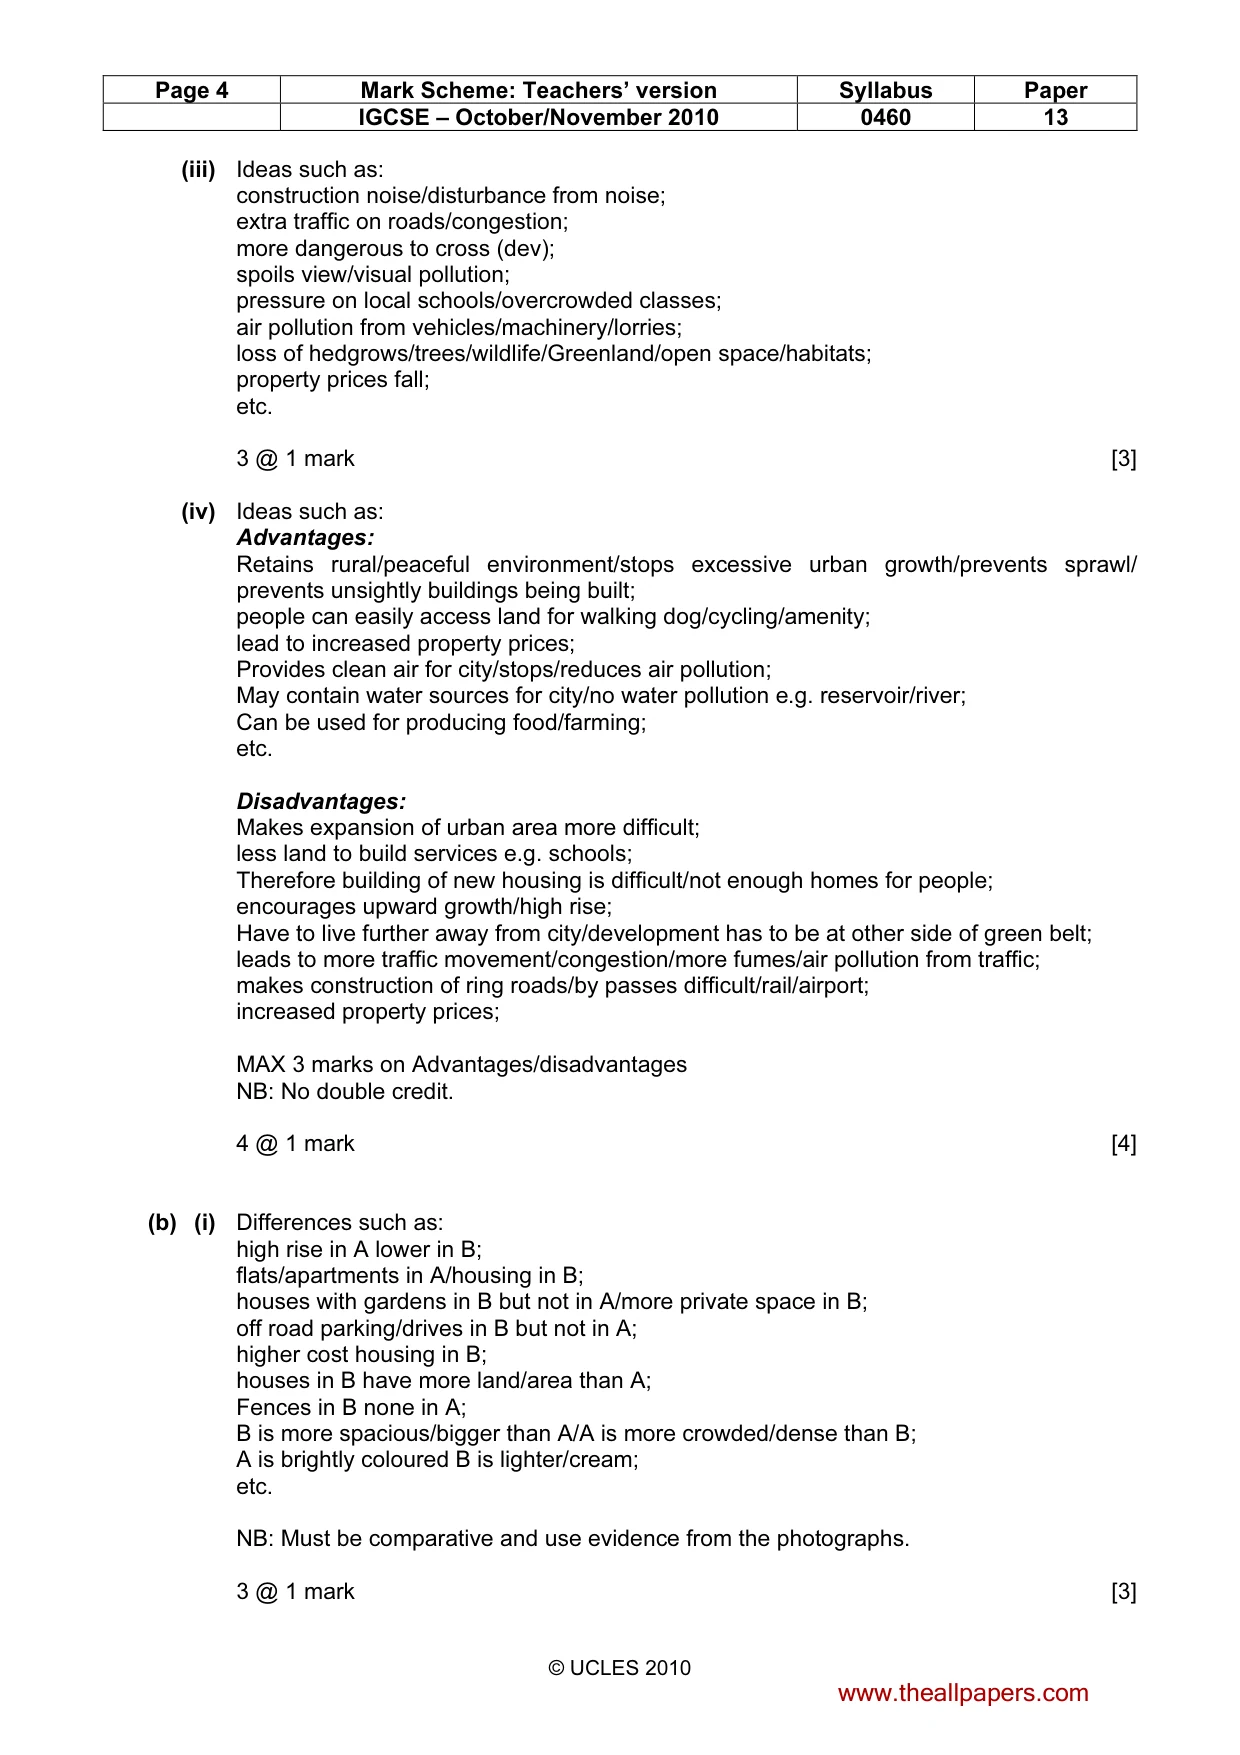
Page 3 Mark Scheme: Teachers’ version Syllabus Paper IGCSE – October/November 2010 0460 13 © UCLES 2010 (iii) Strategies such as: offer incentives to people with larger families; such as free education/healthcare (dev); subsidised housing for large families; or offer of cash to have more babies/monthly payments/family allowances/child credits; women with large families given medals/gifts; e.g. title of ‘Hero Mother’ given to women with large families (dev); pay women to give up work to have child/maternity leave; propaganda idea/adverts/education on benefits; etc. 5 @ 1 mark or development [5] (c) Levels marking Level 1 (1–3 marks) Statements including limited detail explaining low rates of natural population growth. (e.g. children have to attend school, there is plenty of contraception, Many women work, low birth rate, high death rate, high cost of children, death rate is equal to birth rate. etc.) Level 2 (4–6 marks) Max 5 if no example. 3 developed statements plus named example for 6 marks. More developed statements explaining low rates of population growth. (e.g. children have to attend school therefore large numbers create a greater economic burden, contraception is easily available in all parts of the country, many women are career minded so prefer to wait longer until they have children, developed reasons for high death rate and low birth rate. etc.) Level 3 (7 marks) Must include place specific information. Uses named example (e.g. France). Comprehensive and accurate statements including some place specific reference. (e.g. children have to attend school therefore large numbers create a greater economic burden, contraception is easily available even in rural area such as Massif Central as there are family planning clinics, in urban areas such as Paris many women are career minded so prefer to wait longer until they have children. Could also quote accurate population growth rates/dates for place specific. etc.) [7] [Total: 25] 2 (a) (i) Area where town and countryside meet/edge of town/city etc. 1 mark [1] (ii) Golf course; Tennis courts; School/educational; Farm/agricultural; Housing/residential; Roads/streets; 2 @ 1 mark [2] www.theallpapers.com
Mark scheme, page 4
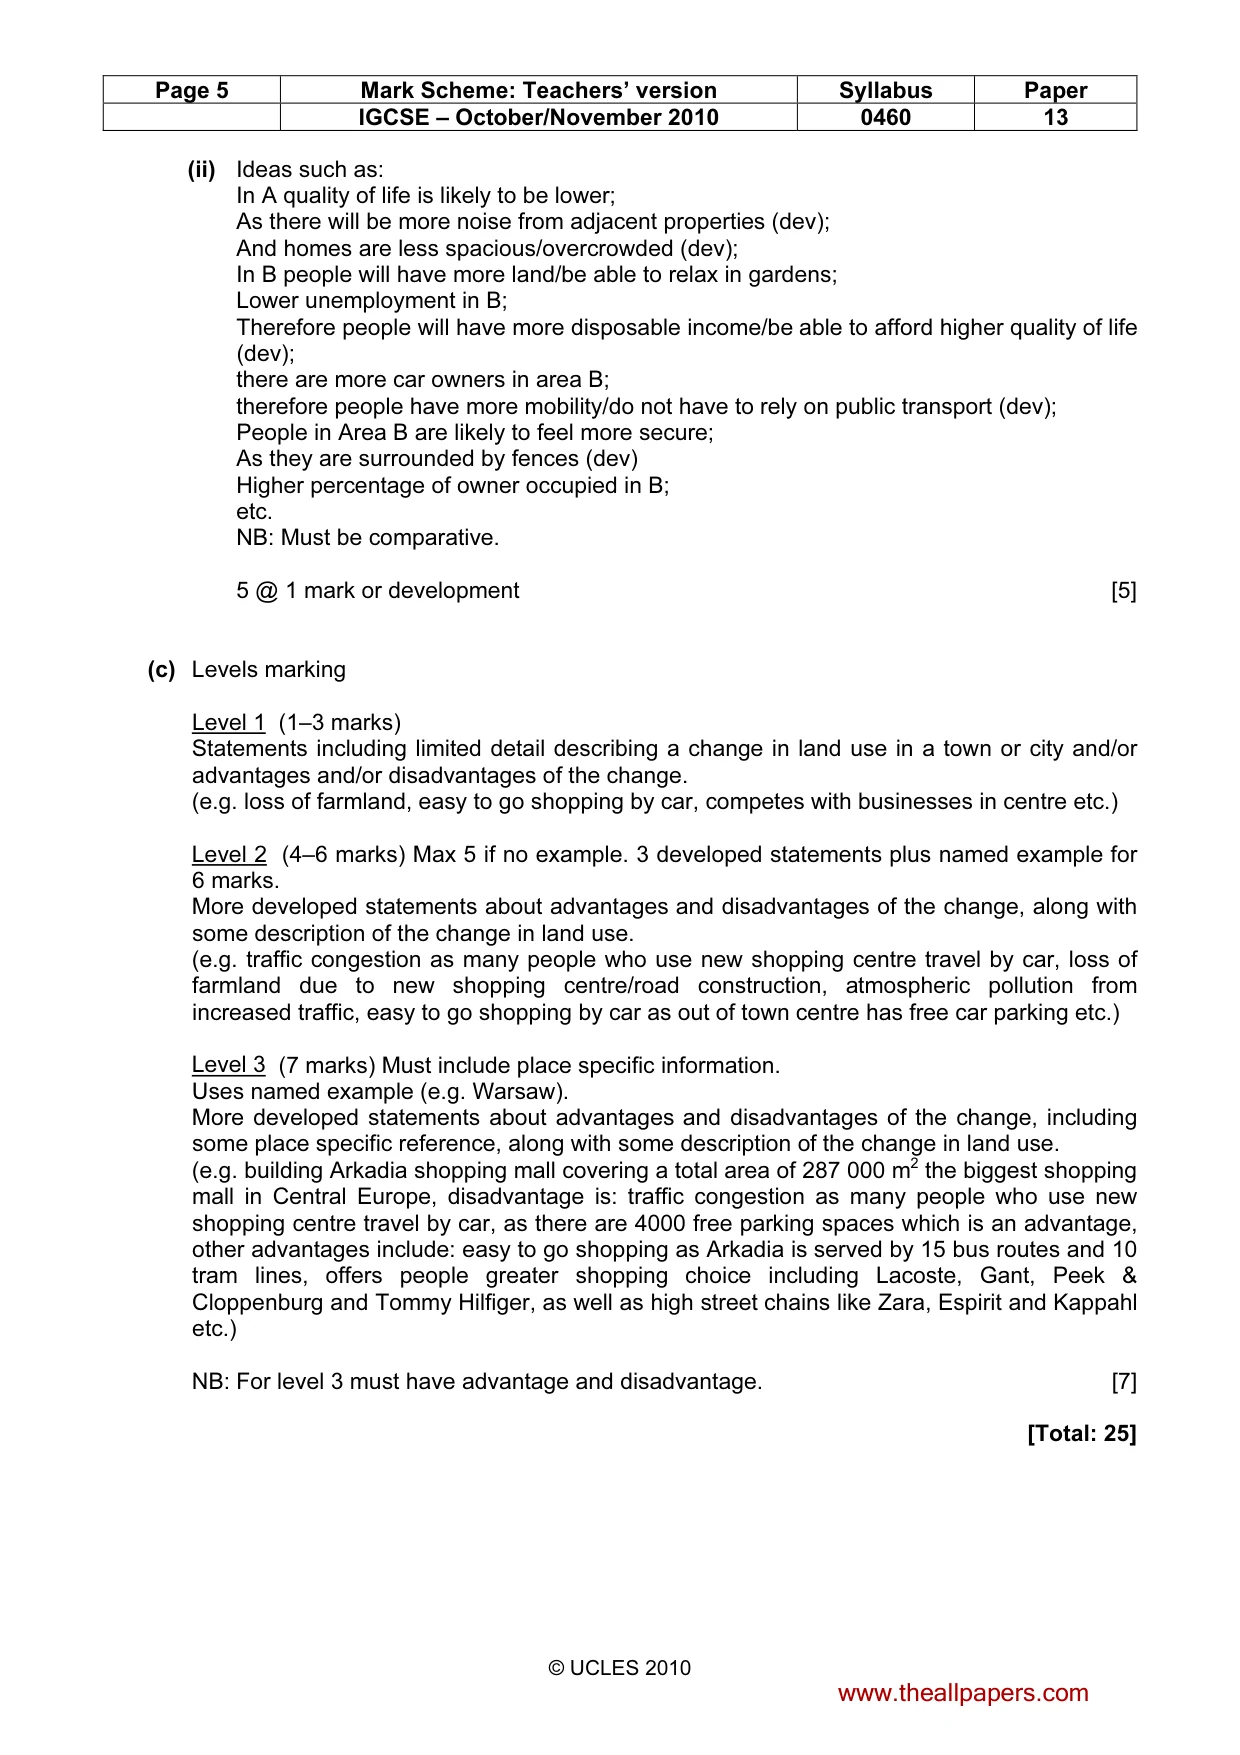
Page 4 Mark Scheme: Teachers’ version Syllabus Paper IGCSE – October/November 2010 0460 13 © UCLES 2010 (iii) Ideas such as: construction noise/disturbance from noise; extra traffic on roads/congestion; more dangerous to cross (dev); spoils view/visual pollution; pressure on local schools/overcrowded classes; air pollution from vehicles/machinery/lorries; loss of hedgrows/trees/wildlife/Greenland/open space/habitats; property prices fall; etc. 3 @ 1 mark [3] (iv) Ideas such as: Advantages: Retains rural/peaceful environment/stops excessive urban growth/prevents sprawl/ prevents unsightly buildings being built; people can easily access land for walking dog/cycling/amenity; lead to increased property prices; Provides clean air for city/stops/reduces air pollution; May contain water sources for city/no water pollution e.g. reservoir/river; Can be used for producing food/farming; etc. Disadvantages: Makes expansion of urban area more difficult; less land to build services e.g. schools; Therefore building of new housing is difficult/not enough homes for people; encourages upward growth/high rise; Have to live further away from city/development has to be at other side of green belt; leads to more traffic movement/congestion/more fumes/air pollution from traffic; makes construction of ring roads/by passes difficult/rail/airport; increased property prices; MAX 3 marks on Advantages/disadvantages NB: No double credit. 4 @ 1 mark [4] (b) (i) Differences such as: high rise in A lower in B; flats/apartments in A/housing in B; houses with gardens in B but not in A/more private space in B; off road parking/drives in B but not in A; higher cost housing in B; houses in B have more land/area than A; Fences in B none in A; B is more spacious/bigger than A/A is more crowded/dense than B; A is brightly coloured B is lighter/cream; etc. NB: Must be comparative and use evidence from the photographs. 3 @ 1 mark [3] www.theallpapers.com
Mark scheme, page 5
Page 5 Mark Scheme: Teachers’ version Syllabus Paper IGCSE – October/November 2010 0460 13 © UCLES 2010 (ii) Ideas such as: In A quality of life is likely to be lower; As there will be more noise from adjacent properties (dev); And homes are less spacious/overcrowded (dev); In B people will have more land/be able to relax in gardens; Lower unemployment in B; Therefore people will have more disposable income/be able to afford higher quality of life (dev); there are more car owners in area B; therefore people have more mobility/do not have to rely on public transport (dev); People in Area B are likely to feel more secure; As they are surrounded by fences (dev) Higher percentage of owner occupied in B; etc. NB: Must be comparative. 5 @ 1 mark or development [5] (c) Levels marking Level 1 (1–3 marks) Statements including limited detail describing a change in land use in a town or city and/or advantages and/or disadvantages of the change. (e.g. loss of farmland, easy to go shopping by car, competes with businesses in centre etc.) Level 2 (4–6 marks) Max 5 if no example. 3 developed statements plus named example for 6 marks. More developed statements about advantages and disadvantages of the change, along with some description of the change in land use. (e.g. traffic congestion as many people who use new shopping centre travel by car, loss of farmland due to new shopping centre/road construction, atmospheric pollution from increased traffic, easy to go shopping by car as out of town centre has free car parking etc.) Level 3 (7 marks) Must include place specific information. Uses named example (e.g. Warsaw). More developed statements about advantages and disadvantages of the change, including some place specific reference, along with some description of the change in land use. (e.g. building Arkadia shopping mall covering a total area of 287 000 m2 the biggest shopping mall in Central Europe, disadvantage is: traffic congestion as many people who use new shopping centre travel by car, as there are 4000 free parking spaces which is an advantage, other advantages include: easy to go shopping as Arkadia is served by 15 bus routes and 10 tram lines, offers people greater shopping choice including Lacoste, Gant, Peek & Cloppenburg and Tommy Hilfiger, as well as high street chains like Zara, Espirit and Kappahl etc.) NB: For level 3 must have advantage and disadvantage. [7] [Total: 25] www.theallpapers.com
Mark scheme, page 6
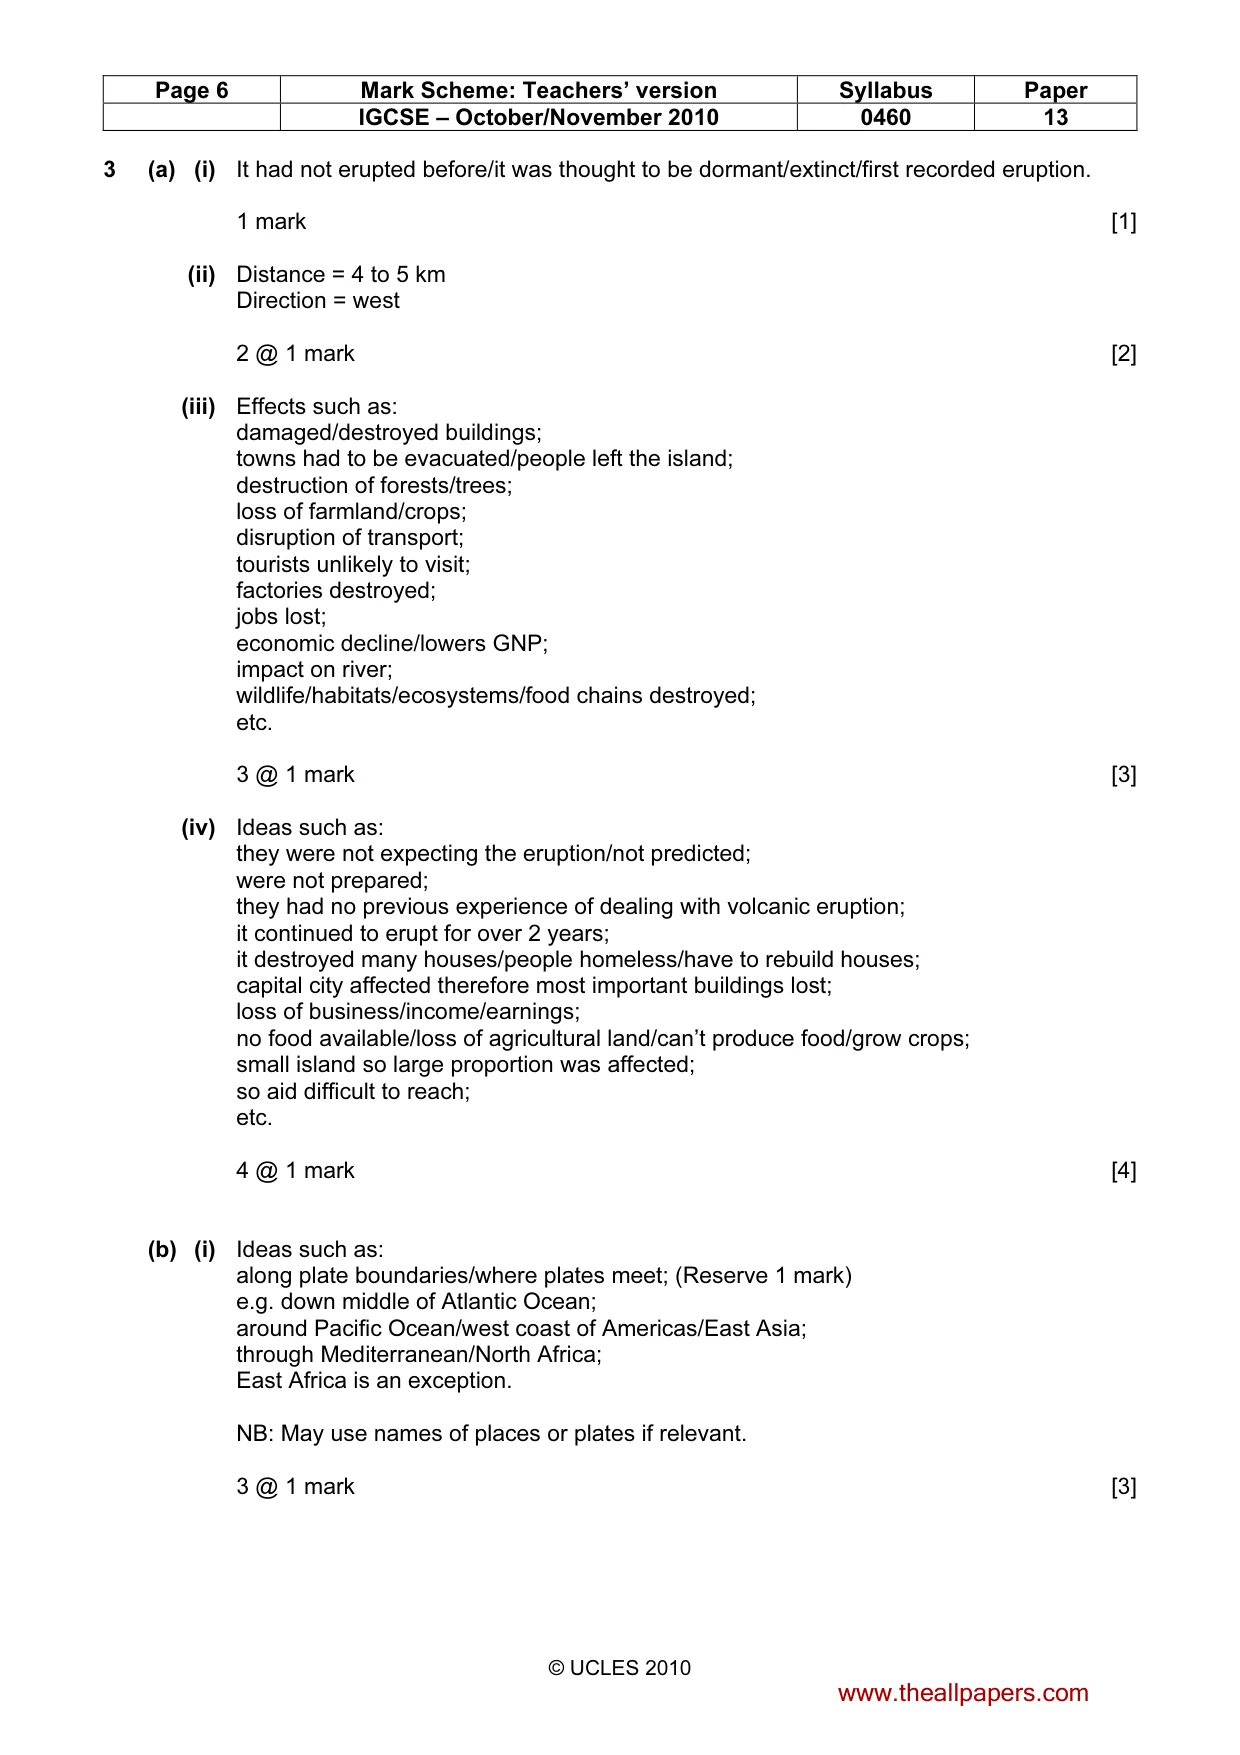
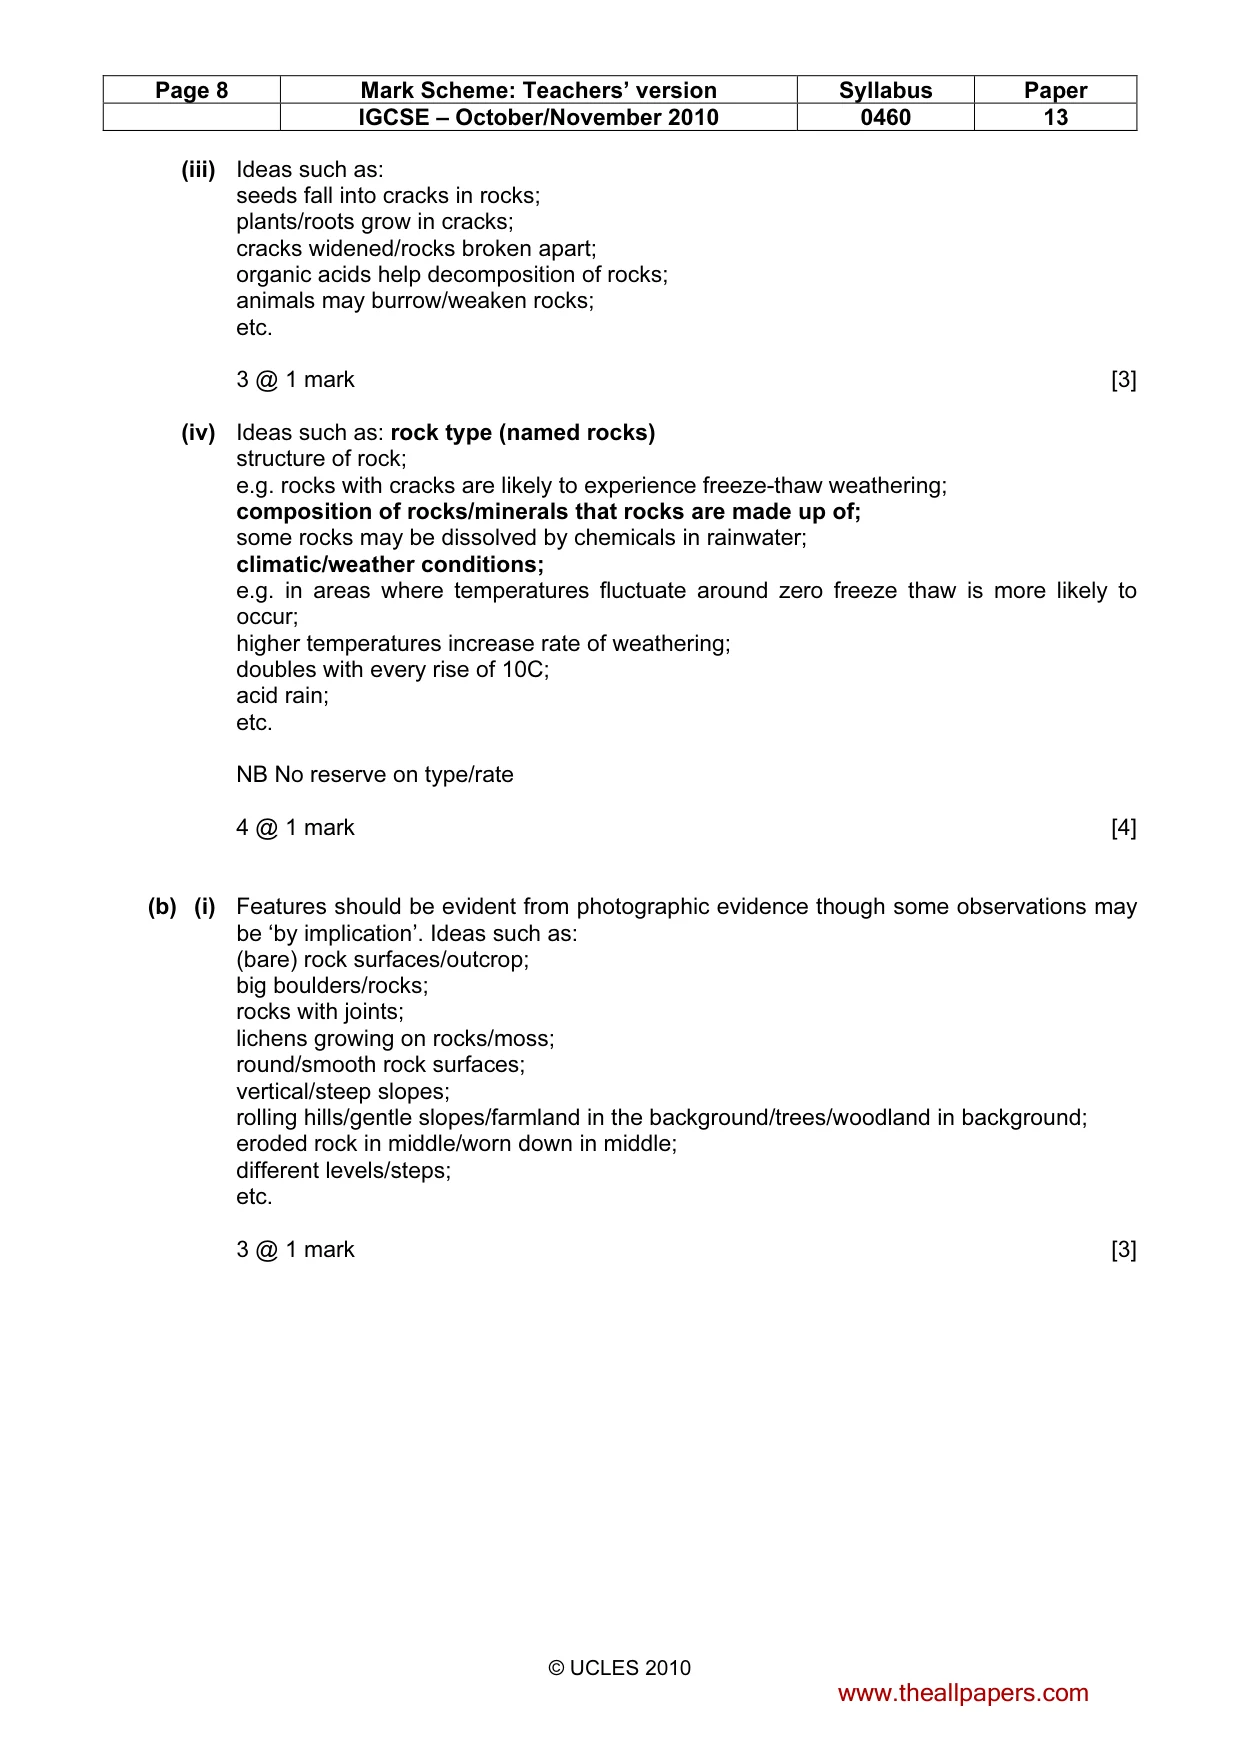
Page 6 Mark Scheme: Teachers’ version Syllabus Paper IGCSE – October/November 2010 0460 13 © UCLES 2010 3 (a) (i) It had not erupted before/it was thought to be dormant/extinct/first recorded eruption. 1 mark [1] (ii) Distance = 4 to 5 km Direction = west 2 @ 1 mark [2] (iii) Effects such as: damaged/destroyed buildings; towns had to be evacuated/people left the island; destruction of forests/trees; loss of farmland/crops; disruption of transport; tourists unlikely to visit; factories destroyed; jobs lost; economic decline/lowers GNP; impact on river; wildlife/habitats/ecosystems/food chains destroyed; etc. 3 @ 1 mark [3] (iv) Ideas such as: they were not expecting the eruption/not predicted; were not prepared; they had no previous experience of dealing with volcanic eruption; it continued to erupt for over 2 years; it destroyed many houses/people homeless/have to rebuild houses; capital city affected therefore most important buildings lost; loss of business/income/earnings; no food available/loss of agricultural land/can’t produce food/grow crops; small island so large proportion was affected; so aid difficult to reach; etc. 4 @ 1 mark [4] (b) (i) Ideas such as: along plate boundaries/where plates meet; (Reserve 1 mark) e.g. down middle of Atlantic Ocean; around Pacific Ocean/west coast of Americas/East Asia; through Mediterranean/North Africa; East Africa is an exception. NB: May use names of places or plates if relevant. 3 @ 1 mark [3] www.theallpapers.com
Mark scheme, page 7
Page 7 Mark Scheme: Teachers’ version Syllabus Paper IGCSE – October/November 2010 0460 13 © UCLES 2010 (ii) Ideas such as: Destructive plate boundary; Plates converge/collide with/move together; Subduction of one plate (oceanic); Due to greater density of/heavier oceanic plate (dev); Friction/heating; Thus destruction of oceanic plate/turns to magma/melts (dev); Build up of magma/pressure; Magma rises through lines of weakness/magma rises up; Lava solidifies to create volcano; 5 @ 1 mark or development [5] (c) Levels marking Level 1 (1–3 marks) Statements including limited detail describing causes of a flood, tropical storm or drought. (e.g. heavy rain, impermeable rocks, flood plains built on, for drought: a prolonged period of time without rainfall, delayed rainfall etc.) Level 2 (4–6 marks) Max 5 if no example. 3 developed statements plus named example for 6 marks. More developed statements describing causes of flood, tropical storm or drought. (e.g. heavy rain falling over a relatively short period, impermeable rocks encouraging overland flow and rapidly raising river levels, underlying rocks river/constricting flow, for drought – late arrival of SW monsoon etc.) Level 3 (7 marks) Must include place specific information. Uses named example (e.g. Lynmouth floods). Comprehensive and accurate statements including some place specific reference. (e.g. thunderstorms associated with frontal depression formed torrential rain – 229 mm near Longstone Barrow on Exmoor, saturated from previous rainfall as it had rained for 12 of the previous 14 days, impermeable rocks of Exmoor encouraging overland flow and rapidly raising river levels, river had been diverted and its channel made narrower due to building of hotels in Lynmouth, bridges over river trapped boulders and formed temporary dams etc.) [7] [Total: 25] 4 (a) (i) Physical = Freeze-thaw/exfoliation Chemical = Carbonation/oxidation 1 mark [1] (ii) Chemical weathering involves a change in (chemical) composition of rocks/physical does not involve chemical change/involves rocks breaking down into smaller particles. 2 @ 1 mark [2] www.theallpapers.com
Mark scheme, page 8
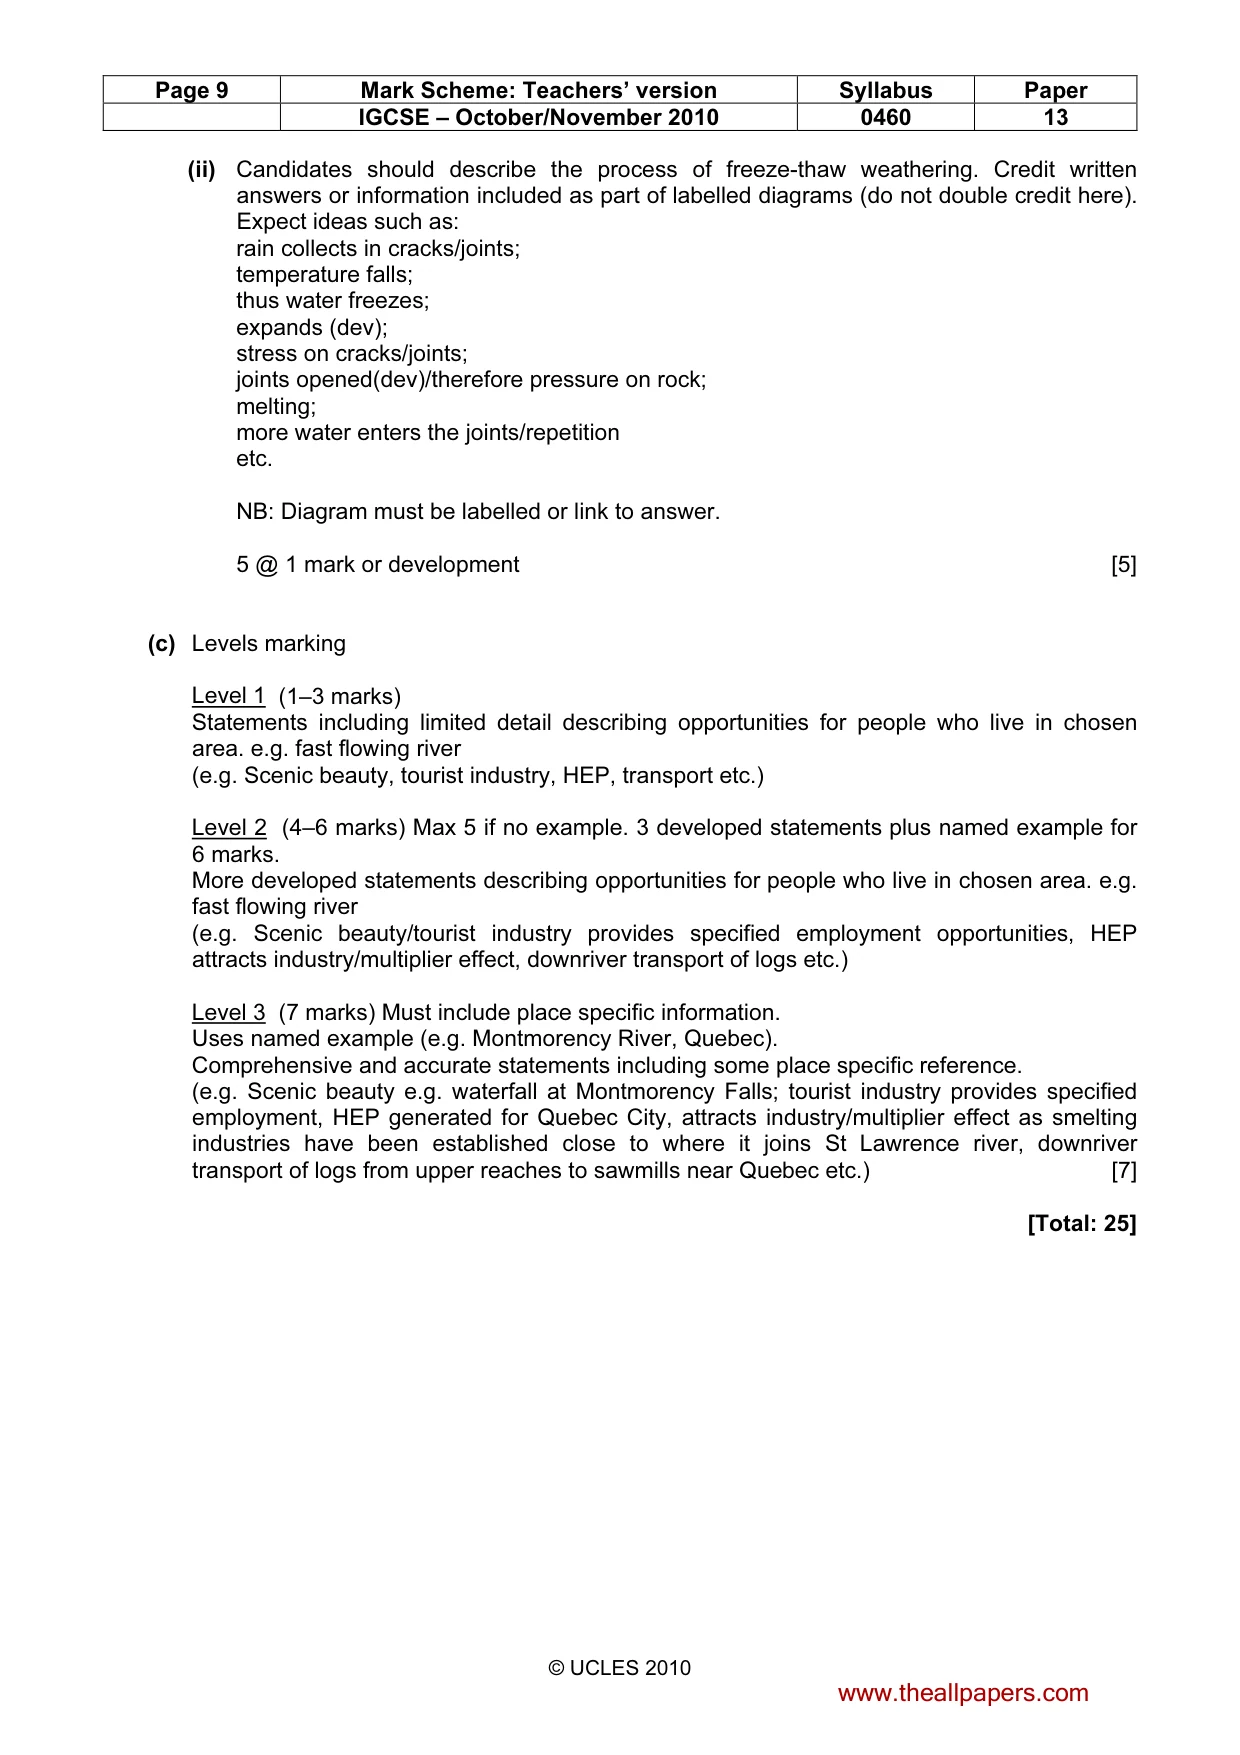
Page 8 Mark Scheme: Teachers’ version Syllabus Paper IGCSE – October/November 2010 0460 13 © UCLES 2010 (iii) Ideas such as: seeds fall into cracks in rocks; plants/roots grow in cracks; cracks widened/rocks broken apart; organic acids help decomposition of rocks; animals may burrow/weaken rocks; etc. 3 @ 1 mark [3] (iv) Ideas such as: rock type (named rocks) structure of rock; e.g. rocks with cracks are likely to experience freeze-thaw weathering; composition of rocks/minerals that rocks are made up of; some rocks may be dissolved by chemicals in rainwater; climatic/weather conditions; e.g. in areas where temperatures fluctuate around zero freeze thaw is more likely to occur; higher temperatures increase rate of weathering; doubles with every rise of 10C; acid rain; etc. NB No reserve on type/rate 4 @ 1 mark [4] (b) (i) Features should be evident from photographic evidence though some observations may be ‘by implication’. Ideas such as: (bare) rock surfaces/outcrop; big boulders/rocks; rocks with joints; lichens growing on rocks/moss; round/smooth rock surfaces; vertical/steep slopes; rolling hills/gentle slopes/farmland in the background/trees/woodland in background; eroded rock in middle/worn down in middle; different levels/steps; etc. 3 @ 1 mark [3] www.theallpapers.com
Mark scheme, page 9
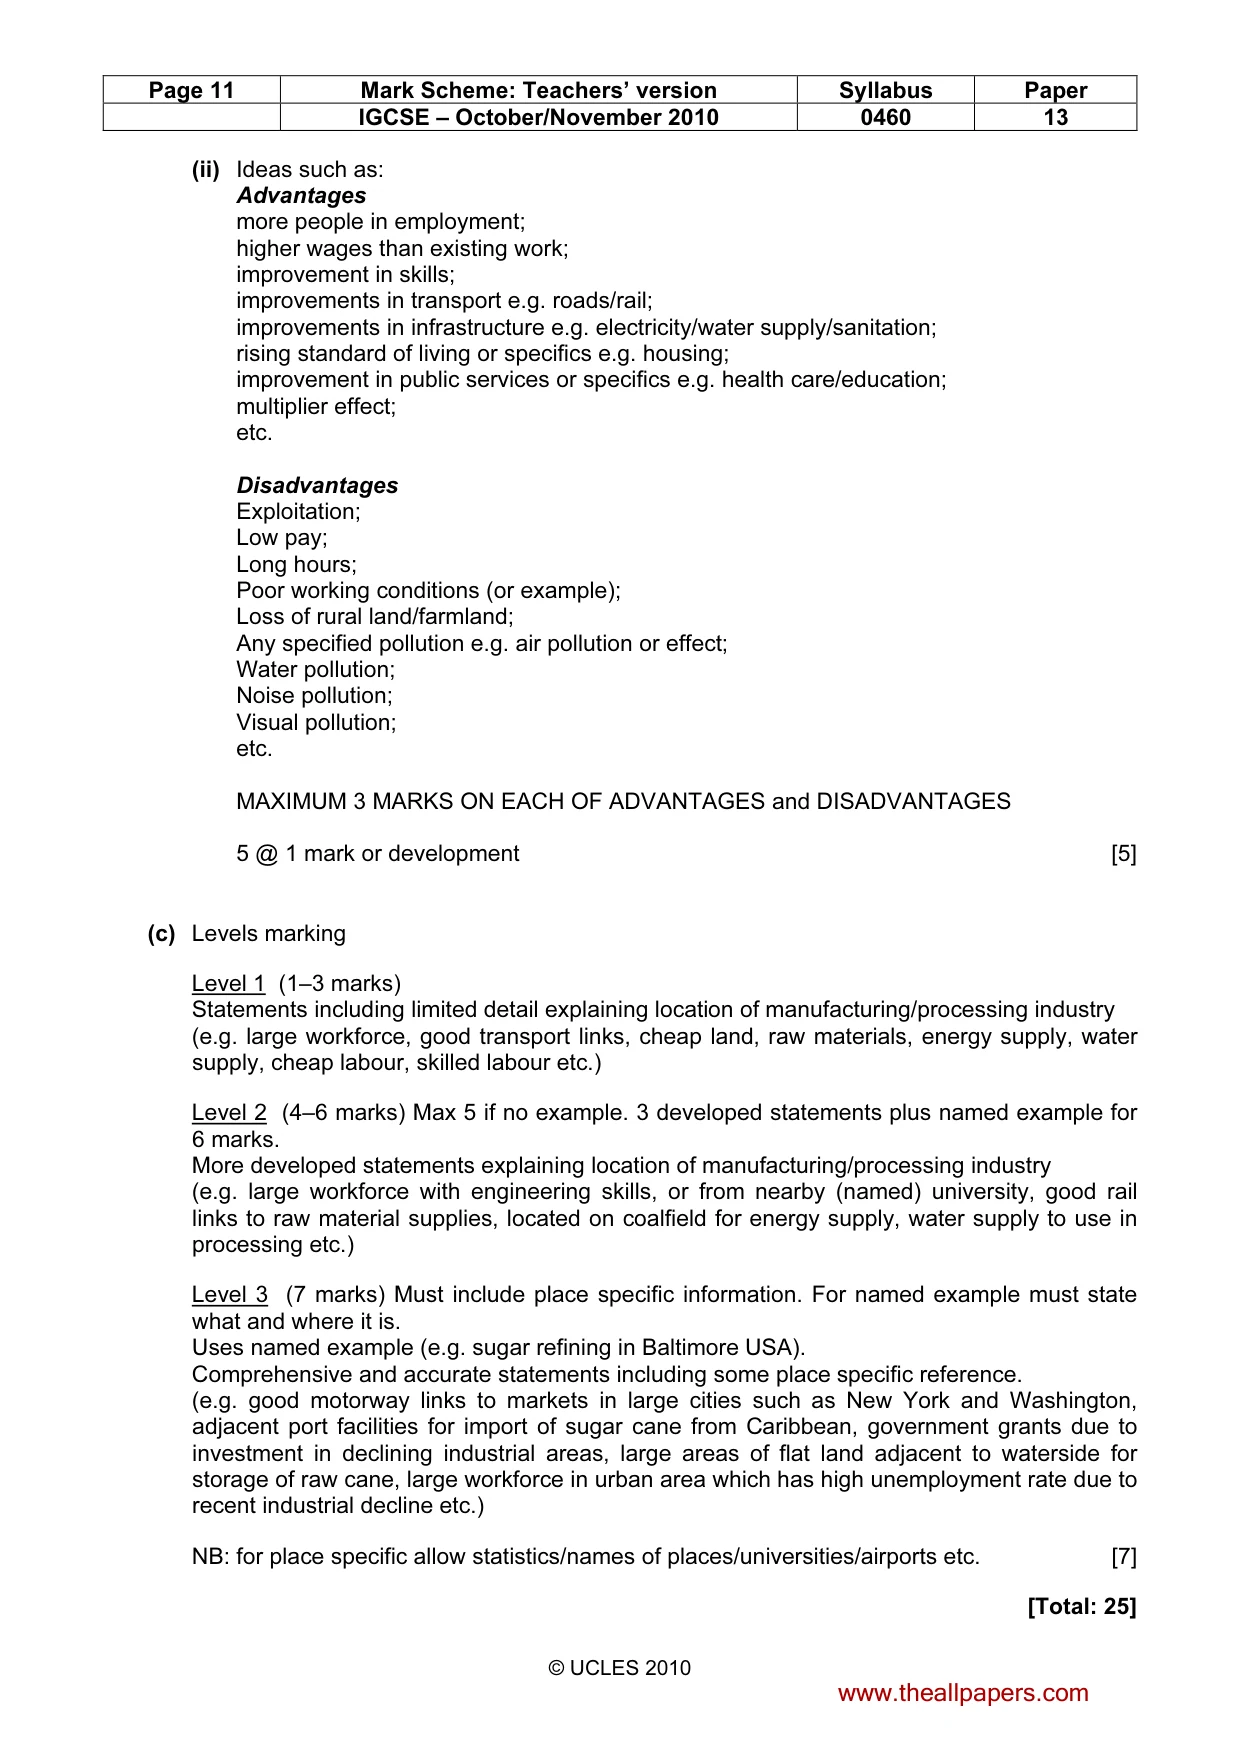
Page 9 Mark Scheme: Teachers’ version Syllabus Paper IGCSE – October/November 2010 0460 13 © UCLES 2010 (ii) Candidates should describe the process of freeze-thaw weathering. Credit written answers or information included as part of labelled diagrams (do not double credit here). Expect ideas such as: rain collects in cracks/joints; temperature falls; thus water freezes; expands (dev); stress on cracks/joints; joints opened(dev)/therefore pressure on rock; melting; more water enters the joints/repetition etc. NB: Diagram must be labelled or link to answer. 5 @ 1 mark or development [5] (c) Levels marking Level 1 (1–3 marks) Statements including limited detail describing opportunities for people who live in chosen area. e.g. fast flowing river (e.g. Scenic beauty, tourist industry, HEP, transport etc.) Level 2 (4–6 marks) Max 5 if no example. 3 developed statements plus named example for 6 marks. More developed statements describing opportunities for people who live in chosen area. e.g. fast flowing river (e.g. Scenic beauty/tourist industry provides specified employment opportunities, HEP attracts industry/multiplier effect, downriver transport of logs etc.) Level 3 (7 marks) Must include place specific information. Uses named example (e.g. Montmorency River, Quebec). Comprehensive and accurate statements including some place specific reference. (e.g. Scenic beauty e.g. waterfall at Montmorency Falls; tourist industry provides specified employment, HEP generated for Quebec City, attracts industry/multiplier effect as smelting industries have been established close to where it joins St Lawrence river, downriver transport of logs from upper reaches to sawmills near Quebec etc.) [7] [Total: 25] www.theallpapers.com
Mark scheme, page 10
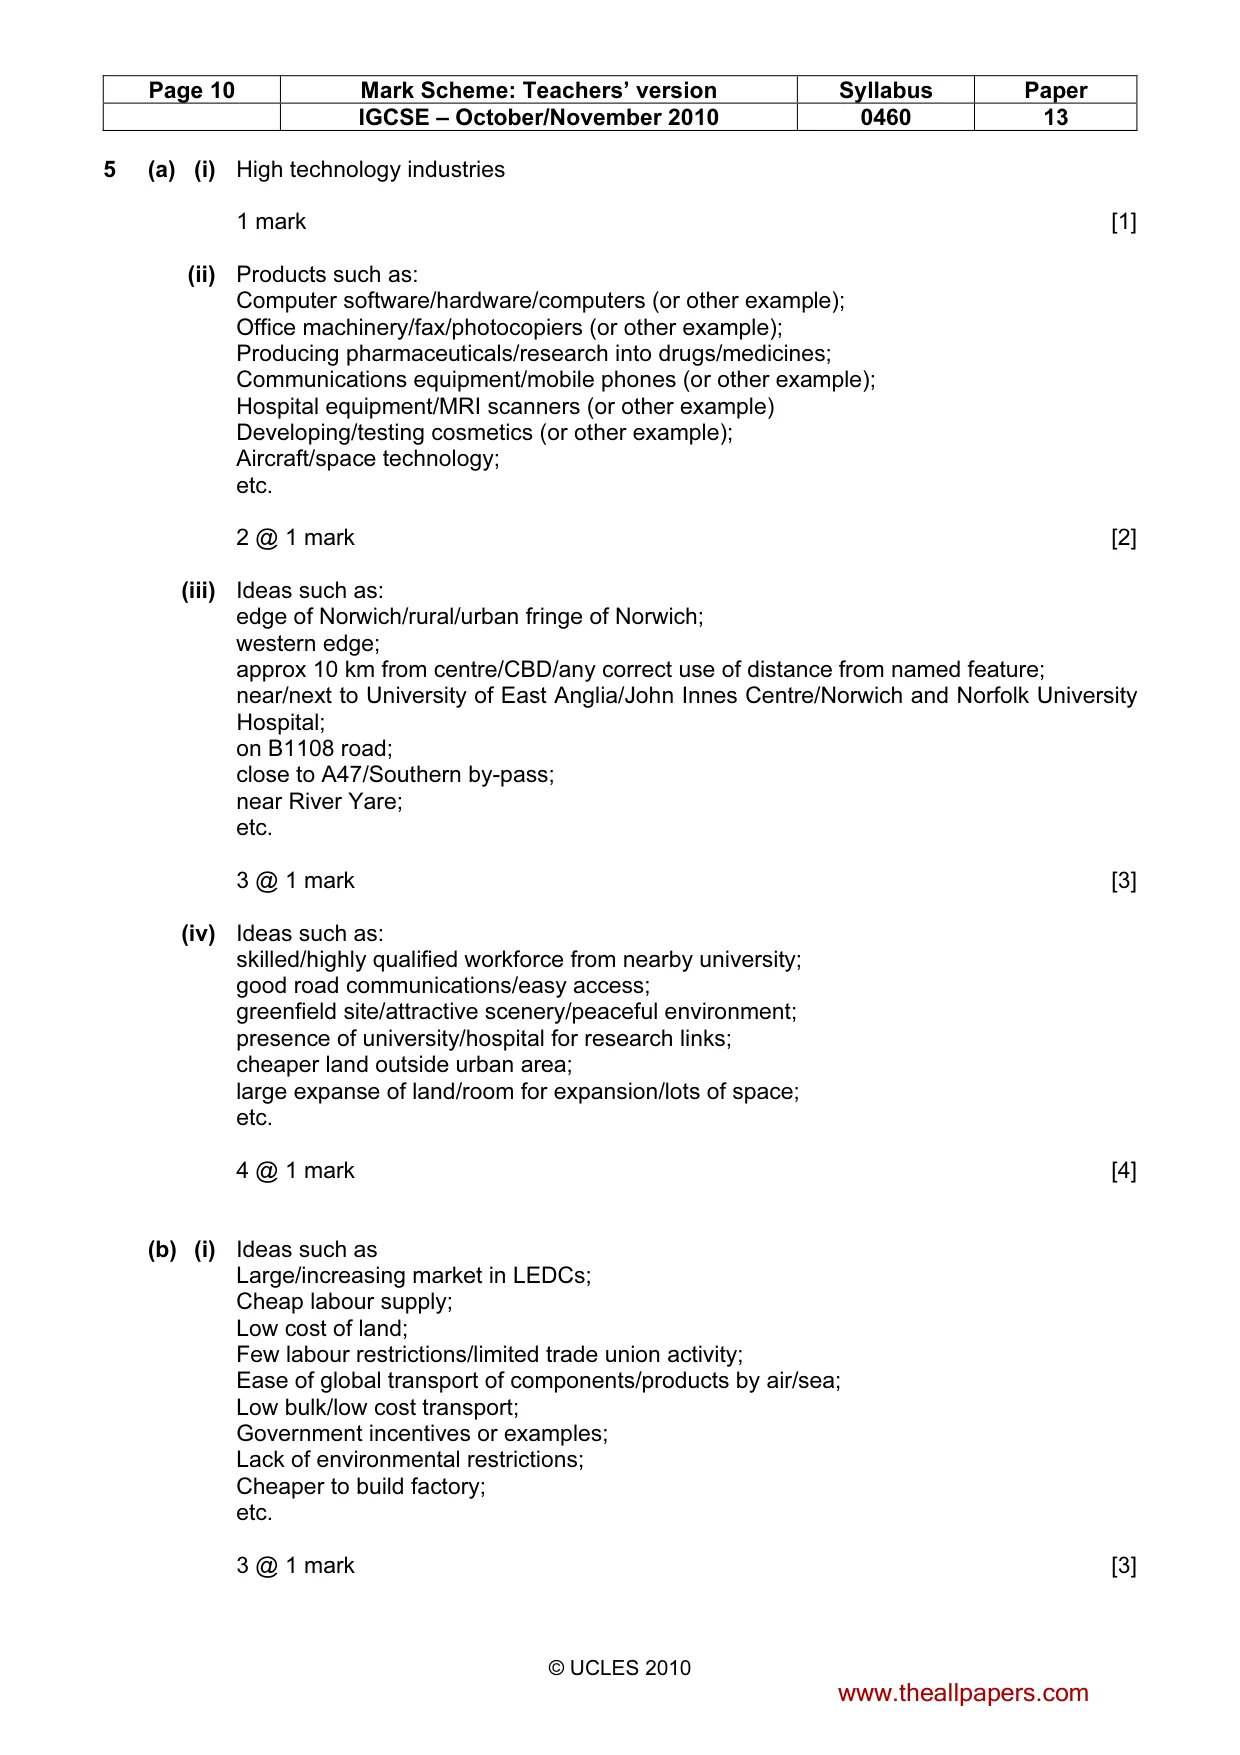
Page 10 Mark Scheme: Teachers’ version Syllabus Paper IGCSE – October/November 2010 0460 13 © UCLES 2010 5 (a) (i) High technology industries 1 mark [1] (ii) Products such as: Computer software/hardware/computers (or other example); Office machinery/fax/photocopiers (or other example); Producing pharmaceuticals/research into drugs/medicines; Communications equipment/mobile phones (or other example); Hospital equipment/MRI scanners (or other example) Developing/testing cosmetics (or other example); Aircraft/space technology; etc. 2 @ 1 mark [2] (iii) Ideas such as: edge of Norwich/rural/urban fringe of Norwich; western edge; approx 10 km from centre/CBD/any correct use of distance from named feature; near/next to University of East Anglia/John Innes Centre/Norwich and Norfolk University Hospital; on B1108 road; close to A47/Southern by-pass; near River Yare; etc. 3 @ 1 mark [3] (iv) Ideas such as: skilled/highly qualified workforce from nearby university; good road communications/easy access; greenfield site/attractive scenery/peaceful environment; presence of university/hospital for research links; cheaper land outside urban area; large expanse of land/room for expansion/lots of space; etc. 4 @ 1 mark [4] (b) (i) Ideas such as Large/increasing market in LEDCs; Cheap labour supply; Low cost of land; Few labour restrictions/limited trade union activity; Ease of global transport of components/products by air/sea; Low bulk/low cost transport; Government incentives or examples; Lack of environmental restrictions; Cheaper to build factory; etc. 3 @ 1 mark [3] www.theallpapers.com
Mark scheme, page 11
Page 11 Mark Scheme: Teachers’ version Syllabus Paper IGCSE – October/November 2010 0460 13 © UCLES 2010 (ii) Ideas such as: Advantages more people in employment; higher wages than existing work; improvement in skills; improvements in transport e.g. roads/rail; improvements in infrastructure e.g. electricity/water supply/sanitation; rising standard of living or specifics e.g. housing; improvement in public services or specifics e.g. health care/education; multiplier effect; etc. Disadvantages Exploitation; Low pay; Long hours; Poor working conditions (or example); Loss of rural land/farmland; Any specified pollution e.g. air pollution or effect; Water pollution; Noise pollution; Visual pollution; etc. MAXIMUM 3 MARKS ON EACH OF ADVANTAGES and DISADVANTAGES 5 @ 1 mark or development [5] (c) Levels marking Level 1 (1–3 marks) Statements including limited detail explaining location of manufacturing/processing industry (e.g. large workforce, good transport links, cheap land, raw materials, energy supply, water supply, cheap labour, skilled labour etc.) Level 2 (4–6 marks) Max 5 if no example. 3 developed statements plus named example for 6 marks. More developed statements explaining location of manufacturing/processing industry (e.g. large workforce with engineering skills, or from nearby (named) university, good rail links to raw material supplies, located on coalfield for energy supply, water supply to use in processing etc.) Level 3 (7 marks) Must include place specific information. For named example must state what and where it is. Uses named example (e.g. sugar refining in Baltimore USA). Comprehensive and accurate statements including some place specific reference. (e.g. good motorway links to markets in large cities such as New York and Washington, adjacent port facilities for import of sugar cane from Caribbean, government grants due to investment in declining industrial areas, large areas of flat land adjacent to waterside for storage of raw cane, large workforce in urban area which has high unemployment rate due to recent industrial decline etc.) NB: for place specific allow statistics/names of places/universities/airports etc. [7] [Total: 25] www.theallpapers.com
Mark scheme, page 12
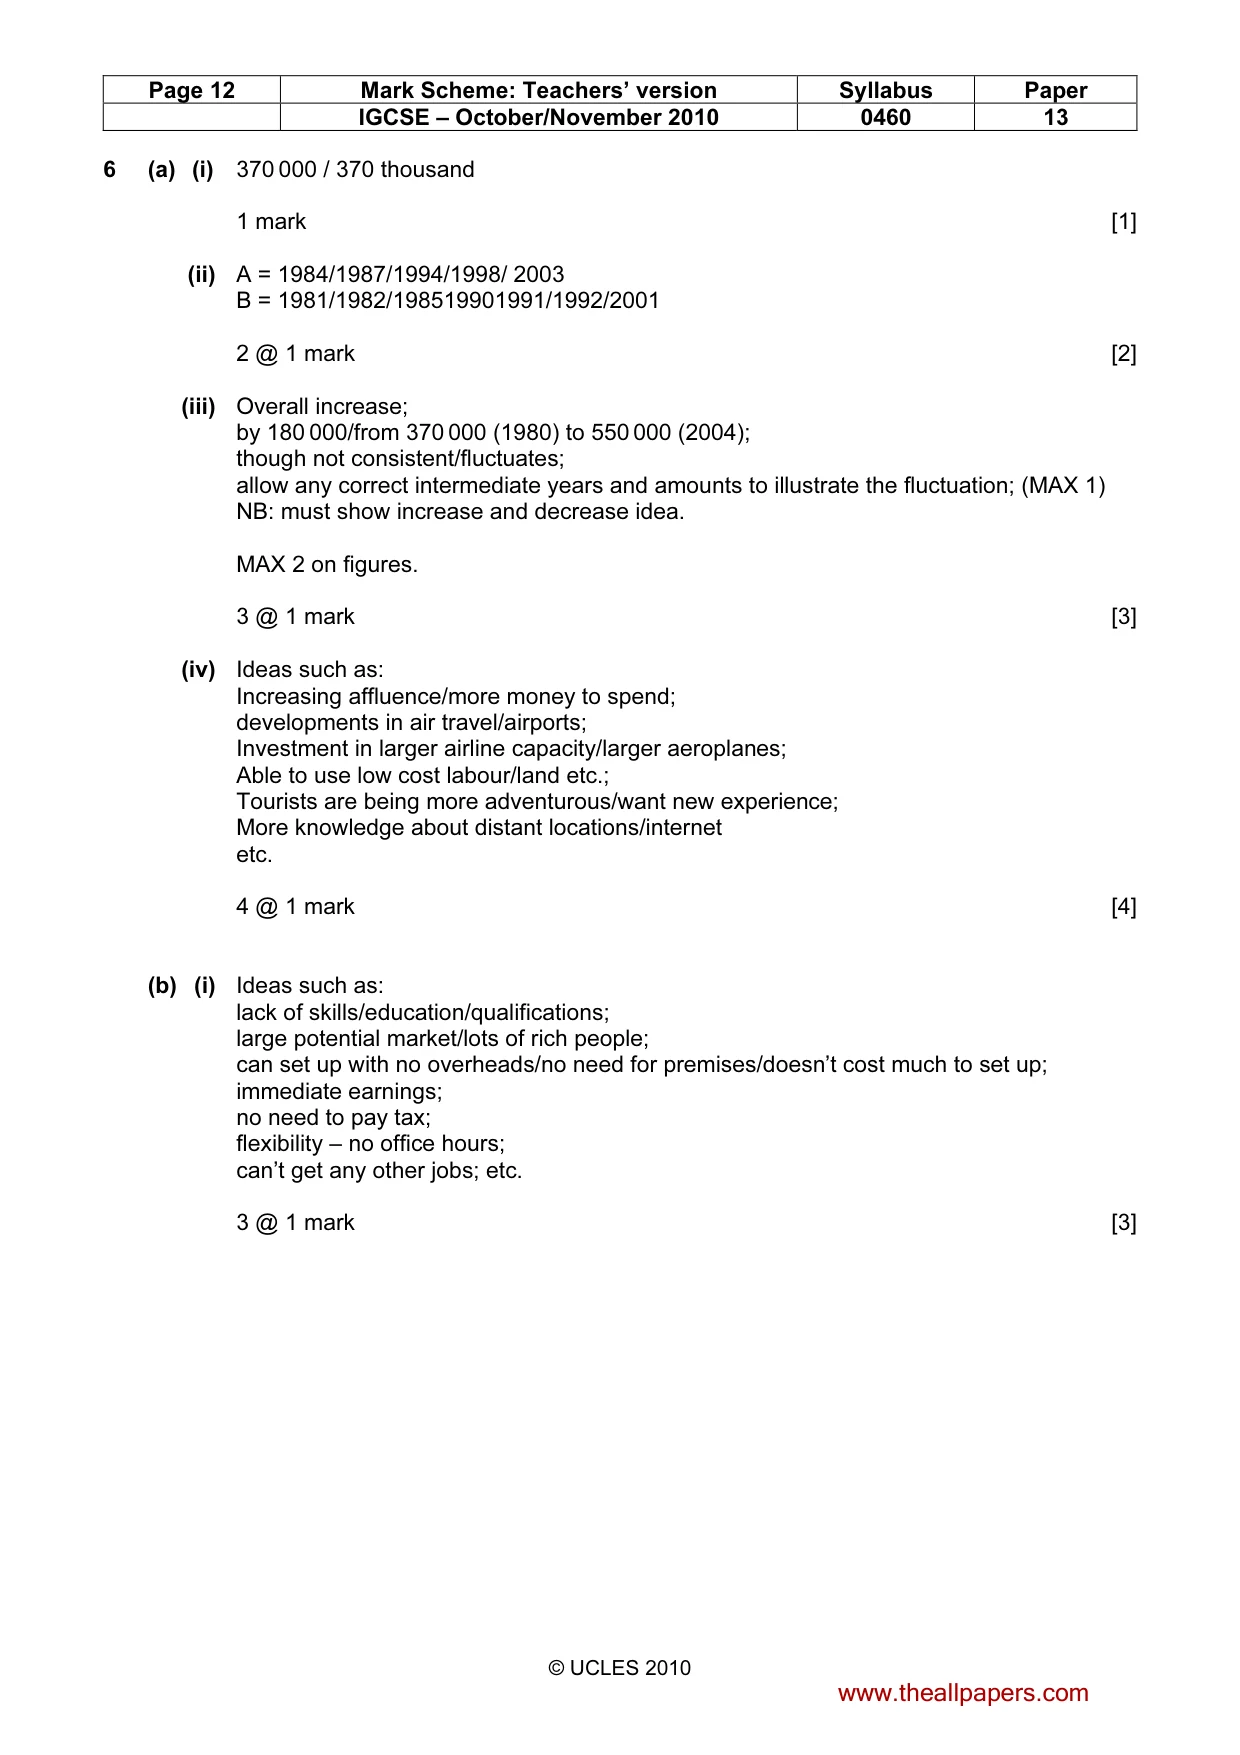
Page 12 Mark Scheme: Teachers’ version Syllabus Paper IGCSE – October/November 2010 0460 13 © UCLES 2010 6 (a) (i) 370 000 / 370 thousand 1 mark [1] (ii) A = 1984/1987/1994/1998/ 2003 B = 1981/1982/198519901991/1992/2001 2 @ 1 mark [2] (iii) Overall increase; by 180 000/from 370 000 (1980) to 550 000 (2004); though not consistent/fluctuates; allow any correct intermediate years and amounts to illustrate the fluctuation; (MAX 1) NB: must show increase and decrease idea. MAX 2 on figures. 3 @ 1 mark [3] (iv) Ideas such as: Increasing affluence/more money to spend; developments in air travel/airports; Investment in larger airline capacity/larger aeroplanes; Able to use low cost labour/land etc.; Tourists are being more adventurous/want new experience; More knowledge about distant locations/internet etc. 4 @ 1 mark [4] (b) (i) Ideas such as: lack of skills/education/qualifications; large potential market/lots of rich people; can set up with no overheads/no need for premises/doesn’t cost much to set up; immediate earnings; no need to pay tax; flexibility – no office hours; can’t get any other jobs; etc. 3 @ 1 mark [3] www.theallpapers.com
Mark scheme, page 13
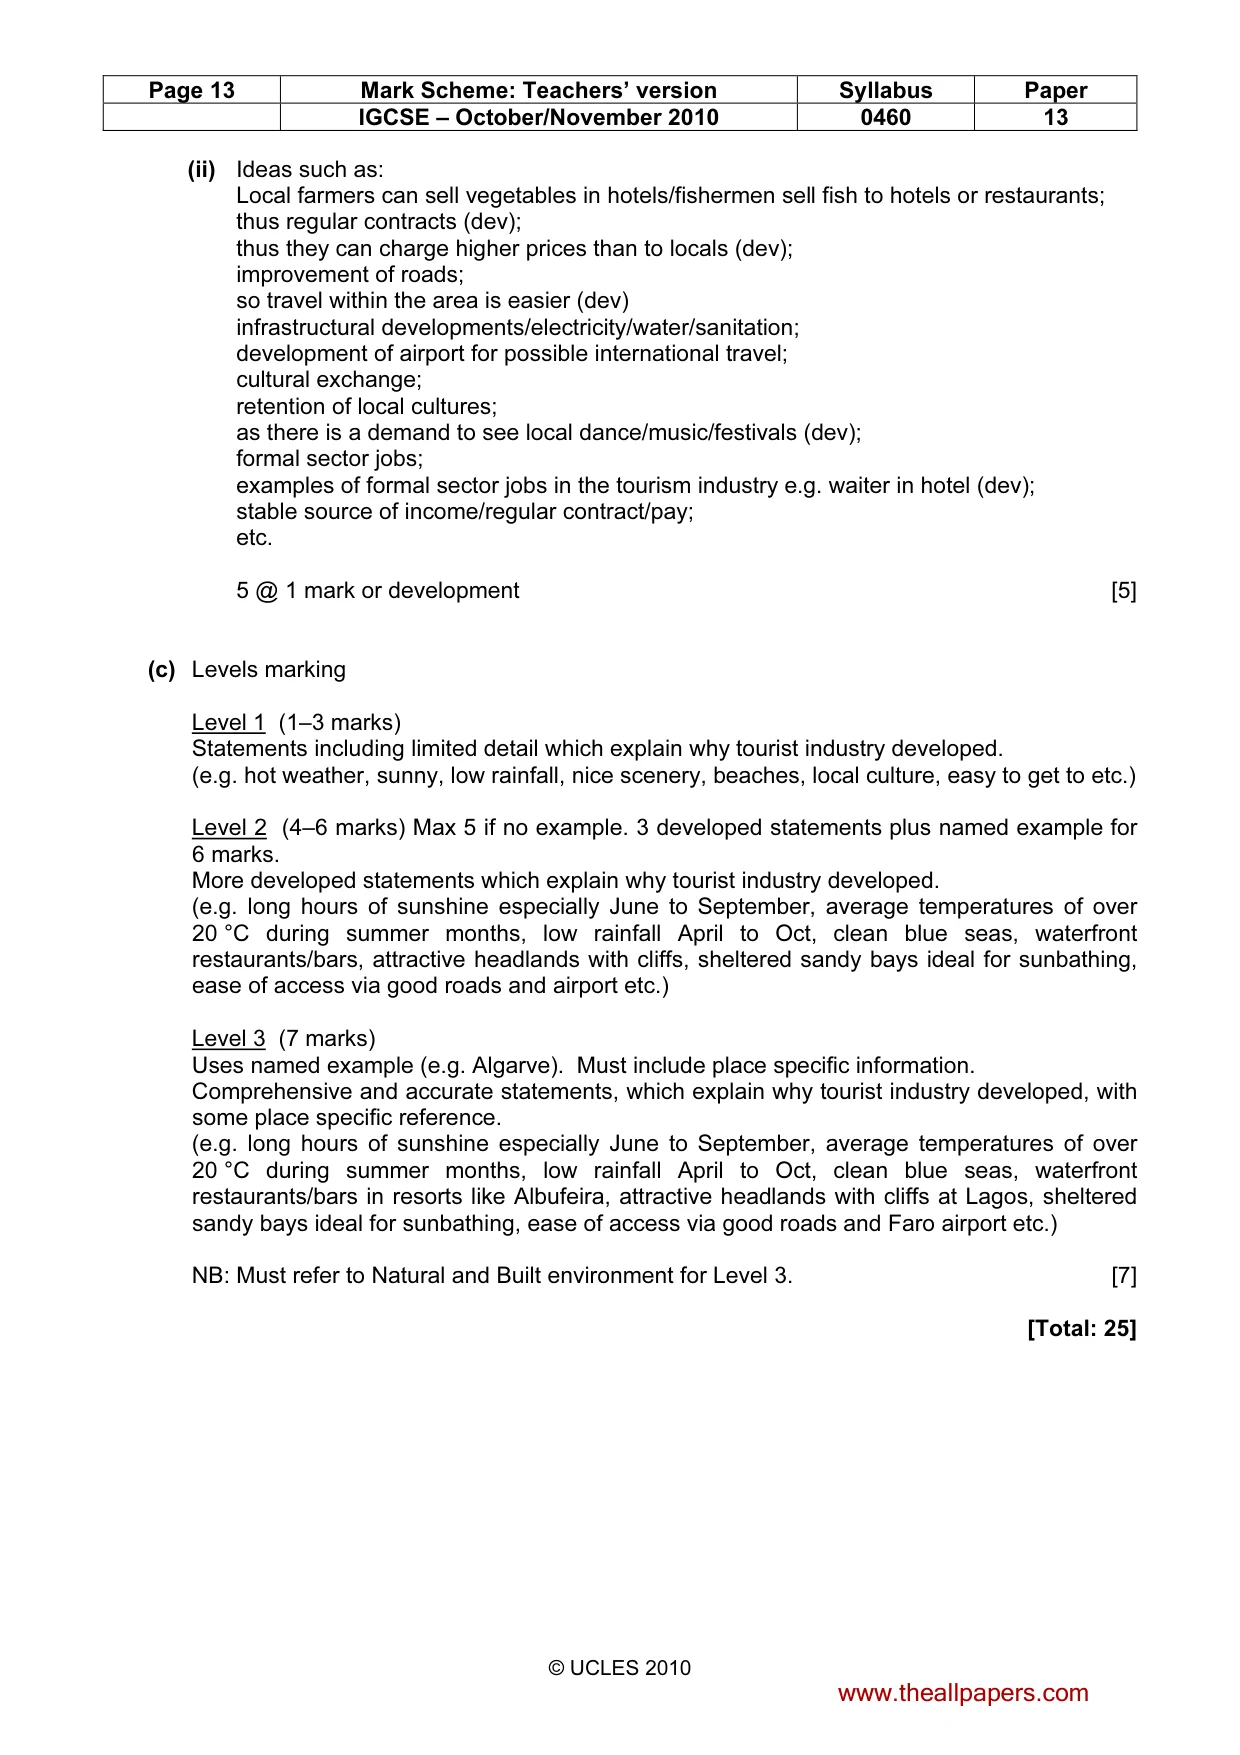
Page 13 Mark Scheme: Teachers’ version Syllabus Paper IGCSE – October/November 2010 0460 13 © UCLES 2010 (ii) Ideas such as: Local farmers can sell vegetables in hotels/fishermen sell fish to hotels or restaurants; thus regular contracts (dev); thus they can charge higher prices than to locals (dev); improvement of roads; so travel within the area is easier (dev) infrastructural developments/electricity/water/sanitation; development of airport for possible international travel; cultural exchange; retention of local cultures; as there is a demand to see local dance/music/festivals (dev); formal sector jobs; examples of formal sector jobs in the tourism industry e.g. waiter in hotel (dev); stable source of income/regular contract/pay; etc. 5 @ 1 mark or development [5] (c) Levels marking Level 1 (1–3 marks) Statements including limited detail which explain why tourist industry developed. (e.g. hot weather, sunny, low rainfall, nice scenery, beaches, local culture, easy to get to etc.) Level 2 (4–6 marks) Max 5 if no example. 3 developed statements plus named example for 6 marks. More developed statements which explain why tourist industry developed. (e.g. long hours of sunshine especially June to September, average temperatures of over 20 °C during summer months, low rainfall April to Oct, clean blue seas, waterfront restaurants/bars, attractive headlands with cliffs, sheltered sandy bays ideal for sunbathing, ease of access via good roads and airport etc.) Level 3 (7 marks) Uses named example (e.g. Algarve). Must include place specific information. Comprehensive and accurate statements, which explain why tourist industry developed, with some place specific reference. (e.g. long hours of sunshine especially June to September, average temperatures of over 20 °C during summer months, low rainfall April to Oct, clean blue seas, waterfront restaurants/bars in resorts like Albufeira, attractive headlands with cliffs at Lagos, sheltered sandy bays ideal for sunbathing, ease of access via good roads and Faro airport etc.) NB: Must refer to Natural and Built environment for Level 3. [7] [Total: 25] www.theallpapers.com
What you needed in this session
Cambridge’s own grade thresholds for 2010 Oct/Nov, Paper 1 · Variant 3. A higher threshold means an easier paper — the bar moves with how the cohort did.