Cambridge IGCSE Geography 0460 — 2010 Oct/Nov Paper 1 · Variant 2
0460/12/O/N/10 · 75 marks · ≈84 min
The question paper and its mark scheme, free to read here and free to download. This is Cambridge’s own paper, exactly as it was sat.
Question paper12 pages


Mark scheme11 pages
Answers below. Sit the paper first if you are practising.
Paper as text
Question paper, page 1
This document consists of 10 printed pages, 2 blank pages and 1 Insert. DC (CW/SW) 20091/7 © UCLES 2010 [Turn over UNIVERSITY OF CAMBRIDGE INTERNATIONAL EXAMINATIONS International General Certificate of Secondary Education READ THESE INSTRUCTIONS FIRST If you have been given an Answer Booklet, follow the instructions on the front cover of the Booklet. Write your Centre number, candidate number and name on all the work you hand in. Write in dark blue or black pen. You may use a soft pencil for any diagrams, graphs, or rough working. Do not use staples, paper clips, highlighters, glue or correction fluid. Answer three questions. Sketch maps and diagrams should be drawn whenever they serve to illustrate an answer. The Insert contains Fig. 4 for Question 2, Photographs A and B for Question 4 and Photographs C, D and E for Question 6. At the end of the examination, fasten all your work securely together. The number of marks is given in brackets [ ] at the end of each question or part question. * 0 0 0 0 7 2 9 5 5 3 * GEOGRAPHY 0460/12 Paper 1 October/November 2010 1 hour 45 minutes Additional Materials: Answer Booklet/Paper www.theallpapers.com
Question paper, page 2
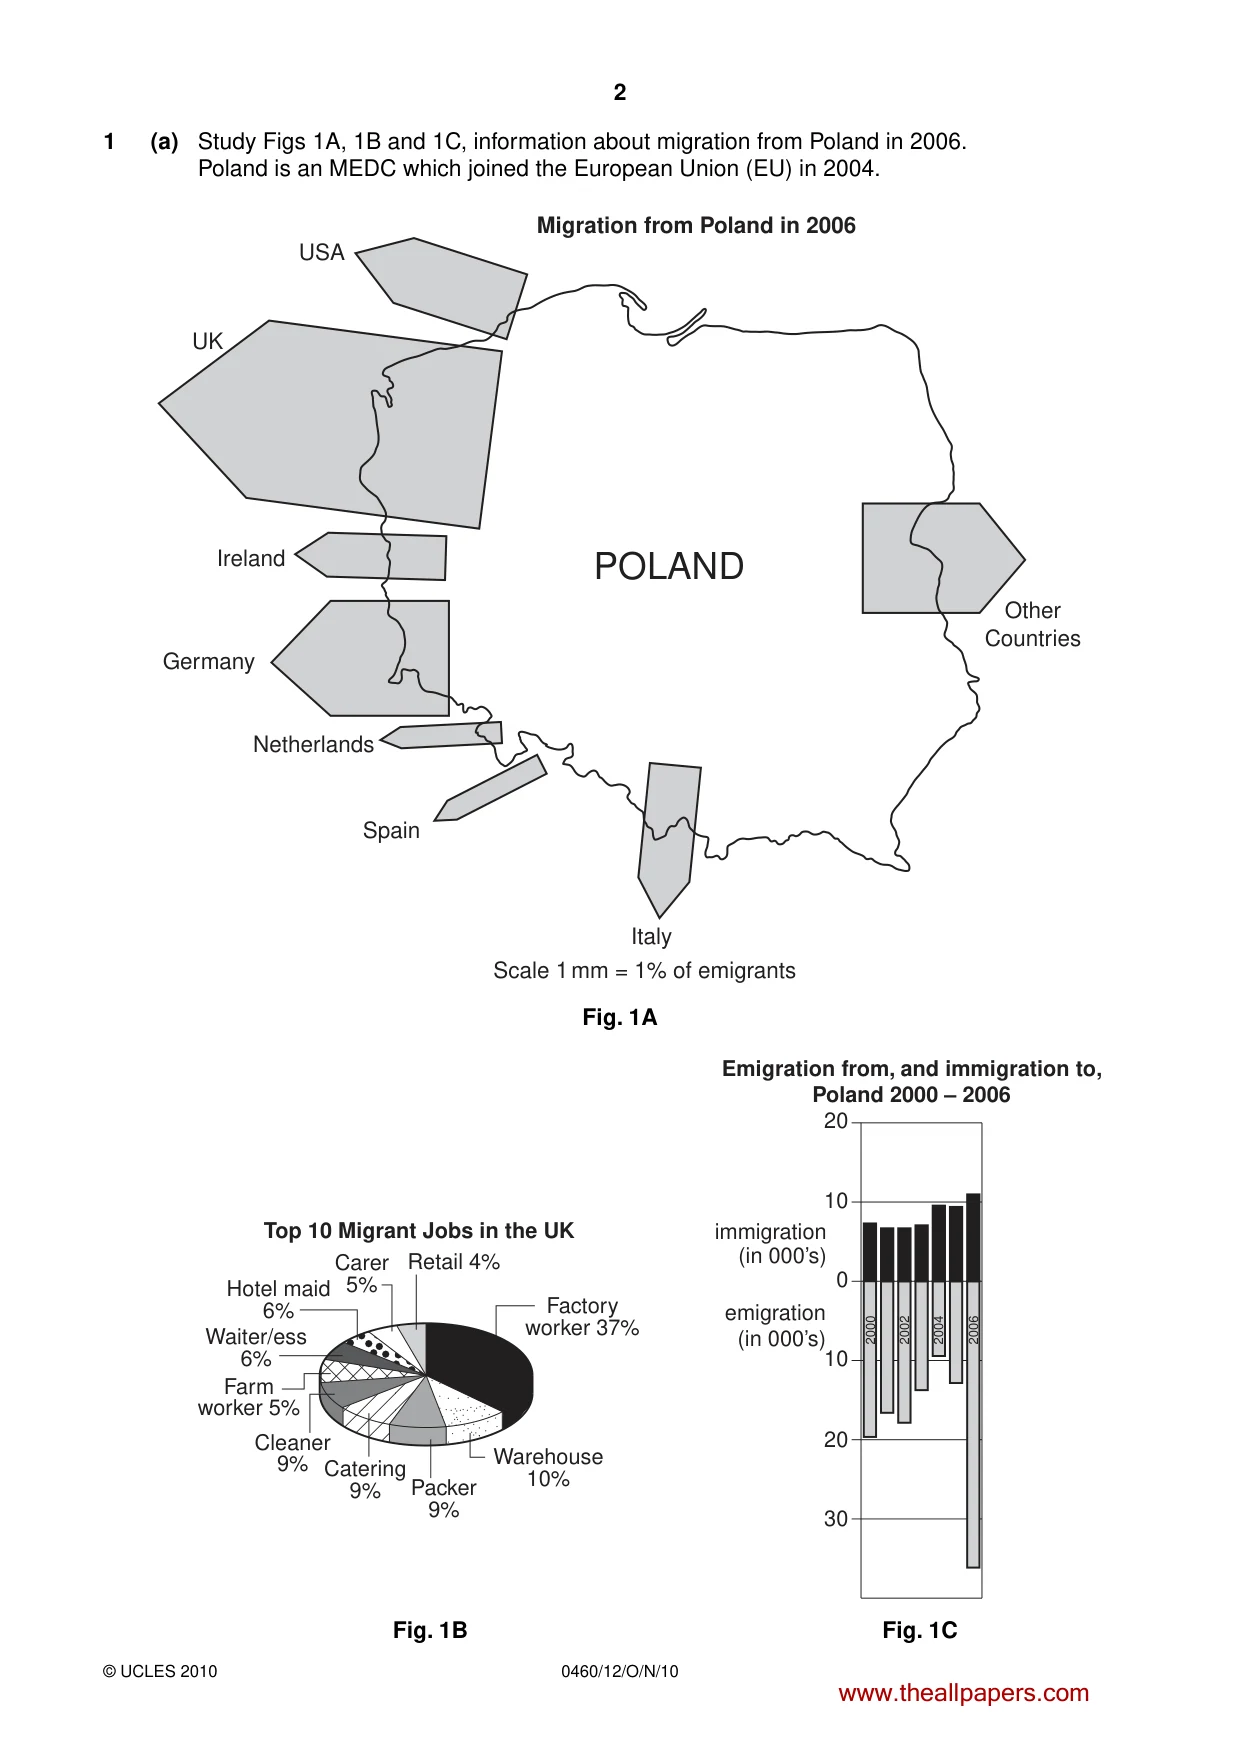
2 0460/12/O/N/10 © UCLES 2010 1 (a) Study Figs 1A, 1B and 1C, information about migration from Poland in 2006. Poland is an MEDC which joined the European Union (EU) in 2004. USA Migration from Poland in 2006 Germany UK Ireland Spain Netherlands Scale 1 mm = 1% of emigrants POLAND Italy Other Countries Fig. 1A 2000 2002 2004 2006 30 20 10 0 immigration Emigration from, and immigration to, Poland 2000 – 2006 (in 000’s) emigration (in 000’s) 10 20 Carer 5% Hotel maid 6% Waiter/ess 6% Farm worker 5% Cleaner 9% Catering 9% Packer 9% Warehouse 10% Factory worker 37% Retail 4% Top 10 Migrant Jobs in the UK Fig. 1B Fig. 1C www.theallpapers.com
Question paper, page 3
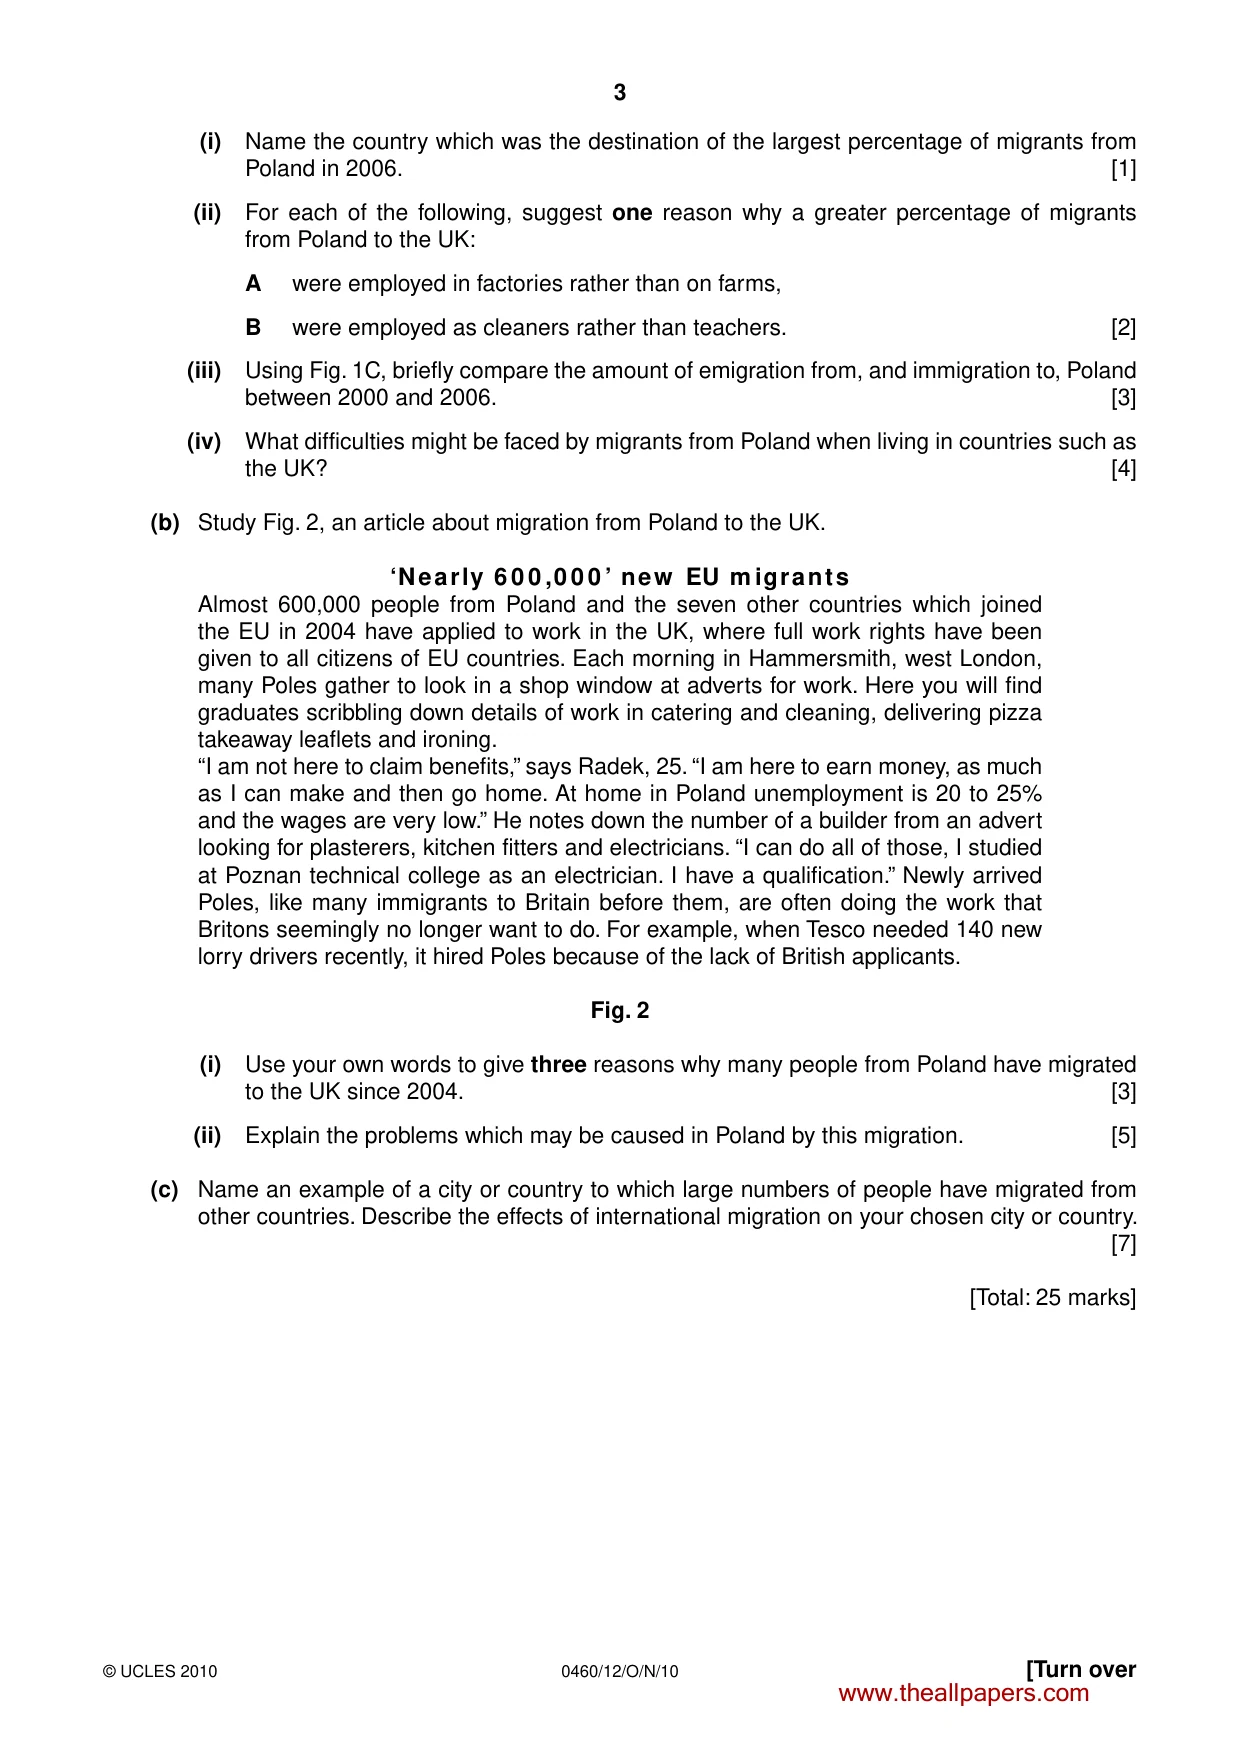
3 0460/12/O/N/10 © UCLES 2010 [Turn over (i) Name the country which was the destination of the largest percentage of migrants from Poland in 2006. [1] (ii) For each of the following, suggest one reason why a greater percentage of migrants from Poland to the UK: A were employed in factories rather than on farms, B were employed as cleaners rather than teachers. [2] (iii) Using Fig. 1C, briefly compare the amount of emigration from, and immigration to, Poland between 2000 and 2006. [3] (iv) What difficulties might be faced by migrants from Poland when living in countries such as the UK? [4] (b) Study Fig. 2, an article about migration from Poland to the UK. ‘Nearly 6 0 0 ,0 0 0 ’ new EU m igrants Almost 600,000 people from Poland and the seven other countries which joined the EU in 2004 have applied to work in the UK, where full work rights have been given to all citizens of EU countries. Each morning in Hammersmith, west London, many Poles gather to look in a shop window at adverts for work. Here you will find graduates scribbling down details of work in catering and cleaning, delivering pizza takeaway leaflets and ironing. “I am not here to claim benefits,” says Radek, 25. “I am here to earn money, as much as I can make and then go home. At home in Poland unemployment is 20 to 25% and the wages are very low.” He notes down the number of a builder from an advert looking for plasterers, kitchen fitters and electricians. “I can do all of those, I studied at Poznan technical college as an electrician. I have a qualification.” Newly arrived Poles, like many immigrants to Britain before them, are often doing the work that Britons seemingly no longer want to do. For example, when Tesco needed 140 new lorry drivers recently, it hired Poles because of the lack of British applicants. Fig. 2 (i) Use your own words to give three reasons why many people from Poland have migrated to the UK since 2004. [3] (ii) Explain the problems which may be caused in Poland by this migration. [5] (c) Name an example of a city or country to which large numbers of people have migrated from other countries. Describe the effects of international migration on your chosen city or country. [7] [Total: 25 marks] www.theallpapers.com
Question paper, page 4
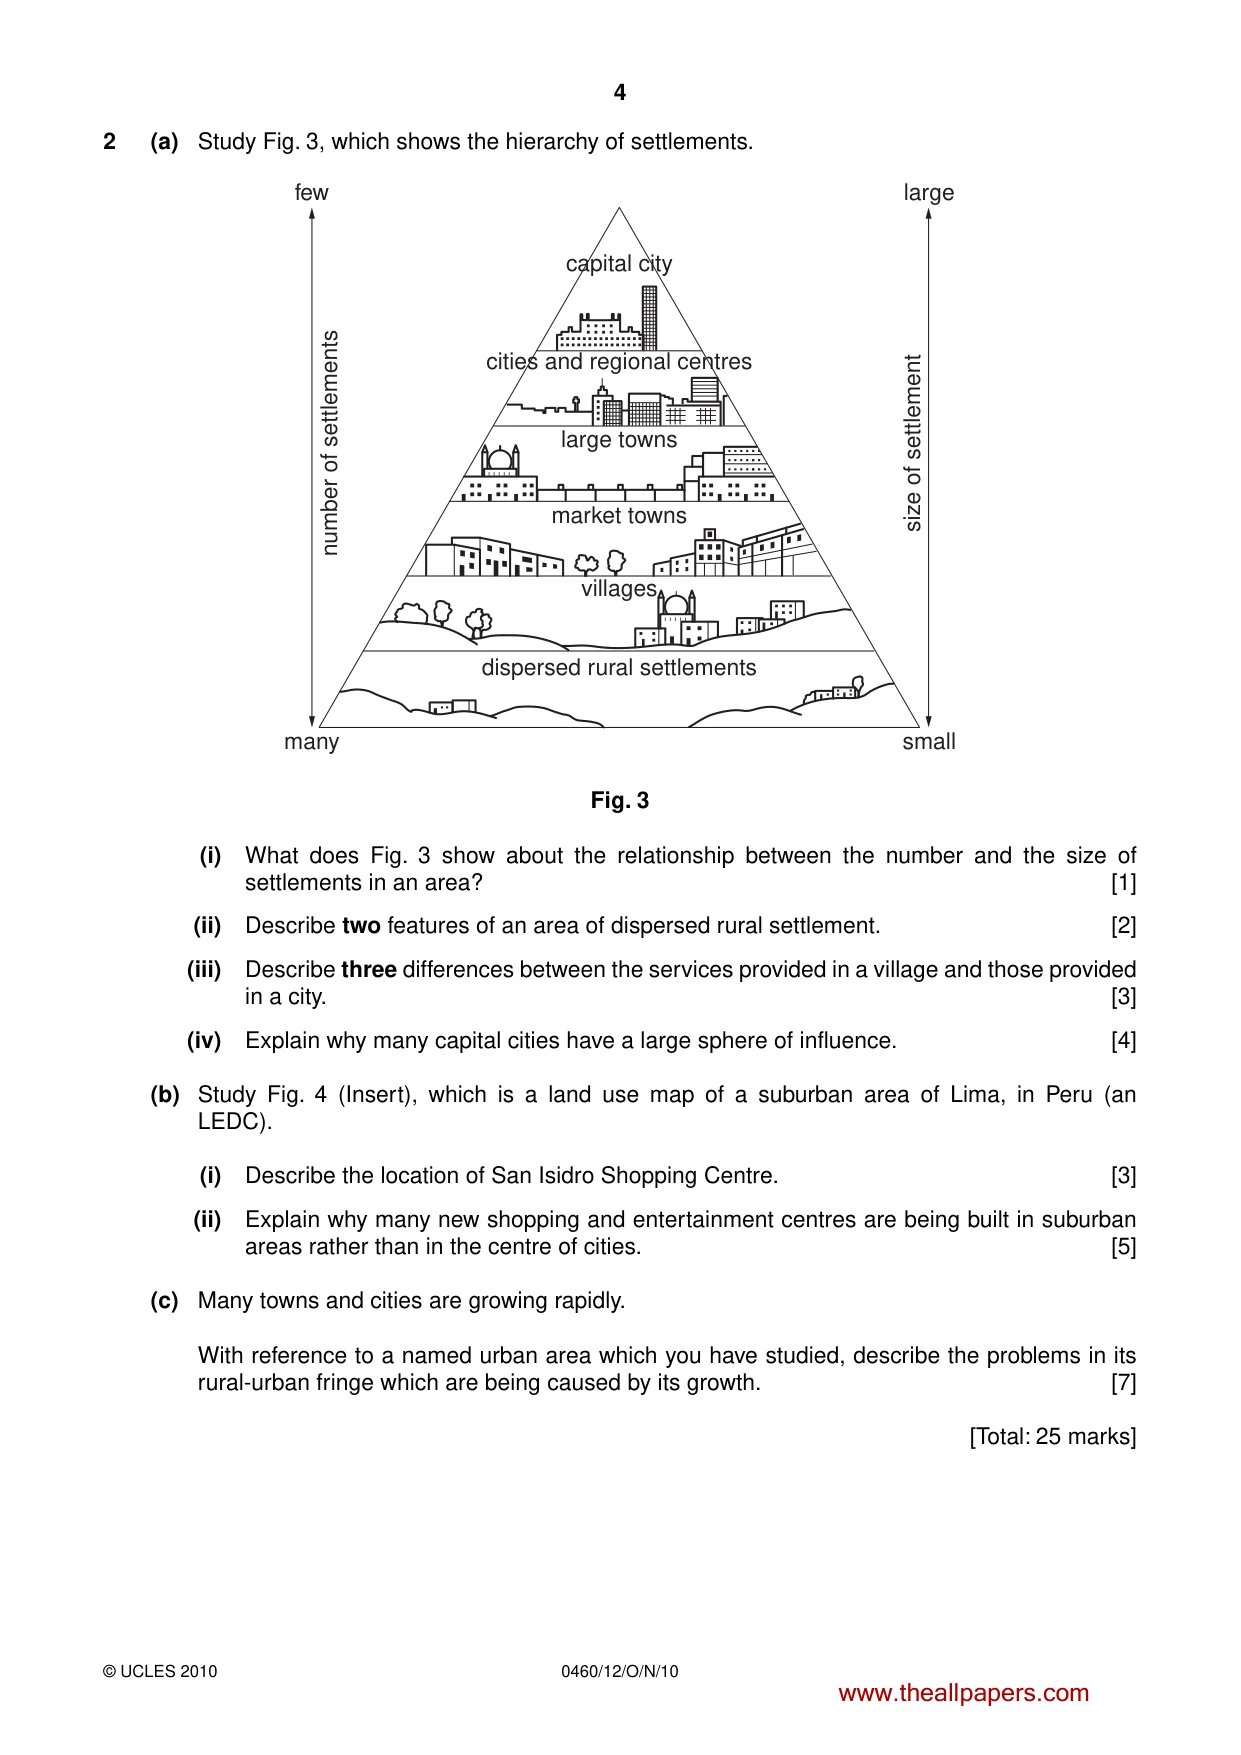
4 0460/12/O/N/10 © UCLES 2010 2 (a) Study Fig. 3, which shows the hierarchy of settlements. dispersed rural settlements villages market towns large towns cities and regional centres number of settlements size of settlement capital city few large many small Fig. 3 (i) What does Fig. 3 show about the relationship between the number and the size of settlements in an area? [1] (ii) Describe two features of an area of dispersed rural settlement. [2] (iii) Describe three differences between the services provided in a village and those provided in a city. [3] (iv) Explain why many capital cities have a large sphere of influence. [4] (b) Study Fig. 4 (Insert), which is a land use map of a suburban area of Lima, in Peru (an LEDC). (i) Describe the location of San Isidro Shopping Centre. [3] (ii) Explain why many new shopping and entertainment centres are being built in suburban areas rather than in the centre of cities. [5] (c) Many towns and cities are growing rapidly. With reference to a named urban area which you have studied, describe the problems in its rural-urban fringe which are being caused by its growth. [7] [Total: 25 marks] www.theallpapers.com
Question paper, page 5
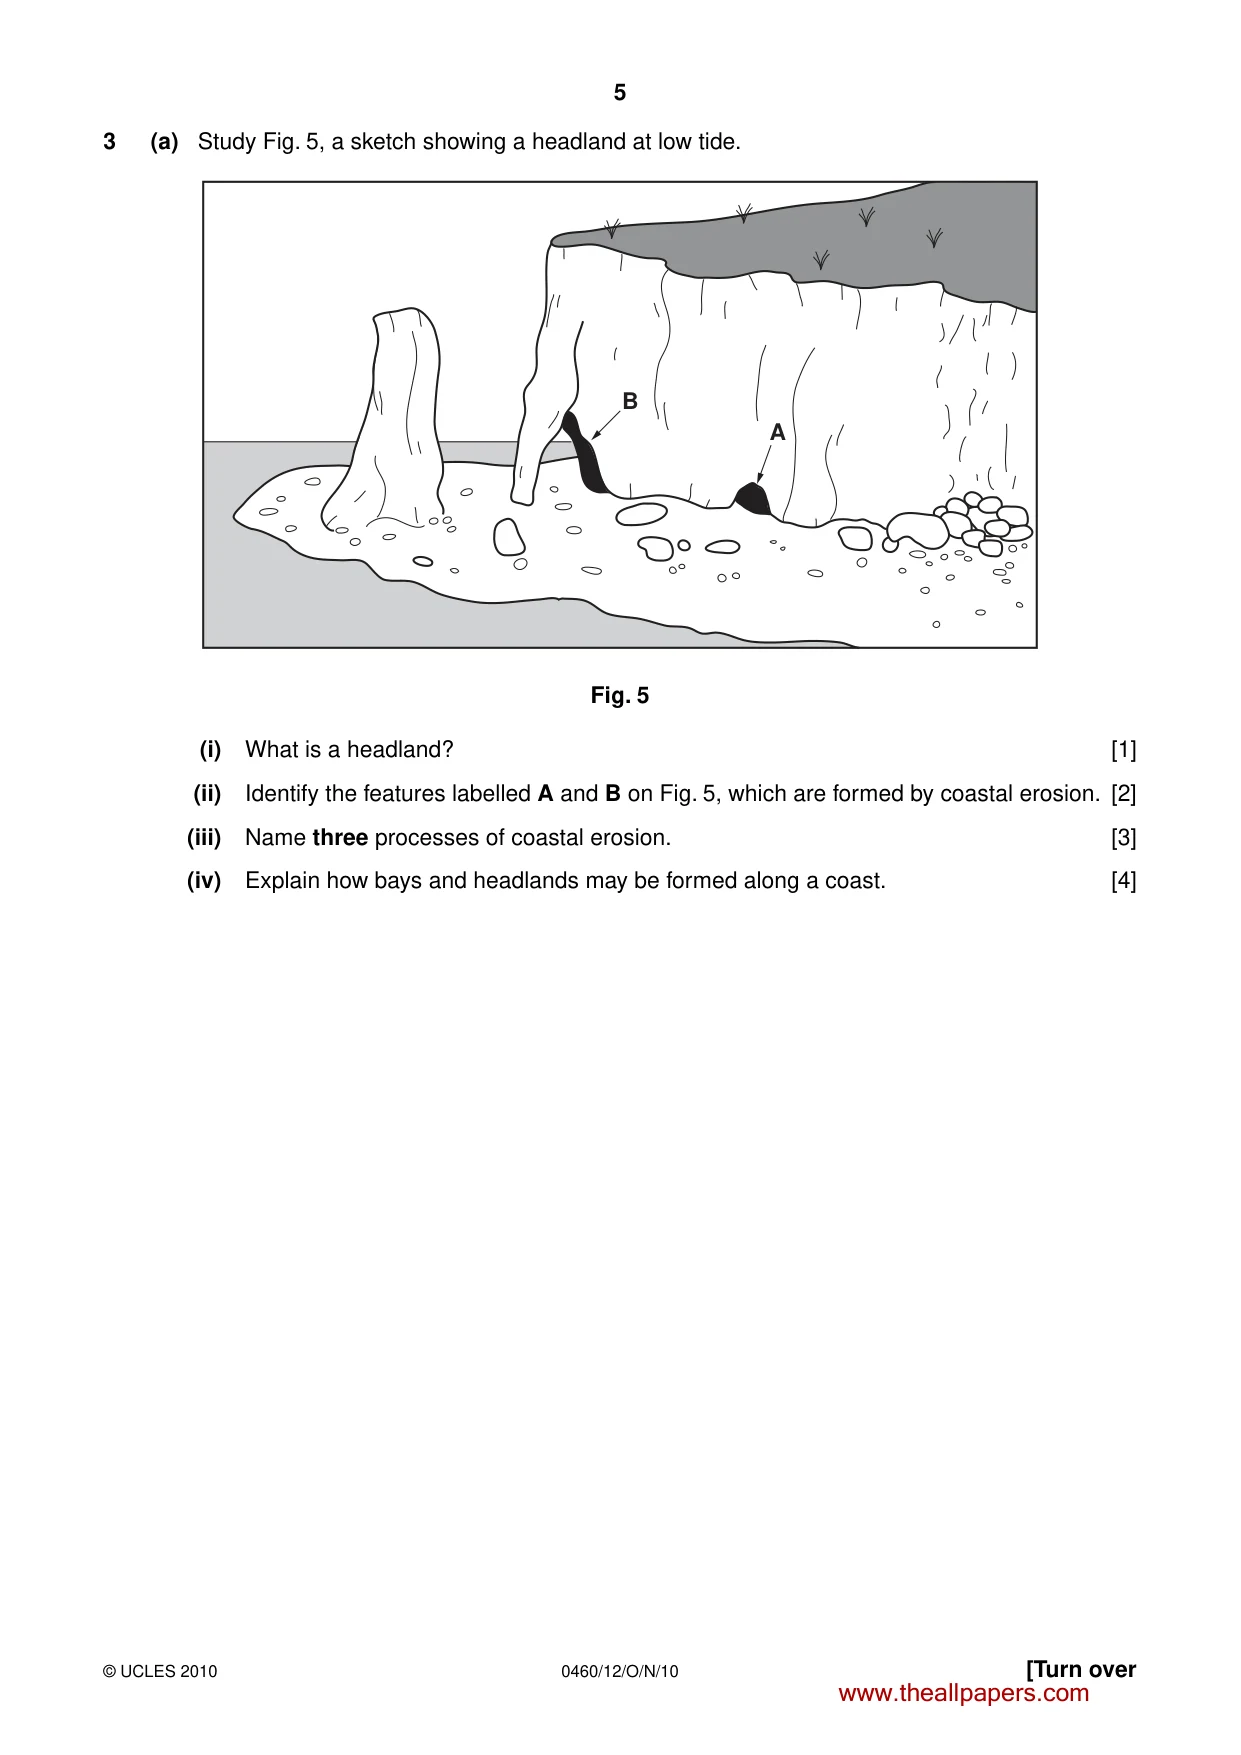
5 0460/12/O/N/10 © UCLES 2010 [Turn over 3 (a) Study Fig. 5, a sketch showing a headland at low tide. B A Fig. 5 (i) What is a headland? [1] (ii) Identify the features labelled A and B on Fig. 5, which are formed by coastal erosion. [2] (iii) Name three processes of coastal erosion. [3] (iv) Explain how bays and headlands may be formed along a coast. [4] www.theallpapers.com
Question paper, page 6
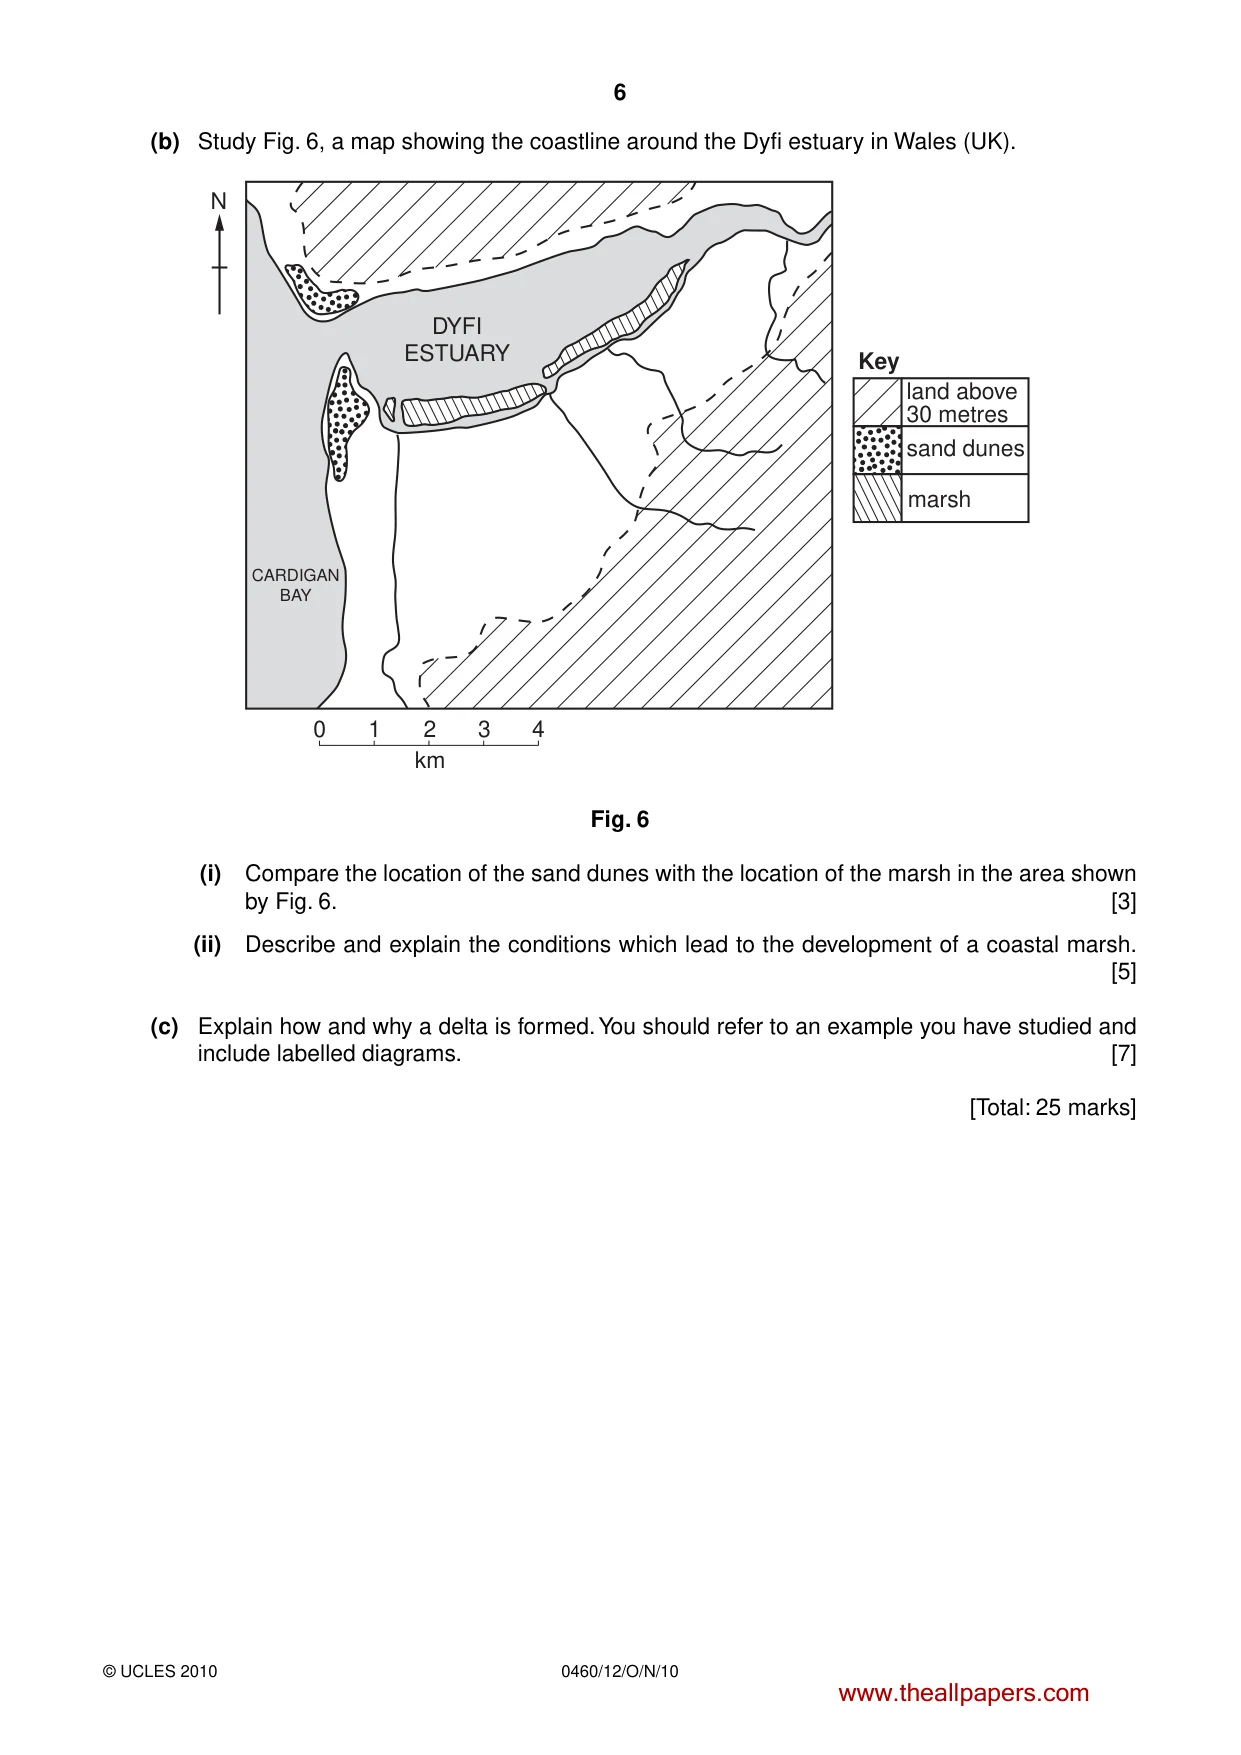
6 0460/12/O/N/10 © UCLES 2010 (b) Study Fig. 6, a map showing the coastline around the Dyfi estuary in Wales (UK). 0 1 2 km 3 4 DYFI ESTUARY CARDIGAN BAY N land above 30 metres Key sand dunes marsh Fig. 6 (i) Compare the location of the sand dunes with the location of the marsh in the area shown by Fig. 6. [3] (ii) Describe and explain the conditions which lead to the development of a coastal marsh. [5] (c) Explain how and why a delta is formed. You should refer to an example you have studied and include labelled diagrams. [7] [Total: 25 marks] www.theallpapers.com
Question paper, page 7
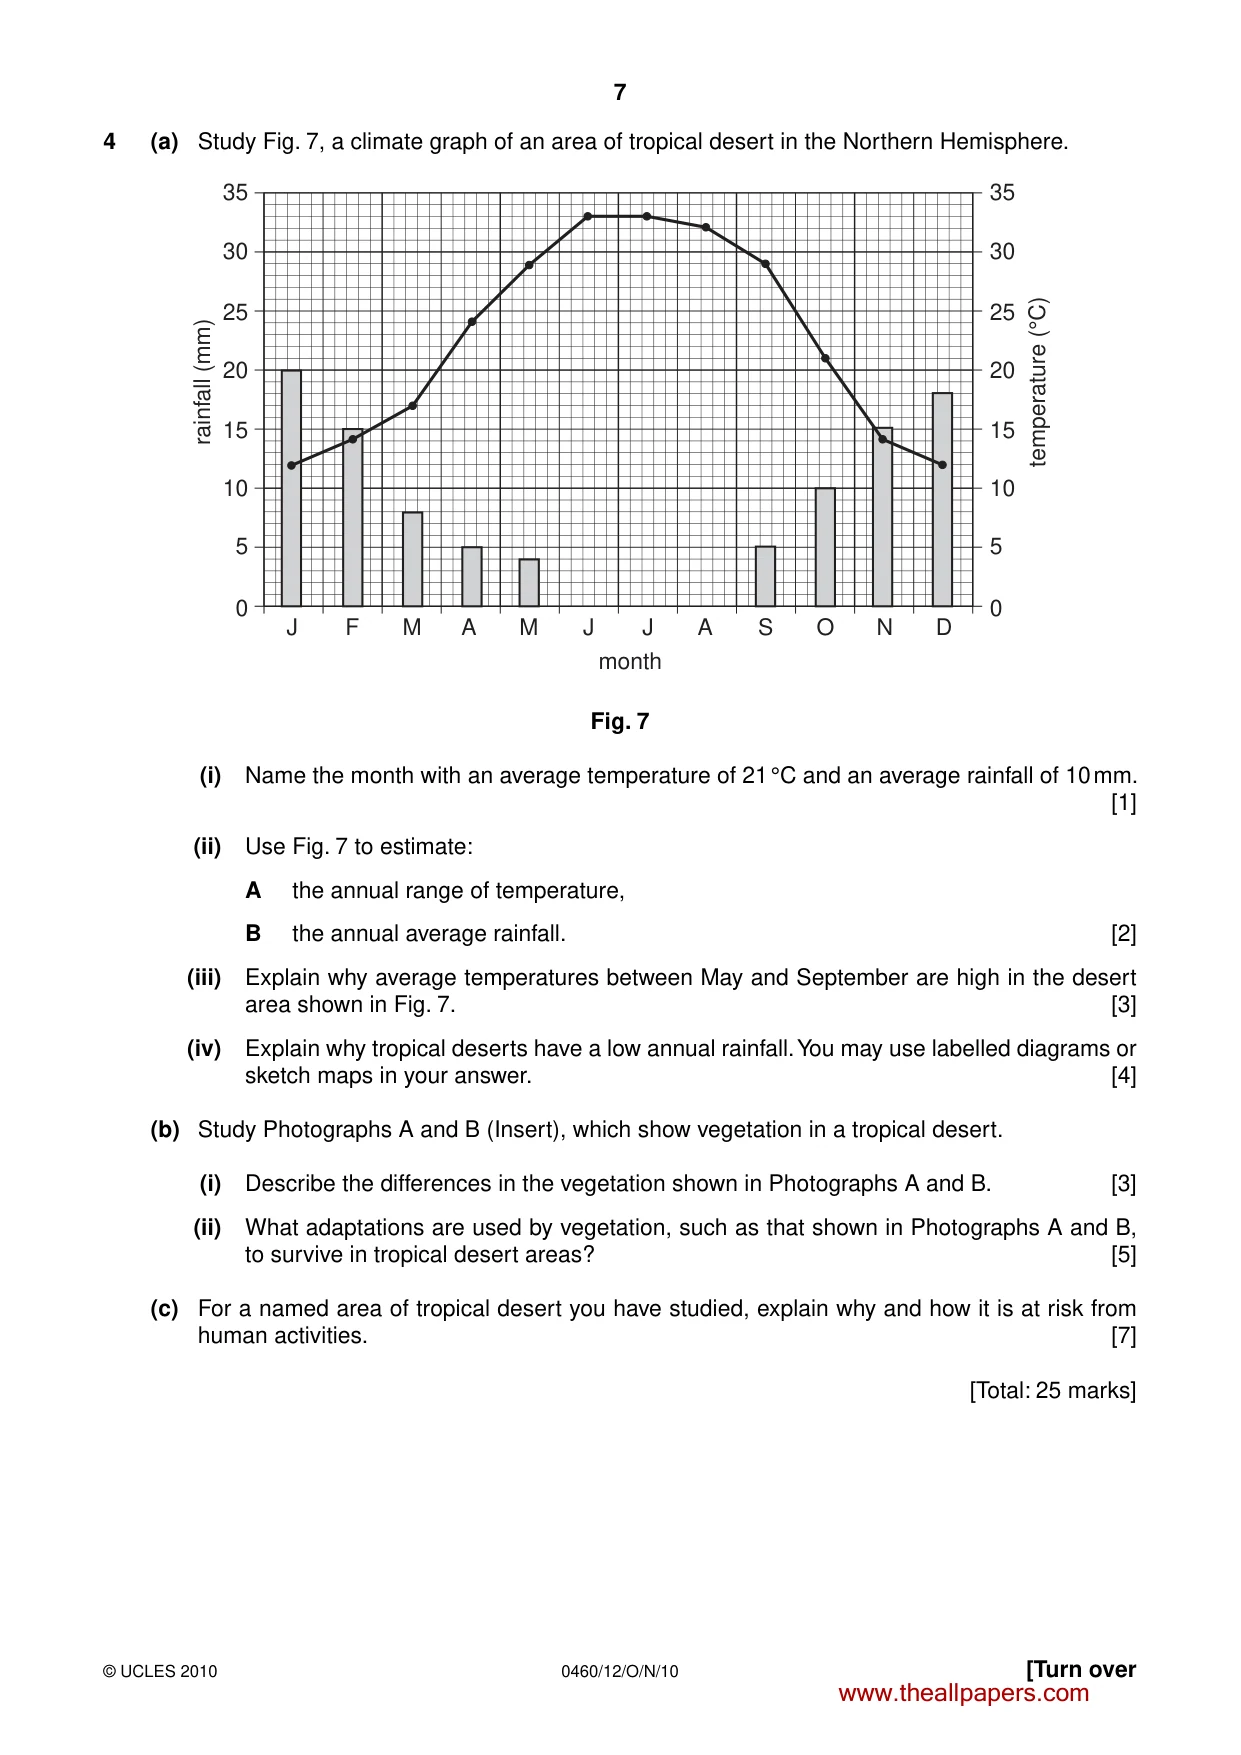
7 0460/12/O/N/10 © UCLES 2010 [Turn over 4 (a) Study Fig. 7, a climate graph of an area of tropical desert in the Northern Hemisphere. 35 30 25 20 15 10 5 0 35 30 25 20 15 10 5 0 J F M A M J month rainfall (mm) temperature (°C) J A S O N D Fig. 7 (i) Name the month with an average temperature of 21 °C and an average rainfall of 10 mm. [1] (ii) Use Fig. 7 to estimate: A the annual range of temperature, B the annual average rainfall. [2] (iii) Explain why average temperatures between May and September are high in the desert area shown in Fig. 7. [3] (iv) Explain why tropical deserts have a low annual rainfall. You may use labelled diagrams or sketch maps in your answer. [4] (b) Study Photographs A and B (Insert), which show vegetation in a tropical desert. (i) Describe the differences in the vegetation shown in Photographs A and B. [3] (ii) What adaptations are used by vegetation, such as that shown in Photographs A and B, to survive in tropical desert areas? [5] (c) For a named area of tropical desert you have studied, explain why and how it is at risk from human activities. [7] [Total: 25 marks] www.theallpapers.com
Question paper, page 8
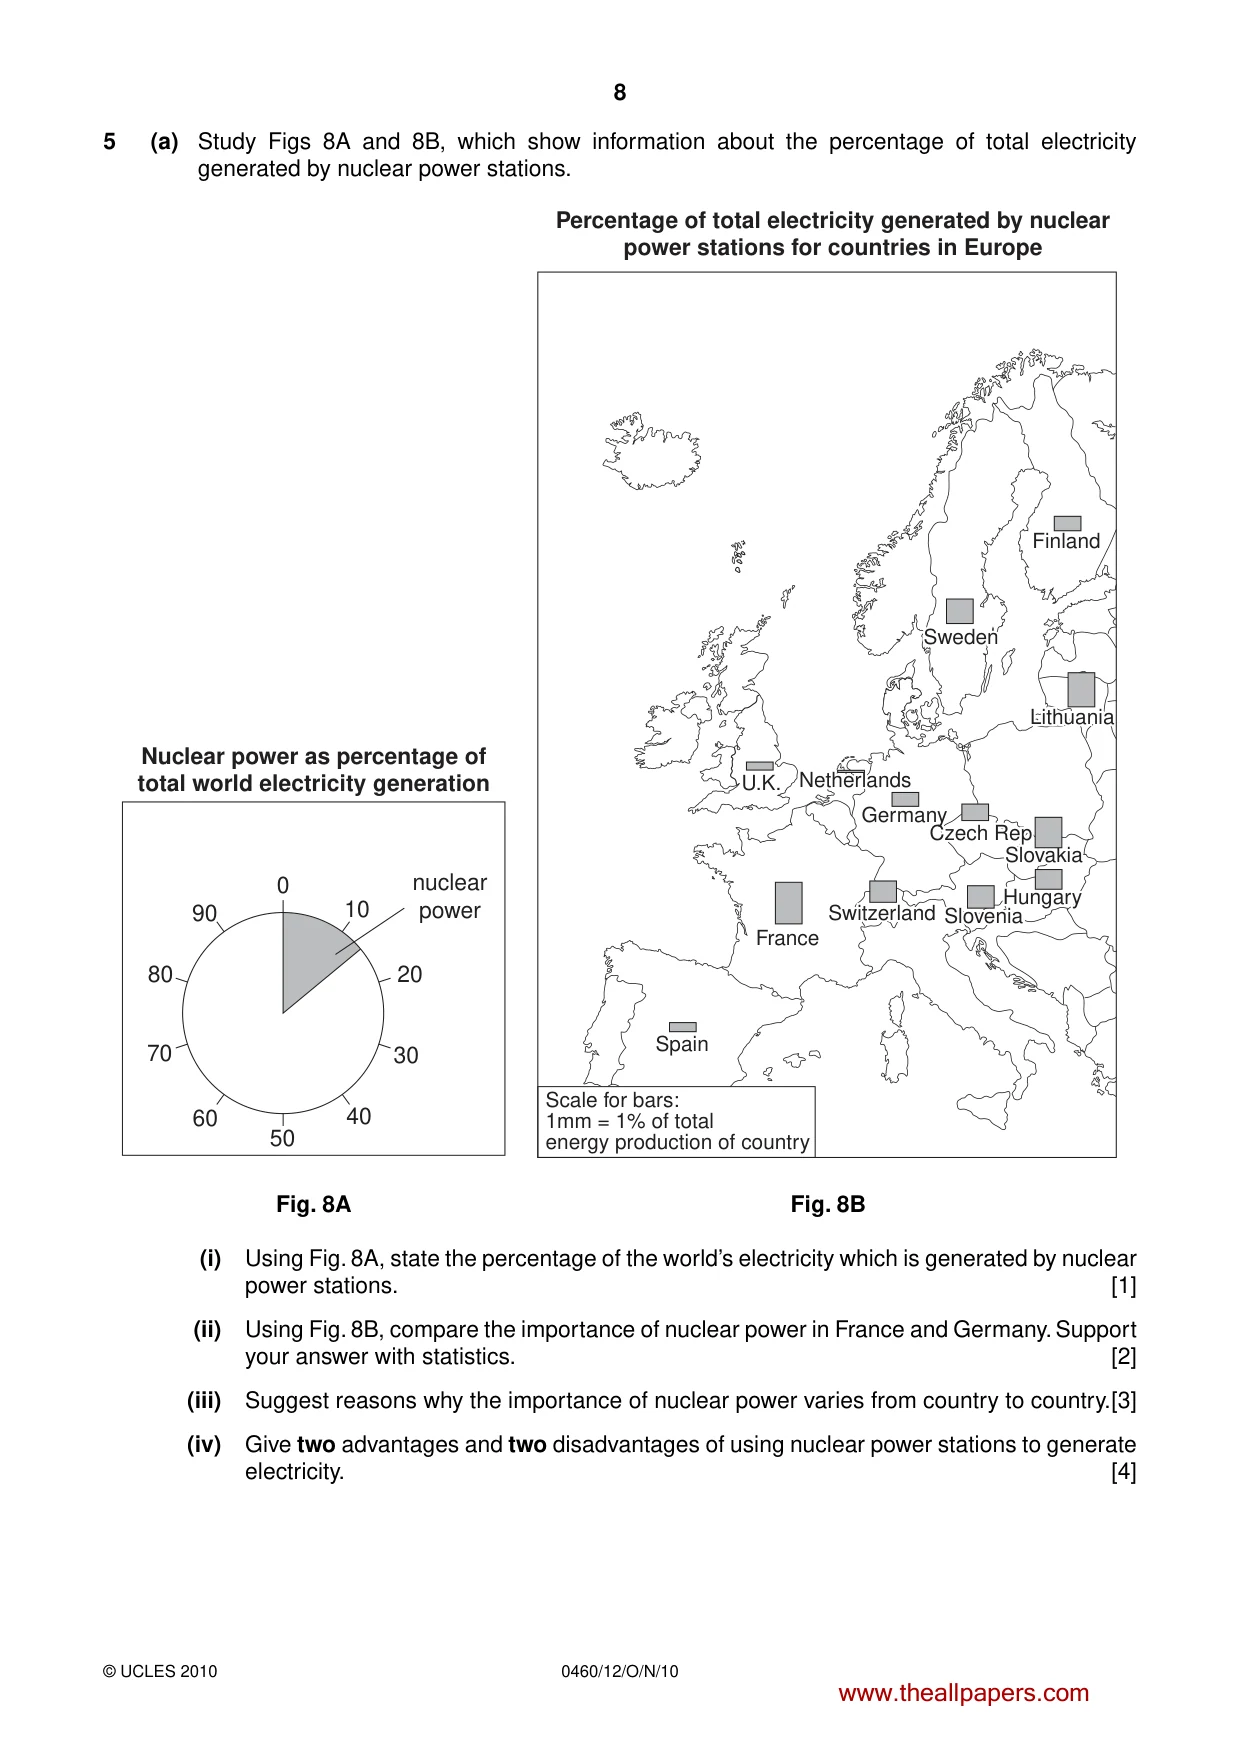
8 0460/12/O/N/10 © UCLES 2010 5 (a) Study Figs 8A and 8B, which show information about the percentage of total electricity generated by nuclear power stations. Nuclear power as percentage of total world electricity generation nuclear power 0 10 20 30 40 50 60 70 80 90 France France U.K. U.K. Germany Germany Sweden Sweden Lithuania Lithuania Finland Finland Netherlands Netherlands Hungary Hungary Slovenia Slovenia Slovakia Slovakia Czech Rep Czech Rep Switzerland Switzerland Spain Spain France U.K. Scale for bars: 1mm = 1% of total energy production of country Germany Sweden Lithuania Finland Netherlands Hungary Slovenia Slovakia Czech Rep Switzerland Spain Percentage of total electricity generated by nuclear power stations for countries in Europe Fig. 8A Fig. 8B (i) Using Fig. 8A, state the percentage of the world’s electricity which is generated by nuclear power stations. [1] (ii) Using Fig. 8B, compare the importance of nuclear power in France and Germany. Support your answer with statistics. [2] (iii) Suggest reasons why the importance of nuclear power varies from country to country. [3] (iv) Give two advantages and two disadvantages of using nuclear power stations to generate electricity. [4] www.theallpapers.com
Question paper, page 9
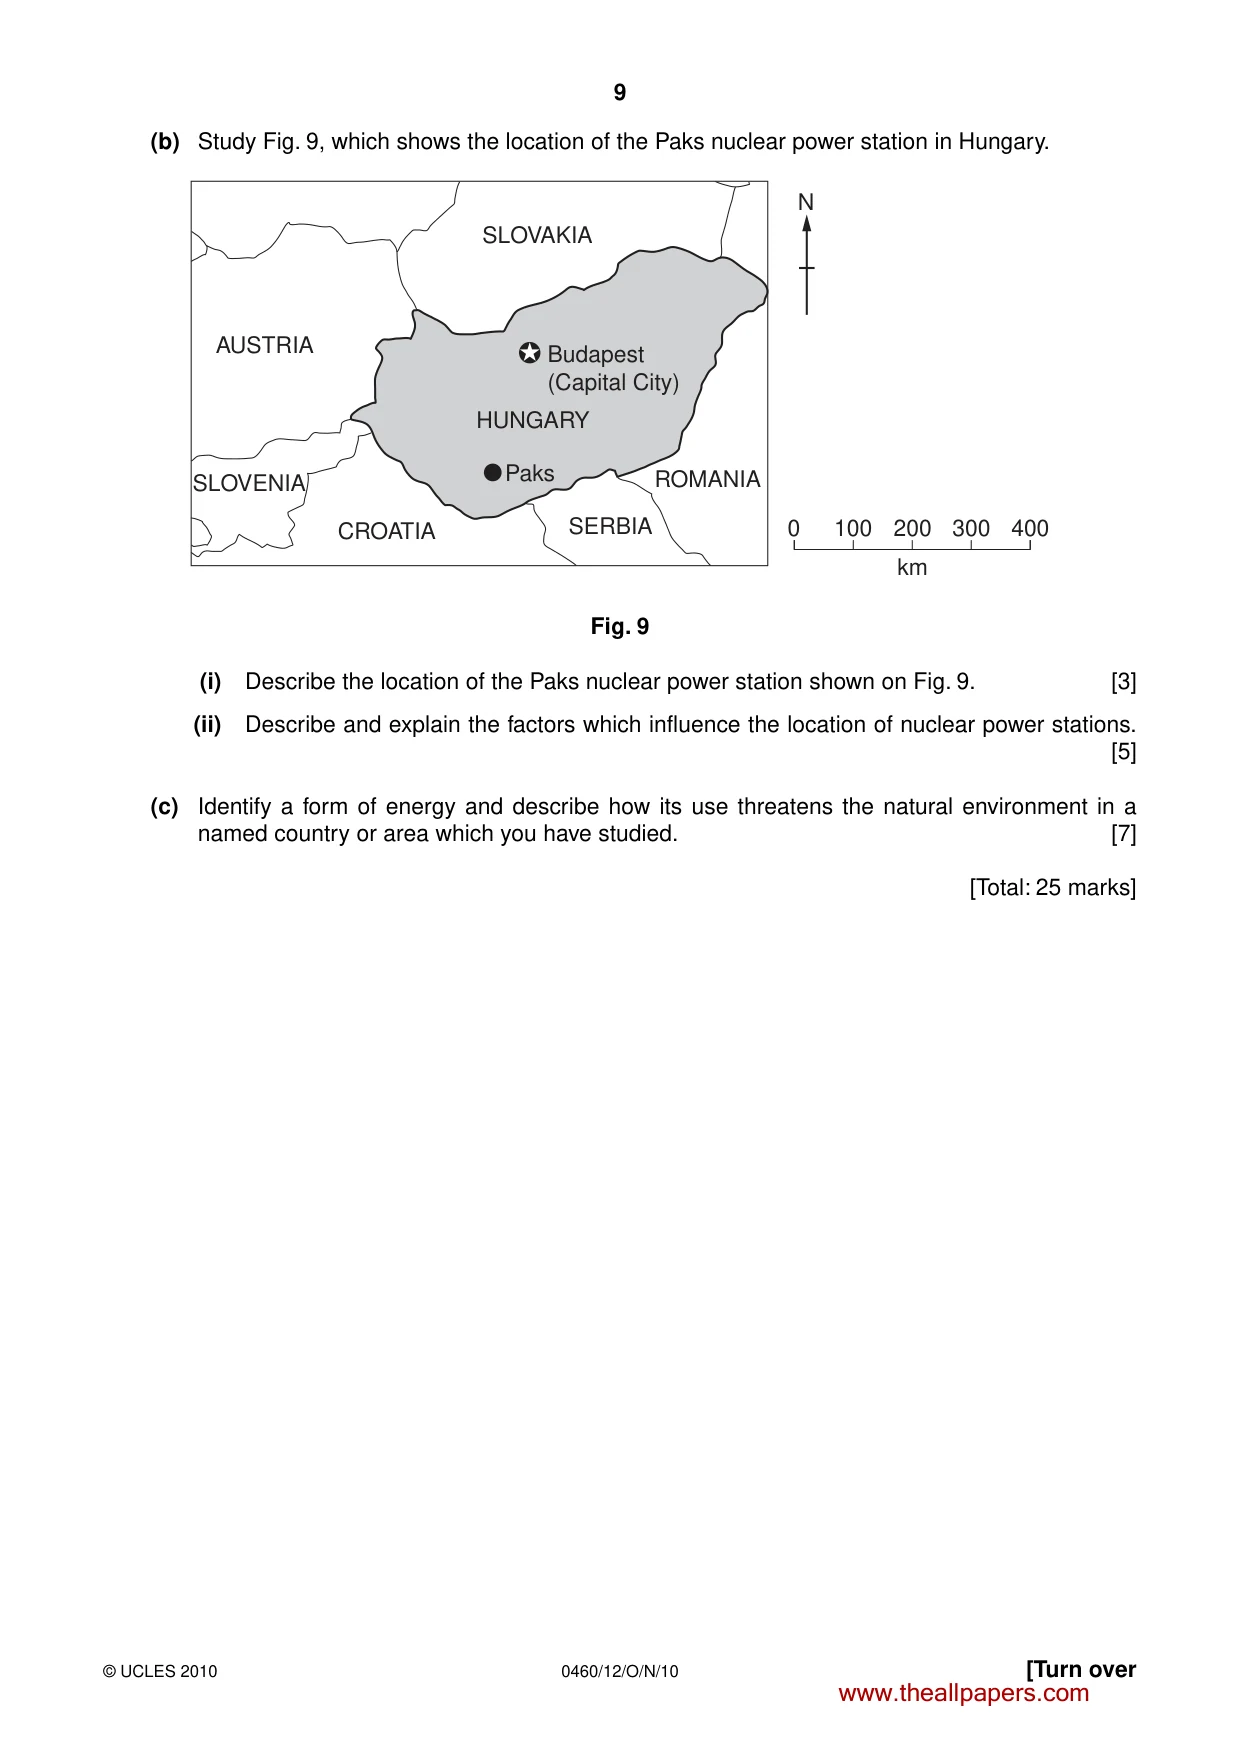
9 0460/12/O/N/10 © UCLES 2010 [Turn over (b) Study Fig. 9, which shows the location of the Paks nuclear power station in Hungary. HUNGARY Budapest (Capital City) Paks SERBIA ROMANIA SLOVAKIA AUSTRIA CROATIA SLOVENIA 0 100 200 km 300 400 N Fig. 9 (i) Describe the location of the Paks nuclear power station shown on Fig. 9. [3] (ii) Describe and explain the factors which influence the location of nuclear power stations. [5] (c) Identify a form of energy and describe how its use threatens the natural environment in a named country or area which you have studied. [7] [Total: 25 marks] www.theallpapers.com
Question paper, page 10
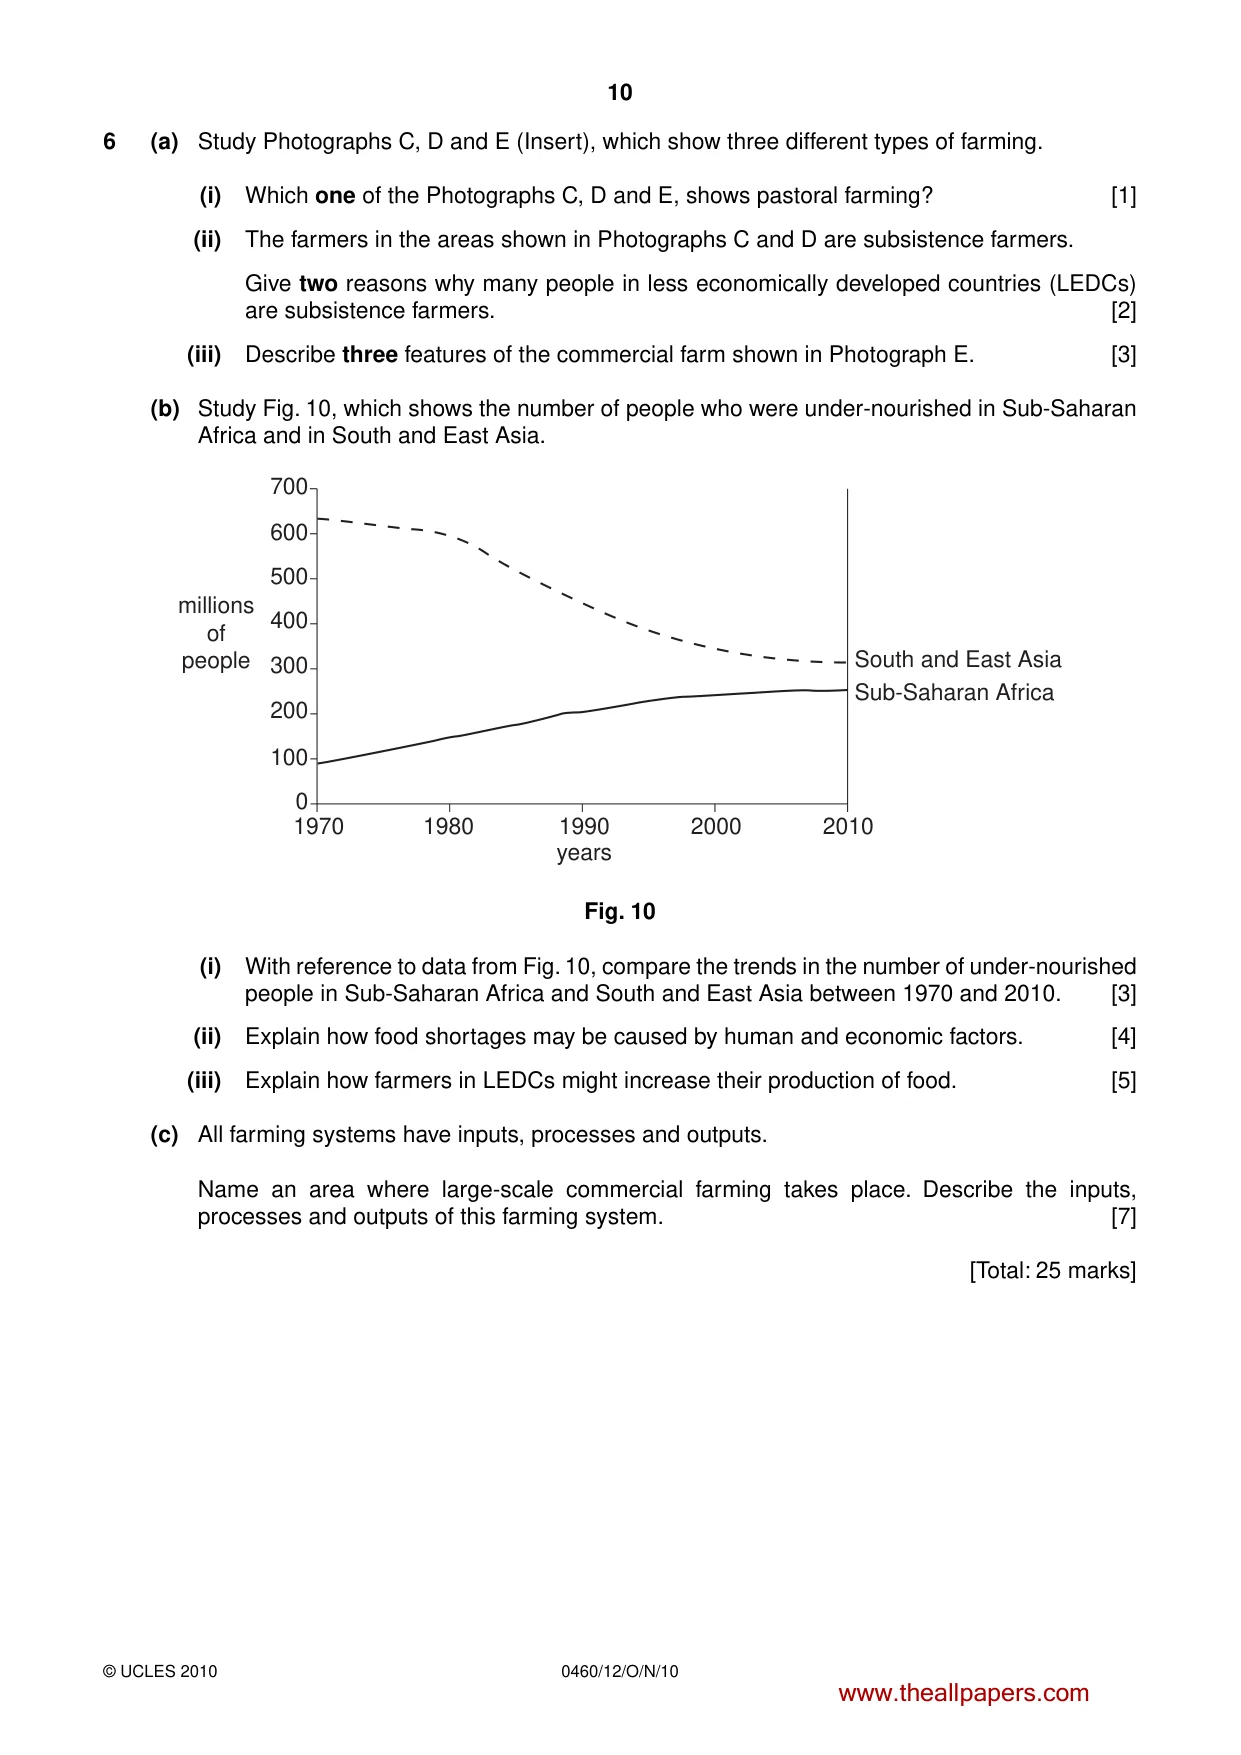
10 0460/12/O/N/10 © UCLES 2010 6 (a) Study Photographs C, D and E (Insert), which show three different types of farming. (i) Which one of the Photographs C, D and E, shows pastoral farming? [1] (ii) The farmers in the areas shown in Photographs C and D are subsistence farmers. Give two reasons why many people in less economically developed countries (LEDCs) are subsistence farmers. [2] (iii) Describe three features of the commercial farm shown in Photograph E. [3] (b) Study Fig. 10, which shows the number of people who were under-nourished in Sub-Saharan Africa and in South and East Asia. 1970 0 100 200 300 400 millions of people 500 600 700 1980 1990 years 2000 2010 South and East Asia Sub-Saharan Africa Fig. 10 (i) With reference to data from Fig. 10, compare the trends in the number of under-nourished people in Sub-Saharan Africa and South and East Asia between 1970 and 2010. [3] (ii) Explain how food shortages may be caused by human and economic factors. [4] (iii) Explain how farmers in LEDCs might increase their production of food. [5] (c) All farming systems have inputs, processes and outputs. Name an area where large-scale commercial farming takes place. Describe the inputs, processes and outputs of this farming system. [7] [Total: 25 marks] www.theallpapers.com
Question paper, page 11
11 0460/12/O/N/10 © UCLES 2010 BLANK PAGE www.theallpapers.com
Question paper, page 12
12 0460/12/O/N/10 © UCLES 2010 Copyright Acknowledgements: Question 1 Fig. 2 Adapted from: http://news.bbc.co.uk/1/hi/uk_politics/5273356.stm http://www.guardian.co.uk/uk/2005/mar/09/immigration.immigrationandpublicservices Question 4 Fig. 7 http://www.sin.org.uk/geography/Livingdesert.htm Question 4 Photographs A and B S. Sibley © UCLES Question 5 Fig. 9 http://insp.pnl.gov/inspmedia/Pocketbook2001/mapHungary.gif Question 6 Photographs C, D and E S. Sibley © UCLES Permission to reproduce items where third-party owned material protected by copyright is included has been sought and cleared where possible. Every reasonable effort has been made by the publisher (UCLES) to trace copyright holders, but if any items requiring clearance have unwittingly been included, the publisher will be pleased to make amends at the earliest possible opportunity. University of Cambridge International Examinations is part of the Cambridge Assessment Group. Cambridge Assessment is the brand name of University of Cambridge Local Examinations Syndicate (UCLES), which is itself a department of the University of Cambridge. www.theallpapers.com
Mark scheme, page 1
UNIVERSITY OF CAMBRIDGE INTERNATIONAL EXAMINATIONS International General Certificate of Secondary Education MARK SCHEME for the October/November 2010 question paper for the guidance of teachers 0460 GEOGRAPHY 0460/12 Paper 1, maximum raw mark 75 This mark scheme is published as an aid to teachers and candidates, to indicate the requirements of the examination. It shows the basis on which Examiners were instructed to award marks. It does not indicate the details of the discussions that took place at an Examiners’ meeting before marking began, which would have considered the acceptability of alternative answers. Mark schemes must be read in conjunction with the question papers and the report on the examination. • CIE will not enter into discussions or correspondence in connection with these mark schemes. CIE is publishing the mark schemes for the October/November 2010 question papers for most IGCSE, GCE Advanced Level and Advanced Subsidiary Level syllabuses and some Ordinary Level syllabuses. www.theallpapers.com
Mark scheme, page 2
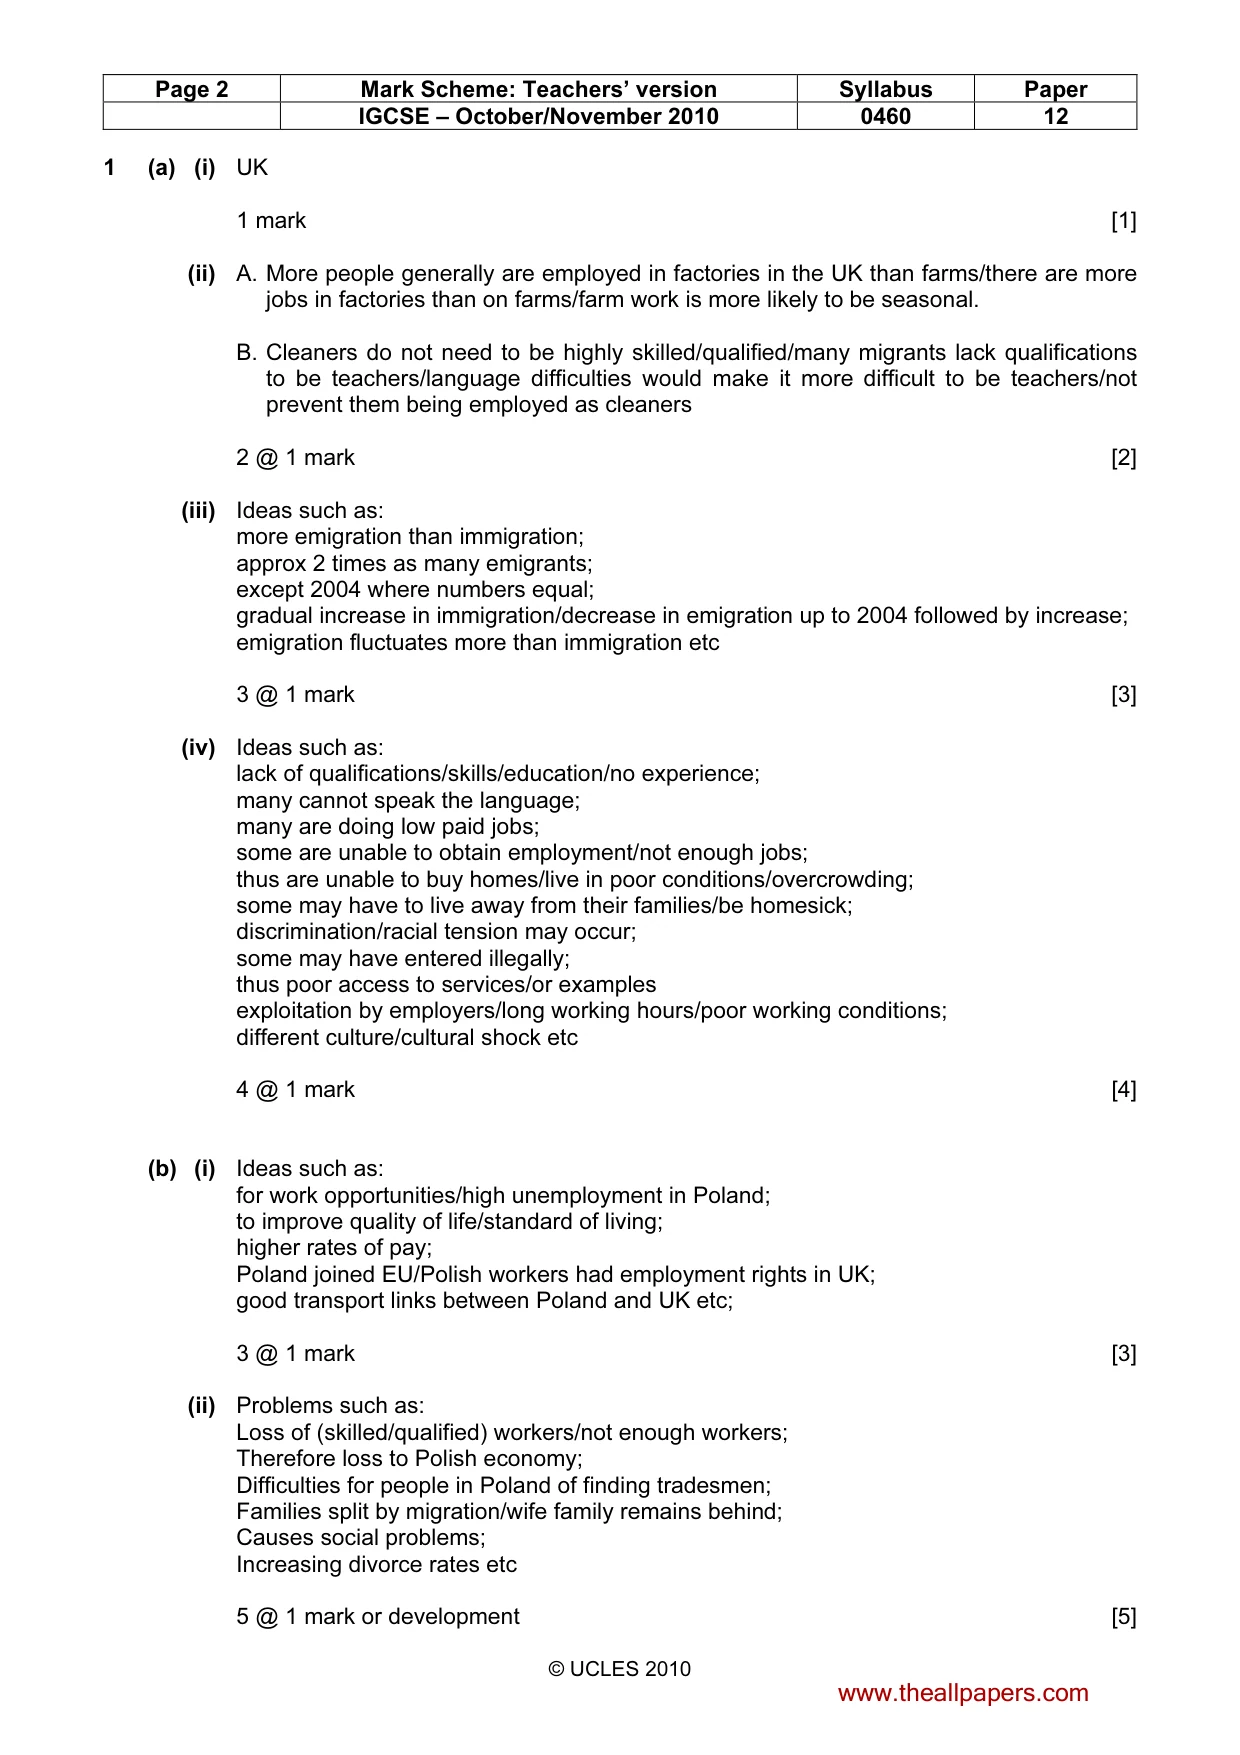
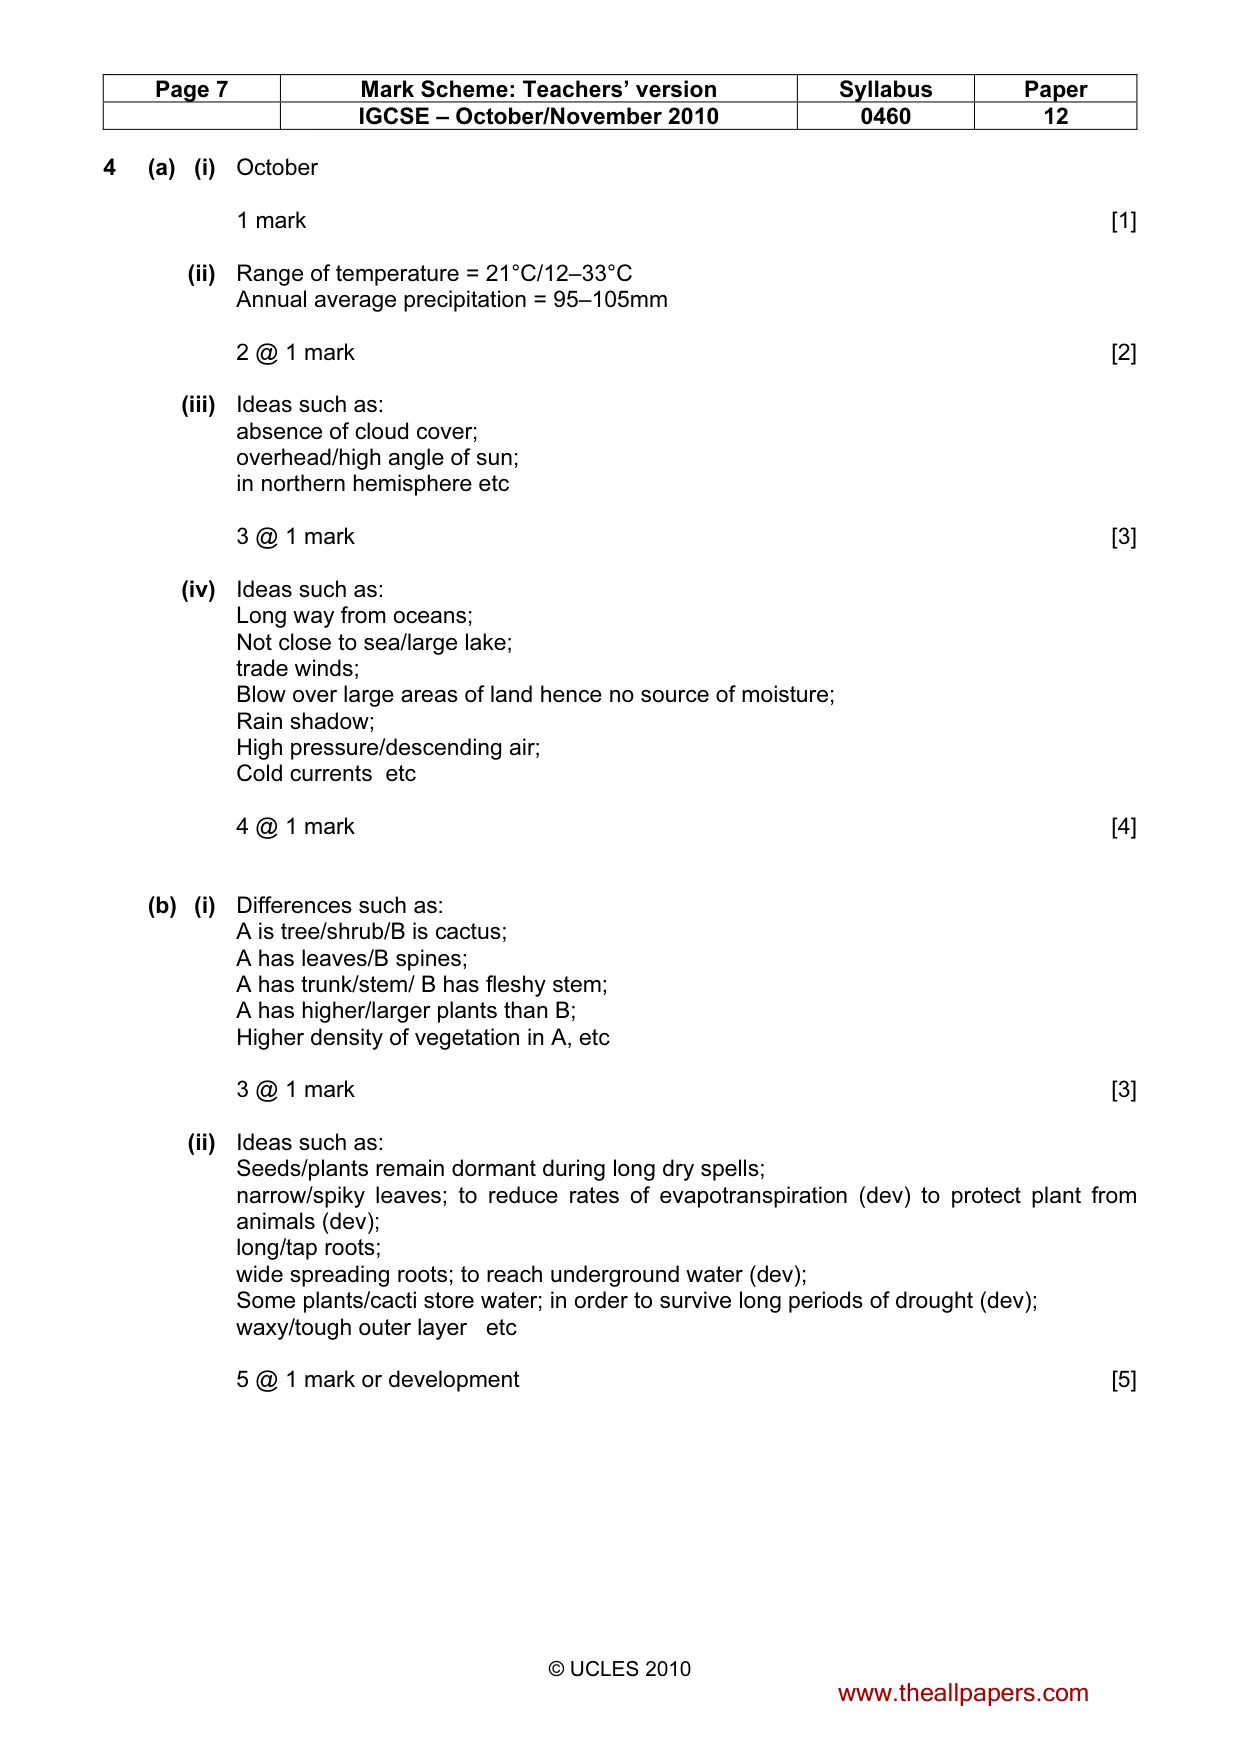
Page 2 Mark Scheme: Teachers’ version Syllabus Paper IGCSE – October/November 2010 0460 12 © UCLES 2010 1 (a) (i) UK 1 mark [1] (ii) A. More people generally are employed in factories in the UK than farms/there are more jobs in factories than on farms/farm work is more likely to be seasonal. B. Cleaners do not need to be highly skilled/qualified/many migrants lack qualifications to be teachers/language difficulties would make it more difficult to be teachers/not prevent them being employed as cleaners 2 @ 1 mark [2] (iii) Ideas such as: more emigration than immigration; approx 2 times as many emigrants; except 2004 where numbers equal; gradual increase in immigration/decrease in emigration up to 2004 followed by increase; emigration fluctuates more than immigration etc 3 @ 1 mark [3] (iv) Ideas such as: lack of qualifications/skills/education/no experience; many cannot speak the language; many are doing low paid jobs; some are unable to obtain employment/not enough jobs; thus are unable to buy homes/live in poor conditions/overcrowding; some may have to live away from their families/be homesick; discrimination/racial tension may occur; some may have entered illegally; thus poor access to services/or examples exploitation by employers/long working hours/poor working conditions; different culture/cultural shock etc 4 @ 1 mark [4] (b) (i) Ideas such as: for work opportunities/high unemployment in Poland; to improve quality of life/standard of living; higher rates of pay; Poland joined EU/Polish workers had employment rights in UK; good transport links between Poland and UK etc; 3 @ 1 mark [3] (ii) Problems such as: Loss of (skilled/qualified) workers/not enough workers; Therefore loss to Polish economy; Difficulties for people in Poland of finding tradesmen; Families split by migration/wife family remains behind; Causes social problems; Increasing divorce rates etc 5 @ 1 mark or development [5] www.theallpapers.com
Mark scheme, page 3
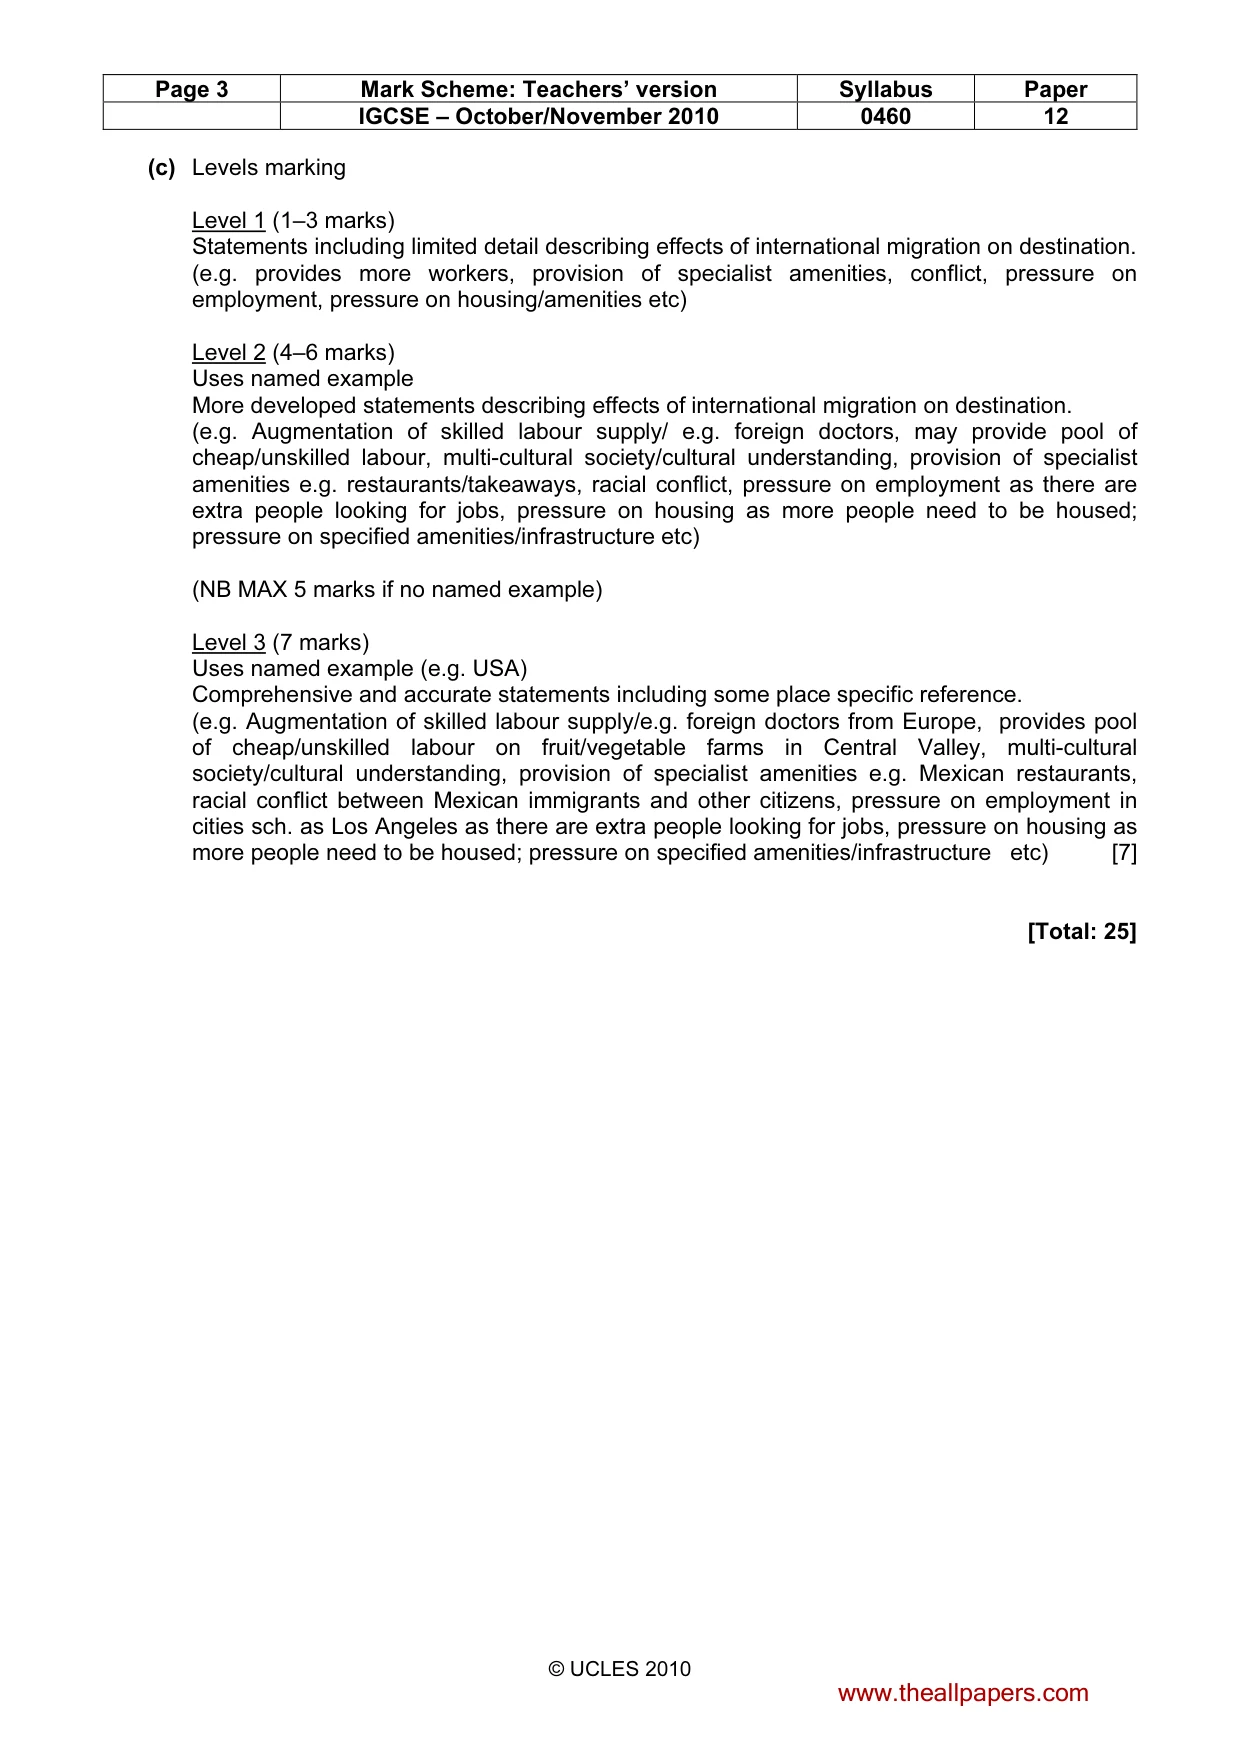
Page 3 Mark Scheme: Teachers’ version Syllabus Paper IGCSE – October/November 2010 0460 12 © UCLES 2010 (c) Levels marking Level 1 (1–3 marks) Statements including limited detail describing effects of international migration on destination. (e.g. provides more workers, provision of specialist amenities, conflict, pressure on employment, pressure on housing/amenities etc) Level 2 (4–6 marks) Uses named example More developed statements describing effects of international migration on destination. (e.g. Augmentation of skilled labour supply/ e.g. foreign doctors, may provide pool of cheap/unskilled labour, multi-cultural society/cultural understanding, provision of specialist amenities e.g. restaurants/takeaways, racial conflict, pressure on employment as there are extra people looking for jobs, pressure on housing as more people need to be housed; pressure on specified amenities/infrastructure etc) (NB MAX 5 marks if no named example) Level 3 (7 marks) Uses named example (e.g. USA) Comprehensive and accurate statements including some place specific reference. (e.g. Augmentation of skilled labour supply/e.g. foreign doctors from Europe, provides pool of cheap/unskilled labour on fruit/vegetable farms in Central Valley, multi-cultural society/cultural understanding, provision of specialist amenities e.g. Mexican restaurants, racial conflict between Mexican immigrants and other citizens, pressure on employment in cities sch. as Los Angeles as there are extra people looking for jobs, pressure on housing as more people need to be housed; pressure on specified amenities/infrastructure etc) [7] [Total: 25] www.theallpapers.com
Mark scheme, page 4
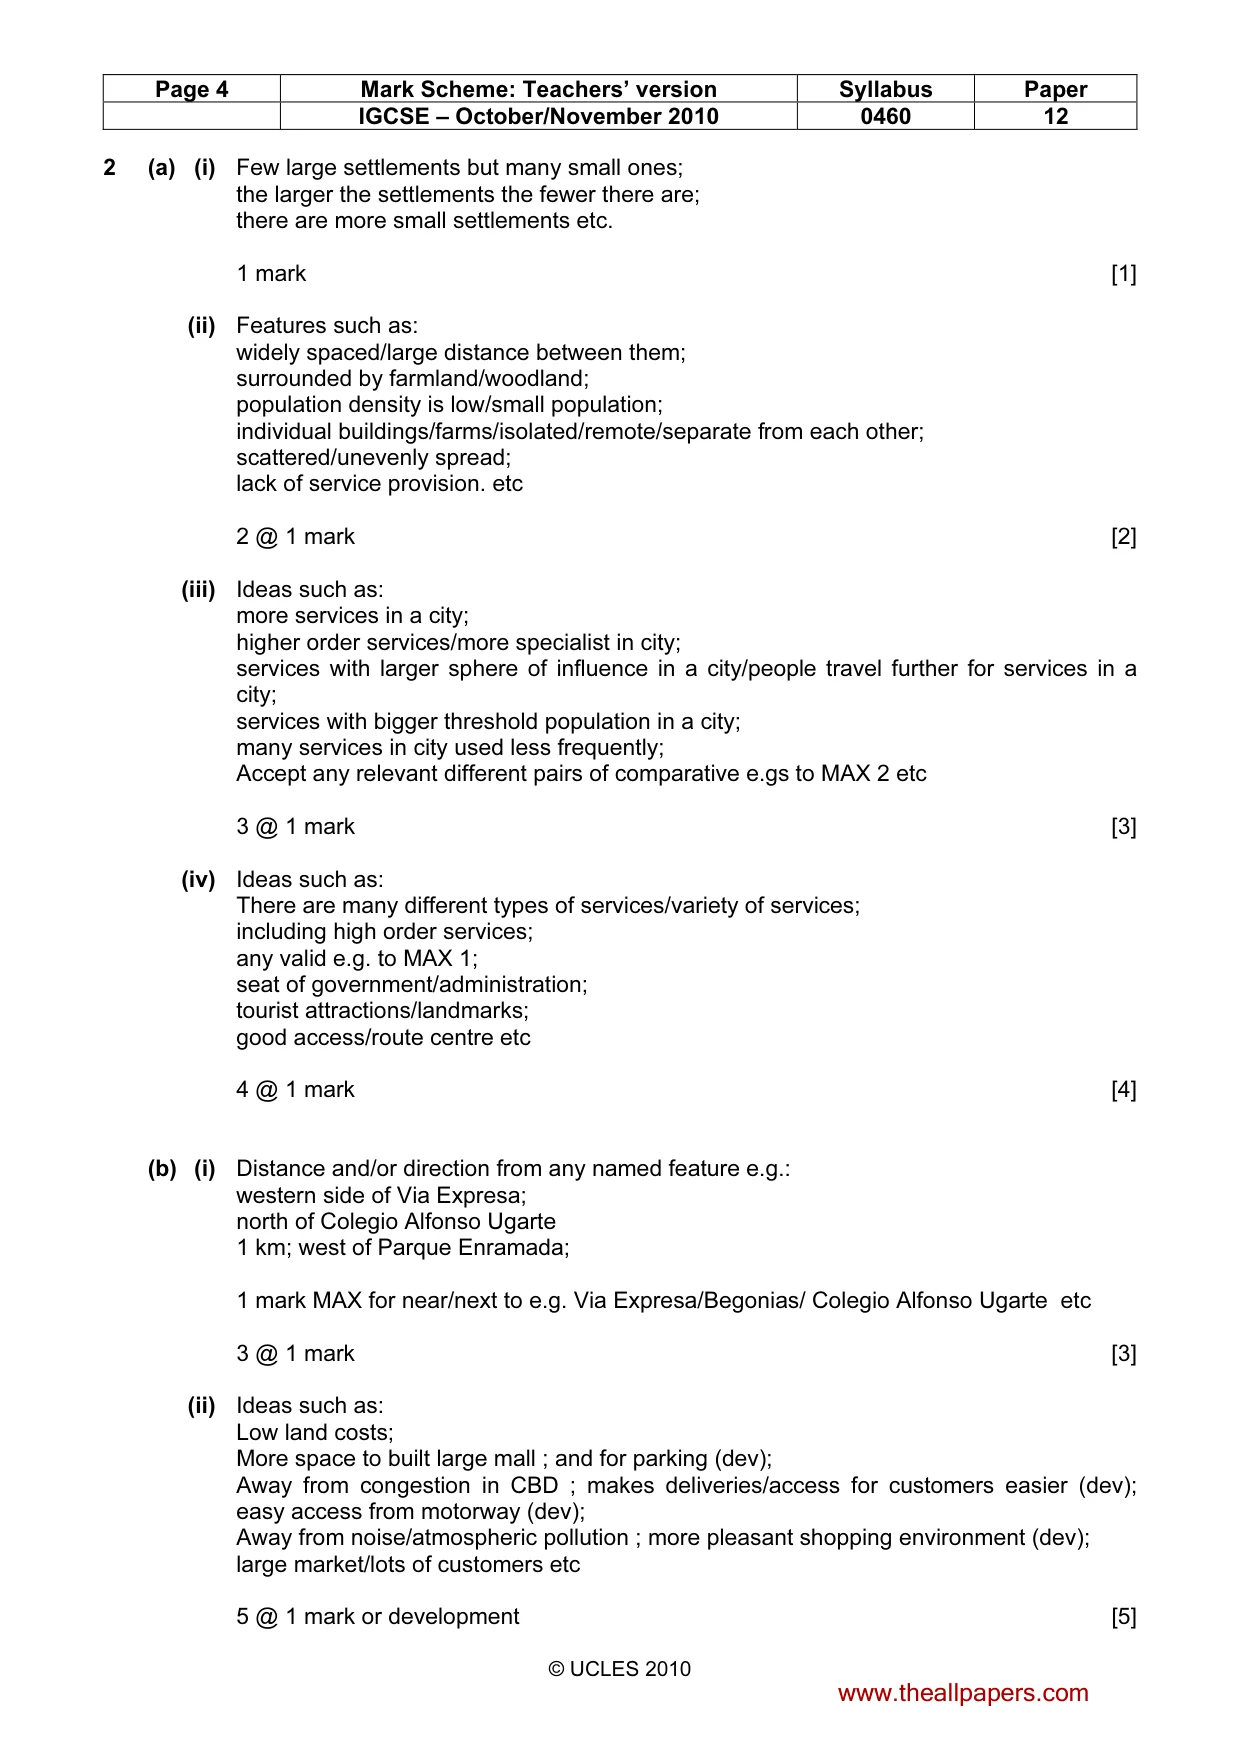
Page 4 Mark Scheme: Teachers’ version Syllabus Paper IGCSE – October/November 2010 0460 12 © UCLES 2010 2 (a) (i) Few large settlements but many small ones; the larger the settlements the fewer there are; there are more small settlements etc. 1 mark [1] (ii) Features such as: widely spaced/large distance between them; surrounded by farmland/woodland; population density is low/small population; individual buildings/farms/isolated/remote/separate from each other; scattered/unevenly spread; lack of service provision. etc 2 @ 1 mark [2] (iii) Ideas such as: more services in a city; higher order services/more specialist in city; services with larger sphere of influence in a city/people travel further for services in a city; services with bigger threshold population in a city; many services in city used less frequently; Accept any relevant different pairs of comparative e.gs to MAX 2 etc 3 @ 1 mark [3] (iv) Ideas such as: There are many different types of services/variety of services; including high order services; any valid e.g. to MAX 1; seat of government/administration; tourist attractions/landmarks; good access/route centre etc 4 @ 1 mark [4] (b) (i) Distance and/or direction from any named feature e.g.: western side of Via Expresa; north of Colegio Alfonso Ugarte 1 km; west of Parque Enramada; 1 mark MAX for near/next to e.g. Via Expresa/Begonias/ Colegio Alfonso Ugarte etc 3 @ 1 mark [3] (ii) Ideas such as: Low land costs; More space to built large mall ; and for parking (dev); Away from congestion in CBD ; makes deliveries/access for customers easier (dev); easy access from motorway (dev); Away from noise/atmospheric pollution ; more pleasant shopping environment (dev); large market/lots of customers etc 5 @ 1 mark or development [5] www.theallpapers.com
Mark scheme, page 5
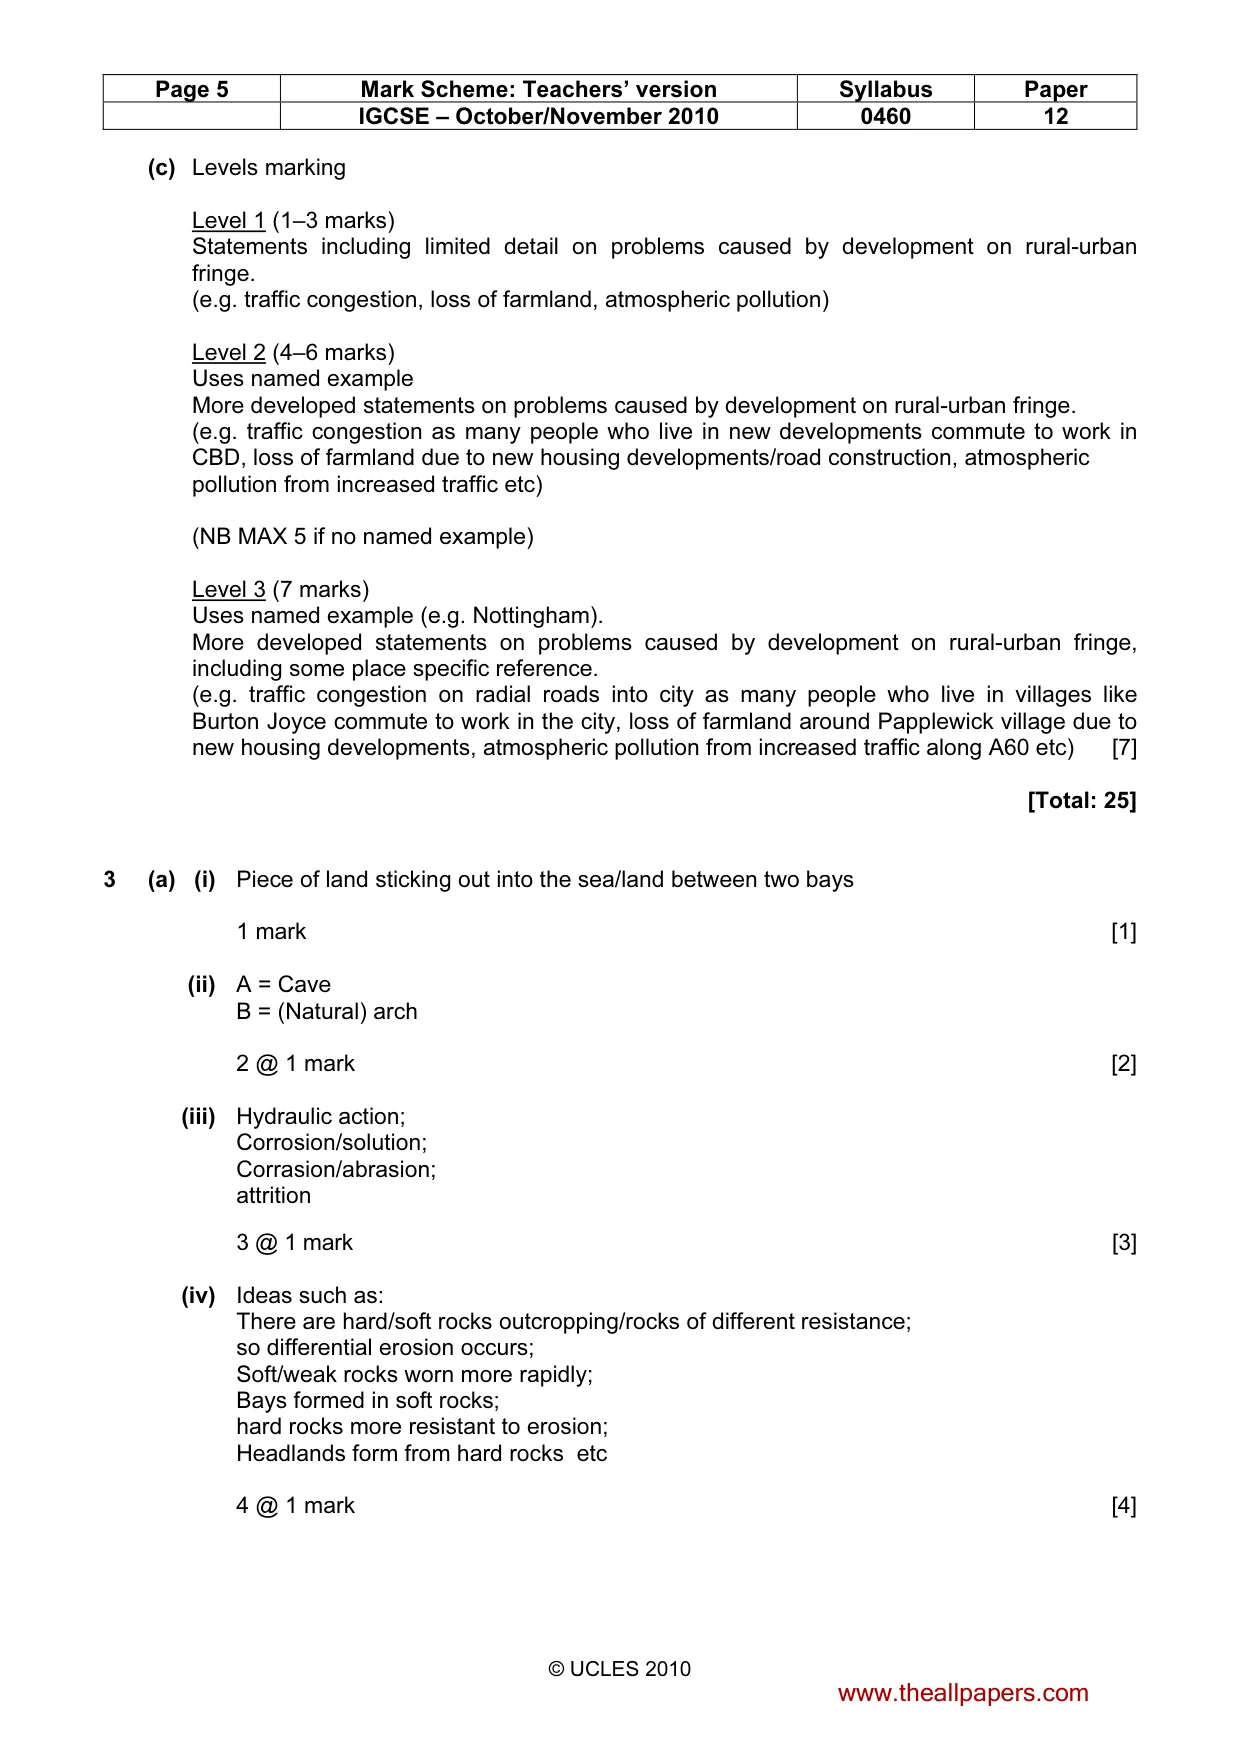
Page 5 Mark Scheme: Teachers’ version Syllabus Paper IGCSE – October/November 2010 0460 12 © UCLES 2010 (c) Levels marking Level 1 (1–3 marks) Statements including limited detail on problems caused by development on rural-urban fringe. (e.g. traffic congestion, loss of farmland, atmospheric pollution) Level 2 (4–6 marks) Uses named example More developed statements on problems caused by development on rural-urban fringe. (e.g. traffic congestion as many people who live in new developments commute to work in CBD, loss of farmland due to new housing developments/road construction, atmospheric pollution from increased traffic etc) (NB MAX 5 if no named example) Level 3 (7 marks) Uses named example (e.g. Nottingham). More developed statements on problems caused by development on rural-urban fringe, including some place specific reference. (e.g. traffic congestion on radial roads into city as many people who live in villages like Burton Joyce commute to work in the city, loss of farmland around Papplewick village due to new housing developments, atmospheric pollution from increased traffic along A60 etc) [7] [Total: 25] 3 (a) (i) Piece of land sticking out into the sea/land between two bays 1 mark [1] (ii) A = Cave B = (Natural) arch 2 @ 1 mark [2] (iii) Hydraulic action; Corrosion/solution; Corrasion/abrasion; attrition 3 @ 1 mark [3] (iv) Ideas such as: There are hard/soft rocks outcropping/rocks of different resistance; so differential erosion occurs; Soft/weak rocks worn more rapidly; Bays formed in soft rocks; hard rocks more resistant to erosion; Headlands form from hard rocks etc 4 @ 1 mark [4] www.theallpapers.com
Mark scheme, page 6
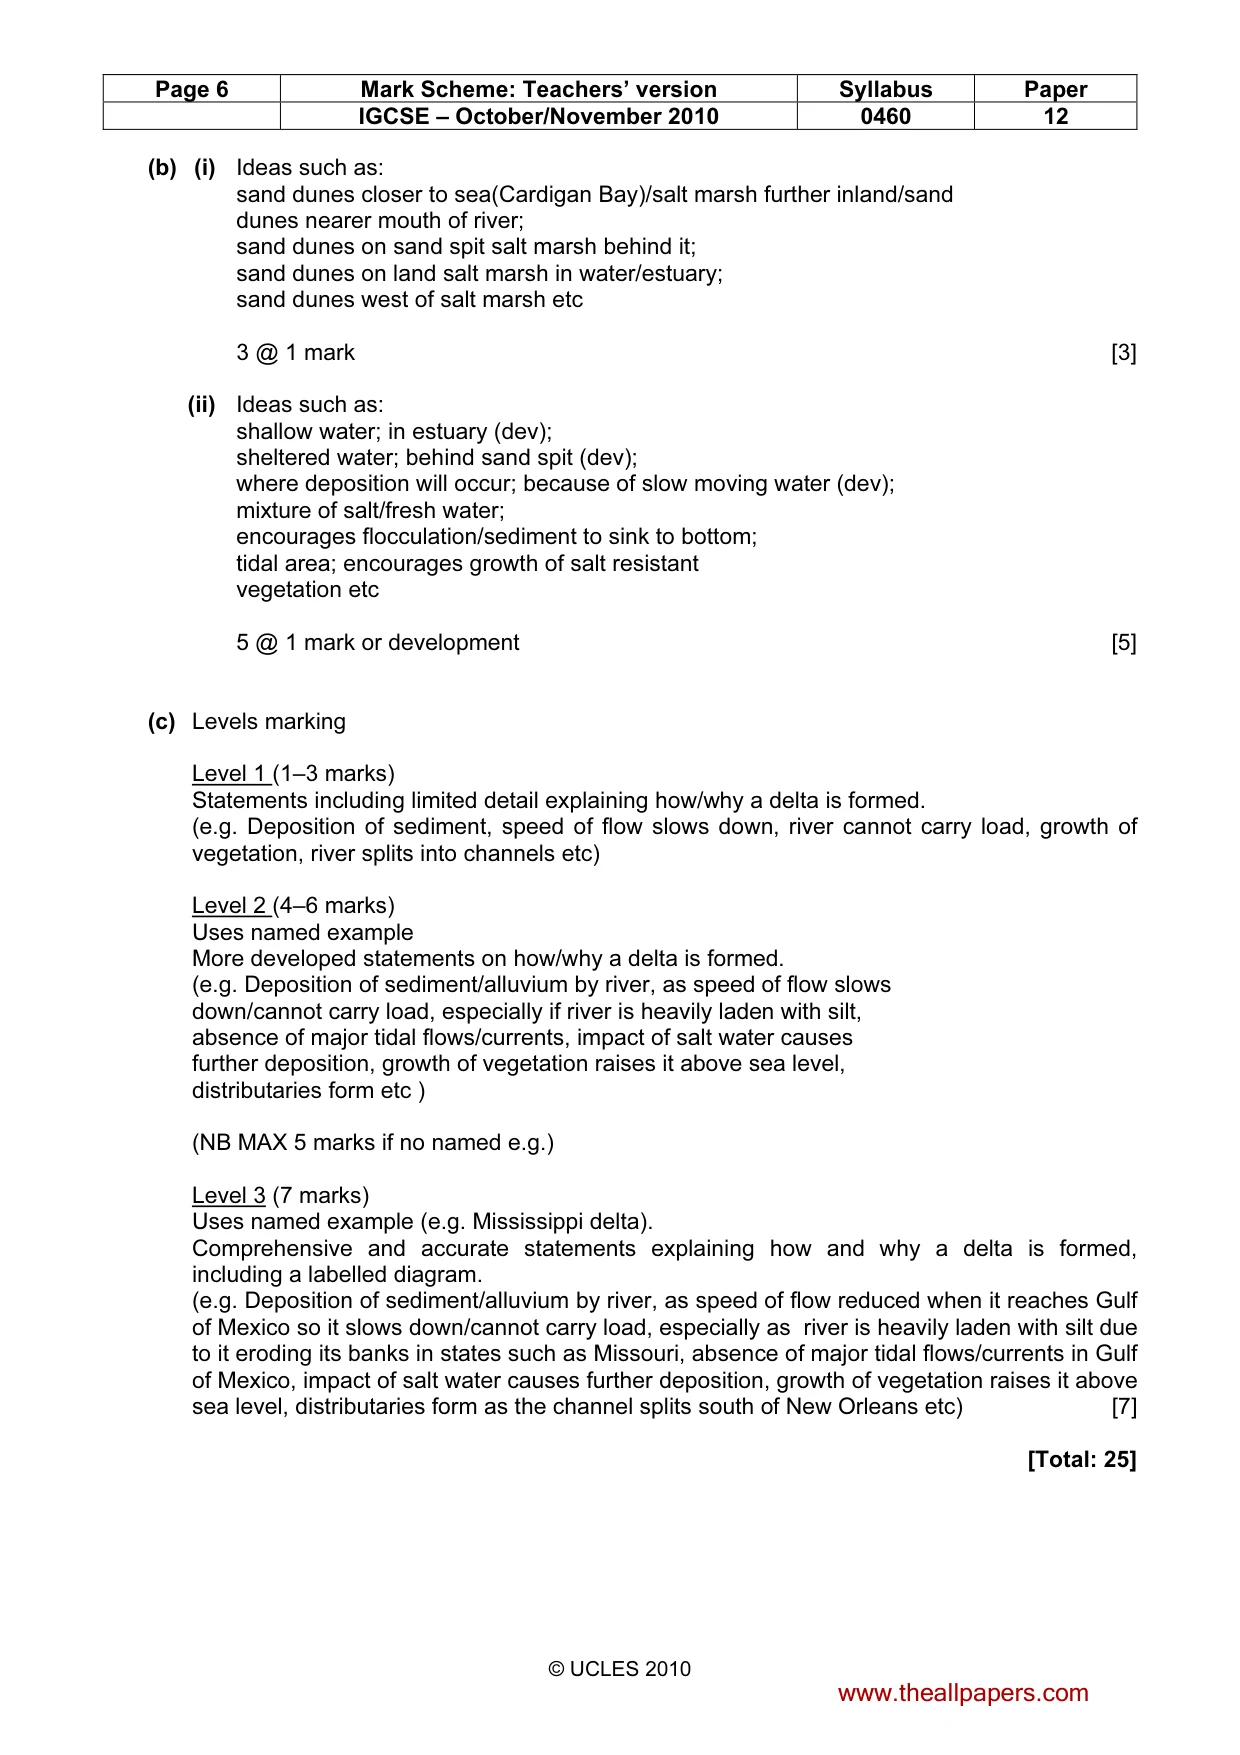
Page 6 Mark Scheme: Teachers’ version Syllabus Paper IGCSE – October/November 2010 0460 12 © UCLES 2010 (b) (i) Ideas such as: sand dunes closer to sea(Cardigan Bay)/salt marsh further inland/sand dunes nearer mouth of river; sand dunes on sand spit salt marsh behind it; sand dunes on land salt marsh in water/estuary; sand dunes west of salt marsh etc 3 @ 1 mark [3] (ii) Ideas such as: shallow water; in estuary (dev); sheltered water; behind sand spit (dev); where deposition will occur; because of slow moving water (dev); mixture of salt/fresh water; encourages flocculation/sediment to sink to bottom; tidal area; encourages growth of salt resistant vegetation etc 5 @ 1 mark or development [5] (c) Levels marking Level 1 (1–3 marks) Statements including limited detail explaining how/why a delta is formed. (e.g. Deposition of sediment, speed of flow slows down, river cannot carry load, growth of vegetation, river splits into channels etc) Level 2 (4–6 marks) Uses named example More developed statements on how/why a delta is formed. (e.g. Deposition of sediment/alluvium by river, as speed of flow slows down/cannot carry load, especially if river is heavily laden with silt, absence of major tidal flows/currents, impact of salt water causes further deposition, growth of vegetation raises it above sea level, distributaries form etc ) (NB MAX 5 marks if no named e.g.) Level 3 (7 marks) Uses named example (e.g. Mississippi delta). Comprehensive and accurate statements explaining how and why a delta is formed, including a labelled diagram. (e.g. Deposition of sediment/alluvium by river, as speed of flow reduced when it reaches Gulf of Mexico so it slows down/cannot carry load, especially as river is heavily laden with silt due to it eroding its banks in states such as Missouri, absence of major tidal flows/currents in Gulf of Mexico, impact of salt water causes further deposition, growth of vegetation raises it above sea level, distributaries form as the channel splits south of New Orleans etc) [7] [Total: 25] www.theallpapers.com
Mark scheme, page 7
Page 7 Mark Scheme: Teachers’ version Syllabus Paper IGCSE – October/November 2010 0460 12 © UCLES 2010 4 (a) (i) October 1 mark [1] (ii) Range of temperature = 21°C/12–33°C Annual average precipitation = 95–105mm 2 @ 1 mark [2] (iii) Ideas such as: absence of cloud cover; overhead/high angle of sun; in northern hemisphere etc 3 @ 1 mark [3] (iv) Ideas such as: Long way from oceans; Not close to sea/large lake; trade winds; Blow over large areas of land hence no source of moisture; Rain shadow; High pressure/descending air; Cold currents etc 4 @ 1 mark [4] (b) (i) Differences such as: A is tree/shrub/B is cactus; A has leaves/B spines; A has trunk/stem/ B has fleshy stem; A has higher/larger plants than B; Higher density of vegetation in A, etc 3 @ 1 mark [3] (ii) Ideas such as: Seeds/plants remain dormant during long dry spells; narrow/spiky leaves; to reduce rates of evapotranspiration (dev) to protect plant from animals (dev); long/tap roots; wide spreading roots; to reach underground water (dev); Some plants/cacti store water; in order to survive long periods of drought (dev); waxy/tough outer layer etc 5 @ 1 mark or development [5] www.theallpapers.com
Mark scheme, page 8
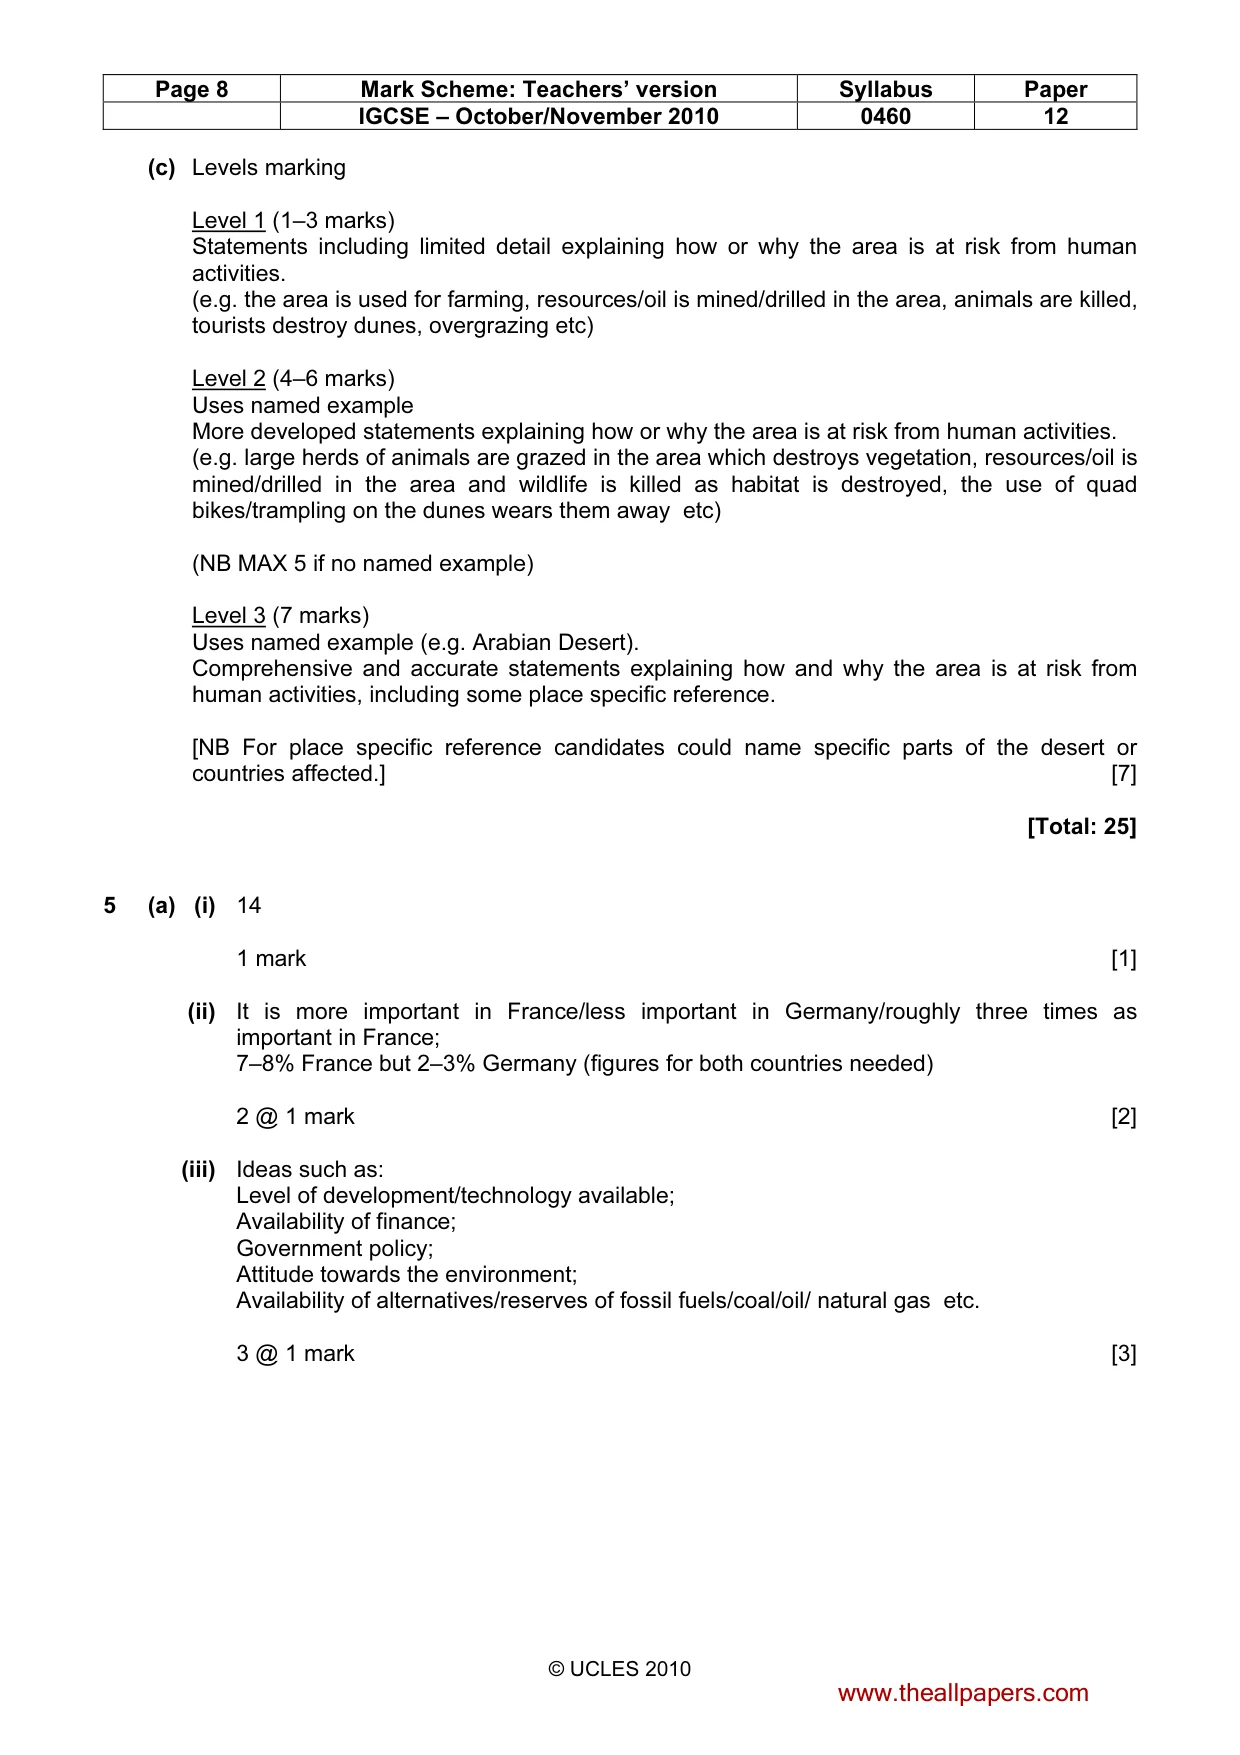
Page 8 Mark Scheme: Teachers’ version Syllabus Paper IGCSE – October/November 2010 0460 12 © UCLES 2010 (c) Levels marking Level 1 (1–3 marks) Statements including limited detail explaining how or why the area is at risk from human activities. (e.g. the area is used for farming, resources/oil is mined/drilled in the area, animals are killed, tourists destroy dunes, overgrazing etc) Level 2 (4–6 marks) Uses named example More developed statements explaining how or why the area is at risk from human activities. (e.g. large herds of animals are grazed in the area which destroys vegetation, resources/oil is mined/drilled in the area and wildlife is killed as habitat is destroyed, the use of quad bikes/trampling on the dunes wears them away etc) (NB MAX 5 if no named example) Level 3 (7 marks) Uses named example (e.g. Arabian Desert). Comprehensive and accurate statements explaining how and why the area is at risk from human activities, including some place specific reference. [NB For place specific reference candidates could name specific parts of the desert or countries affected.] [7] [Total: 25] 5 (a) (i) 14 1 mark [1] (ii) It is more important in France/less important in Germany/roughly three times as important in France; 7–8% France but 2–3% Germany (figures for both countries needed) 2 @ 1 mark [2] (iii) Ideas such as: Level of development/technology available; Availability of finance; Government policy; Attitude towards the environment; Availability of alternatives/reserves of fossil fuels/coal/oil/ natural gas etc. 3 @ 1 mark [3] www.theallpapers.com
Mark scheme, page 9
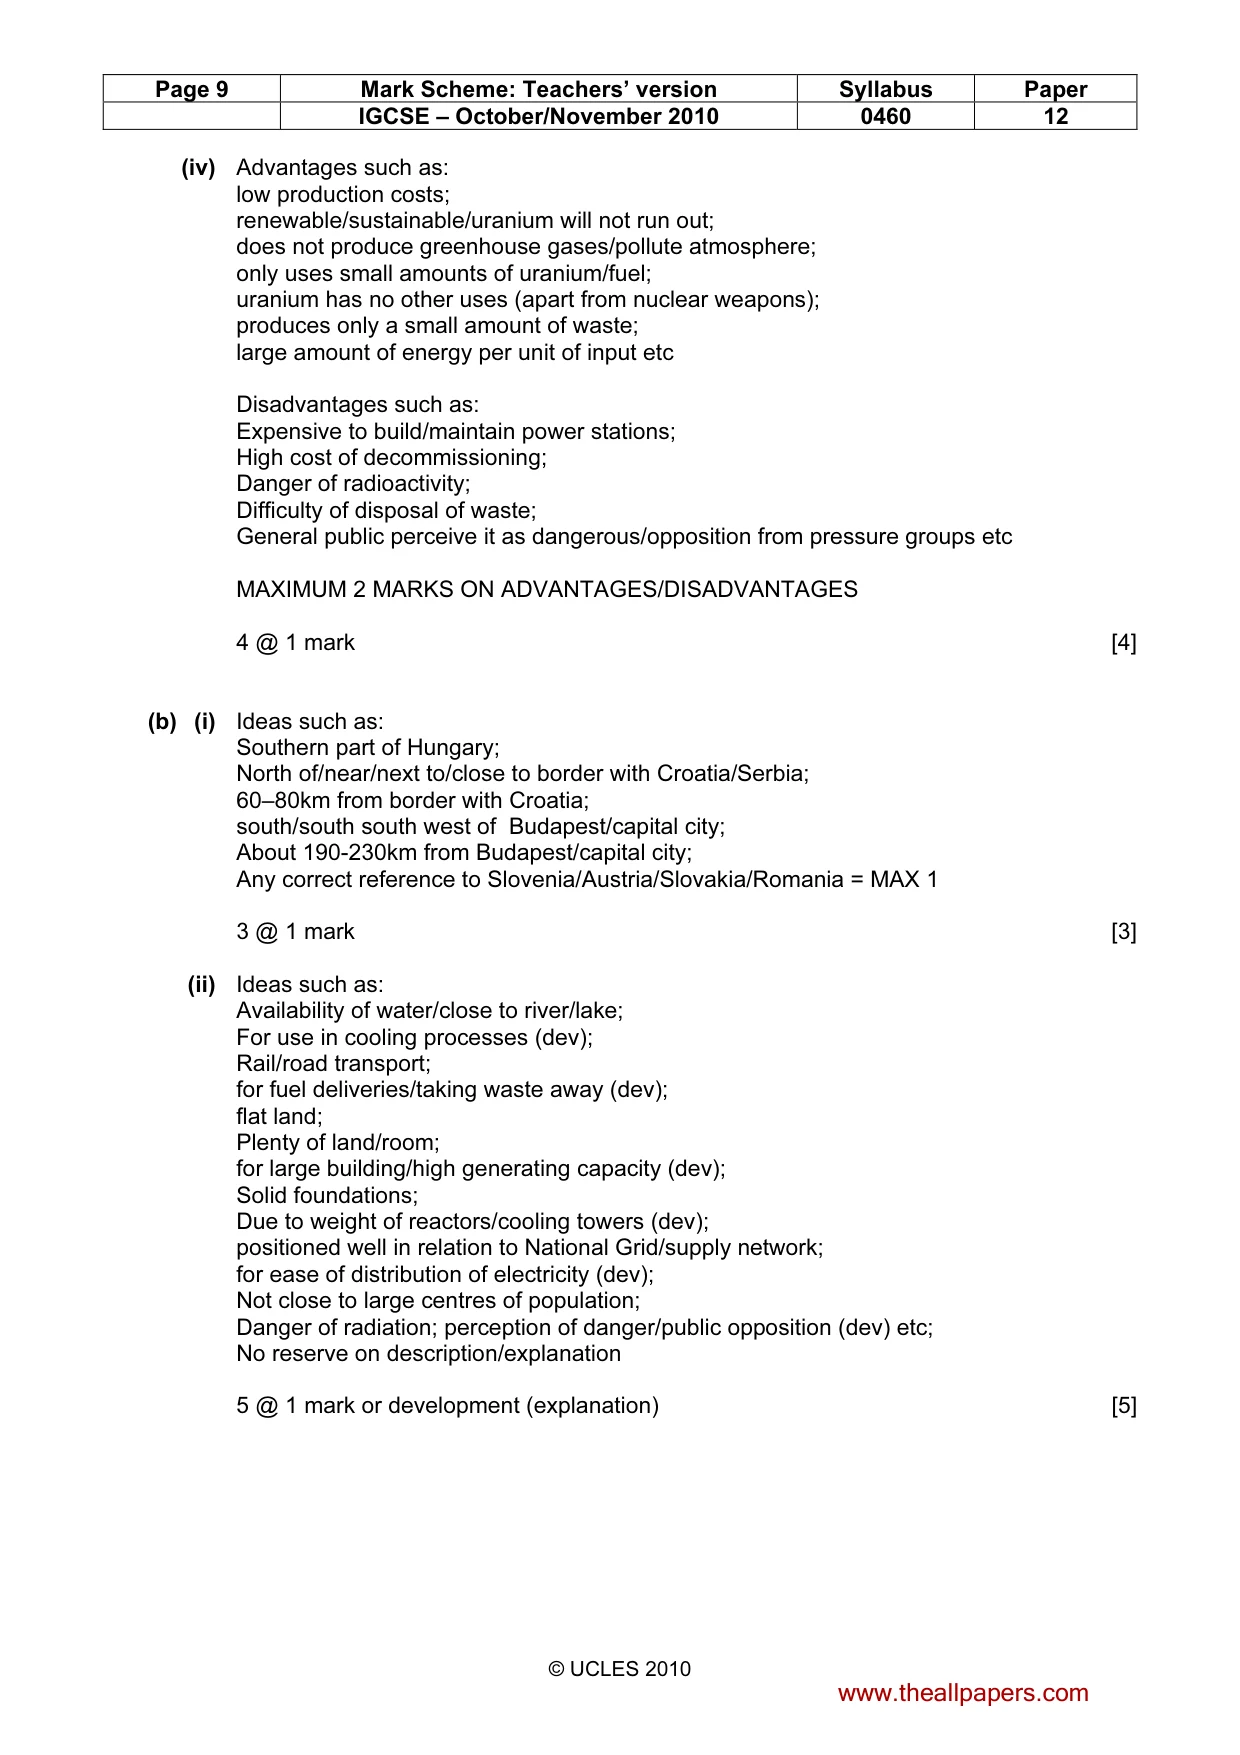
Page 9 Mark Scheme: Teachers’ version Syllabus Paper IGCSE – October/November 2010 0460 12 © UCLES 2010 (iv) Advantages such as: low production costs; renewable/sustainable/uranium will not run out; does not produce greenhouse gases/pollute atmosphere; only uses small amounts of uranium/fuel; uranium has no other uses (apart from nuclear weapons); produces only a small amount of waste; large amount of energy per unit of input etc Disadvantages such as: Expensive to build/maintain power stations; High cost of decommissioning; Danger of radioactivity; Difficulty of disposal of waste; General public perceive it as dangerous/opposition from pressure groups etc MAXIMUM 2 MARKS ON ADVANTAGES/DISADVANTAGES 4 @ 1 mark [4] (b) (i) Ideas such as: Southern part of Hungary; North of/near/next to/close to border with Croatia/Serbia; 60–80km from border with Croatia; south/south south west of Budapest/capital city; About 190-230km from Budapest/capital city; Any correct reference to Slovenia/Austria/Slovakia/Romania = MAX 1 3 @ 1 mark [3] (ii) Ideas such as: Availability of water/close to river/lake; For use in cooling processes (dev); Rail/road transport; for fuel deliveries/taking waste away (dev); flat land; Plenty of land/room; for large building/high generating capacity (dev); Solid foundations; Due to weight of reactors/cooling towers (dev); positioned well in relation to National Grid/supply network; for ease of distribution of electricity (dev); Not close to large centres of population; Danger of radiation; perception of danger/public opposition (dev) etc; No reserve on description/explanation 5 @ 1 mark or development (explanation) [5] www.theallpapers.com
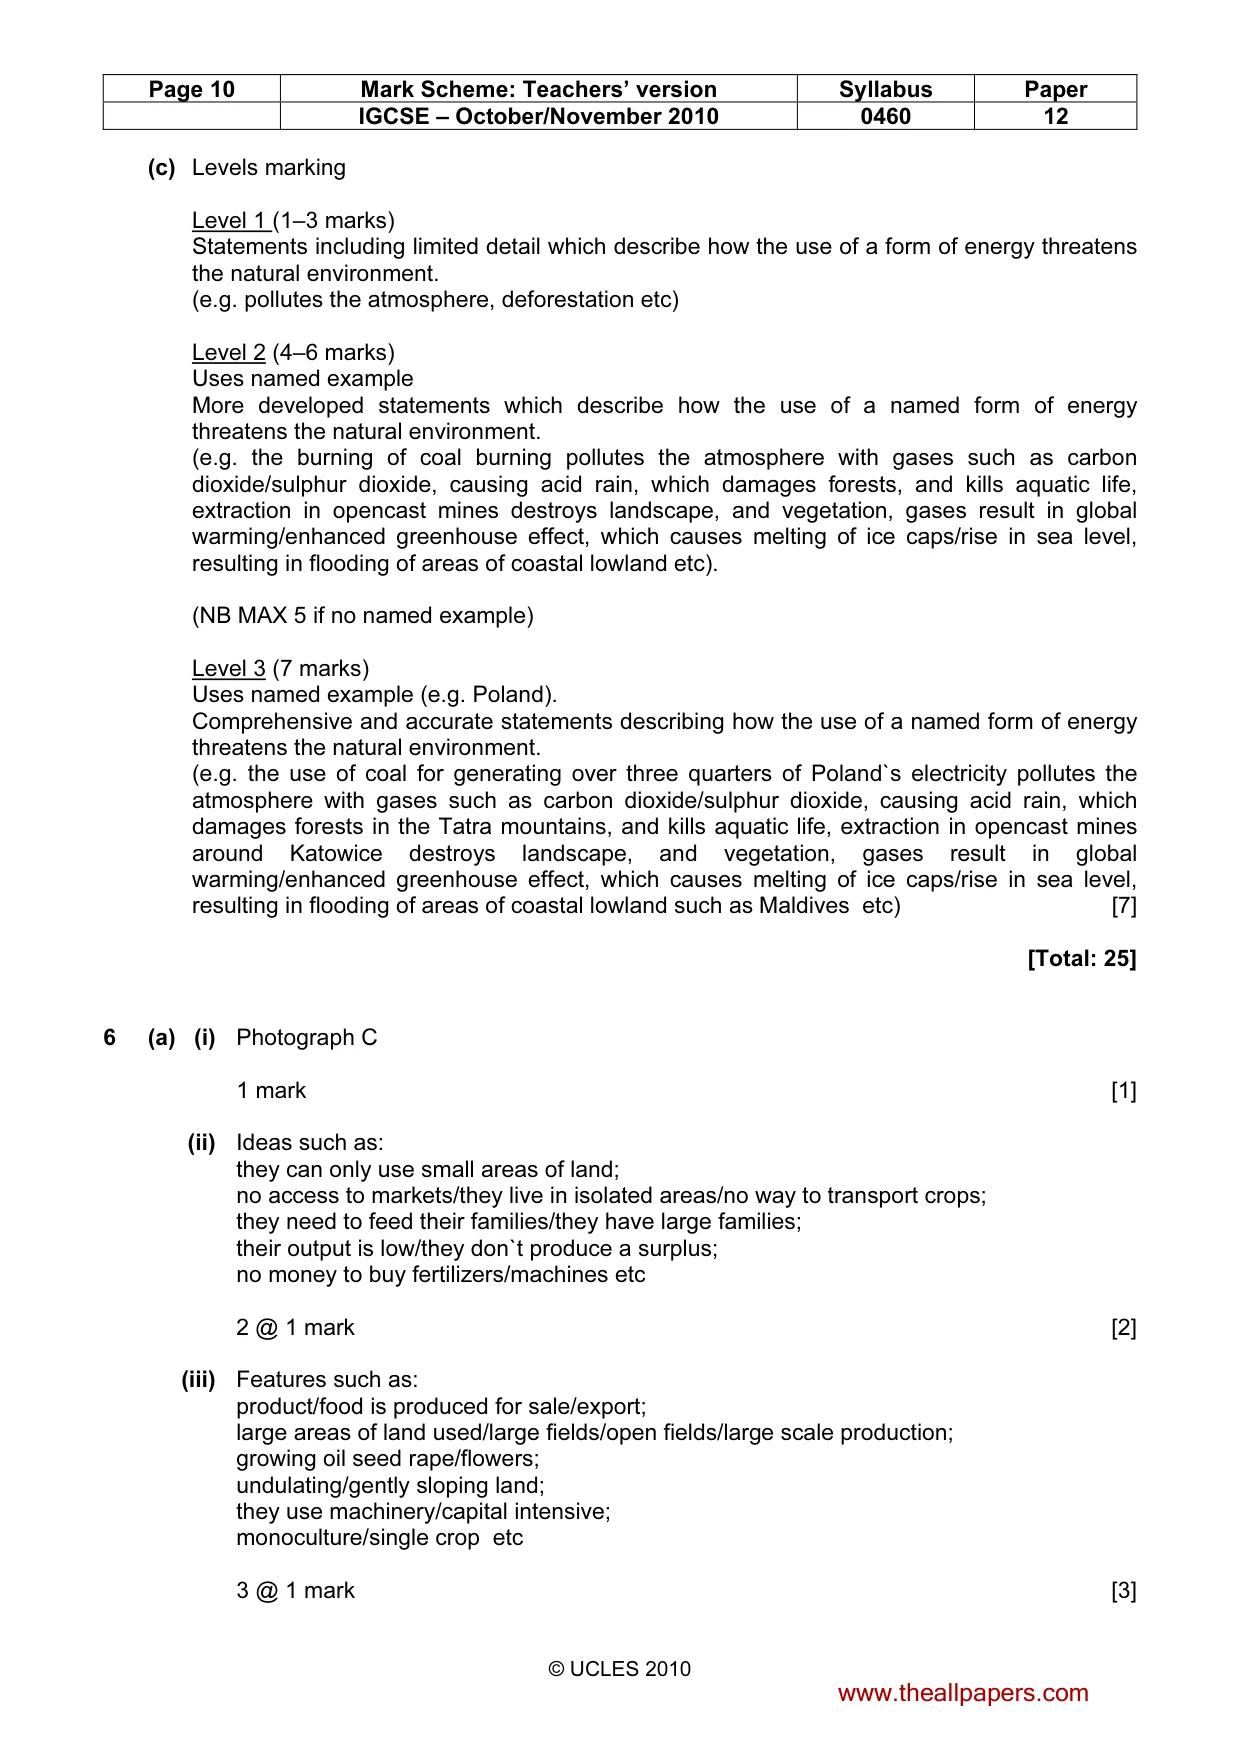
Mark scheme, page 10
Page 10 Mark Scheme: Teachers’ version Syllabus Paper IGCSE – October/November 2010 0460 12 © UCLES 2010 (c) Levels marking Level 1 (1–3 marks) Statements including limited detail which describe how the use of a form of energy threatens the natural environment. (e.g. pollutes the atmosphere, deforestation etc) Level 2 (4–6 marks) Uses named example More developed statements which describe how the use of a named form of energy threatens the natural environment. (e.g. the burning of coal burning pollutes the atmosphere with gases such as carbon dioxide/sulphur dioxide, causing acid rain, which damages forests, and kills aquatic life, extraction in opencast mines destroys landscape, and vegetation, gases result in global warming/enhanced greenhouse effect, which causes melting of ice caps/rise in sea level, resulting in flooding of areas of coastal lowland etc). (NB MAX 5 if no named example) Level 3 (7 marks) Uses named example (e.g. Poland). Comprehensive and accurate statements describing how the use of a named form of energy threatens the natural environment. (e.g. the use of coal for generating over three quarters of Poland`s electricity pollutes the atmosphere with gases such as carbon dioxide/sulphur dioxide, causing acid rain, which damages forests in the Tatra mountains, and kills aquatic life, extraction in opencast mines around Katowice destroys landscape, and vegetation, gases result in global warming/enhanced greenhouse effect, which causes melting of ice caps/rise in sea level, resulting in flooding of areas of coastal lowland such as Maldives etc) [7] [Total: 25] 6 (a) (i) Photograph C 1 mark [1] (ii) Ideas such as: they can only use small areas of land; no access to markets/they live in isolated areas/no way to transport crops; they need to feed their families/they have large families; their output is low/they don`t produce a surplus; no money to buy fertilizers/machines etc 2 @ 1 mark [2] (iii) Features such as: product/food is produced for sale/export; large areas of land used/large fields/open fields/large scale production; growing oil seed rape/flowers; undulating/gently sloping land; they use machinery/capital intensive; monoculture/single crop etc 3 @ 1 mark [3] www.theallpapers.com
Mark scheme, page 11
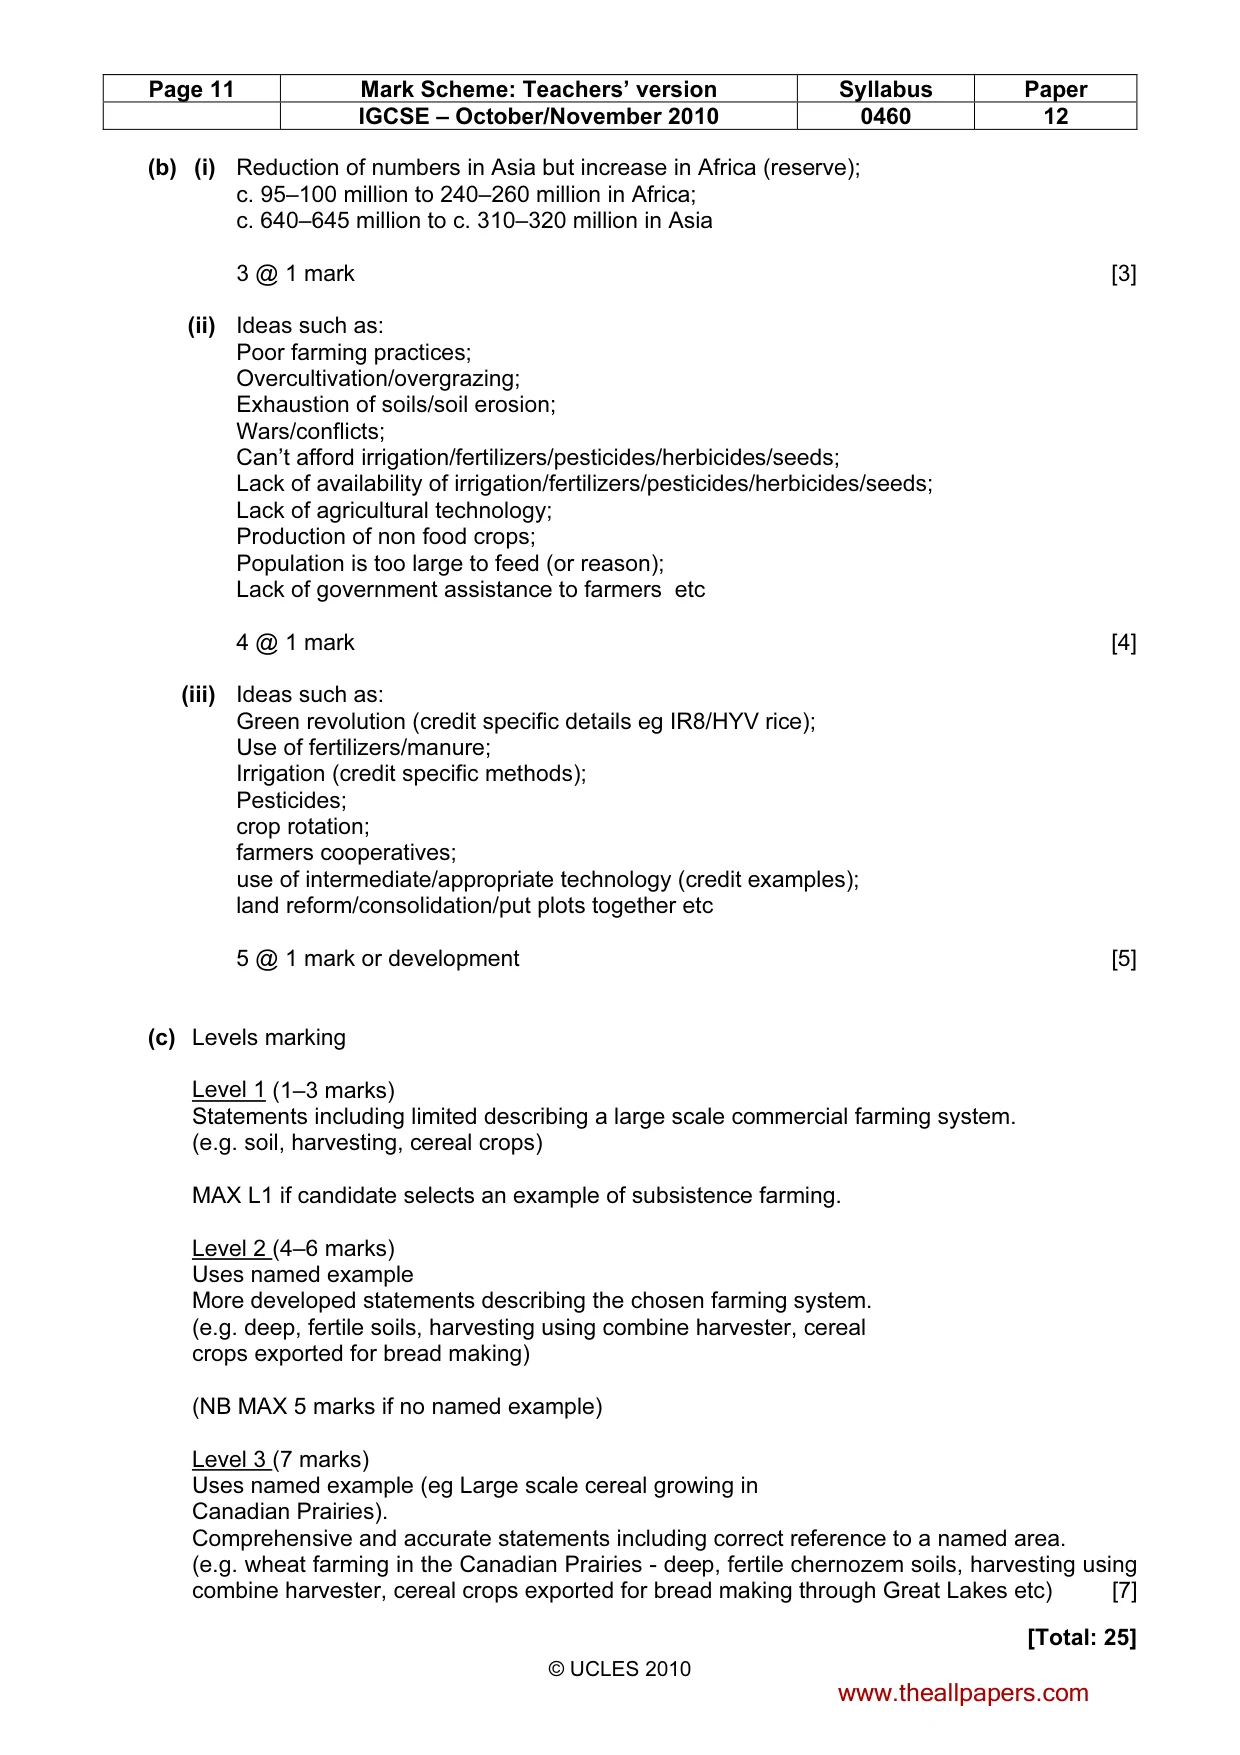
Page 11 Mark Scheme: Teachers’ version Syllabus Paper IGCSE – October/November 2010 0460 12 © UCLES 2010 (b) (i) Reduction of numbers in Asia but increase in Africa (reserve); c. 95–100 million to 240–260 million in Africa; c. 640–645 million to c. 310–320 million in Asia 3 @ 1 mark [3] (ii) Ideas such as: Poor farming practices; Overcultivation/overgrazing; Exhaustion of soils/soil erosion; Wars/conflicts; Can’t afford irrigation/fertilizers/pesticides/herbicides/seeds; Lack of availability of irrigation/fertilizers/pesticides/herbicides/seeds; Lack of agricultural technology; Production of non food crops; Population is too large to feed (or reason); Lack of government assistance to farmers etc 4 @ 1 mark [4] (iii) Ideas such as: Green revolution (credit specific details eg IR8/HYV rice); Use of fertilizers/manure; Irrigation (credit specific methods); Pesticides; crop rotation; farmers cooperatives; use of intermediate/appropriate technology (credit examples); land reform/consolidation/put plots together etc 5 @ 1 mark or development [5] (c) Levels marking Level 1 (1–3 marks) Statements including limited describing a large scale commercial farming system. (e.g. soil, harvesting, cereal crops) MAX L1 if candidate selects an example of subsistence farming. Level 2 (4–6 marks) Uses named example More developed statements describing the chosen farming system. (e.g. deep, fertile soils, harvesting using combine harvester, cereal crops exported for bread making) (NB MAX 5 marks if no named example) Level 3 (7 marks) Uses named example (eg Large scale cereal growing in Canadian Prairies). Comprehensive and accurate statements including correct reference to a named area. (e.g. wheat farming in the Canadian Prairies - deep, fertile chernozem soils, harvesting using combine harvester, cereal crops exported for bread making through Great Lakes etc) [7] [Total: 25] www.theallpapers.com
What you needed in this session
Cambridge’s own grade thresholds for 2010 Oct/Nov, Paper 1 · Variant 2. A higher threshold means an easier paper — the bar moves with how the cohort did.