Cambridge IGCSE Geography 0460 — 2009 Oct/Nov Paper 4 · Variant 1
0460/41/O/N/09 · 60 marks · ≈68 min
The question paper and its mark scheme, free to read here and free to download. This is Cambridge’s own paper, exactly as it was sat.
Question paper16 pages

Mark scheme6 pages
Answers below. Sit the paper first if you are practising.
Paper as text
Question paper, page 1
This document consists of 15 printed pages, 1 blank page, and 1 Insert. DC (NF/CGW) 10966/9 © UCLES 2009 [Turn over UNIVERSITY OF CAMBRIDGE INTERNATIONAL EXAMINATIONS International General Certificate of Secondary Education READ THESE INSTRUCTIONS FIRST Write your Centre number, candidate number and name on all the work you hand in. Write in dark blue or black pen. You may use a soft pencil for any diagrams, graphs or rough working. Do not use staples, paper clips, highlighters, glue or correction fluid. DO NOT WRITE ON ANY BARCODES. Answer all questions. The Insert contains Fig. 1 and Tables 1 and 2 for Question 1 and Table 4 for Question 2. The Insert is not required by the Examiner. Sketch maps and diagrams should be drawn whenever they serve to illustrate an answer. At the end of the examination, fasten all your work securely together. The number of marks is given in brackets [ ] at the end of each question or part question. * 6 8 7 5 7 2 9 4 7 8 * GEOGRAPHY 0460/04 Paper 4 Alternative to Coursework October/November 2009 1 hour 30 minutes Candidates answer on the Question Paper. Additional Materials: Ruler For Examiner’s Use Q1 Q2 Total www.theallpapers.com
Question paper, page 2
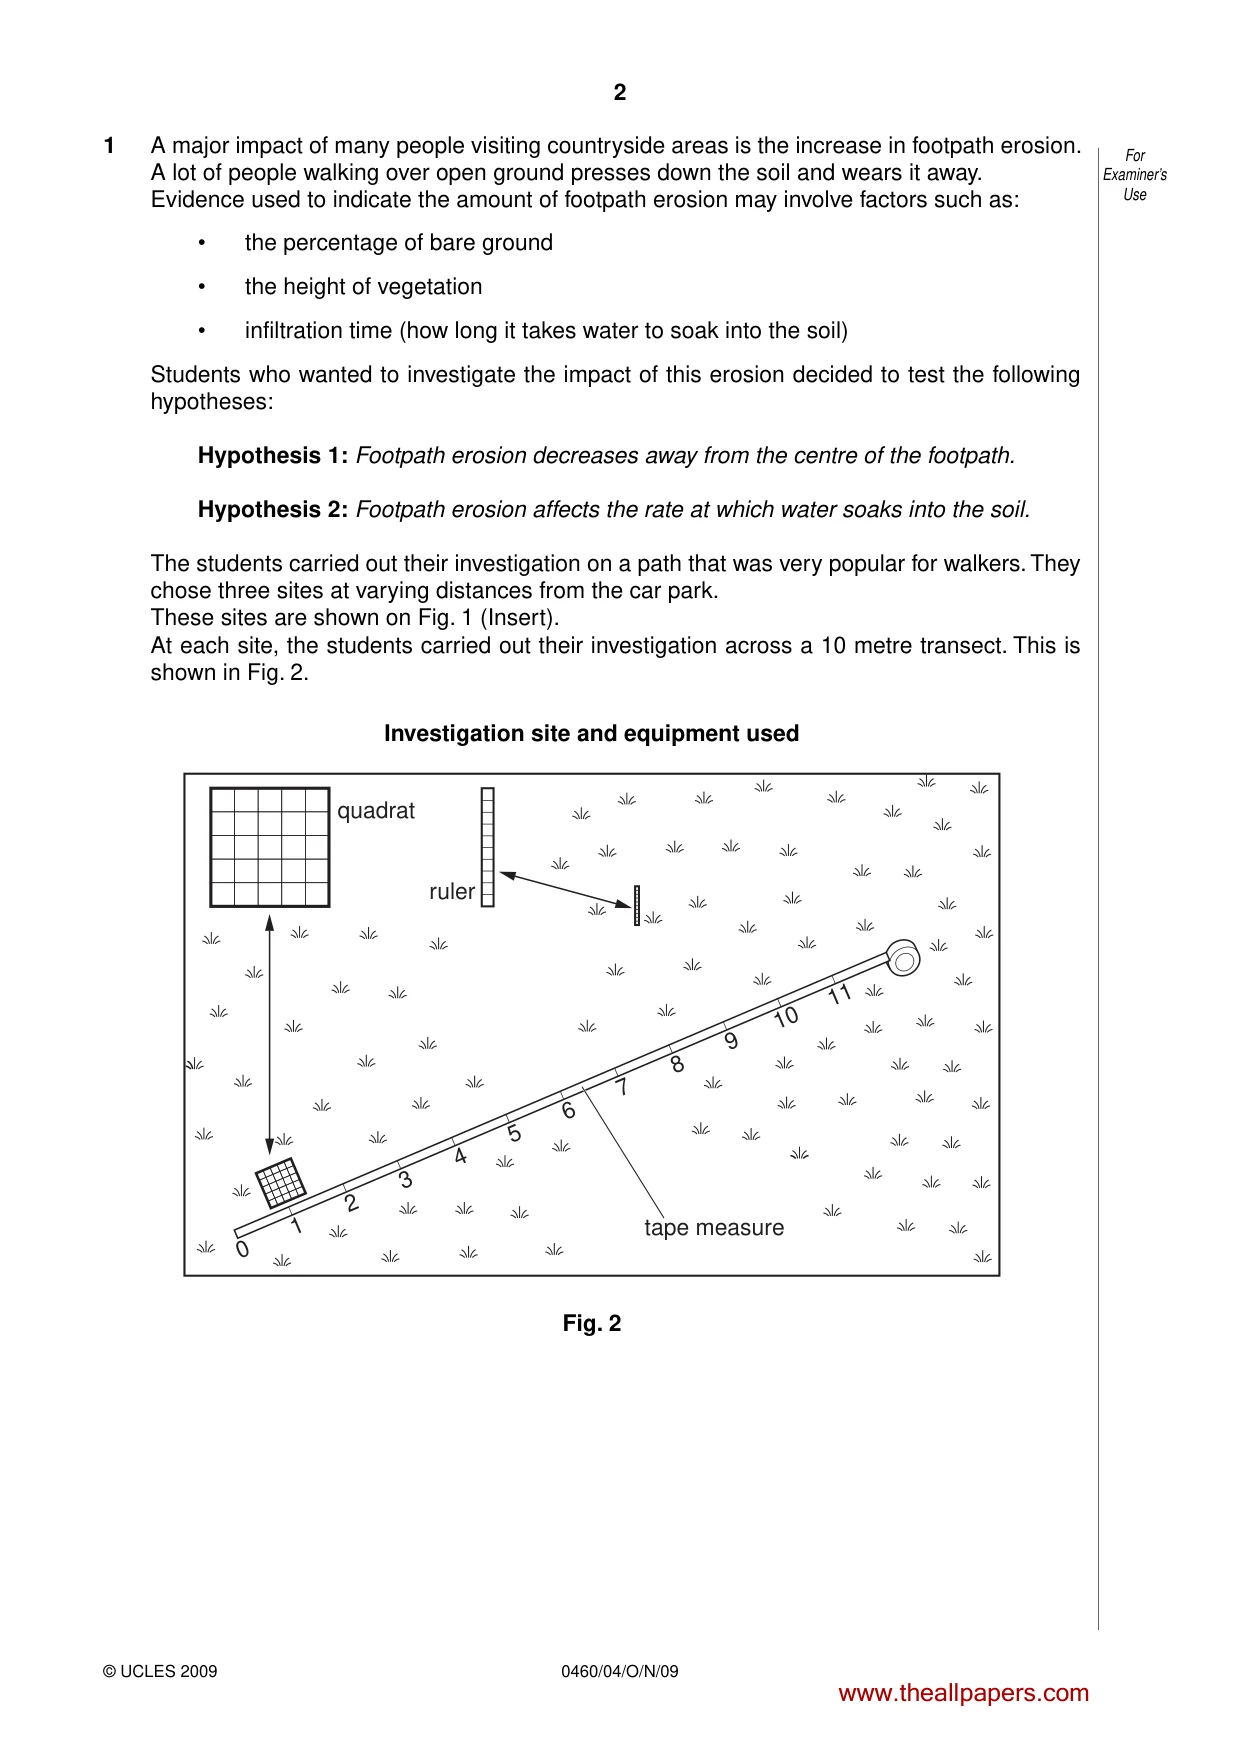
2 0460/04/O/N/09 © UCLES 2009 For Examiner’s Use 1 A major impact of many people visiting countryside areas is the increase in footpath erosion. A lot of people walking over open ground presses down the soil and wears it away. Evidence used to indicate the amount of footpath erosion may involve factors such as: • the percentage of bare ground • the height of vegetation • infiltration time (how long it takes water to soak into the soil) Students who wanted to investigate the impact of this erosion decided to test the following hypotheses: Hypothesis 1: Footpath erosion decreases away from the centre of the footpath. Hypothesis 2: Footpath erosion affects the rate at which water soaks into the soil. The students carried out their investigation on a path that was very popular for walkers. They chose three sites at varying distances from the car park. These sites are shown on Fig. 1 (Insert). At each site, the students carried out their investigation across a 10 metre transect. This is shown in Fig. 2. Investigation site and equipment used quadrat ruler tape measure 0 1 2 3 4 5 6 7 8 9 10 11 Fig. 2 www.theallpapers.com
Question paper, page 3
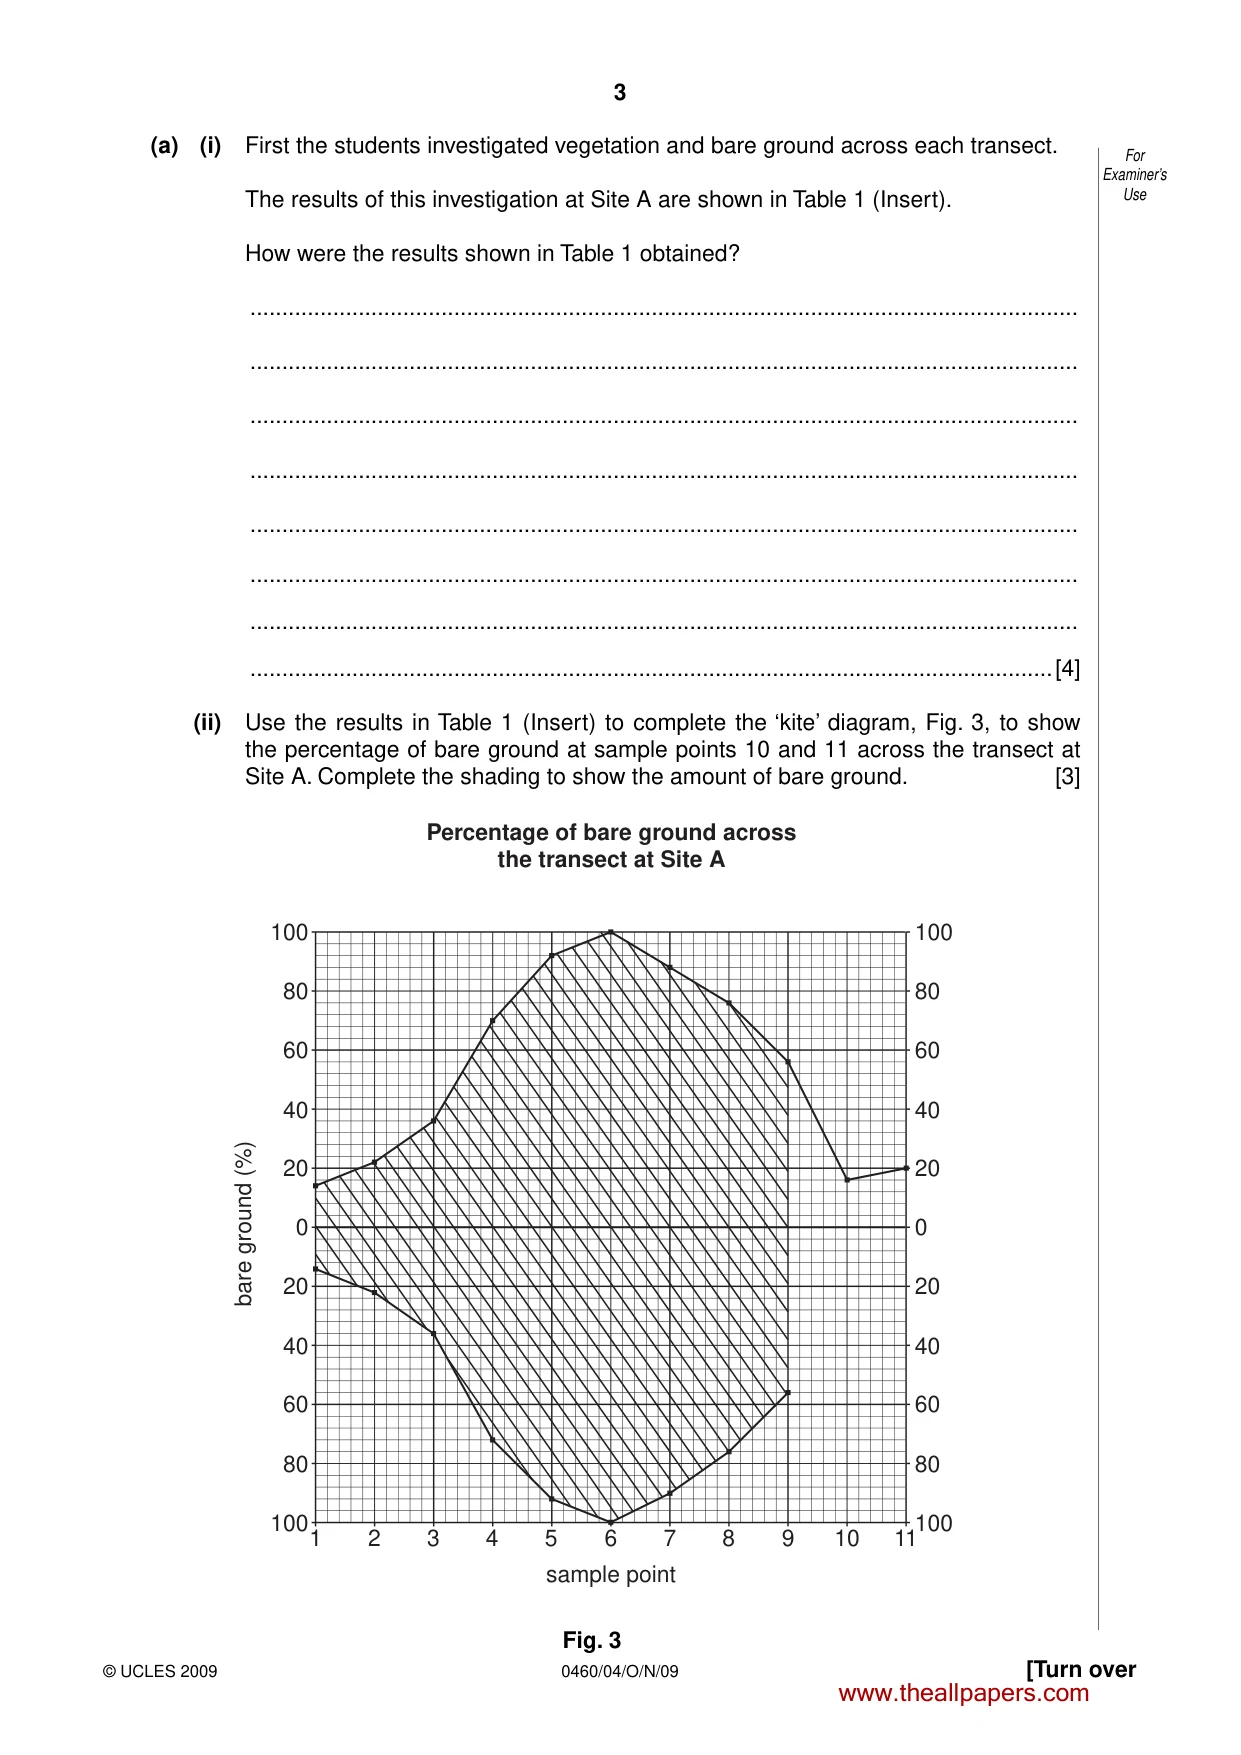
3 0460/04/O/N/09 © UCLES 2009 [Turn over For Examiner’s Use (a) (i) First the students investigated vegetation and bare ground across each transect. The results of this investigation at Site A are shown in Table 1 (Insert). How were the results shown in Table 1 obtained? … … … … … … … …[4] (ii) Use the results in Table 1 (Insert) to complete the ‘kite’ diagram, Fig. 3, to show the percentage of bare ground at sample points 10 and 11 across the transect at Site A. Complete the shading to show the amount of bare ground. [3] 1 2 3 4 5 6 sample point 7 8 9 10 11 100 bare ground (%) 80 60 40 20 0 20 40 60 80 100 100 Percentage of bare ground across the transect at Site A 80 60 40 20 0 20 40 60 80 100 Fig. 3 www.theallpapers.com
Question paper, page 4
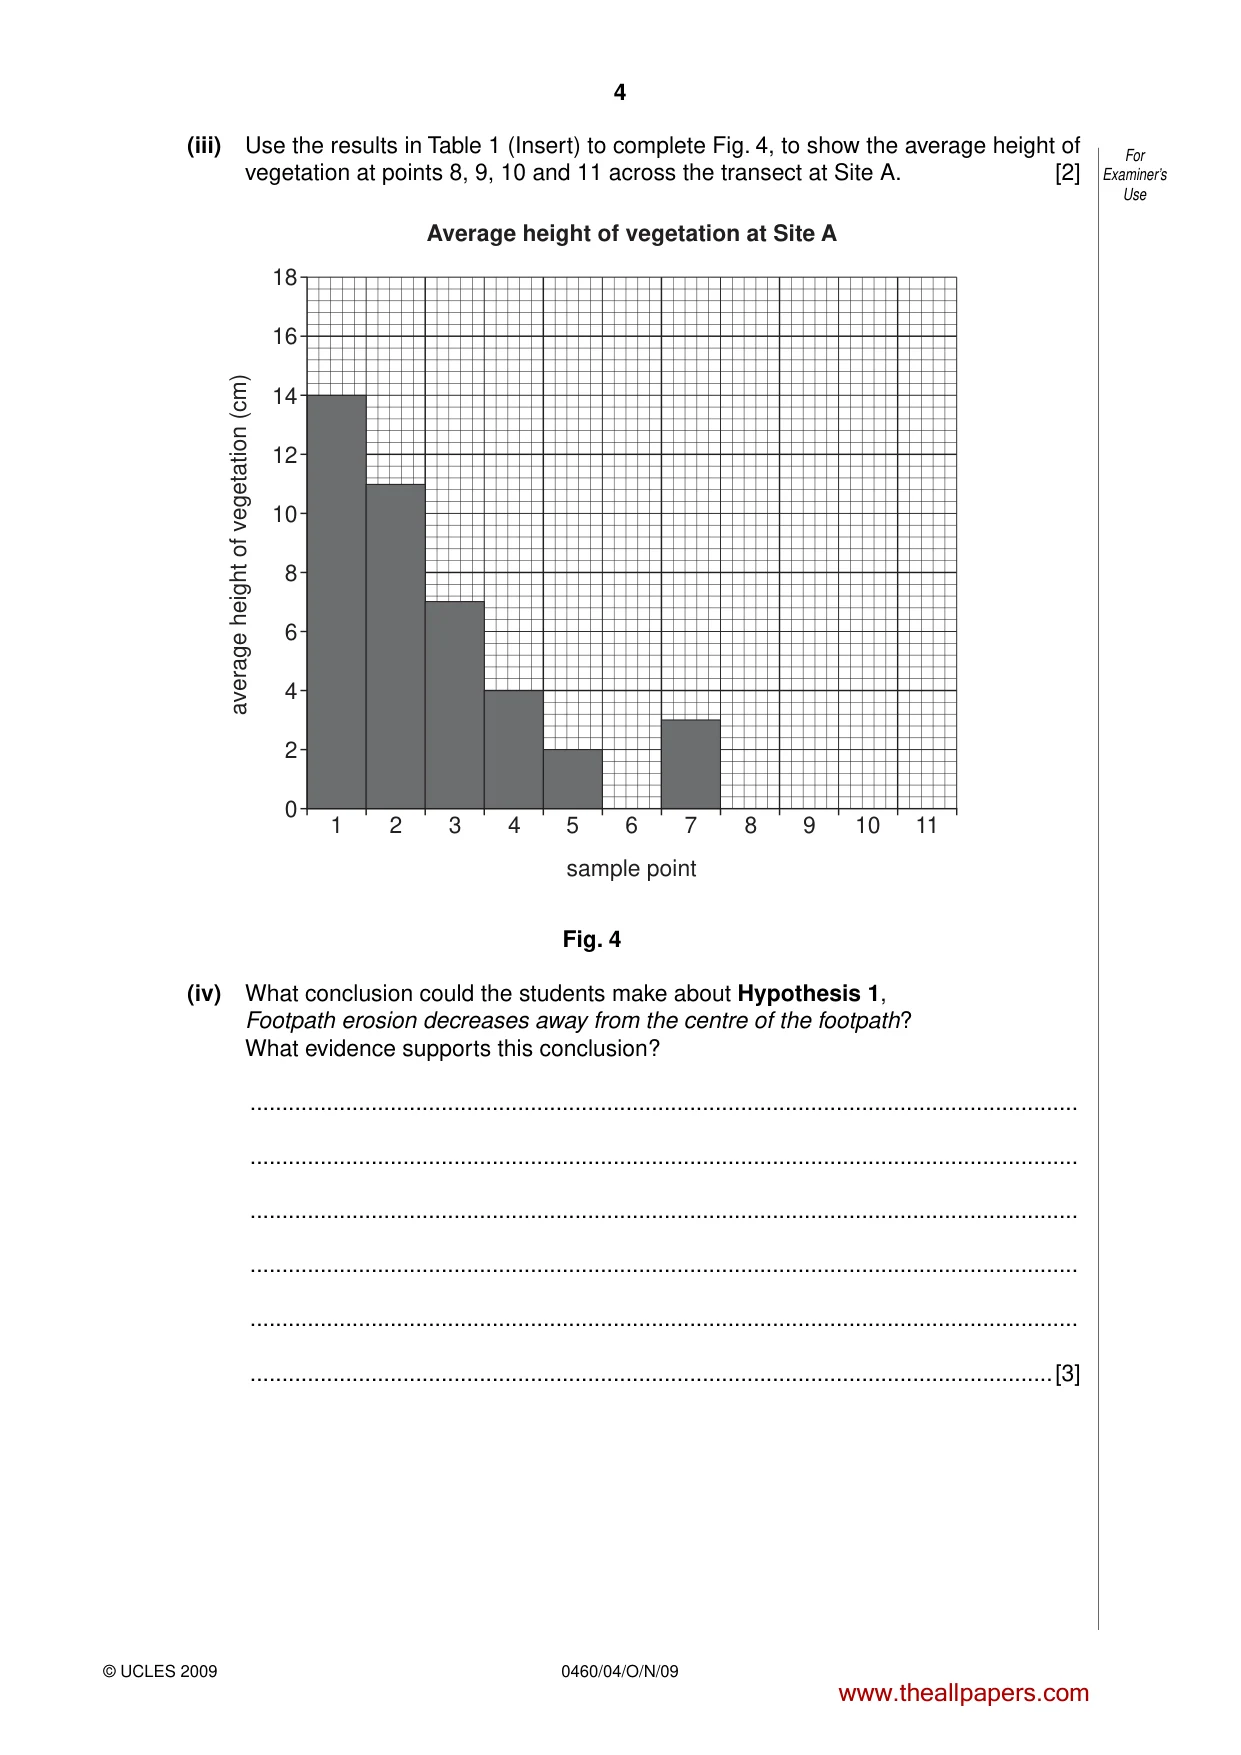
4 0460/04/O/N/09 © UCLES 2009 For Examiner’s Use (iii) Use the results in Table 1 (Insert) to complete Fig. 4, to show the average height of vegetation at points 8, 9, 10 and 11 across the transect at Site A. [2] 1 0 2 4 6 8 10 12 14 16 18 2 3 4 5 6 sample point Average height of vegetation at Site A average height of vegetation (cm) 7 8 9 10 11 Fig. 4 (iv) What conclusion could the students make about Hypothesis 1, Footpath erosion decreases away from the centre of the footpath? What evidence supports this conclusion? … … … … … …[3] www.theallpapers.com
Question paper, page 5
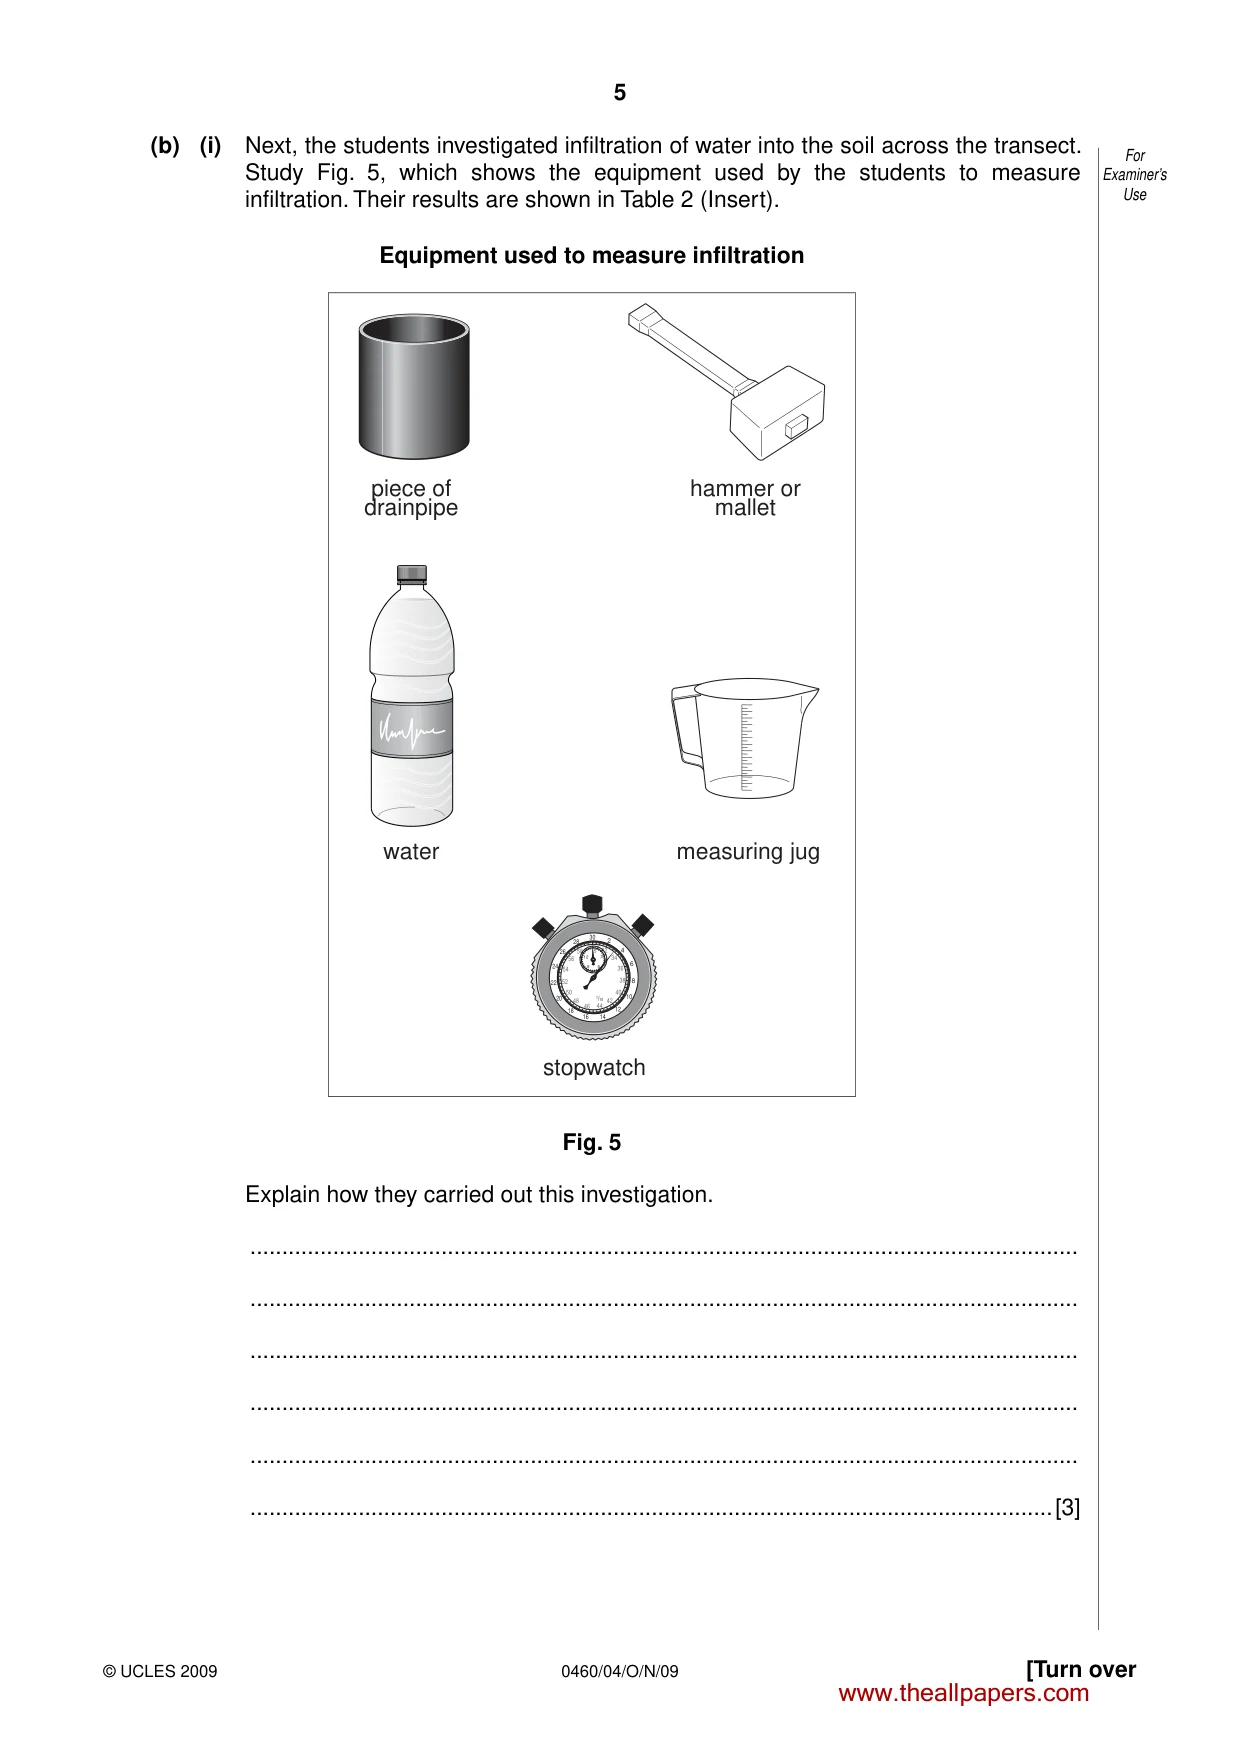
5 0460/04/O/N/09 © UCLES 2009 [Turn over For Examiner’s Use (b) (i) Next, the students investigated infiltration of water into the soil across the transect. Study Fig. 5, which shows the equipment used by the students to measure infiltration. Their results are shown in Table 2 (Insert). Equipment used to measure infiltration water measuring jug stopwatch piece of drainpipe hammer or mallet 32 58 3 6 9 12 15 2 4 6 8 10 12 14 16 18 20 22 24 26 28 30 34 36 38 40 42 46 44 48 50 52 54 56 1/10 Fig. 5 Explain how they carried out this investigation. … … … … … …[3] www.theallpapers.com
Question paper, page 6
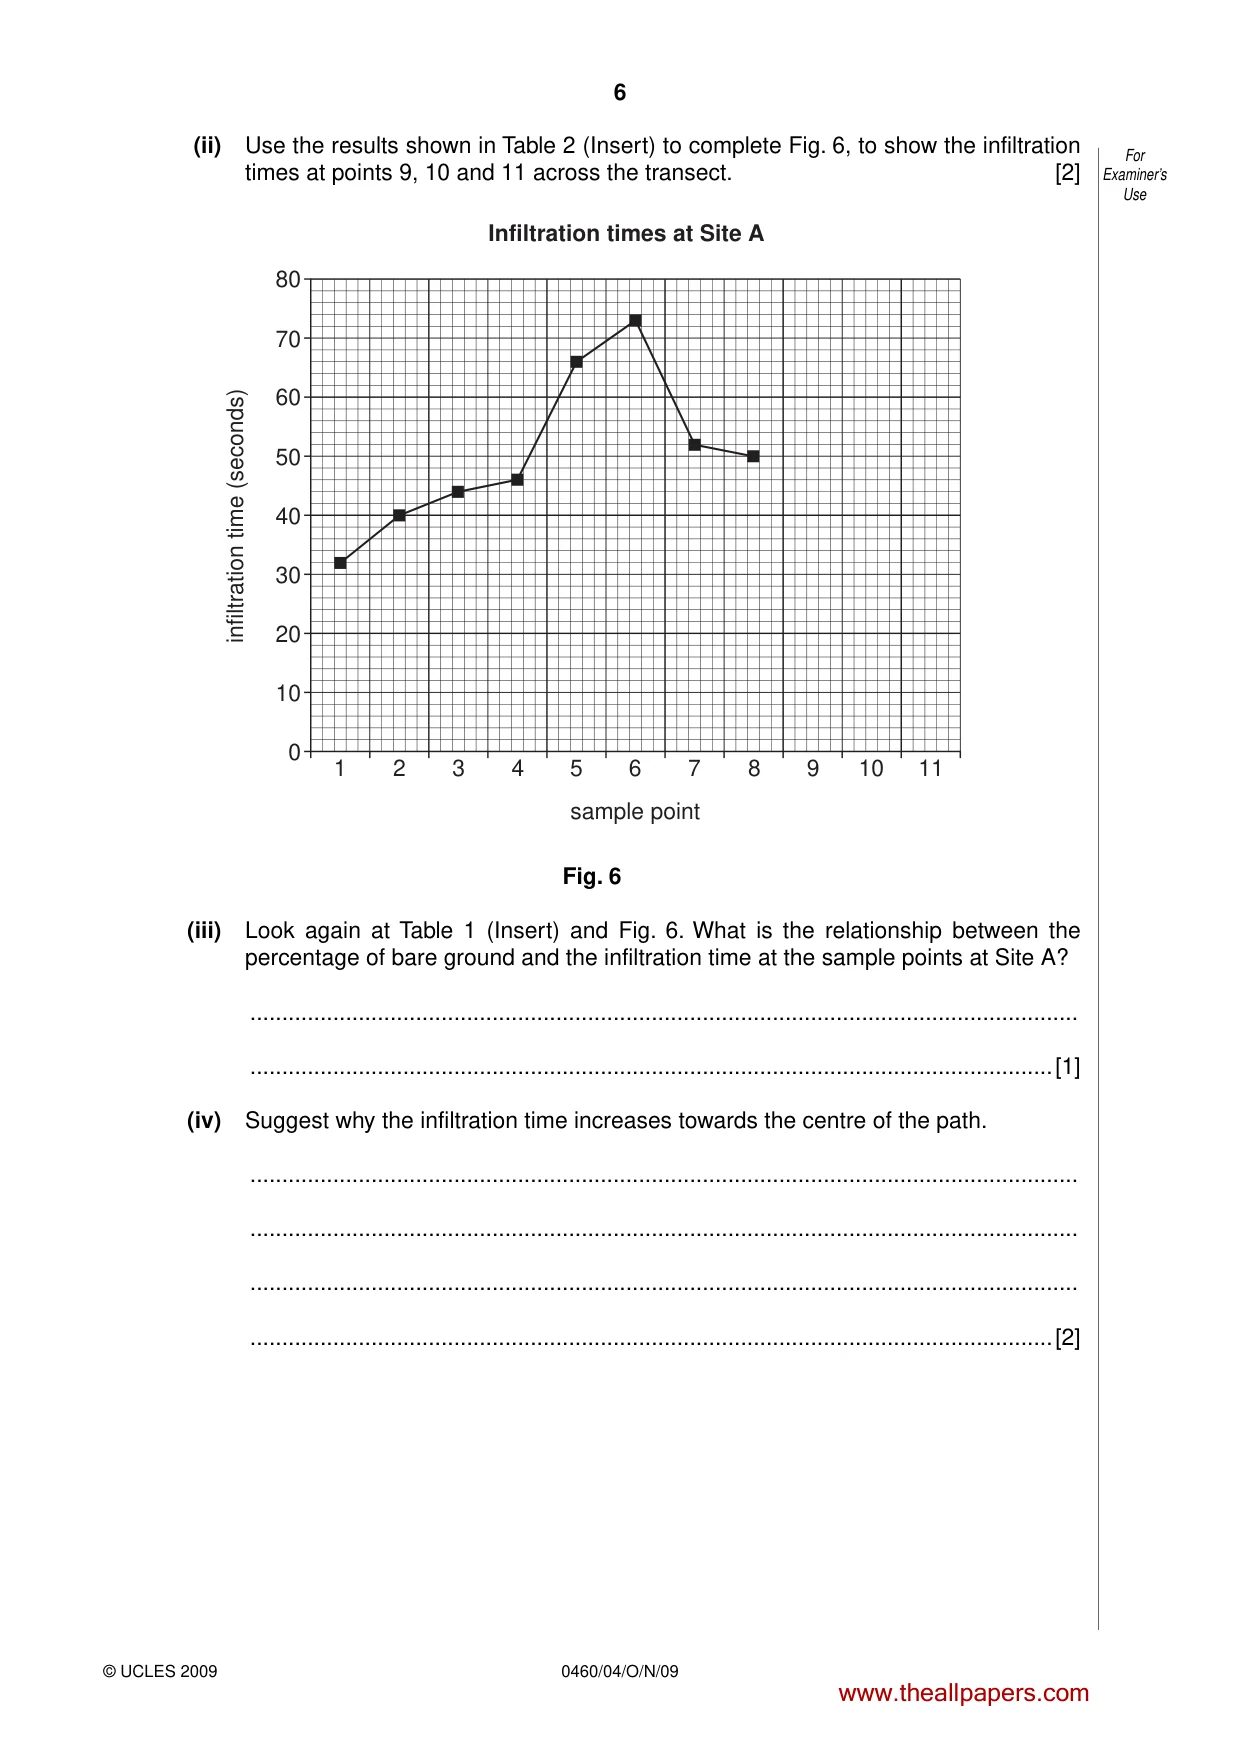
6 0460/04/O/N/09 © UCLES 2009 For Examiner’s Use (ii) Use the results shown in Table 2 (Insert) to complete Fig. 6, to show the infiltration times at points 9, 10 and 11 across the transect. [2] 1 0 10 20 30 40 50 60 70 80 2 3 4 5 6 sample point Infiltration times at Site A infiltration time (seconds) 7 8 9 10 11 Fig. 6 (iii) Look again at Table 1 (Insert) and Fig. 6. What is the relationship between the percentage of bare ground and the infiltration time at the sample points at Site A? … …[1] (iv) Suggest why the infiltration time increases towards the centre of the path. … … … …[2] www.theallpapers.com
Question paper, page 7
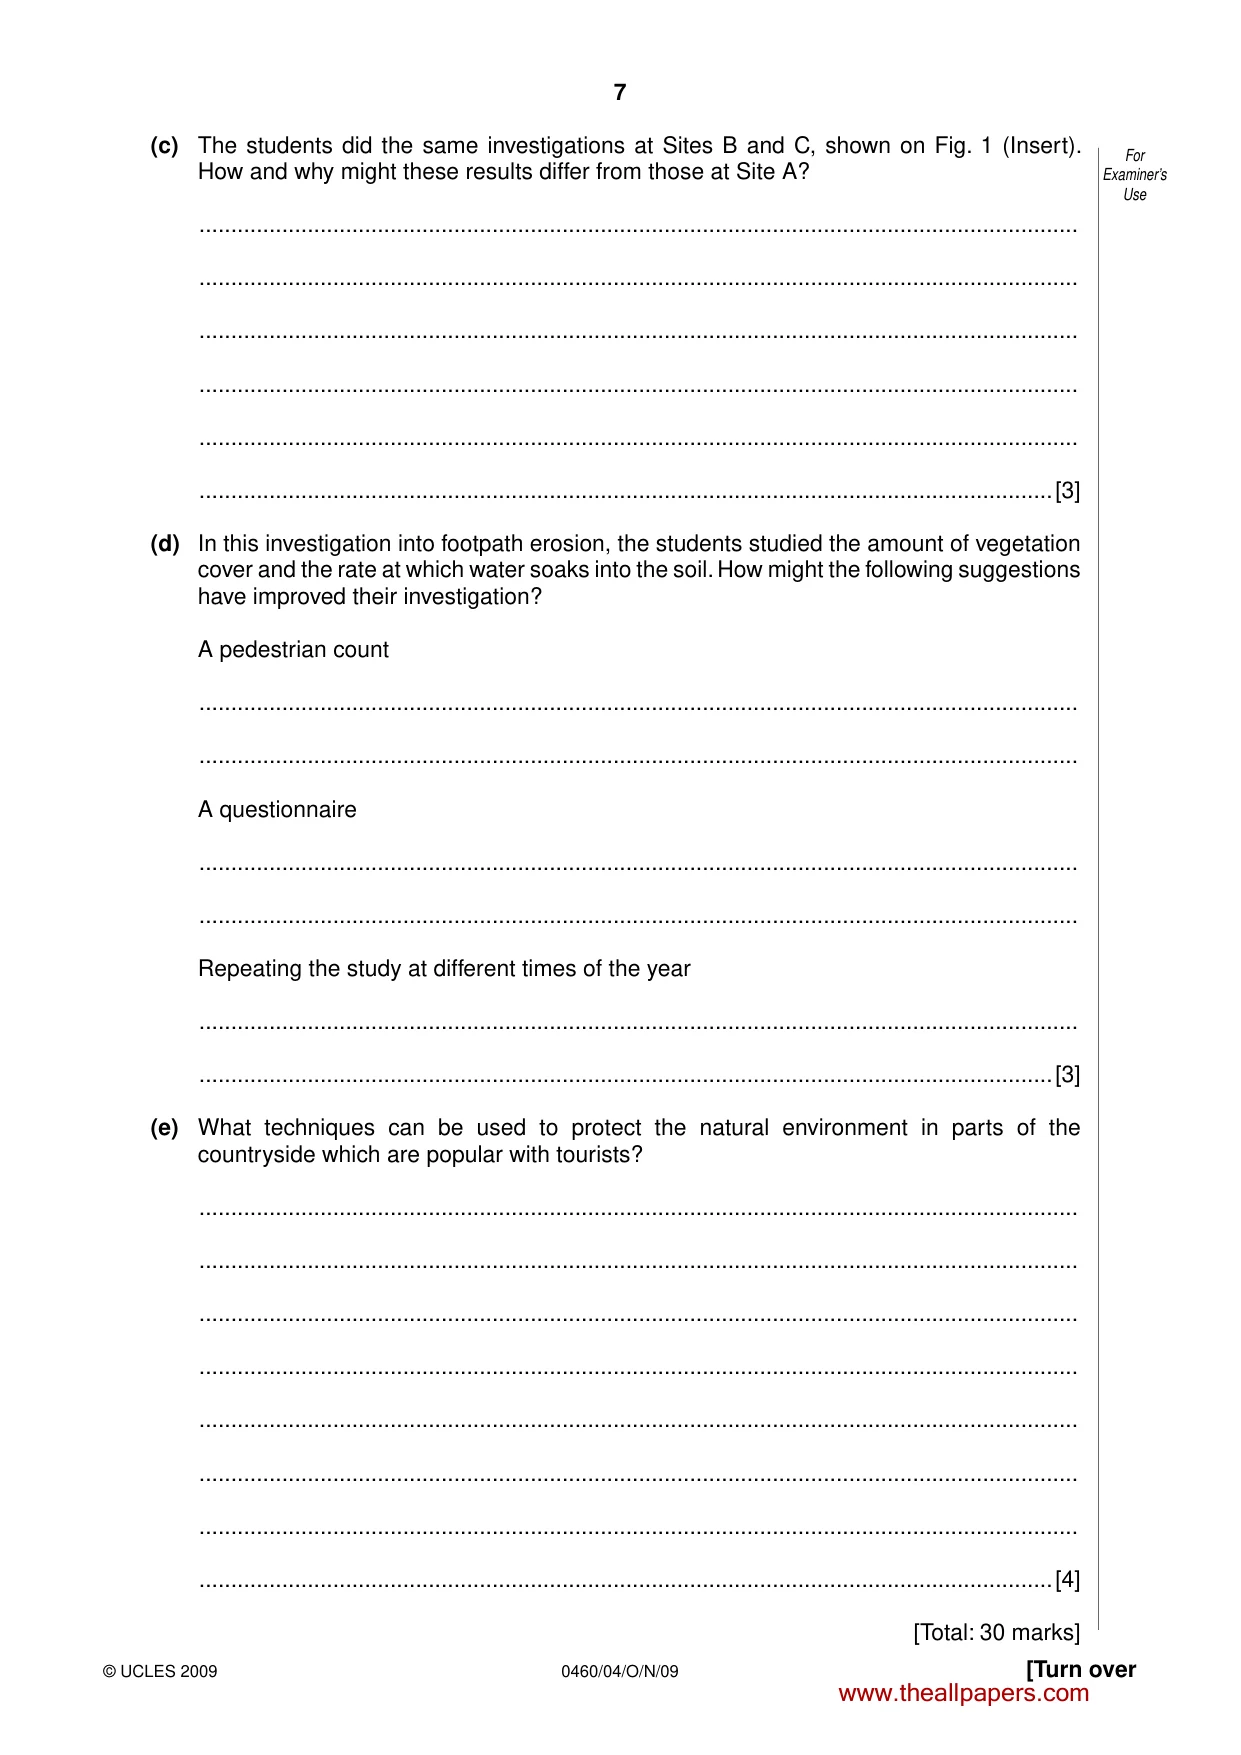
7 0460/04/O/N/09 © UCLES 2009 [Turn over For Examiner’s Use (c) The students did the same investigations at Sites B and C, shown on Fig. 1 (Insert). How and why might these results differ from those at Site A? … … … … … …[3] (d) In this investigation into footpath erosion, the students studied the amount of vegetation cover and the rate at which water soaks into the soil. How might the following suggestions have improved their investigation? A pedestrian count … … A questionnaire … … Repeating the study at different times of the year … …[3] (e) What techniques can be used to protect the natural environment in parts of the countryside which are popular with tourists? … … … … … … … …[4] [Total: 30 marks] www.theallpapers.com
Question paper, page 8
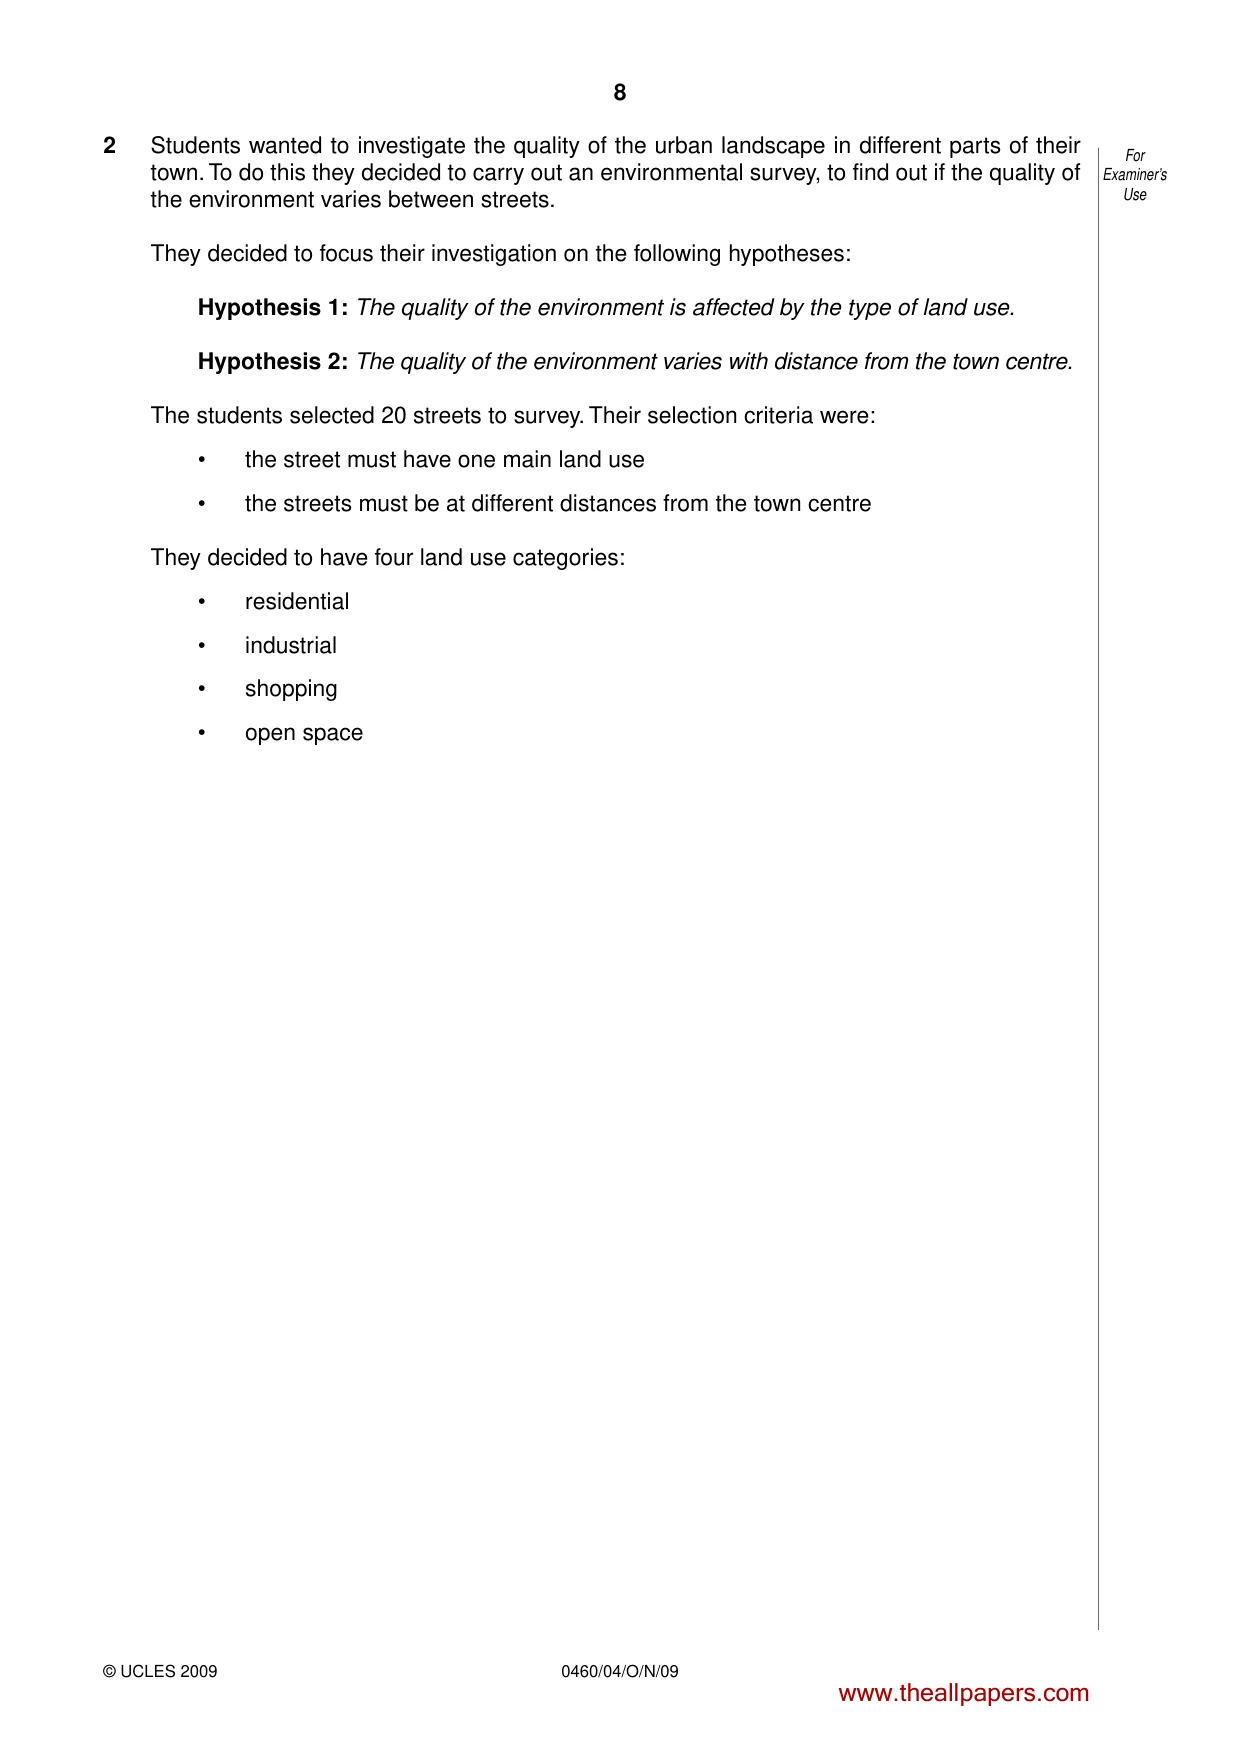
8 0460/04/O/N/09 © UCLES 2009 For Examiner’s Use 2 Students wanted to investigate the quality of the urban landscape in different parts of their town. To do this they decided to carry out an environmental survey, to find out if the quality of the environment varies between streets. They decided to focus their investigation on the following hypotheses: Hypothesis 1: The quality of the environment is affected by the type of land use. Hypothesis 2: The quality of the environment varies with distance from the town centre. The students selected 20 streets to survey. Their selection criteria were: • the street must have one main land use • the streets must be at different distances from the town centre They decided to have four land use categories: • residential • industrial • shopping • open space www.theallpapers.com
Question paper, page 9
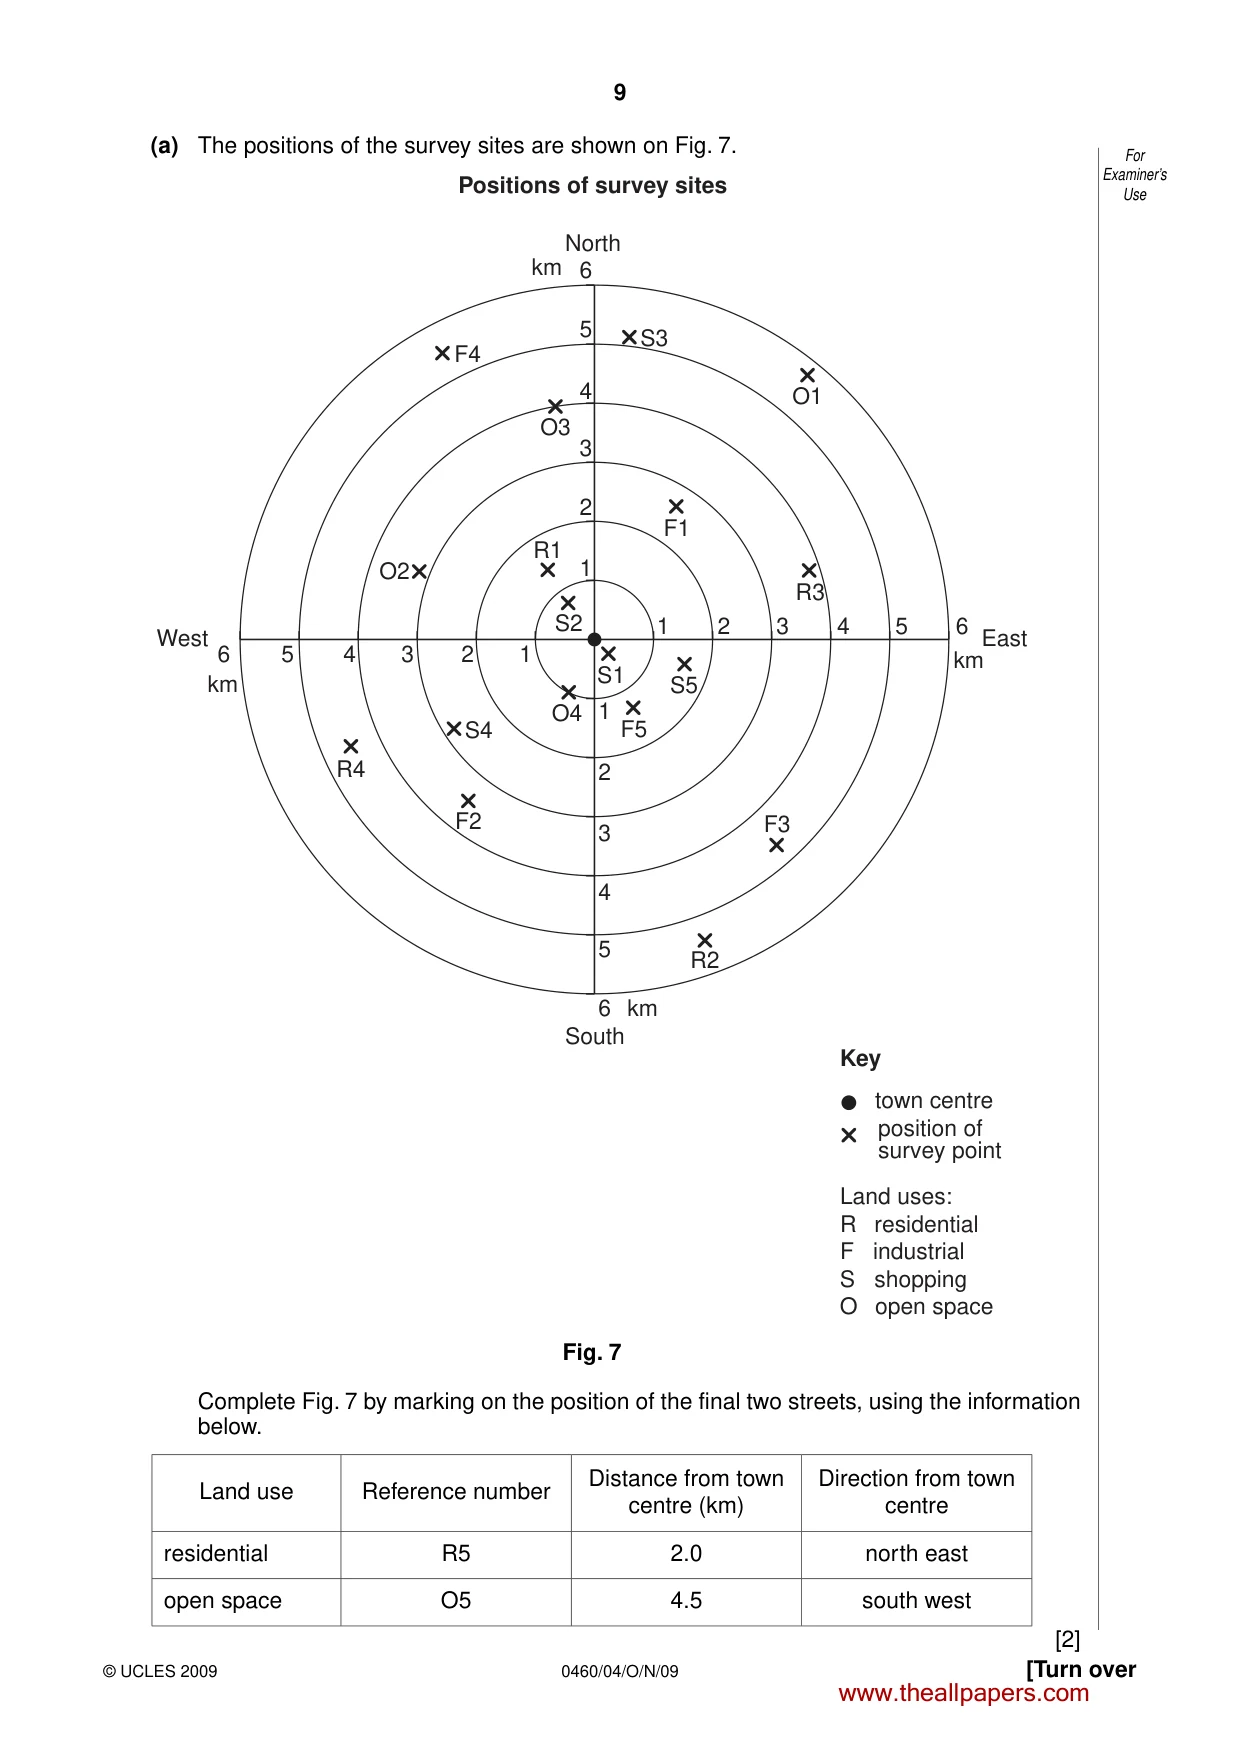
9 0460/04/O/N/09 © UCLES 2009 [Turn over For Examiner’s Use (a) The positions of the survey sites are shown on Fig. 7. 1 1 2 3 4 5 6 1 2 3 4 O1 F1 F5 F2 R3 R4 R2 F3 O4 S1 S2 R1 S4 S3 S5 O2 O3 F4 5 6 North Positions of survey sites South Key town centre position of survey point Land uses: R residential F industrial S shopping O open space East West km km km km 2 3 4 5 6 1 2 3 4 5 6 Fig. 7 Complete Fig. 7 by marking on the position of the final two streets, using the information below. Land use Reference number Distance from town centre (km) Direction from town centre residential R5 2.0 north east open space O5 4.5 south west [2] www.theallpapers.com
Question paper, page 10
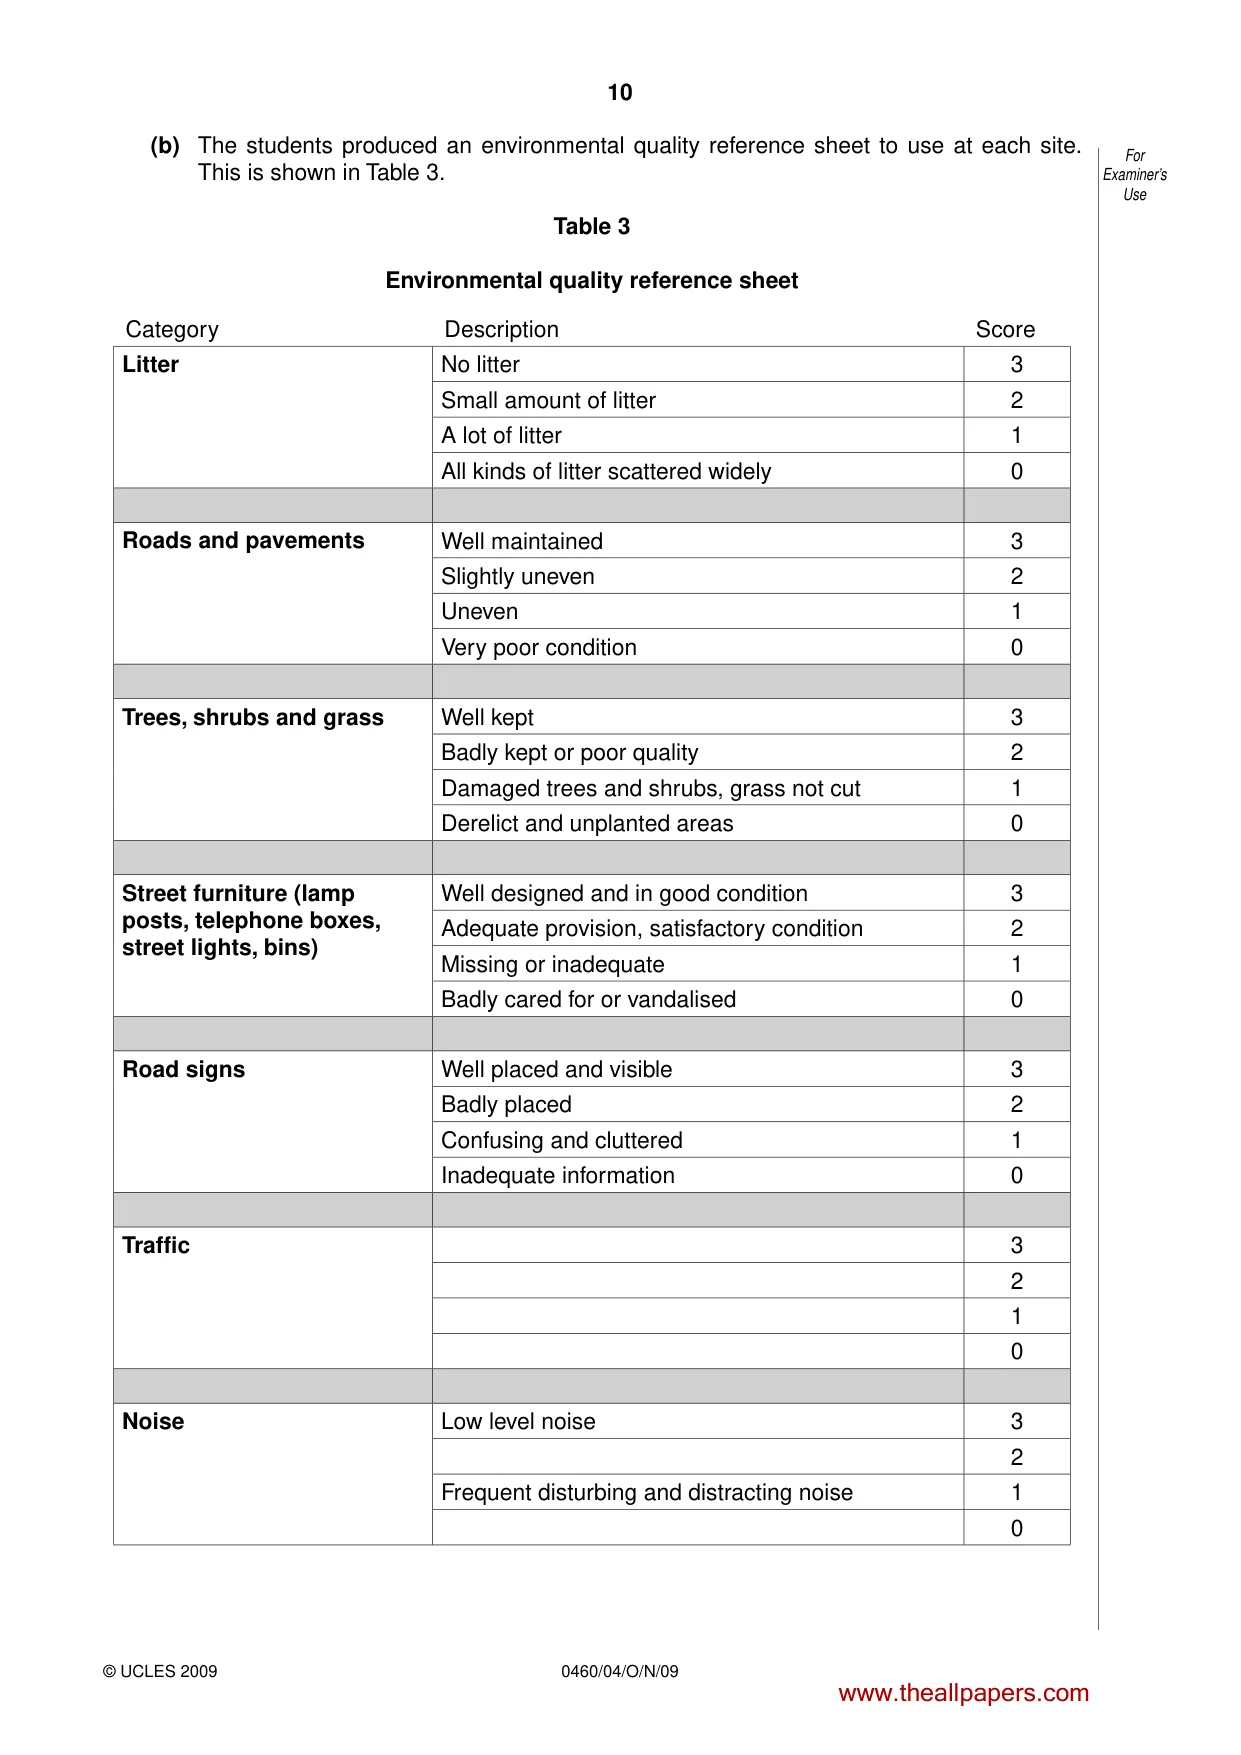
10 0460/04/O/N/09 © UCLES 2009 For Examiner’s Use (b) The students produced an environmental quality reference sheet to use at each site. This is shown in Table 3. Table 3 Environmental quality reference sheet Category Description Score Litter No litter 3 Small amount of litter 2 A lot of litter 1 All kinds of litter scattered widely 0 Roads and pavements Well maintained 3 Slightly uneven 2 Uneven 1 Very poor condition 0 Trees, shrubs and grass Well kept 3 Badly kept or poor quality 2 Damaged trees and shrubs, grass not cut 1 Derelict and unplanted areas 0 Street furniture (lamp posts, telephone boxes, street lights, bins) Well designed and in good condition 3 Adequate provision, satisfactory condition 2 Missing or inadequate 1 Badly cared for or vandalised 0 Road signs Well placed and visible 3 Badly placed 2 Confusing and cluttered 1 Inadequate information 0 Traffic 3 2 1 0 Noise Low level noise 3 2 Frequent disturbing and distracting noise 1 0 www.theallpapers.com
Question paper, page 11
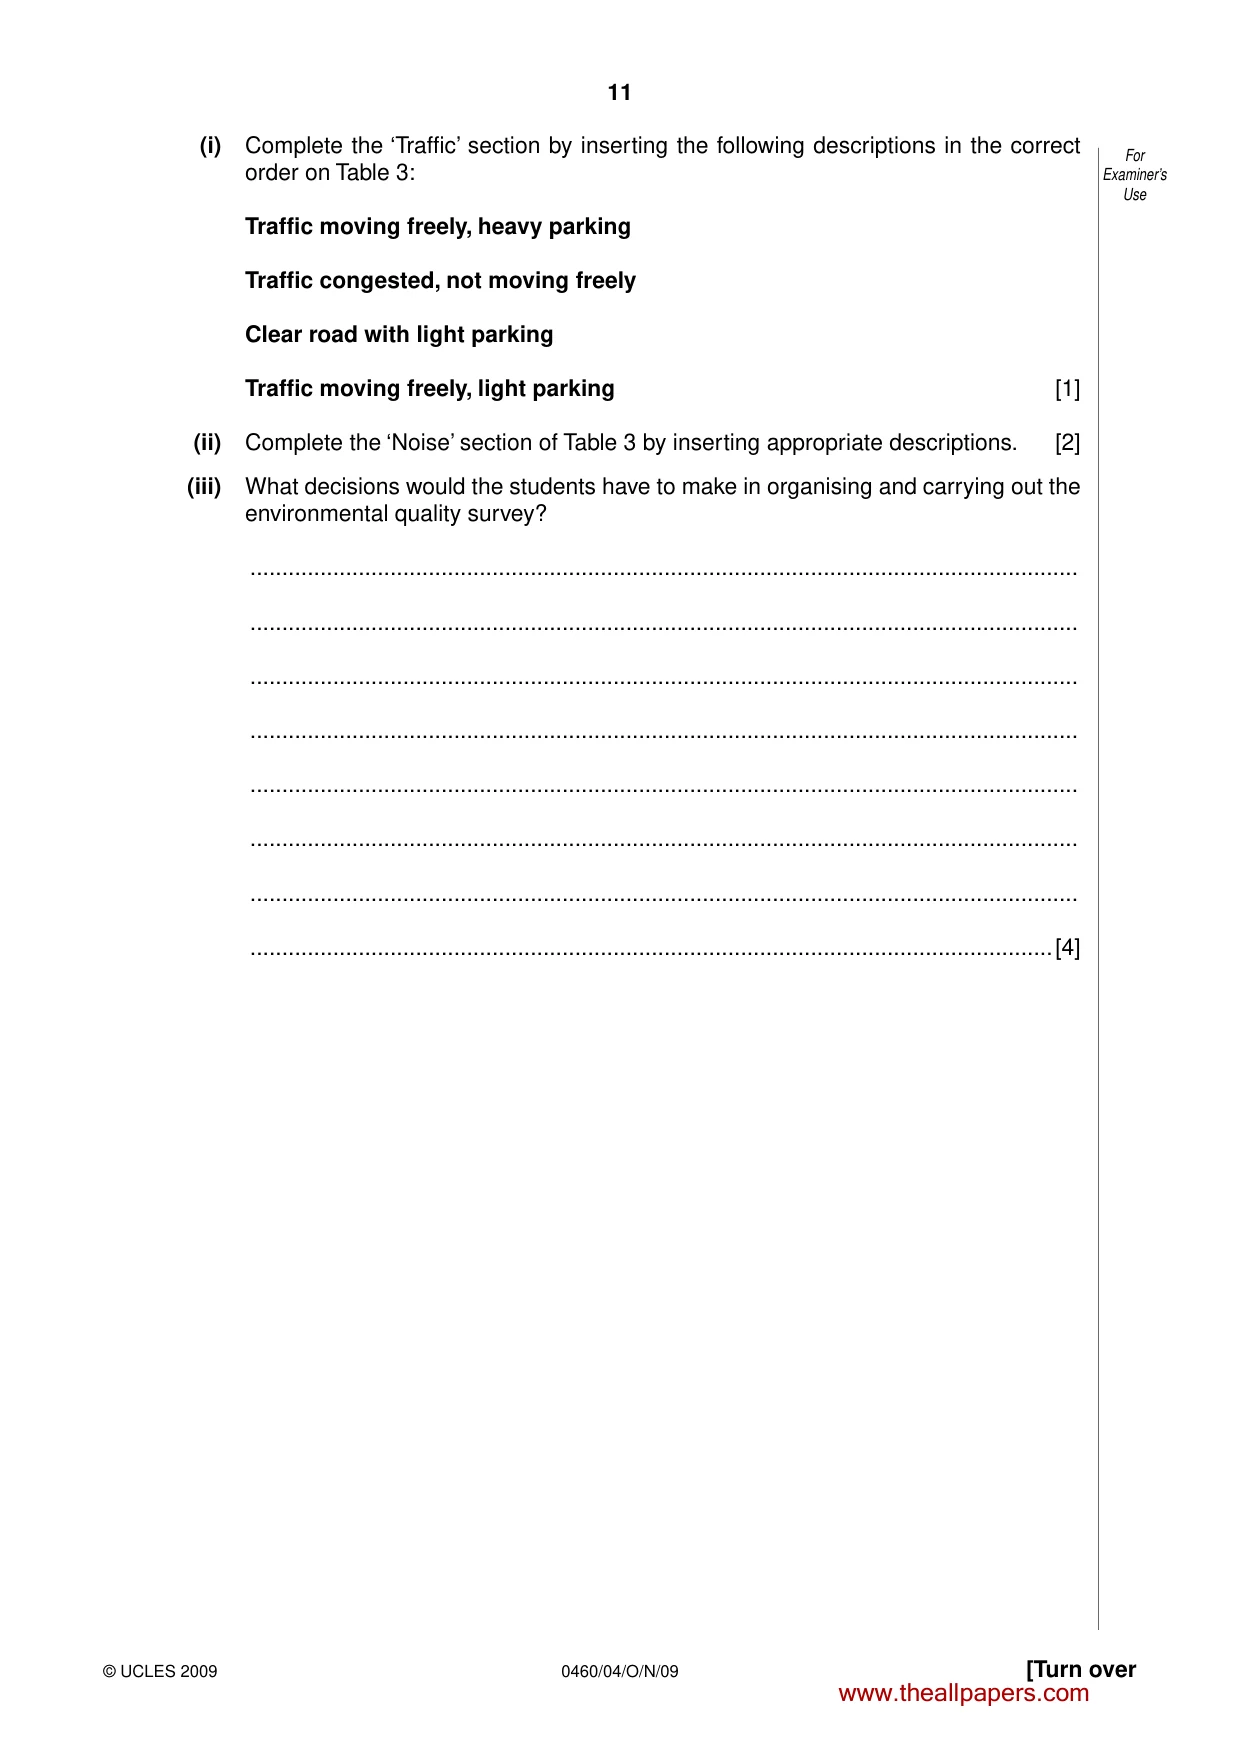
11 0460/04/O/N/09 © UCLES 2009 [Turn over For Examiner’s Use (i) Complete the ‘Traffic’ section by inserting the following descriptions in the correct order on Table 3: Traffic moving freely, heavy parking Traffic congested, not moving freely Clear road with light parking Traffic moving freely, light parking [1] (ii) Complete the ‘Noise’ section of Table 3 by inserting appropriate descriptions. [2] (iii) What decisions would the students have to make in organising and carrying out the environmental quality survey? … … … … … … … …[4] www.theallpapers.com
Question paper, page 12
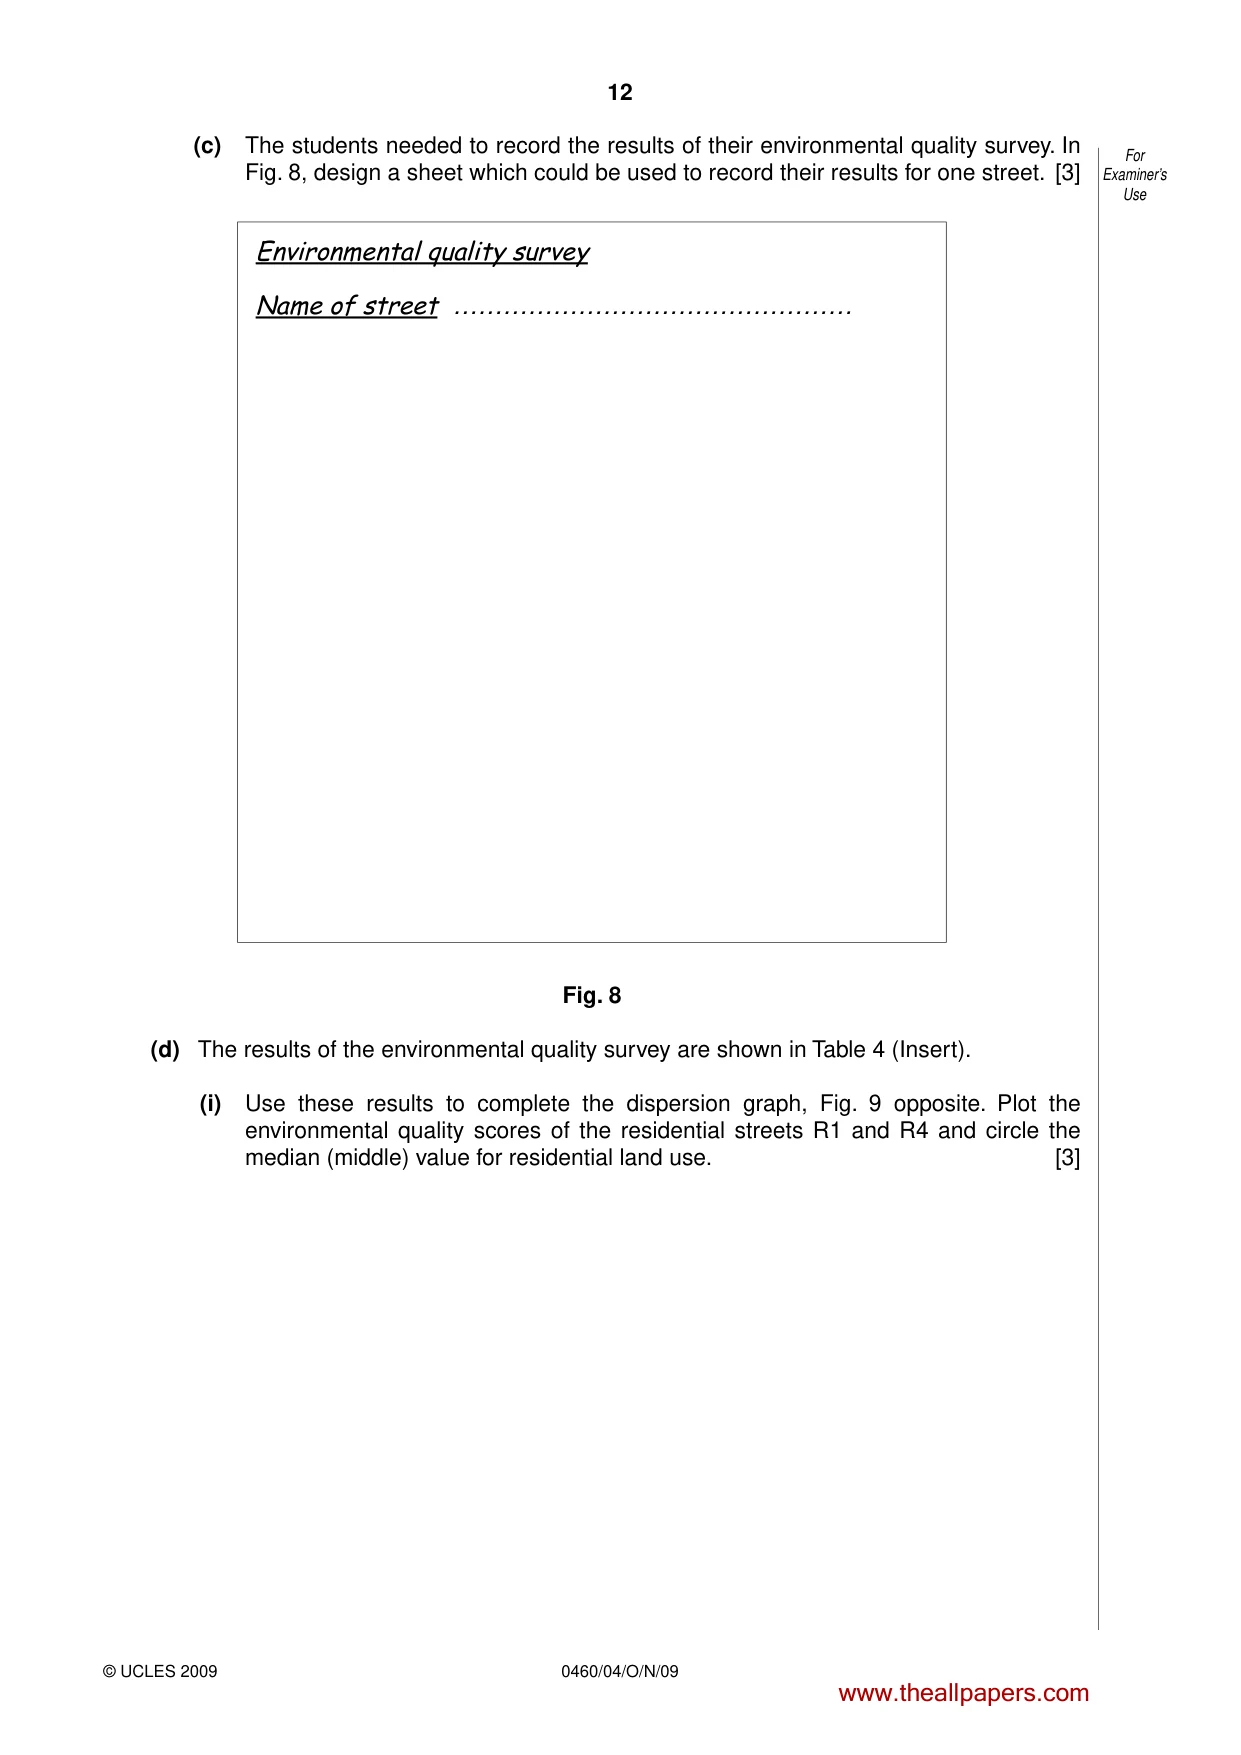
12 0460/04/O/N/09 © UCLES 2009 For Examiner’s Use (c) The students needed to record the results of their environmental quality survey. In Fig. 8, design a sheet which could be used to record their results for one street. [3] Environmental quality survey Name of street ………………………………………… Fig. 8 (d) The results of the environmental quality survey are shown in Table 4 (Insert). (i) Use these results to complete the dispersion graph, Fig. 9 opposite. Plot the environmental quality scores of the residential streets R1 and R4 and circle the median (middle) value for residential land use. [3] www.theallpapers.com
Question paper, page 13
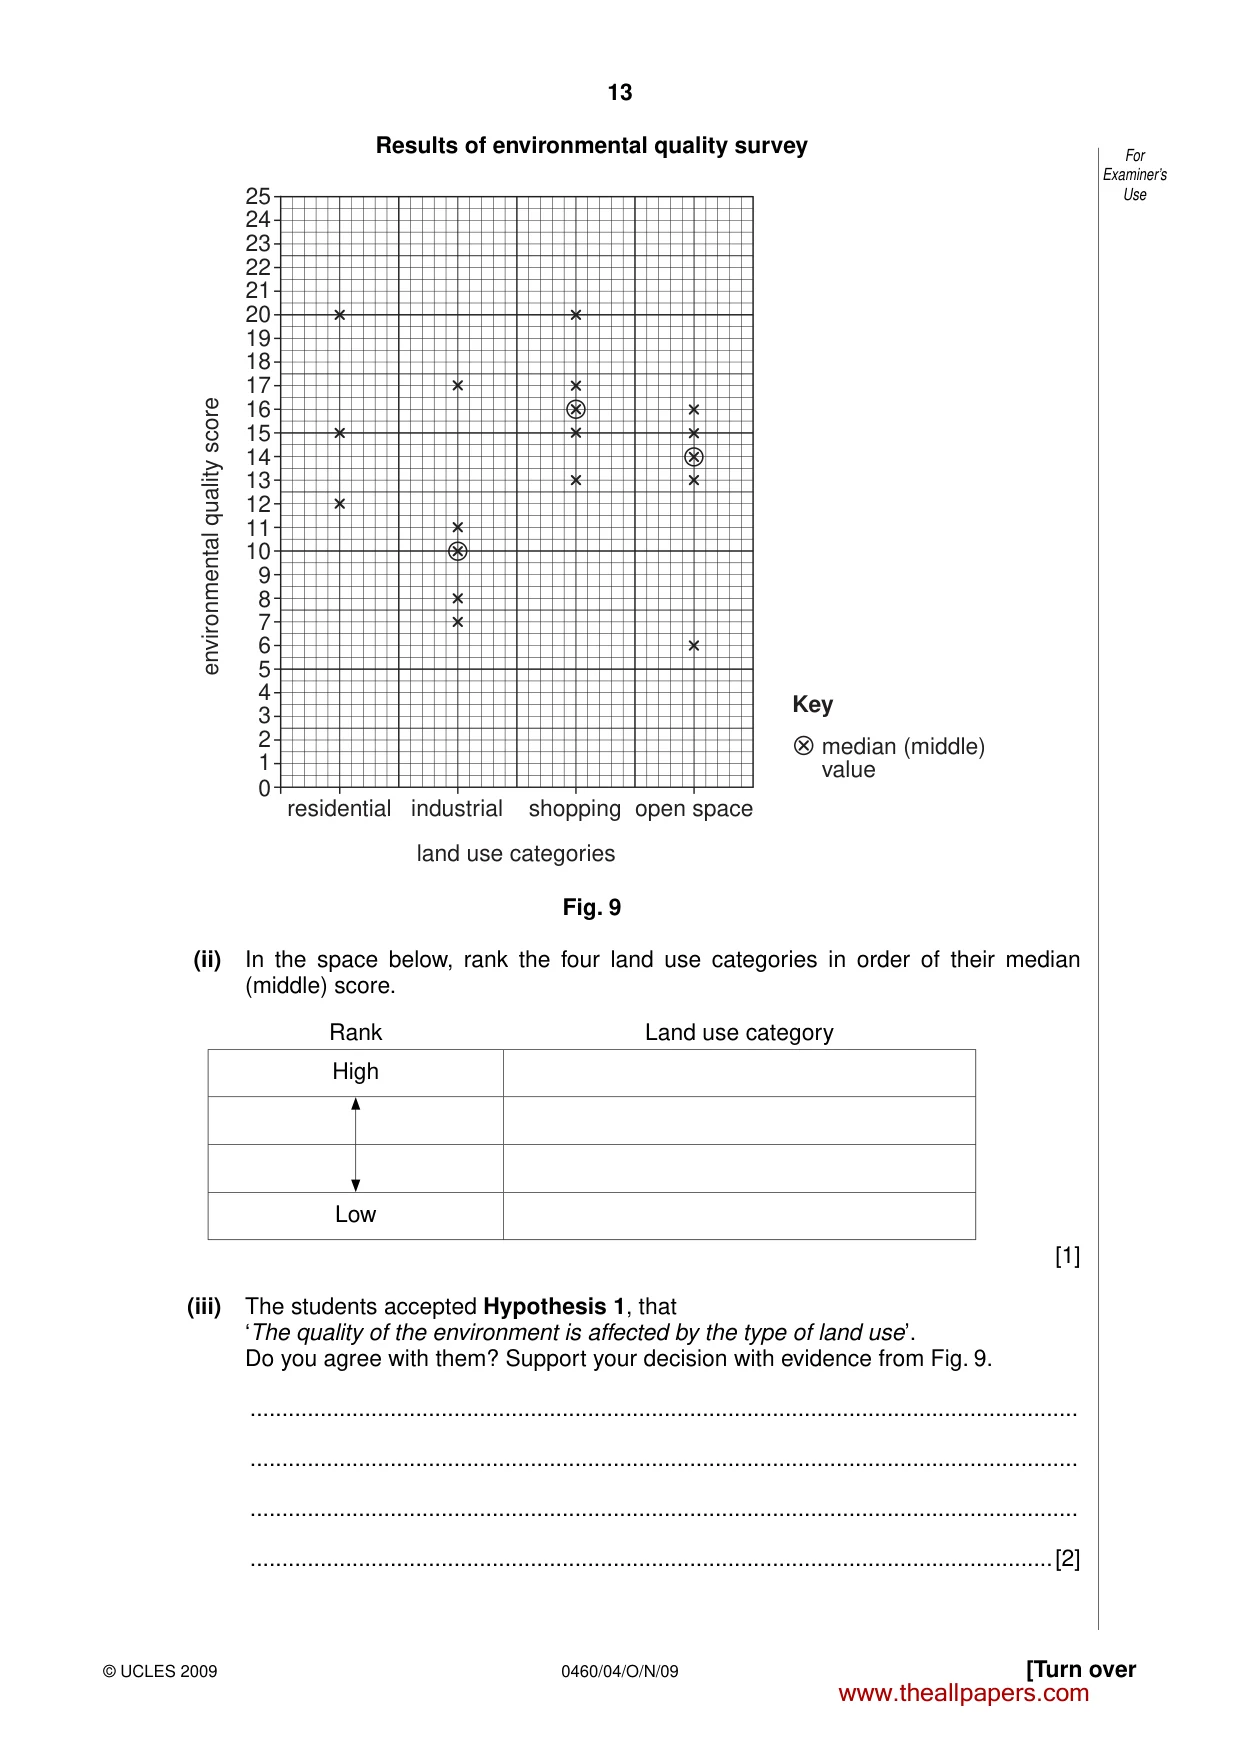
13 0460/04/O/N/09 © UCLES 2009 [Turn over For Examiner’s Use Results of environmental quality survey 0 1 2 3 4 residential industrial land use categories shopping open space median (middle) value Key 5 6 7 8 9 10 11 13 12 14 15 17 16 18 20 19 21 22 23 24 25 environmental quality score Fig. 9 (ii) In the space below, rank the four land use categories in order of their median (middle) score. Rank Land use category High Low [1] (iii) The students accepted Hypothesis 1, that ‘The quality of the environment is affected by the type of land use’. Do you agree with them? Support your decision with evidence from Fig. 9. … … … …[2] www.theallpapers.com
Question paper, page 14
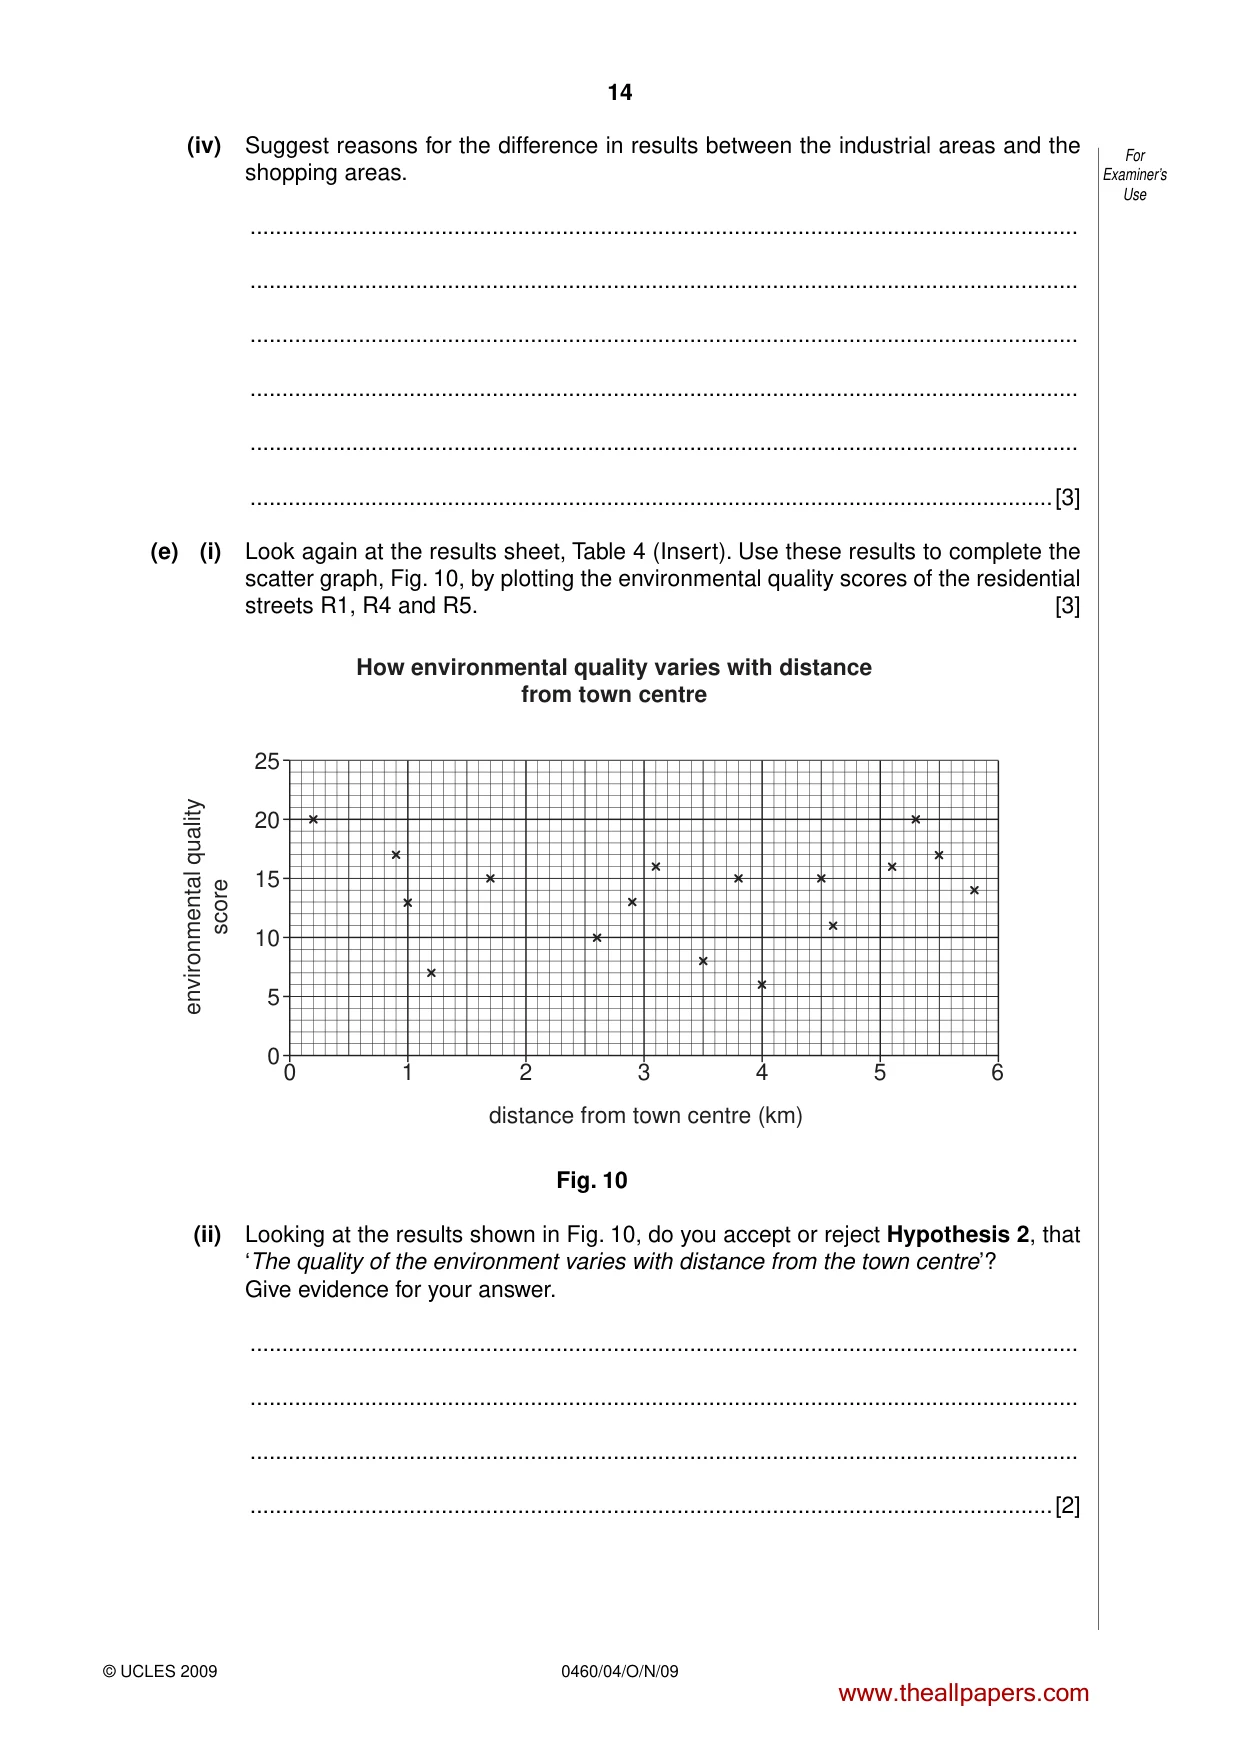
14 0460/04/O/N/09 © UCLES 2009 For Examiner’s Use (iv) Suggest reasons for the difference in results between the industrial areas and the shopping areas. … … … … … …[3] (e) (i) Look again at the results sheet, Table 4 (Insert). Use these results to complete the scatter graph, Fig. 10, by plotting the environmental quality scores of the residential streets R1, R4 and R5. [3] 1 0 5 10 15 20 25 2 0 3 4 5 6 distance from town centre (km) How environmental quality varies with distance from town centre environmental quality score Fig. 10 (ii) Looking at the results shown in Fig. 10, do you accept or reject Hypothesis 2, that ‘The quality of the environment varies with distance from the town centre’? Give evidence for your answer. … … … …[2] www.theallpapers.com
Question paper, page 15
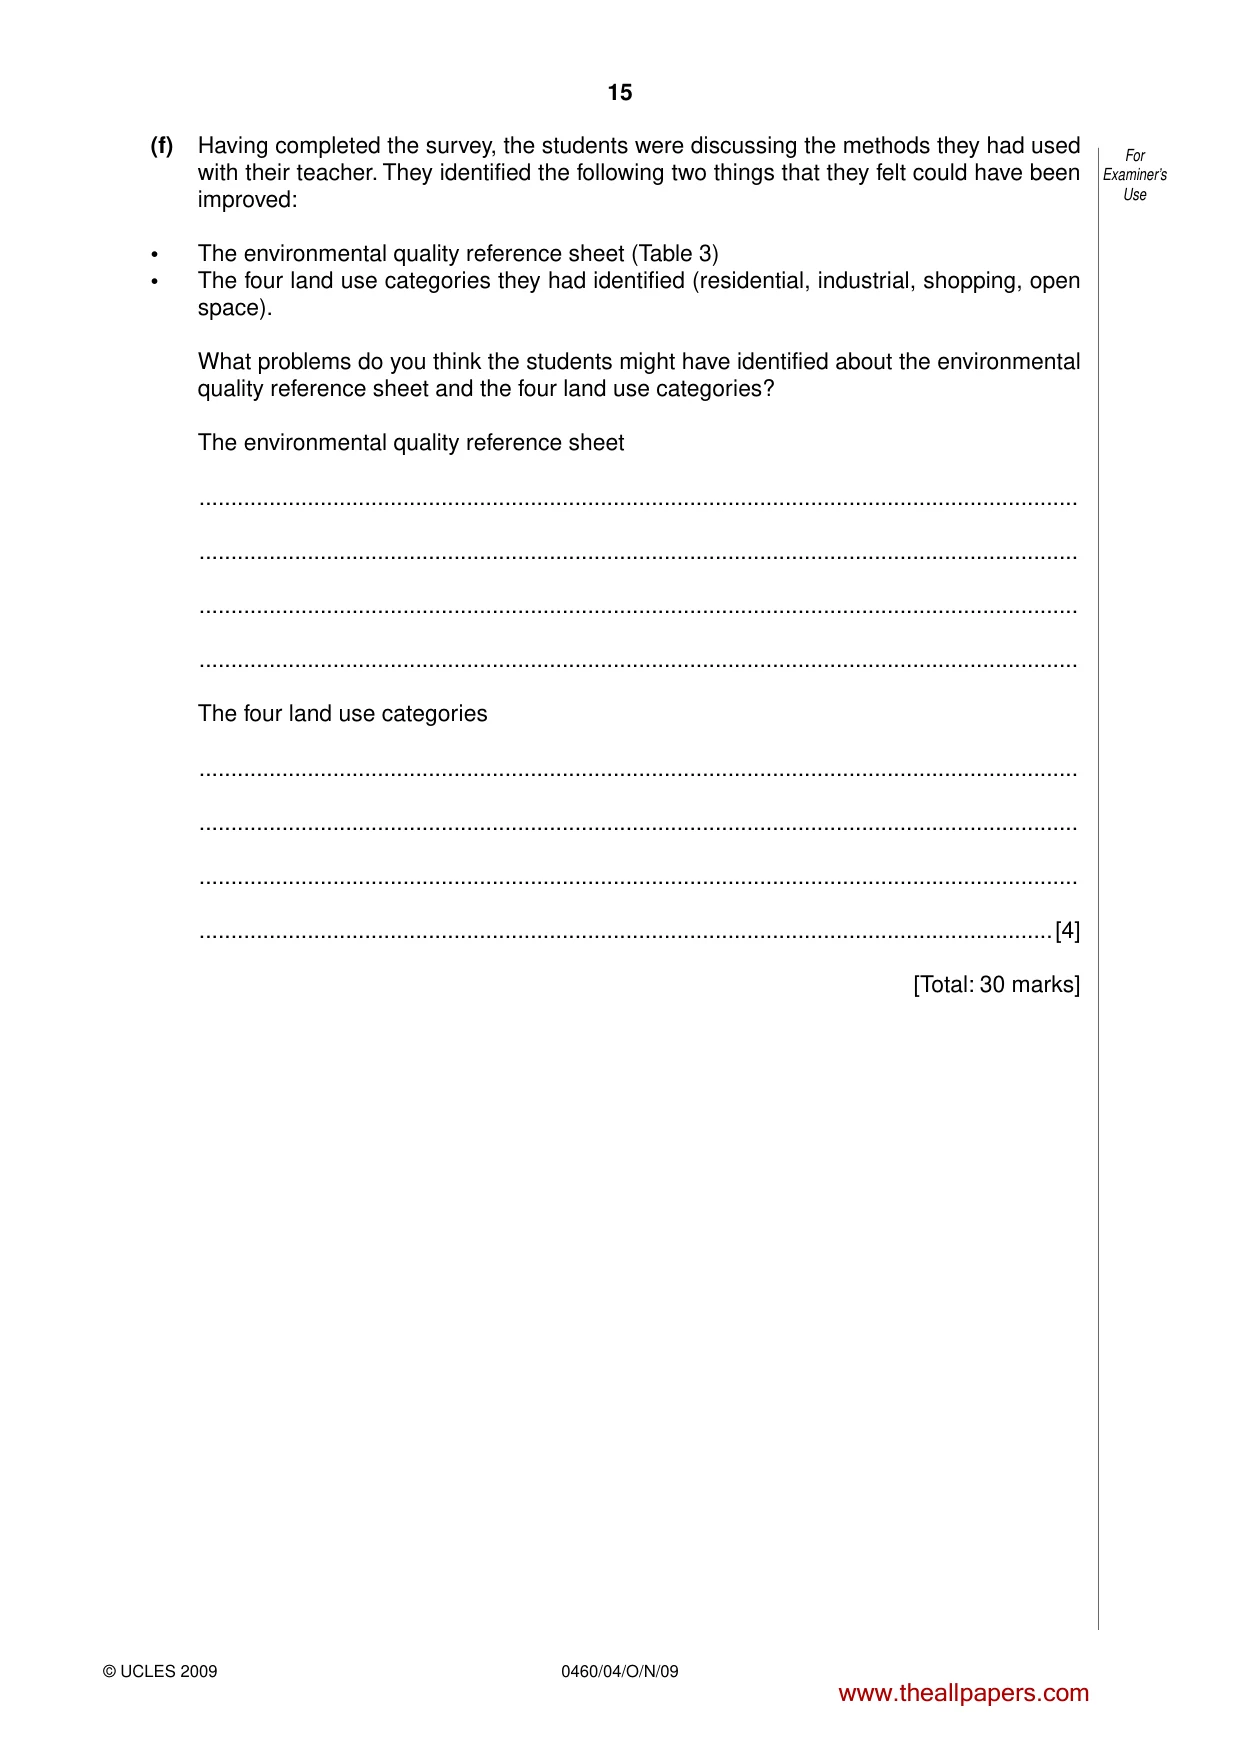
15 0460/04/O/N/09 © UCLES 2009 For Examiner’s Use (f) Having completed the survey, the students were discussing the methods they had used with their teacher. They identified the following two things that they felt could have been improved: • The environmental quality reference sheet (Table 3) • The four land use categories they had identified (residential, industrial, shopping, open space). What problems do you think the students might have identified about the environmental quality reference sheet and the four land use categories? The environmental quality reference sheet … … … … The four land use categories … … … …[4] [Total: 30 marks] www.theallpapers.com
Question paper, page 16
16 0460/04/O/N/09 BLANK PAGE Permission to reproduce items where third-party owned material protected by copyright is included has been sought and cleared where possible. Every reasonable effort has been made by the publisher (UCLES) to trace copyright holders, but if any items requiring clearance have unwittingly been included, the publisher will be pleased to make amends at the earliest possible opportunity. University of Cambridge International Examinations is part of the Cambridge Assessment Group. Cambridge Assessment is the brand name of University of Cambridge Local Examinations Syndicate (UCLES), which is itself a department of the University of Cambridge. www.theallpapers.com
Mark scheme, page 1
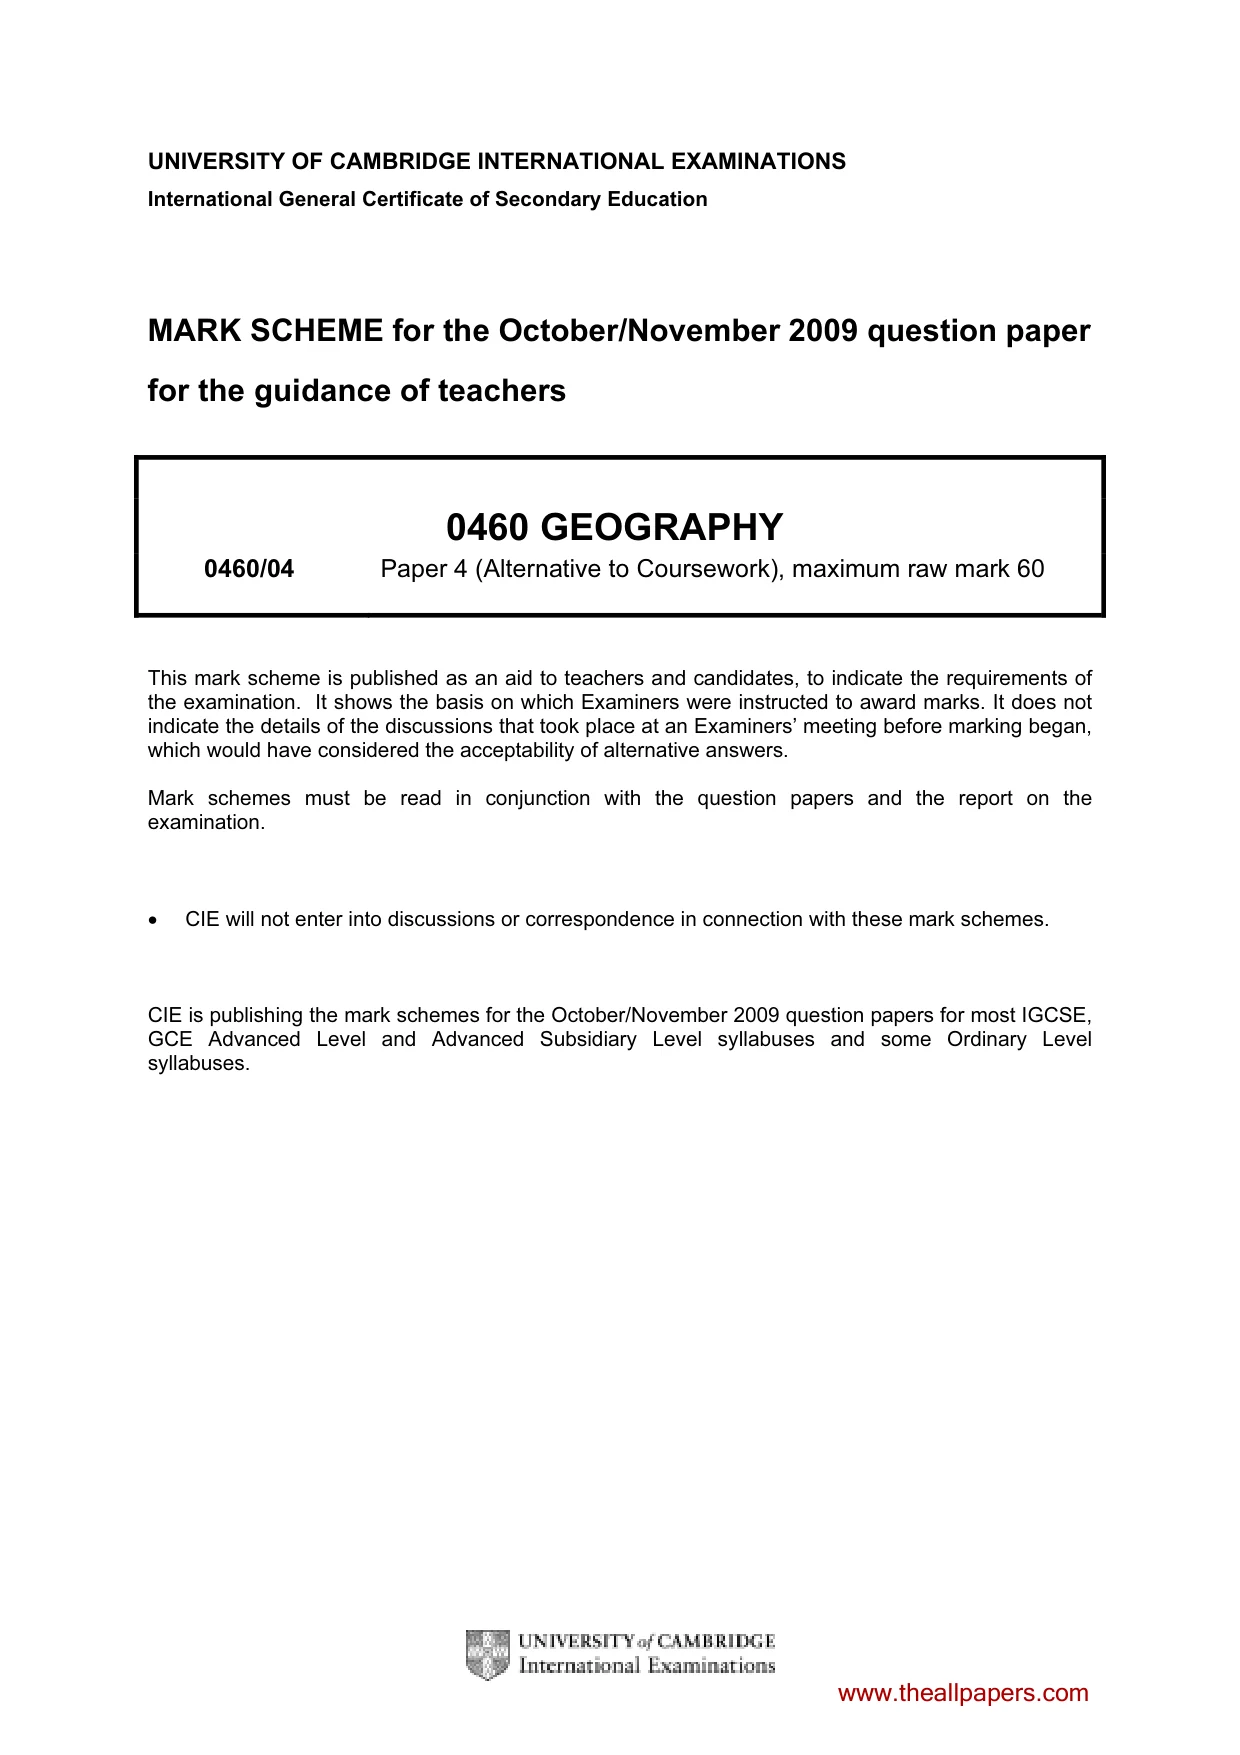
UNIVERSITY OF CAMBRIDGE INTERNATIONAL EXAMINATIONS International General Certificate of Secondary Education MARK SCHEME for the October/November 2009 question paper for the guidance of teachers 0460 GEOGRAPHY 0460/04 Paper 4 (Alternative to Coursework), maximum raw mark 60 This mark scheme is published as an aid to teachers and candidates, to indicate the requirements of the examination. It shows the basis on which Examiners were instructed to award marks. It does not indicate the details of the discussions that took place at an Examiners’ meeting before marking began, which would have considered the acceptability of alternative answers. Mark schemes must be read in conjunction with the question papers and the report on the examination. • CIE will not enter into discussions or correspondence in connection with these mark schemes. CIE is publishing the mark schemes for the October/November 2009 question papers for most IGCSE, GCE Advanced Level and Advanced Subsidiary Level syllabuses and some Ordinary Level syllabuses. www.theallpapers.com
Mark scheme, page 2
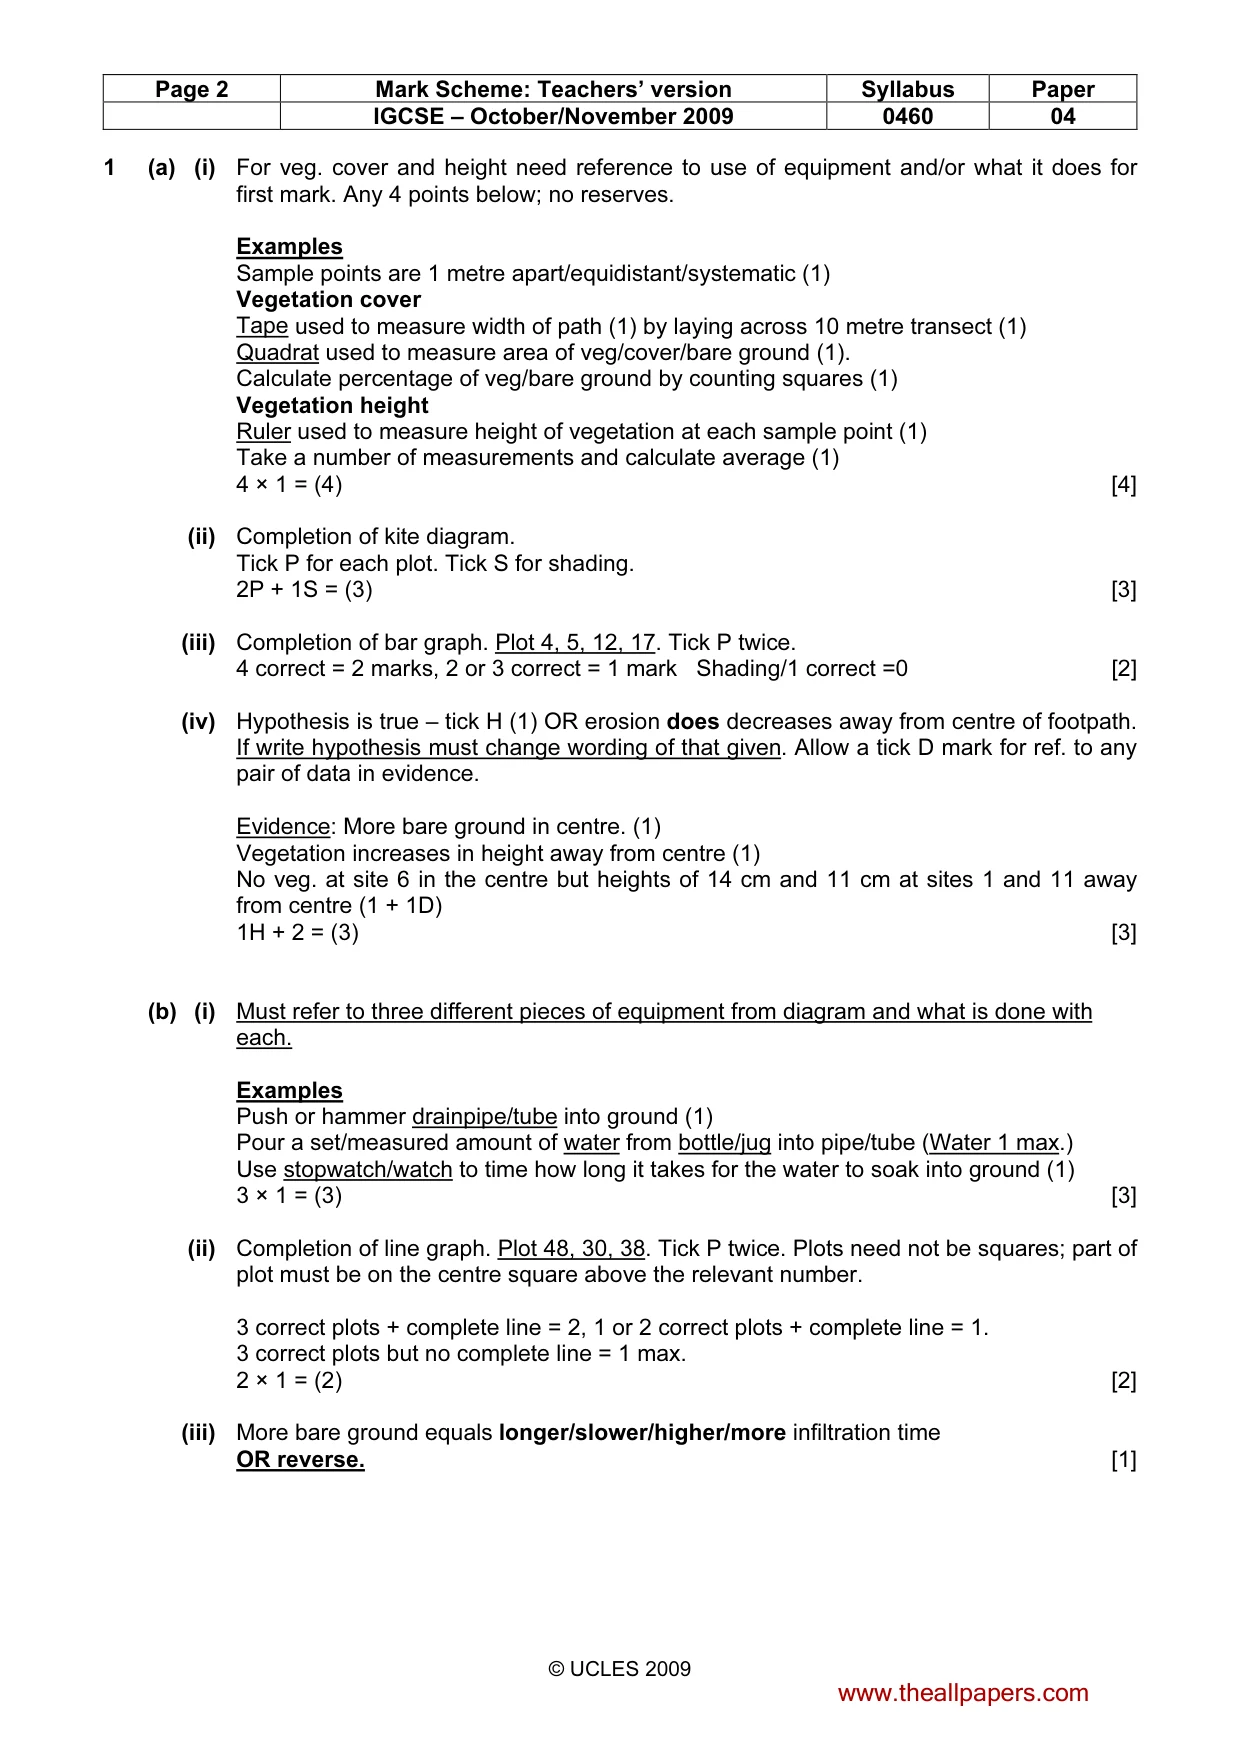
Page 2 Mark Scheme: Teachers’ version Syllabus Paper IGCSE – October/November 2009 0460 04 © UCLES 2009 1 (a) (i) For veg. cover and height need reference to use of equipment and/or what it does for first mark. Any 4 points below; no reserves. Examples Sample points are 1 metre apart/equidistant/systematic (1) Vegetation cover Tape used to measure width of path (1) by laying across 10 metre transect (1) Quadrat used to measure area of veg/cover/bare ground (1). Calculate percentage of veg/bare ground by counting squares (1) Vegetation height Ruler used to measure height of vegetation at each sample point (1) Take a number of measurements and calculate average (1) 4 × 1 = (4) [4] (ii) Completion of kite diagram. Tick P for each plot. Tick S for shading. 2P + 1S = (3) [3] (iii) Completion of bar graph. Plot 4, 5, 12, 17. Tick P twice. 4 correct = 2 marks, 2 or 3 correct = 1 mark Shading/1 correct =0 [2] (iv) Hypothesis is true – tick H (1) OR erosion does decreases away from centre of footpath. If write hypothesis must change wording of that given. Allow a tick D mark for ref. to any pair of data in evidence. Evidence: More bare ground in centre. (1) Vegetation increases in height away from centre (1) No veg. at site 6 in the centre but heights of 14 cm and 11 cm at sites 1 and 11 away from centre (1 + 1D) 1H + 2 = (3) [3] (b) (i) Must refer to three different pieces of equipment from diagram and what is done with each. Examples Push or hammer drainpipe/tube into ground (1) Pour a set/measured amount of water from bottle/jug into pipe/tube (Water 1 max.) Use stopwatch/watch to time how long it takes for the water to soak into ground (1) 3 × 1 = (3) [3] (ii) Completion of line graph. Plot 48, 30, 38. Tick P twice. Plots need not be squares; part of plot must be on the centre square above the relevant number. 3 correct plots + complete line = 2, 1 or 2 correct plots + complete line = 1. 3 correct plots but no complete line = 1 max. 2 × 1 = (2) [2] (iii) More bare ground equals longer/slower/higher/more infiltration time OR reverse. [1] www.theallpapers.com
Mark scheme, page 3
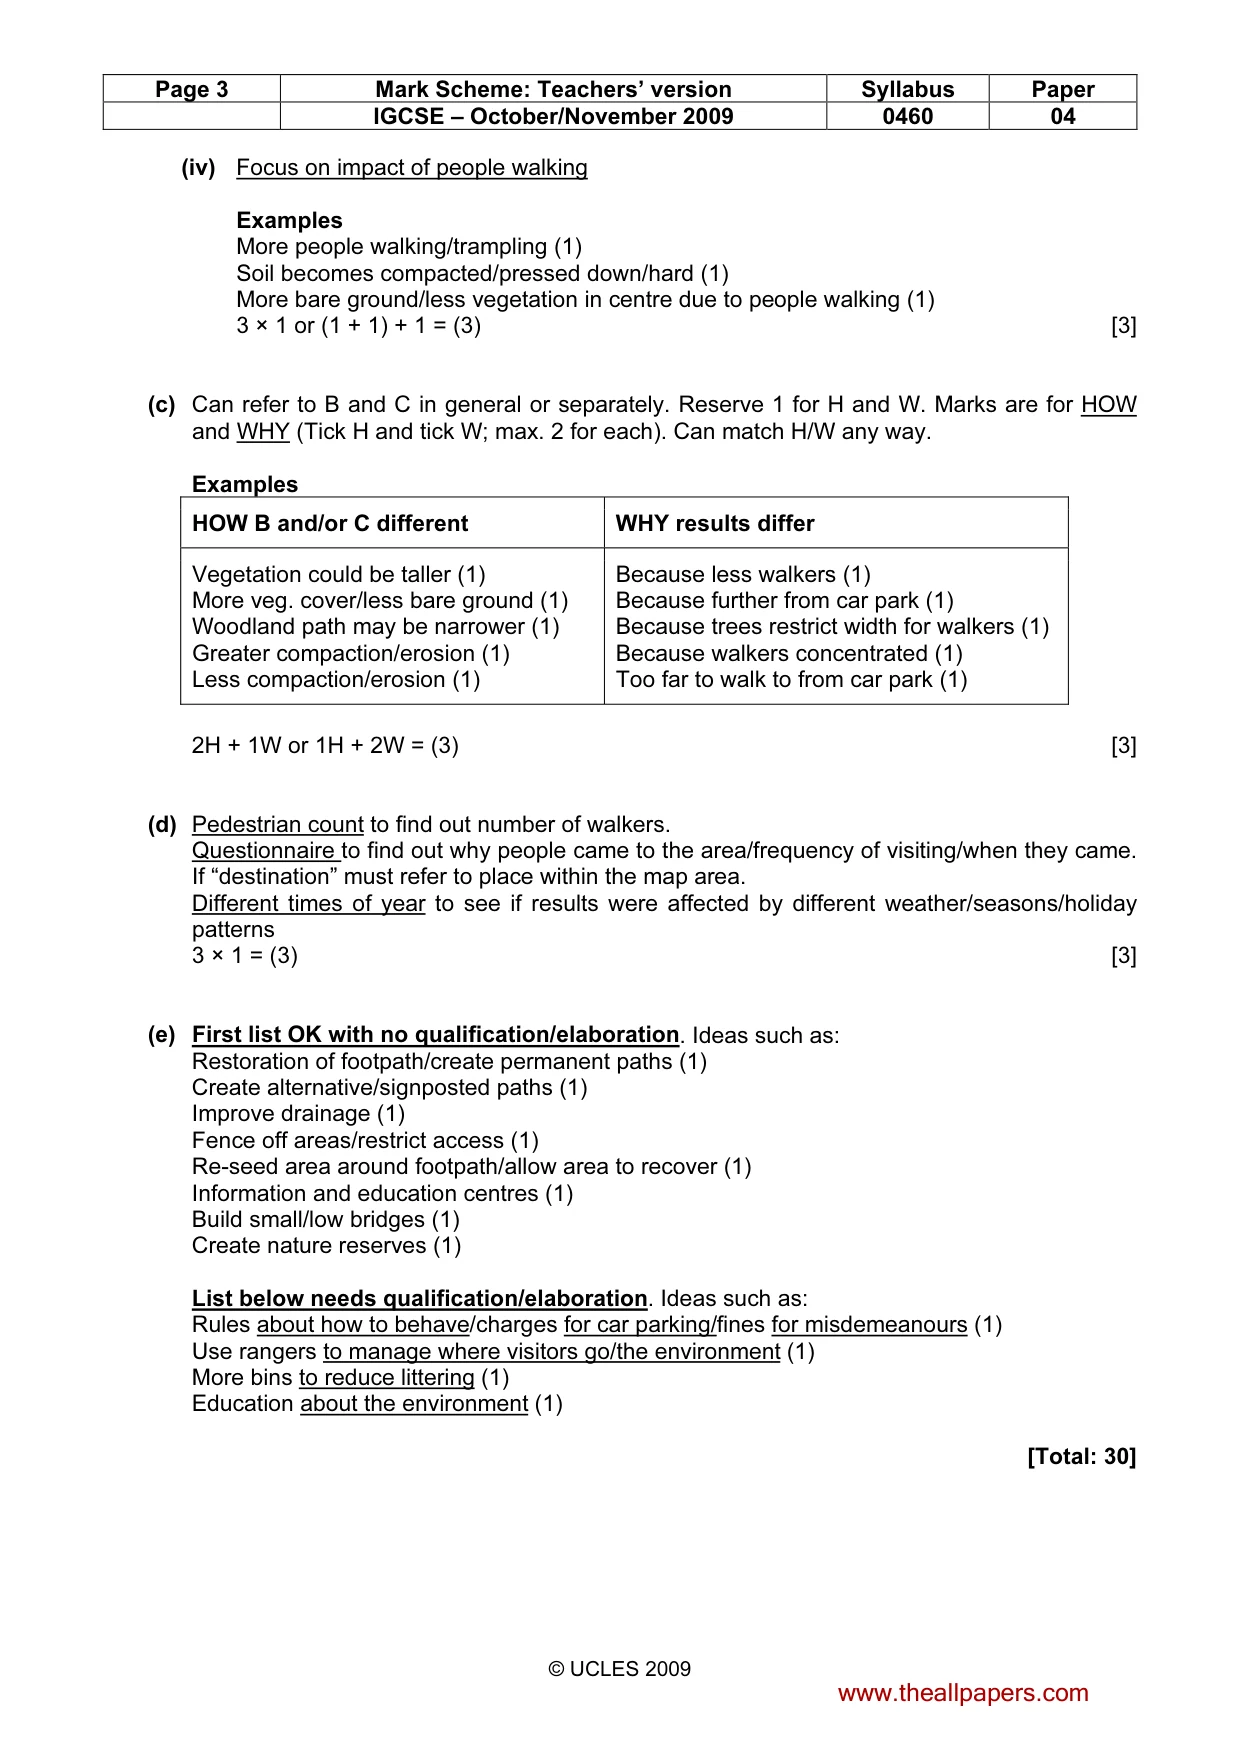
Page 3 Mark Scheme: Teachers’ version Syllabus Paper IGCSE – October/November 2009 0460 04 © UCLES 2009 (iv) Focus on impact of people walking Examples More people walking/trampling (1) Soil becomes compacted/pressed down/hard (1) More bare ground/less vegetation in centre due to people walking (1) 3 × 1 or (1 + 1) + 1 = (3) [3] (c) Can refer to B and C in general or separately. Reserve 1 for H and W. Marks are for HOW and WHY (Tick H and tick W; max. 2 for each). Can match H/W any way. Examples HOW B and/or C different WHY results differ Vegetation could be taller (1) More veg. cover/less bare ground (1) Woodland path may be narrower (1) Greater compaction/erosion (1) Less compaction/erosion (1) Because less walkers (1) Because further from car park (1) Because trees restrict width for walkers (1) Because walkers concentrated (1) Too far to walk to from car park (1) 2H + 1W or 1H + 2W = (3) [3] (d) Pedestrian count to find out number of walkers. Questionnaire to find out why people came to the area/frequency of visiting/when they came. If “destination” must refer to place within the map area. Different times of year to see if results were affected by different weather/seasons/holiday patterns 3 × 1 = (3) [3] (e) First list OK with no qualification/elaboration. Ideas such as: Restoration of footpath/create permanent paths (1) Create alternative/signposted paths (1) Improve drainage (1) Fence off areas/restrict access (1) Re-seed area around footpath/allow area to recover (1) Information and education centres (1) Build small/low bridges (1) Create nature reserves (1) List below needs qualification/elaboration. Ideas such as: Rules about how to behave/charges for car parking/fines for misdemeanours (1) Use rangers to manage where visitors go/the environment (1) More bins to reduce littering (1) Education about the environment (1) [Total: 30] www.theallpapers.com
Mark scheme, page 4
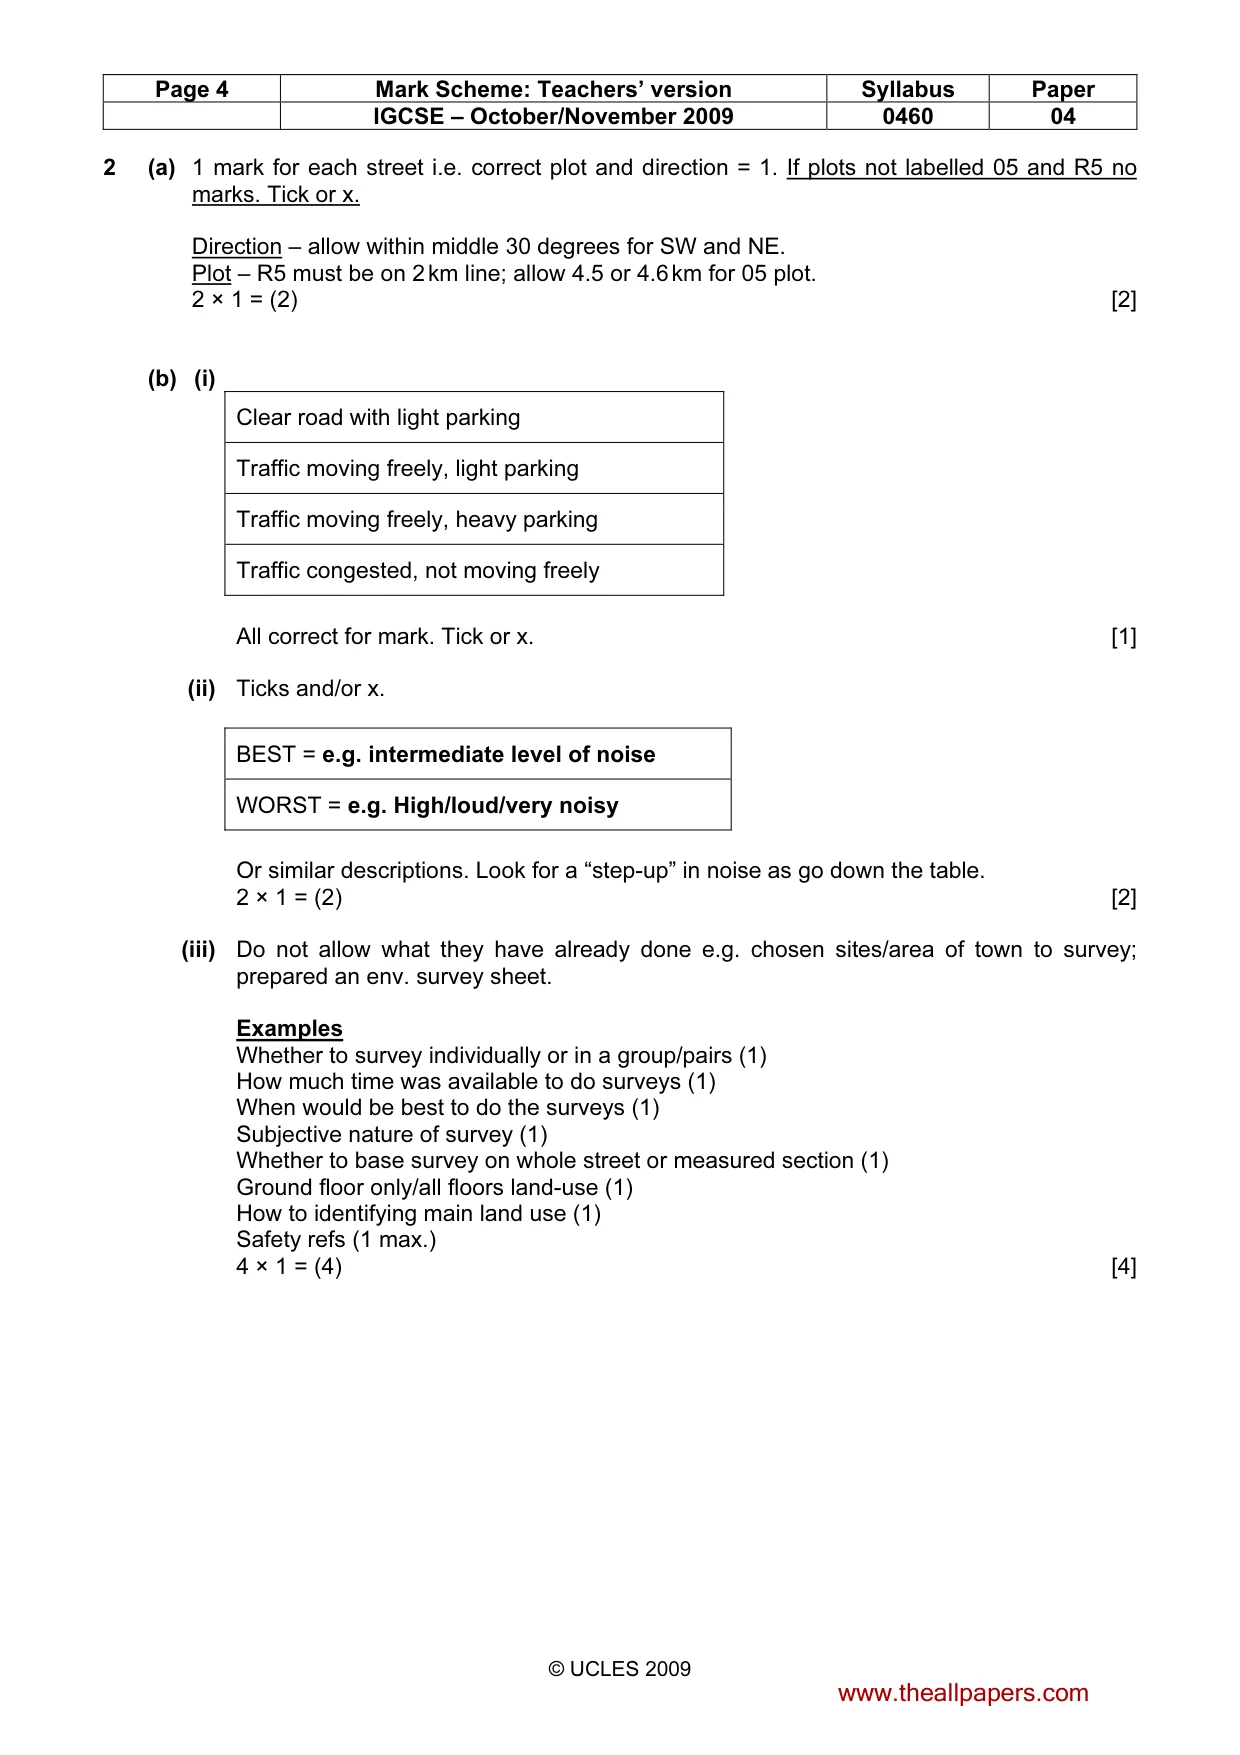
Page 4 Mark Scheme: Teachers’ version Syllabus Paper IGCSE – October/November 2009 0460 04 © UCLES 2009 2 (a) 1 mark for each street i.e. correct plot and direction = 1. If plots not labelled 05 and R5 no marks. Tick or x. Direction – allow within middle 30 degrees for SW and NE. Plot – R5 must be on 2 km line; allow 4.5 or 4.6 km for 05 plot. 2 × 1 = (2) [2] (b) (i) Clear road with light parking Traffic moving freely, light parking Traffic moving freely, heavy parking Traffic congested, not moving freely All correct for mark. Tick or x. [1] (ii) Ticks and/or x. BEST = e.g. intermediate level of noise WORST = e.g. High/loud/very noisy Or similar descriptions. Look for a “step-up” in noise as go down the table. 2 × 1 = (2) [2] (iii) Do not allow what they have already done e.g. chosen sites/area of town to survey; prepared an env. survey sheet. Examples Whether to survey individually or in a group/pairs (1) How much time was available to do surveys (1) When would be best to do the surveys (1) Subjective nature of survey (1) Whether to base survey on whole street or measured section (1) Ground floor only/all floors land-use (1) How to identifying main land use (1) Safety refs (1 max.) 4 × 1 = (4) [4] www.theallpapers.com
Mark scheme, page 5
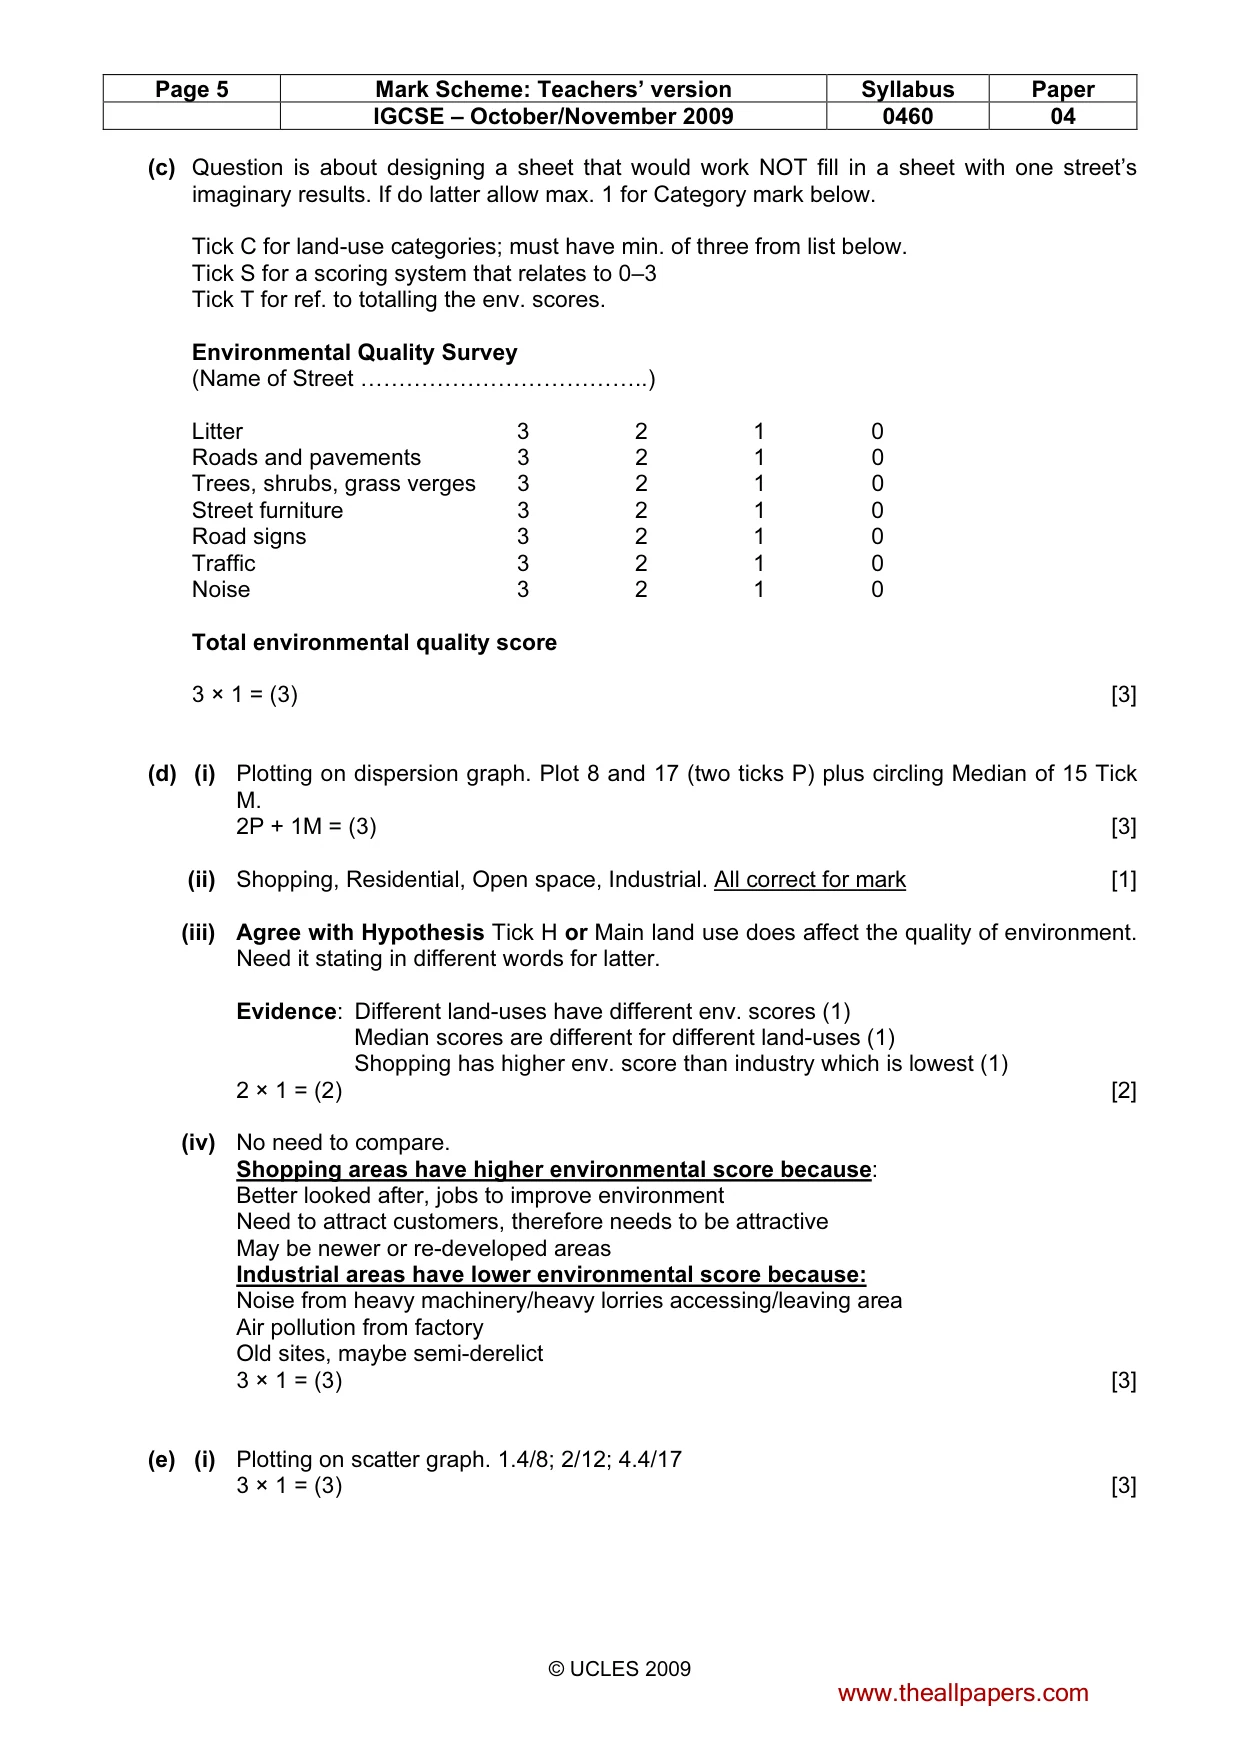
Page 5 Mark Scheme: Teachers’ version Syllabus Paper IGCSE – October/November 2009 0460 04 © UCLES 2009 (c) Question is about designing a sheet that would work NOT fill in a sheet with one street’s imaginary results. If do latter allow max. 1 for Category mark below. Tick C for land-use categories; must have min. of three from list below. Tick S for a scoring system that relates to 0–3 Tick T for ref. to totalling the env. scores. Environmental Quality Survey (Name of Street ………………………………..) Litter 3 2 1 0 Roads and pavements 3 2 1 0 Trees, shrubs, grass verges 3 2 1 0 Street furniture 3 2 1 0 Road signs 3 2 1 0 Traffic 3 2 1 0 Noise 3 2 1 0 Total environmental quality score 3 × 1 = (3) [3] (d) (i) Plotting on dispersion graph. Plot 8 and 17 (two ticks P) plus circling Median of 15 Tick M. 2P + 1M = (3) [3] (ii) Shopping, Residential, Open space, Industrial. All correct for mark [1] (iii) Agree with Hypothesis Tick H or Main land use does affect the quality of environment. Need it stating in different words for latter. Evidence: Different land-uses have different env. scores (1) Median scores are different for different land-uses (1) Shopping has higher env. score than industry which is lowest (1) 2 × 1 = (2) [2] (iv) No need to compare. Shopping areas have higher environmental score because: Better looked after, jobs to improve environment Need to attract customers, therefore needs to be attractive May be newer or re-developed areas Industrial areas have lower environmental score because: Noise from heavy machinery/heavy lorries accessing/leaving area Air pollution from factory Old sites, maybe semi-derelict 3 × 1 = (3) [3] (e) (i) Plotting on scatter graph. 1.4/8; 2/12; 4.4/17 3 × 1 = (3) [3] www.theallpapers.com
Mark scheme, page 6
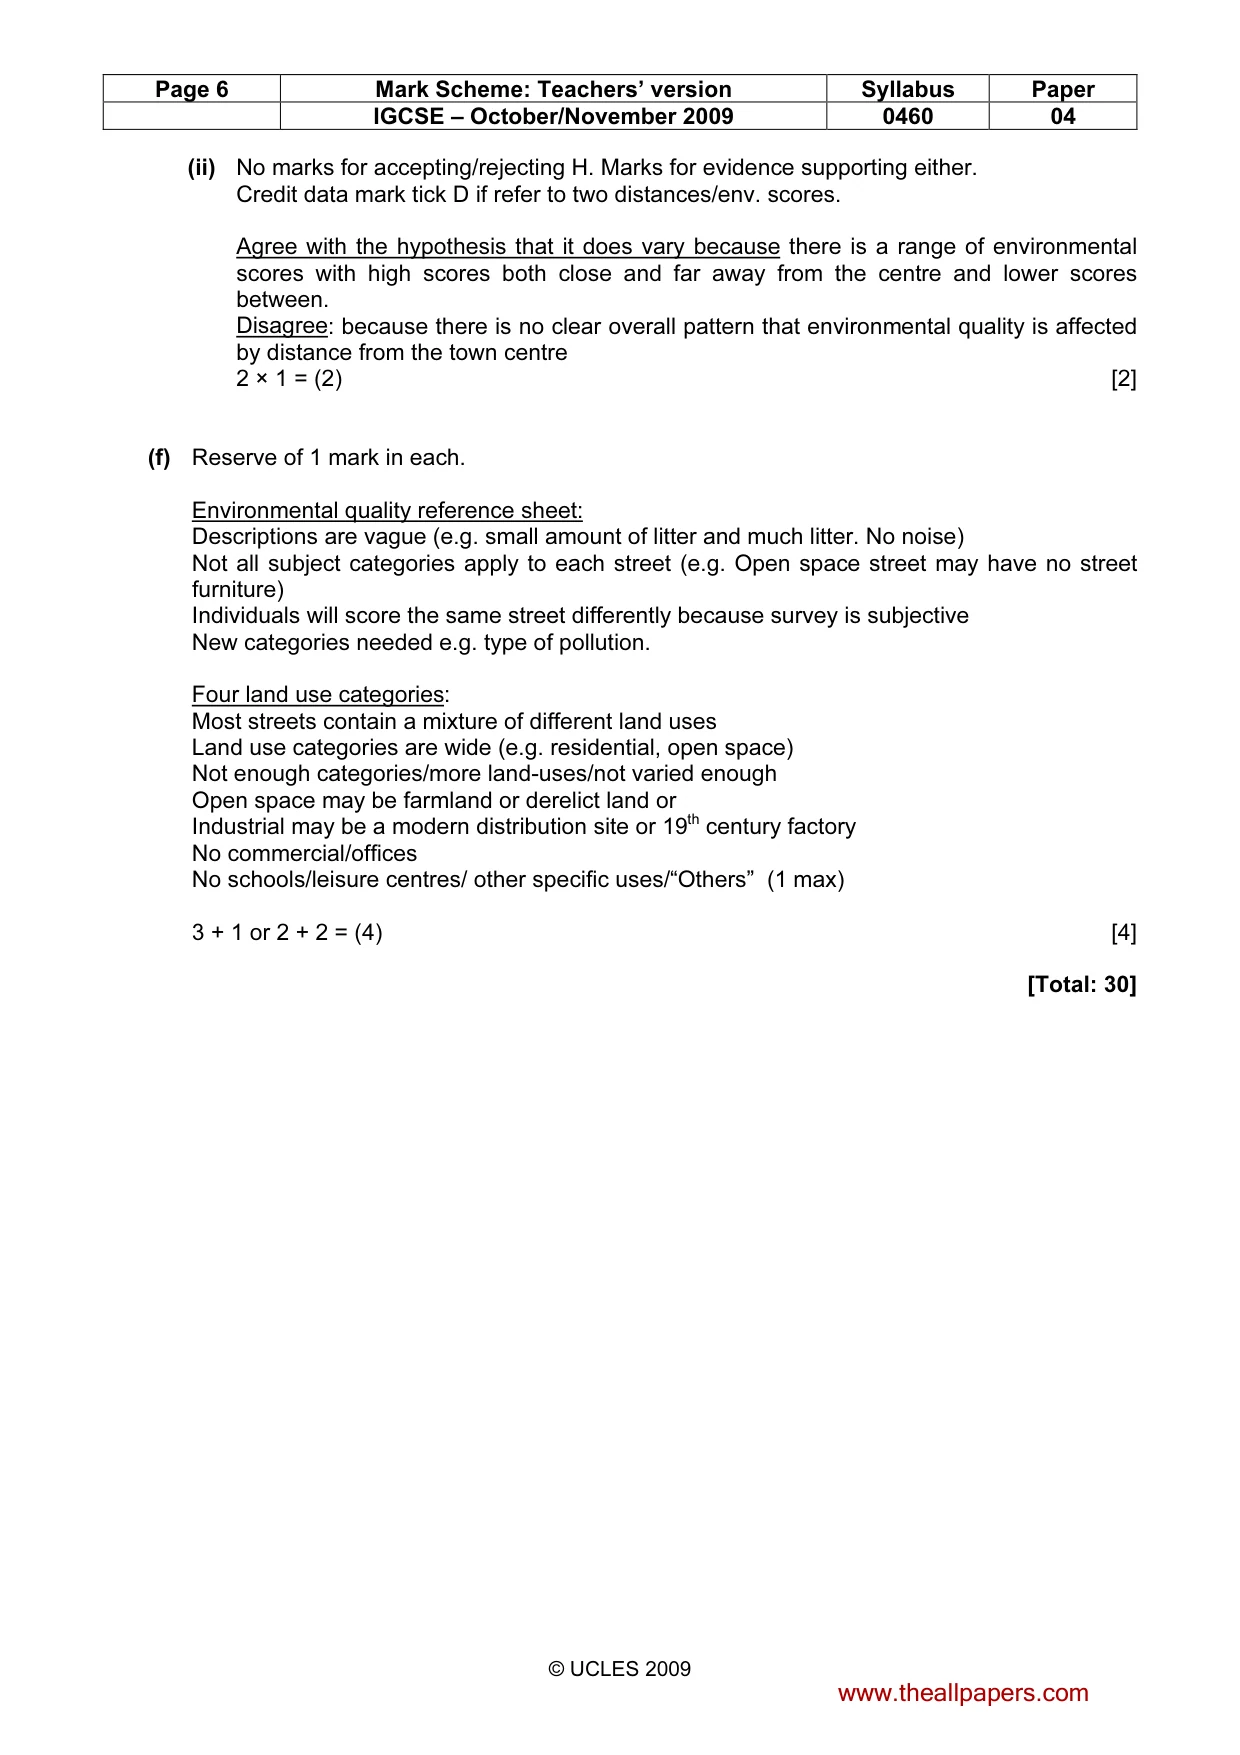
Page 6 Mark Scheme: Teachers’ version Syllabus Paper IGCSE – October/November 2009 0460 04 © UCLES 2009 (ii) No marks for accepting/rejecting H. Marks for evidence supporting either. Credit data mark tick D if refer to two distances/env. scores. Agree with the hypothesis that it does vary because there is a range of environmental scores with high scores both close and far away from the centre and lower scores between. Disagree: because there is no clear overall pattern that environmental quality is affected by distance from the town centre 2 × 1 = (2) [2] (f) Reserve of 1 mark in each. Environmental quality reference sheet: Descriptions are vague (e.g. small amount of litter and much litter. No noise) Not all subject categories apply to each street (e.g. Open space street may have no street furniture) Individuals will score the same street differently because survey is subjective New categories needed e.g. type of pollution. Four land use categories: Most streets contain a mixture of different land uses Land use categories are wide (e.g. residential, open space) Not enough categories/more land-uses/not varied enough Open space may be farmland or derelict land or Industrial may be a modern distribution site or 19th century factory No commercial/offices No schools/leisure centres/ other specific uses/“Others” (1 max) 3 + 1 or 2 + 2 = (4) [4] [Total: 30] www.theallpapers.com
What you needed in this session
Cambridge’s own grade thresholds for 2009 Oct/Nov, Paper 4 · Variant 1. A higher threshold means an easier paper — the bar moves with how the cohort did.