Cambridge IGCSE Geography 0460 — 2009 May/June Paper 4 · Variant 1
0460/41/M/J/09 · 60 marks · ≈68 min
The question paper and its mark scheme, free to read here and free to download. This is Cambridge’s own paper, exactly as it was sat.
Question paper12 pages




Mark scheme5 pages
Answers below. Sit the paper first if you are practising.

Paper as text
Question paper, page 1
This document consists of 11 printed pages, 1 blank page and 1 Insert. (DR/DR) T64673/3 © UCLES 2009 [Turn over UNIVERSITY OF CAMBRIDGE INTERNATIONAL EXAMINATIONS International General Certificate of Secondary Education READ THESE INSTRUCTIONS FIRST Write your Centre number, candidate number and name in the spaces provided. Write in dark blue or black pen. You may use a soft pencil for any diagrams, graphs or rough working. Do not use staples, paper clips, highlighters, glue or correction fluid. DO NOT WRITE IN ANY BARCODES. Answer all questions. The Insert contains Table 1 and Fig. 2 for Question 1 and Fig. 4, Table 2 and Fig. 8 for Question 2. The Insert is not required by the Examiner. Sketch maps and diagrams should be drawn whenever they serve to illustrate an answer. At the end of the examination, fasten all your work securely together. The number of marks is given in brackets [ ] at the end of each question or part question. GEOGRAPHY 0460/04 Paper 4 Alternative to Coursework May/June 2009 1 hour 30 minutes Candidates answer on the Question Paper. Additional Materials: Calculator Ruler For Examiner’s Use Q1 Q2 Total www.theallpapers.com
Question paper, page 2
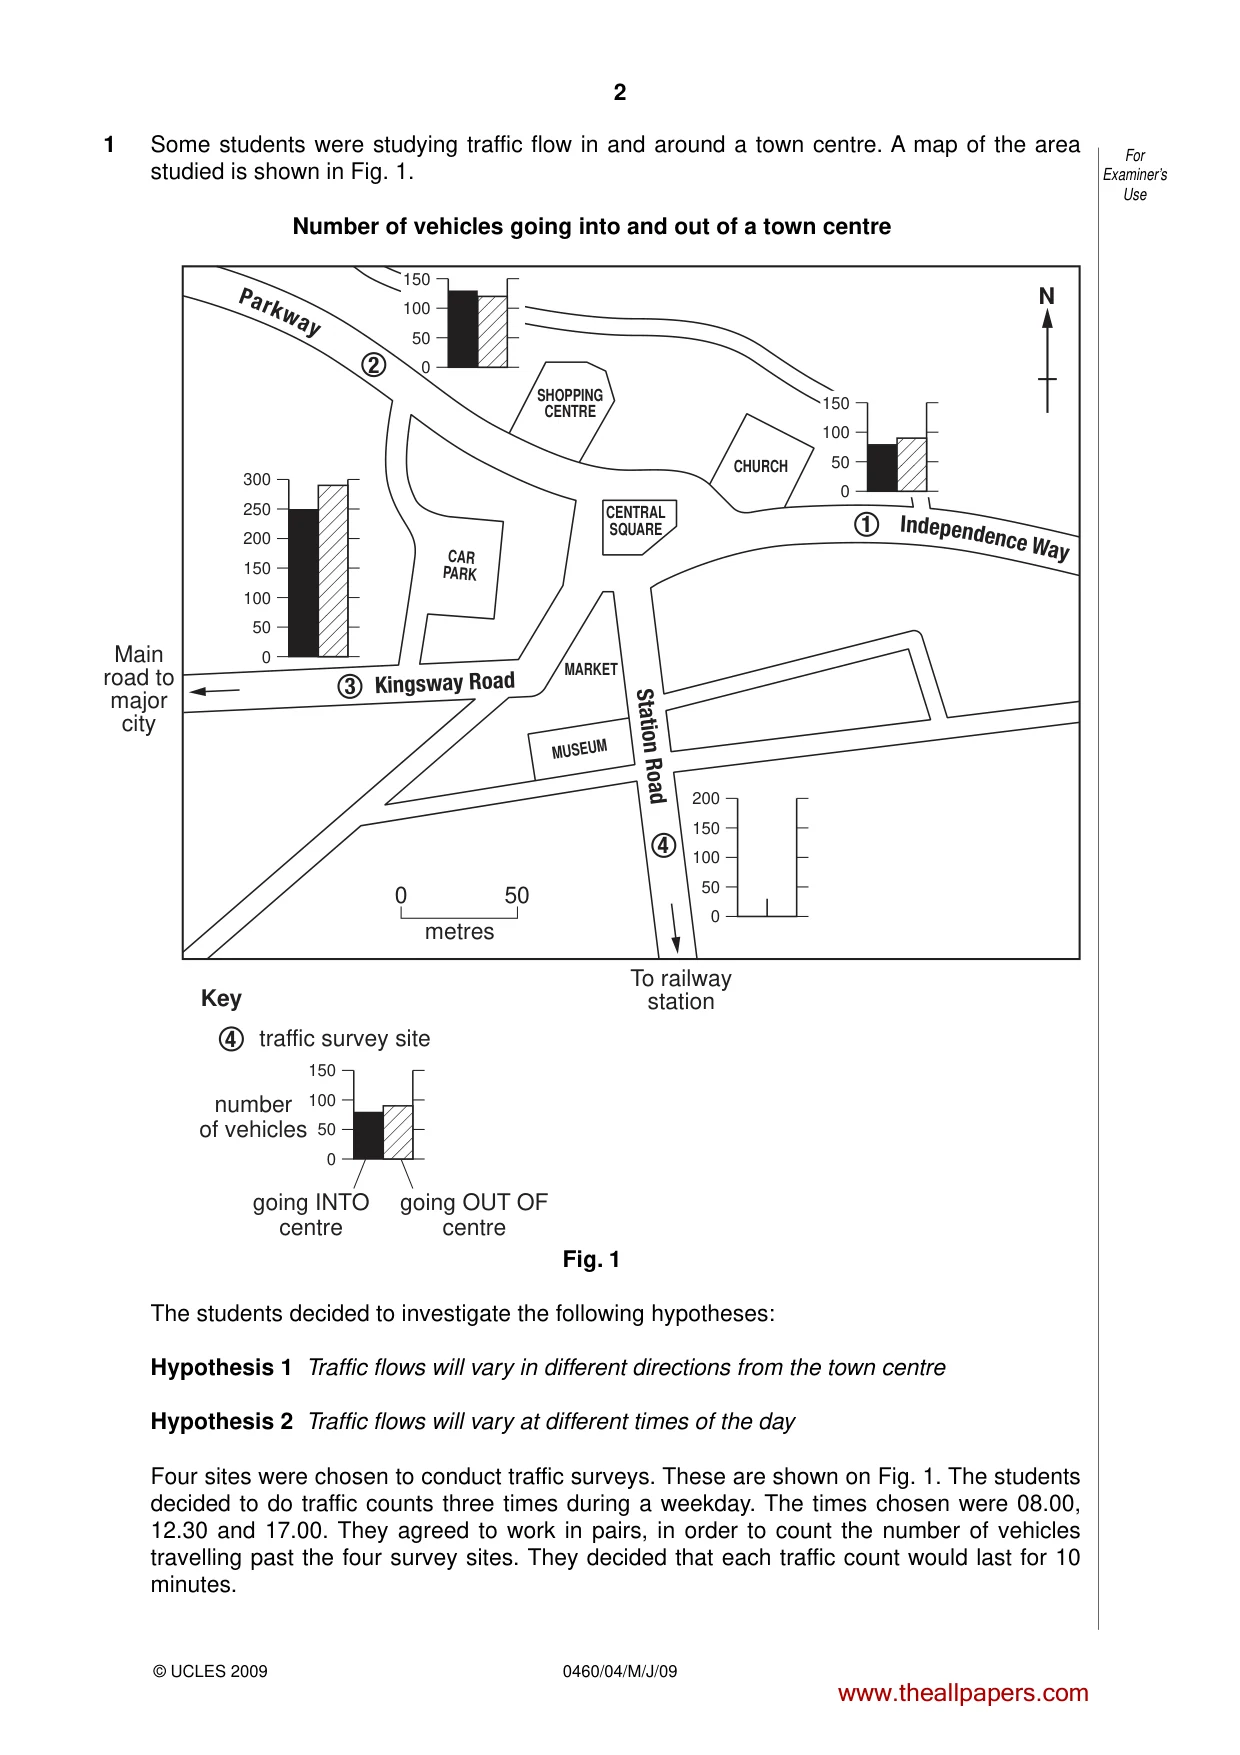
2 0460/04/M/J/09 For Examiner’s Use © UCLES 2009 1 Some students were studying traffic flow in and around a town centre. A map of the area studied is shown in Fig. 1. Number of vehicles going into and out of a town centre 2 3 4 4 1 Pa rk wa y Ind epe ndenc e Way Kingsway Road Station Road SHOPPING CENTRE CHURCH CAR PARK CENTRAL SQUARE MUSEUM MARKET Main road to major city To railway station 100 50 0 250 200 150 300 Key traffic survey site going INTO centre going OUT OF centre number of vehicles N 0 50 metres 100 50 0 200 150 100 50 0 150 100 50 0 150 100 50 0 150 Fig. 1 The students decided to investigate the following hypotheses: Hypothesis 1 Traffic flows will vary in different directions from the town centre Hypothesis 2 Traffic flows will vary at different times of the day Four sites were chosen to conduct traffic surveys. These are shown on Fig. 1. The students decided to do traffic counts three times during a weekday. The times chosen were 08.00, 12.30 and 17.00. They agreed to work in pairs, in order to count the number of vehicles travelling past the four survey sites. They decided that each traffic count would last for 10 minutes. www.theallpapers.com
Question paper, page 3
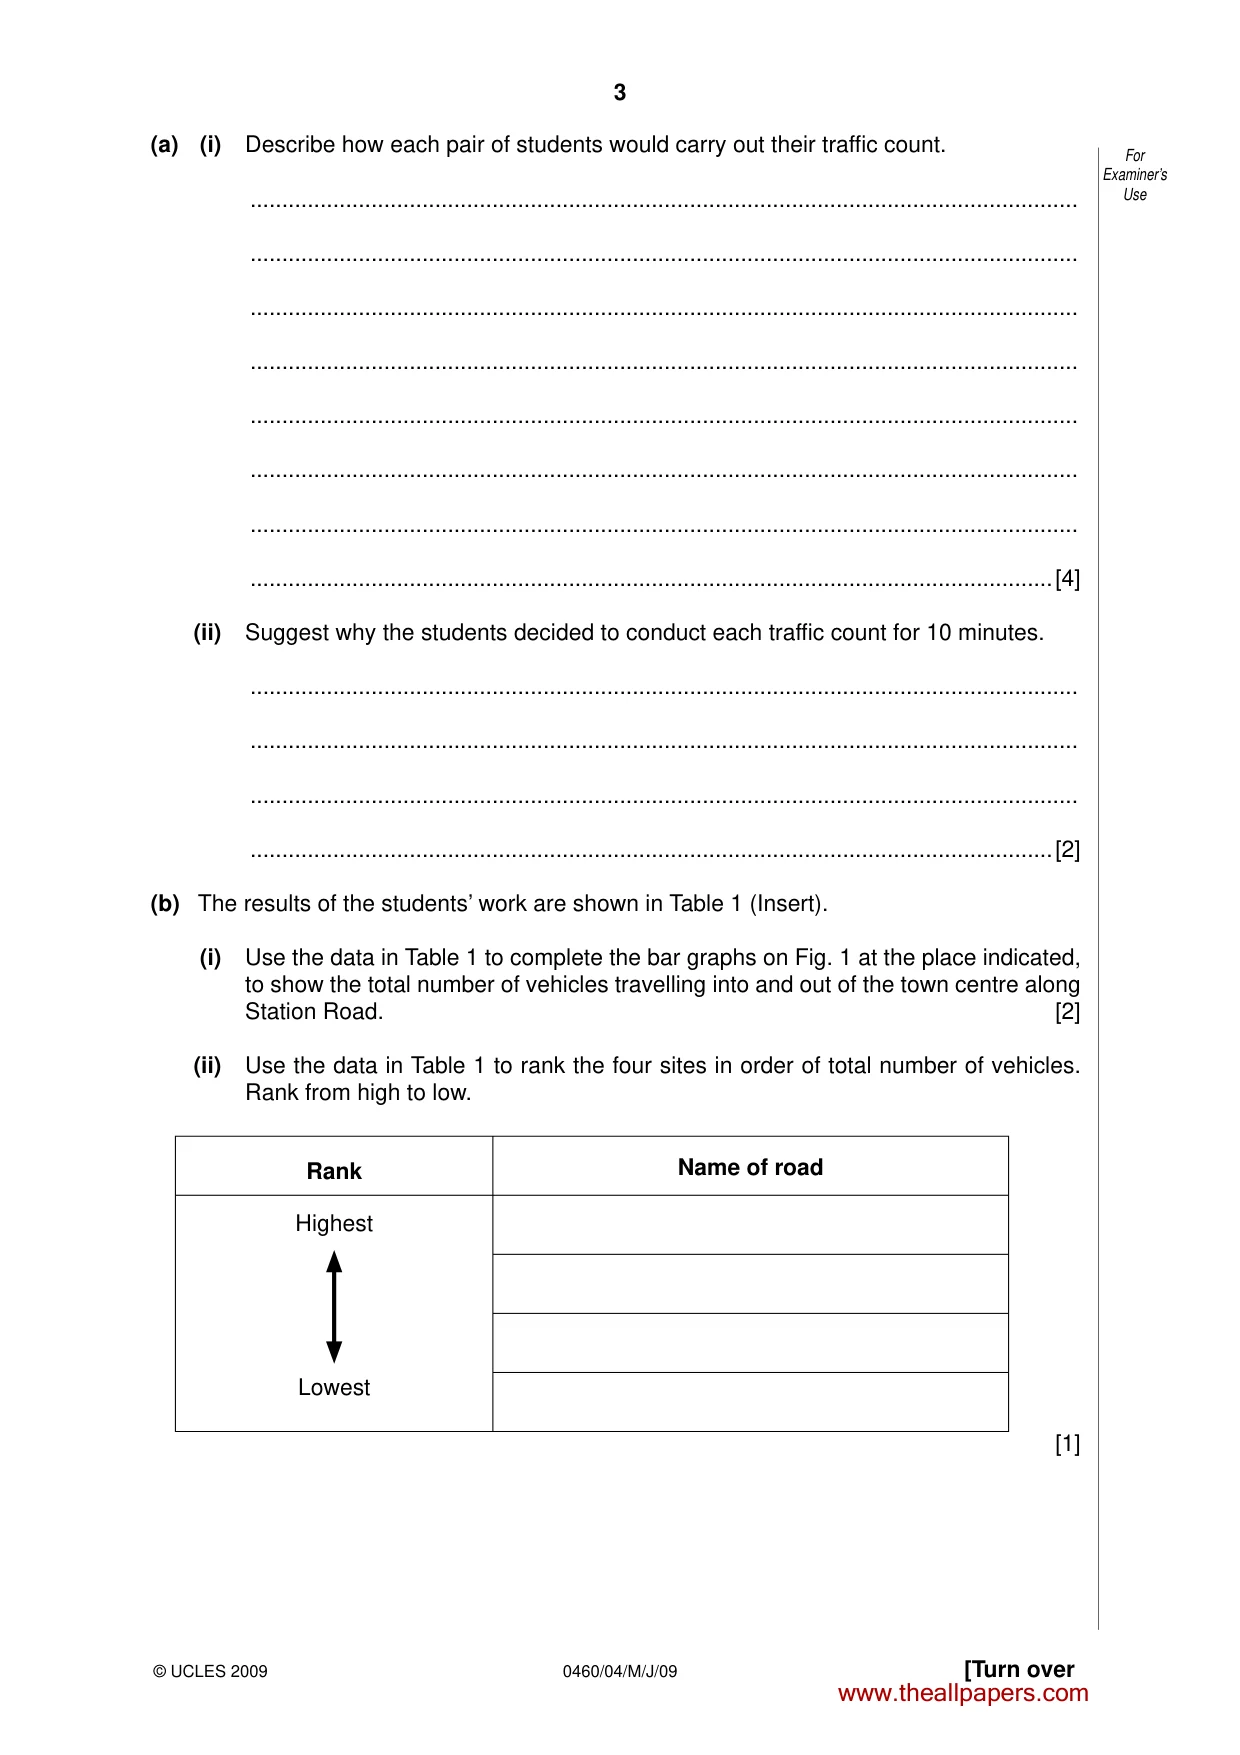
3 0460/04/M/J/09 [Turn over For Examiner’s Use © UCLES 2009 (a) (i) Describe how each pair of students would carry out their traffic count. … … … … … … … …[4] (ii) Suggest why the students decided to conduct each traffic count for 10 minutes. … … … …[2] (b) The results of the students’ work are shown in Table 1 (Insert). (i) Use the data in Table 1 to complete the bar graphs on Fig. 1 at the place indicated, to show the total number of vehicles travelling into and out of the town centre along Station Road. [2] (ii) Use the data in Table 1 to rank the four sites in order of total number of vehicles. Rank from high to low. Rank Name of road Highest Lowest [1] www.theallpapers.com
Question paper, page 4
4 0460/04/M/J/09 For Examiner’s Use © UCLES 2009 (iii) Describe the pattern of the total number of vehicles going into and out of the town centre. … … … … … …[3] (iv) What would be the students’ conclusion to Hypothesis 1, based on their results? What reasons might the students give to support their conclusion? … … … … … … … …[4] www.theallpapers.com
Question paper, page 5
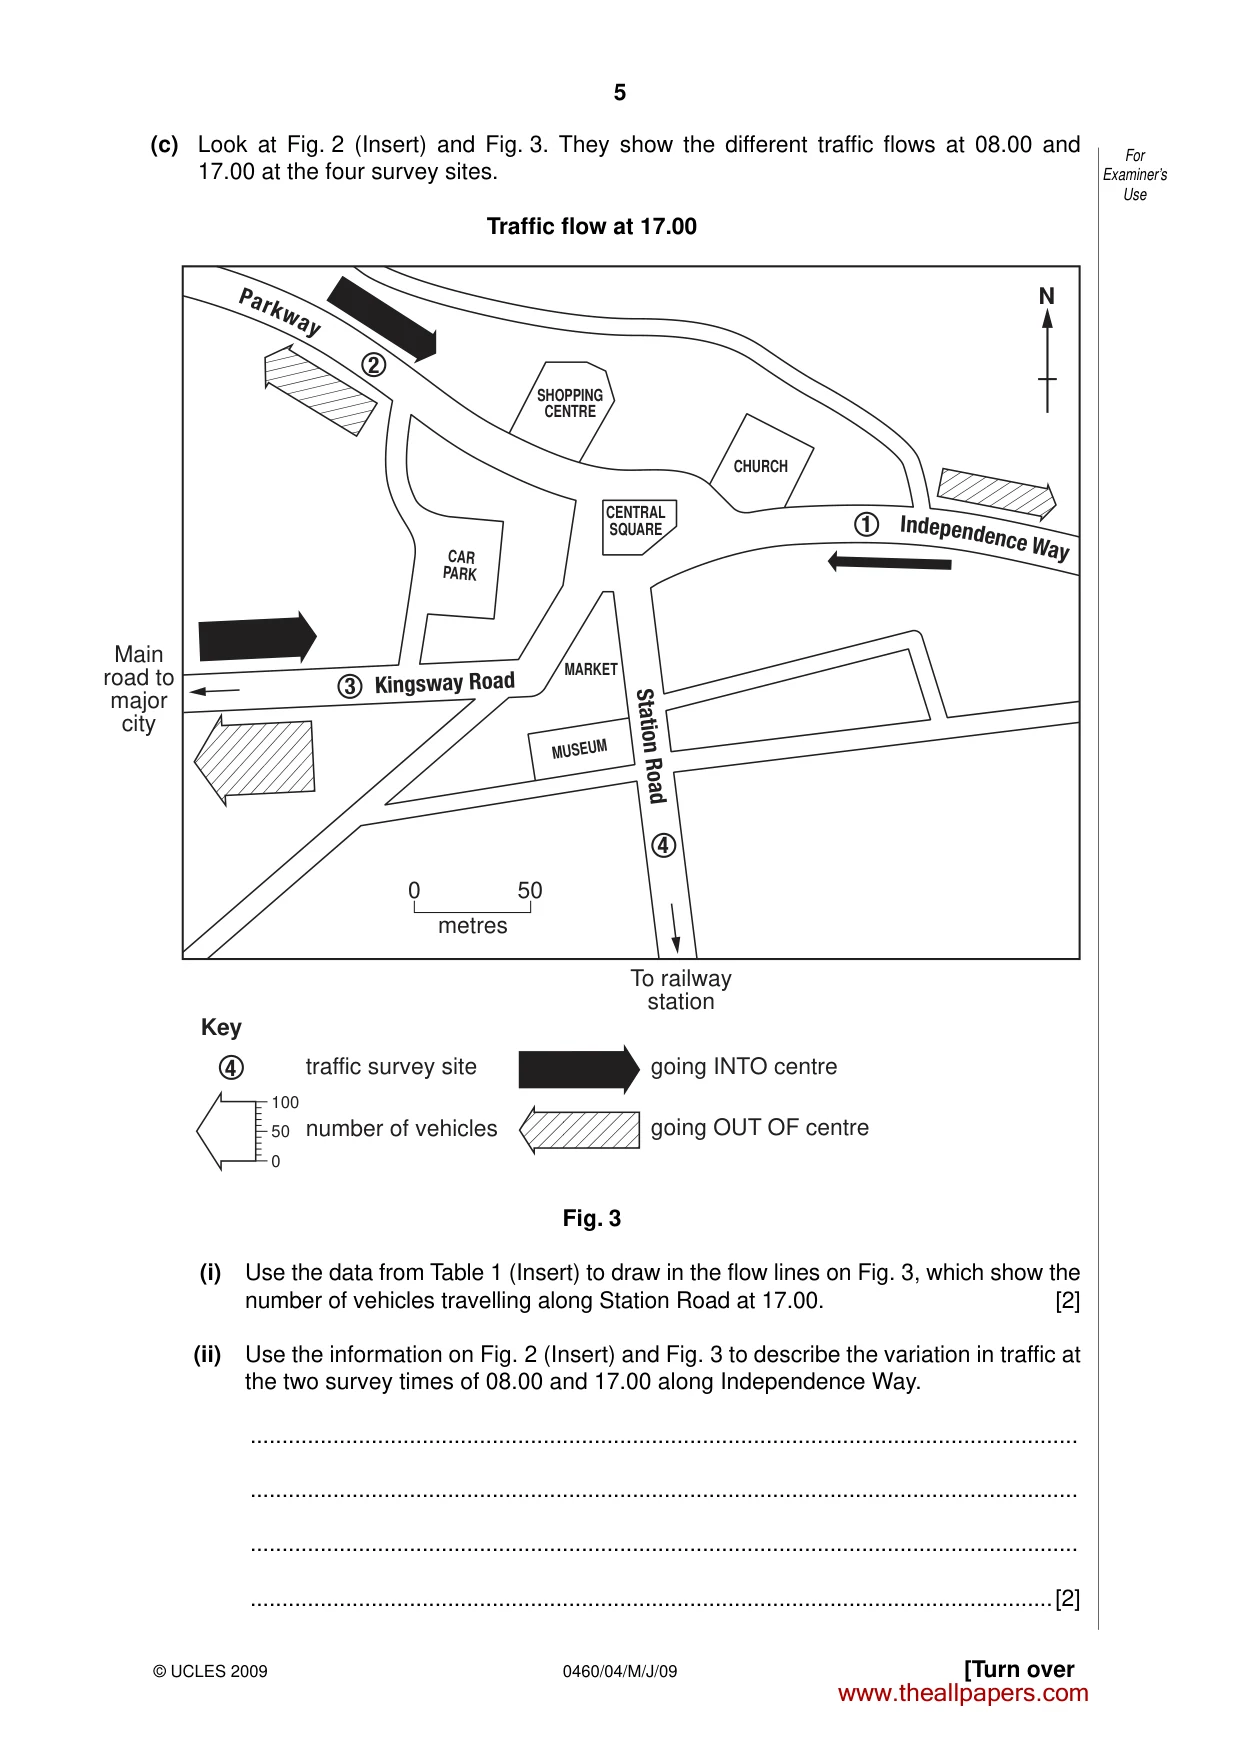
5 0460/04/M/J/09 [Turn over For Examiner’s Use © UCLES 2009 (c) Look at Fig. 2 (Insert) and Fig. 3. They show the different traffic flows at 08.00 and 17.00 at the four survey sites. Traffic flow at 17.00 2 3 4 4 1 Pa rk wa y Ind epe ndenc e Way Kingsway Road Station Road SHOPPING CENTRE CHURCH CAR PARK CENTRAL SQUARE MUSEUM MARKET Main road to major city To railway station 100 50 0 Key traffic survey site going INTO centre going OUT OF centre number of vehicles N 0 50 metres Fig. 3 (i) Use the data from Table 1 (Insert) to draw in the flow lines on Fig. 3, which show the number of vehicles travelling along Station Road at 17.00. [2] (ii) Use the information on Fig. 2 (Insert) and Fig. 3 to describe the variation in traffic at the two survey times of 08.00 and 17.00 along Independence Way. … … … …[2] www.theallpapers.com
Question paper, page 6
6 0460/04/M/J/09 For Examiner’s Use © UCLES 2009 (iii) What would be the students’ conclusion to Hypothesis 2, based on their results? What reasons might the students give to support their conclusion? … … … … … … … …[4] (d) (i) Suggest improvements to the data collection methods used in the students’ investigation. … … … … … … … …[4] (ii) State two other features of traffic in towns that could be investigated at the four traffic survey sites. 1 … … 2 … …[2] [Total: 30 marks] www.theallpapers.com
Question paper, page 7
7 0460/04/M/J/09 © UCLES 2009 [Turn over BLANK PAGE www.theallpapers.com
Question paper, page 8
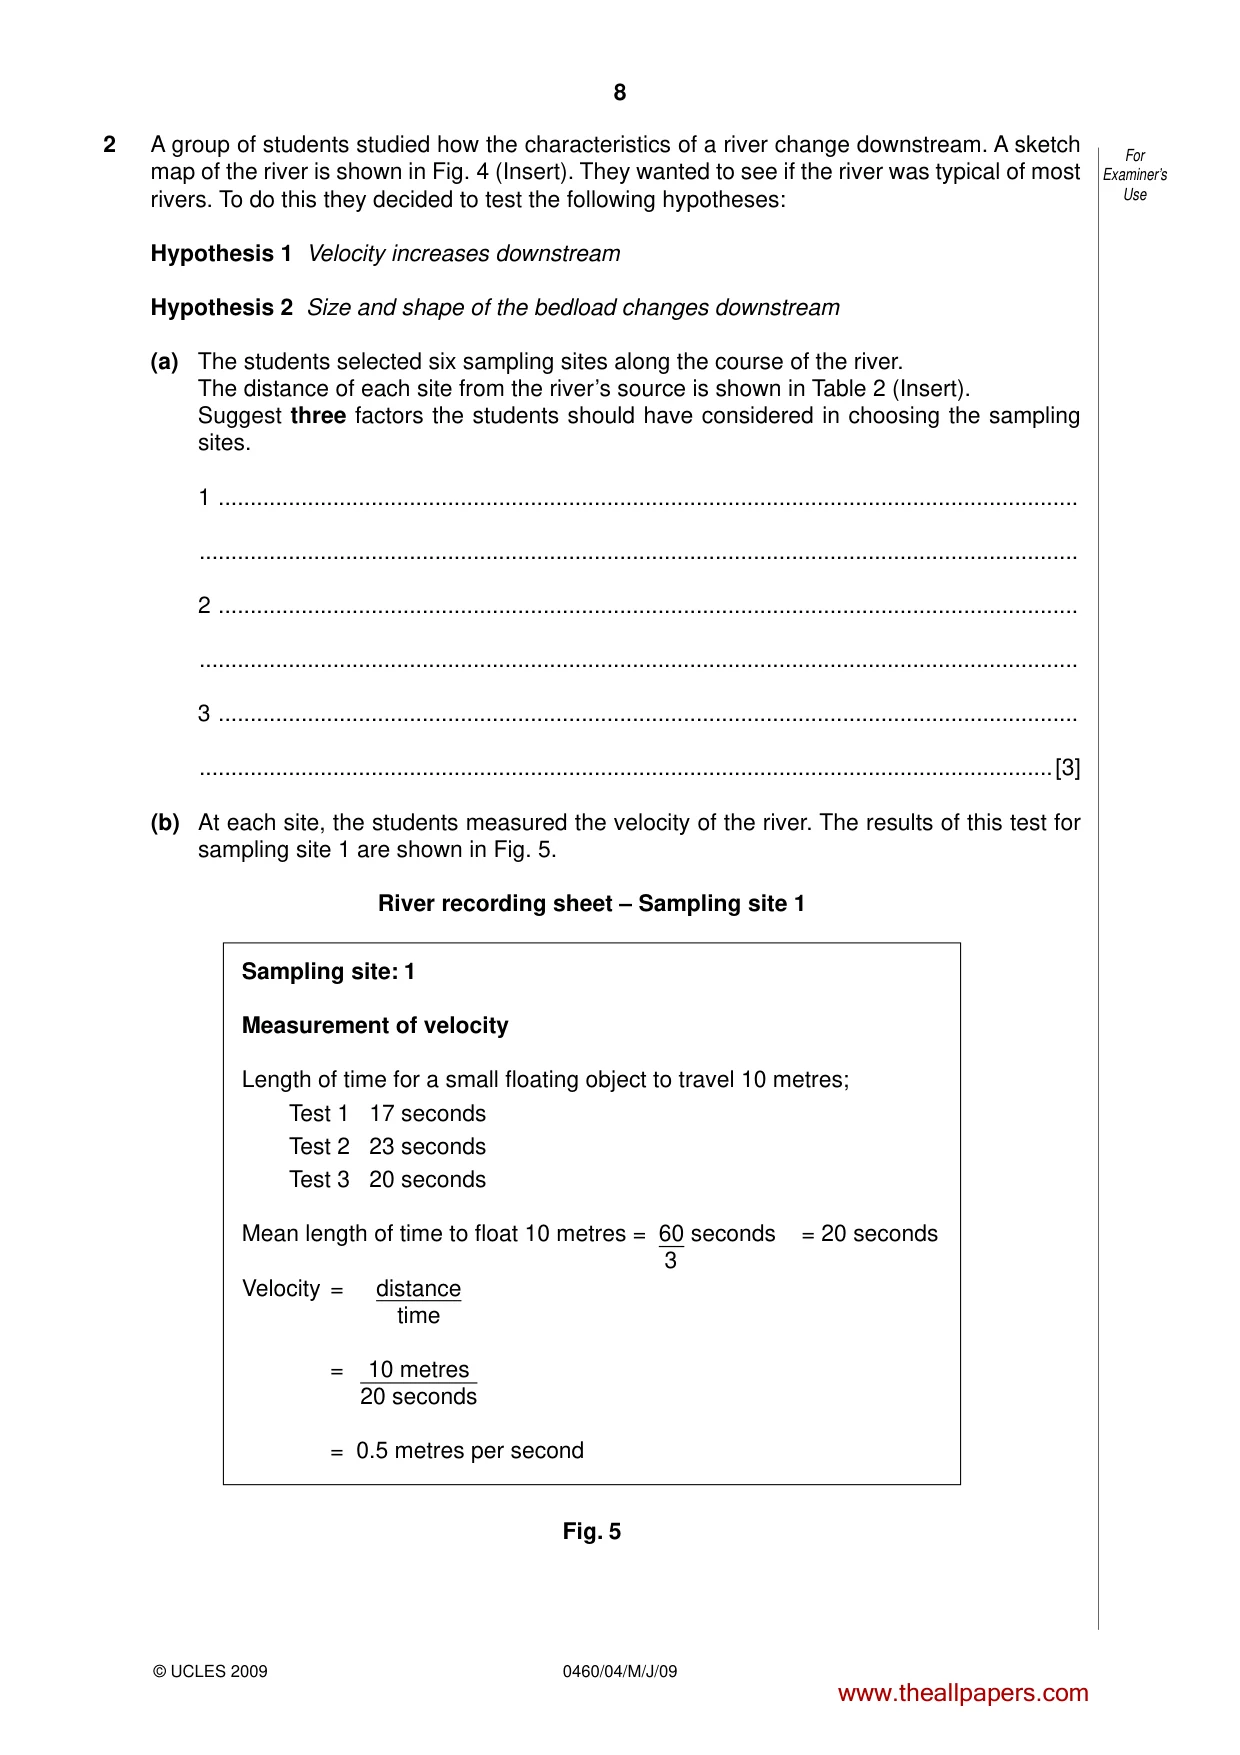
8 0460/04/M/J/09 For Examiner’s Use © UCLES 2009 2 A group of students studied how the characteristics of a river change downstream. A sketch map of the river is shown in Fig. 4 (Insert). They wanted to see if the river was typical of most rivers. To do this they decided to test the following hypotheses: Hypothesis 1 Velocity increases downstream Hypothesis 2 Size and shape of the bedload changes downstream (a) The students selected six sampling sites along the course of the river. The distance of each site from the river’s source is shown in Table 2 (Insert). Suggest three factors the students should have considered in choosing the sampling sites. 1 … … 2 … … 3 … …[3] (b) At each site, the students measured the velocity of the river. The results of this test for sampling site 1 are shown in Fig. 5. River recording sheet – Sampling site 1 Sampling site: 1 Measurement of velocity Length of time for a small floating object to travel 10 metres; Test 1 17 seconds Test 2 23 seconds Test 3 20 seconds Mean length of time to float 10 metres = 60 seconds = 20 seconds 3 Velocity = distance time = 10 metres 20 seconds = 0.5 metres per second Fig. 5 www.theallpapers.com
Question paper, page 9
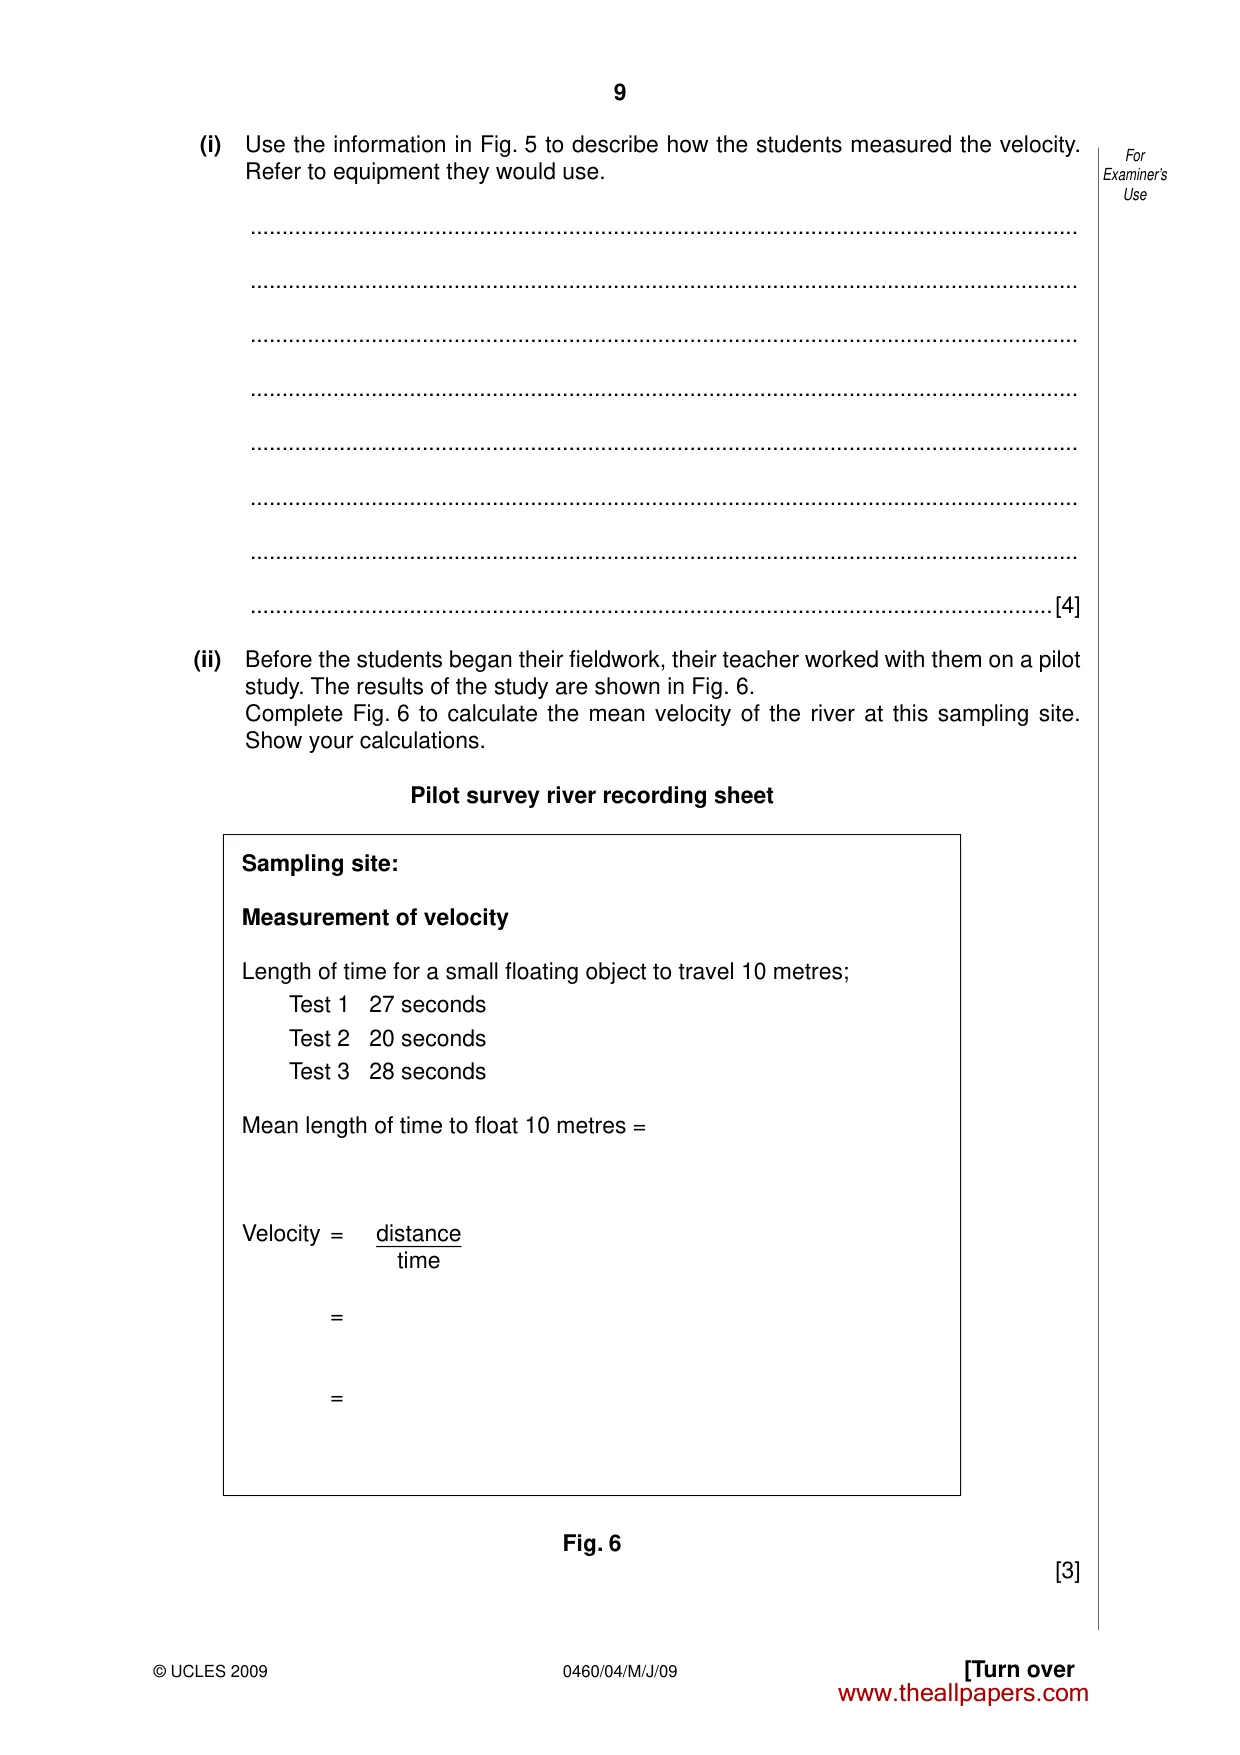
9 0460/04/M/J/09 [Turn over For Examiner’s Use © UCLES 2009 (i) Use the information in Fig. 5 to describe how the students measured the velocity. Refer to equipment they would use. … … … … … … … …[4] (ii) Before the students began their fieldwork, their teacher worked with them on a pilot study. The results of the study are shown in Fig. 6. Complete Fig. 6 to calculate the mean velocity of the river at this sampling site. Show your calculations. Pilot survey river recording sheet Sampling site: Measurement of velocity Length of time for a small floating object to travel 10 metres; Test 1 27 seconds Test 2 20 seconds Test 3 28 seconds Mean length of time to float 10 metres = Velocity = distance time = = Fig. 6 [3] www.theallpapers.com
Question paper, page 10
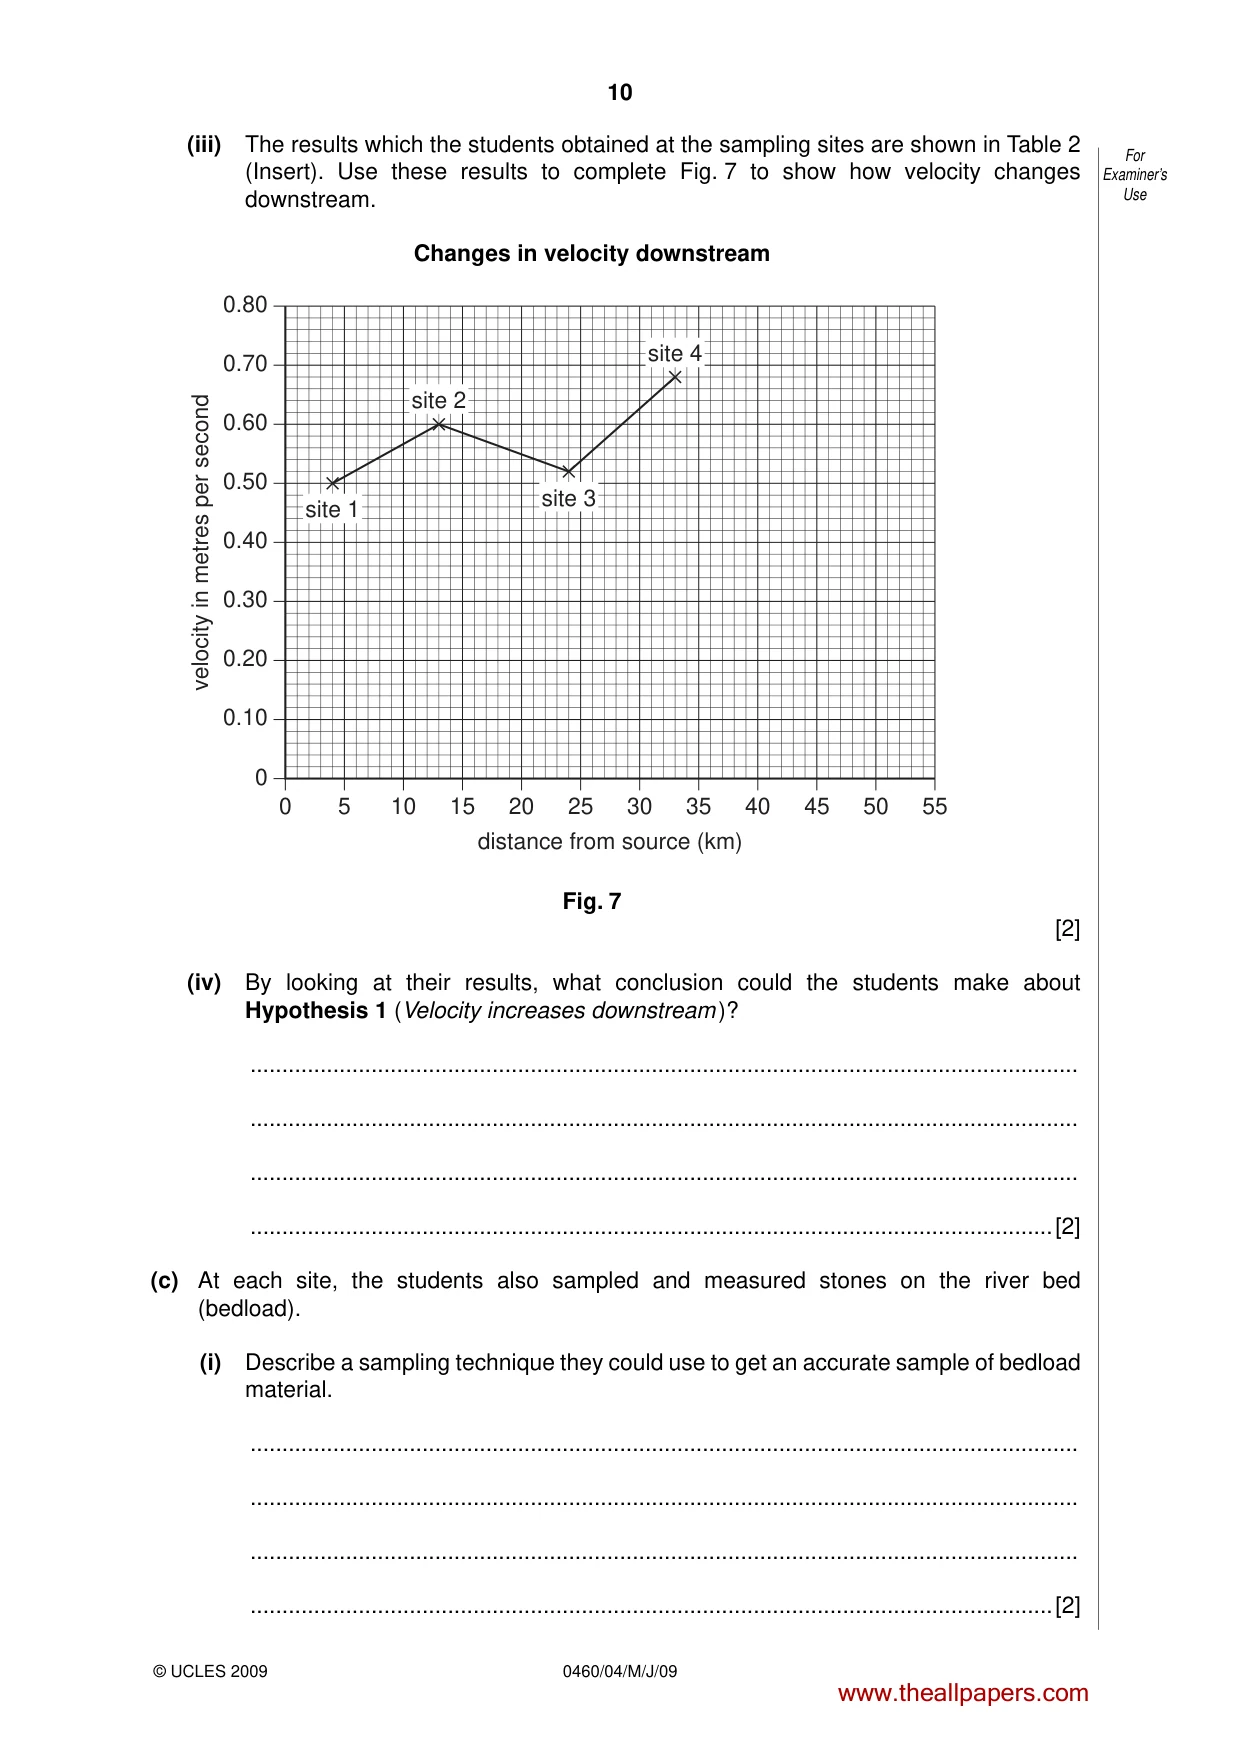
10 0460/04/M/J/09 For Examiner’s Use © UCLES 2009 (iii) The results which the students obtained at the sampling sites are shown in Table 2 (Insert). Use these results to complete Fig. 7 to show how velocity changes downstream. Changes in velocity downstream 0 5 10 15 20 25 30 35 40 45 50 55 distance from source (km) 0 0.10 0.20 0.30 0.40 0.50 0.60 0.70 0.80 velocity in metres per second site 1 site 2 site 3 site 4 Fig. 7 [2] (iv) By looking at their results, what conclusion could the students make about Hypothesis 1 (Velocity increases downstream )? … … … …[2] (c) At each site, the students also sampled and measured stones on the river bed (bedload). (i) Describe a sampling technique they could use to get an accurate sample of bedload material. … … … …[2] www.theallpapers.com
Question paper, page 11
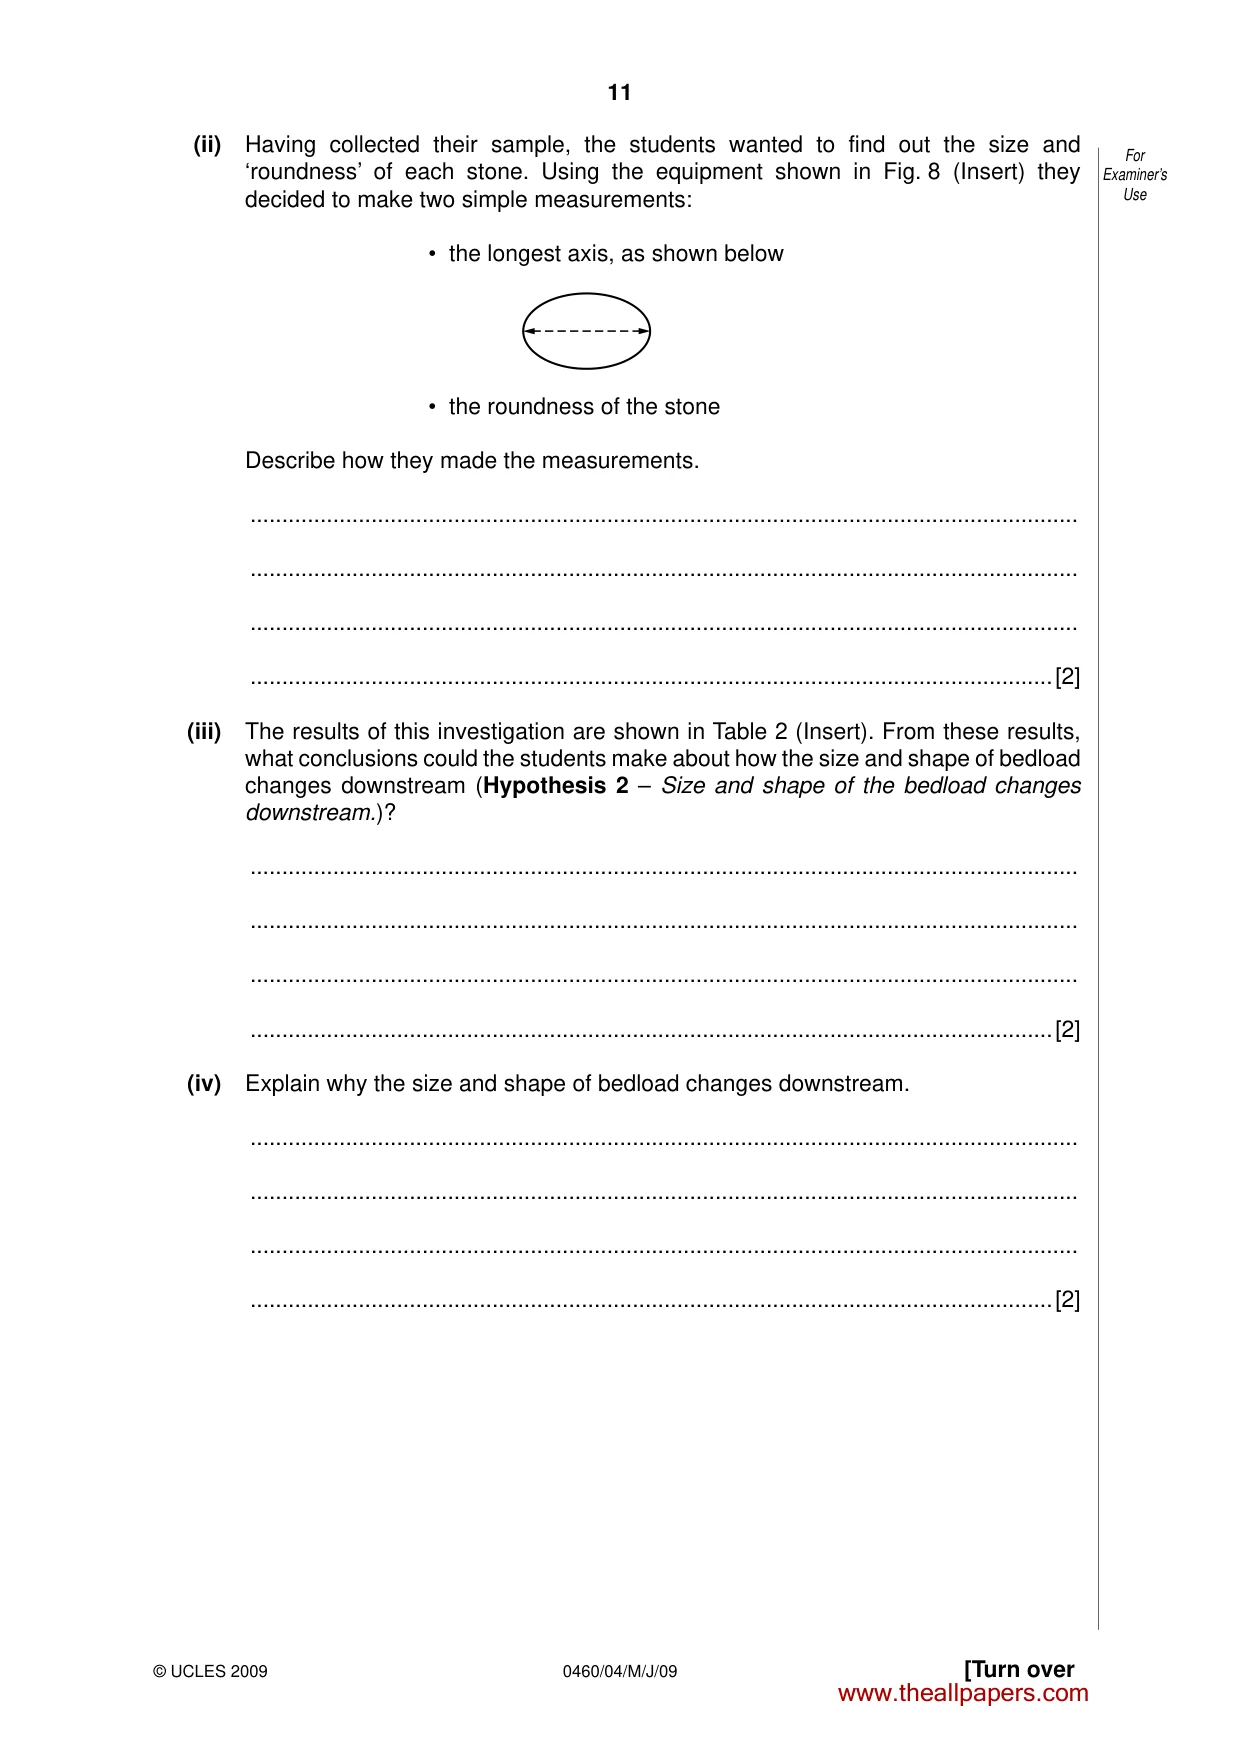
11 0460/04/M/J/09 [Turn over For Examiner’s Use © UCLES 2009 (ii) Having collected their sample, the students wanted to find out the size and ‘roundness’ of each stone. Using the equipment shown in Fig. 8 (Insert) they decided to make two simple measurements: • the longest axis, as shown below • the roundness of the stone Describe how they made the measurements. … … … …[2] (iii) The results of this investigation are shown in Table 2 (Insert). From these results, what conclusions could the students make about how the size and shape of bedload changes downstream (Hypothesis 2 – Size and shape of the bedload changes downstream.)? … … … …[2] (iv) Explain why the size and shape of bedload changes downstream. … … … …[2] www.theallpapers.com
Question paper, page 12
12 0460/04/M/J/09 © UCLES 2009 (d) Suggest improvements the students could have made to the data collection methods to make the results more reliable. … … … … … … … …[4] (e) In order to extend their fieldwork, the students could have investigated the impact of people on the river. State one impact people could have had on a river. Describe how the impact could be investigated. … … … … … … … …[4] [Total: 30 marks] Permission to reproduce items where third-party owned material protected by copyright is included has been sought and cleared where possible. Every reasonable effort has been made by the publisher (UCLES) to trace copyright holders, but if any items requiring clearance have unwittingly been included, the publisher will be pleased to make amends at the earliest possible opportunity. University of Cambridge International Examinations is part of the Cambridge Assessment Group. Cambridge Assessment is the brand name of University of Cambridge Local Examinations Syndicate (UCLES), which is itself a department of the University of Cambridge. For Examiner’s Use www.theallpapers.com
Mark scheme, page 1
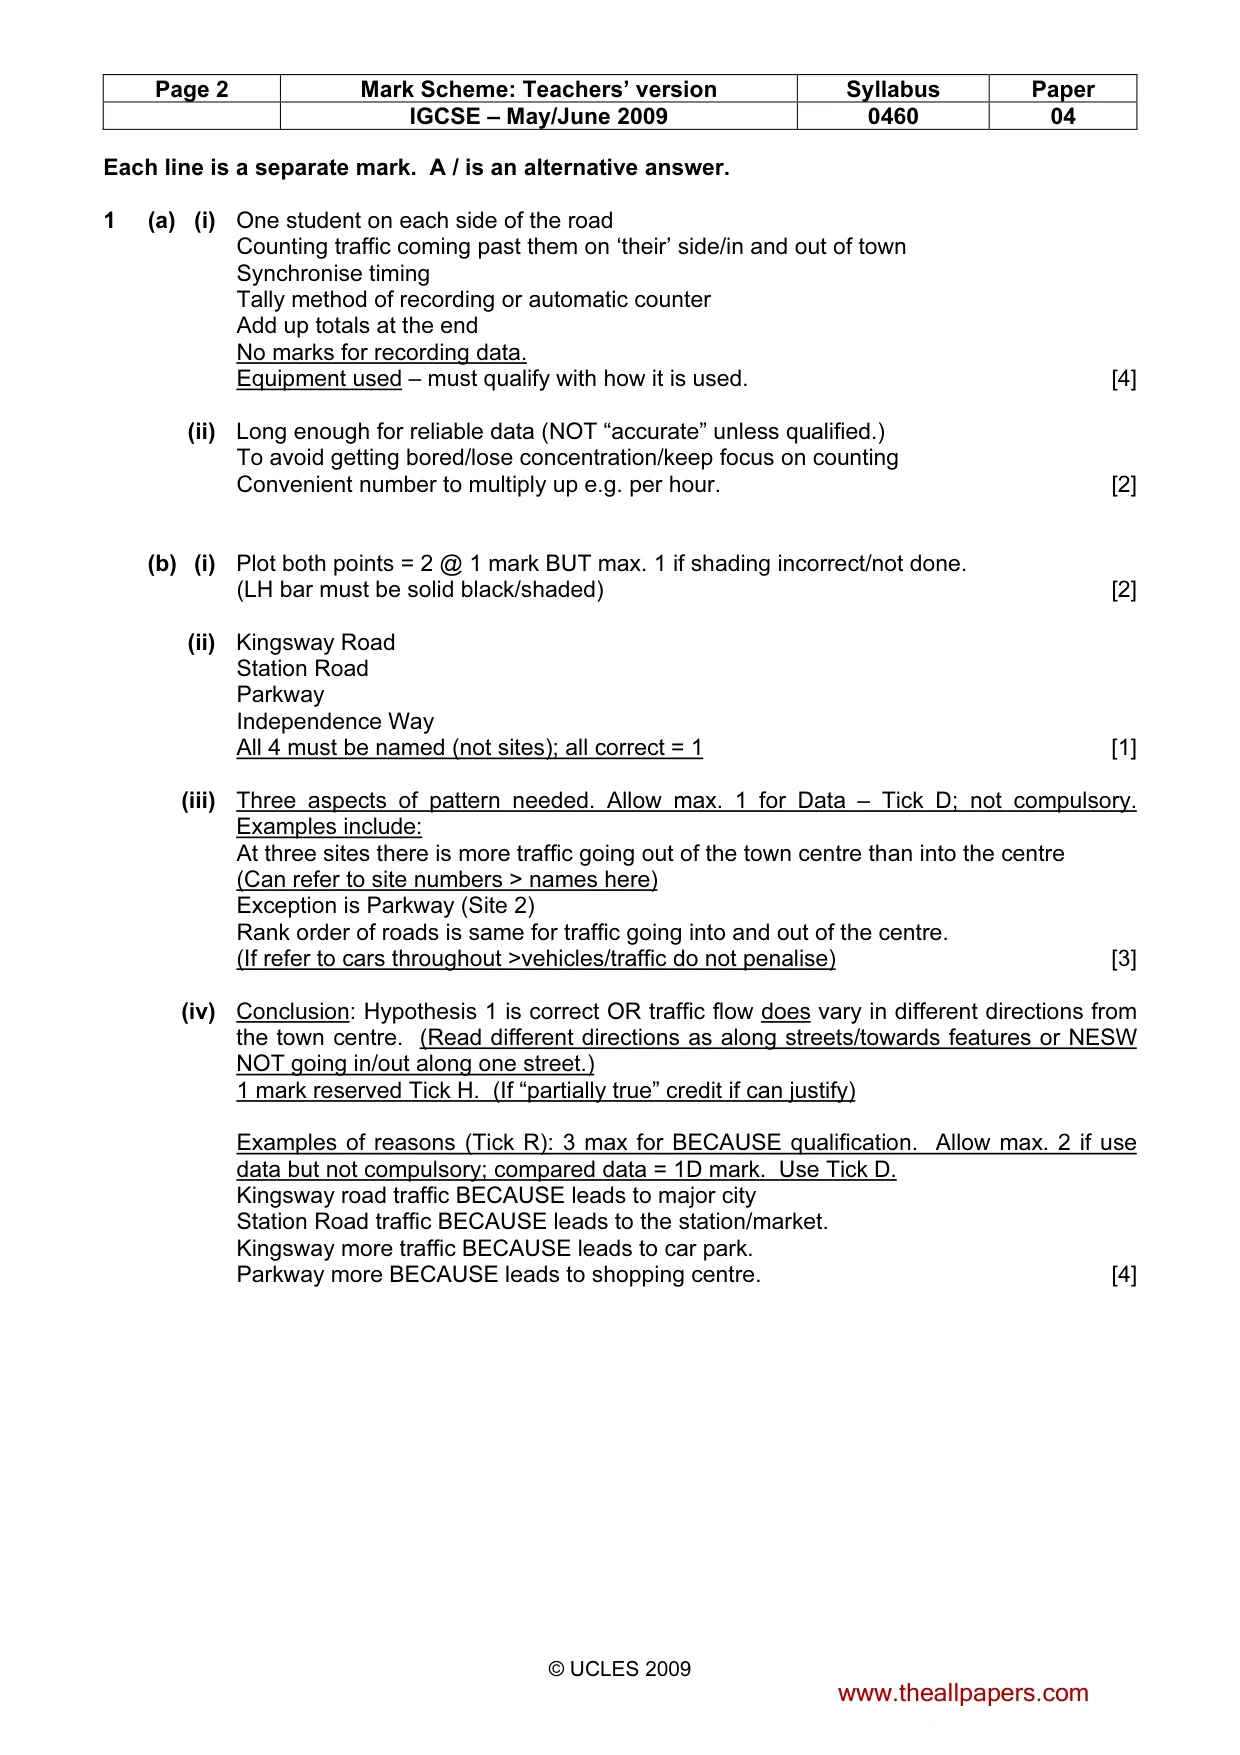
UNIVERSITY OF CAMBRIDGE INTERNATIONAL EXAMINATIONS International General Certificate of Secondary Education MARK SCHEME for the May/June 2009 question paper for the guidance of teachers 0460 GEOGRAPHY 0460/04 Paper 4 (Alternative to Coursework), maximum raw mark 60 This mark scheme is published as an aid to teachers and candidates, to indicate the requirements of the examination. It shows the basis on which Examiners were instructed to award marks. It does not indicate the details of the discussions that took place at an Examiners’ meeting before marking began, which would have considered the acceptability of alternative answers. Mark schemes must be read in conjunction with the question papers and the report on the examination. • CIE will not enter into discussions or correspondence in connection with these mark schemes. CIE is publishing the mark schemes for the May/June 2009 question papers for most IGCSE, GCE Advanced Level and Advanced Subsidiary Level syllabuses and some Ordinary Level syllabuses. www.theallpapers.com
Mark scheme, page 2
Page 2 Mark Scheme: Teachers’ version Syllabus Paper IGCSE – May/June 2009 0460 04 © UCLES 2009 Each line is a separate mark. A / is an alternative answer. 1 (a) (i) One student on each side of the road Counting traffic coming past them on ‘their’ side/in and out of town Synchronise timing Tally method of recording or automatic counter Add up totals at the end No marks for recording data. Equipment used – must qualify with how it is used. [4] (ii) Long enough for reliable data (NOT “accurate” unless qualified.) To avoid getting bored/lose concentration/keep focus on counting Convenient number to multiply up e.g. per hour. [2] (b) (i) Plot both points = 2 @ 1 mark BUT max. 1 if shading incorrect/not done. (LH bar must be solid black/shaded) [2] (ii) Kingsway Road Station Road Parkway Independence Way All 4 must be named (not sites); all correct = 1 [1] (iii) Three aspects of pattern needed. Allow max. 1 for Data – Tick D; not compulsory. Examples include: At three sites there is more traffic going out of the town centre than into the centre (Can refer to site numbers > names here) Exception is Parkway (Site 2) Rank order of roads is same for traffic going into and out of the centre. (If refer to cars throughout >vehicles/traffic do not penalise) [3] (iv) Conclusion: Hypothesis 1 is correct OR traffic flow does vary in different directions from the town centre. (Read different directions as along streets/towards features or NESW NOT going in/out along one street.) 1 mark reserved Tick H. (If “partially true” credit if can justify) Examples of reasons (Tick R): 3 max for BECAUSE qualification. Allow max. 2 if use data but not compulsory; compared data = 1D mark. Use Tick D. Kingsway road traffic BECAUSE leads to major city Station Road traffic BECAUSE leads to the station/market. Kingsway more traffic BECAUSE leads to car park. Parkway more BECAUSE leads to shopping centre. [4] www.theallpapers.com
Mark scheme, page 3
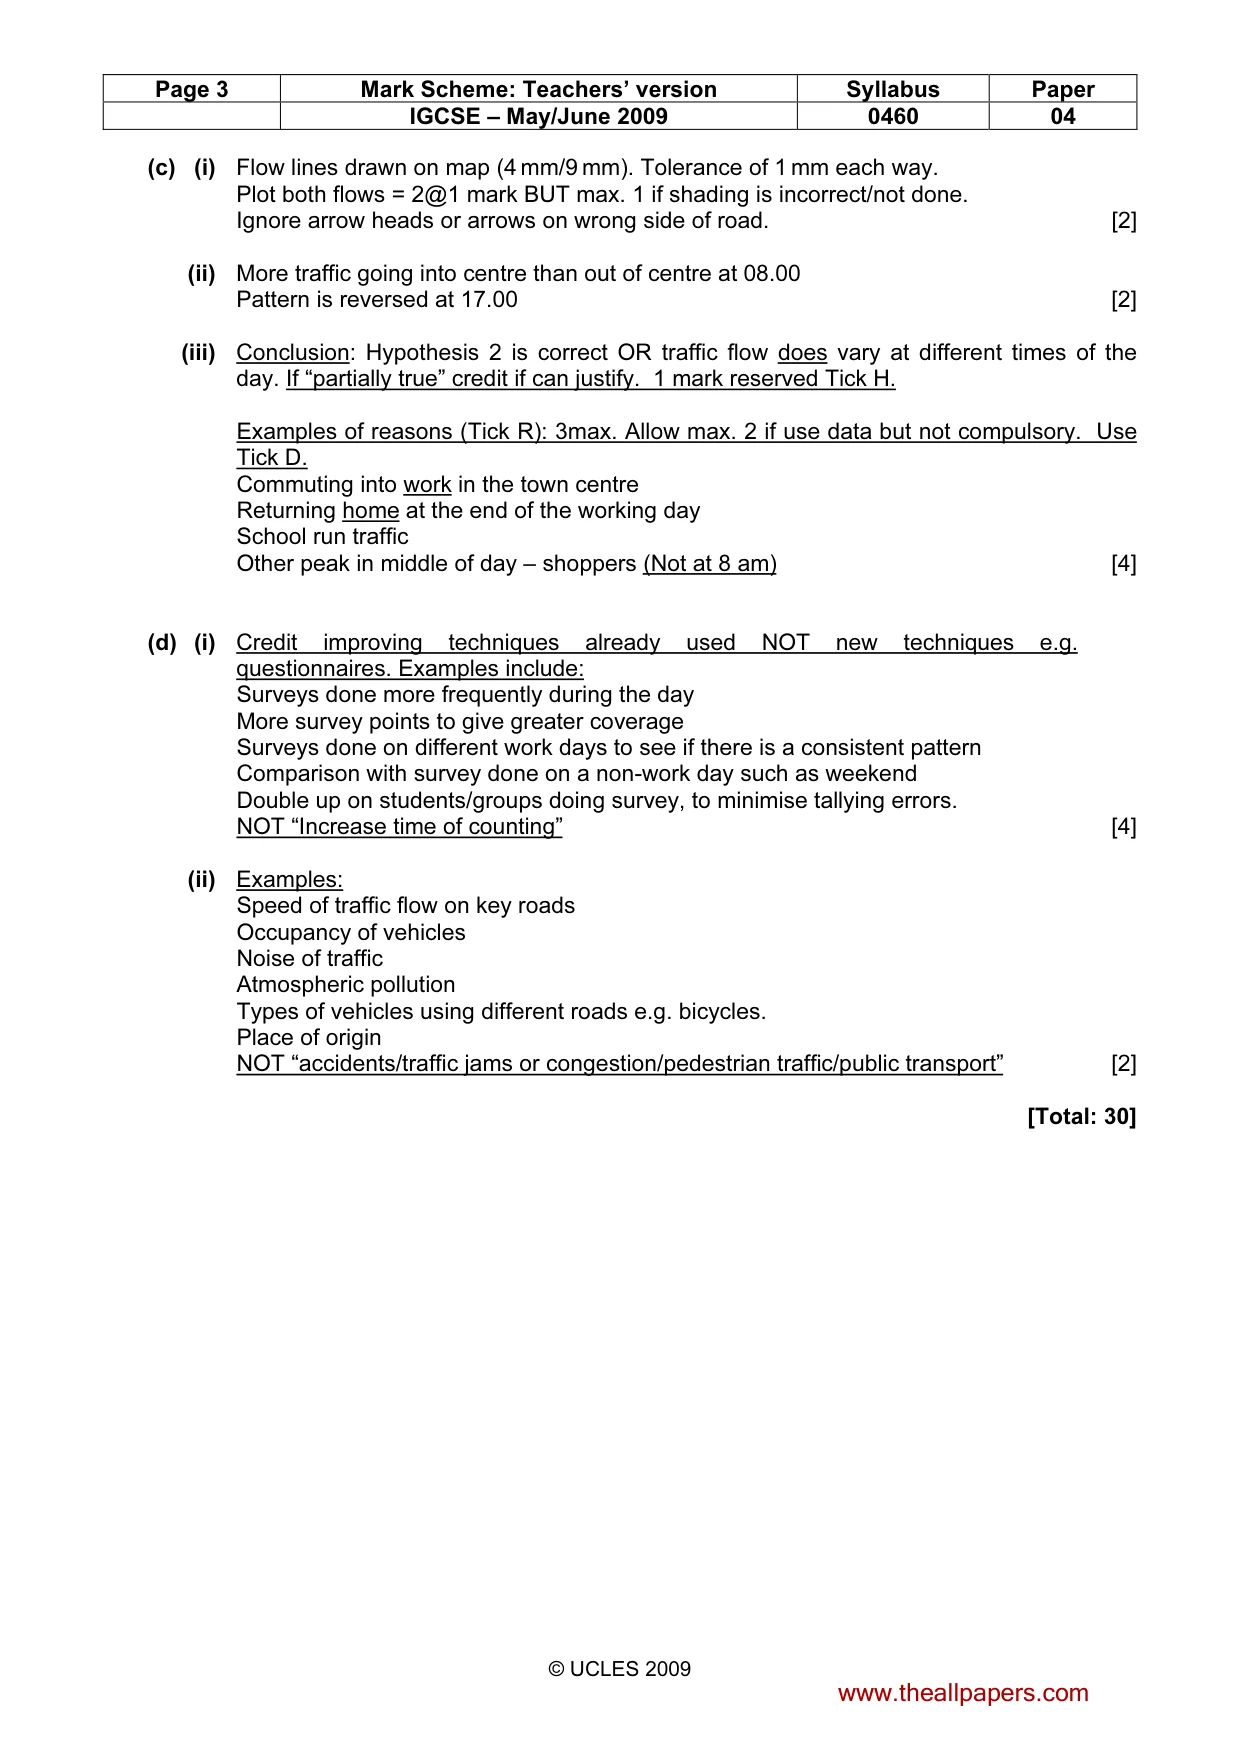
Page 3 Mark Scheme: Teachers’ version Syllabus Paper IGCSE – May/June 2009 0460 04 © UCLES 2009 (c) (i) Flow lines drawn on map (4 mm/9 mm). Tolerance of 1 mm each way. Plot both flows = 2@1 mark BUT max. 1 if shading is incorrect/not done. Ignore arrow heads or arrows on wrong side of road. [2] (ii) More traffic going into centre than out of centre at 08.00 Pattern is reversed at 17.00 [2] (iii) Conclusion: Hypothesis 2 is correct OR traffic flow does vary at different times of the day. If “partially true” credit if can justify. 1 mark reserved Tick H. Examples of reasons (Tick R): 3max. Allow max. 2 if use data but not compulsory. Use Tick D. Commuting into work in the town centre Returning home at the end of the working day School run traffic Other peak in middle of day – shoppers (Not at 8 am) [4] (d) (i) Credit improving techniques already used NOT new techniques e.g. questionnaires. Examples include: Surveys done more frequently during the day More survey points to give greater coverage Surveys done on different work days to see if there is a consistent pattern Comparison with survey done on a non-work day such as weekend Double up on students/groups doing survey, to minimise tallying errors. NOT “Increase time of counting” [4] (ii) Examples: Speed of traffic flow on key roads Occupancy of vehicles Noise of traffic Atmospheric pollution Types of vehicles using different roads e.g. bicycles. Place of origin NOT “accidents/traffic jams or congestion/pedestrian traffic/public transport” [2] [Total: 30] www.theallpapers.com
Mark scheme, page 4
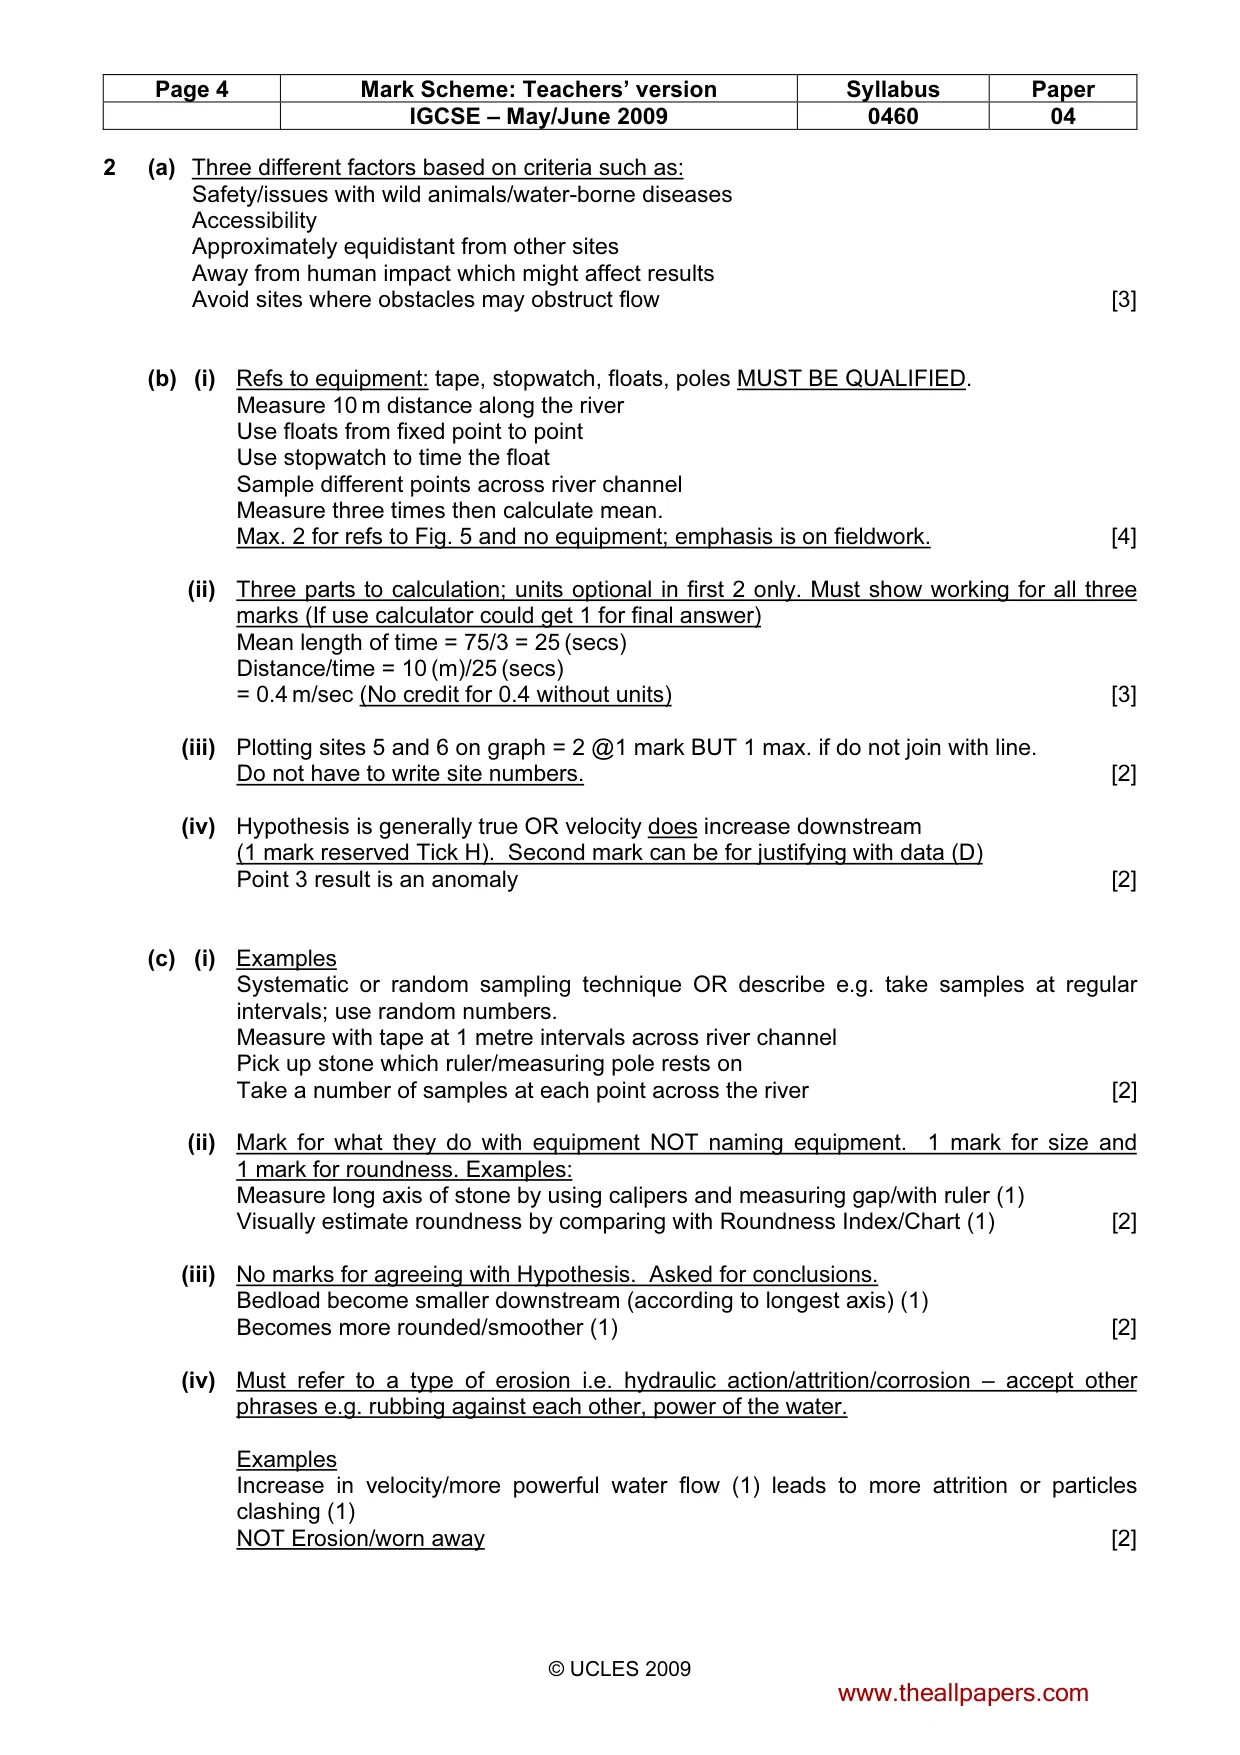
Page 4 Mark Scheme: Teachers’ version Syllabus Paper IGCSE – May/June 2009 0460 04 © UCLES 2009 2 (a) Three different factors based on criteria such as: Safety/issues with wild animals/water-borne diseases Accessibility Approximately equidistant from other sites Away from human impact which might affect results Avoid sites where obstacles may obstruct flow [3] (b) (i) Refs to equipment: tape, stopwatch, floats, poles MUST BE QUALIFIED. Measure 10 m distance along the river Use floats from fixed point to point Use stopwatch to time the float Sample different points across river channel Measure three times then calculate mean. Max. 2 for refs to Fig. 5 and no equipment; emphasis is on fieldwork. [4] (ii) Three parts to calculation; units optional in first 2 only. Must show working for all three marks (If use calculator could get 1 for final answer) Mean length of time = 75/3 = 25 (secs) Distance/time = 10 (m)/25 (secs) = 0.4 m/sec (No credit for 0.4 without units) [3] (iii) Plotting sites 5 and 6 on graph = 2 @1 mark BUT 1 max. if do not join with line. Do not have to write site numbers. [2] (iv) Hypothesis is generally true OR velocity does increase downstream (1 mark reserved Tick H). Second mark can be for justifying with data (D) Point 3 result is an anomaly [2] (c) (i) Examples Systematic or random sampling technique OR describe e.g. take samples at regular intervals; use random numbers. Measure with tape at 1 metre intervals across river channel Pick up stone which ruler/measuring pole rests on Take a number of samples at each point across the river [2] (ii) Mark for what they do with equipment NOT naming equipment. 1 mark for size and 1 mark for roundness. Examples: Measure long axis of stone by using calipers and measuring gap/with ruler (1) Visually estimate roundness by comparing with Roundness Index/Chart (1) [2] (iii) No marks for agreeing with Hypothesis. Asked for conclusions. Bedload become smaller downstream (according to longest axis) (1) Becomes more rounded/smoother (1) [2] (iv) Must refer to a type of erosion i.e. hydraulic action/attrition/corrosion – accept other phrases e.g. rubbing against each other, power of the water. Examples Increase in velocity/more powerful water flow (1) leads to more attrition or particles clashing (1) NOT Erosion/worn away [2] www.theallpapers.com
Mark scheme, page 5
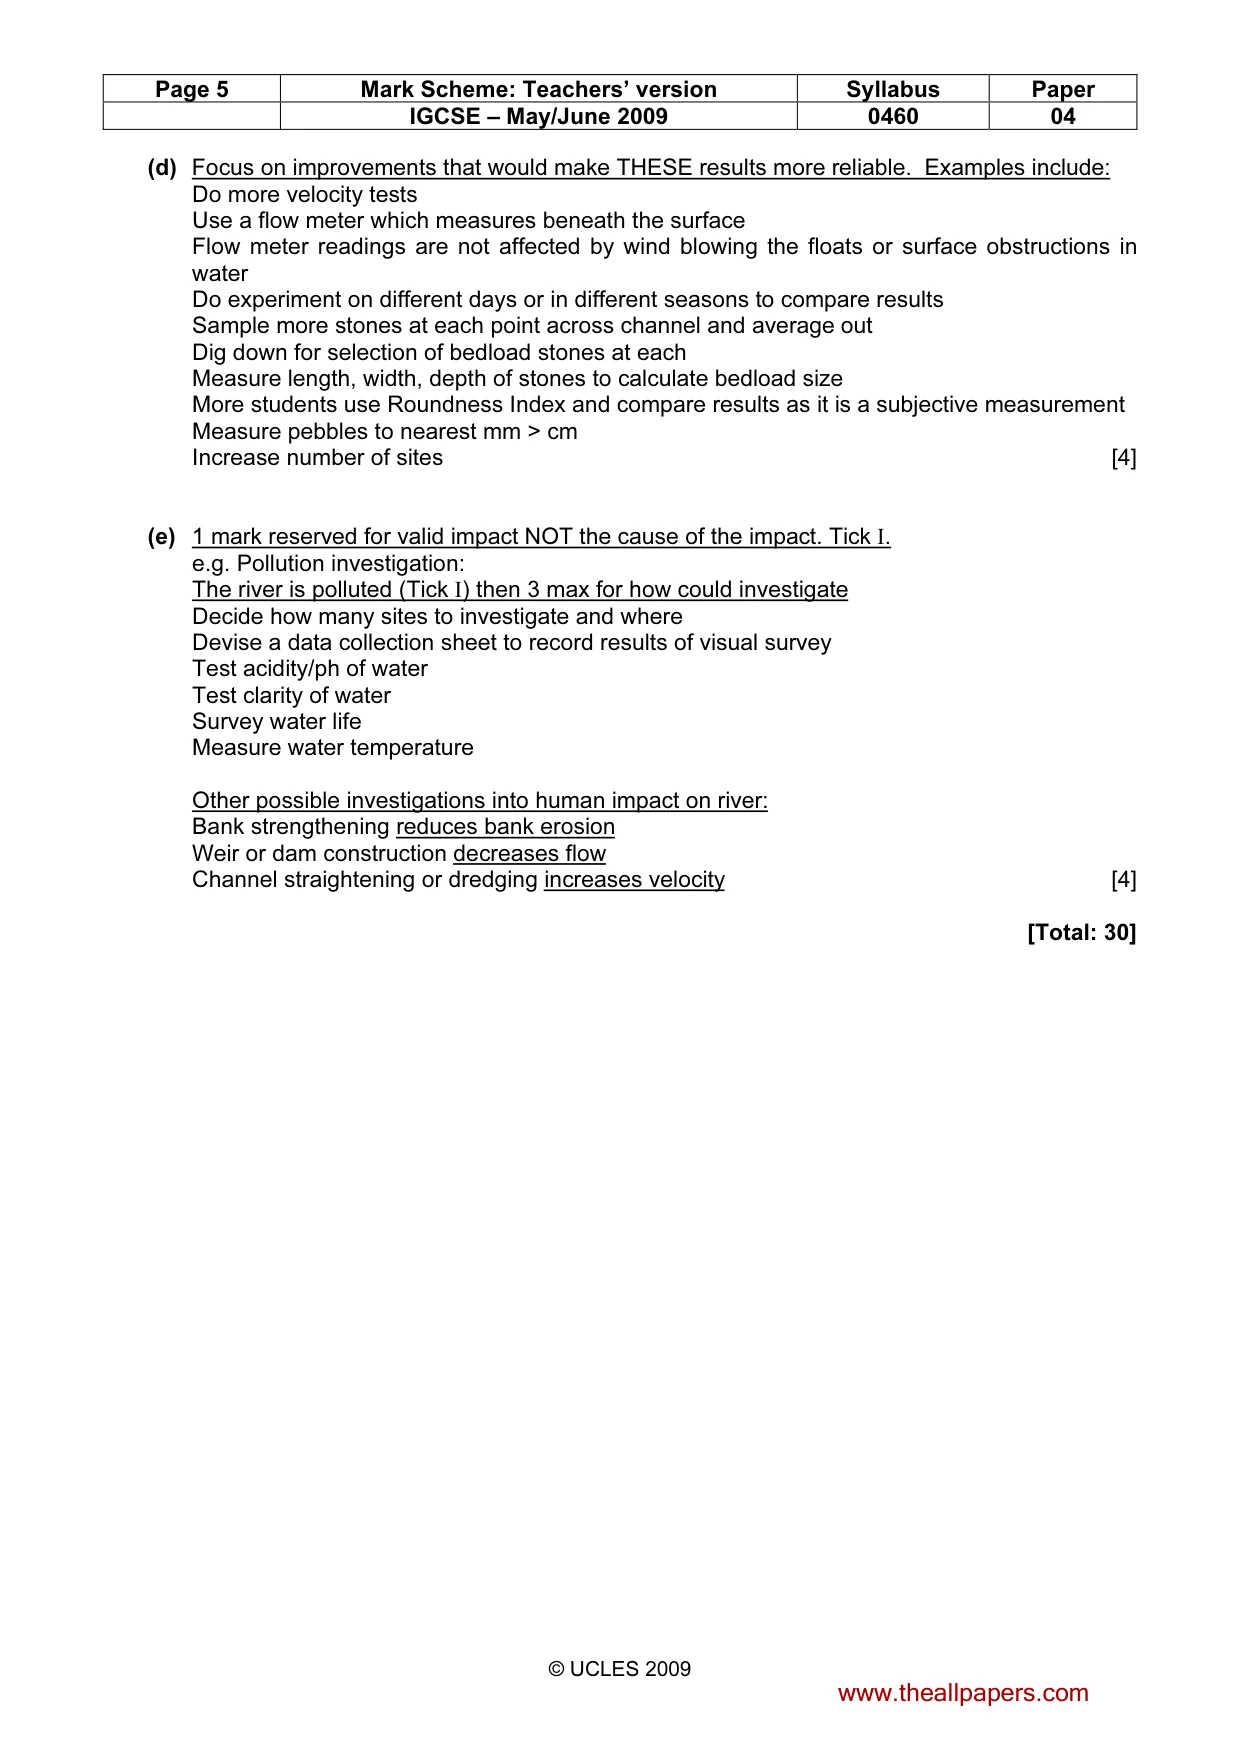
Page 5 Mark Scheme: Teachers’ version Syllabus Paper IGCSE – May/June 2009 0460 04 © UCLES 2009 (d) Focus on improvements that would make THESE results more reliable. Examples include: Do more velocity tests Use a flow meter which measures beneath the surface Flow meter readings are not affected by wind blowing the floats or surface obstructions in water Do experiment on different days or in different seasons to compare results Sample more stones at each point across channel and average out Dig down for selection of bedload stones at each Measure length, width, depth of stones to calculate bedload size More students use Roundness Index and compare results as it is a subjective measurement Measure pebbles to nearest mm > cm Increase number of sites [4] (e) 1 mark reserved for valid impact NOT the cause of the impact. Tick I. e.g. Pollution investigation: The river is polluted (Tick I) then 3 max for how could investigate Decide how many sites to investigate and where Devise a data collection sheet to record results of visual survey Test acidity/ph of water Test clarity of water Survey water life Measure water temperature Other possible investigations into human impact on river: Bank strengthening reduces bank erosion Weir or dam construction decreases flow Channel straightening or dredging increases velocity [4] [Total: 30] www.theallpapers.com
What you needed in this session
Cambridge’s own grade thresholds for 2009 May/June, Paper 4 · Variant 1. A higher threshold means an easier paper — the bar moves with how the cohort did.