Cambridge IGCSE Geography 0460 — 2008 Oct/Nov Paper 4 · Variant 1
0460/41/O/N/08 · 60 marks · ≈68 min
The question paper and its mark scheme, free to read here and free to download. This is Cambridge’s own paper, exactly as it was sat.
Question paper16 pages



Mark scheme4 pages
Answers below. Sit the paper first if you are practising.

Paper as text
Question paper, page 1
UNIVERSITY OF CAMBRIDGE INTERNATIONAL EXAMINATIONS International General Certificate of Secondary Education This document consists of 13 printed pages, 3 blank pages and 1 Insert. SP (SM/CGW) T48187/5 © UCLES 2008 [Turn over READ THESE INSTRUCTIONS FIRST Write your Centre number, candidate number and name on all the work you hand in. Write in dark blue or black pen. You may use a soft pencil for any diagrams, graphs or rough working. Do not use staples, paper clips, highlighters, glue or correction fluid. DO NOT WRITE ON ANY BARCODES. Answer all questions. The Insert contains Fig. 4 for Question 1 and Table 2 for Question 2. The Insert is not required by the Examiner. Sketch maps and diagrams should be drawn whenever they serve to illustrate an answer. At the end of the examination, fasten all your work securely together. The number of marks is given in brackets [ ] at the end of each question or part question. * 3 7 7 9 8 8 4 0 5 2 * GEOGRAPHY 0460/04 Paper 4 Alternative to Coursework October/November 2008 1 hour 30 minutes Candidates answer on the Question Paper. Additional Materials: Ruler For Examiner’s Use Q1 Q2 Total www.XtremePapers.com
Question paper, page 2
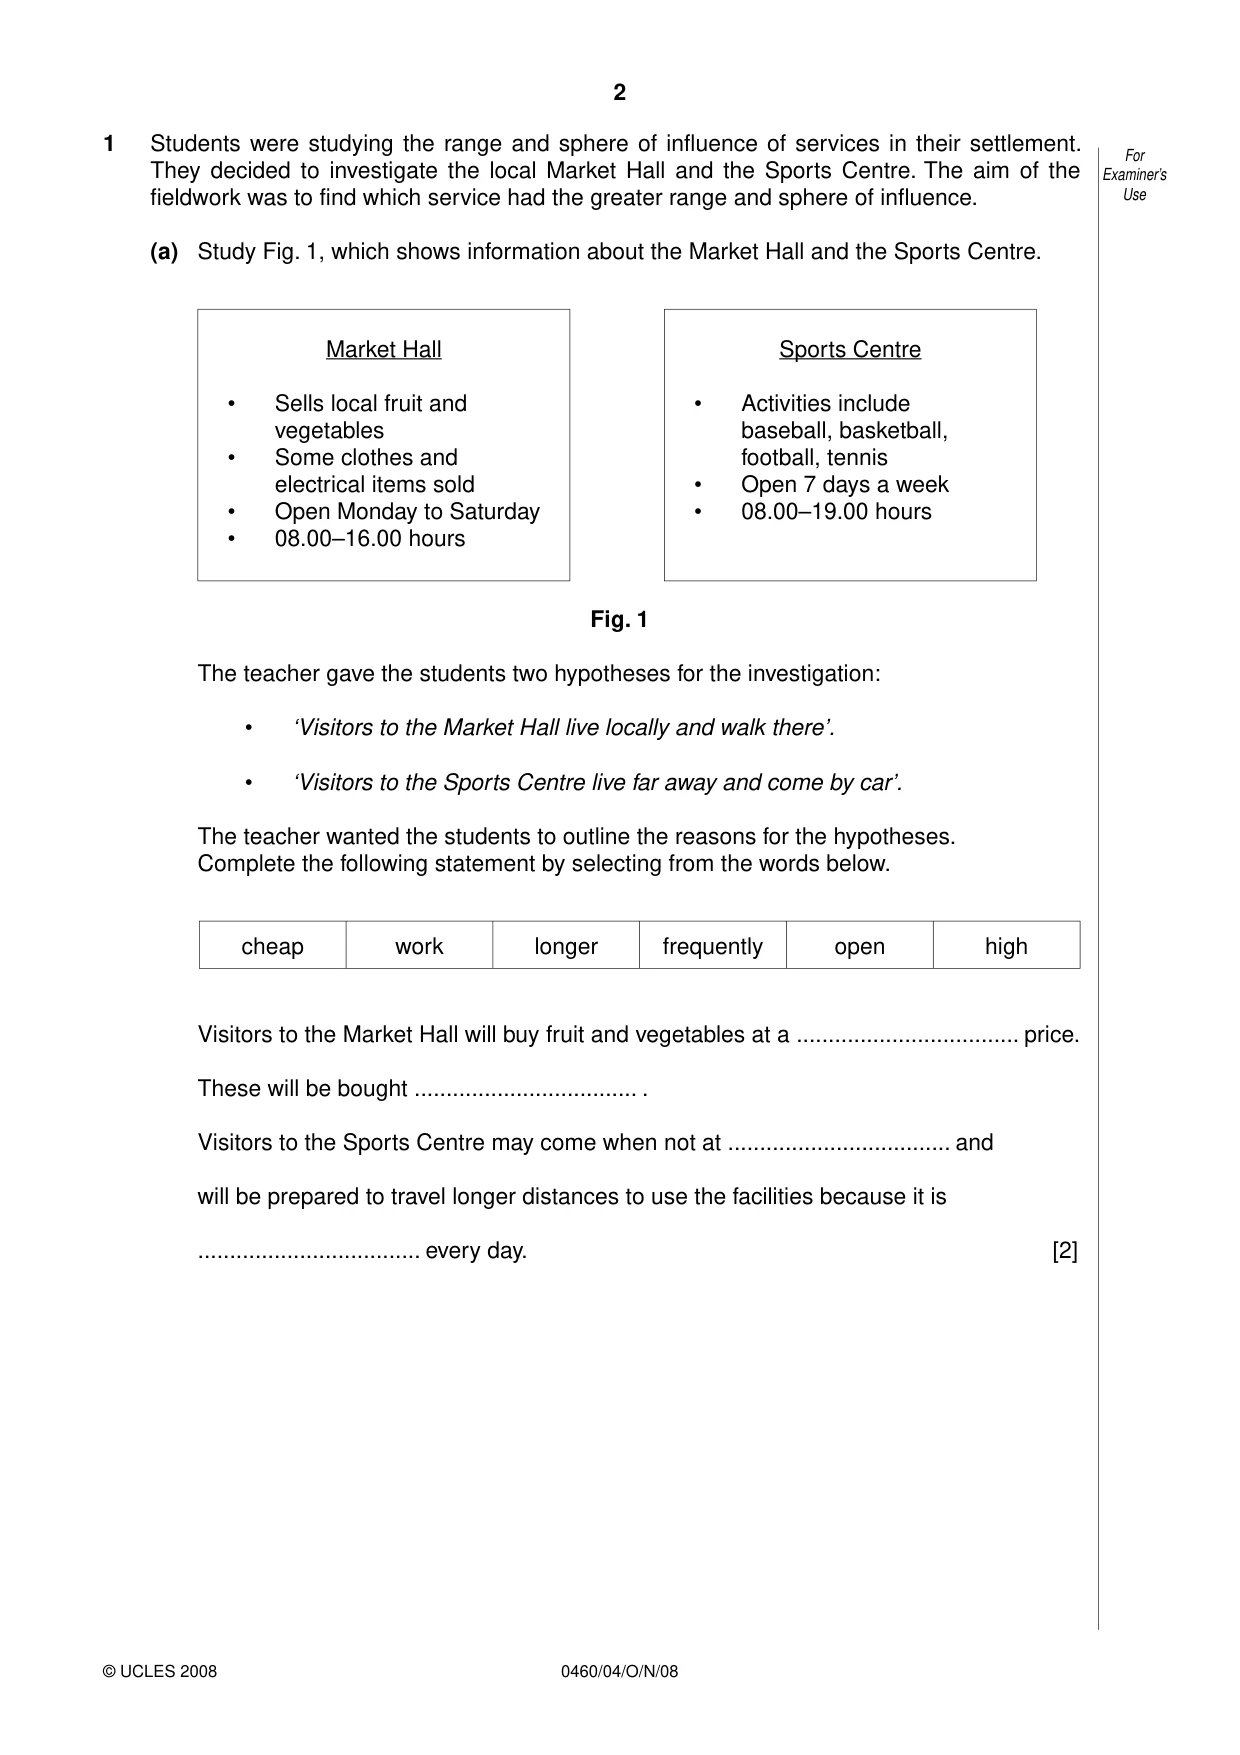
2 0460/04/O/N/08 © UCLES 2008 For Examiner’s Use 1 Students were studying the range and sphere of influence of services in their settlement. They decided to investigate the local Market Hall and the Sports Centre. The aim of the fieldwork was to find which service had the greater range and sphere of influence. (a) Study Fig. 1, which shows information about the Market Hall and the Sports Centre. Market Hall • Sells local fruit and vegetables • Some clothes and electrical items sold • Open Monday to Saturday • 08.00–16.00 hours Sports Centre • Activities include baseball, basketball, football, tennis • Open 7 days a week • 08.00–19.00 hours Fig. 1 The teacher gave the students two hypotheses for the investigation: • ‘Visitors to the Market Hall live locally and walk there’. • ‘Visitors to the Sports Centre live far away and come by car’. The teacher wanted the students to outline the reasons for the hypotheses. Complete the following statement by selecting from the words below. cheap work longer frequently open high Visitors to the Market Hall will buy fruit and vegetables at a … price. These will be bought … . Visitors to the Sports Centre may come when not at … and will be prepared to travel longer distances to use the facilities because it is … every day. [2]
Question paper, page 3
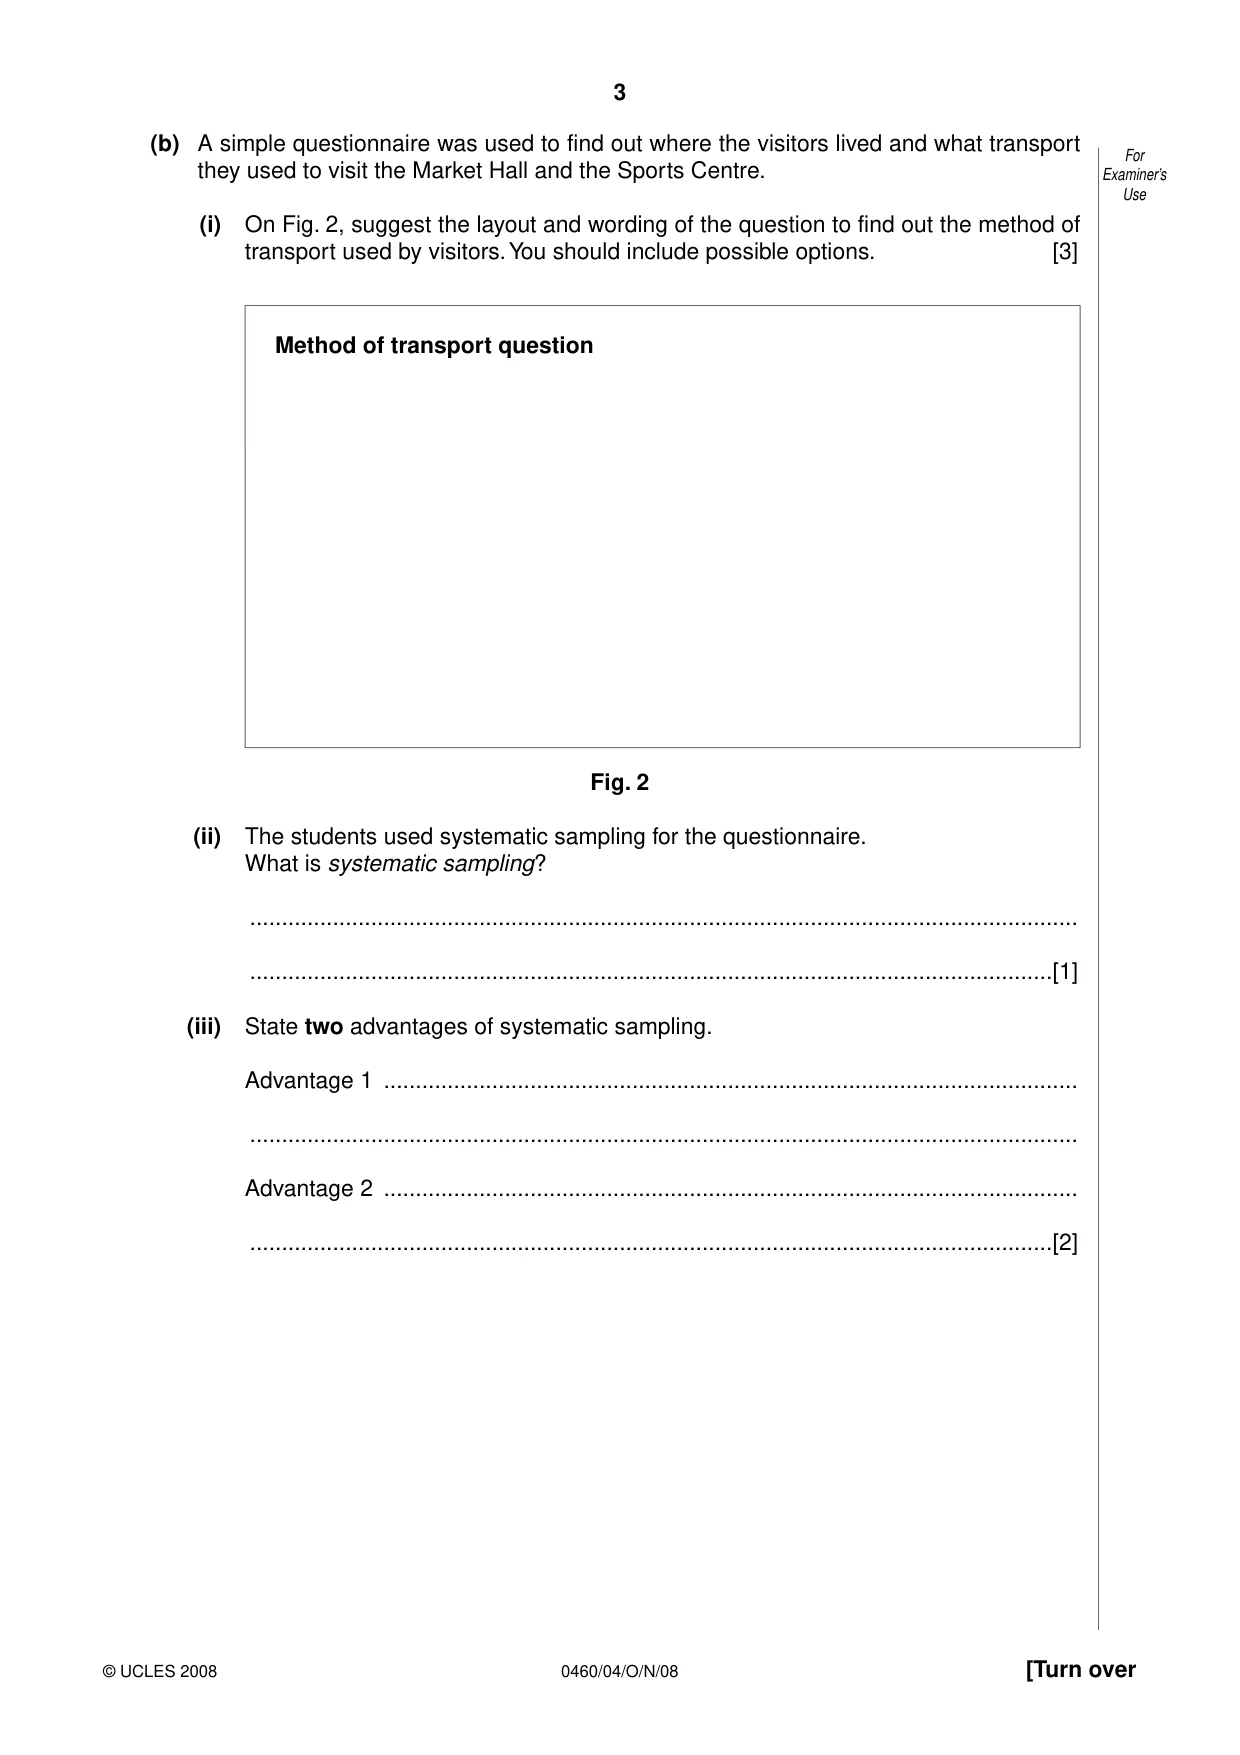
3 0460/04/O/N/08 © UCLES 2008 [Turn over For Examiner’s Use (b) A simple questionnaire was used to find out where the visitors lived and what transport they used to visit the Market Hall and the Sports Centre. (i) On Fig. 2, suggest the layout and wording of the question to find out the method of transport used by visitors. You should include possible options. [3] Method of transport question Fig. 2 (ii) The students used systematic sampling for the questionnaire. What is systematic sampling? … …[1] (iii) State two advantages of systematic sampling. Advantage 1 … … Advantage 2 … …[2]
Question paper, page 4
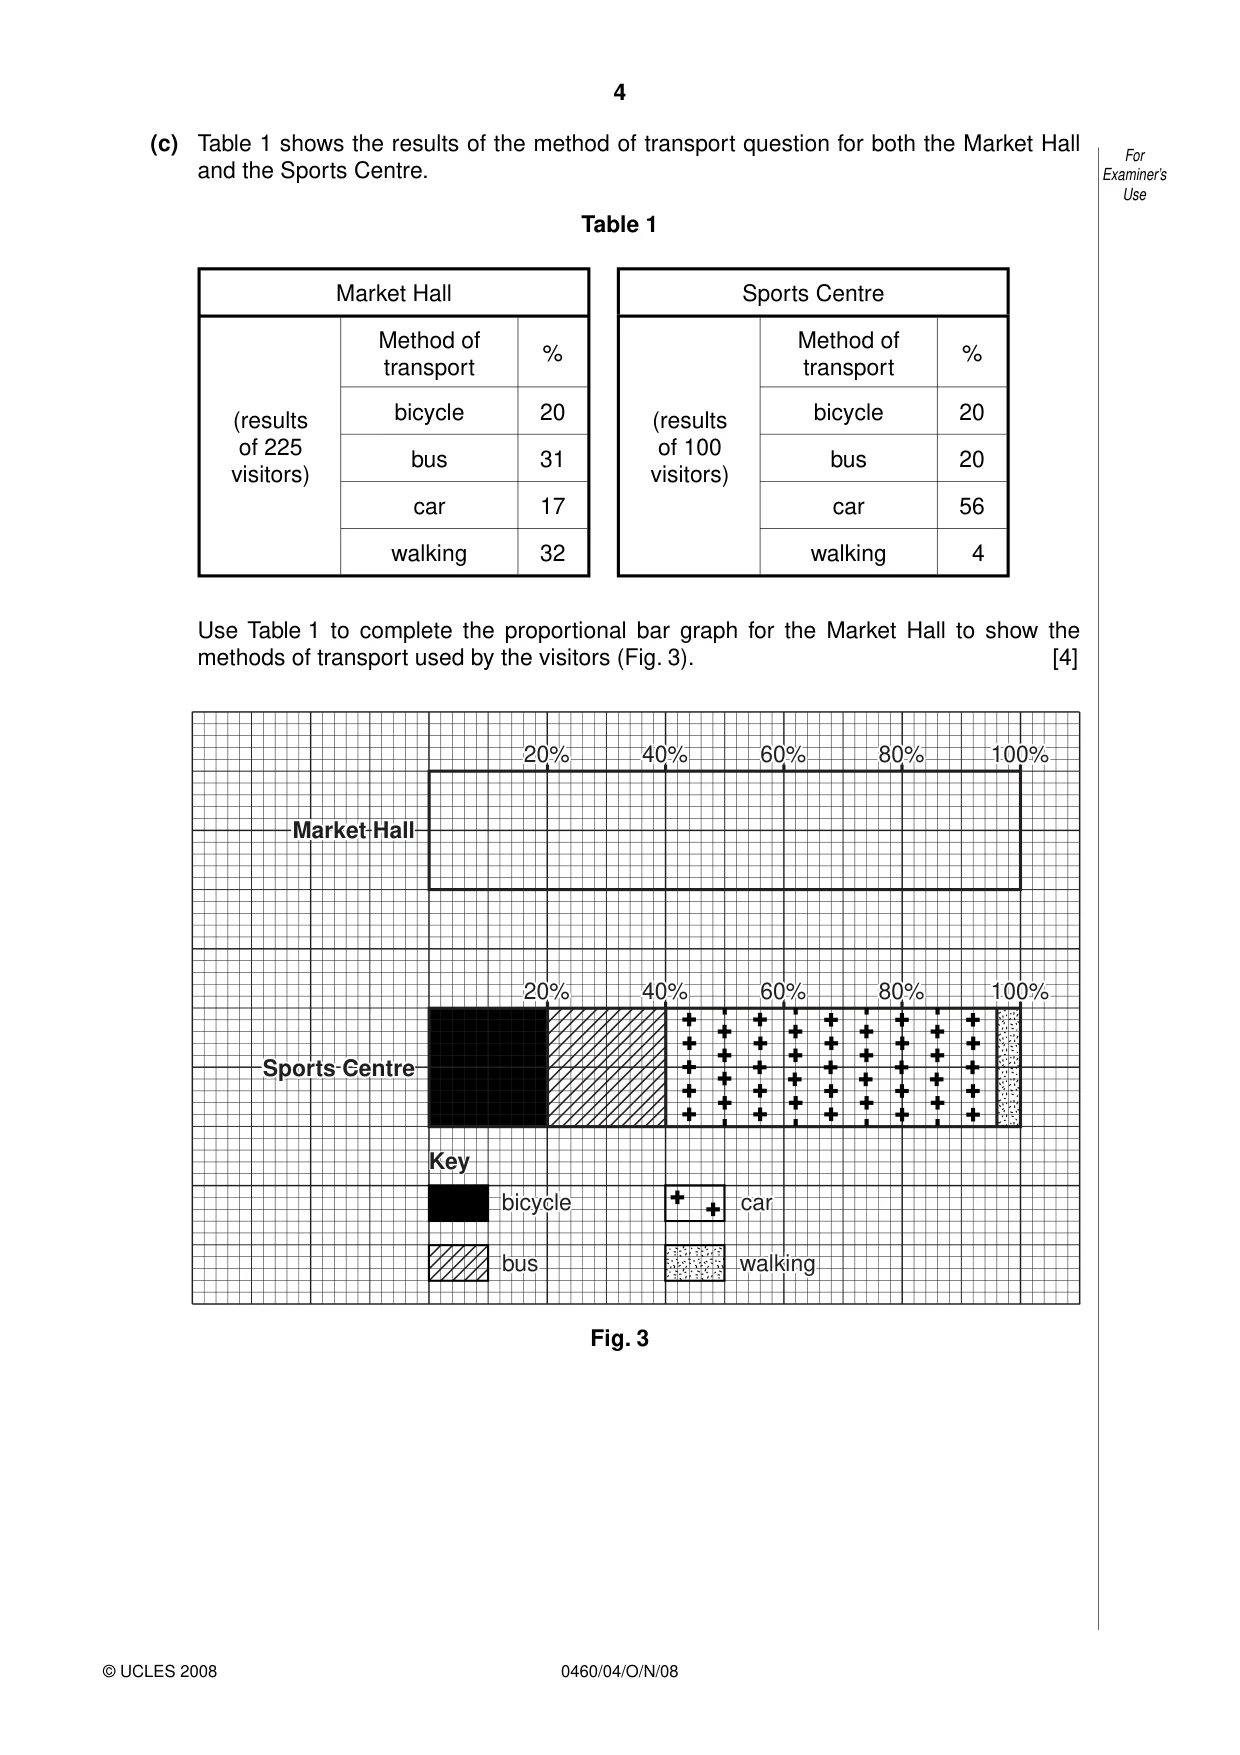
4 0460/04/O/N/08 © UCLES 2008 For Examiner’s Use (c) Table 1 shows the results of the method of transport question for both the Market Hall and the Sports Centre. Table 1 Market Hall Sports Centre (results of 225 visitors) Method of transport % (results of 100 visitors) Method of transport % bicycle 20 bicycle 20 bus 31 bus 20 car 17 car 56 walking 32 walking 4 Use Table 1 to complete the proportional bar graph for the Market Hall to show the methods of transport used by the visitors (Fig. 3). [4] 20% 20% 40% 40% 60% 60% 80% 80% 100% 100% 20% 40% 60% 80% 100% 20% 20% 40% 40% 60% 60% 80% 80% 100% 100% 20% 40% 60% 80% 100% Market Hall Market Hall Market Hall Sports Centre Sports Centre Sports Centre bicycle bicycle bicycle Key Key bus bus bus car car walking walking car walking Key Fig. 3
Question paper, page 5
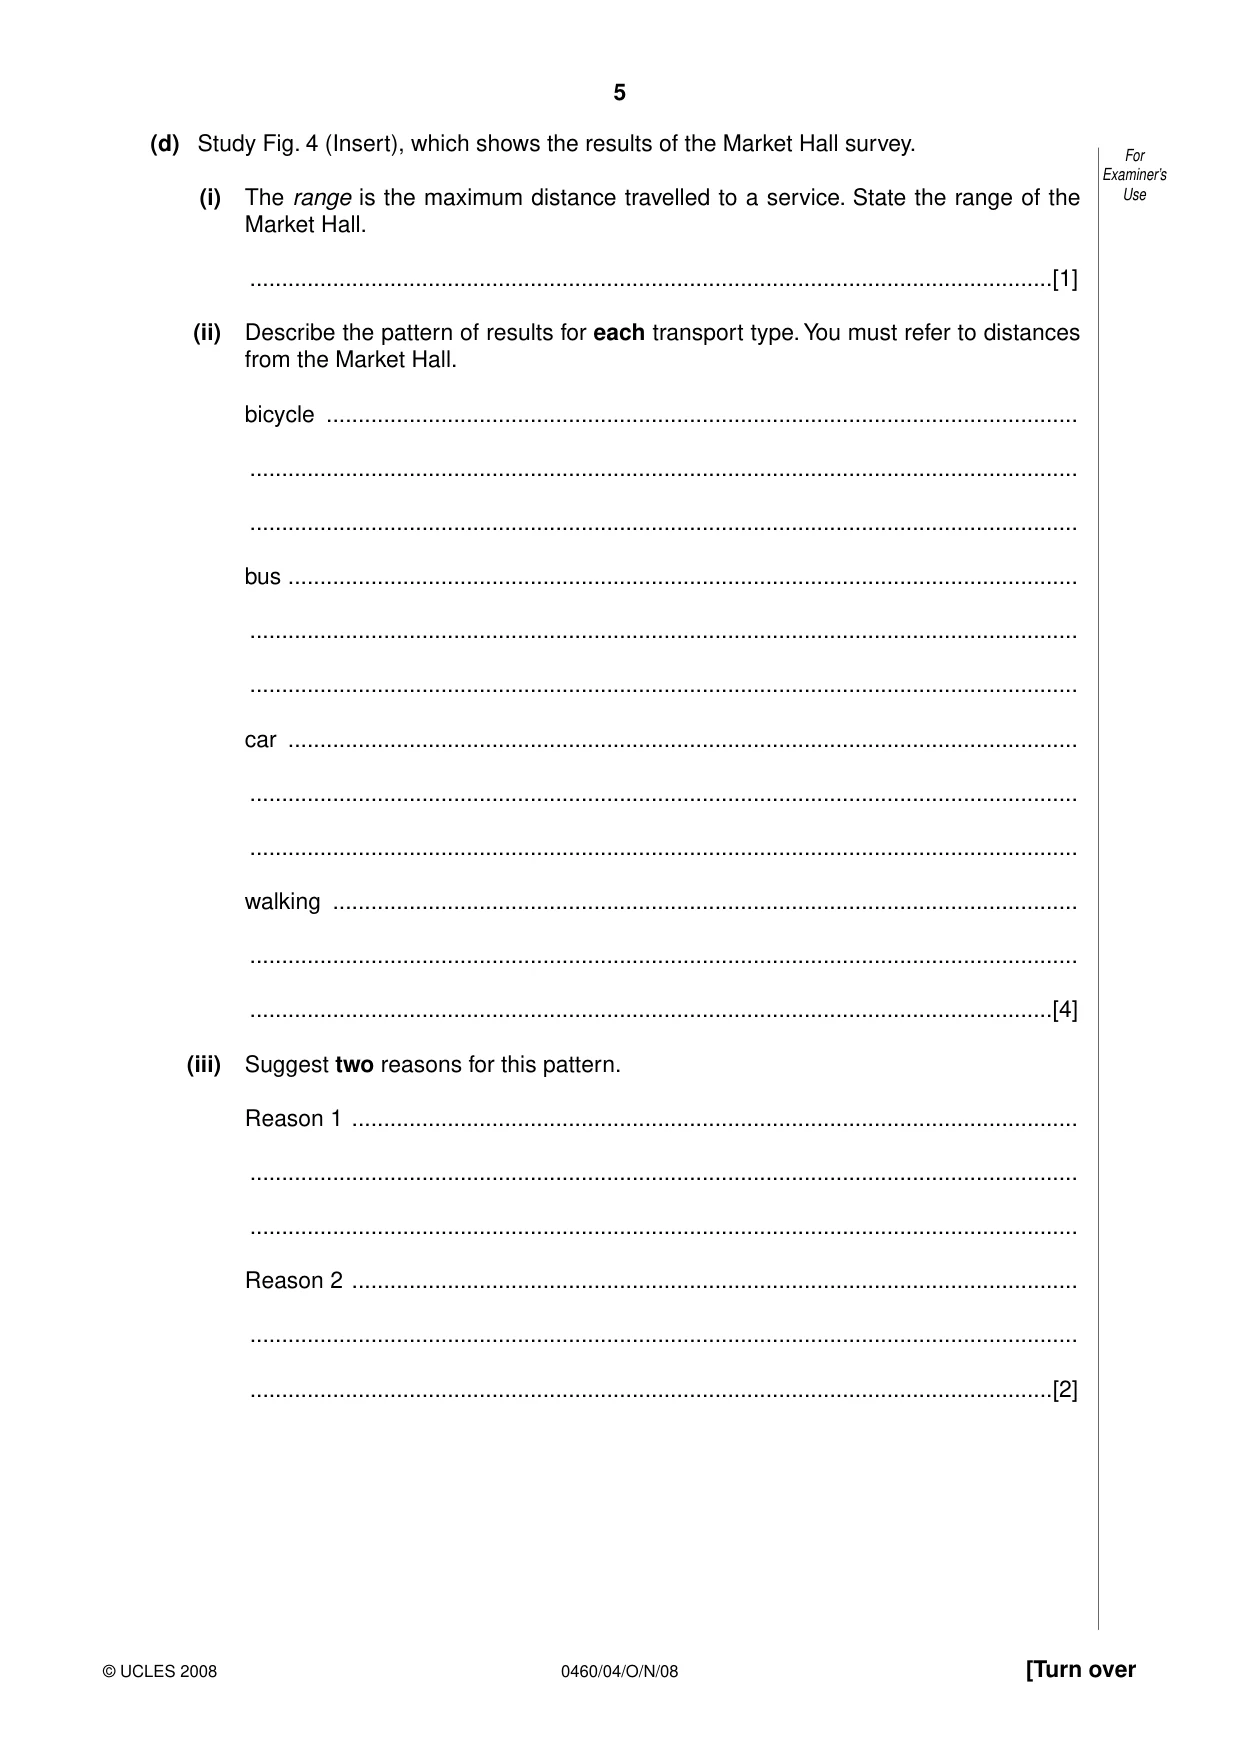
5 0460/04/O/N/08 © UCLES 2008 [Turn over For Examiner’s Use (d) Study Fig. 4 (Insert), which shows the results of the Market Hall survey. (i) The range is the maximum distance travelled to a service. State the range of the Market Hall. …[1] (ii) Describe the pattern of results for each transport type. You must refer to distances from the Market Hall. bicycle … … … bus … … … car … … … walking … … …[4] (iii) Suggest two reasons for this pattern. Reason 1 … … … Reason 2 … … …[2]
Question paper, page 6
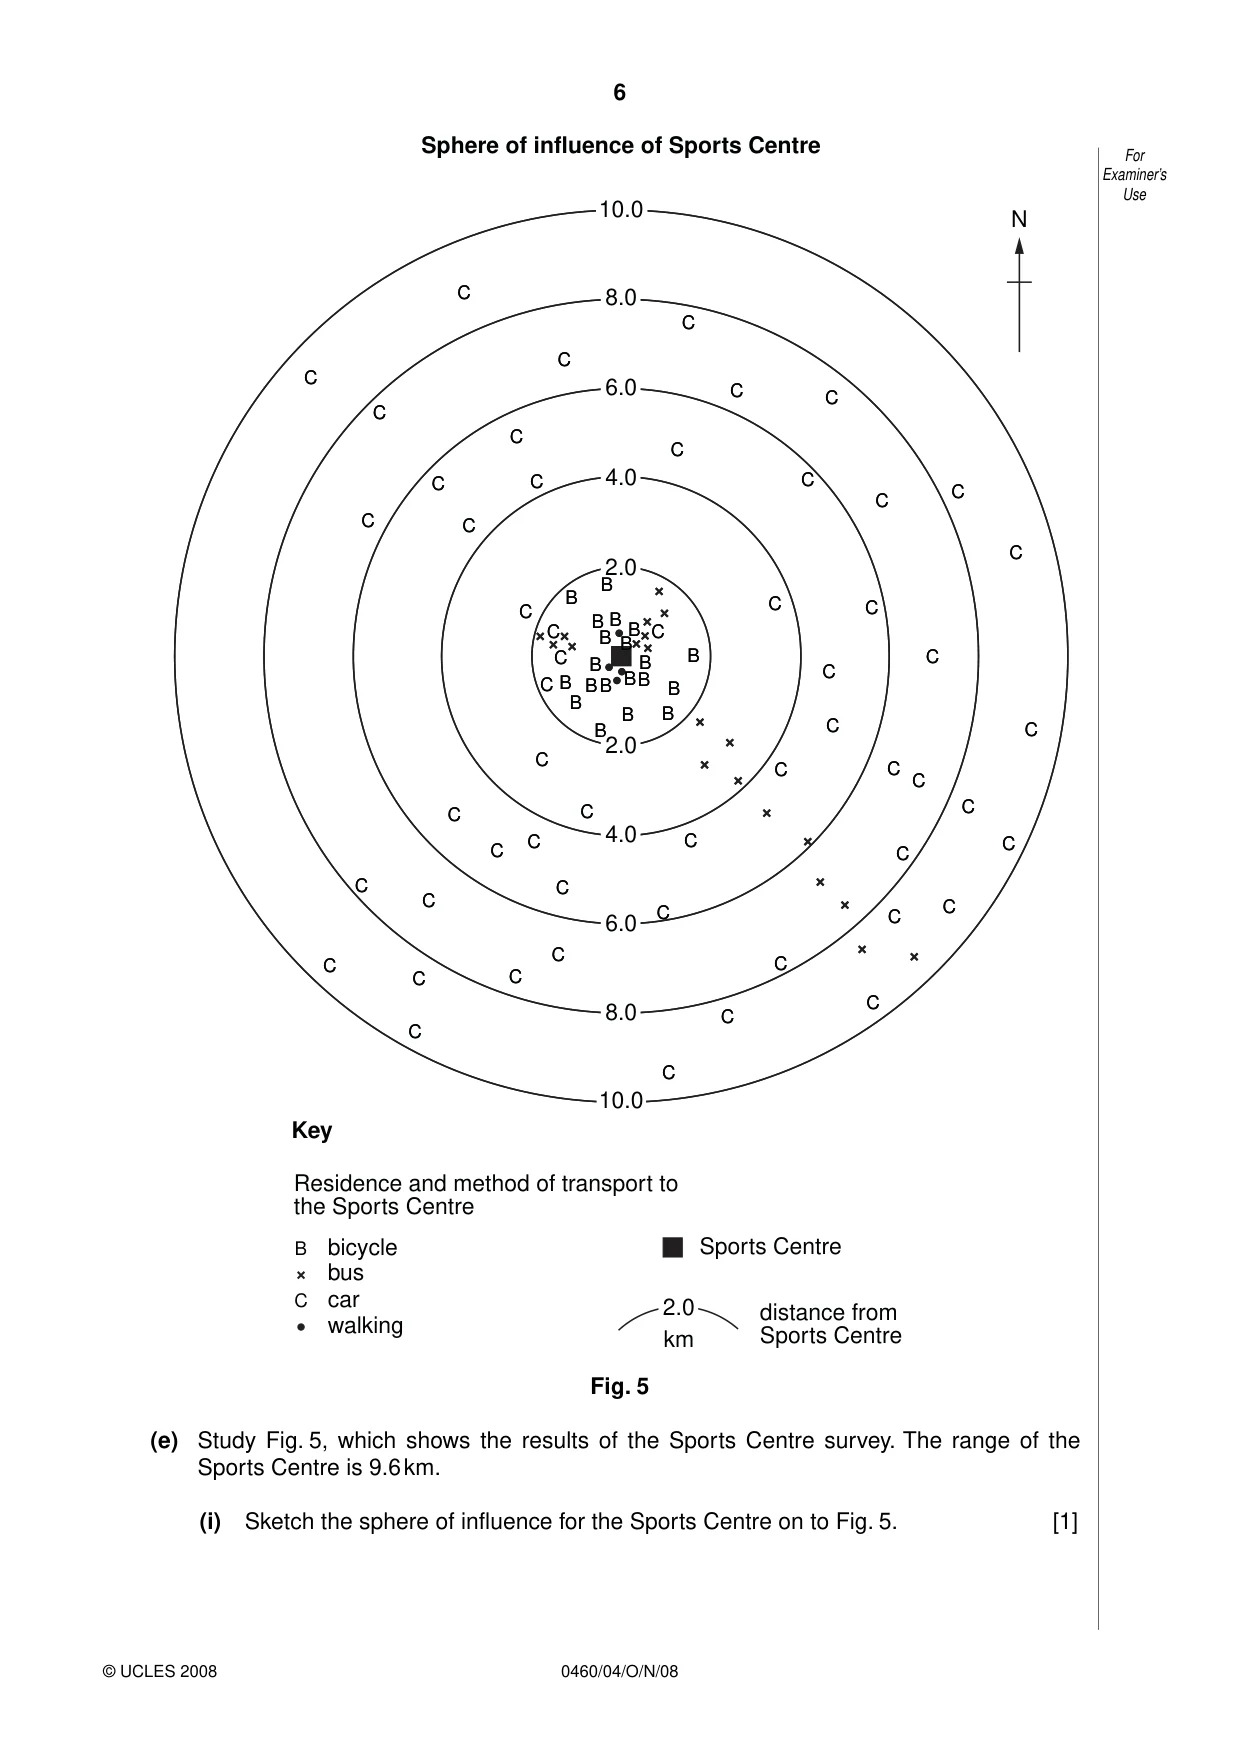
6 0460/04/O/N/08 © UCLES 2008 For Examiner’s Use C C C C C C C B B B B B B B B B B B B B BB B B B C C C C C C C C C C C C C C C C C C C C C C C C C C C C C C C C C C C C C C C C C C C C C C C C 10.0 B2.0 5.0 6.0 8.0 8.0 6.0 4.0 10.0 2.0 B C C C C C C C B B B B B B B B B B B B B B BB B B B C C C C C C C C C C C C C C C C C C C C C C C C C C C C C C C C C C C C C C C C C C C C C C C C C 10.0 B2.0 4.0 6.0 8.0 8.0 6.0 4.0 10.0 Sphere of influence of Sports Centre Key bicycle Sports Centre distance from Sports Centre km Residence and method of transport to the Sports Centre bus car walking N 2.0 2.0 2.0 B Fig. 5 (e) Study Fig. 5, which shows the results of the Sports Centre survey. The range of the Sports Centre is 9.6 km. (i) Sketch the sphere of influence for the Sports Centre on to Fig. 5. [1]
Question paper, page 7
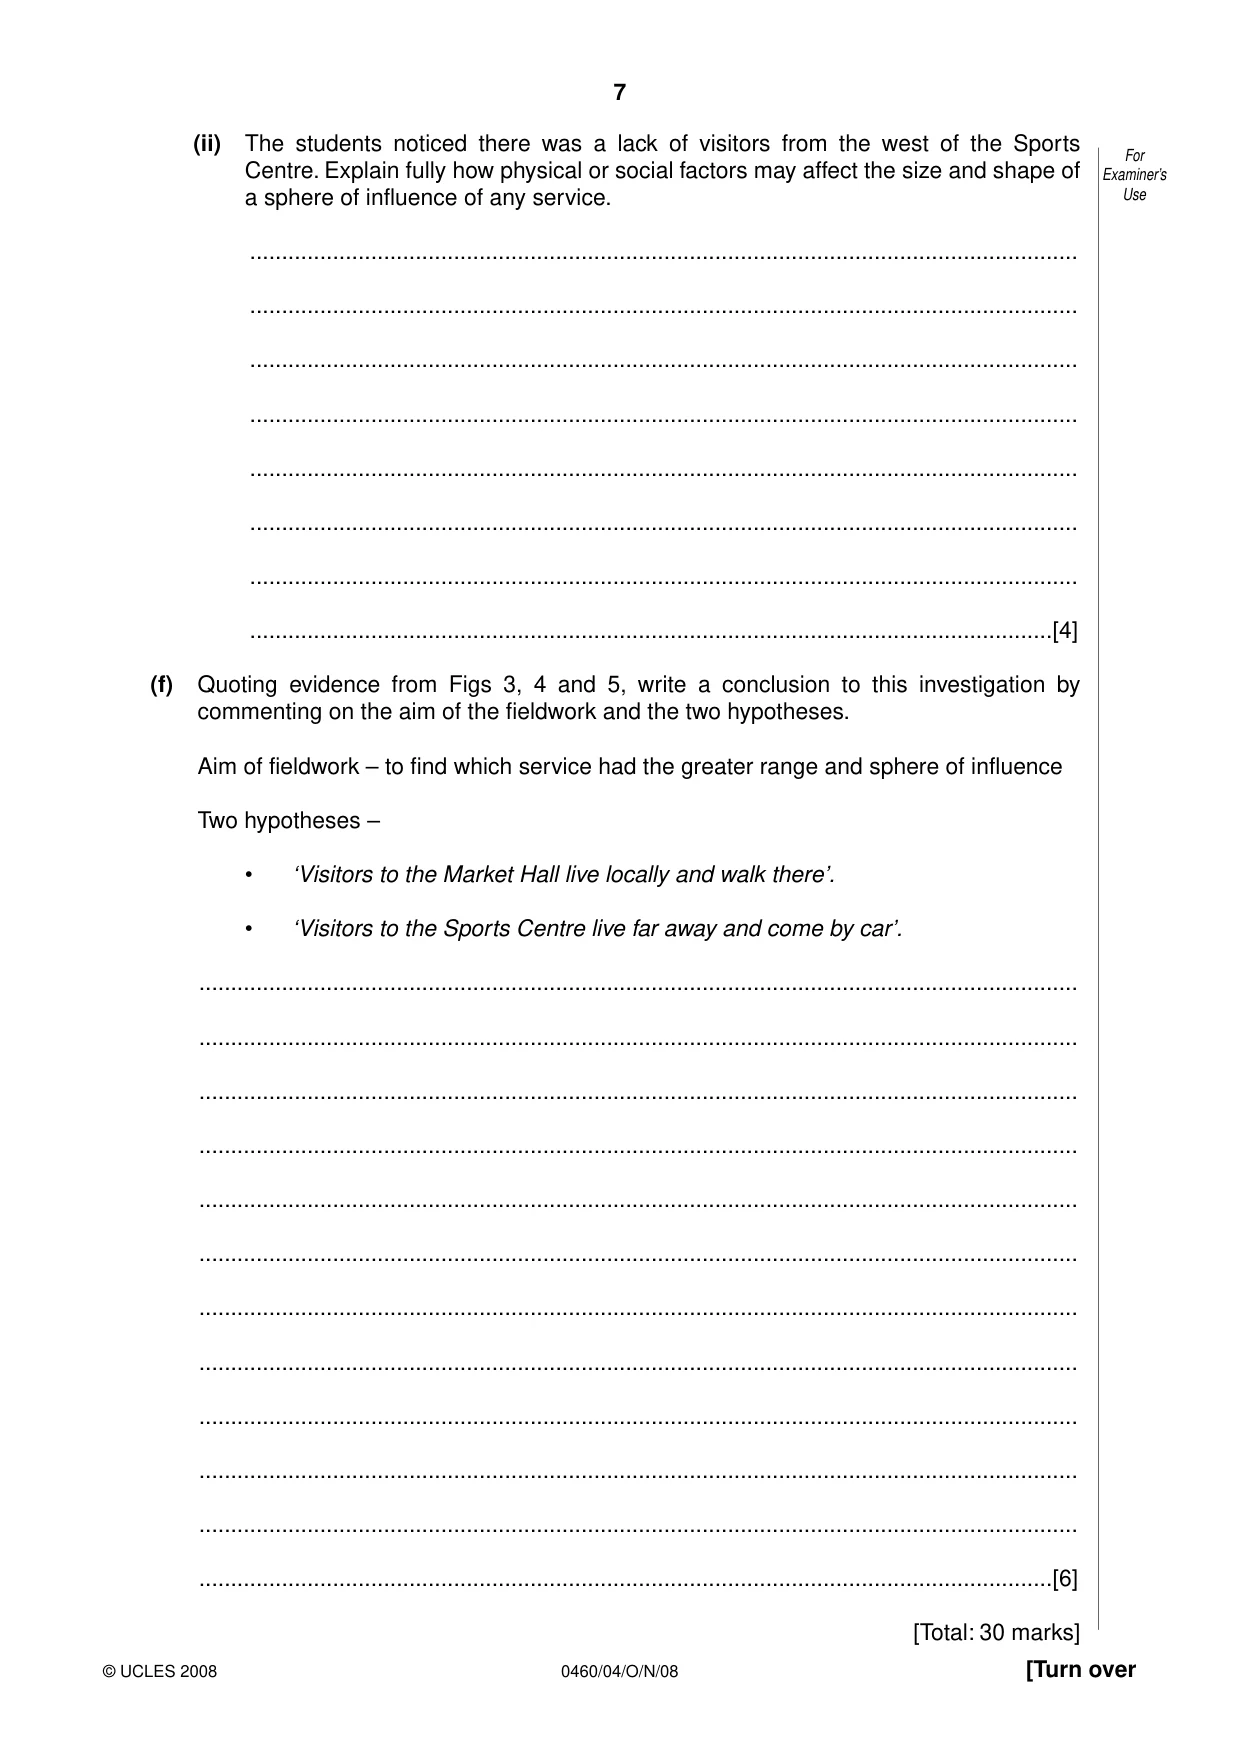
7 0460/04/O/N/08 © UCLES 2008 [Turn over For Examiner’s Use (ii) The students noticed there was a lack of visitors from the west of the Sports Centre. Explain fully how physical or social factors may affect the size and shape of a sphere of influence of any service. … … … … … … … …[4] (f) Quoting evidence from Figs 3, 4 and 5, write a conclusion to this investigation by commenting on the aim of the fieldwork and the two hypotheses. Aim of fieldwork – to find which service had the greater range and sphere of influence Two hypotheses – • ‘Visitors to the Market Hall live locally and walk there’. • ‘Visitors to the Sports Centre live far away and come by car’. … … … … … … … … … … … …[6] [Total: 30 marks]
Question paper, page 8
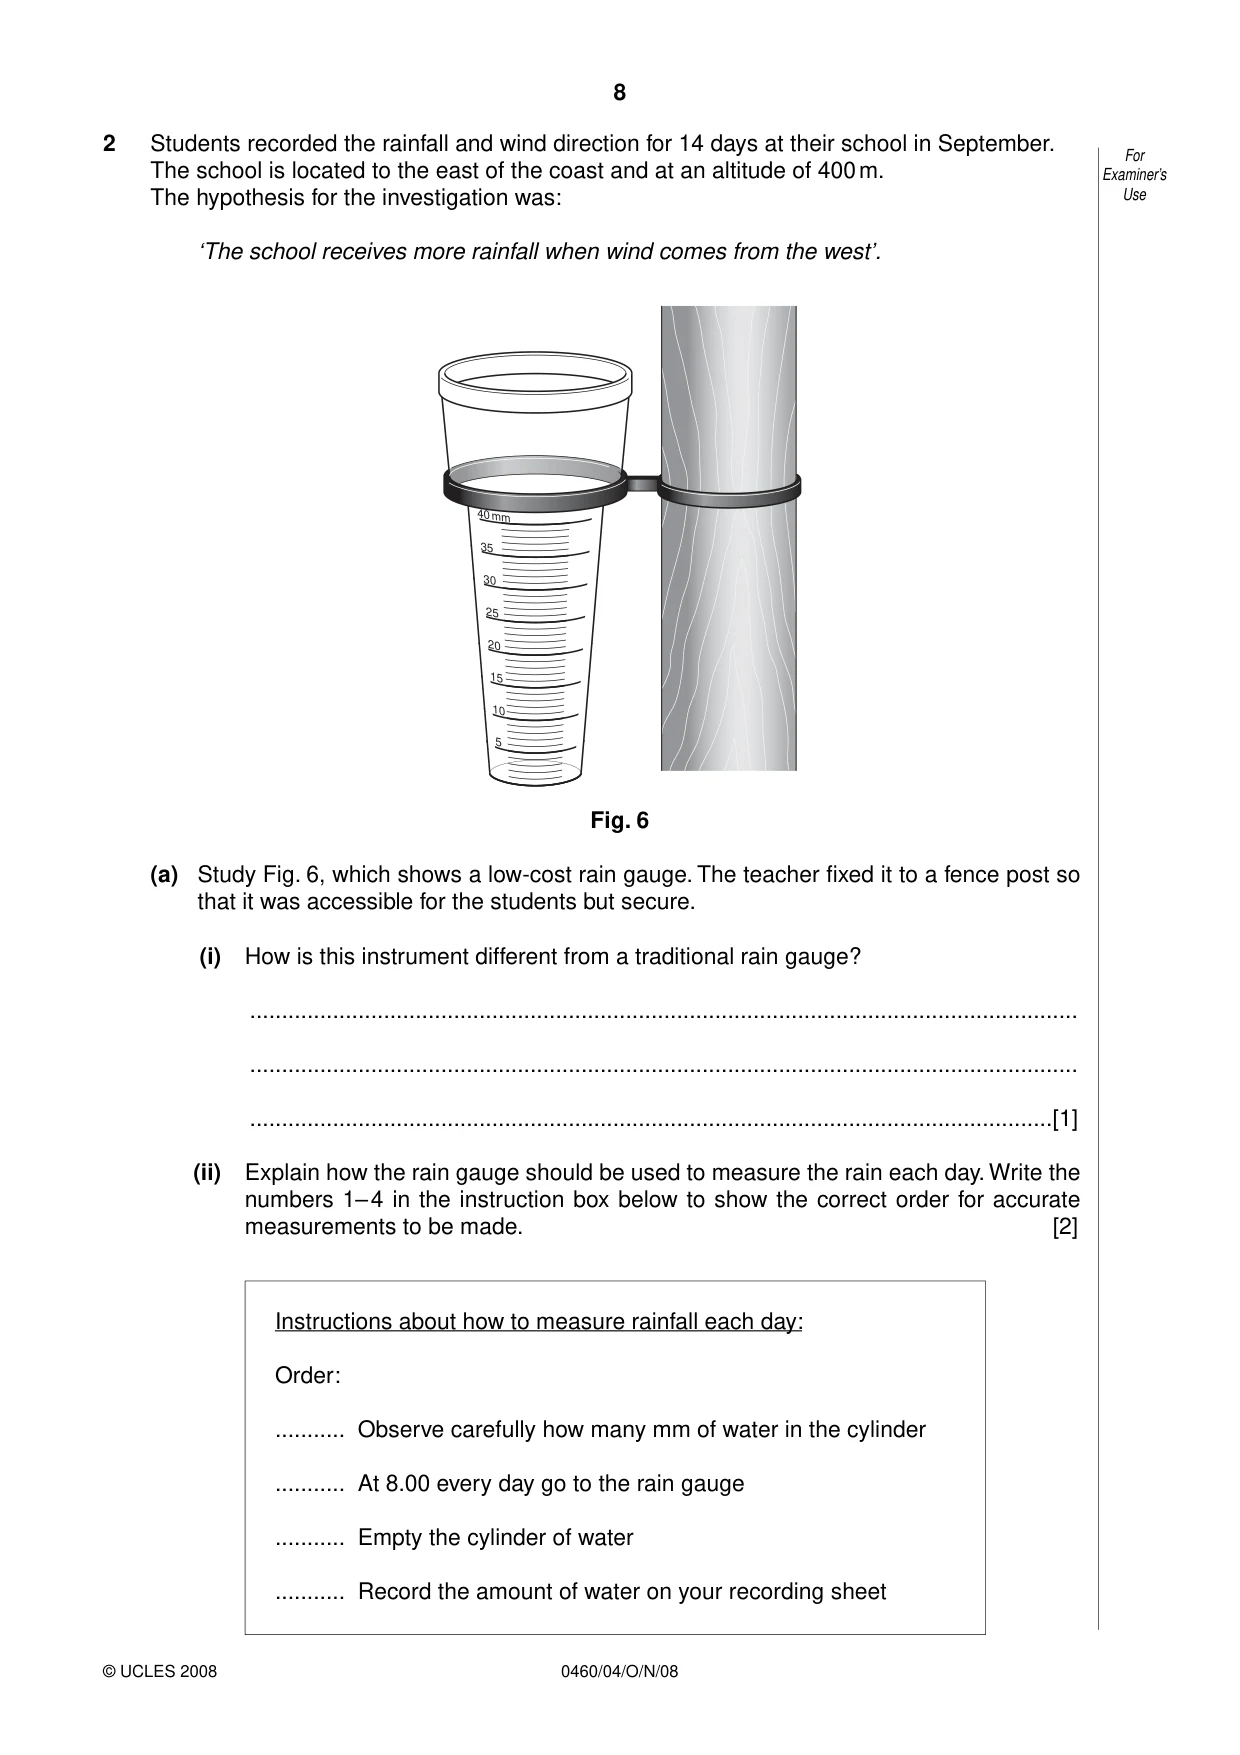
8 0460/04/O/N/08 © UCLES 2008 For Examiner’s Use 2 Students recorded the rainfall and wind direction for 14 days at their school in September. The school is located to the east of the coast and at an altitude of 400 m. The hypothesis for the investigation was: ‘The school receives more rainfall when wind comes from the west’. 40 mm 35 30 25 20 15 10 5 Fig. 6 (a) Study Fig. 6, which shows a low-cost rain gauge. The teacher fixed it to a fence post so that it was accessible for the students but secure. (i) How is this instrument different from a traditional rain gauge? … … …[1] (ii) Explain how the rain gauge should be used to measure the rain each day. Write the numbers 1– 4 in the instruction box below to show the correct order for accurate measurements to be made. [2] Instructions about how to measure rainfall each day: Order: … Observe carefully how many mm of water in the cylinder … At 8.00 every day go to the rain gauge … Empty the cylinder of water … Record the amount of water on your recording sheet
Question paper, page 9
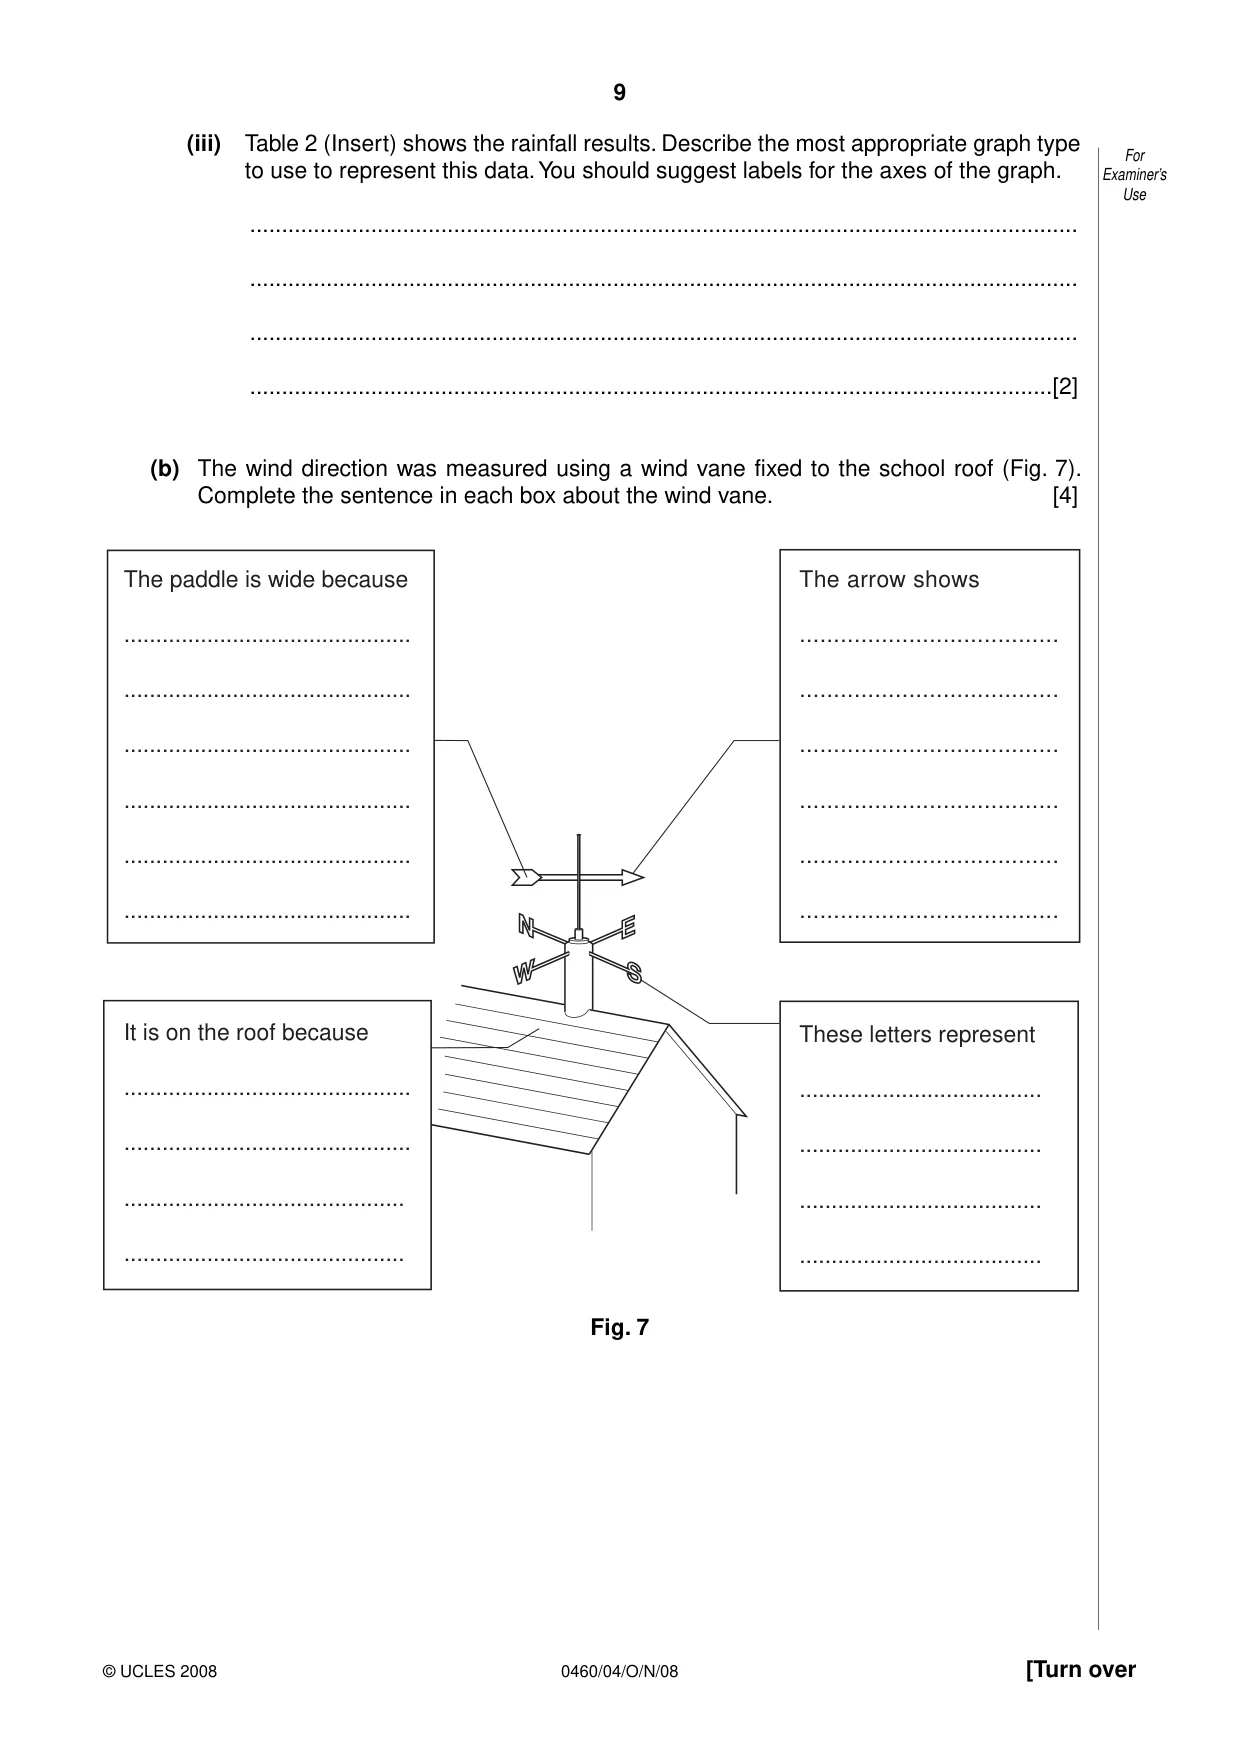
9 0460/04/O/N/08 © UCLES 2008 [Turn over For Examiner’s Use (iii) Table 2 (Insert) shows the rainfall results. Describe the most appropriate graph type to use to represent this data. You should suggest labels for the axes of the graph. … … … …[2] (b) The wind direction was measured using a wind vane fixed to the school roof (Fig. 7). Complete the sentence in each box about the wind vane. [4] The paddle is wide because … … … … … … It is on the roof because … … … … The arrow shows … … … … … … These letters represent … … … … Fig. 7
Question paper, page 10
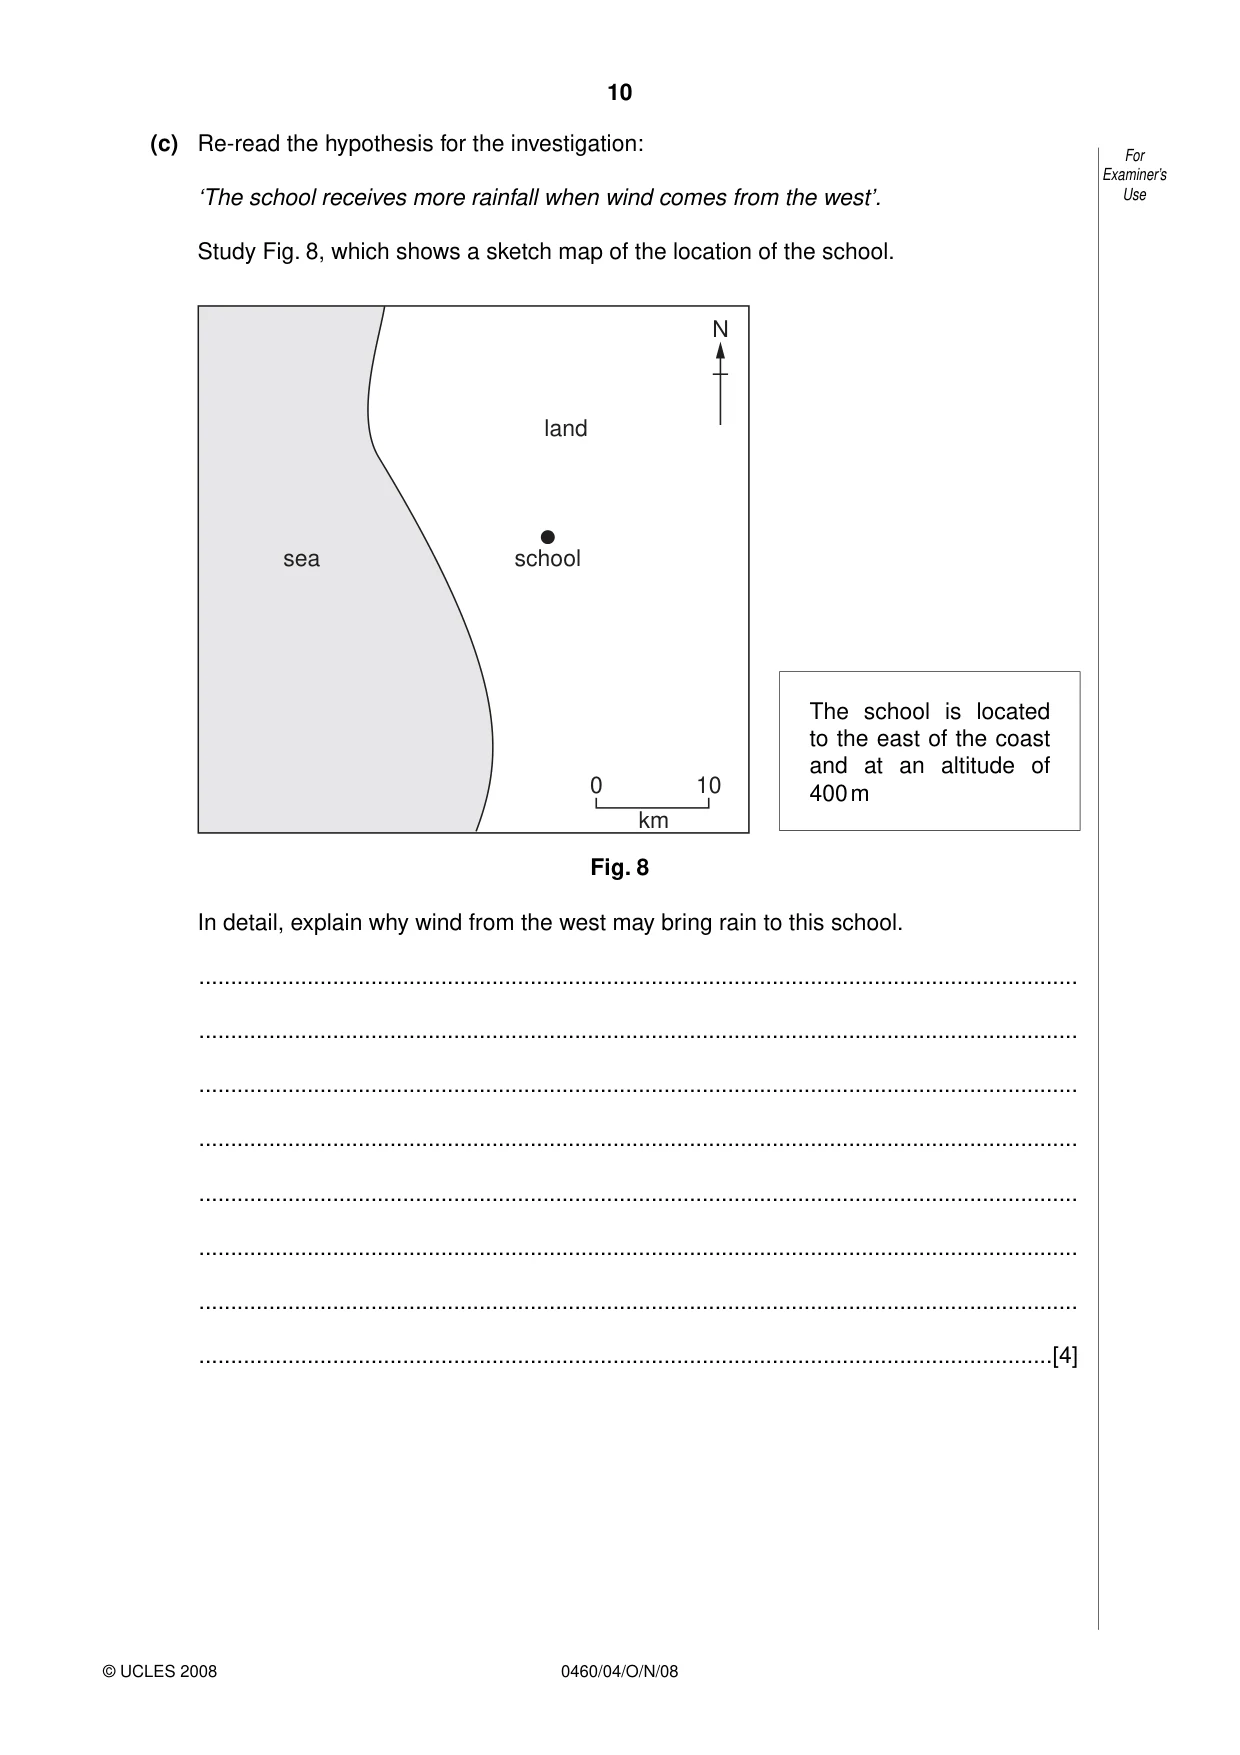
10 0460/04/O/N/08 © UCLES 2008 For Examiner’s Use (c) Re-read the hypothesis for the investigation: ‘The school receives more rainfall when wind comes from the west’. Study Fig. 8, which shows a sketch map of the location of the school. sea land school N 0 10 km The school is located to the east of the coast and at an altitude of 400 m Fig. 8 In detail, explain why wind from the west may bring rain to this school. … … … … … … … …[4]
Question paper, page 11
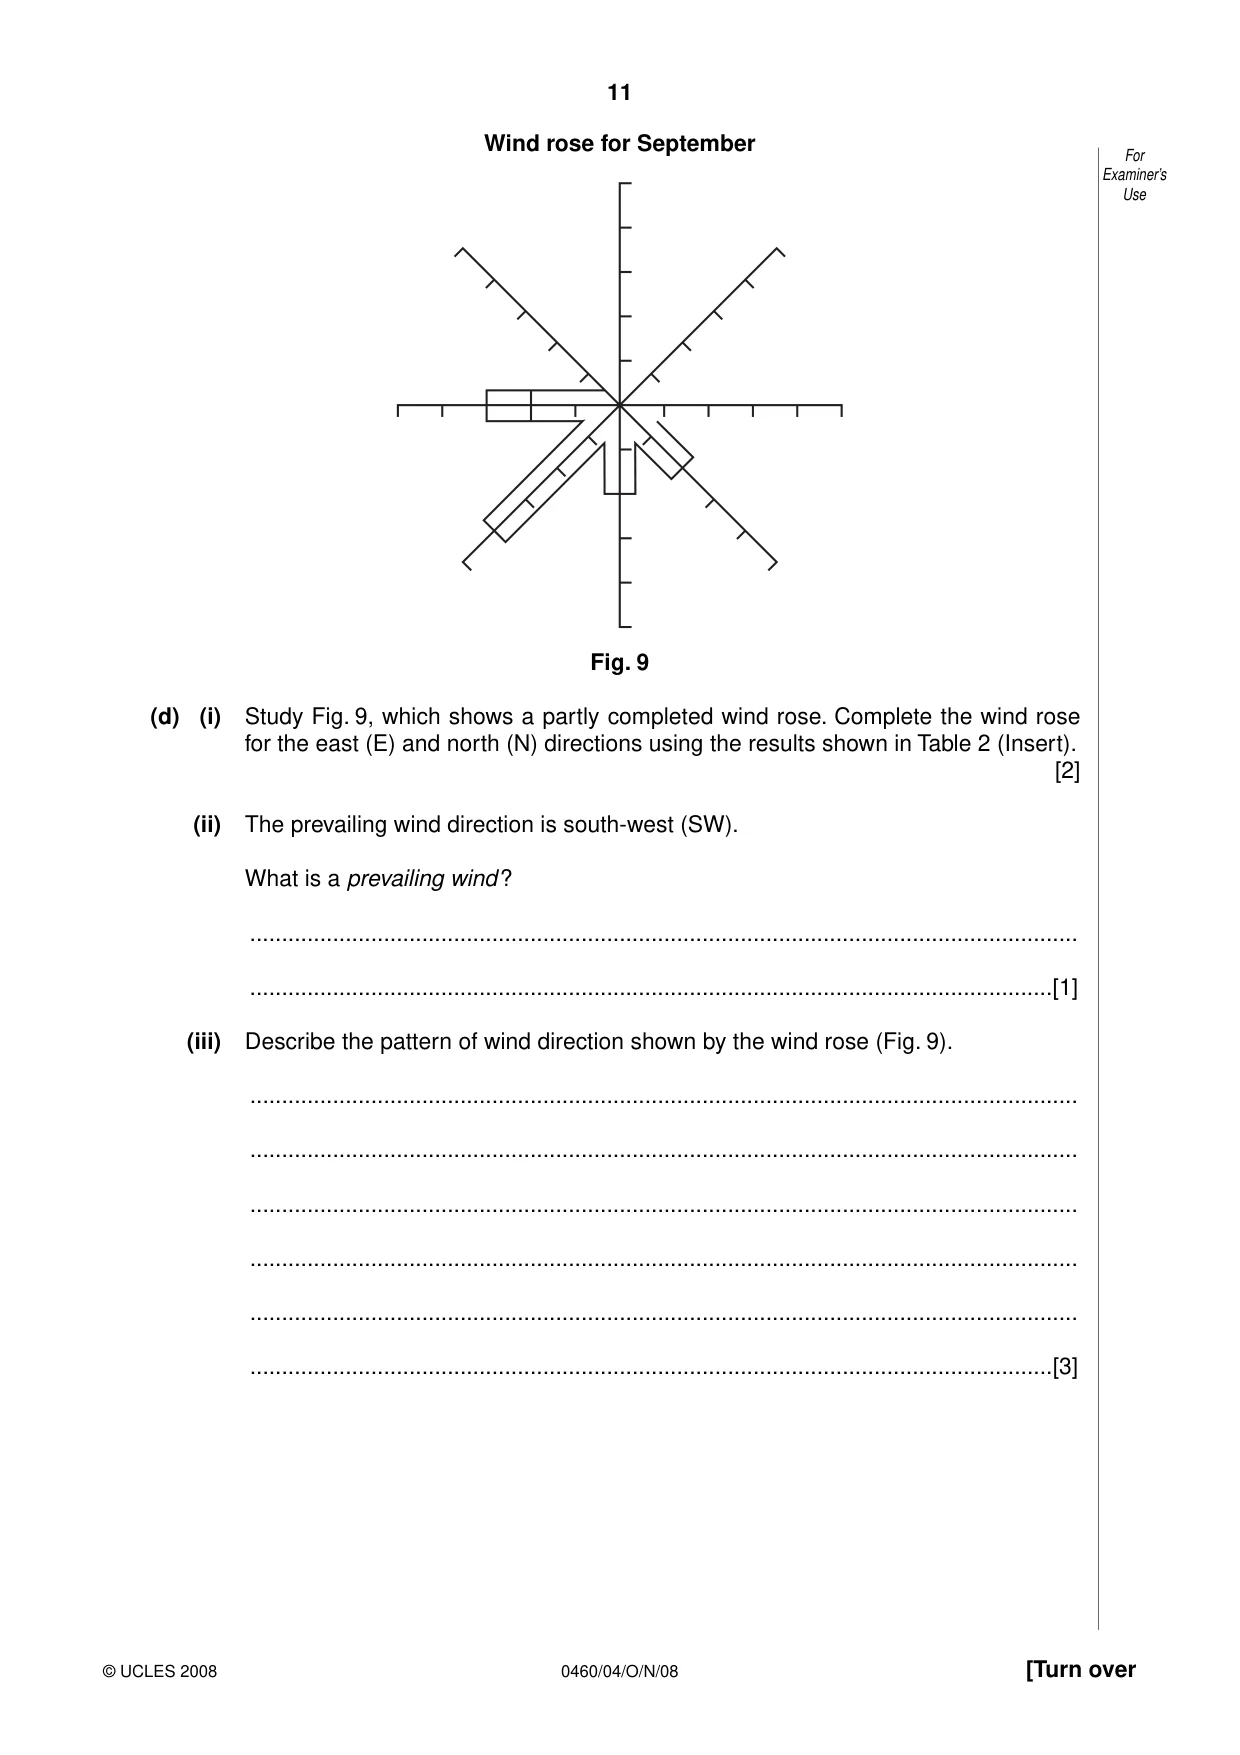
11 0460/04/O/N/08 © UCLES 2008 [Turn over For Examiner’s Use Wind rose for September Fig. 9 (d) (i) Study Fig. 9, which shows a partly completed wind rose. Complete the wind rose for the east (E) and north (N) directions using the results shown in Table 2 (Insert). [2] (ii) The prevailing wind direction is south-west (SW). What is a prevailing wind ? … …[1] (iii) Describe the pattern of wind direction shown by the wind rose (Fig. 9). … … … … … …[3]
Question paper, page 12
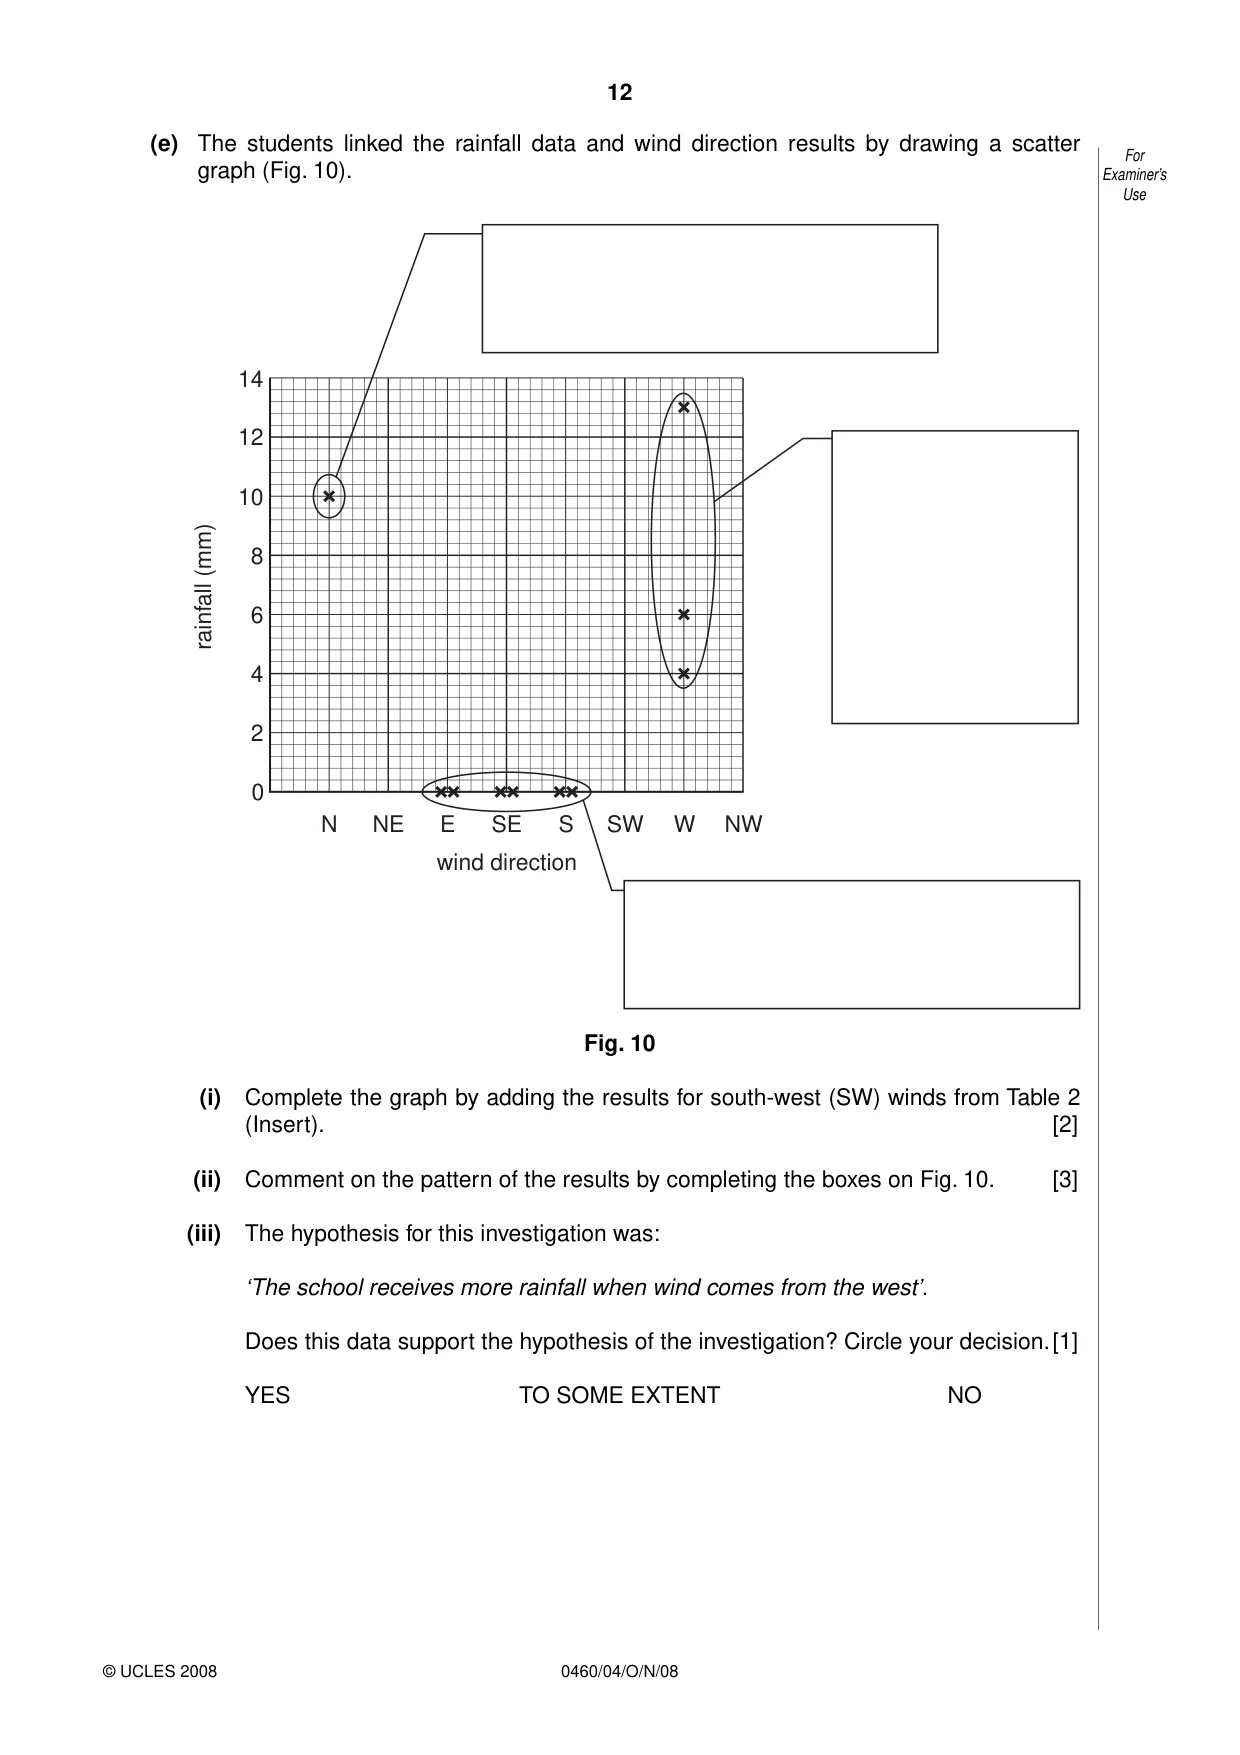
12 0460/04/O/N/08 © UCLES 2008 For Examiner’s Use (e) The students linked the rainfall data and wind direction results by drawing a scatter graph (Fig. 10). 2 0 N NE E SE wind direction S SW W NW 4 6 8 rainfall (mm) 10 12 14 Fig. 10 (i) Complete the graph by adding the results for south-west (SW) winds from Table 2 (Insert). [2] (ii) Comment on the pattern of the results by completing the boxes on Fig. 10. [3] (iii) The hypothesis for this investigation was: ‘The school receives more rainfall when wind comes from the west’. Does this data support the hypothesis of the investigation? Circle your decision. [1] YES TO SOME EXTENT NO
Question paper, page 13
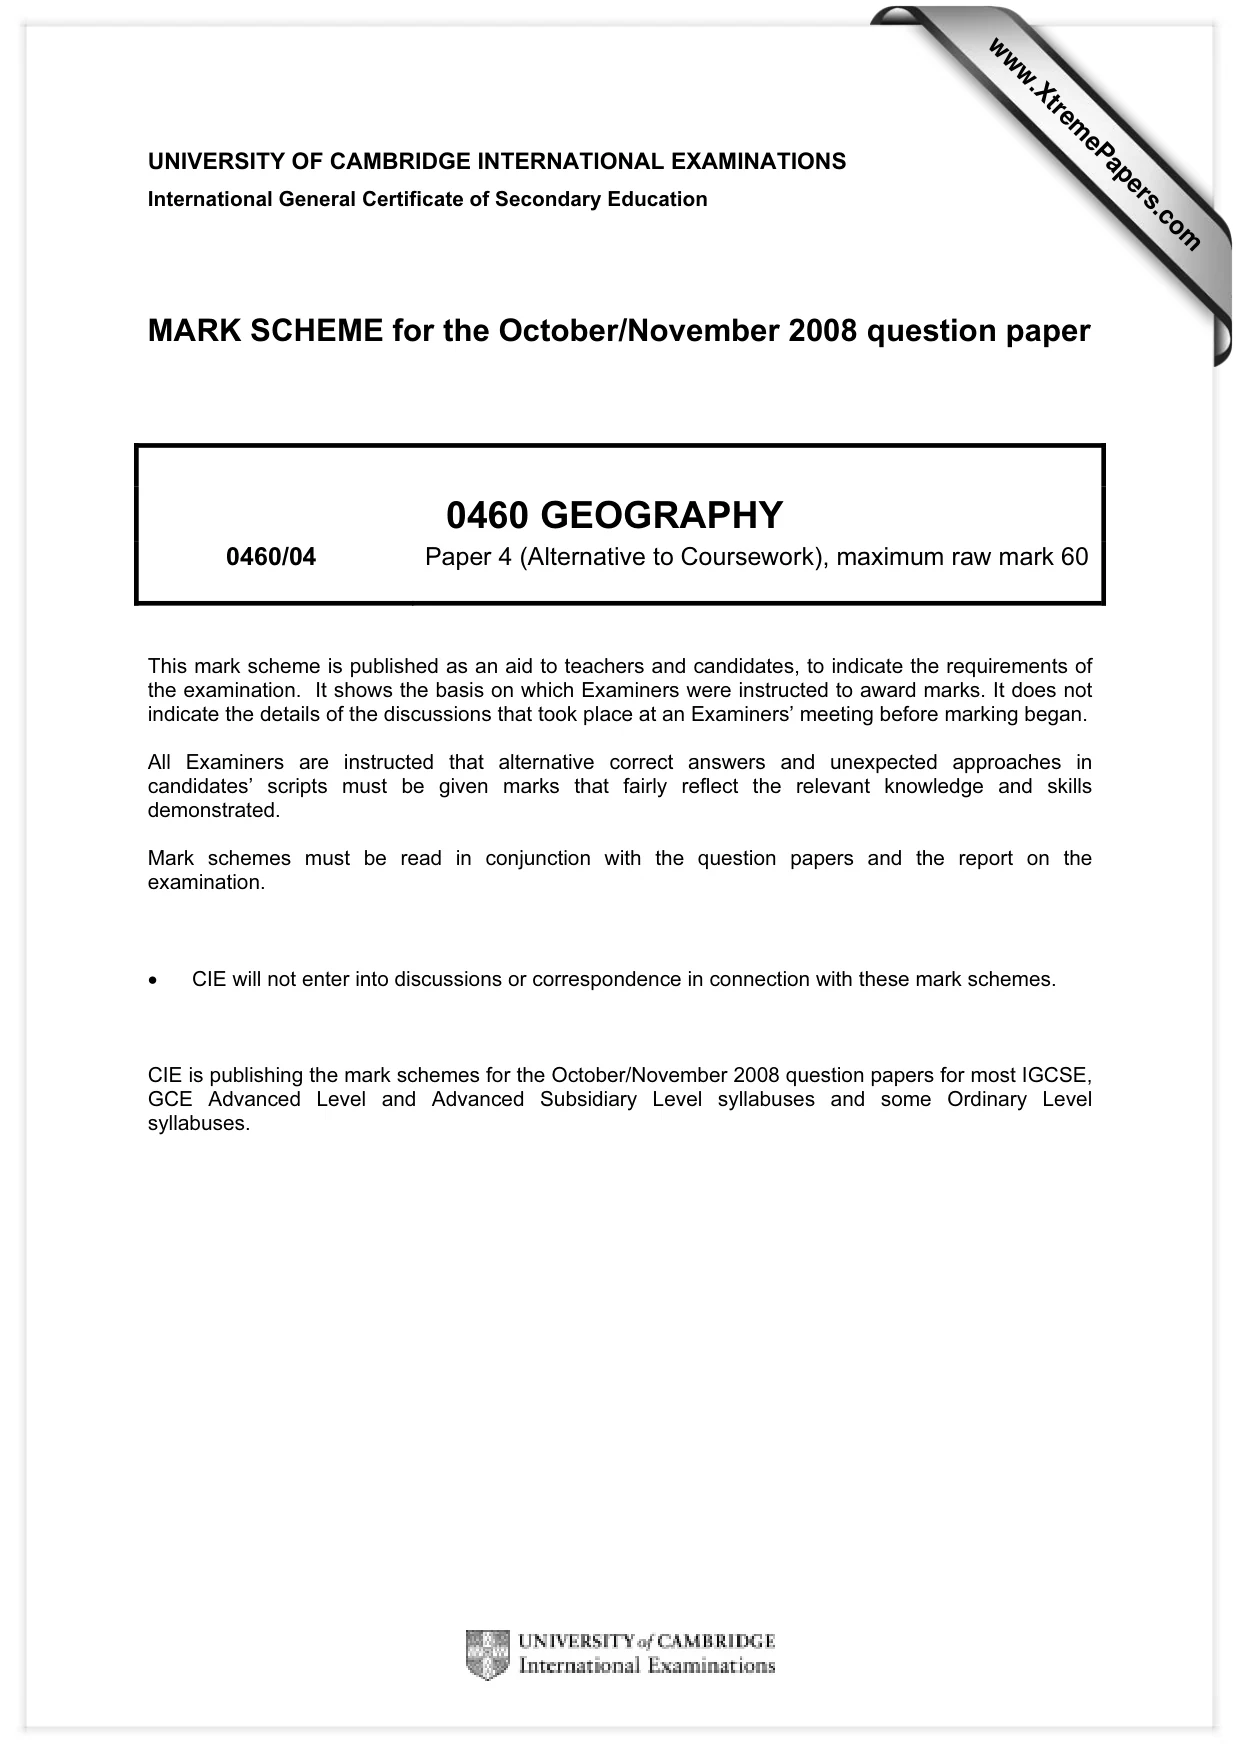
13 0460/04/O/N/08 © UCLES 2008 For Examiner’s Use (f) In detail, suggest how this weather investigation could be improved and extended to make it more reliable and representative. … … … … … … … … … … … …[5] [Total: 30 marks]
Question paper, page 16
16 0460/04/O/N/08 BLANK PAGE Permission to reproduce items where third-party owned material protected by copyright is included has been sought and cleared where possible. Every reasonable effort has been made by the publisher (UCLES) to trace copyright holders, but if any items requiring clearance have unwittingly been included, the publisher will be pleased to make amends at the earliest possible opportunity. University of Cambridge International Examinations is part of the Cambridge Assessment Group. Cambridge Assessment is the brand name of University of Cambridge Local Examinations Syndicate (UCLES), which is itself a department of the University of Cambridge.
Mark scheme, page 1
UNIVERSITY OF CAMBRIDGE INTERNATIONAL EXAMINATIONS International General Certificate of Secondary Education MARK SCHEME for the October/November 2008 question paper 0460 GEOGRAPHY 0460/04 Paper 4 (Alternative to Coursework), maximum raw mark 60 This mark scheme is published as an aid to teachers and candidates, to indicate the requirements of the examination. It shows the basis on which Examiners were instructed to award marks. It does not indicate the details of the discussions that took place at an Examiners’ meeting before marking began. All Examiners are instructed that alternative correct answers and unexpected approaches in candidates’ scripts must be given marks that fairly reflect the relevant knowledge and skills demonstrated. Mark schemes must be read in conjunction with the question papers and the report on the examination. • CIE will not enter into discussions or correspondence in connection with these mark schemes. CIE is publishing the mark schemes for the October/November 2008 question papers for most IGCSE, GCE Advanced Level and Advanced Subsidiary Level syllabuses and some Ordinary Level syllabuses. www.XtremePapers.com
Mark scheme, page 2
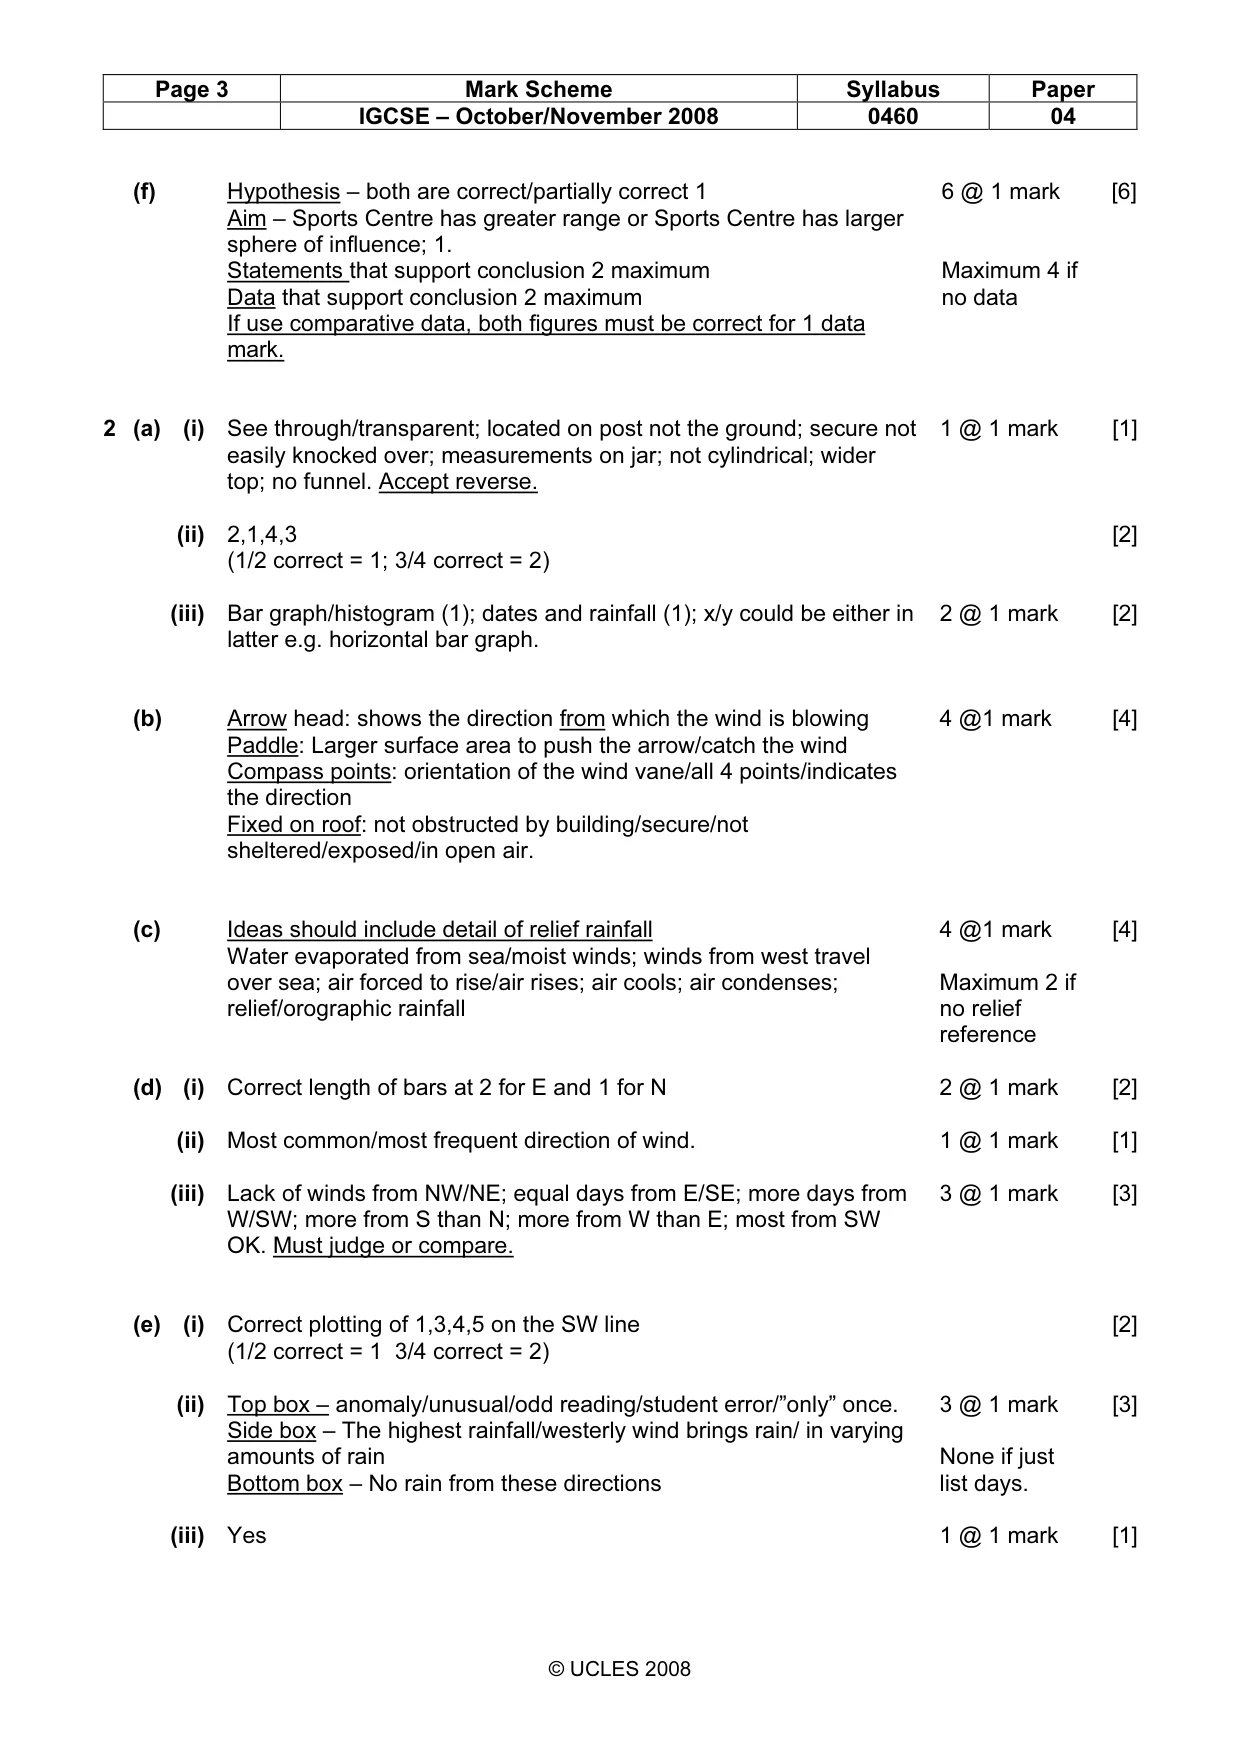
Page 2 Mark Scheme Syllabus Paper IGCSE – October/November 2008 0460 04 © UCLES 2008 1 (a) Cheap, frequently, work, open (1/2 correct =1; 3/4 correct = 2) 2 @ 1 mark [2] (b) (i) ‘How did you travel here?/What mode of transport did you use? Layout in boxes of different transport e.g. car, bus, walk 1 = Question (Not essential for expression to be in the form of a question), 1 = Choices (3 relevant exc. other), 1 for Layout (Boxes/grids or instruction that works e.g. circle) 3 @ 1 mark [3] (ii) Regular sampling/equally spaced sampling/e.g. every fifth person; ref. to “Order” must be qualified. 1 @ 1 mark [1] (iii) Advantages e.g. not biased/fair test (1); easy/simple/faster (1) 1 @ 2 marks [2] (c) Complete proportional bar graph at 20%, 31% (51%), 17% (68%) and 32% with correct key. Mark 1 per line then 1 for correct key. 4 @1 mark [4] (d) (i) 2.2/2.3 km 1 @ 1 mark [1] (ii) Bicycle – most within 0.5km/all within 1.5km/close to market hall Bus – in lines away from market hall/grouped/clustered/certain directions/up to 2.2km Car – from all directions/up to 2.2/2.3km away/most 0.5/2km Walking – Close to market hall/most within 0.5km/up to 1km References to 2.5km too vague. Distance or pattern OK. 4 @1 mark [4] (iii) Any sensible comment related to pattern of transport e.g. people not prepared to walk/bike far/not far as uses up energy/walking is free/no parking fines; bus in lines due to routes/bus routes to where non-drivers live; cars more flexible means of transport Maximum of 1 per means of transport. 2 @ 1 mark [2] (e) (i) Sketch line to include all outer most points (can join up) and inwards at western side to at least 4km ring. 1 @ 1 mark [1] (ii) Explain fully needs more than list; allow (1 + 1) for development. e.g. Higher land/mountain restricts access/no one lives there; Lake/sea may be there. River may be there – hard to get over/access issues. Poor roads – take too long. Another/cheaper sports centre is competition; Poorer area so cannot afford to travel/pay for sports. 4 @ 1 mark Maximum 2 for simple list [4]
Mark scheme, page 3
Page 3 Mark Scheme Syllabus Paper IGCSE – October/November 2008 0460 04 © UCLES 2008 (f) Hypothesis – both are correct/partially correct 1 Aim – Sports Centre has greater range or Sports Centre has larger sphere of influence; 1. Statements that support conclusion 2 maximum Data that support conclusion 2 maximum If use comparative data, both figures must be correct for 1 data mark. 6 @ 1 mark Maximum 4 if no data [6] 2 (a) (i) See through/transparent; located on post not the ground; secure not easily knocked over; measurements on jar; not cylindrical; wider top; no funnel. Accept reverse. 1 @ 1 mark [1] (ii) 2,1,4,3 (1/2 correct = 1; 3/4 correct = 2) [2] (iii) Bar graph/histogram (1); dates and rainfall (1); x/y could be either in latter e.g. horizontal bar graph. 2 @ 1 mark [2] (b) Arrow head: shows the direction from which the wind is blowing Paddle: Larger surface area to push the arrow/catch the wind Compass points: orientation of the wind vane/all 4 points/indicates the direction Fixed on roof: not obstructed by building/secure/not sheltered/exposed/in open air. 4 @1 mark [4] (c) Ideas should include detail of relief rainfall Water evaporated from sea/moist winds; winds from west travel over sea; air forced to rise/air rises; air cools; air condenses; relief/orographic rainfall 4 @1 mark Maximum 2 if no relief reference [4] (d) (i) Correct length of bars at 2 for E and 1 for N 2 @ 1 mark [2] (ii) Most common/most frequent direction of wind. 1 @ 1 mark [1] (iii) Lack of winds from NW/NE; equal days from E/SE; more days from W/SW; more from S than N; more from W than E; most from SW OK. Must judge or compare. 3 @ 1 mark [3] (e) (i) Correct plotting of 1,3,4,5 on the SW line (1/2 correct = 1 3/4 correct = 2) [2] (ii) Top box – anomaly/unusual/odd reading/student error/”only” once. Side box – The highest rainfall/westerly wind brings rain/ in varying amounts of rain Bottom box – No rain from these directions 3 @ 1 mark None if just list days. [3] (iii) Yes 1 @ 1 mark [1]
Mark scheme, page 4
Page 4 Mark Scheme Syllabus Paper IGCSE – October/November 2008 0460 04 © UCLES 2008 (f) Longer time of investigation; twice each day; different season/month; measure wind speed; different instruments; traditional (accept “proper”) rain gauge; compare to local weather station/other school/sites; more sites Credit mention of more reliable/more representative as development marks if they explain how their suggestions do this. 5 @ 1 mark [5]
What you needed in this session
Cambridge’s own grade thresholds for 2008 Oct/Nov, Paper 4 · Variant 1. A higher threshold means an easier paper — the bar moves with how the cohort did.