Cambridge IGCSE Geography 0460 — 2008 May/June Paper 4 · Variant 1
0460/41/M/J/08 · 60 marks · ≈68 min
The question paper and its mark scheme, free to read here and free to download. This is Cambridge’s own paper, exactly as it was sat.
Question paper16 pages


Mark scheme5 pages
Answers below. Sit the paper first if you are practising.
Paper as text
Question paper, page 1
This document consists of 14 printed pages, 2 blank pages and 1 Insert. SP (SM/CGW) T47815/6 © UCLES 2008 [Turn over UNIVERSITY OF CAMBRIDGE INTERNATIONAL EXAMINATIONS International General Certificate of Secondary Education READ THESE INSTRUCTIONS FIRST Write your Centre number, candidate number and name on all the work you hand in. Write in dark blue or black pen. You may use a soft pencil for any diagrams, graphs or rough working. Do not use staples, paper clips, highlighters, glue or correction fluid. DO NOT WRITE ON ANY BARCODES. Answer all the questions. The Insert contains Fig. 1 for Question 1 and Figs 6 and 8 for Question 2. The Insert is not required by the Examiner. Sketch maps and diagrams should be drawn whenever they serve to illustrate an answer. At the end of the examination, fasten all your work securely together. The number of marks is given in brackets [ ] at the end of each question or part question. * 8 8 6 8 1 4 8 7 9 2 * GEOGRAPHY 0460/04 Paper 4 Alternative to Coursework May/June 2008 1 hour 30 minutes Candidates answer on the Question Paper. Additional Materials: Calculator Ruler For Examiner’s Use Q1 Q2 Total www.XtremePapers.com
Question paper, page 2
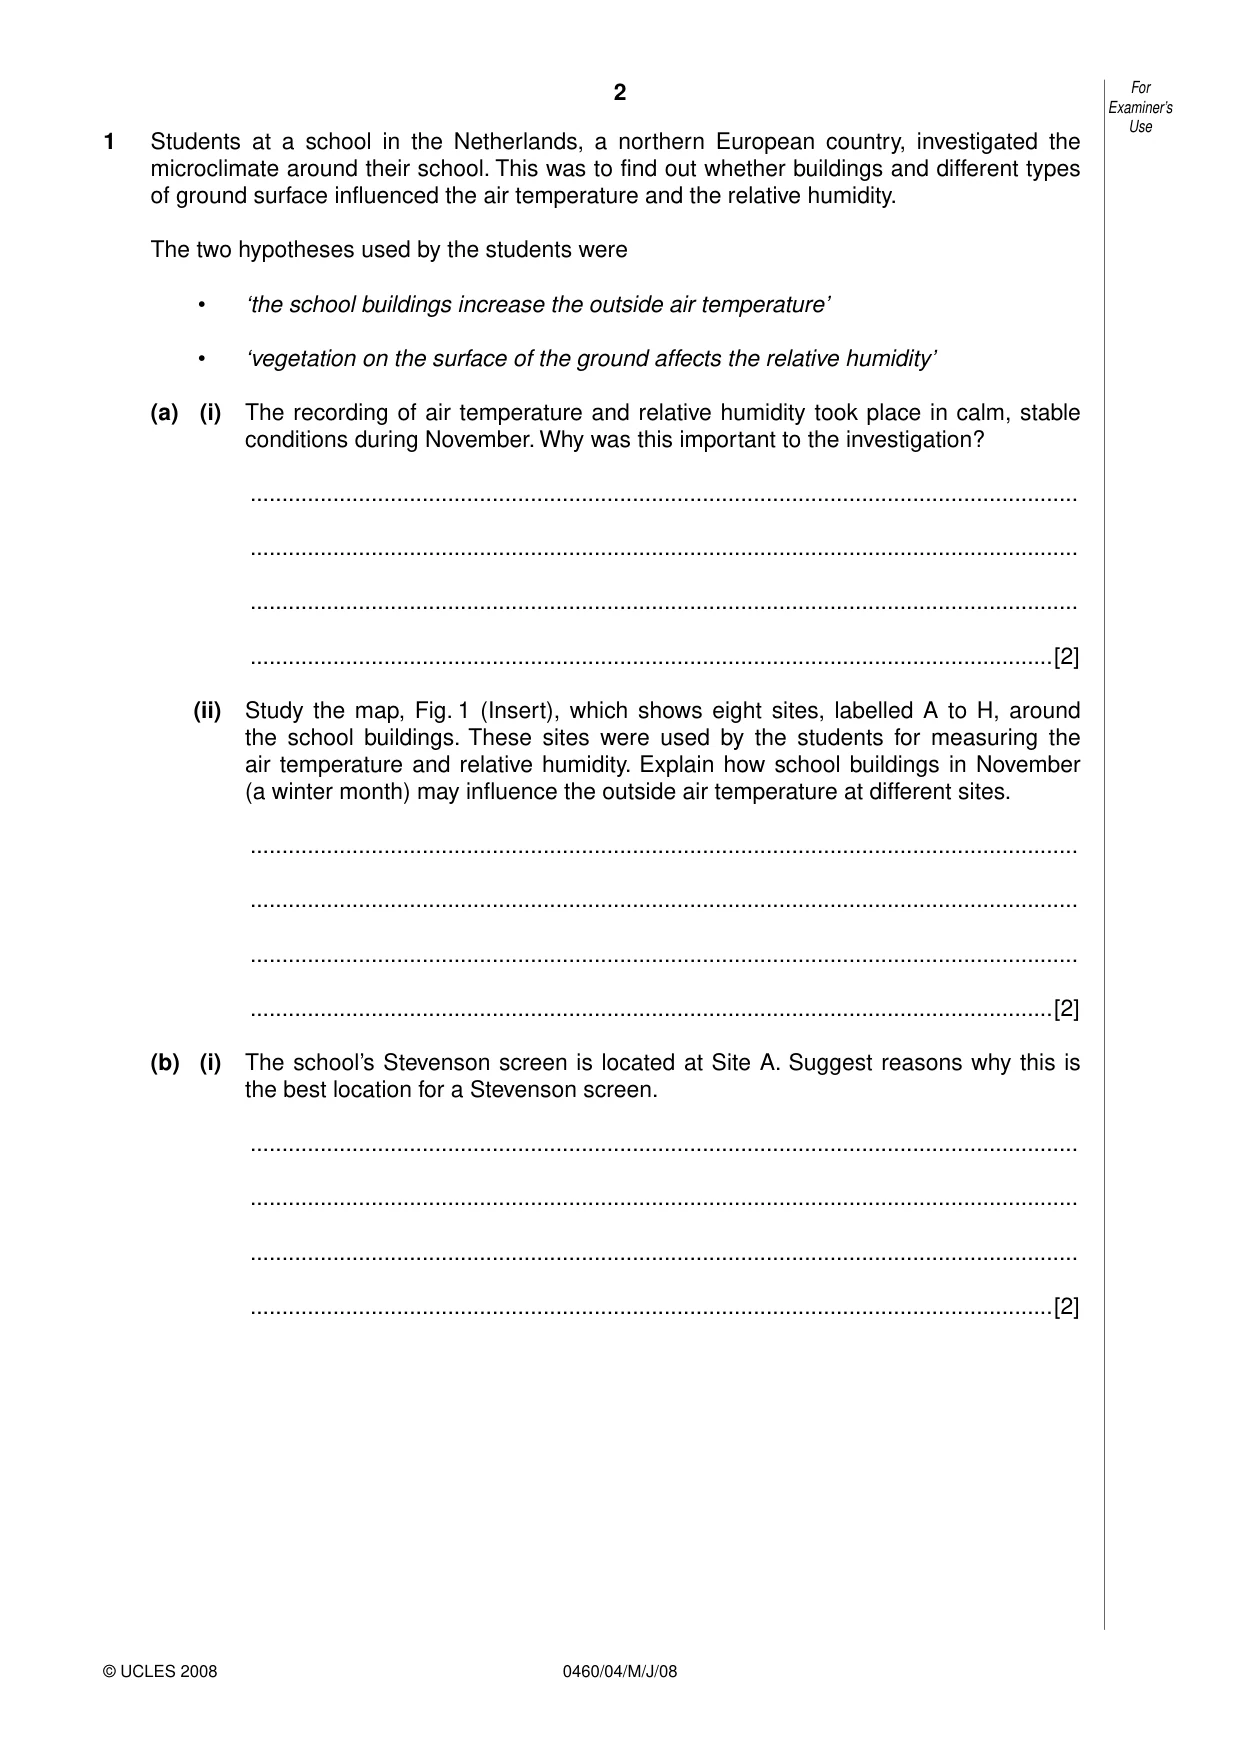
2 0460/04/M/J/08 For Examiner’s Use © UCLES 2008 1 Students at a school in the Netherlands, a northern European country, investigated the microclimate around their school. This was to find out whether buildings and different types of ground surface influenced the air temperature and the relative humidity. The two hypotheses used by the students were • ‘the school buildings increase the outside air temperature’ • ‘vegetation on the surface of the ground affects the relative humidity’ (a) (i) The recording of air temperature and relative humidity took place in calm, stable conditions during November. Why was this important to the investigation? … … … …[2] (ii) Study the map, Fig. 1 (Insert), which shows eight sites, labelled A to H, around the school buildings. These sites were used by the students for measuring the air temperature and relative humidity. Explain how school buildings in November (a winter month) may influence the outside air temperature at different sites. … … … …[2] (b) (i) The school’s Stevenson screen is located at Site A. Suggest reasons why this is the best location for a Stevenson screen. … … … …[2]
Question paper, page 3
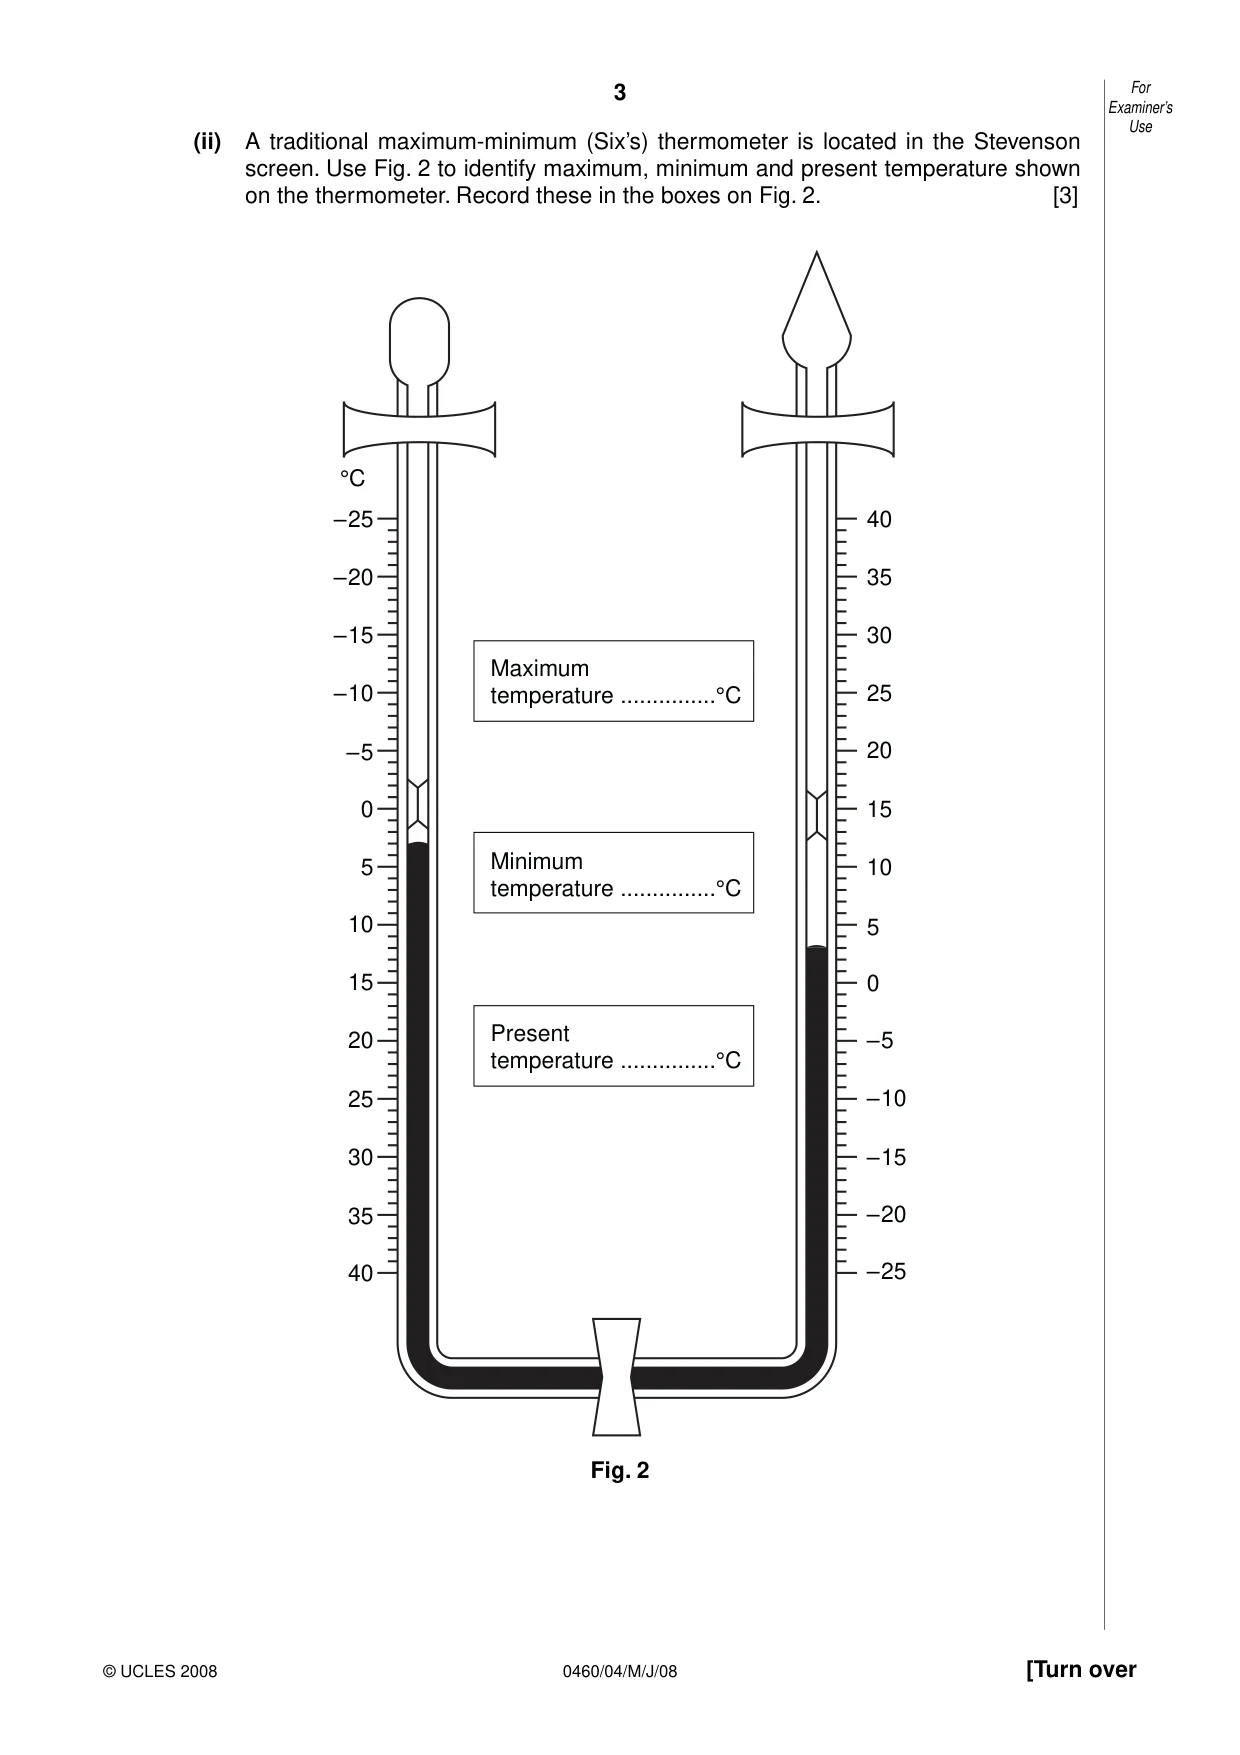
3 0460/04/M/J/08 [Turn over For Examiner’s Use © UCLES 2008 (ii) A traditional maximum-minimum (Six’s) thermometer is located in the Stevenson screen. Use Fig. 2 to identify maximum, minimum and present temperature shown on the thermometer. Record these in the boxes on Fig. 2. [3] 40 35 30 25 20 15 10 5 – 5 – 10 – 15 – 20 – 25 °C 0 40 35 30 25 20 15 10 5 – 5 – 10 – 15 – 20 – 25 0 Maximum temperature …°C Minimum temperature …°C Present temperature …°C Fig. 2
Question paper, page 4
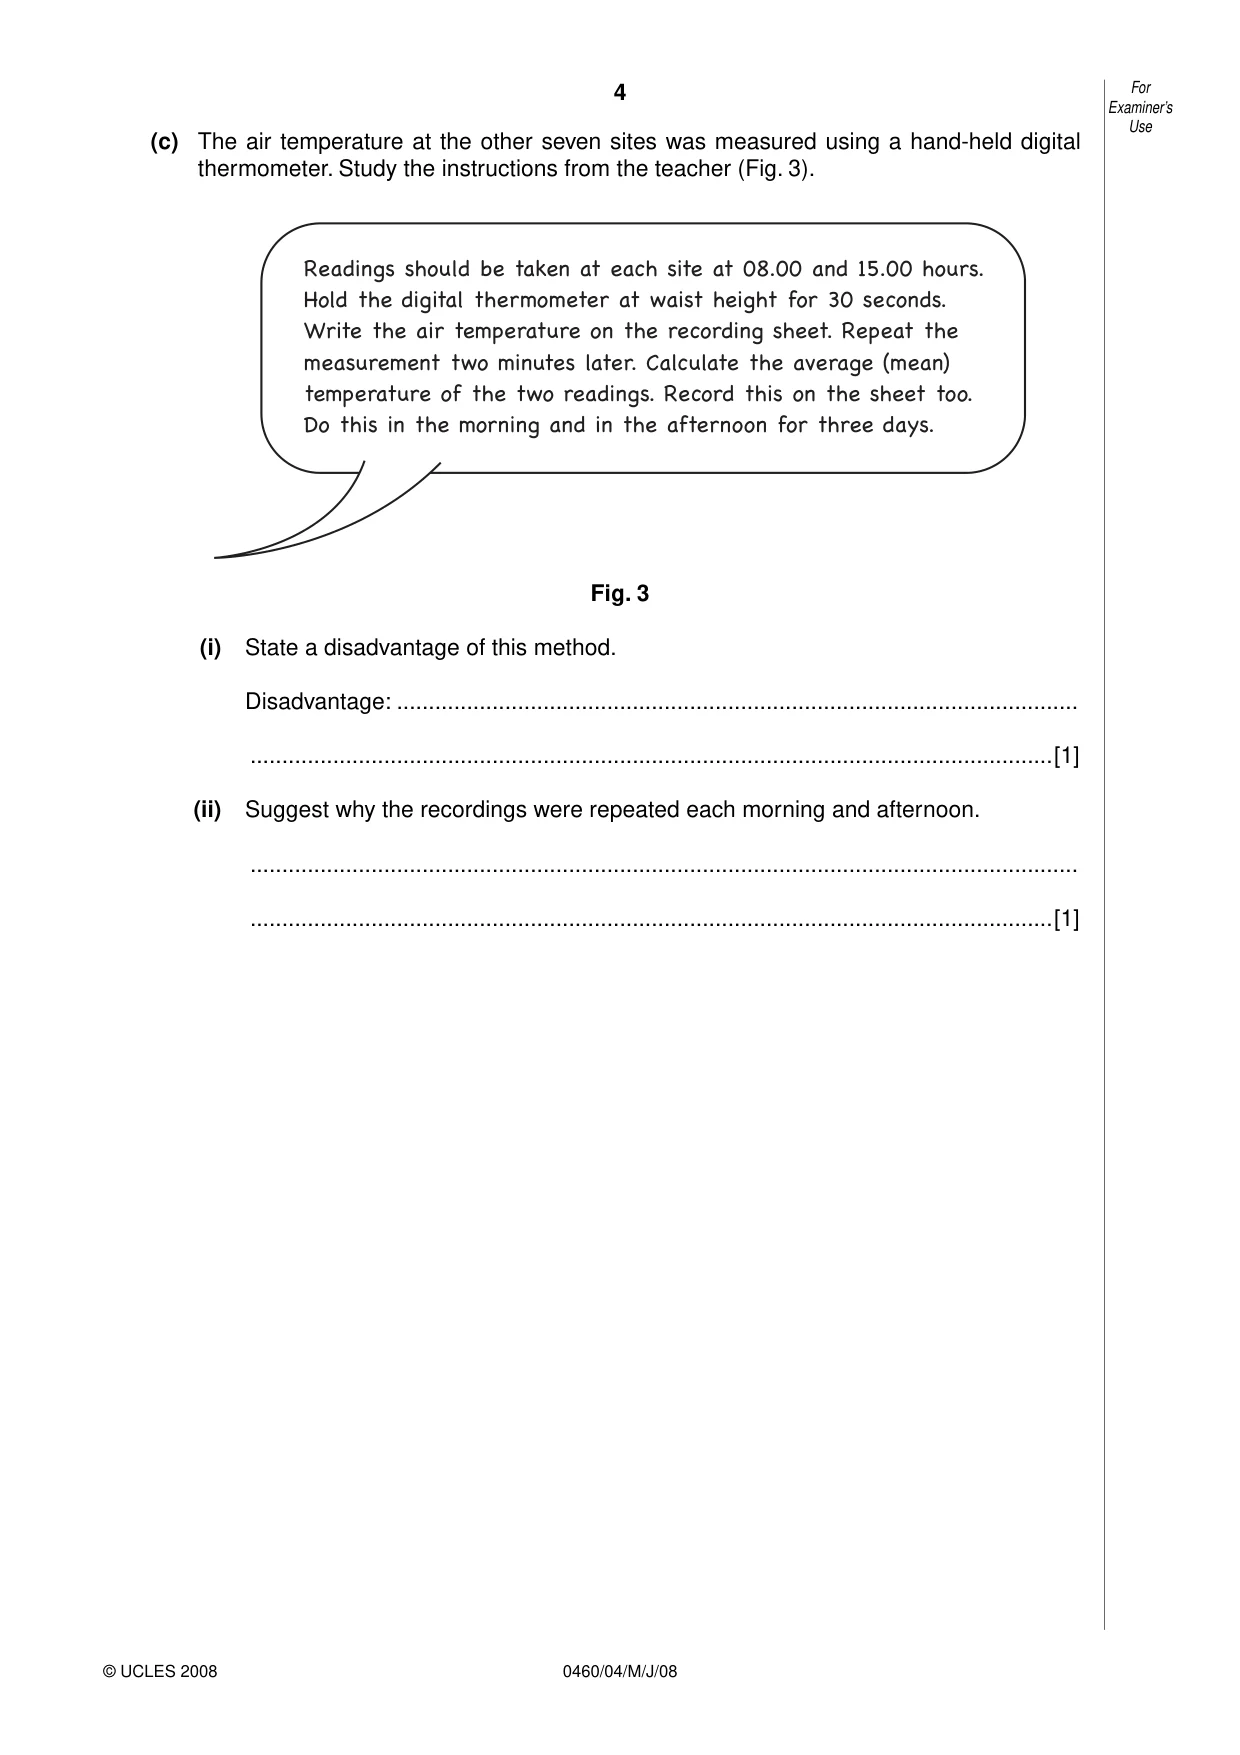
4 0460/04/M/J/08 For Examiner’s Use © UCLES 2008 (c) The air temperature at the other seven sites was measured using a hand-held digital thermometer. Study the instructions from the teacher (Fig. 3). Readings should be taken at each site at 08.00 and 15.00 hours. Hold the digital thermometer at waist height for 30 seconds. Write the air temperature on the recording sheet. Repeat the measurement two minutes later. Calculate the average (mean) temperature of the two readings. Record this on the sheet too. Do this in the morning and in the afternoon for three days. Fig. 3 (i) State a disadvantage of this method. Disadvantage: … …[1] (ii) Suggest why the recordings were repeated each morning and afternoon. … …[1]
Question paper, page 5
5 0460/04/M/J/08 [Turn over BLANK PAGE QUESTION 1 CONTINUES ON PAGE 6
Question paper, page 6
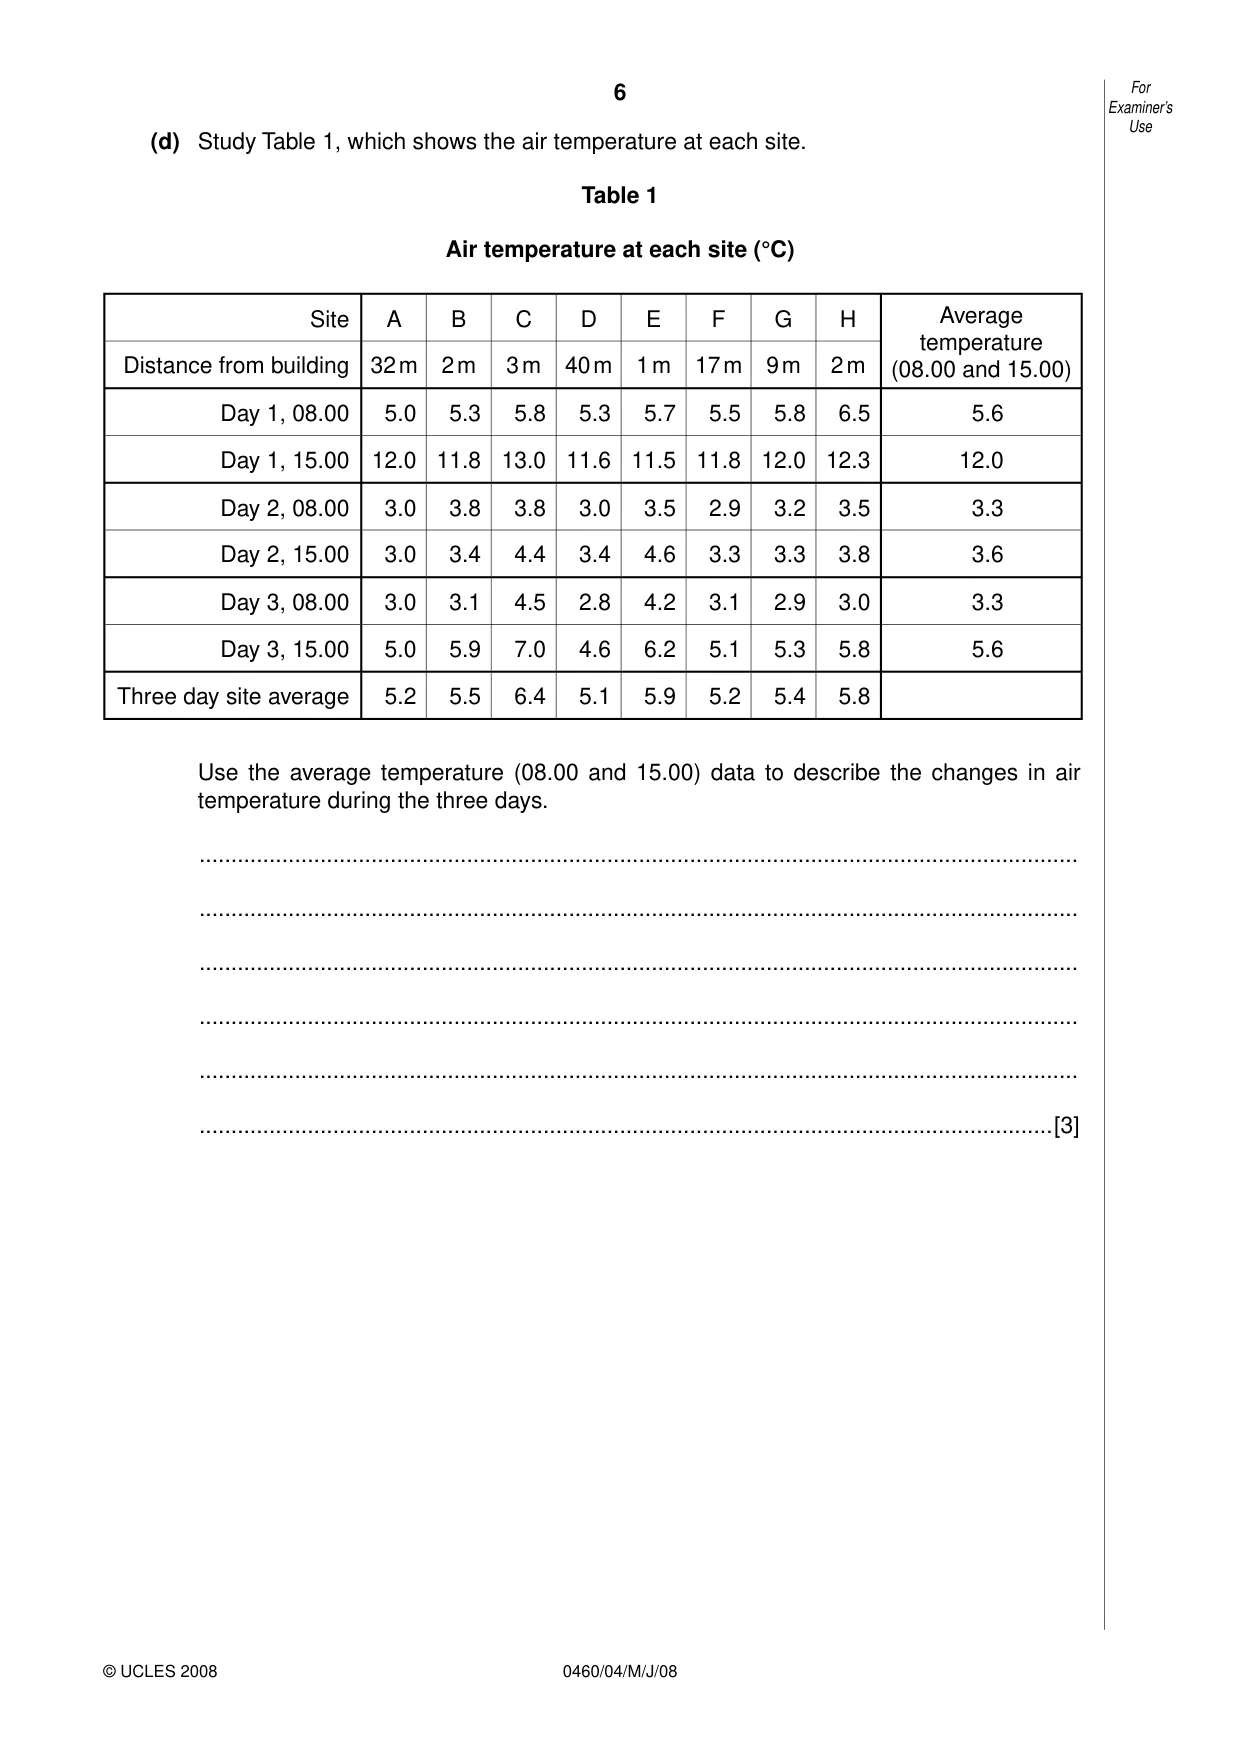
6 0460/04/M/J/08 For Examiner’s Use © UCLES 2008 (d) Study Table 1, which shows the air temperature at each site. Table 1 Air temperature at each site (°C) Site A B C D E F G H Average temperature (08.00 and 15.00) Distance from building 32 m 2 m 3 m 40 m 1 m 17 m 9 m 2 m Day 1, 08.00 5.0 5.3 5.8 5.3 5.7 5.5 5.8 6.5 5.6 Day 1, 15.00 12.0 11.8 13.0 11.6 11.5 11.8 12.0 12.3 12.0 Day 2, 08.00 3.0 3.8 3.8 3.0 3.5 2.9 3.2 3.5 3.3 Day 2, 15.00 3.0 3.4 4.4 3.4 4.6 3.3 3.3 3.8 3.6 Day 3, 08.00 3.0 3.1 4.5 2.8 4.2 3.1 2.9 3.0 3.3 Day 3, 15.00 5.0 5.9 7.0 4.6 6.2 5.1 5.3 5.8 5.6 Three day site average 5.2 5.5 6.4 5.1 5.9 5.2 5.4 5.8 Use the average temperature (08.00 and 15.00) data to describe the changes in air temperature during the three days. … … … … … …[3]
Question paper, page 7
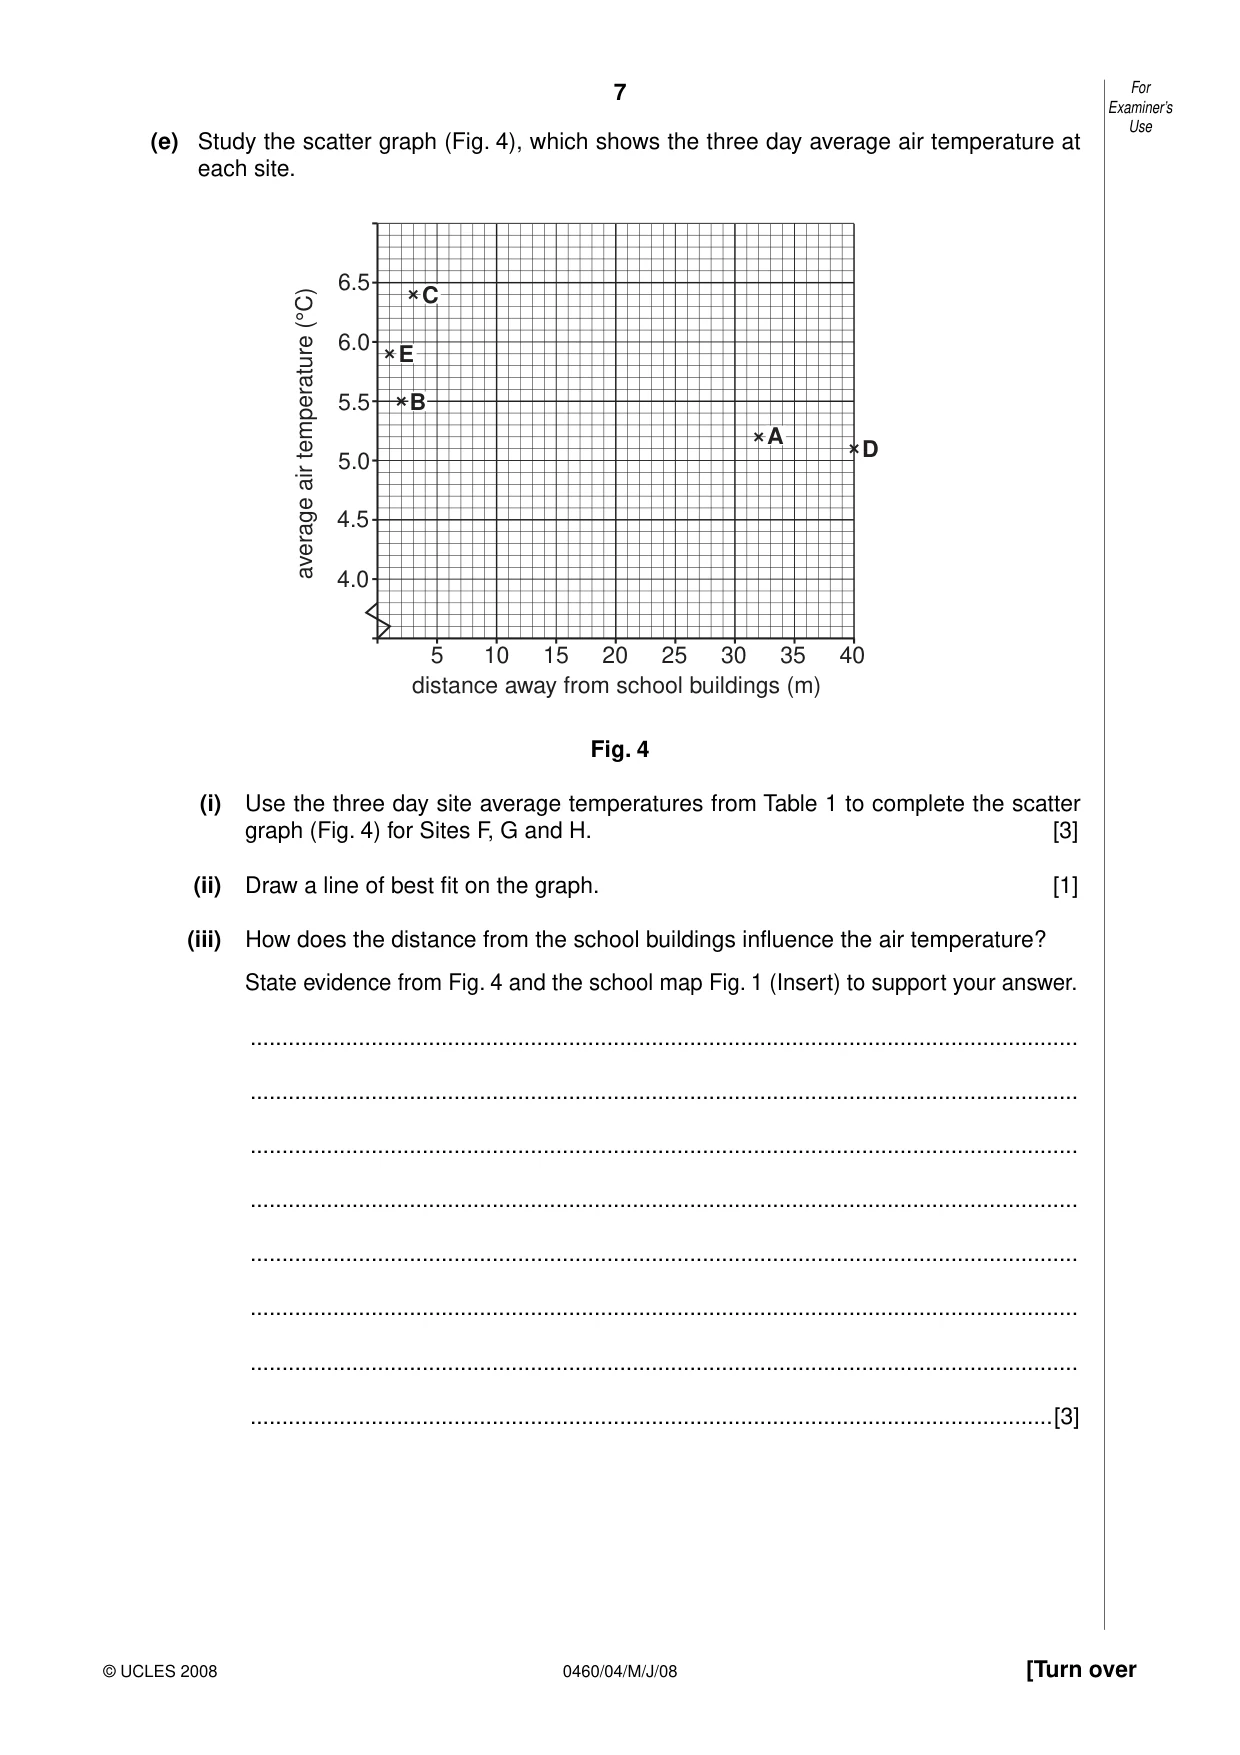
7 0460/04/M/J/08 [Turn over For Examiner’s Use © UCLES 2008 (e) Study the scatter graph (Fig. 4), which shows the three day average air temperature at each site. 4.0 4.5 5 10 15 20 25 distance away from school buildings (m) 30 35 40 5.0 5.5 average air temperature (°C) 6.0 6.5 A D B E C Fig. 4 (i) Use the three day site average temperatures from Table 1 to complete the scatter graph (Fig. 4) for Sites F, G and H. [3] (ii) Draw a line of best fit on the graph. [1] (iii) How does the distance from the school buildings influence the air temperature? State evidence from Fig. 4 and the school map Fig. 1 (Insert) to support your answer. … … … … … … … …[3]
Question paper, page 8
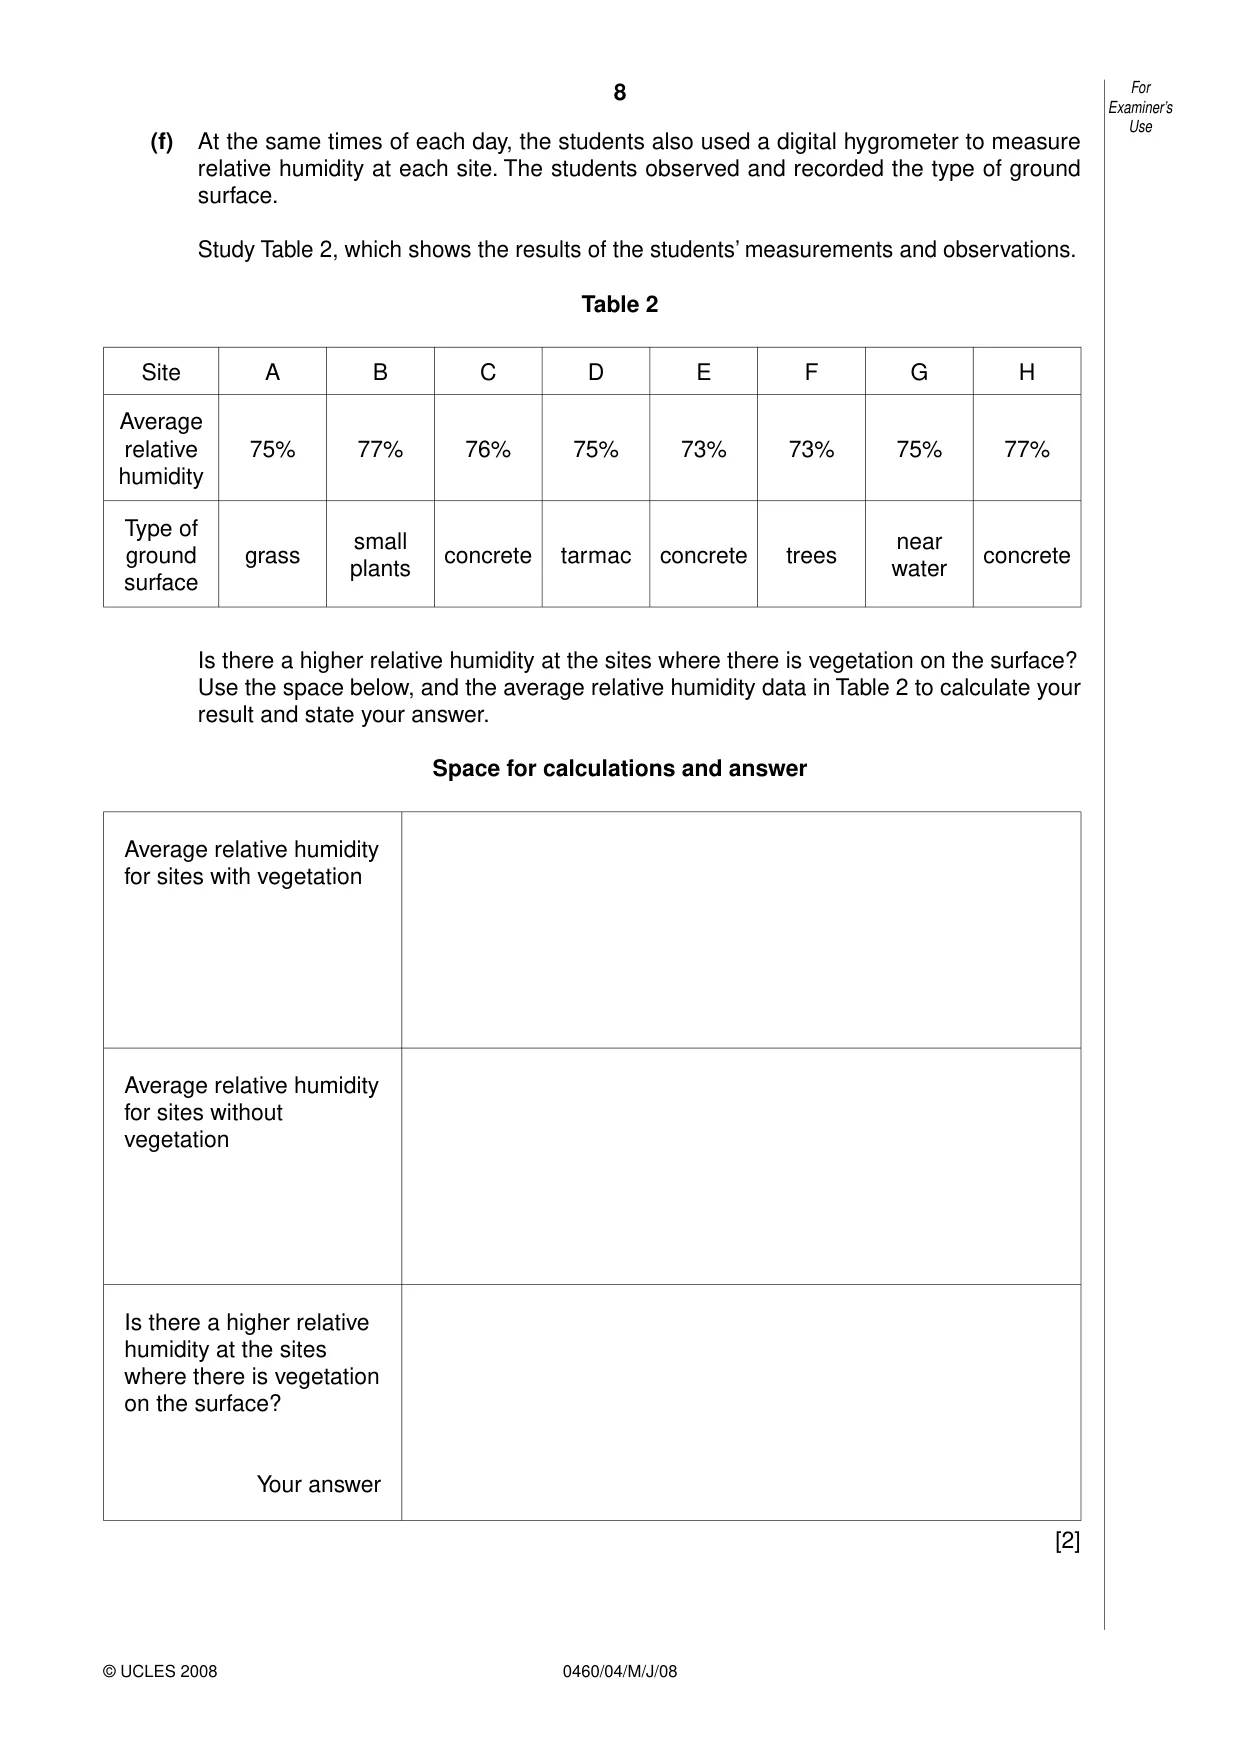
8 0460/04/M/J/08 For Examiner’s Use © UCLES 2008 (f) At the same times of each day, the students also used a digital hygrometer to measure relative humidity at each site. The students observed and recorded the type of ground surface. Study Table 2, which shows the results of the students’ measurements and observations. Table 2 Site A B C D E F G H Average relative humidity 75% 77% 76% 75% 73% 73% 75% 77% Type of ground surface grass small plants concrete tarmac concrete trees near water concrete Is there a higher relative humidity at the sites where there is vegetation on the surface? Use the space below, and the average relative humidity data in Table 2 to calculate your result and state your answer. Space for calculations and answer Average relative humidity for sites with vegetation Average relative humidity for sites without vegetation Is there a higher relative humidity at the sites where there is vegetation on the surface? Your answer [2]
Question paper, page 9
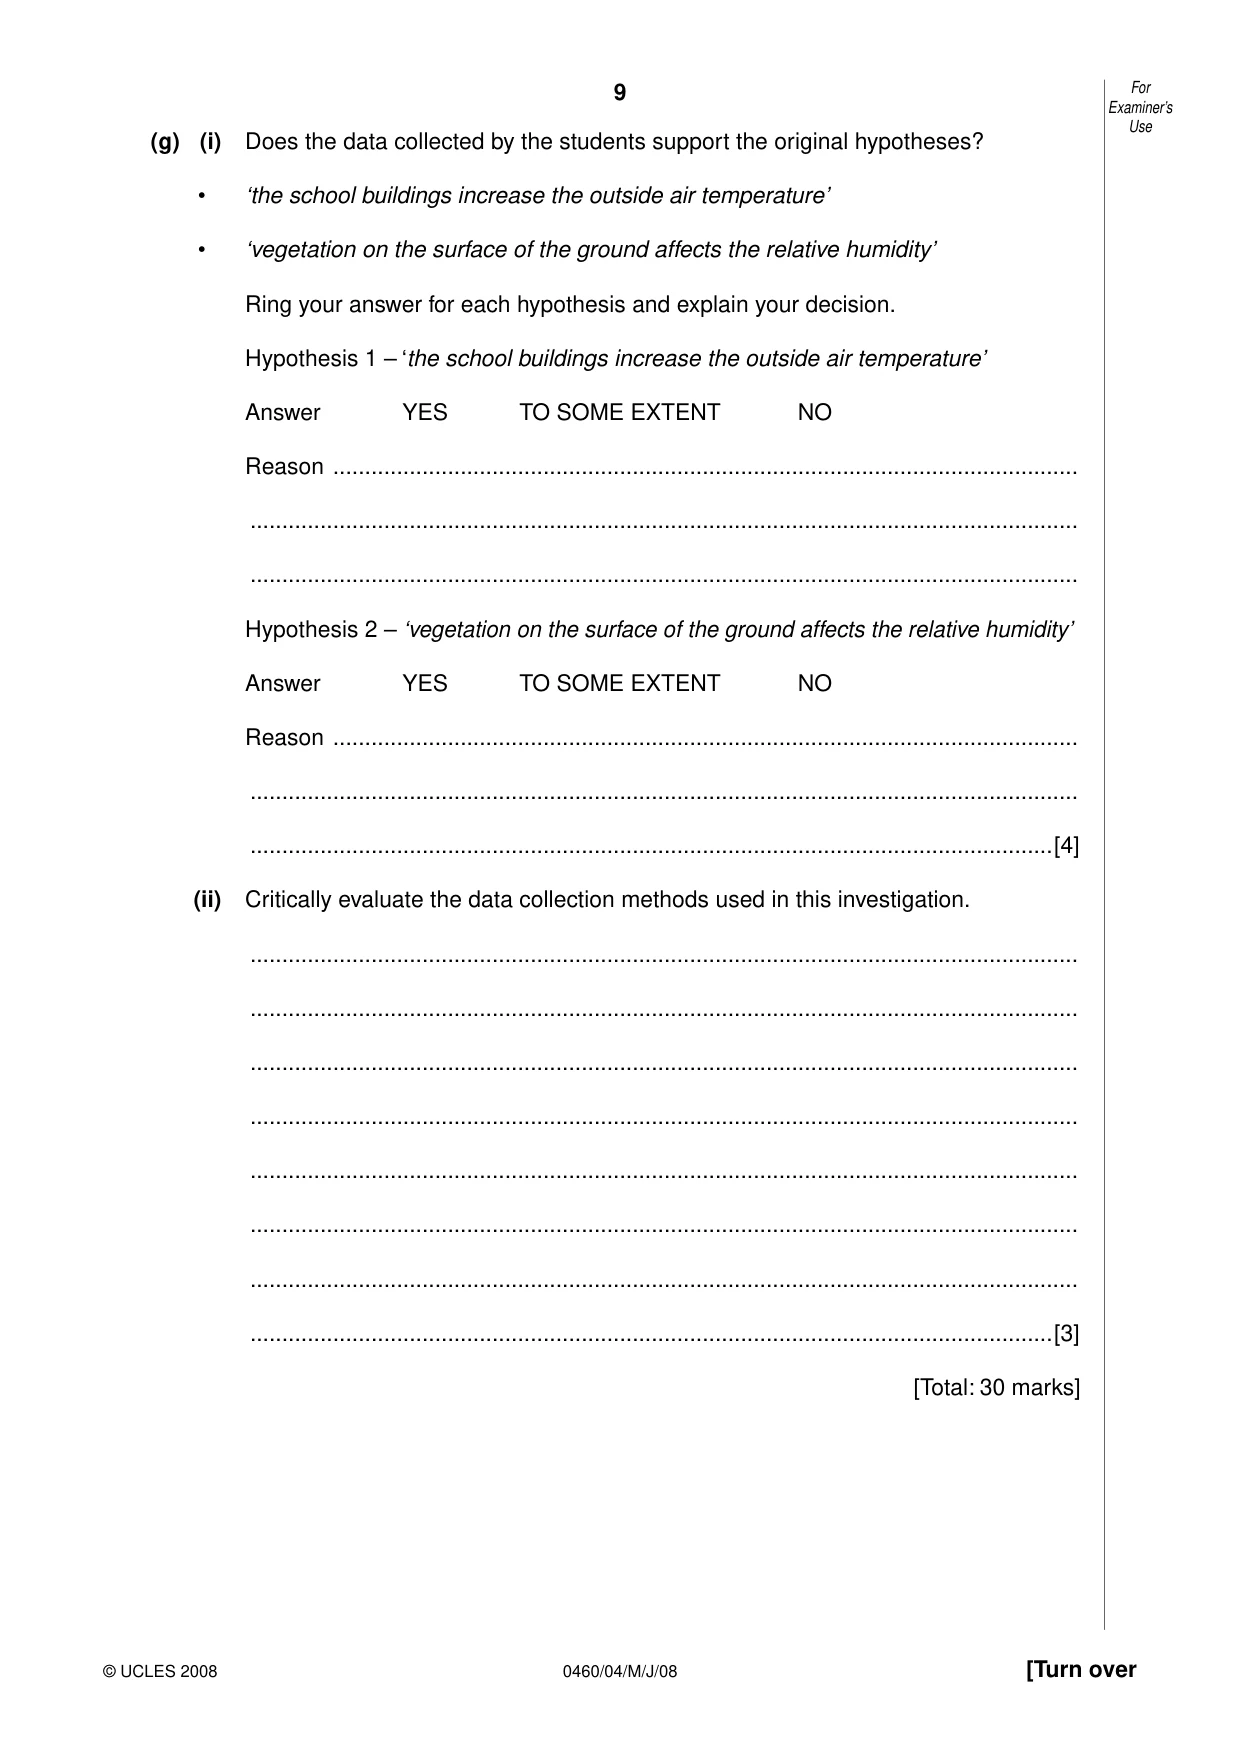
9 0460/04/M/J/08 [Turn over For Examiner’s Use © UCLES 2008 (g) (i) Does the data collected by the students support the original hypotheses? • ‘the school buildings increase the outside air temperature’ • ‘vegetation on the surface of the ground affects the relative humidity’ Ring your answer for each hypothesis and explain your decision. Hypothesis 1 – ‘the school buildings increase the outside air temperature’ Answer YES TO SOME EXTENT NO Reason … … … Hypothesis 2 – ‘vegetation on the surface of the ground affects the relative humidity’ Answer YES TO SOME EXTENT NO Reason … … …[4] (ii) Critically evaluate the data collection methods used in this investigation. … … … … … … … …[3] [Total: 30 marks]
Question paper, page 10
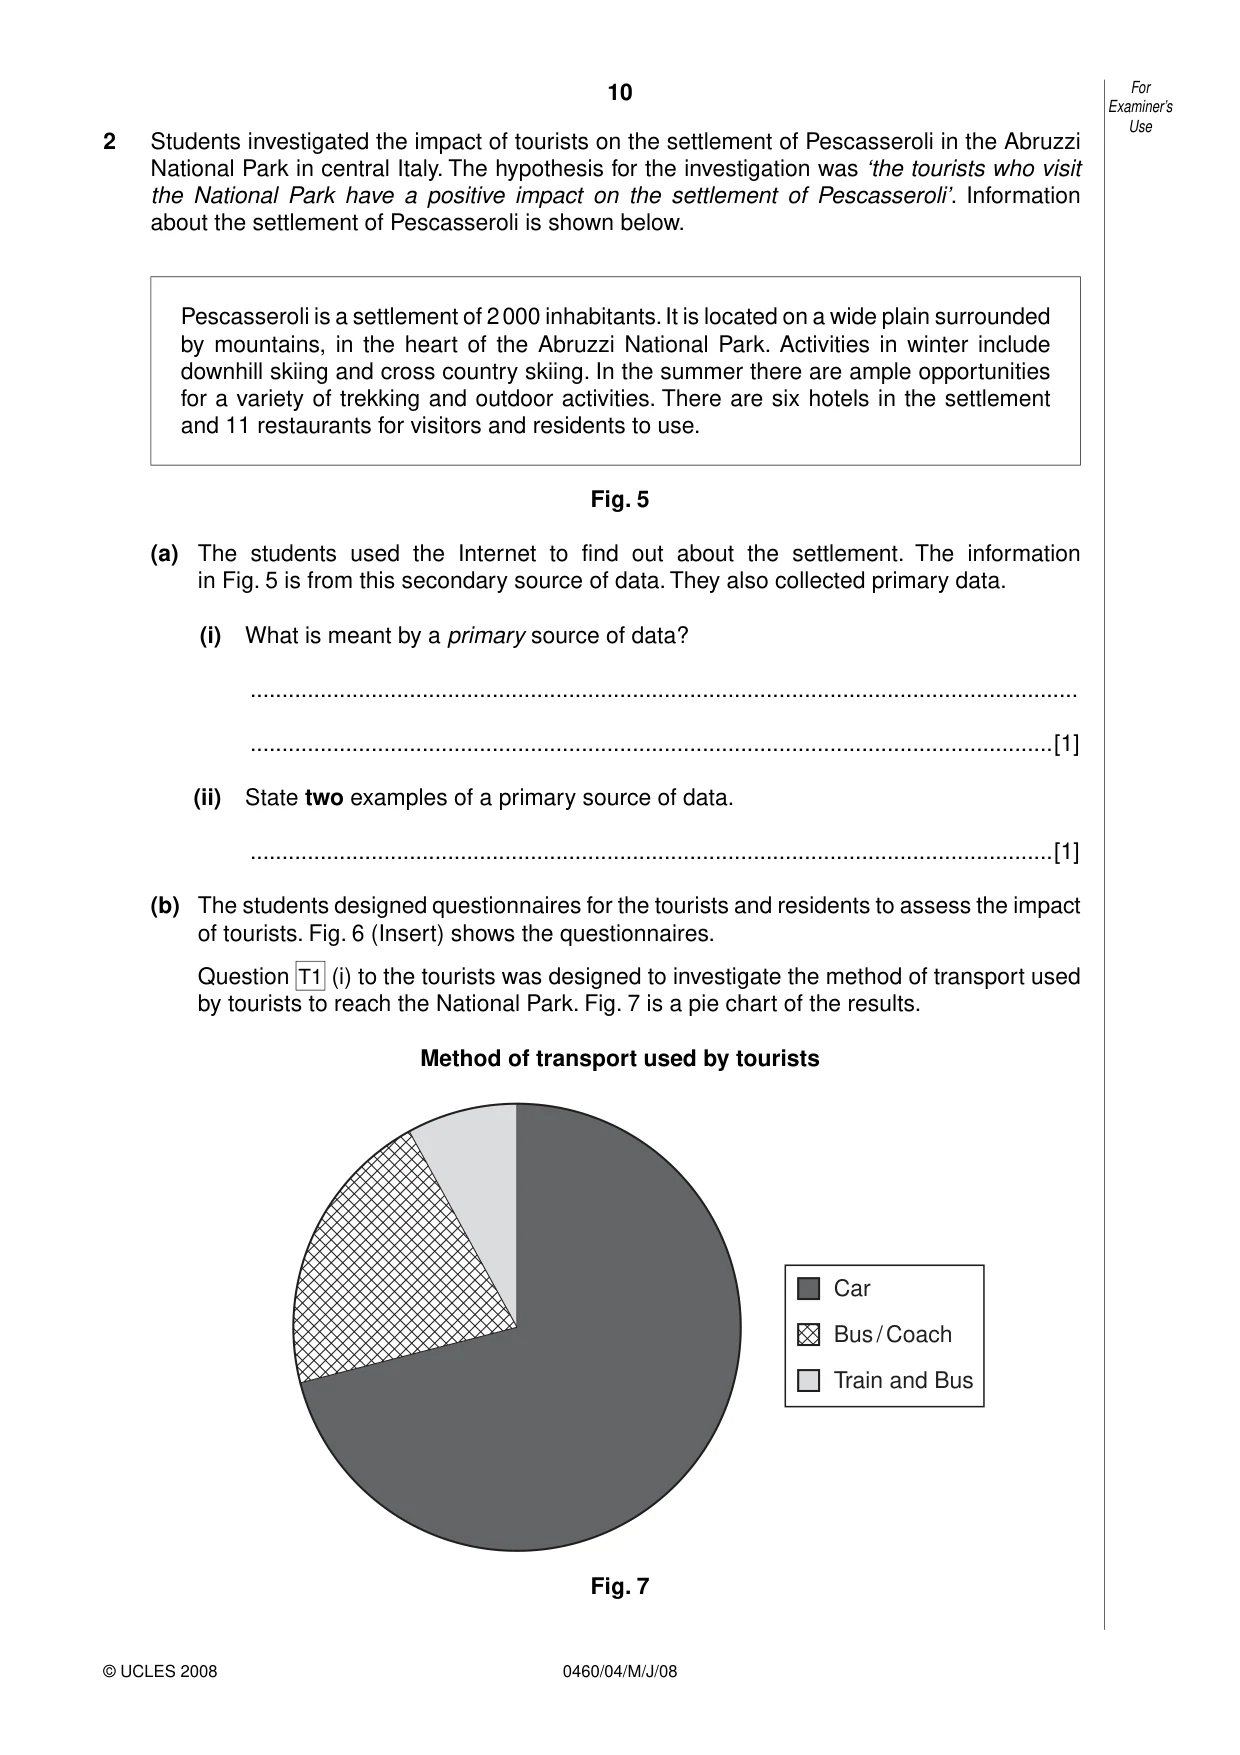
10 0460/04/M/J/08 2 Students investigated the impact of tourists on the settlement of Pescasseroli in the Abruzzi National Park in central Italy. The hypothesis for the investigation was ‘the tourists who visit the National Park have a positive impact on the settlement of Pescasseroli’. Information about the settlement of Pescasseroli is shown below. Pescasseroli is a settlement of 2 000 inhabitants. It is located on a wide plain surrounded by mountains, in the heart of the Abruzzi National Park. Activities in winter include downhill skiing and cross country skiing. In the summer there are ample opportunities for a variety of trekking and outdoor activities. There are six hotels in the settlement and 11 restaurants for visitors and residents to use. Fig. 5 (a) The students used the Internet to find out about the settlement. The information in Fig. 5 is from this secondary source of data. They also collected primary data. (i) What is meant by a primary source of data? … …[1] (ii) State two examples of a primary source of data. …[1] (b) The students designed questionnaires for the tourists and residents to assess the impact of tourists. Fig. 6 (Insert) shows the questionnaires. Question T1 (i) to the tourists was designed to investigate the method of transport used by tourists to reach the National Park. Fig. 7 is a pie chart of the results. Method of transport used by tourists Car Bus / Coach Train and Bus Fig. 7 For Examiner’s Use © UCLES 2008
Question paper, page 11
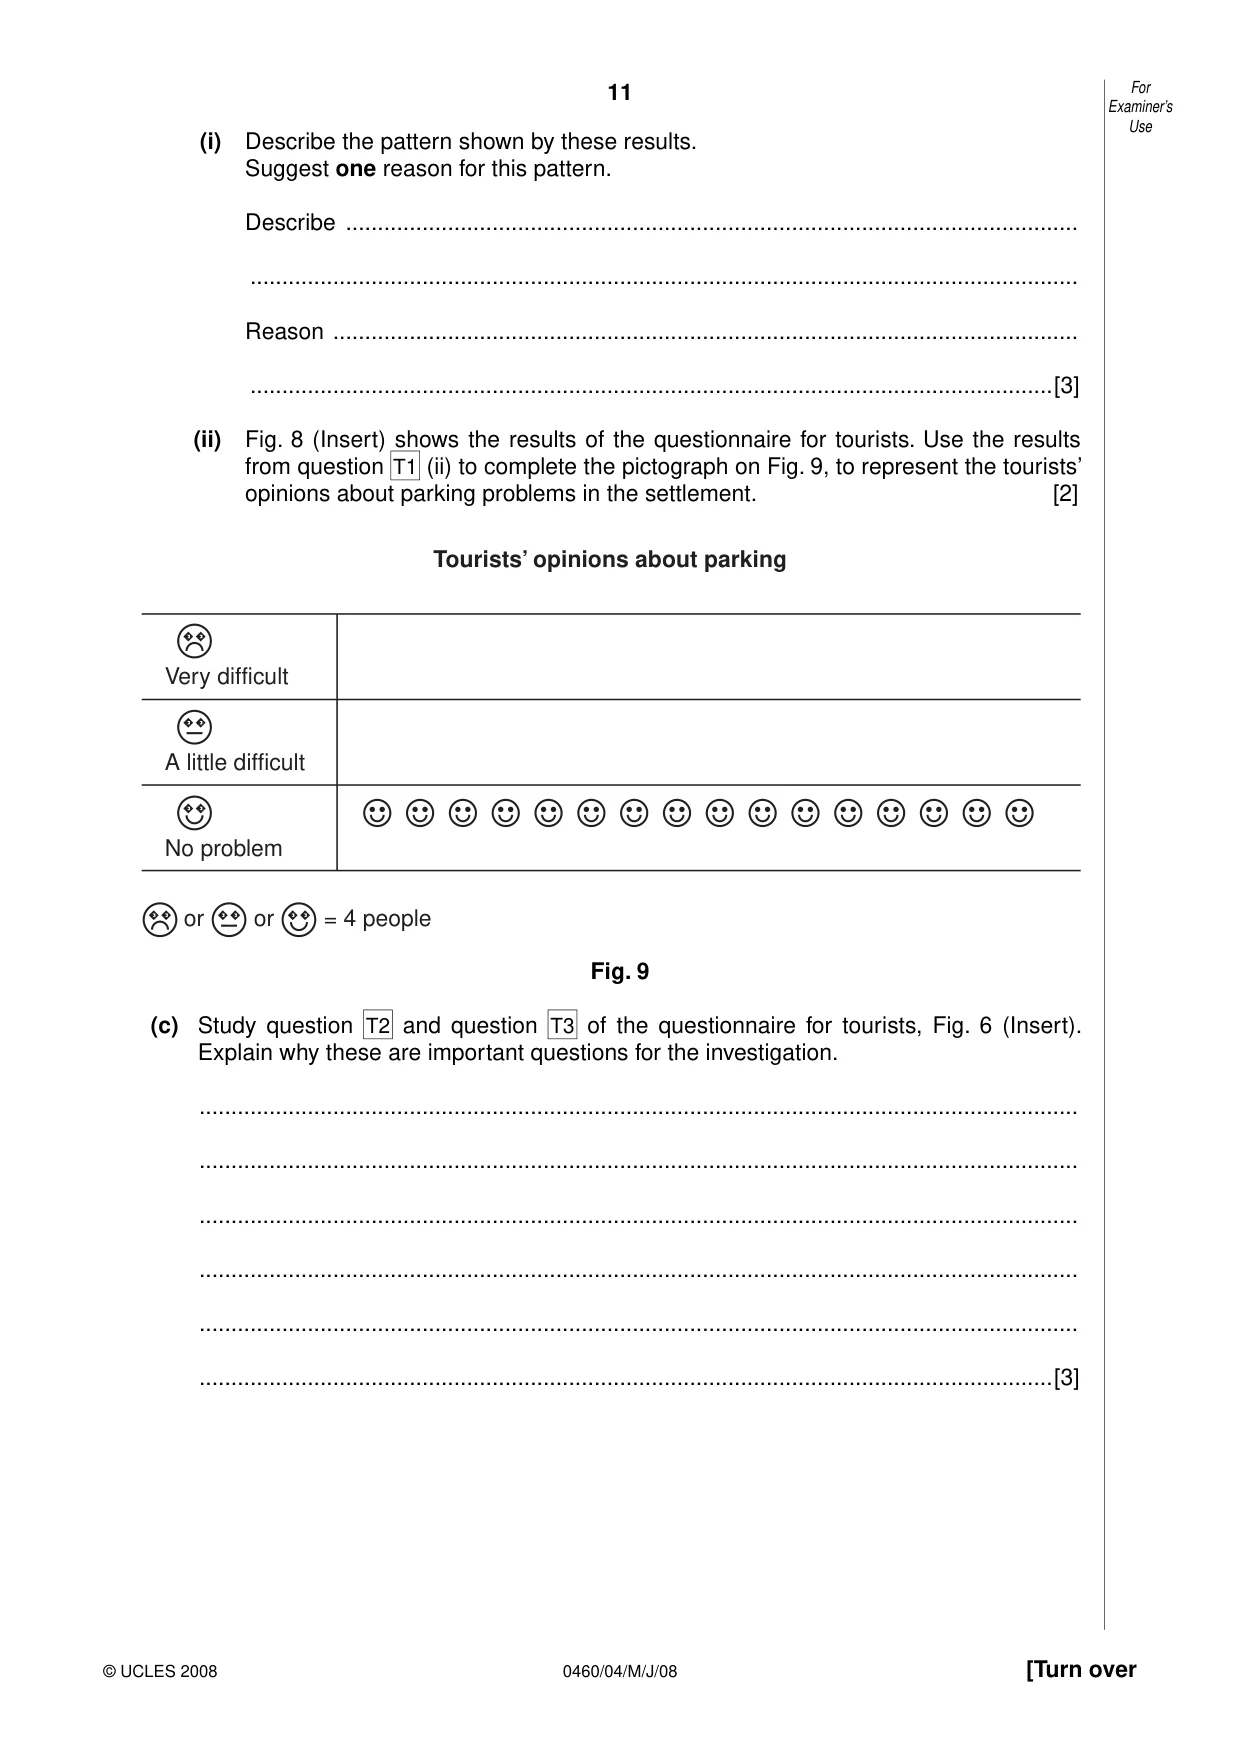
11 0460/04/M/J/08 [Turn over (i) Describe the pattern shown by these results. Suggest one reason for this pattern. Describe … … Reason … …[3] (ii) Fig. 8 (Insert) shows the results of the questionnaire for tourists. Use the results from question T1 (ii) to complete the pictograph on Fig. 9, to represent the tourists’ opinions about parking problems in the settlement. [2] Very difficult A little difficult No problem = 4 people or or Tourists’ opinions about parking Fig. 9 (c) Study question T2 and question T3 of the questionnaire for tourists, Fig. 6 (Insert). Explain why these are important questions for the investigation. … … … … … …[3] For Examiner’s Use © UCLES 2008
Question paper, page 13
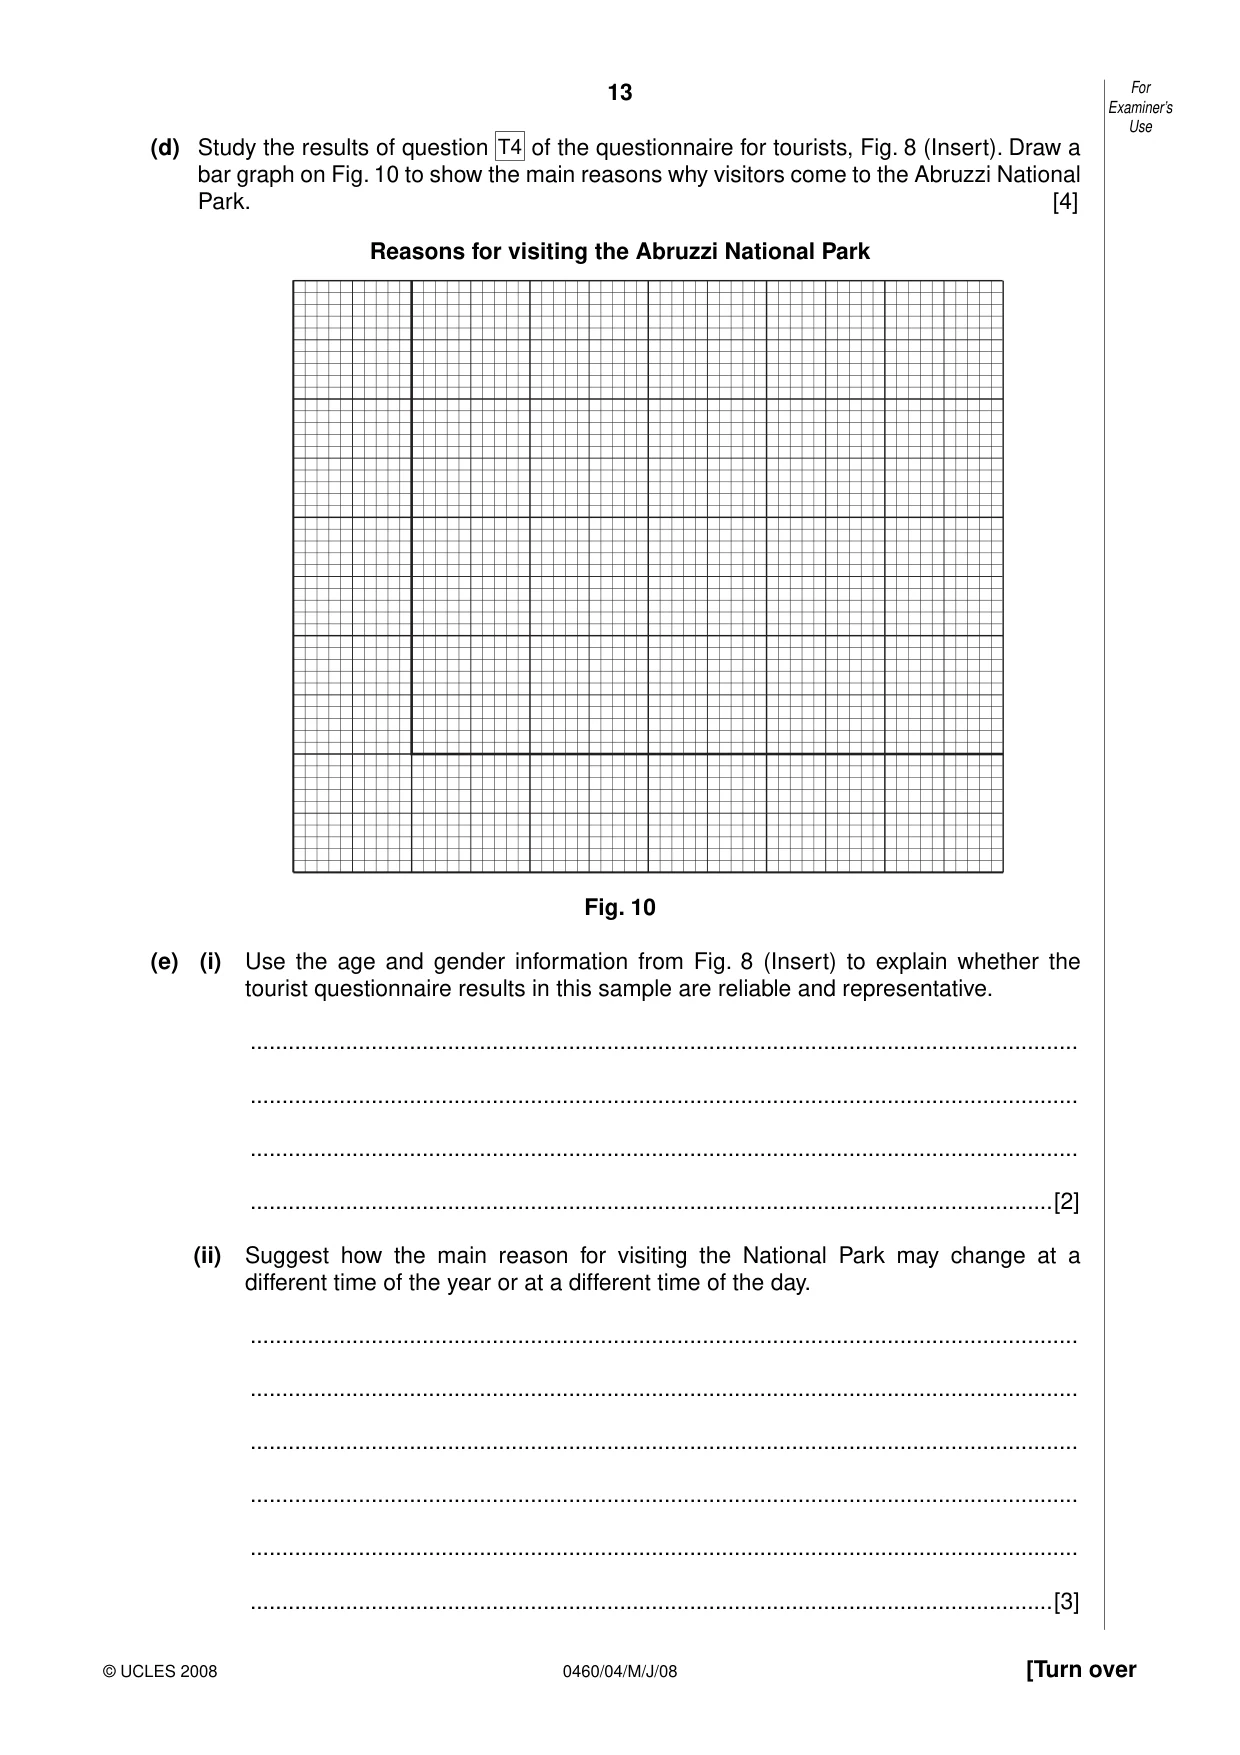
13 0460/04/M/J/08 For Examiner’s Use © UCLES 2008 (d) Study the results of question T4 of the questionnaire for tourists, Fig. 8 (Insert). Draw a bar graph on Fig. 10 to show the main reasons why visitors come to the Abruzzi National Park. [4] Reasons for visiting the Abruzzi National Park Fig. 10 (e) (i) Use the age and gender information from Fig. 8 (Insert) to explain whether the tourist questionnaire results in this sample are reliable and representative. … … … …[2] (ii) Suggest how the main reason for visiting the National Park may change at a different time of the year or at a different time of the day. … … … … … …[3] [Turn over
Question paper, page 14
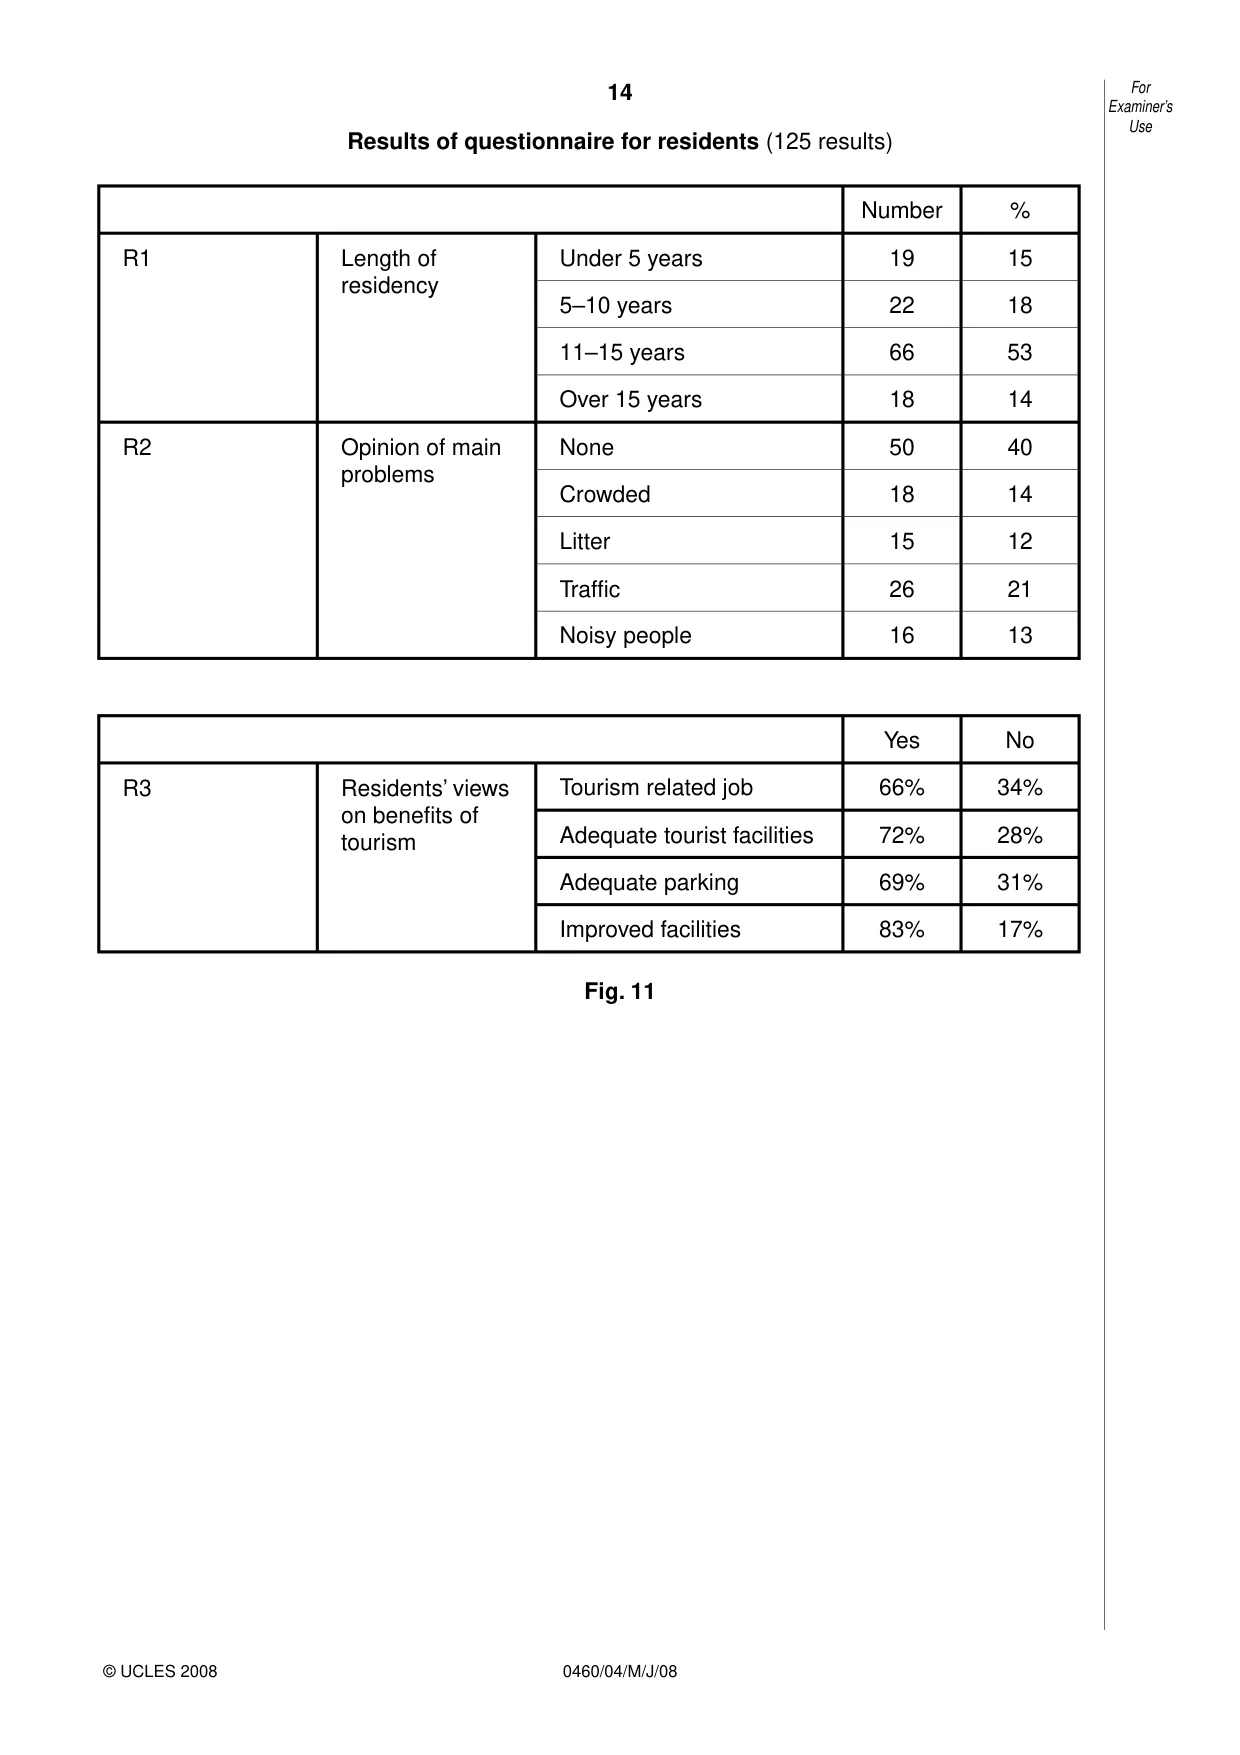
14 0460/04/M/J/08 Results of questionnaire for residents (125 results) Number % R1 Length of residency Under 5 years 19 15 5–10 years 22 18 11–15 years 66 53 Over 15 years 18 14 R2 Opinion of main problems None 50 40 Crowded 18 14 Litter 15 12 Traffic 26 21 Noisy people 16 13 Yes No R3 Residents’ views on benefits of tourism Tourism related job 66% 34% Adequate tourist facilities 72% 28% Adequate parking 69% 31% Improved facilities 83% 17% Fig. 11 For Examiner’s Use © UCLES 2008
Question paper, page 15
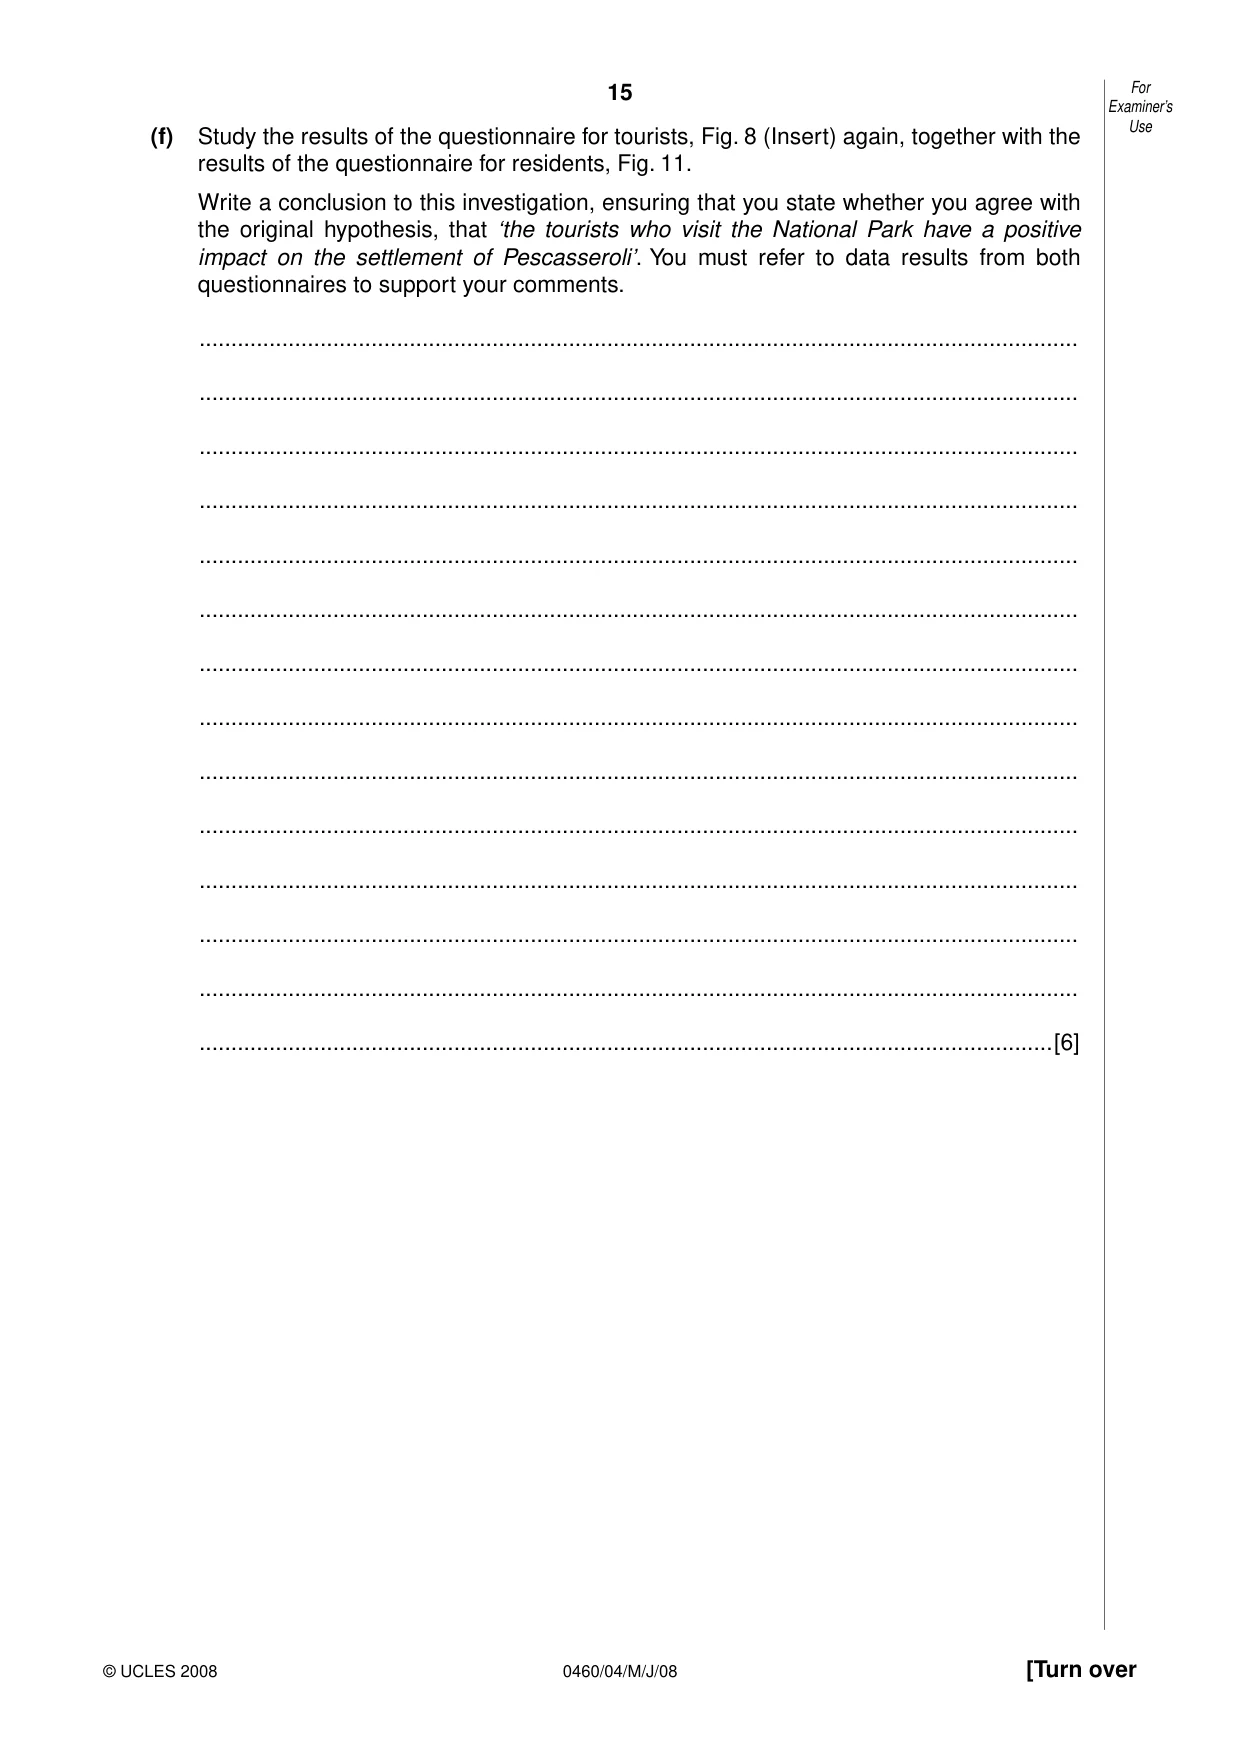
15 0460/04/M/J/08 (f) Study the results of the questionnaire for tourists, Fig. 8 (Insert) again, together with the results of the questionnaire for residents, Fig. 11. Write a conclusion to this investigation, ensuring that you state whether you agree with the original hypothesis, that ‘the tourists who visit the National Park have a positive impact on the settlement of Pescasseroli’. You must refer to data results from both questionnaires to support your comments. … … … … … … … … … … … … … …[6] For Examiner’s Use © UCLES 2008 [Turn over
Question paper, page 16
16 0460/04/M/J/08 (g) Suggest, in detail, how the students could collect data to investigate the extent that tourists may increase the litter, noise and traffic in the settlement. … … … … … … … … … … … …[5] [Total: 30 marks] Permission to reproduce items where third-party owned material protected by copyright is included has been sought and cleared where possible. Every reasonable effort has been made by the publisher (UCLES) to trace copyright holders, but if any items requiring clearance have unwittingly been included, the publisher will be pleased to make amends at the earliest possible opportunity. University of Cambridge International Examinations is part of the Cambridge Assessment Group. Cambridge Assessment is the brand name of University of Cambridge Local Examinations Syndicate (UCLES), which is itself a department of the University of Cambridge. © UCLES 2008 For Examiner’s Use
Mark scheme, page 1
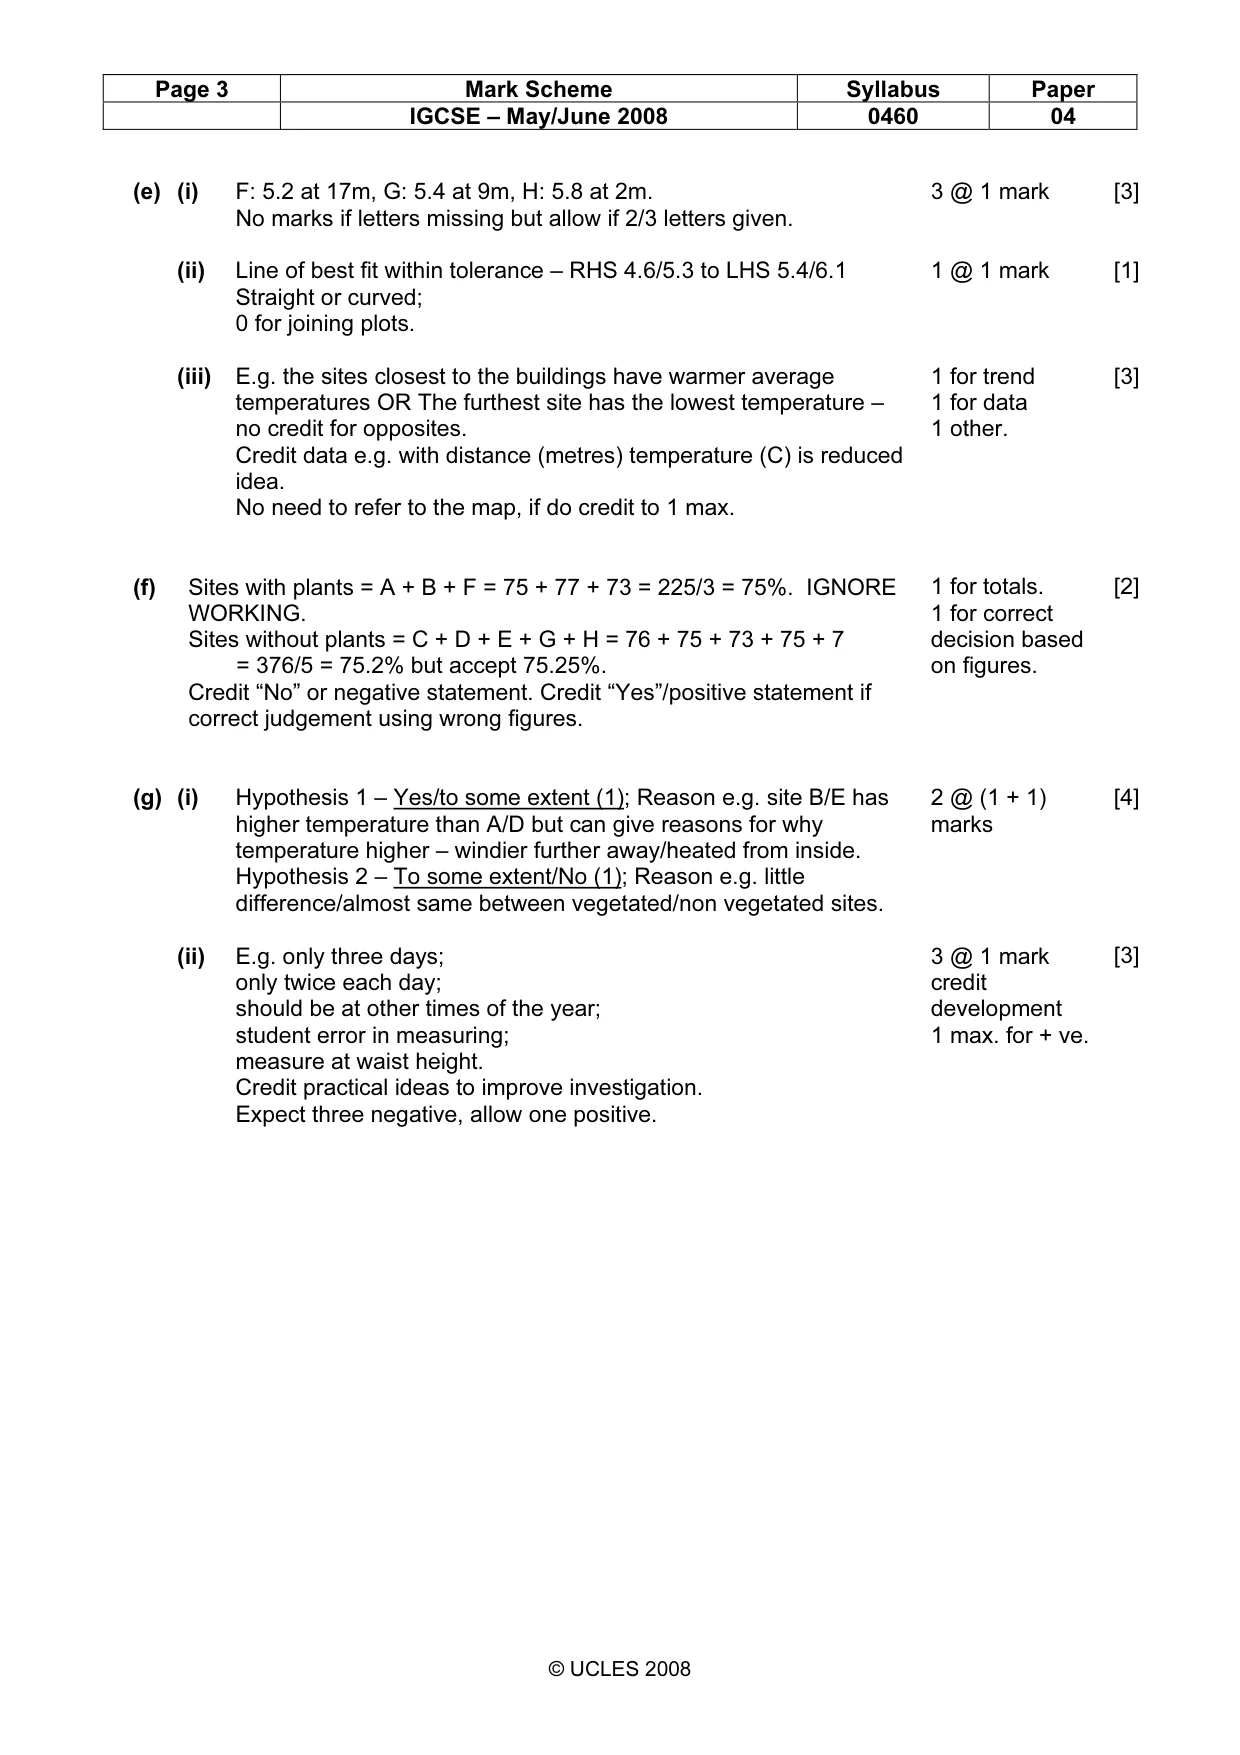
UNIVERSITY OF CAMBRIDGE INTERNATIONAL EXAMINATIONS International General Certificate of Secondary Education MARK SCHEME for the May/June 2008 question paper 0460 GEOGRAPHY 0460/04 Paper 4 (Alternative to Coursework), maximum raw mark 60 This mark scheme is published as an aid to teachers and candidates, to indicate the requirements of the examination. It shows the basis on which Examiners were instructed to award marks. It does not indicate the details of the discussions that took place at an Examiners’ meeting before marking began. All Examiners are instructed that alternative correct answers and unexpected approaches in candidates’ scripts must be given marks that fairly reflect the relevant knowledge and skills demonstrated. Mark schemes must be read in conjunction with the question papers and the report on the examination. • CIE will not enter into discussions or correspondence in connection with these mark schemes. CIE is publishing the mark schemes for the May/June 2008 question papers for most IGCSE, GCE Advanced Level and Advanced Subsidiary Level syllabuses and some Ordinary Level syllabuses. www.XtremePapers.com
Mark scheme, page 2
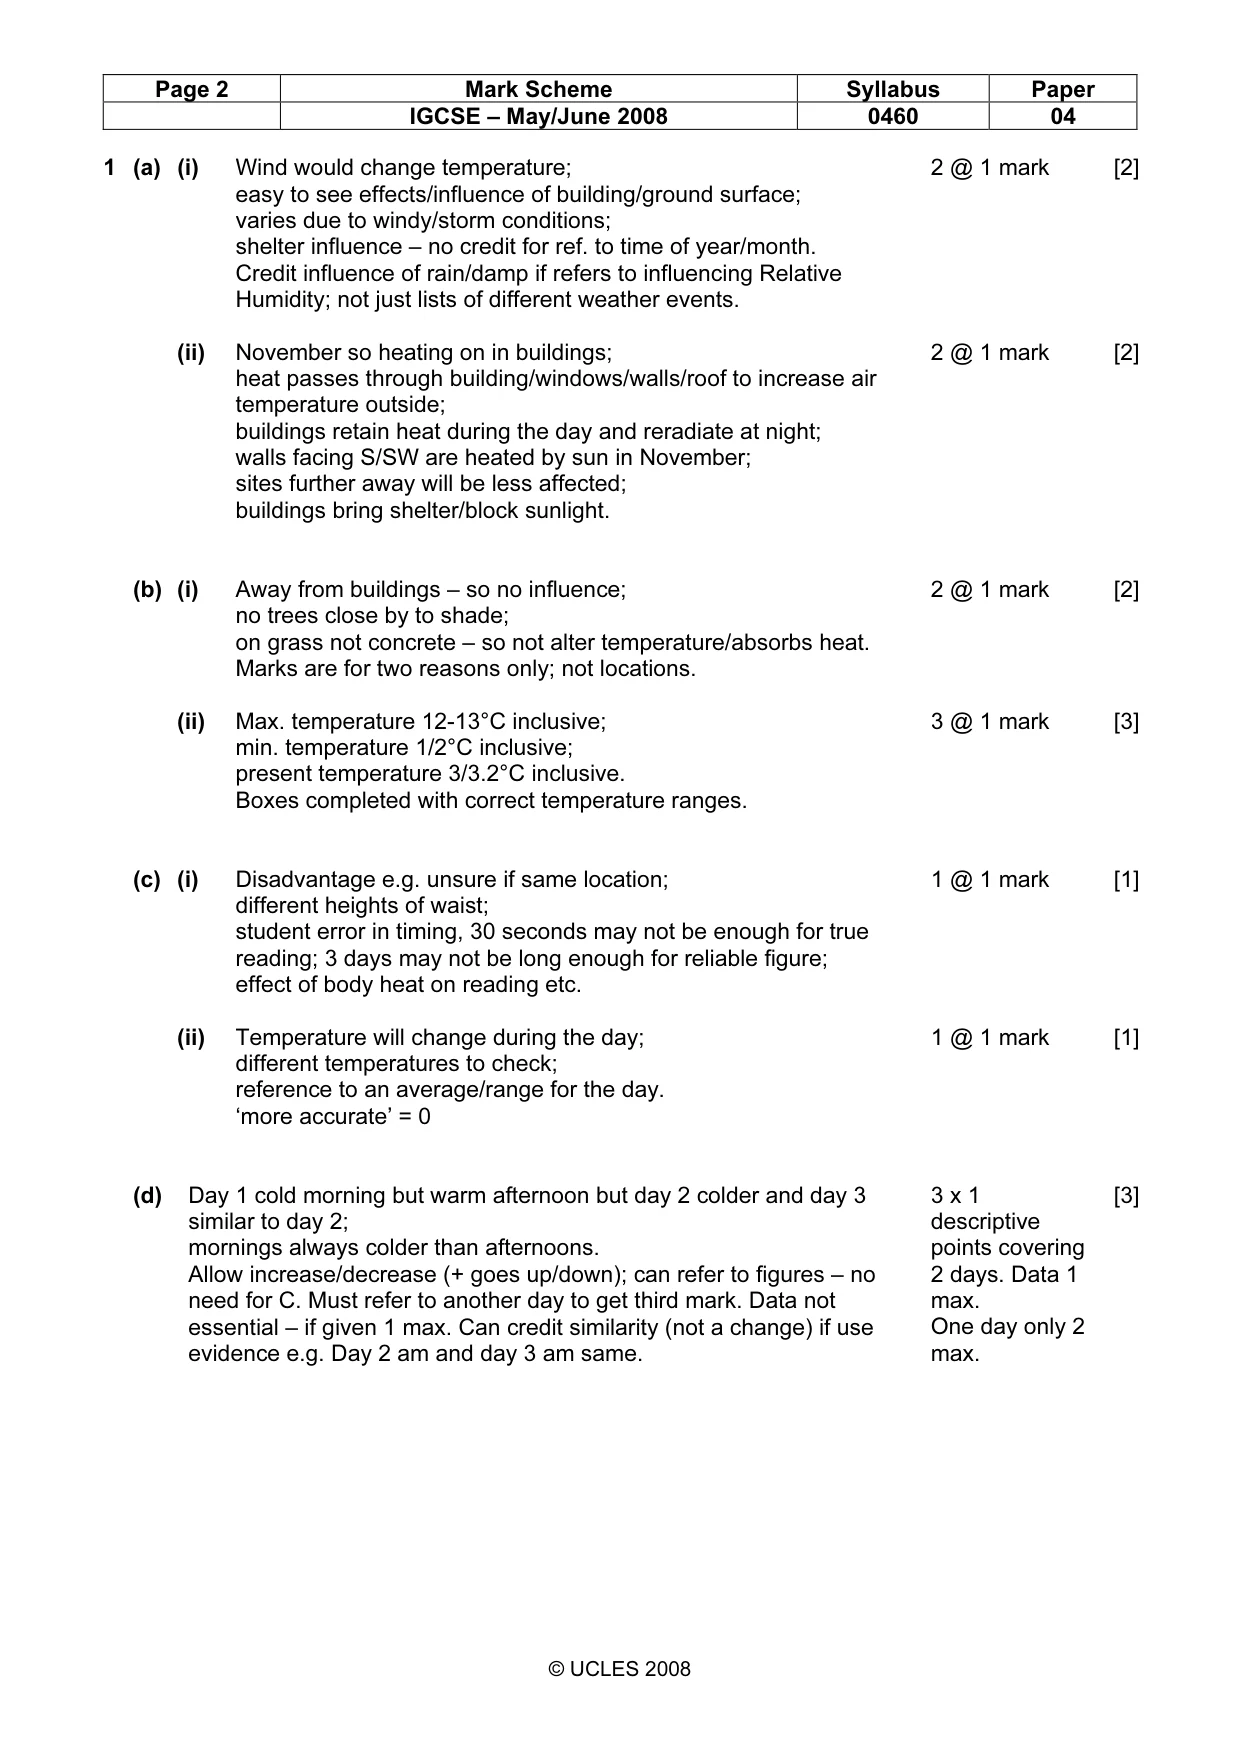
Page 2 Mark Scheme Syllabus Paper IGCSE – May/June 2008 0460 04 © UCLES 2008 1 (a) (i) Wind would change temperature; easy to see effects/influence of building/ground surface; varies due to windy/storm conditions; shelter influence – no credit for ref. to time of year/month. Credit influence of rain/damp if refers to influencing Relative Humidity; not just lists of different weather events. 2 @ 1 mark [2] (ii) November so heating on in buildings; heat passes through building/windows/walls/roof to increase air temperature outside; buildings retain heat during the day and reradiate at night; walls facing S/SW are heated by sun in November; sites further away will be less affected; buildings bring shelter/block sunlight. 2 @ 1 mark [2] (b) (i) Away from buildings – so no influence; no trees close by to shade; on grass not concrete – so not alter temperature/absorbs heat. Marks are for two reasons only; not locations. 2 @ 1 mark [2] (ii) Max. temperature 12-13°C inclusive; min. temperature 1/2°C inclusive; present temperature 3/3.2°C inclusive. Boxes completed with correct temperature ranges. 3 @ 1 mark [3] (c) (i) Disadvantage e.g. unsure if same location; different heights of waist; student error in timing, 30 seconds may not be enough for true reading; 3 days may not be long enough for reliable figure; effect of body heat on reading etc. 1 @ 1 mark [1] (ii) Temperature will change during the day; different temperatures to check; reference to an average/range for the day. ‘more accurate’ = 0 1 @ 1 mark [1] (d) Day 1 cold morning but warm afternoon but day 2 colder and day 3 similar to day 2; mornings always colder than afternoons. Allow increase/decrease (+ goes up/down); can refer to figures – no need for C. Must refer to another day to get third mark. Data not essential – if given 1 max. Can credit similarity (not a change) if use evidence e.g. Day 2 am and day 3 am same. 3 x 1 descriptive points covering 2 days. Data 1 max. One day only 2 max. [3]
Mark scheme, page 3
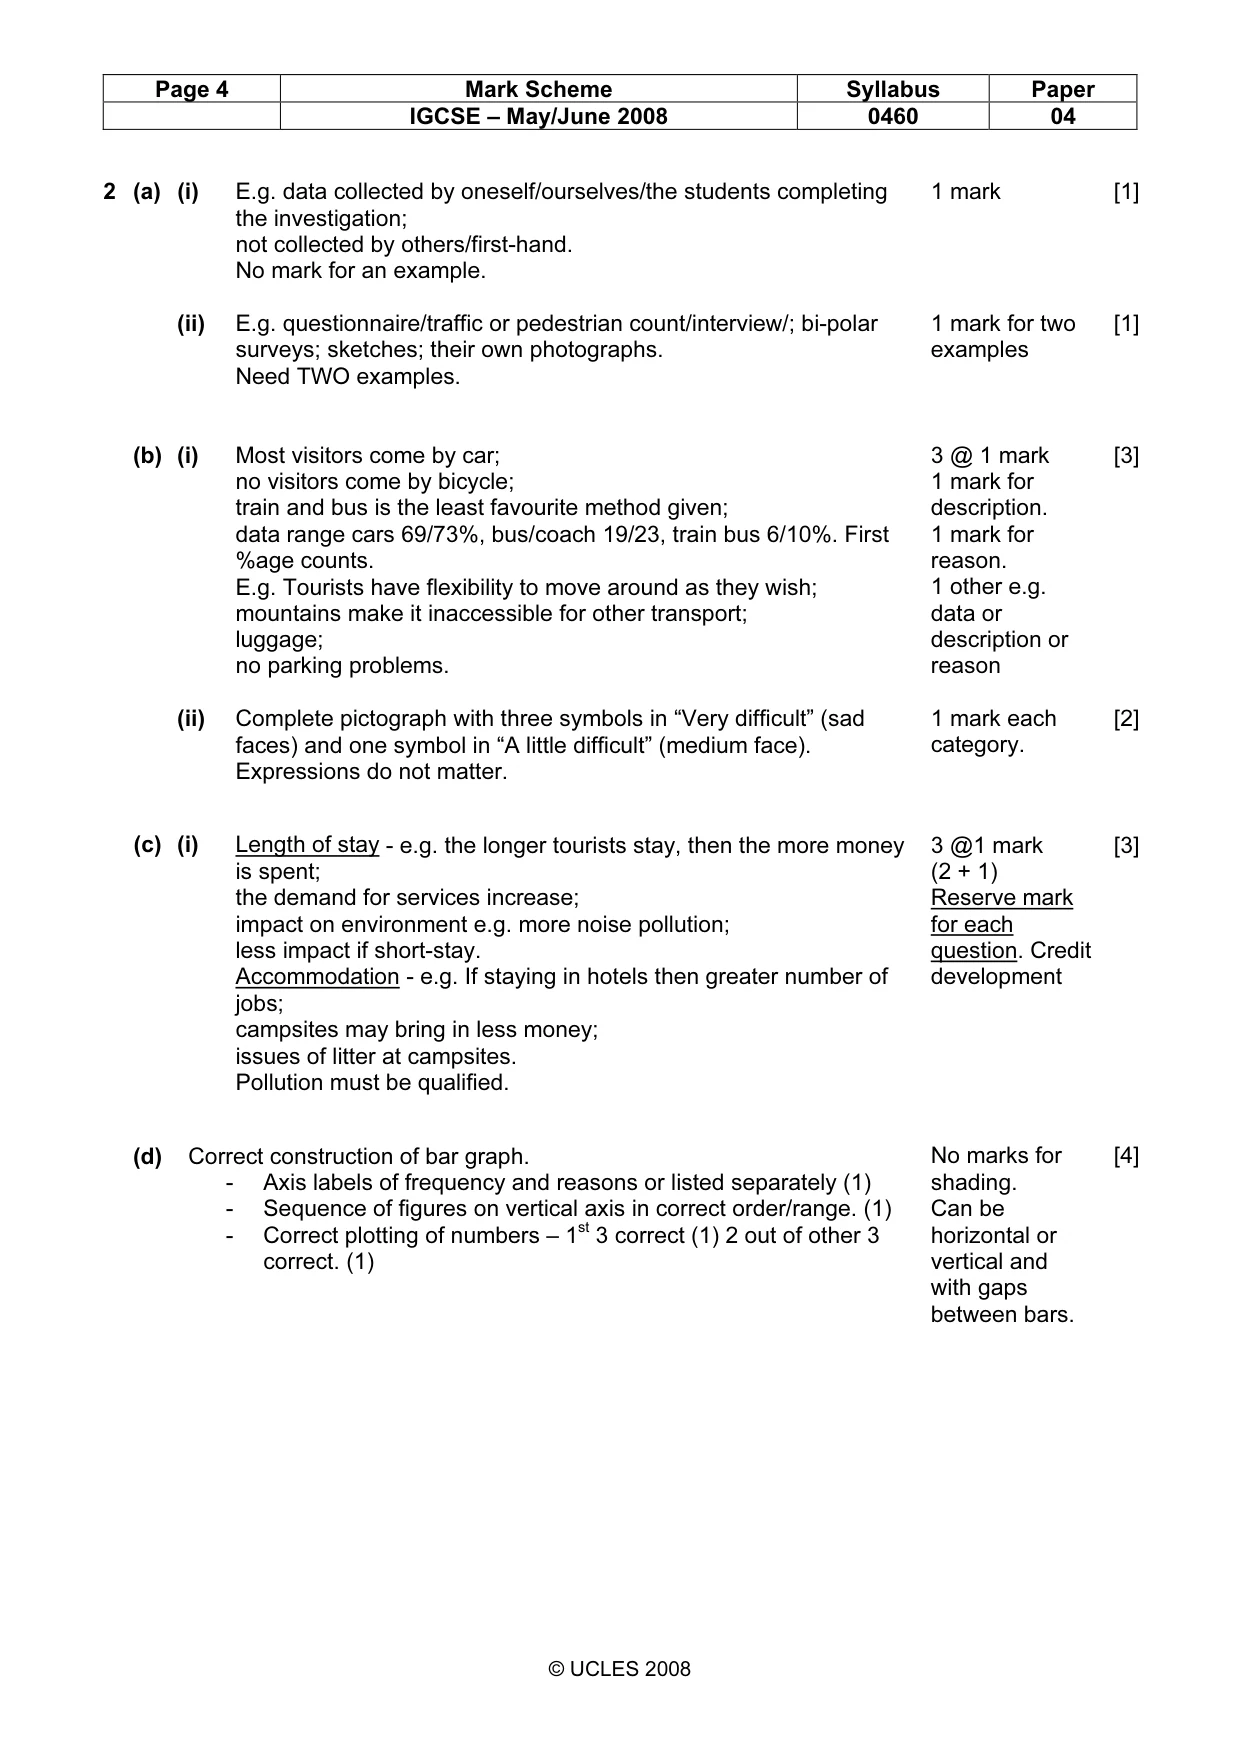
Page 3 Mark Scheme Syllabus Paper IGCSE – May/June 2008 0460 04 © UCLES 2008 (e) (i) F: 5.2 at 17m, G: 5.4 at 9m, H: 5.8 at 2m. No marks if letters missing but allow if 2/3 letters given. 3 @ 1 mark [3] (ii) Line of best fit within tolerance – RHS 4.6/5.3 to LHS 5.4/6.1 Straight or curved; 0 for joining plots. 1 @ 1 mark [1] (iii) E.g. the sites closest to the buildings have warmer average temperatures OR The furthest site has the lowest temperature – no credit for opposites. Credit data e.g. with distance (metres) temperature (C) is reduced idea. No need to refer to the map, if do credit to 1 max. 1 for trend 1 for data 1 other. [3] (f) Sites with plants = A + B + F = 75 + 77 + 73 = 225/3 = 75%. IGNORE WORKING. Sites without plants = C + D + E + G + H = 76 + 75 + 73 + 75 + 7 = 376/5 = 75.2% but accept 75.25%. Credit “No” or negative statement. Credit “Yes”/positive statement if correct judgement using wrong figures. 1 for totals. 1 for correct decision based on figures. [2] (g) (i) Hypothesis 1 – Yes/to some extent (1); Reason e.g. site B/E has higher temperature than A/D but can give reasons for why temperature higher – windier further away/heated from inside. Hypothesis 2 – To some extent/No (1); Reason e.g. little difference/almost same between vegetated/non vegetated sites. 2 @ (1 + 1) marks [4] (ii) E.g. only three days; only twice each day; should be at other times of the year; student error in measuring; measure at waist height. Credit practical ideas to improve investigation. Expect three negative, allow one positive. 3 @ 1 mark credit development 1 max. for + ve. [3]
Mark scheme, page 4
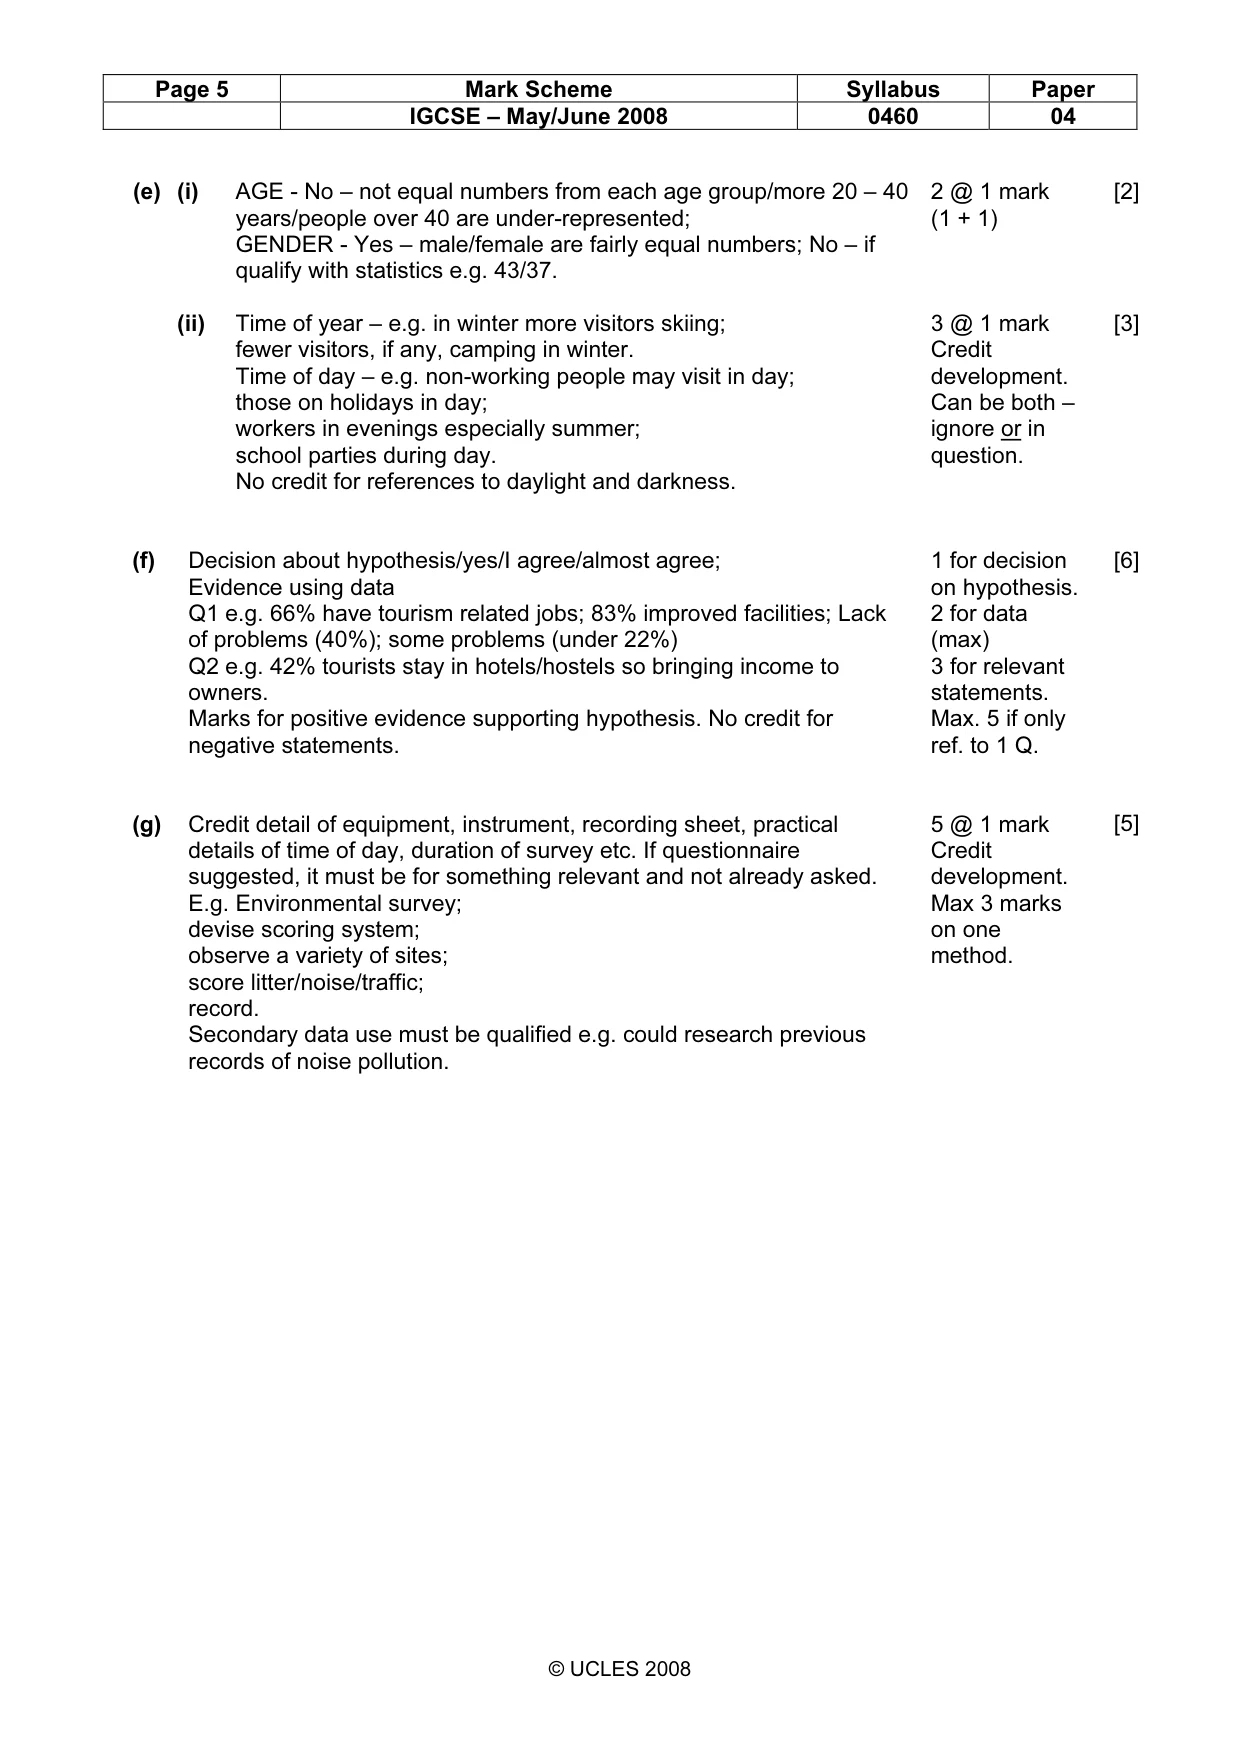
Page 4 Mark Scheme Syllabus Paper IGCSE – May/June 2008 0460 04 © UCLES 2008 2 (a) (i) E.g. data collected by oneself/ourselves/the students completing the investigation; not collected by others/first-hand. No mark for an example. 1 mark [1] (ii) E.g. questionnaire/traffic or pedestrian count/interview/; bi-polar surveys; sketches; their own photographs. Need TWO examples. 1 mark for two examples [1] (b) (i) Most visitors come by car; no visitors come by bicycle; train and bus is the least favourite method given; data range cars 69/73%, bus/coach 19/23, train bus 6/10%. First %age counts. E.g. Tourists have flexibility to move around as they wish; mountains make it inaccessible for other transport; luggage; no parking problems. 3 @ 1 mark 1 mark for description. 1 mark for reason. 1 other e.g. data or description or reason [3] (ii) Complete pictograph with three symbols in “Very difficult” (sad faces) and one symbol in “A little difficult” (medium face). Expressions do not matter. 1 mark each category. [2] (c) (i) Length of stay - e.g. the longer tourists stay, then the more money is spent; the demand for services increase; impact on environment e.g. more noise pollution; less impact if short-stay. Accommodation - e.g. If staying in hotels then greater number of jobs; campsites may bring in less money; issues of litter at campsites. Pollution must be qualified. 3 @1 mark (2 + 1) Reserve mark for each question. Credit development [3] (d) Correct construction of bar graph. - Axis labels of frequency and reasons or listed separately (1) - Sequence of figures on vertical axis in correct order/range. (1) - Correct plotting of numbers – 1st 3 correct (1) 2 out of other 3 correct. (1) No marks for shading. Can be horizontal or vertical and with gaps between bars. [4]
Mark scheme, page 5
Page 5 Mark Scheme Syllabus Paper IGCSE – May/June 2008 0460 04 © UCLES 2008 (e) (i) AGE - No – not equal numbers from each age group/more 20 – 40 years/people over 40 are under-represented; GENDER - Yes – male/female are fairly equal numbers; No – if qualify with statistics e.g. 43/37. 2 @ 1 mark (1 + 1) [2] (ii) Time of year – e.g. in winter more visitors skiing; fewer visitors, if any, camping in winter. Time of day – e.g. non-working people may visit in day; those on holidays in day; workers in evenings especially summer; school parties during day. No credit for references to daylight and darkness. 3 @ 1 mark Credit development. Can be both – ignore or in question. [3] (f) Decision about hypothesis/yes/I agree/almost agree; Evidence using data Q1 e.g. 66% have tourism related jobs; 83% improved facilities; Lack of problems (40%); some problems (under 22%) Q2 e.g. 42% tourists stay in hotels/hostels so bringing income to owners. Marks for positive evidence supporting hypothesis. No credit for negative statements. 1 for decision on hypothesis. 2 for data (max) 3 for relevant statements. Max. 5 if only ref. to 1 Q. [6] (g) Credit detail of equipment, instrument, recording sheet, practical details of time of day, duration of survey etc. If questionnaire suggested, it must be for something relevant and not already asked. E.g. Environmental survey; devise scoring system; observe a variety of sites; score litter/noise/traffic; record. Secondary data use must be qualified e.g. could research previous records of noise pollution. 5 @ 1 mark Credit development. Max 3 marks on one method. [5]
What you needed in this session
Cambridge’s own grade thresholds for 2008 May/June, Paper 4 · Variant 1. A higher threshold means an easier paper — the bar moves with how the cohort did.