Cambridge IGCSE Geography 0460 — 2007 Oct/Nov Paper 2 · Variant 1
0460/21/O/N/07 · 60 marks · ≈68 min
The question paper and its mark scheme, free to read here and free to download. This is Cambridge’s own paper, exactly as it was sat.
Question paper16 pages
Mark scheme11 pages
Answers below. Sit the paper first if you are practising.
Paper as text
Question paper, page 1
This document consists of 14 printed pages, 2 blank pages and 1 Insert. SPA (KN) T27365/5 © UCLES 2007 [Turn over UNIVERSITY OF CAMBRIDGE INTERNATIONAL EXAMINATIONS International General Certificate of Secondary Education READ THESE INSTRUCTIONS FIRST Write your Centre number, candidate number and name in the spaces provided. Write in dark blue or black pen. You may use a soft pencil for any diagrams, graphs or rough working. Do not use staples, paper clips, highlighters, glue or correction fluid. DO NOT WRITE IN ANY BARCODES. Answer all questions. The Insert contains Photograph A for Question 3. Sketch maps and diagrams should be drawn whenever they serve to illustrate an answer. The Survey Map Extract and the Insert are not required by the Examiner. At the end of the examination, fasten all your work securely together. The number of marks is given in brackets [ ] at the end of each question or part question. * 2 5 8 2 0 8 8 7 0 5 * GEOGRAPHY 0460/02 Paper 2 October/November 2007 1 hour 30 minutes Candidates answer on the Question Paper. Additional Materials: Ruler Protractor 1:50 000 Survey Map Extract is enclosed with this question paper. For Examiner’s Use Question 1 Question 2 Question 3 Question 4 Question 5 Question 6 Total www.XtremePapers.com
Question paper, page 2
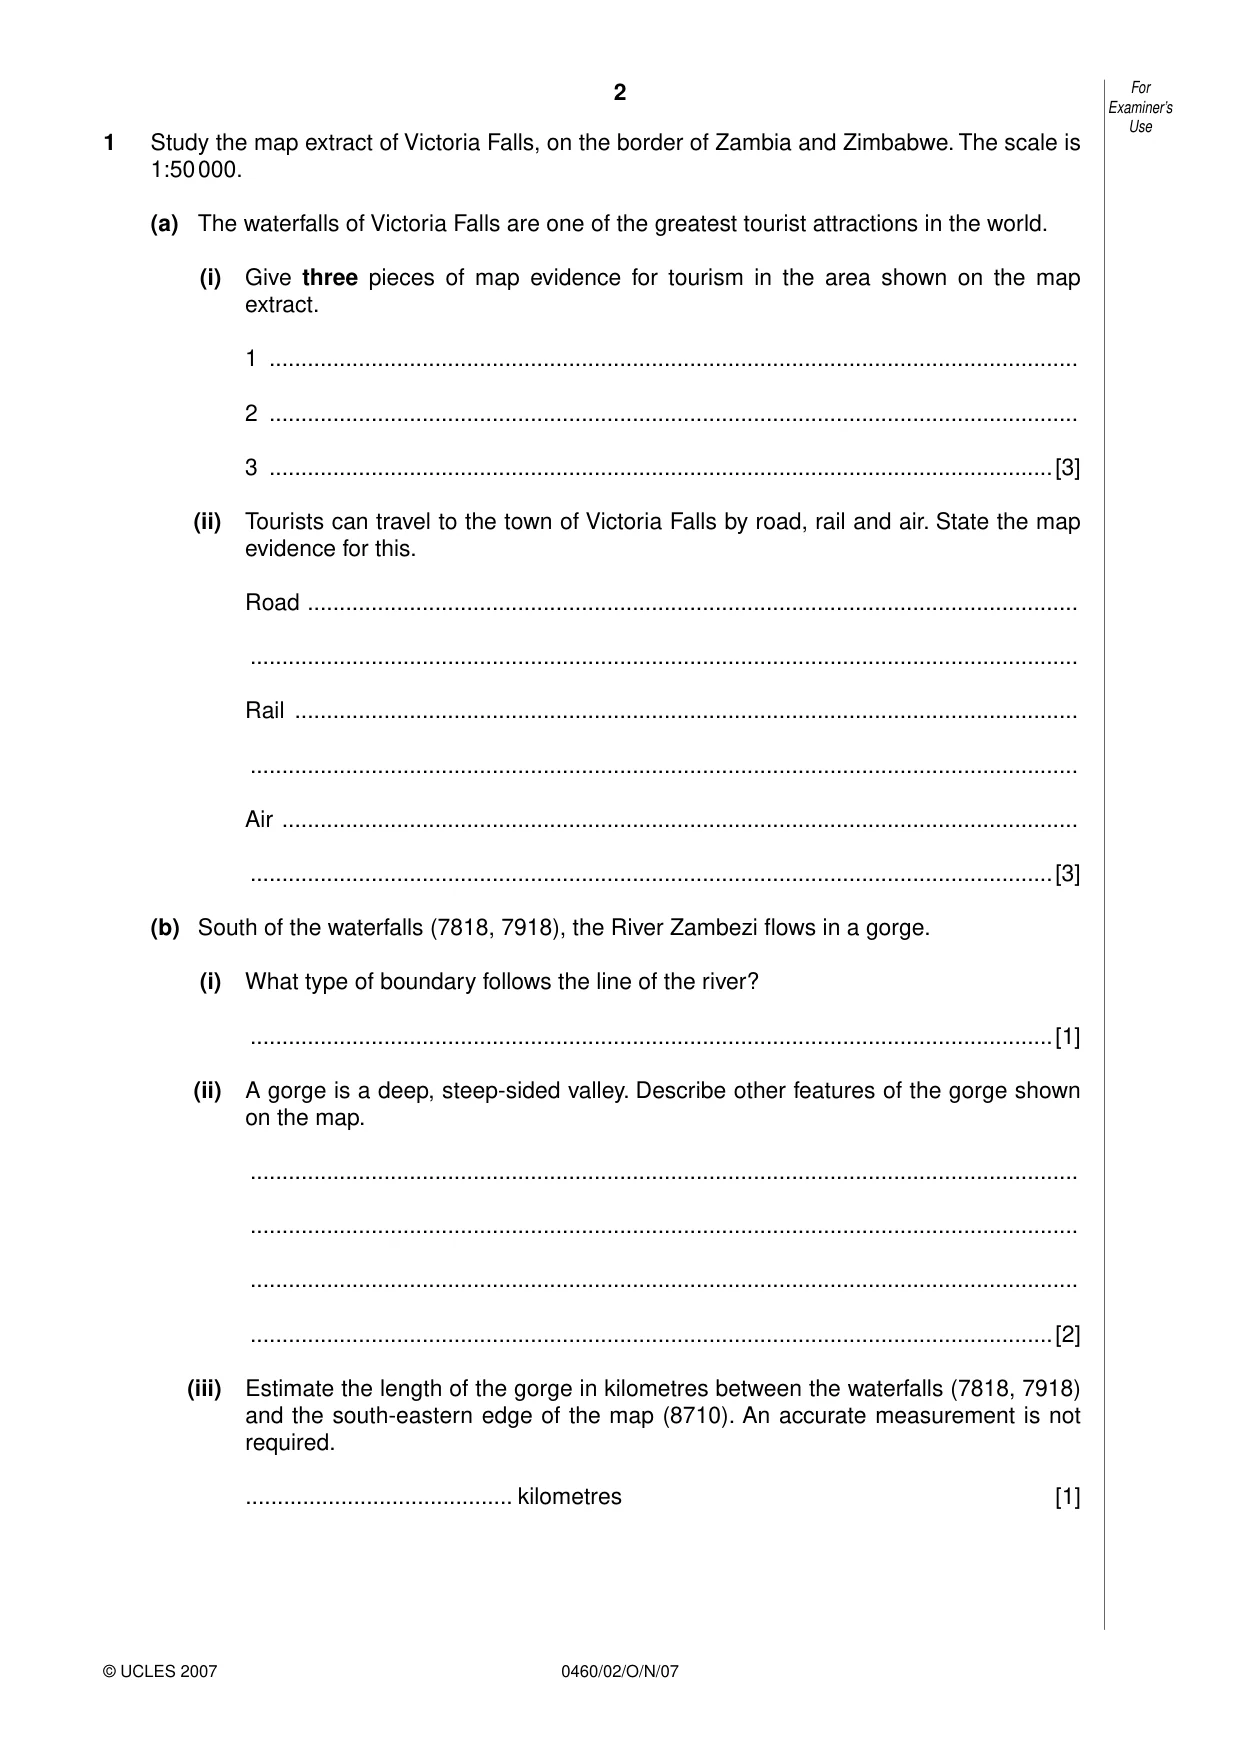
2 0460/02/O/N/07 For Examiner’s Use © UCLES 2007 1 Study the map extract of Victoria Falls, on the border of Zambia and Zimbabwe. The scale is 1:50 000. (a) The waterfalls of Victoria Falls are one of the greatest tourist attractions in the world. (i) Give three pieces of map evidence for tourism in the area shown on the map extract. 1 … 2 … 3 …[3] (ii) Tourists can travel to the town of Victoria Falls by road, rail and air. State the map evidence for this. Road … … Rail … … Air … …[3] (b) South of the waterfalls (7818, 7918), the River Zambezi flows in a gorge. (i) What type of boundary follows the line of the river? …[1] (ii) A gorge is a deep, steep-sided valley. Describe other features of the gorge shown on the map. … … … …[2] (iii) Estimate the length of the gorge in kilometres between the waterfalls (7818, 7918) and the south-eastern edge of the map (8710). An accurate measurement is not required. … kilometres [1]
Question paper, page 3
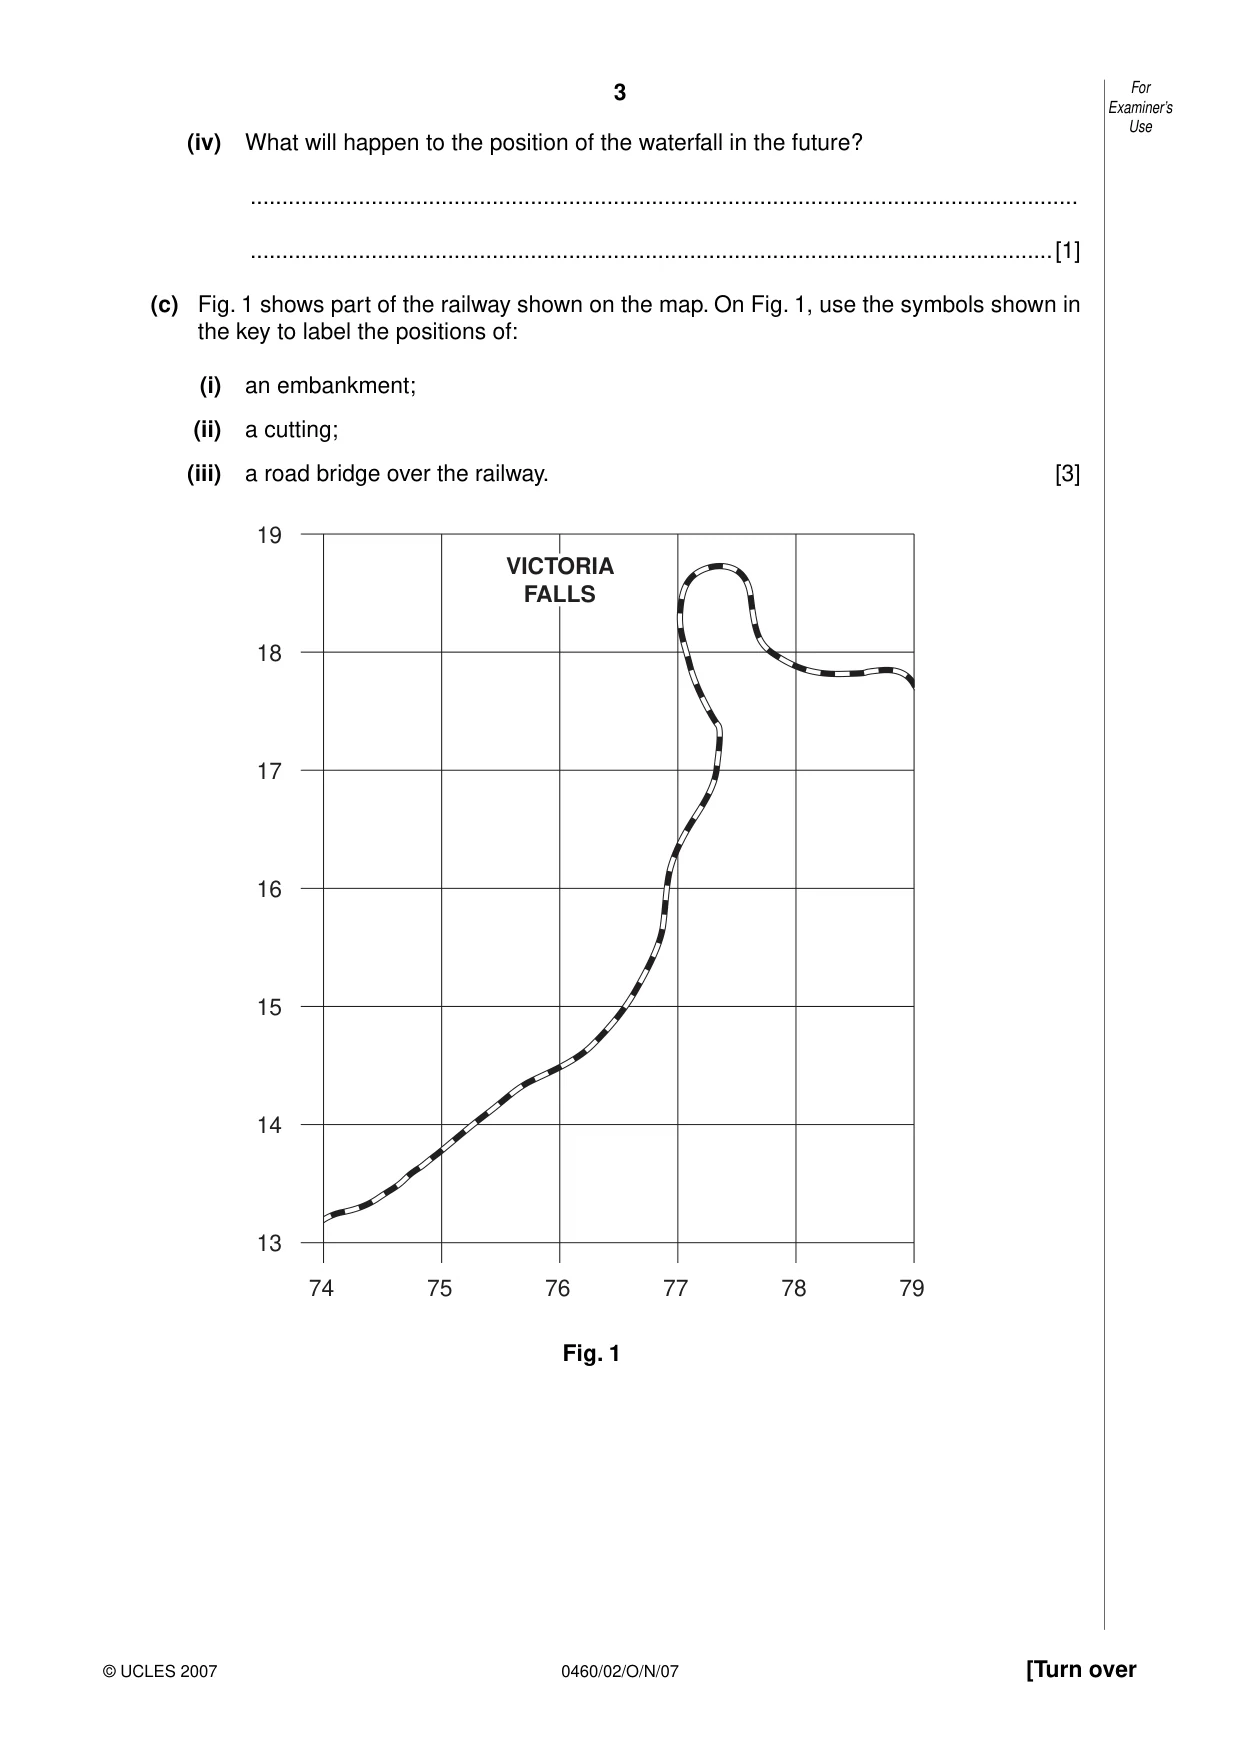
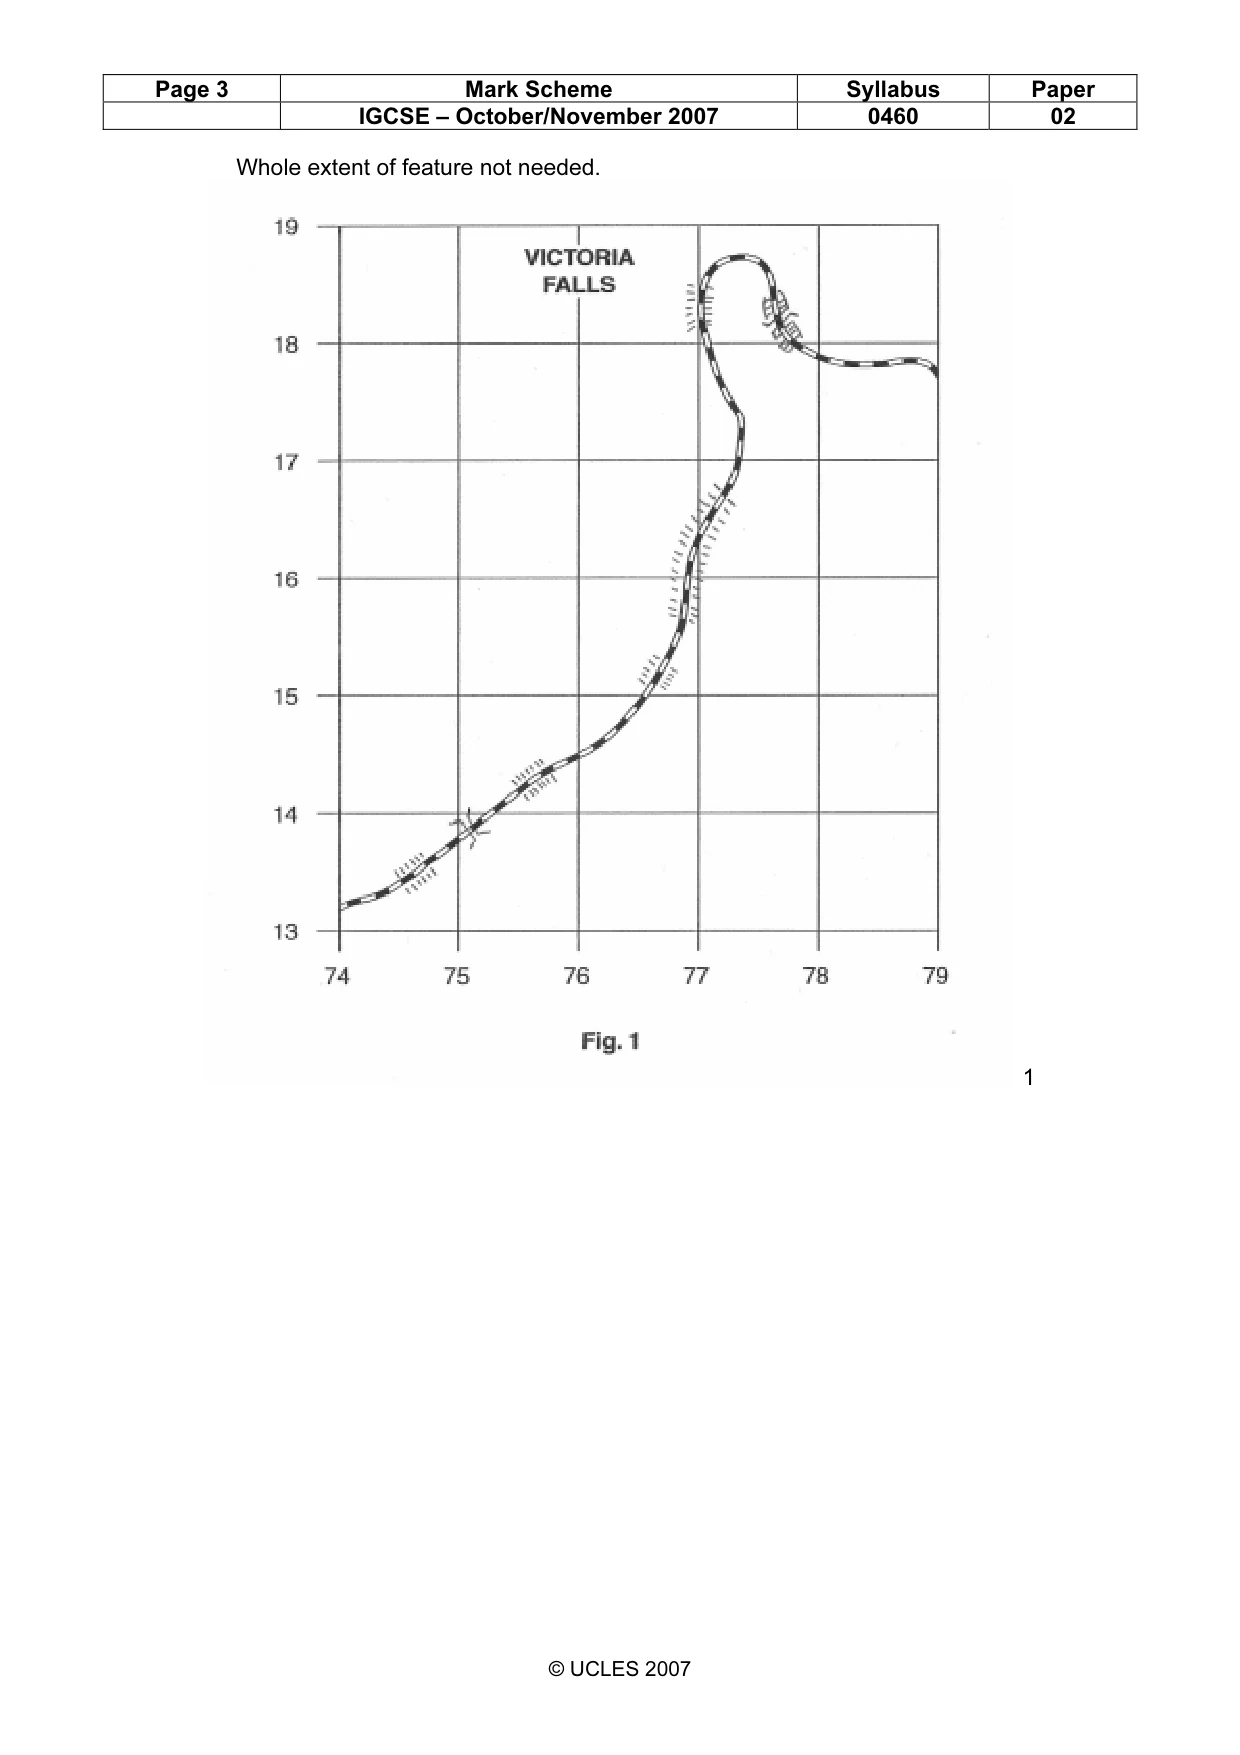
3 0460/02/O/N/07 [Turn over For Examiner’s Use © UCLES 2007 (iv) What will happen to the position of the waterfall in the future? … …[1] (c) Fig. 1 shows part of the railway shown on the map. On Fig. 1, use the symbols shown in the key to label the positions of: (i) an embankment; (ii) a cutting; (iii) a road bridge over the railway. [3] 19 18 17 16 15 14 13 74 75 76 77 78 79 VICTORIA FALLS Fig. 1
Question paper, page 4
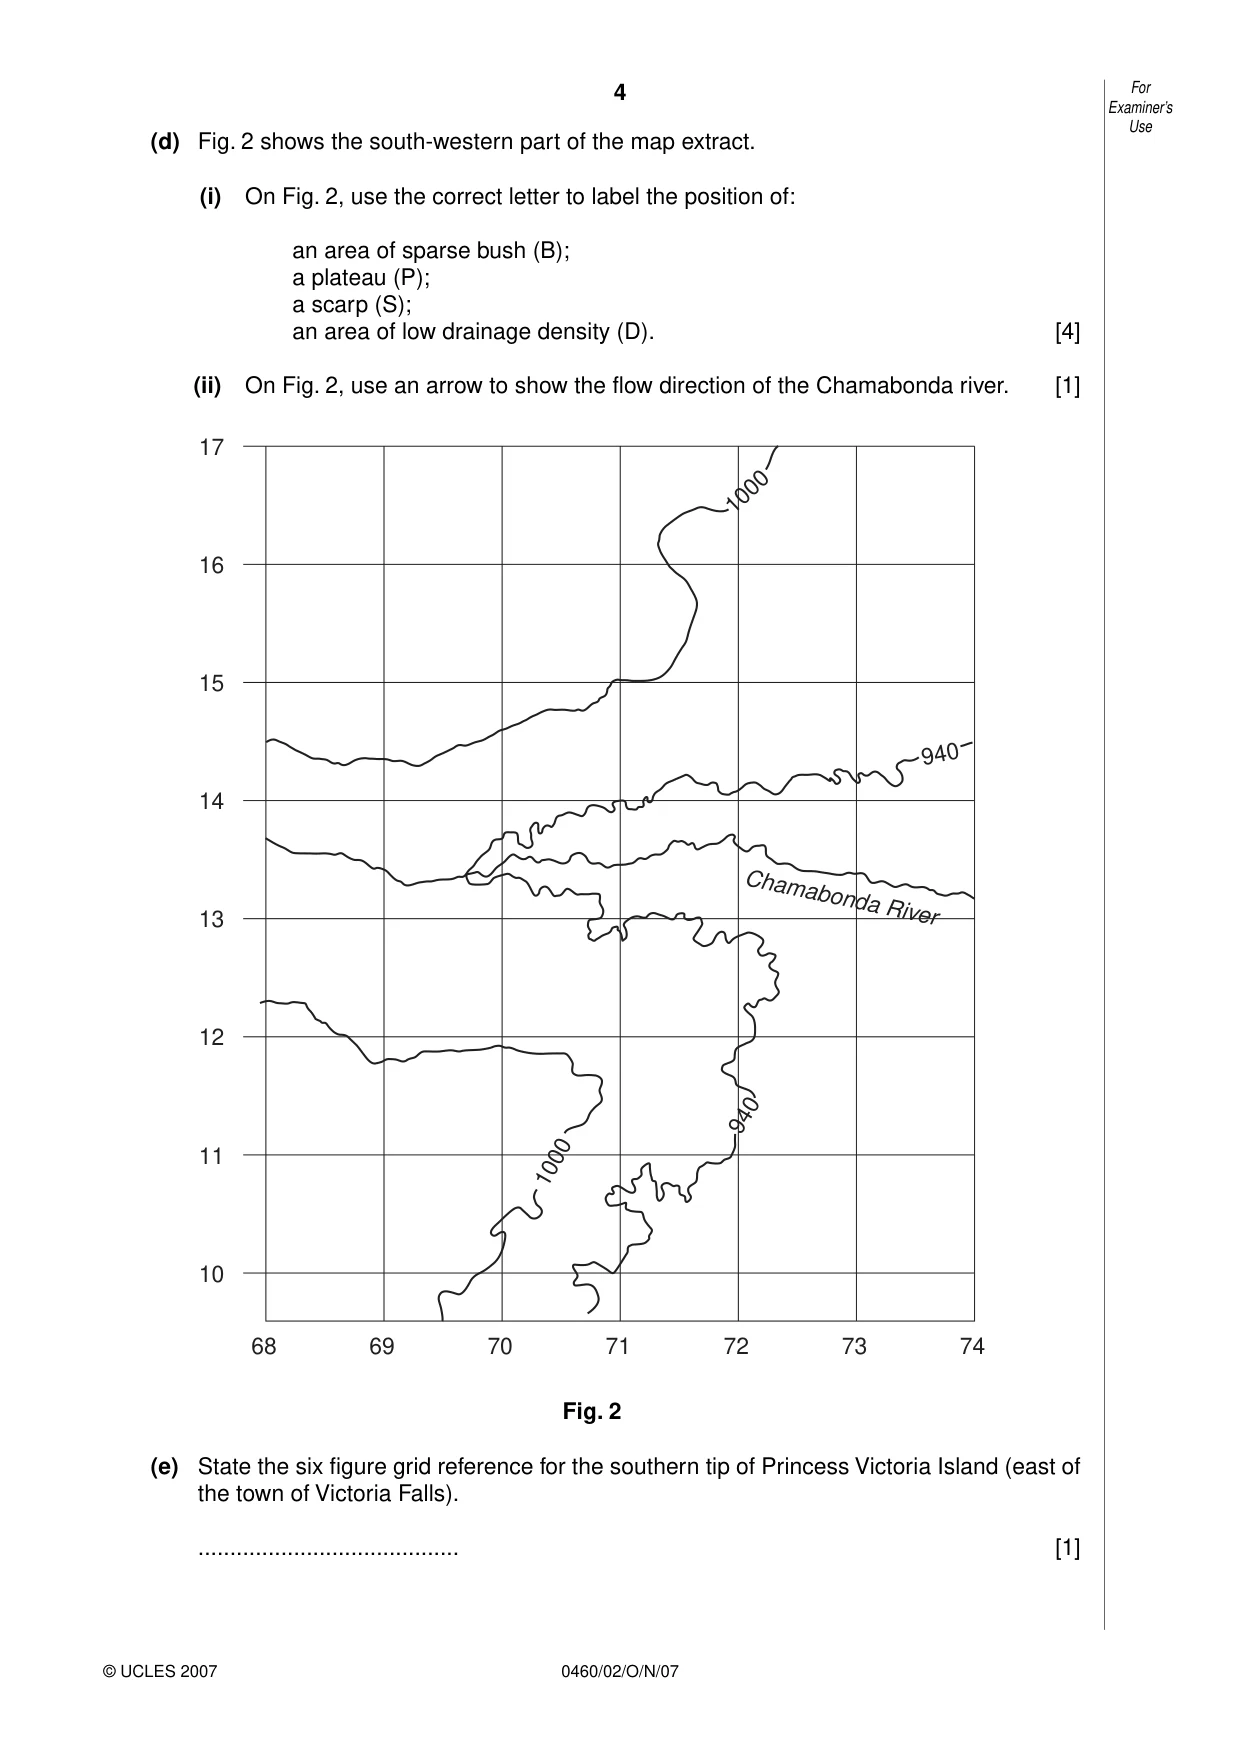
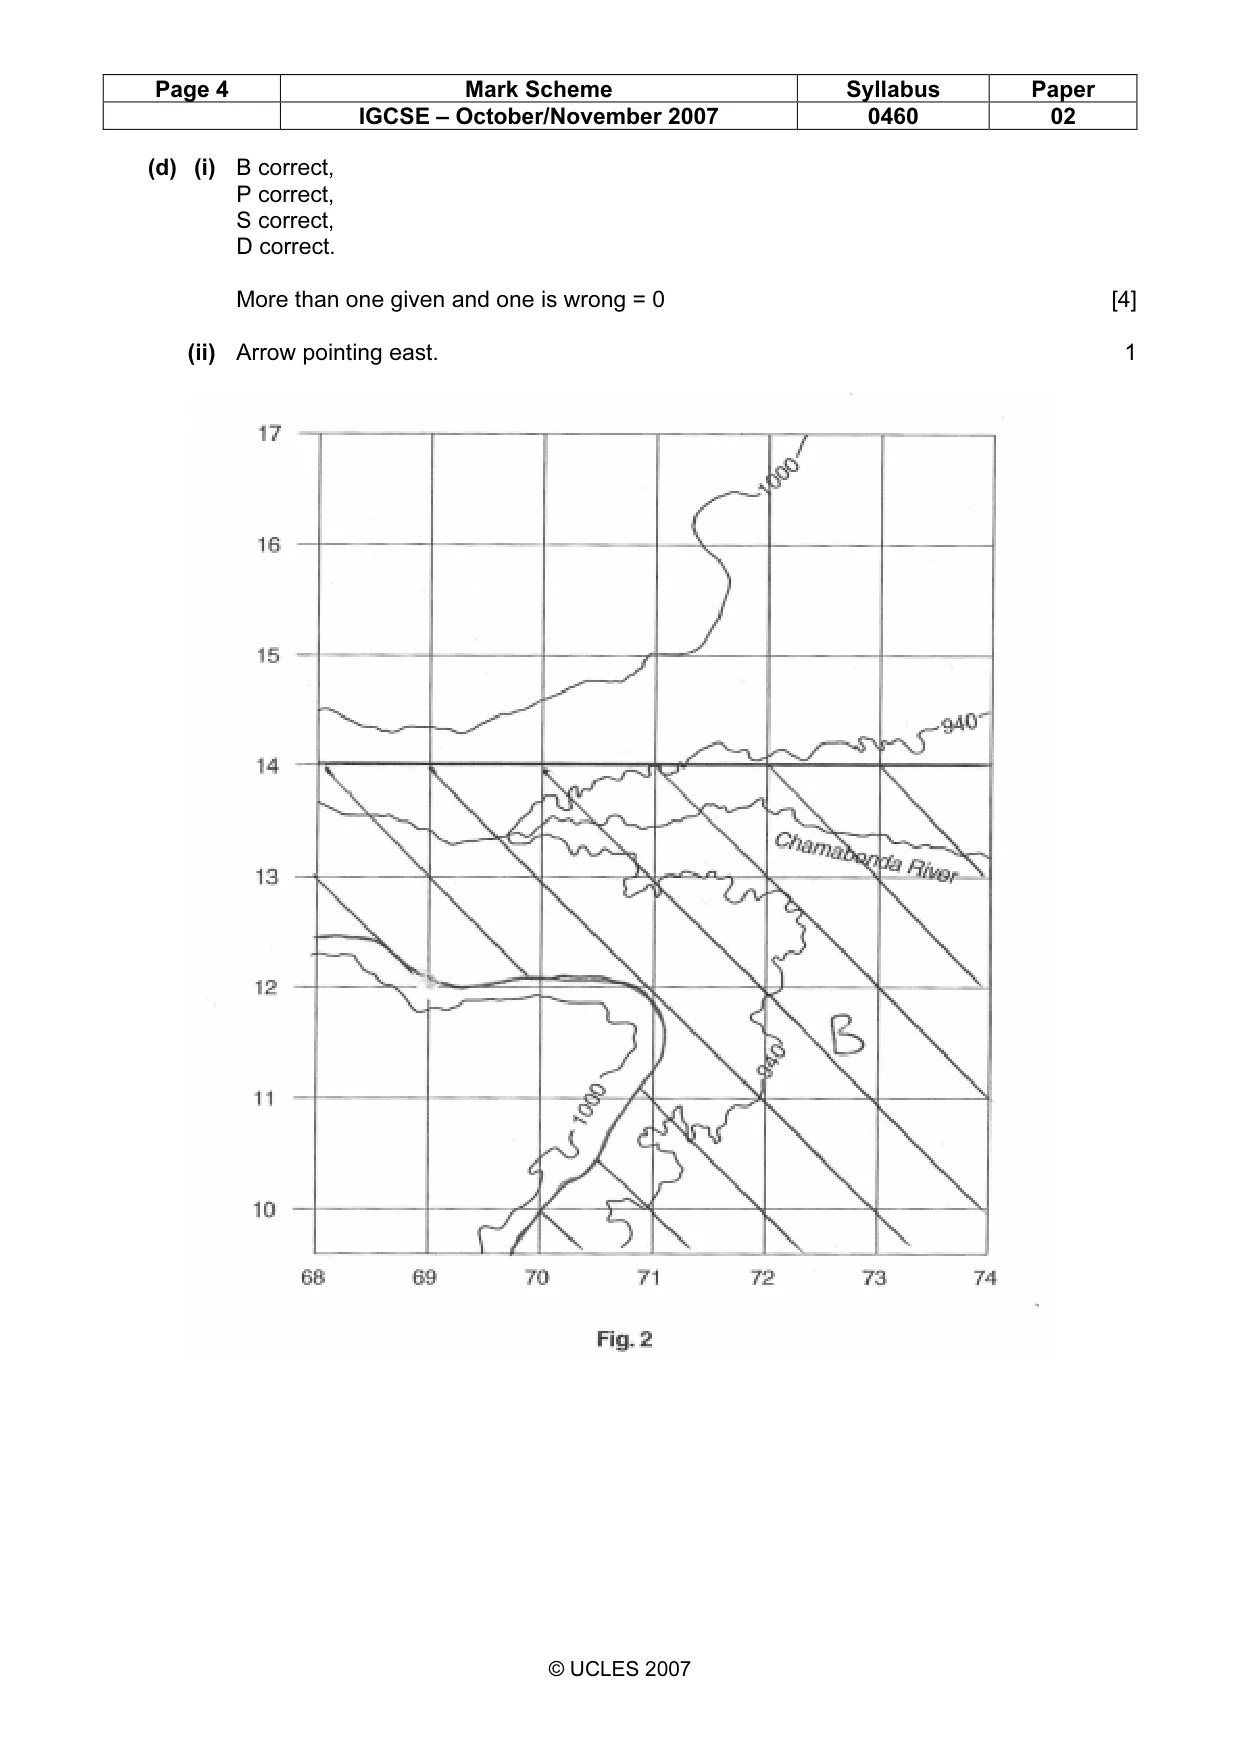
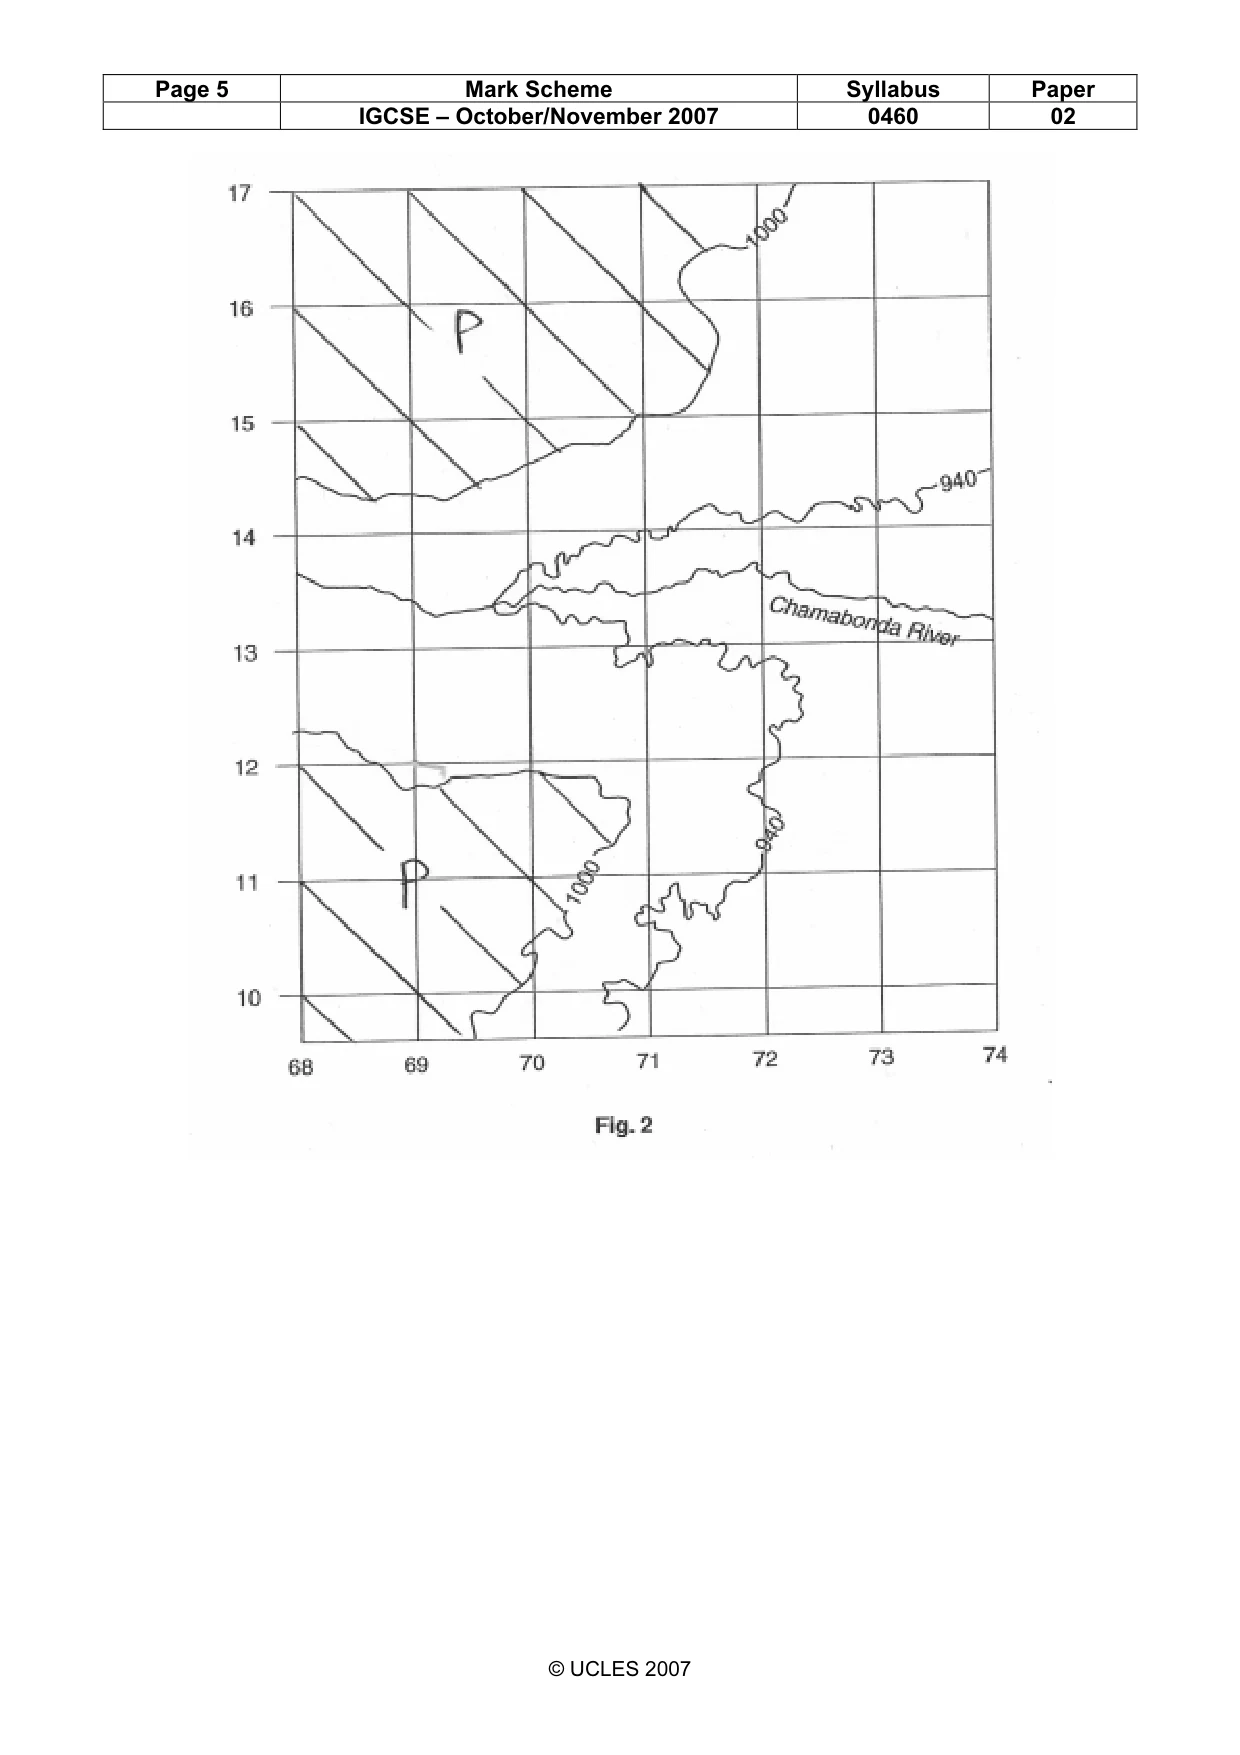
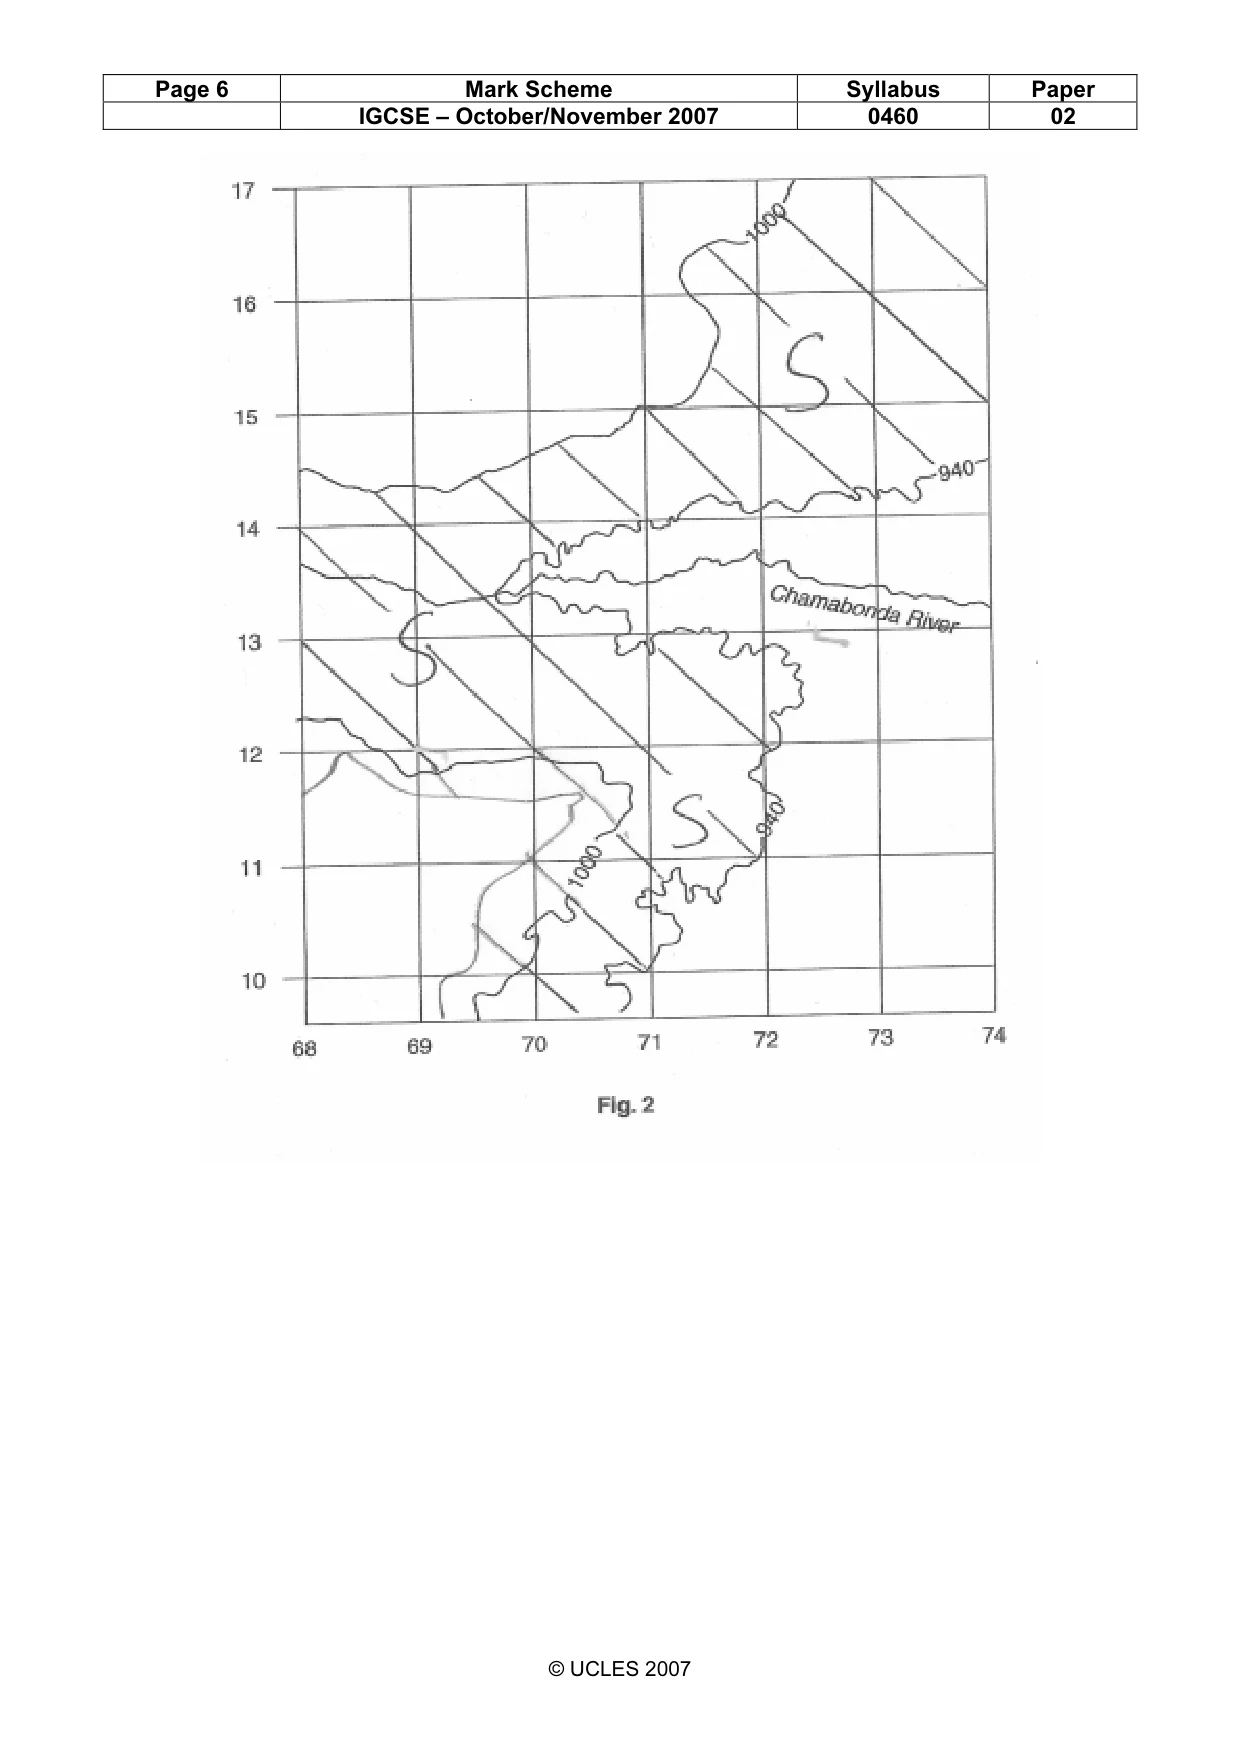
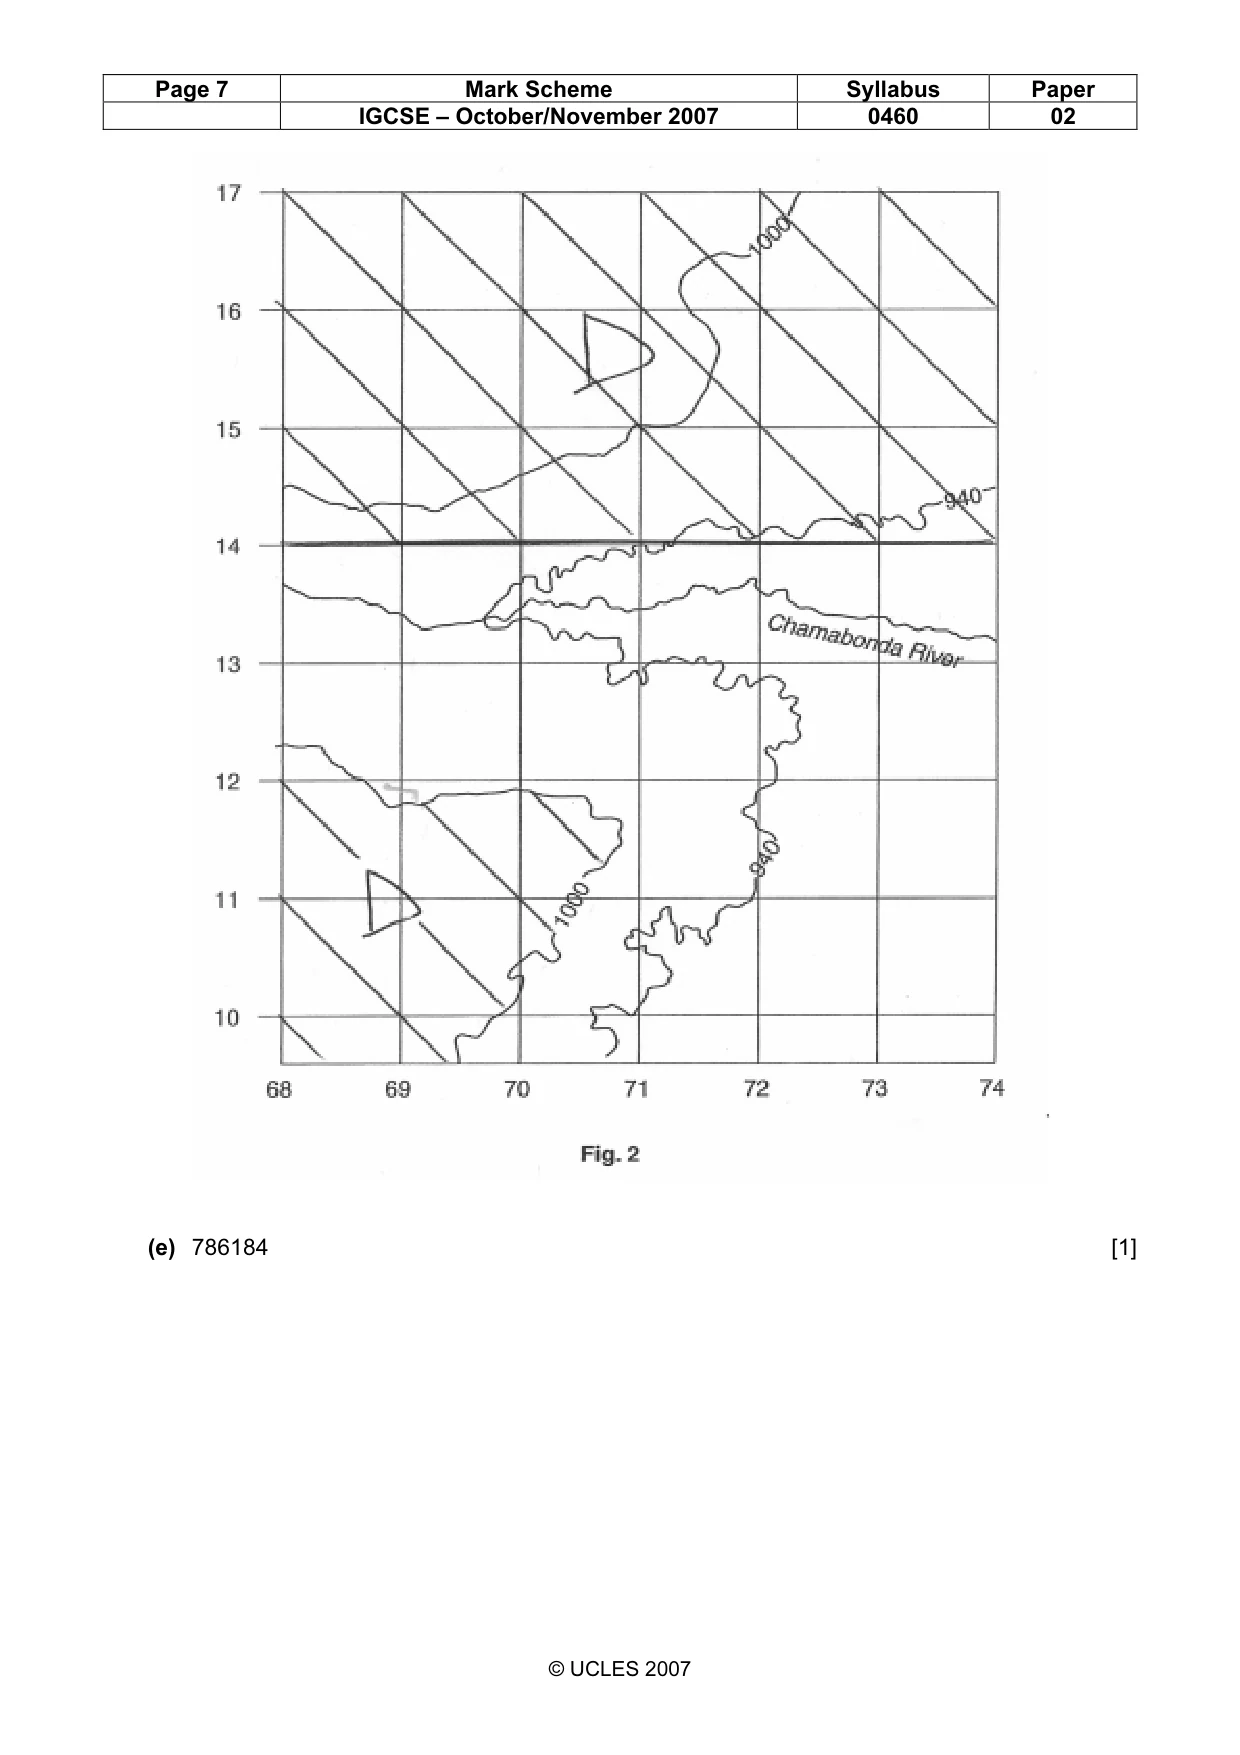
4 0460/02/O/N/07 For Examiner’s Use © UCLES 2007 (d) Fig. 2 shows the south-western part of the map extract. (i) On Fig. 2, use the correct letter to label the position of: an area of sparse bush (B); a plateau (P); a scarp (S); an area of low drainage density (D). [4] (ii) On Fig. 2, use an arrow to show the flow direction of the Chamabonda river. [1] 17 16 15 14 13 12 11 10 68 69 70 71 72 73 74 940 940 1000 Chamabonda River 1000 Fig. 2 (e) State the six figure grid reference for the southern tip of Princess Victoria Island (east of the town of Victoria Falls). … [1]
Question paper, page 6
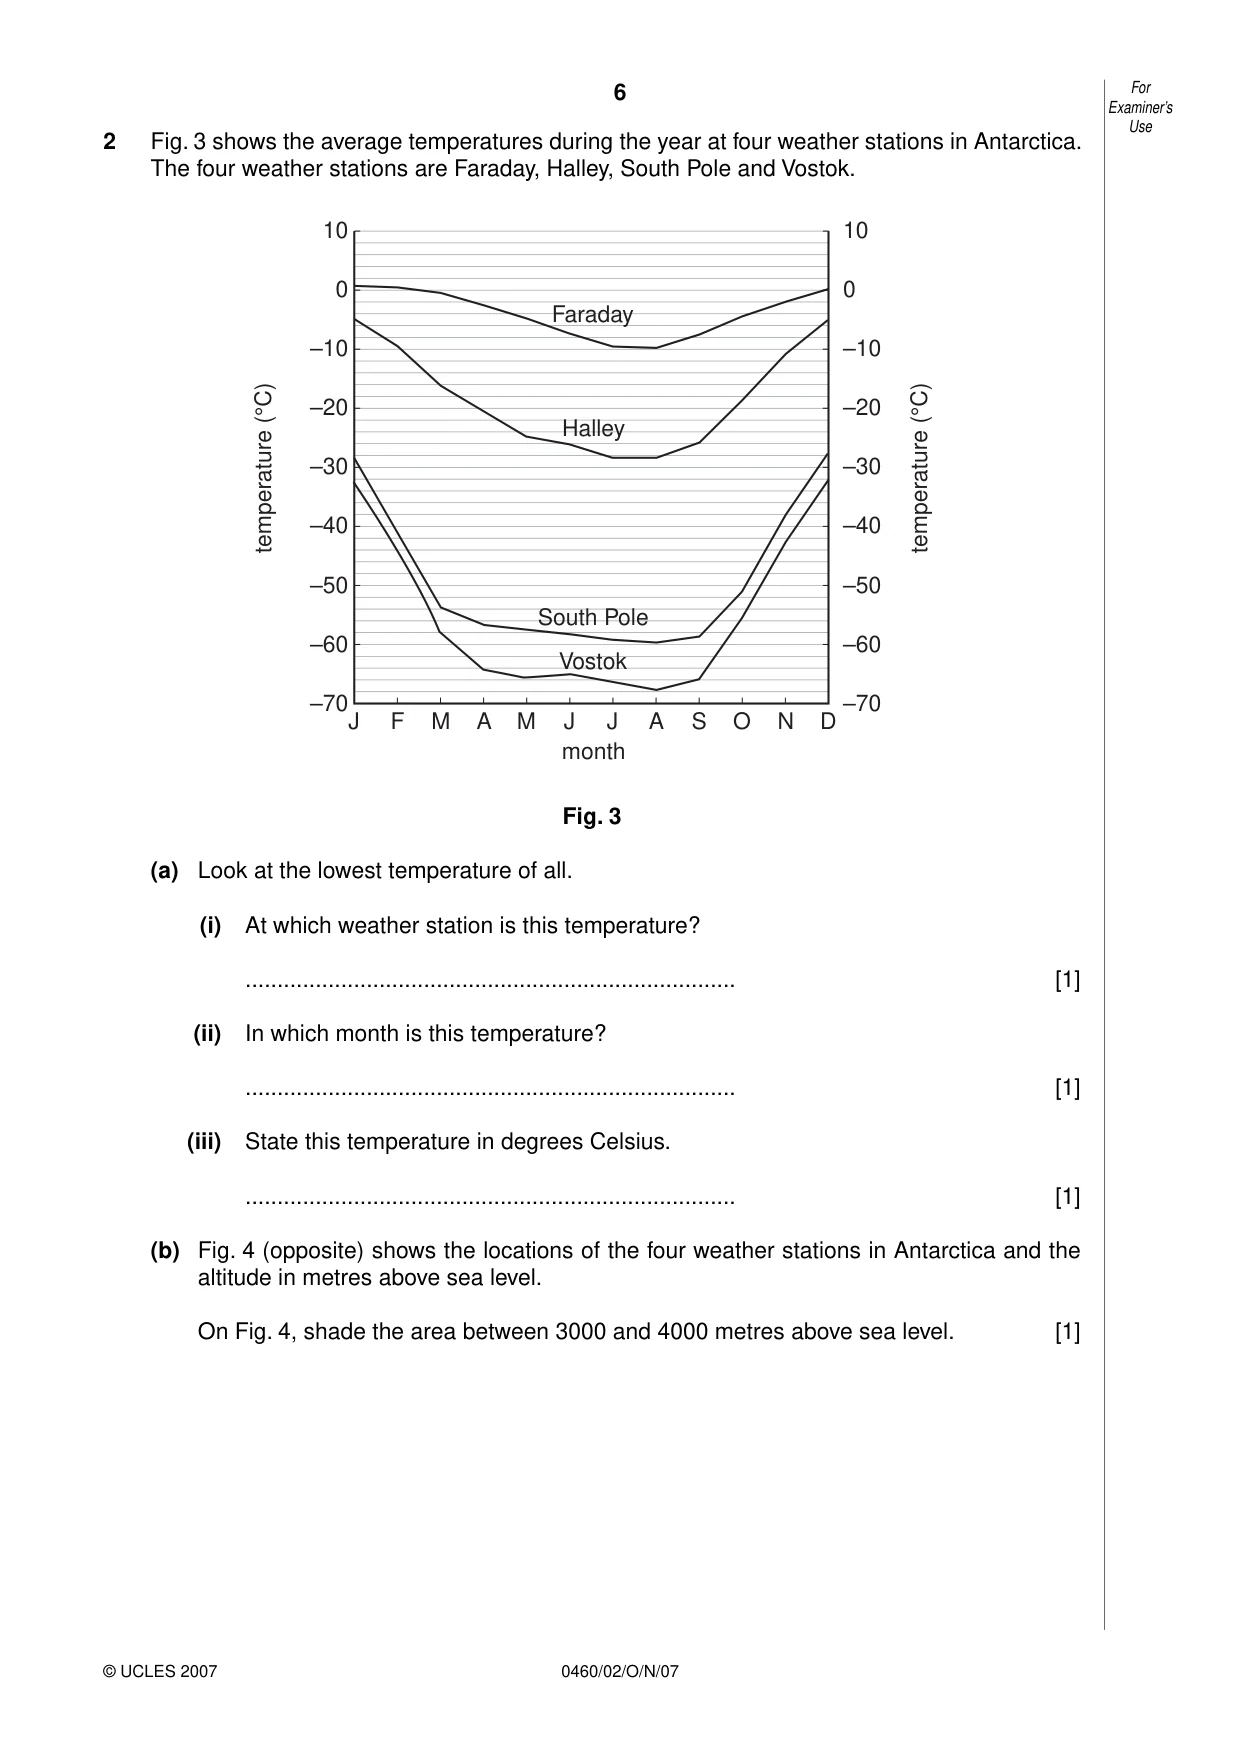
6 0460/02/O/N/07 For Examiner’s Use © UCLES 2007 2 Fig. 3 shows the average temperatures during the year at four weather stations in Antarctica. The four weather stations are Faraday, Halley, South Pole and Vostok. –70 –60 –50 –40 –30 –20 –10 0 10 –70 –60 –50 –40 –30 –20 –10 0 10 temperature (°C) temperature (°C) J F M A M J J A S O N D Faraday Halley South Pole Vostok month Fig. 3 (a) Look at the lowest temperature of all. (i) At which weather station is this temperature? … [1] (ii) In which month is this temperature? … [1] (iii) State this temperature in degrees Celsius. … [1] (b) Fig. 4 (opposite) shows the locations of the four weather stations in Antarctica and the altitude in metres above sea level. On Fig. 4, shade the area between 3000 and 4000 metres above sea level. [1]
Question paper, page 7
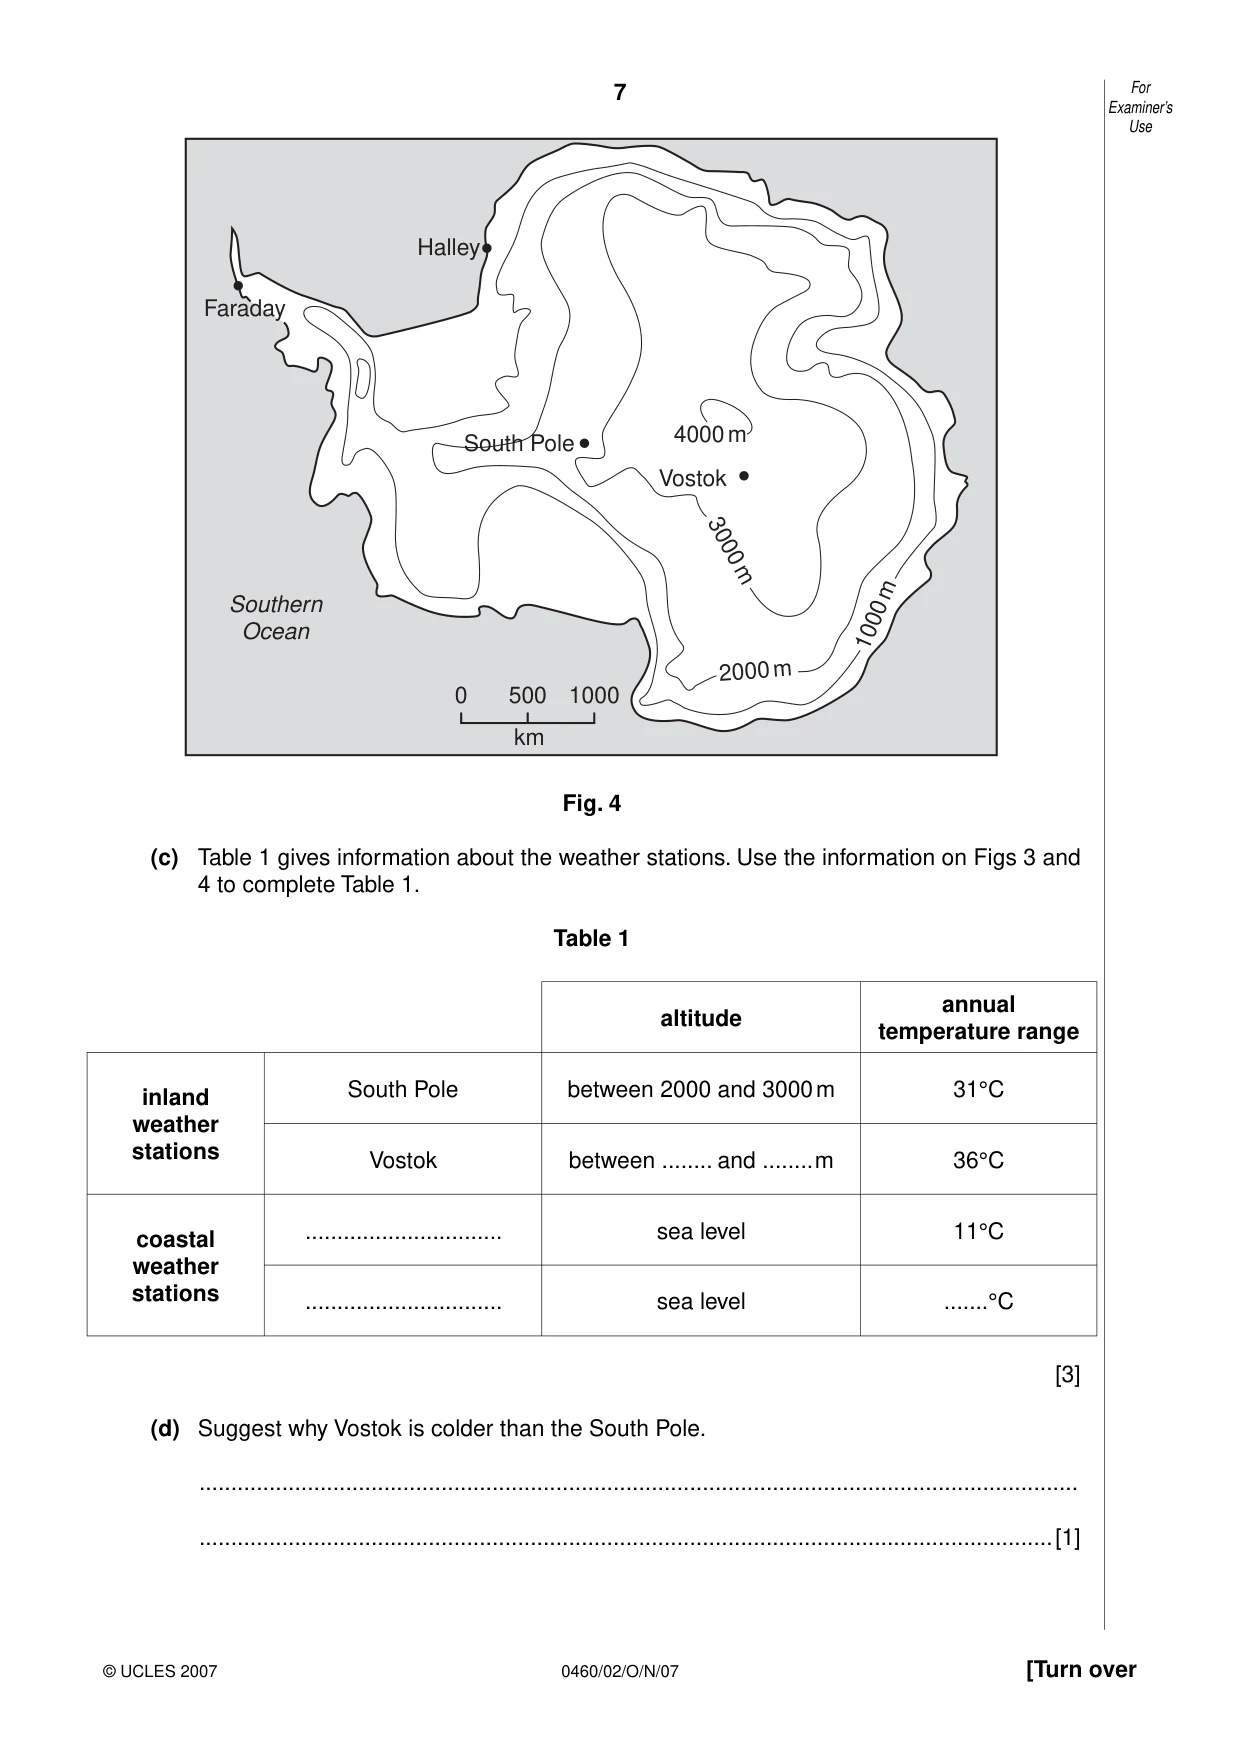
7 0460/02/O/N/07 [Turn over For Examiner’s Use © UCLES 2007 Faraday 0 500 1000 km Southern Ocean Halley South Pole 4000 m 3000 m 2000 m 1000 m Vostok Fig. 4 (c) Table 1 gives information about the weather stations. Use the information on Figs 3 and 4 to complete Table 1. Table 1 altitude annual temperature range inland weather stations South Pole between 2000 and 3000 m 31°C Vostok between … and … m 36°C coastal weather stations … sea level 11°C … sea level …°C [3] (d) Suggest why Vostok is colder than the South Pole. … …[1]
Question paper, page 8
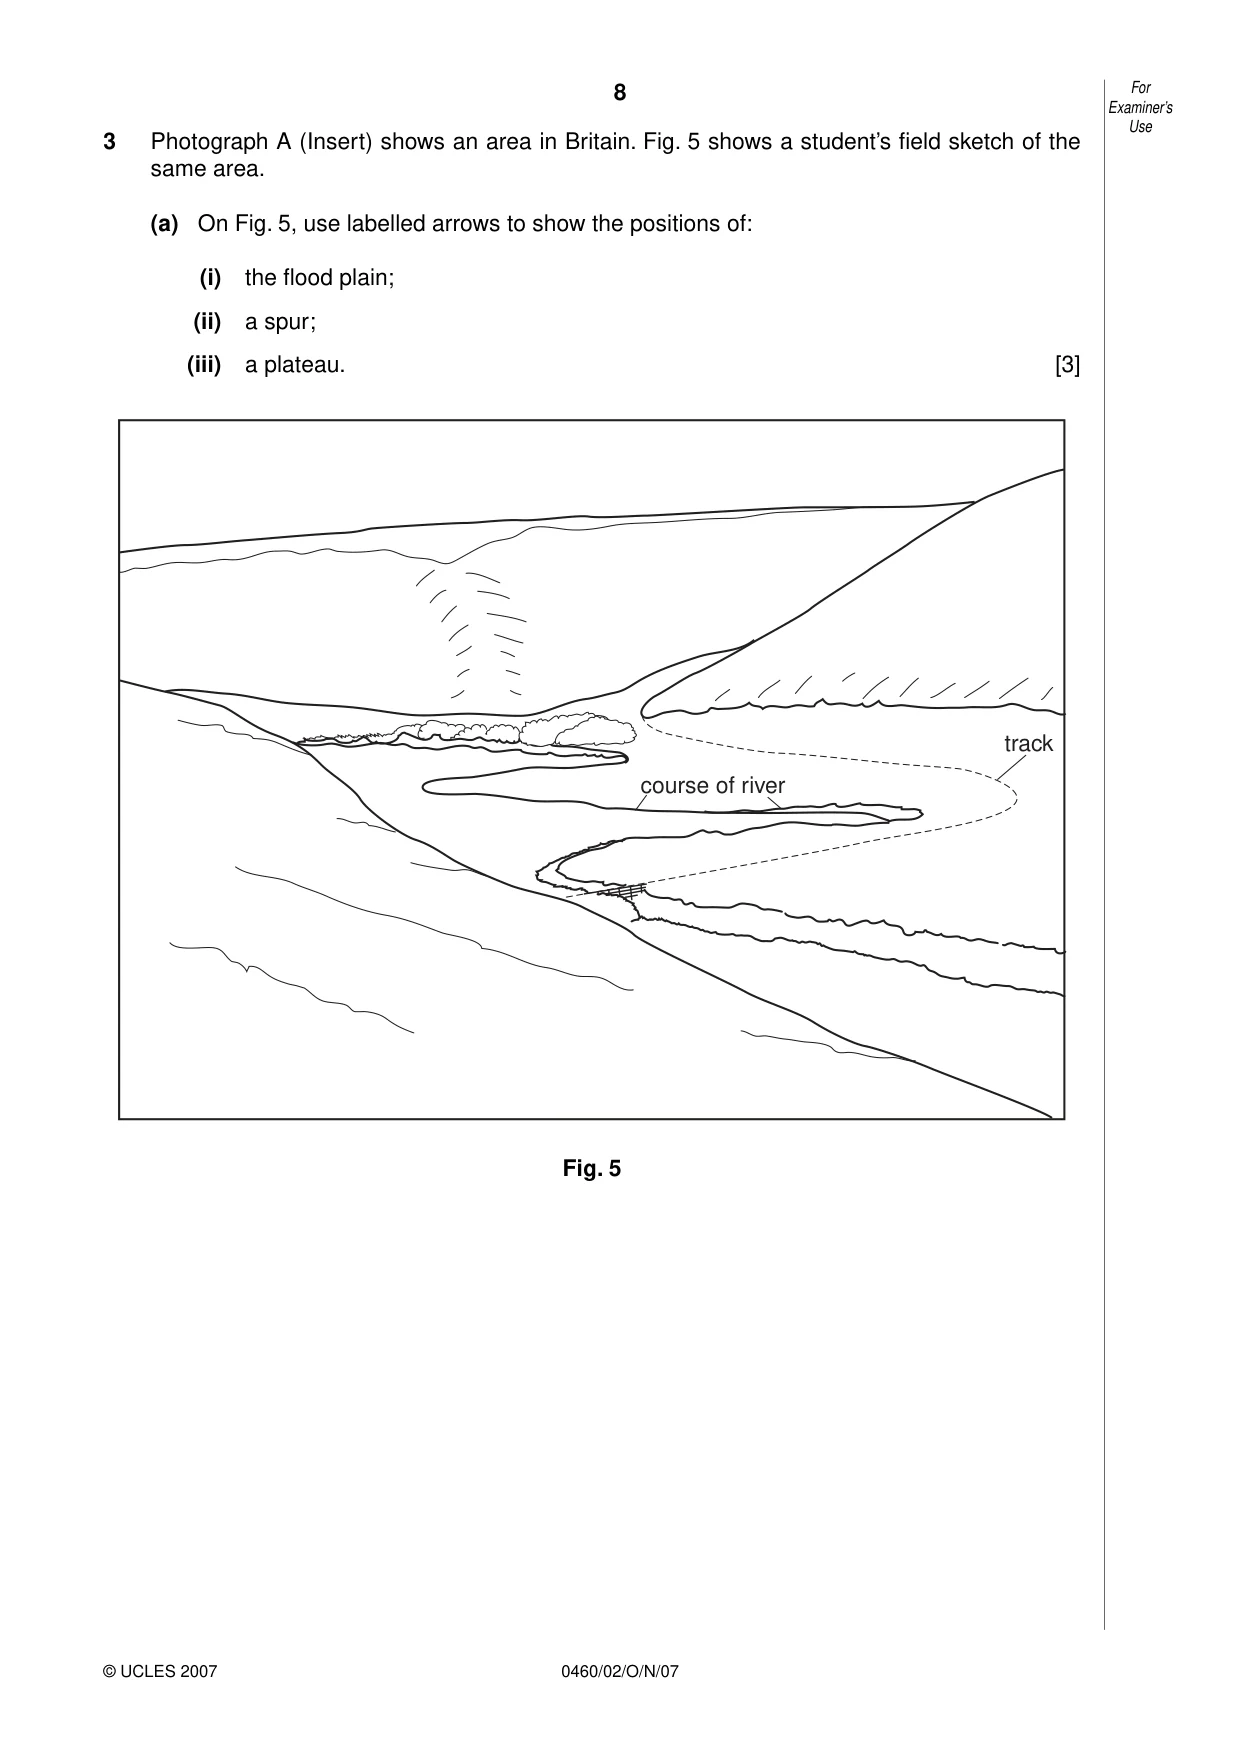
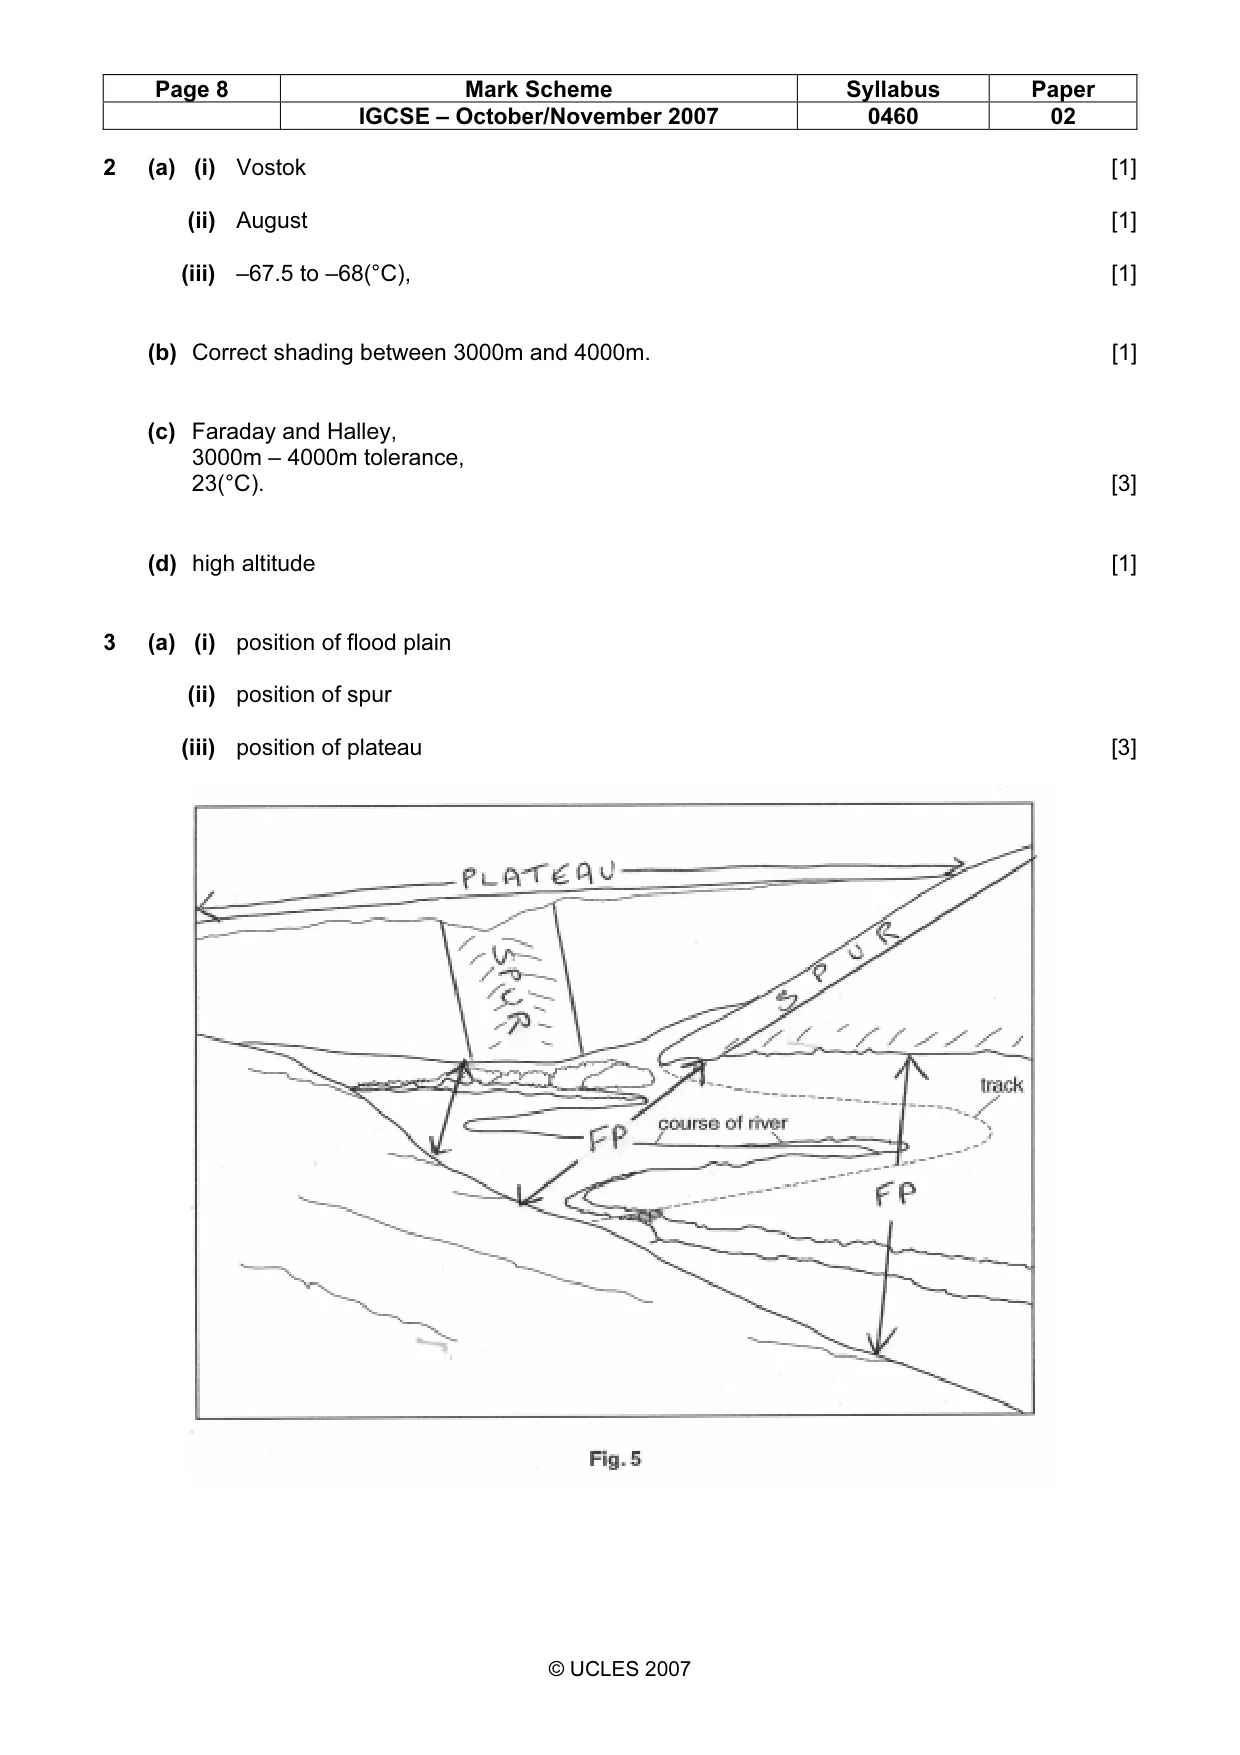
8 0460/02/O/N/07 For Examiner’s Use © UCLES 2007 3 Photograph A (Insert) shows an area in Britain. Fig. 5 shows a student’s field sketch of the same area. (a) On Fig. 5, use labelled arrows to show the positions of: (i) the flood plain; (ii) a spur; (iii) a plateau. [3] course of river track Fig. 5
Question paper, page 9
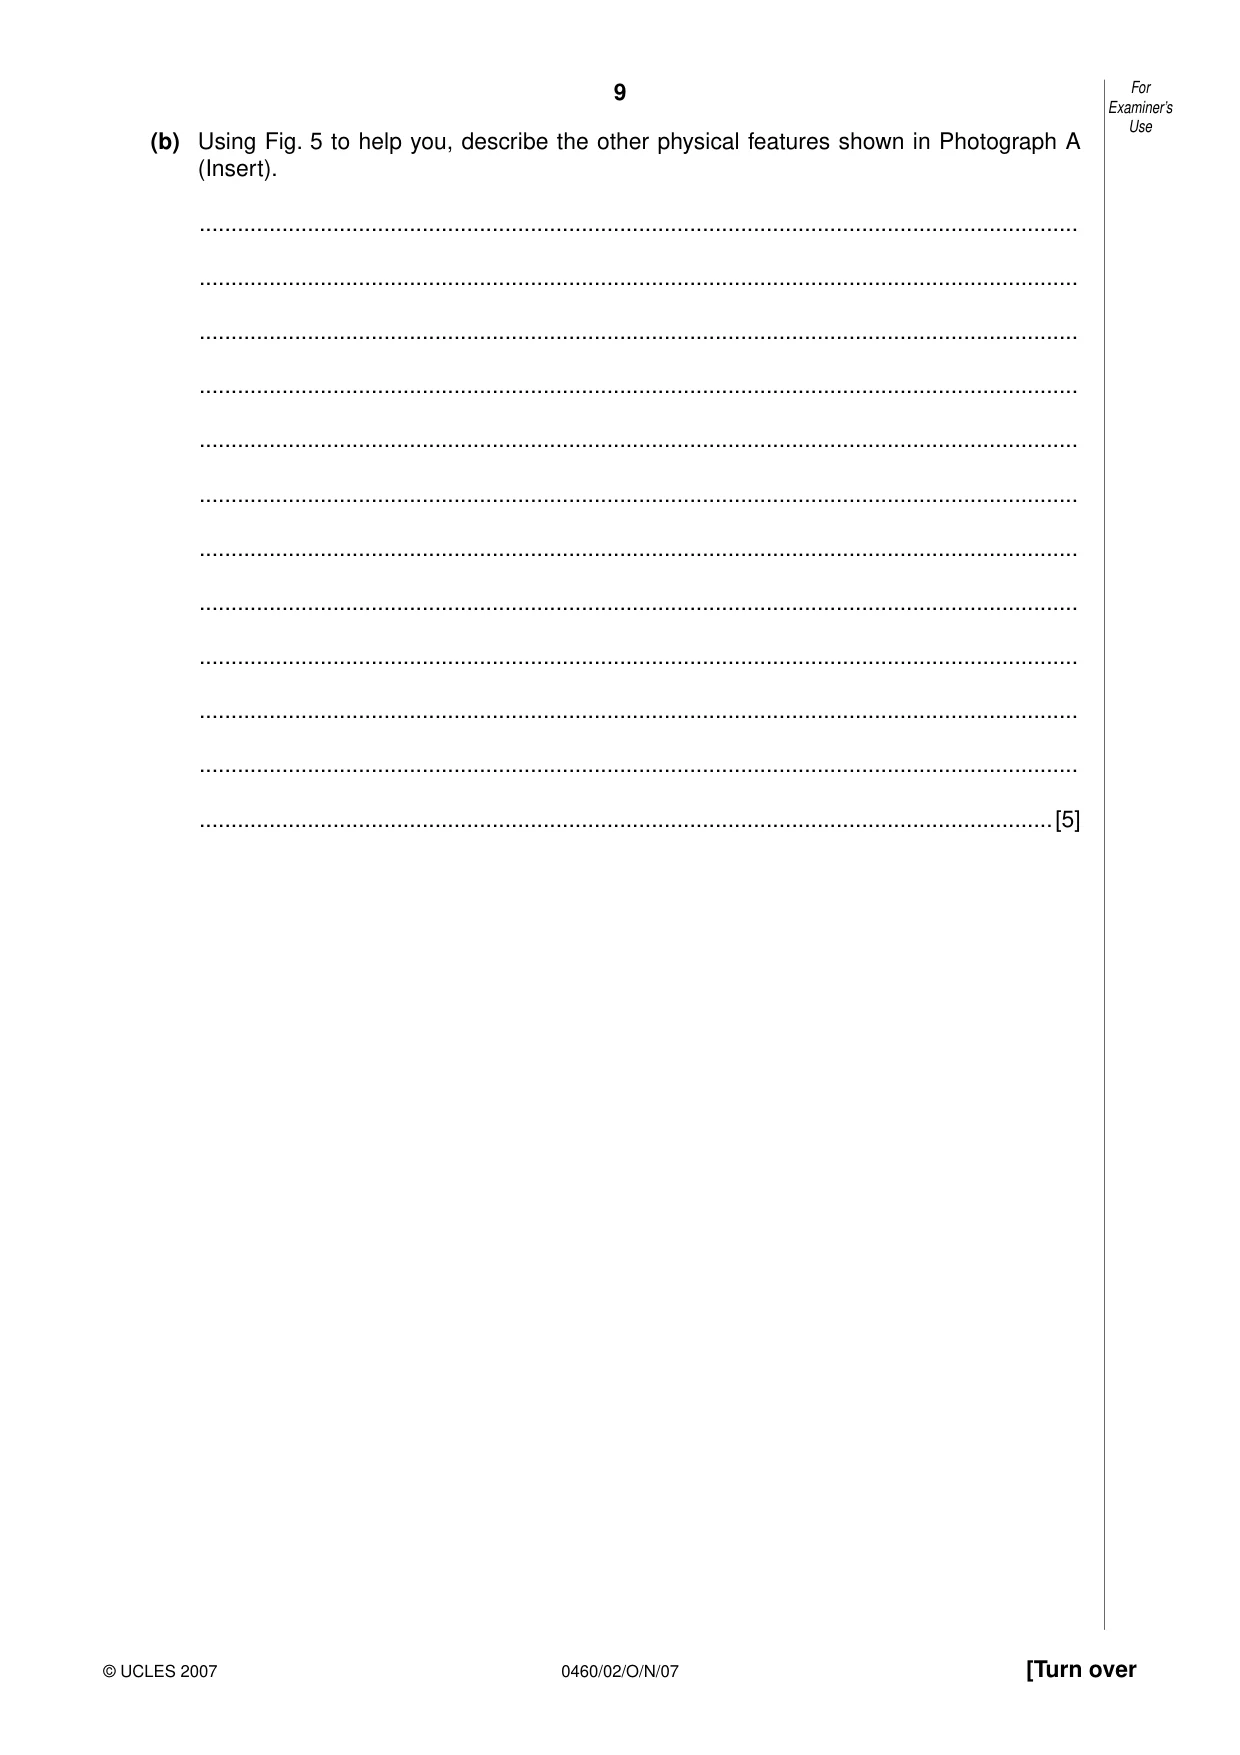
9 0460/02/O/N/07 [Turn over For Examiner’s Use © UCLES 2007 (b) Using Fig. 5 to help you, describe the other physical features shown in Photograph A (Insert). … … … … … … … … … … … …[5]
Question paper, page 10
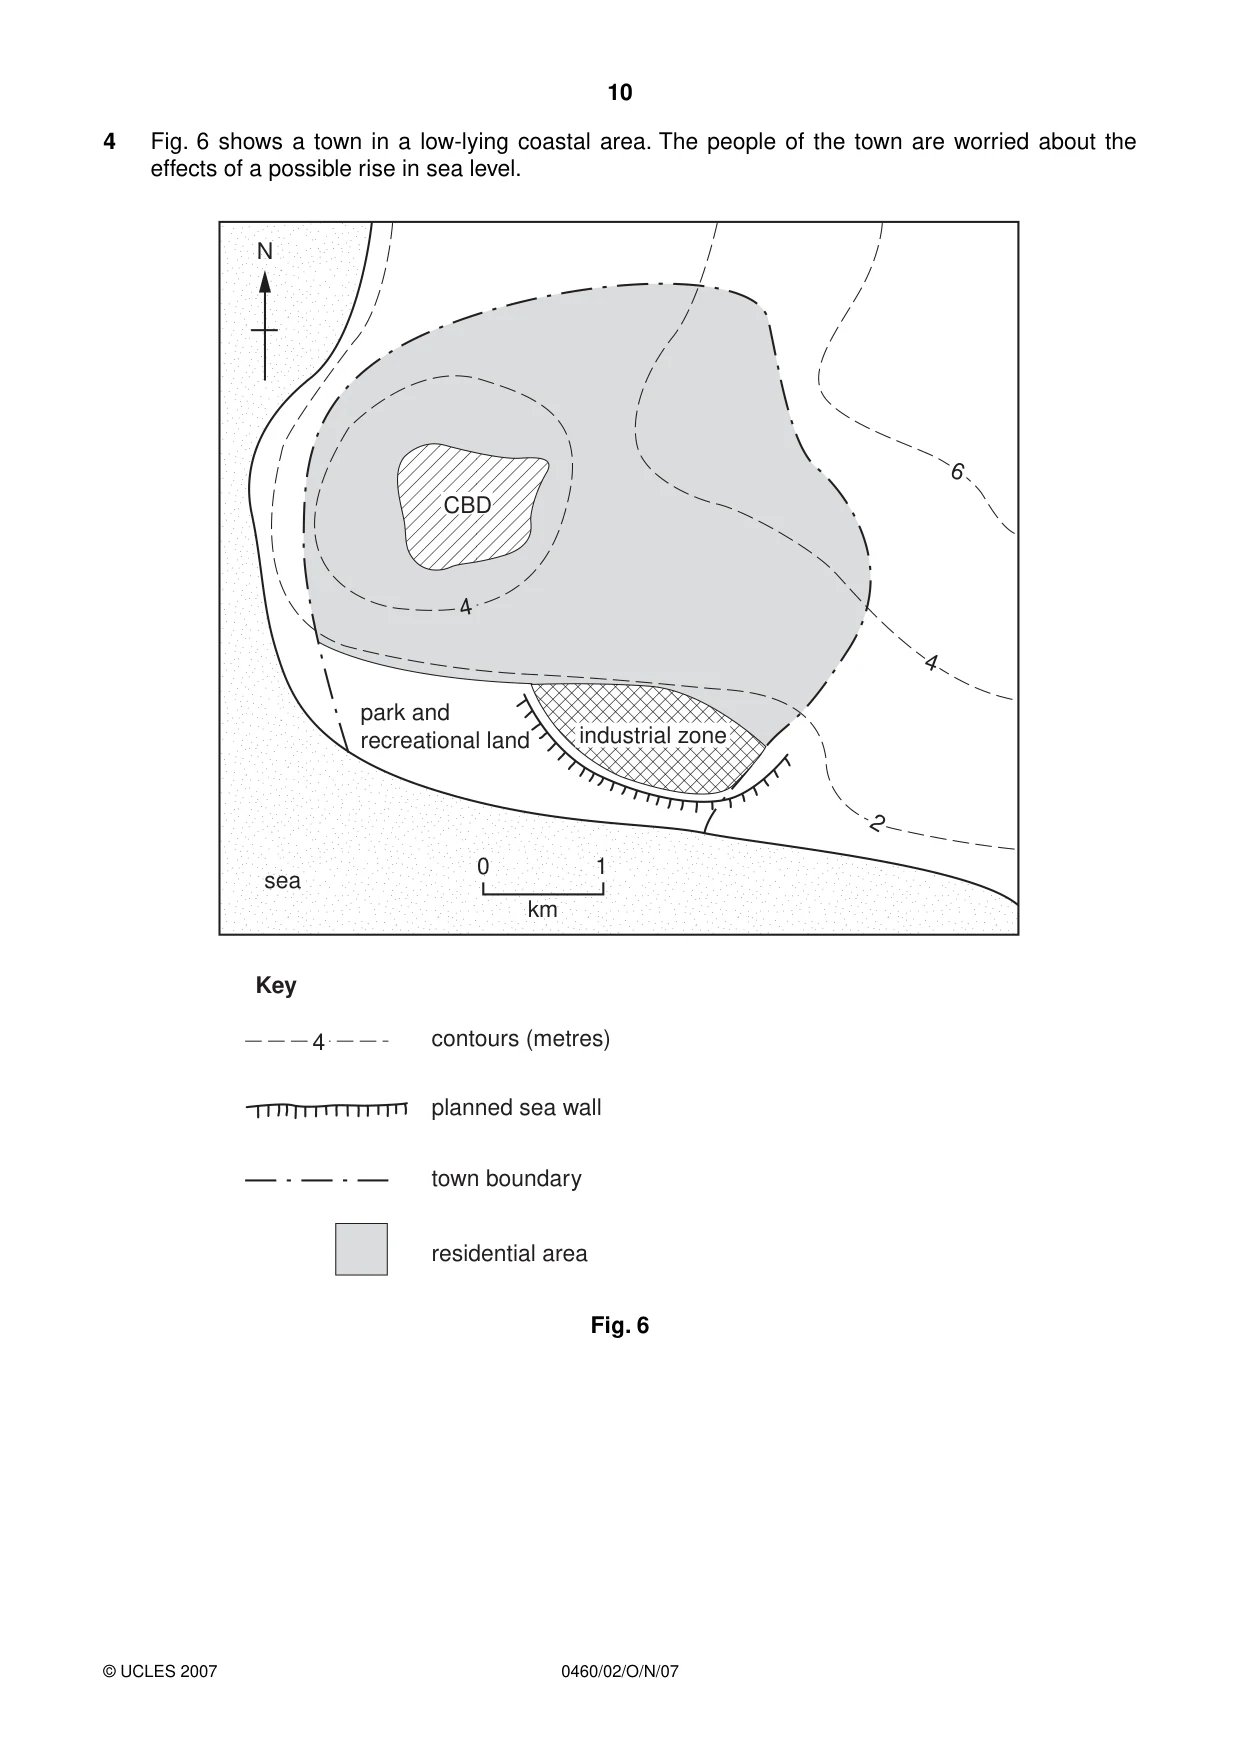
10 0460/02/O/N/07 © UCLES 2007 4 Fig. 6 shows a town in a low-lying coastal area. The people of the town are worried about the effects of a possible rise in sea level. 0 1 km CBD 4 N industrial zone park and recreational land sea 2 4 6 Key contours (metres) town boundary residential area planned sea wall 4 Fig. 6
Question paper, page 11
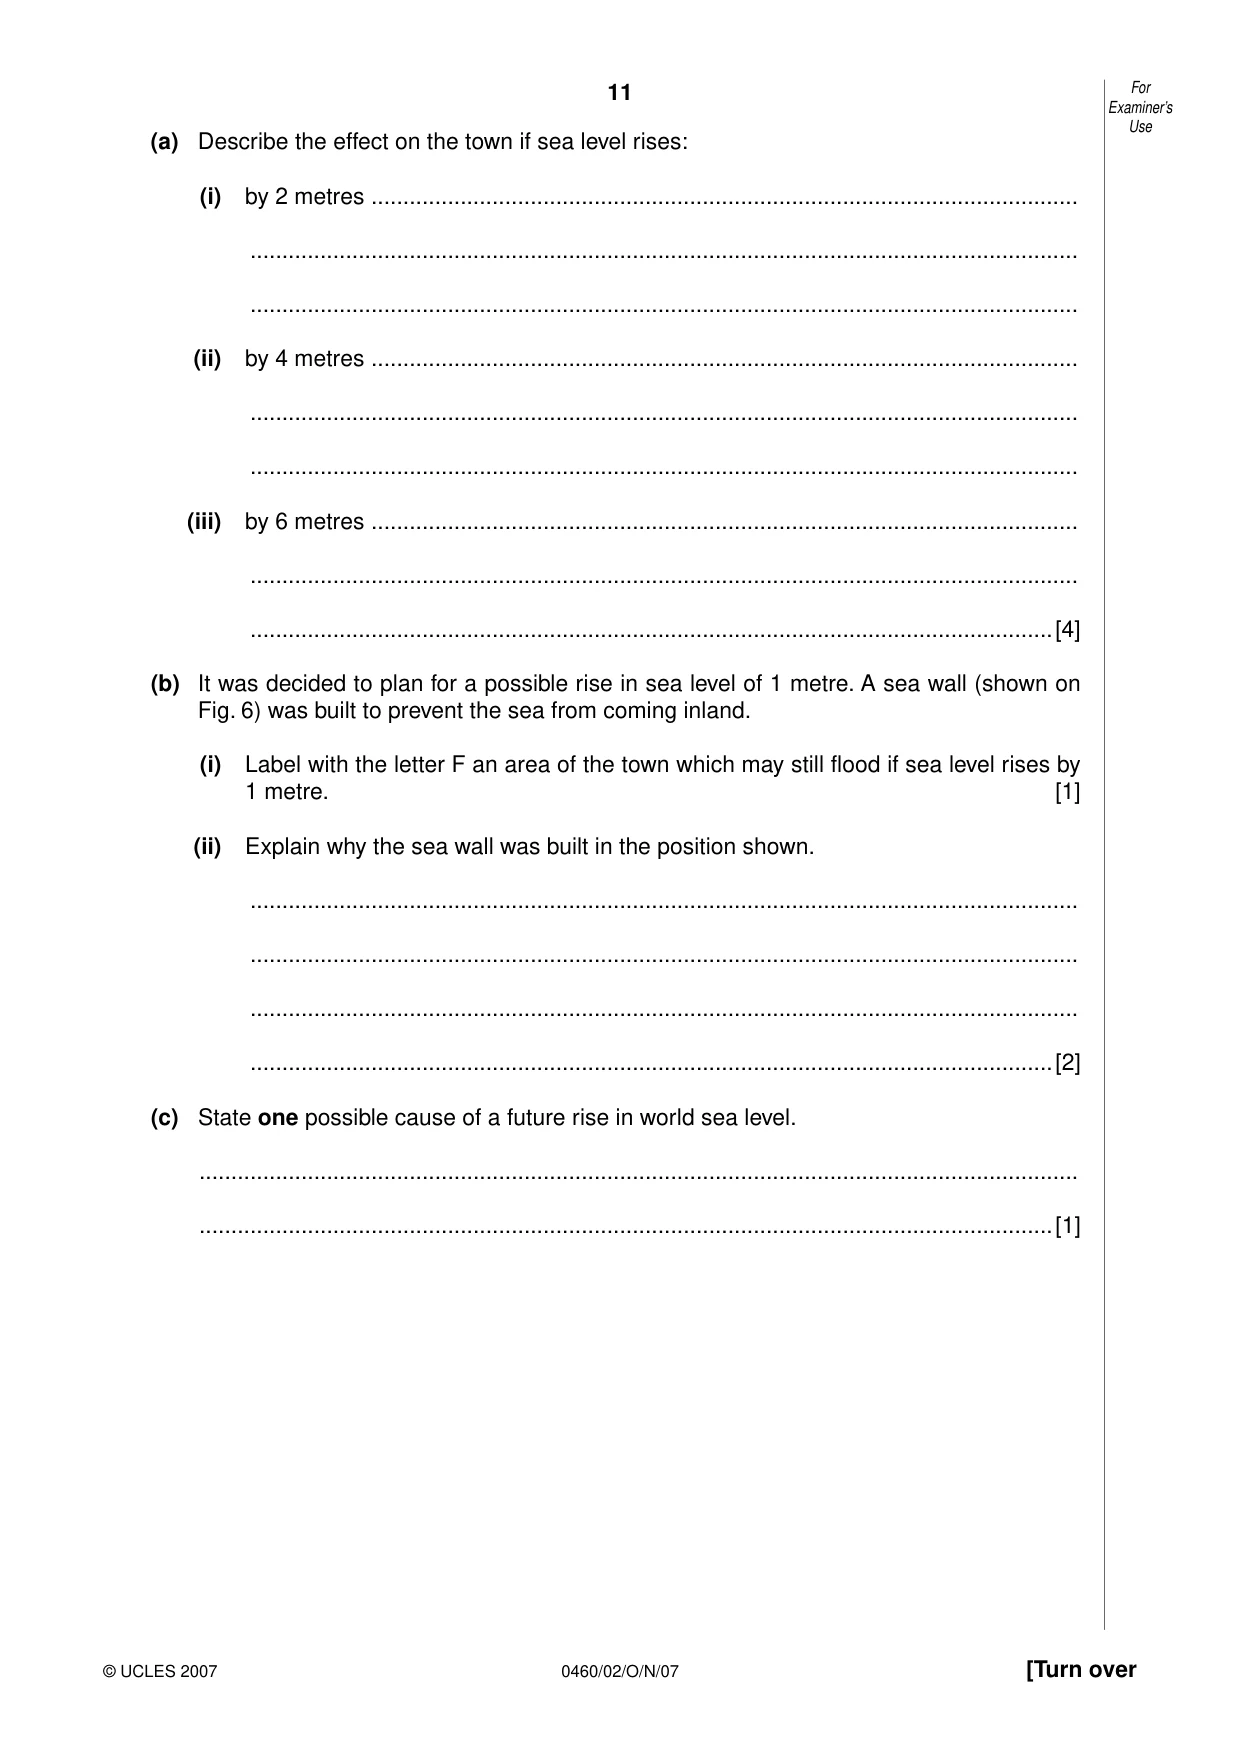
11 0460/02/O/N/07 [Turn over For Examiner’s Use © UCLES 2007 (a) Describe the effect on the town if sea level rises: (i) by 2 metres … … … (ii) by 4 metres … … … (iii) by 6 metres … … …[4] (b) It was decided to plan for a possible rise in sea level of 1 metre. A sea wall (shown on Fig. 6) was built to prevent the sea from coming inland. (i) Label with the letter F an area of the town which may still flood if sea level rises by 1 metre. [1] (ii) Explain why the sea wall was built in the position shown. … … … …[2] (c) State one possible cause of a future rise in world sea level. … …[1]
Question paper, page 12
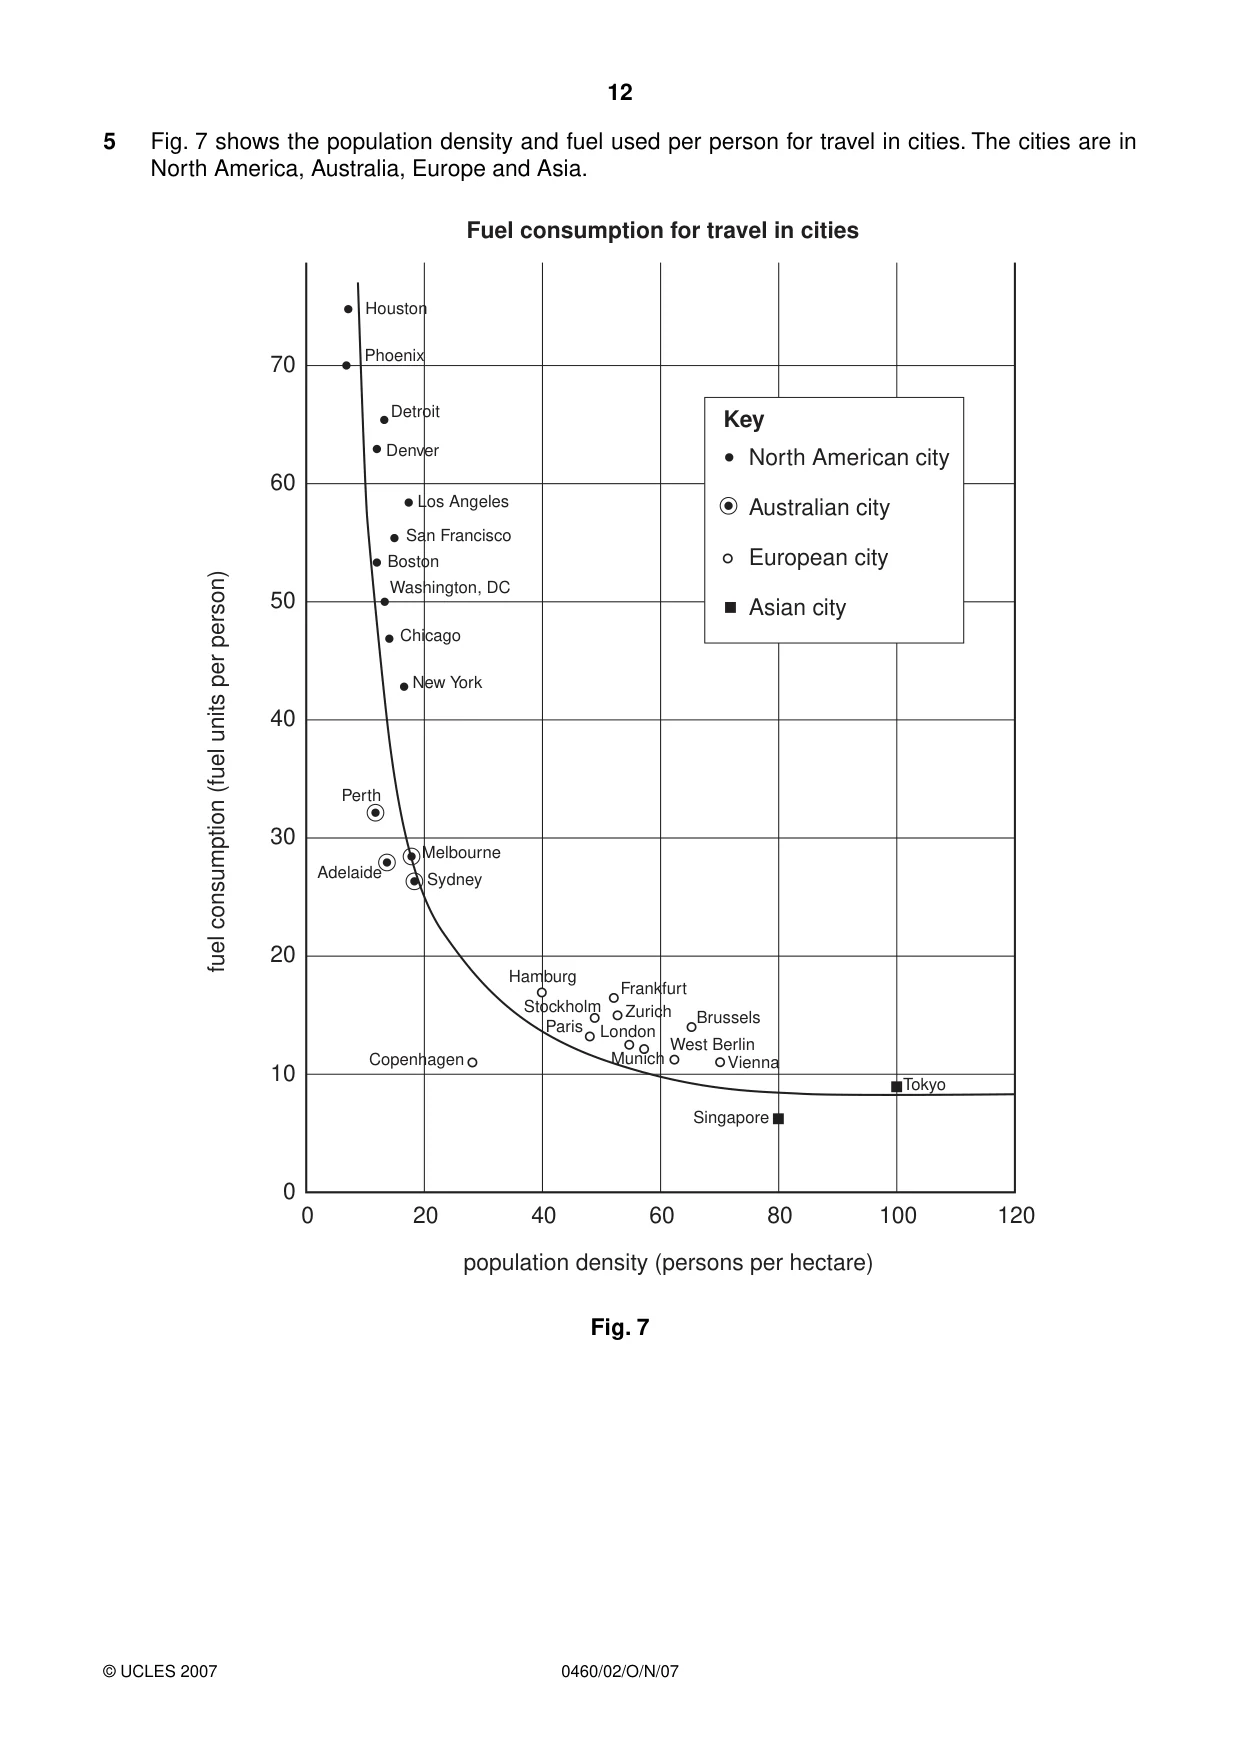
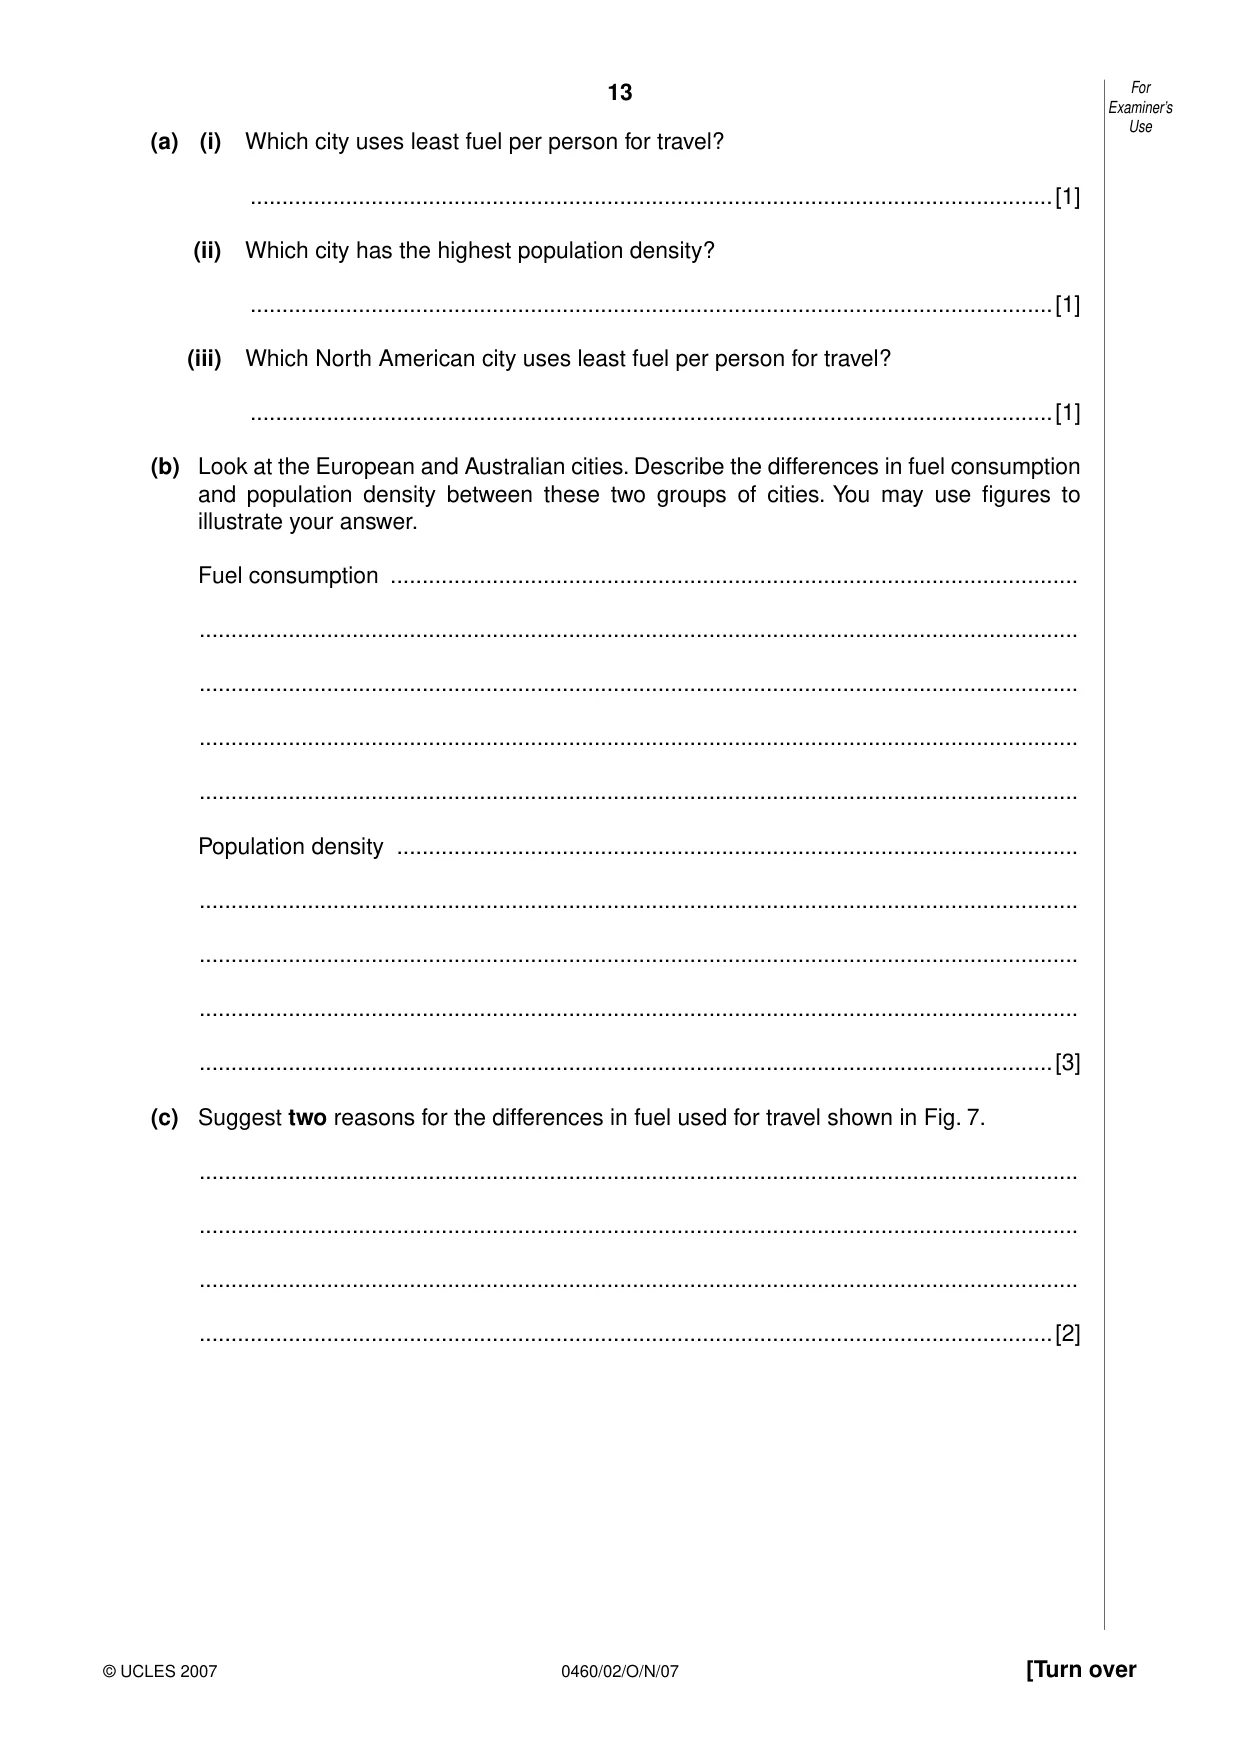
12 0460/02/O/N/07 © UCLES 2007 5 Fig. 7 shows the population density and fuel used per person for travel in cities. The cities are in North America, Australia, Europe and Asia. 0 20 40 60 80 100 120 population density (persons per hectare) 0 10 20 30 40 50 60 70 fuel consumption (fuel units per person) Houston Phoenix Detroit Denver Los Angeles San Francisco Boston Chicago New York Washington, DC Perth Melbourne Sydney Hamburg Stockholm Adelaide Frankfurt Zurich London Paris Copenhagen Brussels West Berlin Vienna Munich Singapore Tokyo North American city Key Fuel consumption for travel in cities Australian city European city Asian city Fig. 7
Question paper, page 13
13 0460/02/O/N/07 [Turn over For Examiner’s Use © UCLES 2007 (a) (i) Which city uses least fuel per person for travel? …[1] (ii) Which city has the highest population density? …[1] (iii) Which North American city uses least fuel per person for travel? …[1] (b) Look at the European and Australian cities. Describe the differences in fuel consumption and population density between these two groups of cities. You may use figures to illustrate your answer. Fuel consumption … … … … … Population density … … … … …[3] (c) Suggest two reasons for the differences in fuel used for travel shown in Fig. 7. … … … …[2]
Question paper, page 14
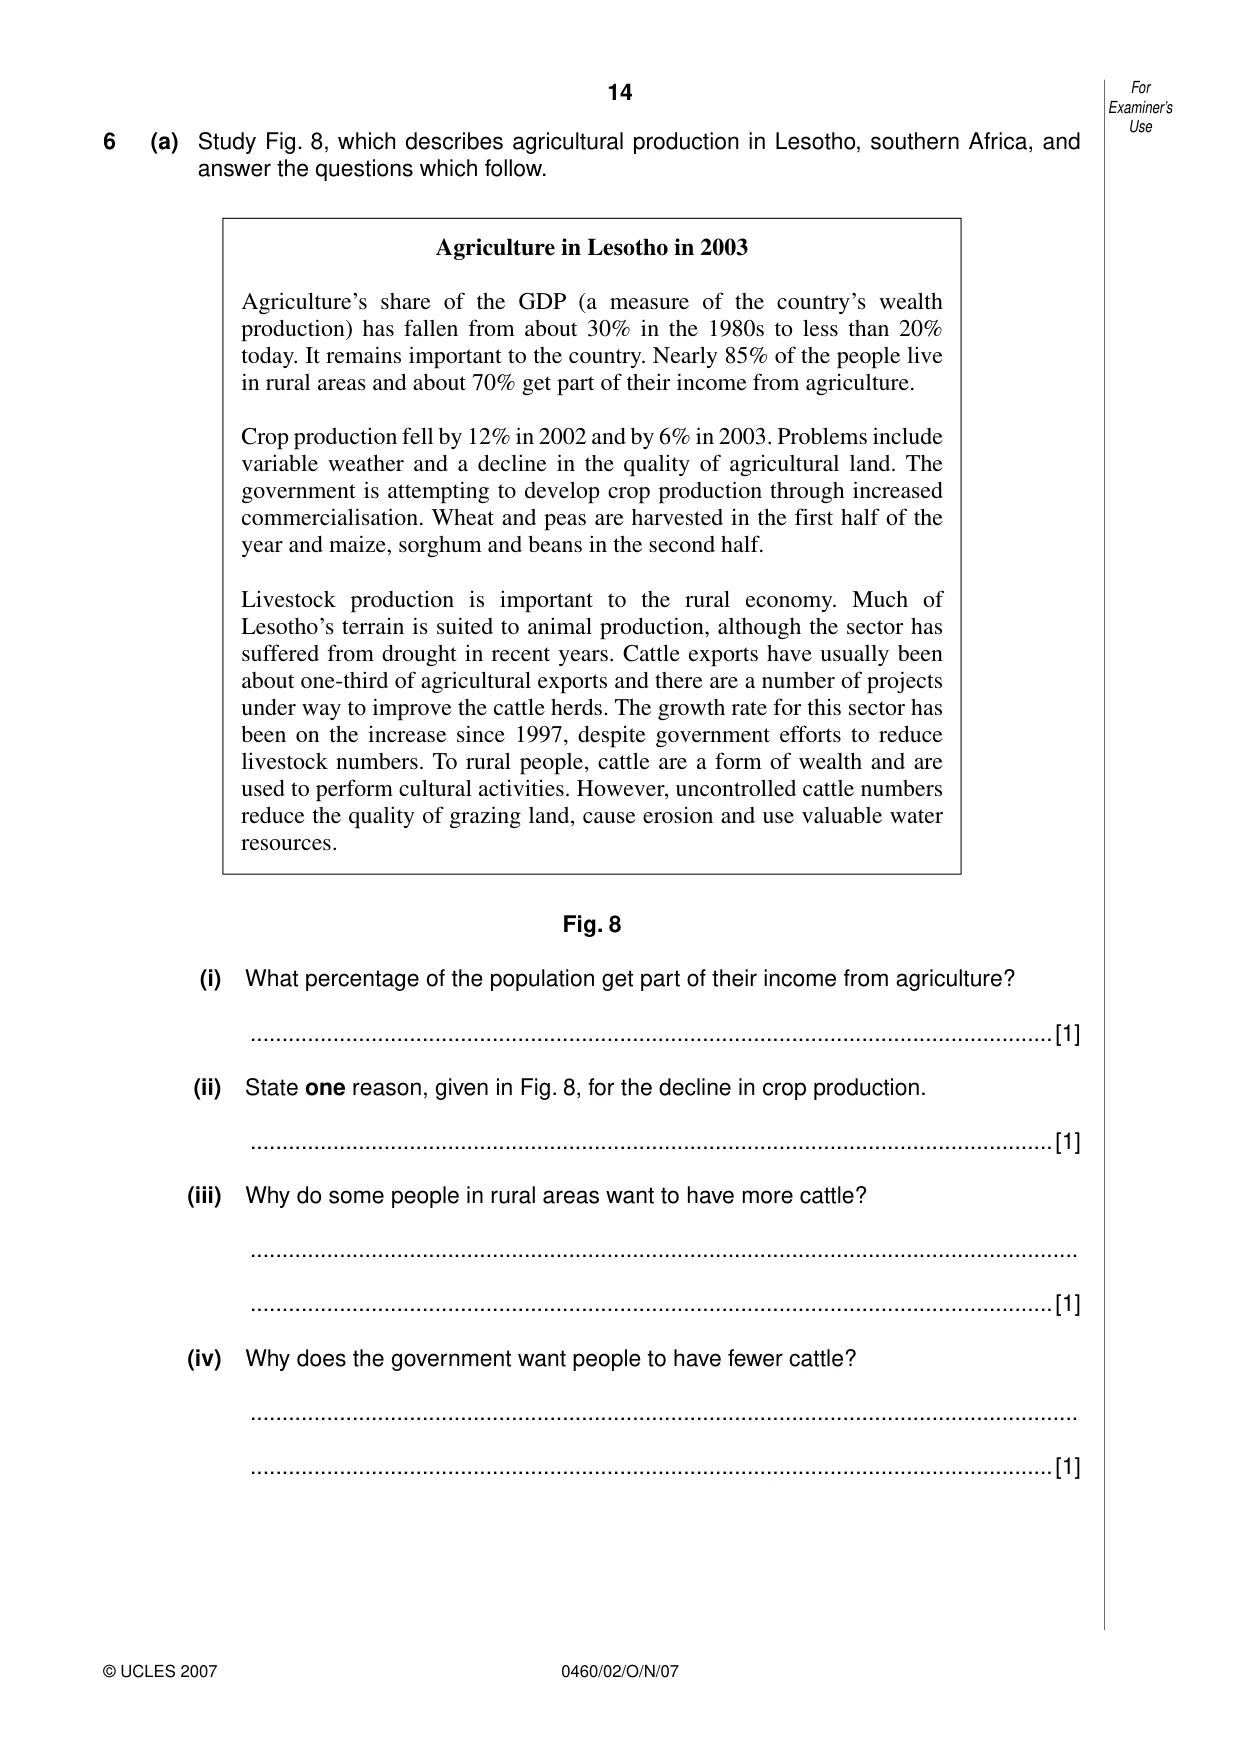
14 0460/02/O/N/07 For Examiner’s Use © UCLES 2007 6 (a) Study Fig. 8, which describes agricultural production in Lesotho, southern Africa, and answer the questions which follow. Agriculture in Lesotho in 2003 Agricultureʼs share of the GDP (a measure of the countryʼs wealth production) has fallen from about 30% in the 1980s to less than 20% today. It remains important to the country. Nearly 85% of the people live in rural areas and about 70% get part of their income from agriculture. Crop production fell by 12% in 2002 and by 6% in 2003. Problems include variable weather and a decline in the quality of agricultural land. The government is attempting to develop crop production through increased commercialisation. Wheat and peas are harvested in the first half of the year and maize, sorghum and beans in the second half. Livestock production is important to the rural economy. Much of Lesothoʼs terrain is suited to animal production, although the sector has suffered from drought in recent years. Cattle exports have usually been about one-third of agricultural exports and there are a number of projects under way to improve the cattle herds. The growth rate for this sector has been on the increase since 1997, despite government efforts to reduce livestock numbers. To rural people, cattle are a form of wealth and are used to perform cultural activities. However, uncontrolled cattle numbers reduce the quality of grazing land, cause erosion and use valuable water resources. Fig. 8 (i) What percentage of the population get part of their income from agriculture? …[1] (ii) State one reason, given in Fig. 8, for the decline in crop production. …[1] (iii) Why do some people in rural areas want to have more cattle? … …[1] (iv) Why does the government want people to have fewer cattle? … …[1]
Question paper, page 15
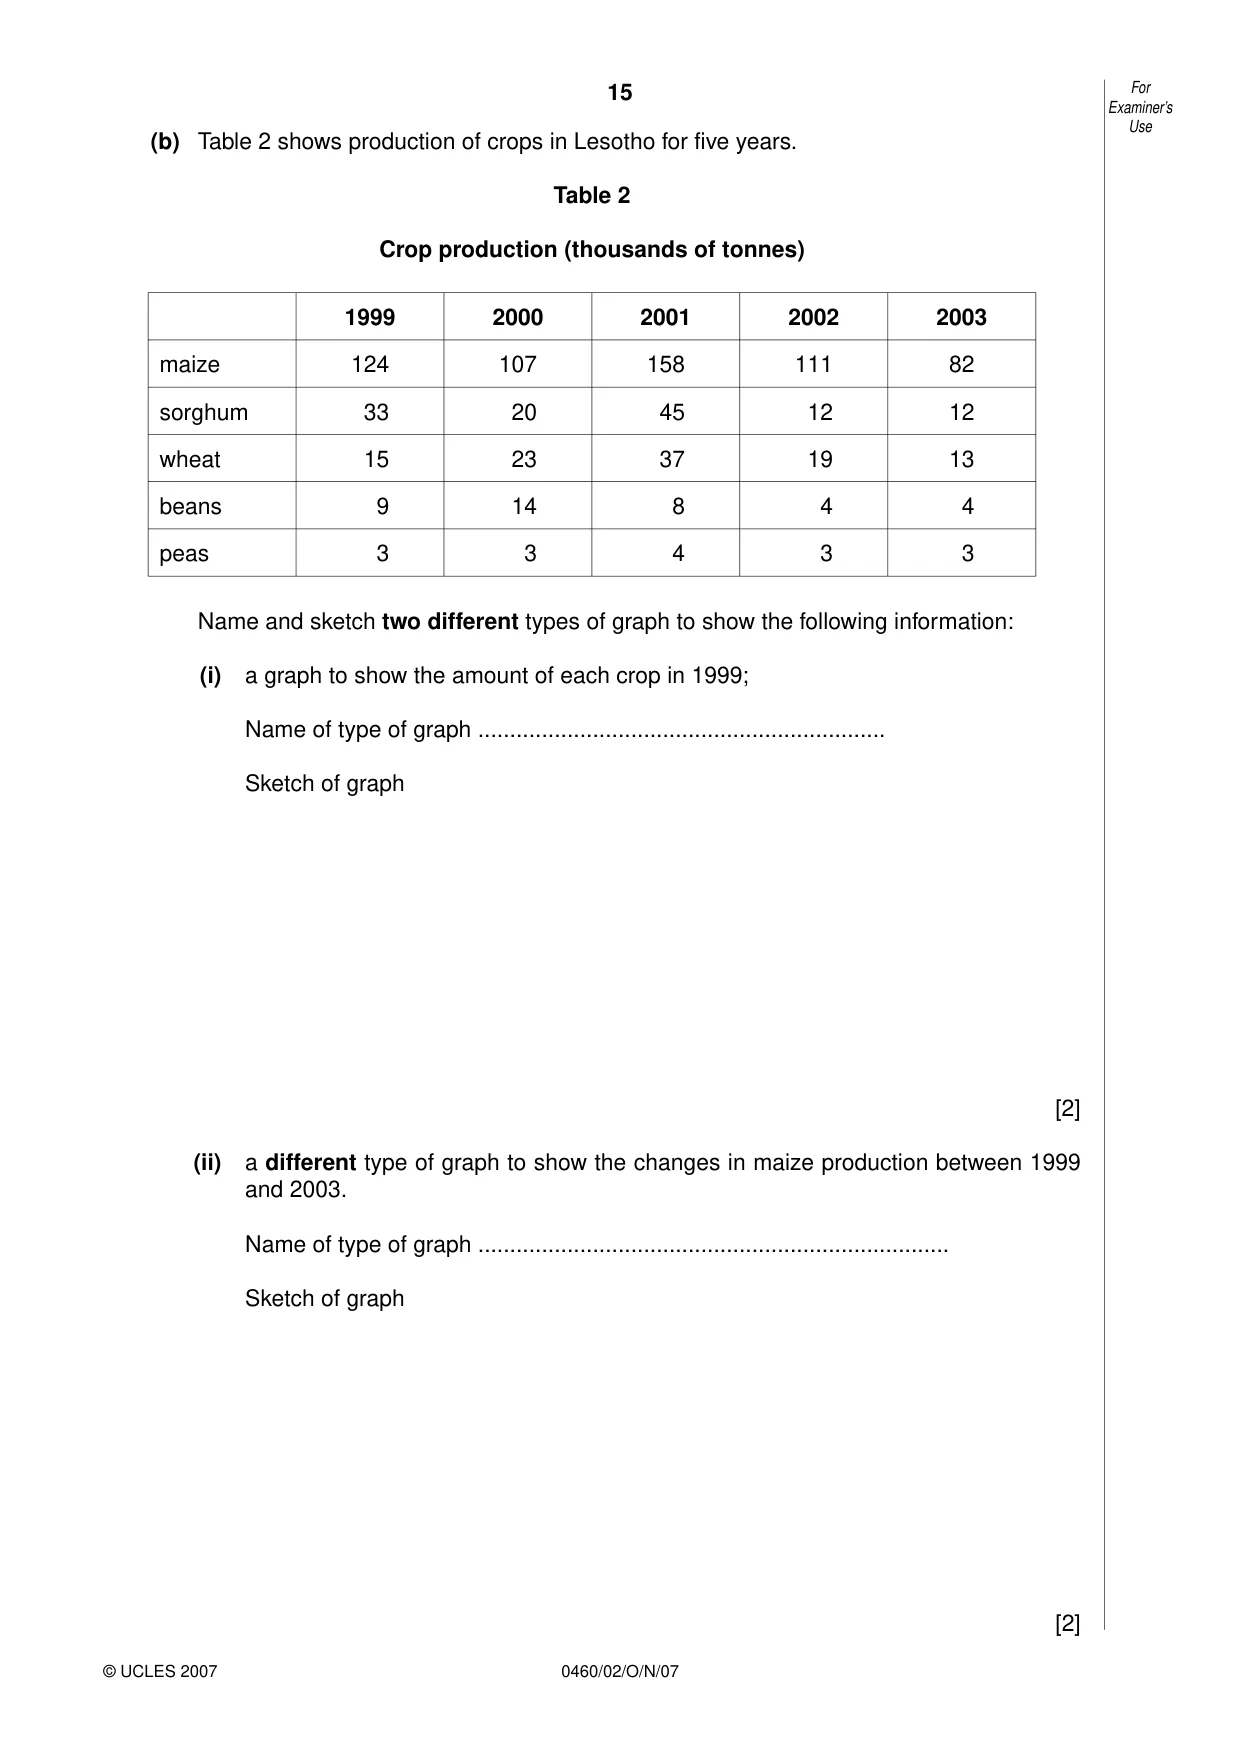
15 0460/02/O/N/07 For Examiner’s Use © UCLES 2007 (b) Table 2 shows production of crops in Lesotho for five years. Table 2 Crop production (thousands of tonnes) 1999 2000 2001 2002 2003 maize 124 107 158 111 82 sorghum 33 20 45 12 12 wheat 15 23 37 19 13 beans 9 14 8 4 4 peas 3 3 4 3 3 Name and sketch two different types of graph to show the following information: (i) a graph to show the amount of each crop in 1999; Name of type of graph … Sketch of graph [2] (ii) a different type of graph to show the changes in maize production between 1999 and 2003. Name of type of graph … Sketch of graph [2]
Question paper, page 16
16 0460/02/O/N/07 © UCLES 2007 BLANK PAGE Copyright Acknowledgements: Question 3 Photograph A David Kelly © UCLES. Question 5 Fig. 7 © Michael Pacione; Urban Geography; Taylor & Francis Books Ltd; 2005. Question 6 Fig. 8 © The Official SADC Trade, Industry and Investment Review published jointly by Southern African Marketing Company (Pty) Ltd and the SADC Secretariat. Permission to reproduce items where third-party owned material protected by copyright is included has been sought and cleared where possible. Every reasonable effort has been made by the publisher (UCLES) to trace copyright holders, but if any items requiring clearance have unwittingly been included, the publisher will be pleased to make amends at the earliest possible opportunity. University of Cambridge International Examinations is part of the Cambridge Assessment Group. Cambridge Assessment is the brand name of University of Cambridge Local Examinations Syndicate (UCLES), which is itself a department of the University of Cambridge.
Mark scheme, page 1
UNIVERSITY OF CAMBRIDGE INTERNATIONAL EXAMINATIONS International General Certificate of Secondary Education MARK SCHEME for the October/November 2007 question paper 0460 GEOGRAPHY 0460/02 Paper 2, maximum raw mark 60 This mark scheme is published as an aid to teachers and candidates, to indicate the requirements of the examination. It shows the basis on which Examiners were instructed to award marks. It does not indicate the details of the discussions that took place at an Examiners’ meeting before marking began. All Examiners are instructed that alternative correct answers and unexpected approaches in candidates’ scripts must be given marks that fairly reflect the relevant knowledge and skills demonstrated. Mark schemes must be read in conjunction with the question papers and the report on the examination. • CIE will not enter into discussions or correspondence in connection with these mark schemes. CIE is publishing the mark schemes for the October/November 2007 question papers for most IGCSE, GCE Advanced Level and Advanced Subsidiary Level syllabuses and some Ordinary Level syllabuses. www.XtremePapers.com
Mark scheme, page 2
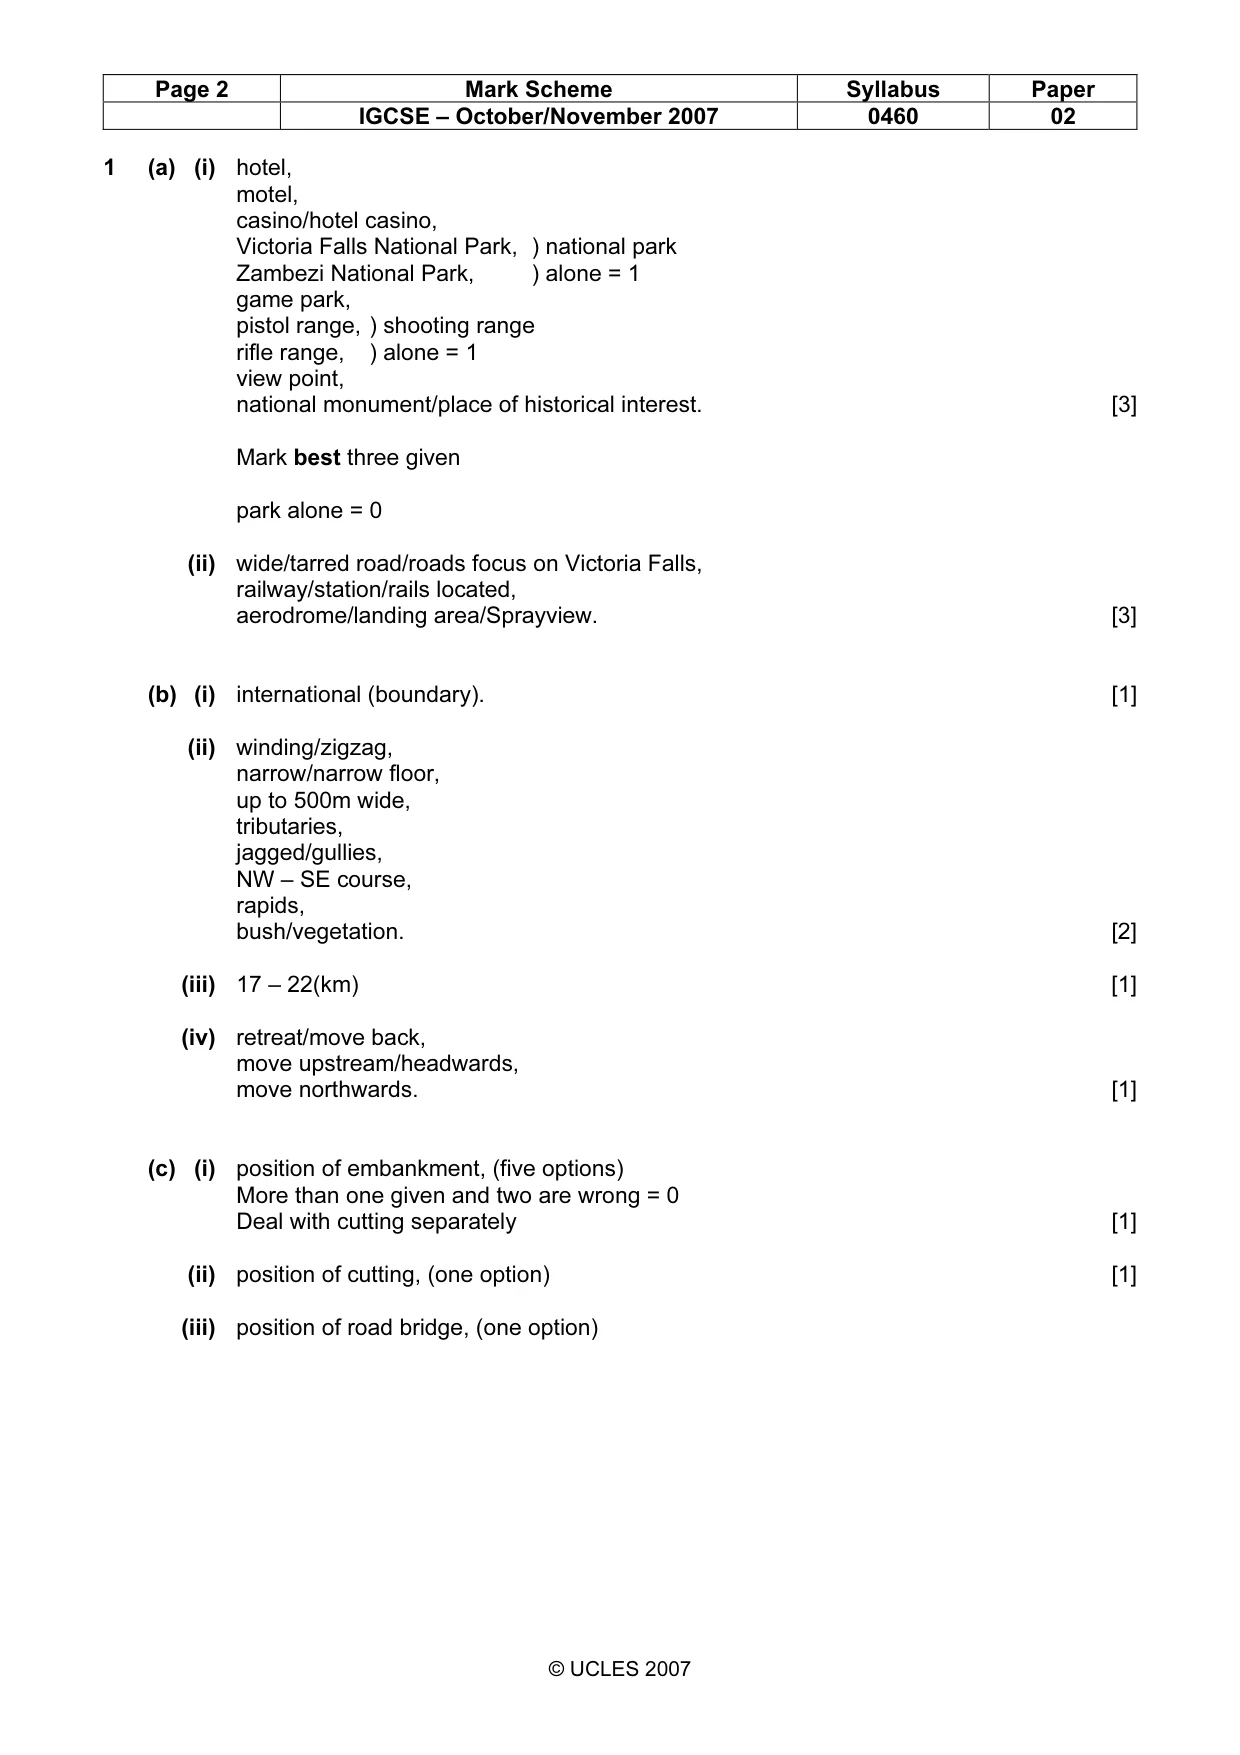
Page 2 Mark Scheme Syllabus Paper IGCSE – October/November 2007 0460 02 © UCLES 2007 1 (a) (i) hotel, motel, casino/hotel casino, Victoria Falls National Park, ) national park Zambezi National Park, ) alone = 1 game park, pistol range, ) shooting range rifle range, ) alone = 1 view point, national monument/place of historical interest. [3] Mark best three given park alone = 0 (ii) wide/tarred road/roads focus on Victoria Falls, railway/station/rails located, aerodrome/landing area/Sprayview. [3] (b) (i) international (boundary). [1] (ii) winding/zigzag, narrow/narrow floor, up to 500m wide, tributaries, jagged/gullies, NW – SE course, rapids, bush/vegetation. [2] (iii) 17 – 22(km) [1] (iv) retreat/move back, move upstream/headwards, move northwards. [1] (c) (i) position of embankment, (five options) More than one given and two are wrong = 0 Deal with cutting separately [1] (ii) position of cutting, (one option) [1] (iii) position of road bridge, (one option)
Mark scheme, page 3
Page 3 Mark Scheme Syllabus Paper IGCSE – October/November 2007 0460 02 © UCLES 2007 Whole extent of feature not needed. 1
Mark scheme, page 4
Page 4 Mark Scheme Syllabus Paper IGCSE – October/November 2007 0460 02 © UCLES 2007 (d) (i) B correct, P correct, S correct, D correct. More than one given and one is wrong = 0 [4] (ii) Arrow pointing east. 1
Mark scheme, page 5
Page 5 Mark Scheme Syllabus Paper IGCSE – October/November 2007 0460 02 © UCLES 2007
Mark scheme, page 6
Page 6 Mark Scheme Syllabus Paper IGCSE – October/November 2007 0460 02 © UCLES 2007
Mark scheme, page 7
Page 7 Mark Scheme Syllabus Paper IGCSE – October/November 2007 0460 02 © UCLES 2007 (e) 786184 [1]
Mark scheme, page 8
Page 8 Mark Scheme Syllabus Paper IGCSE – October/November 2007 0460 02 © UCLES 2007 2 (a) (i) Vostok [1] (ii) August [1] (iii) –67.5 to –68(°C), [1] (b) Correct shading between 3000m and 4000m. [1] (c) Faraday and Halley, 3000m – 4000m tolerance, 23(°C). [3] (d) high altitude [1] 3 (a) (i) position of flood plain (ii) position of spur (iii) position of plateau [3]
Mark scheme, page 9
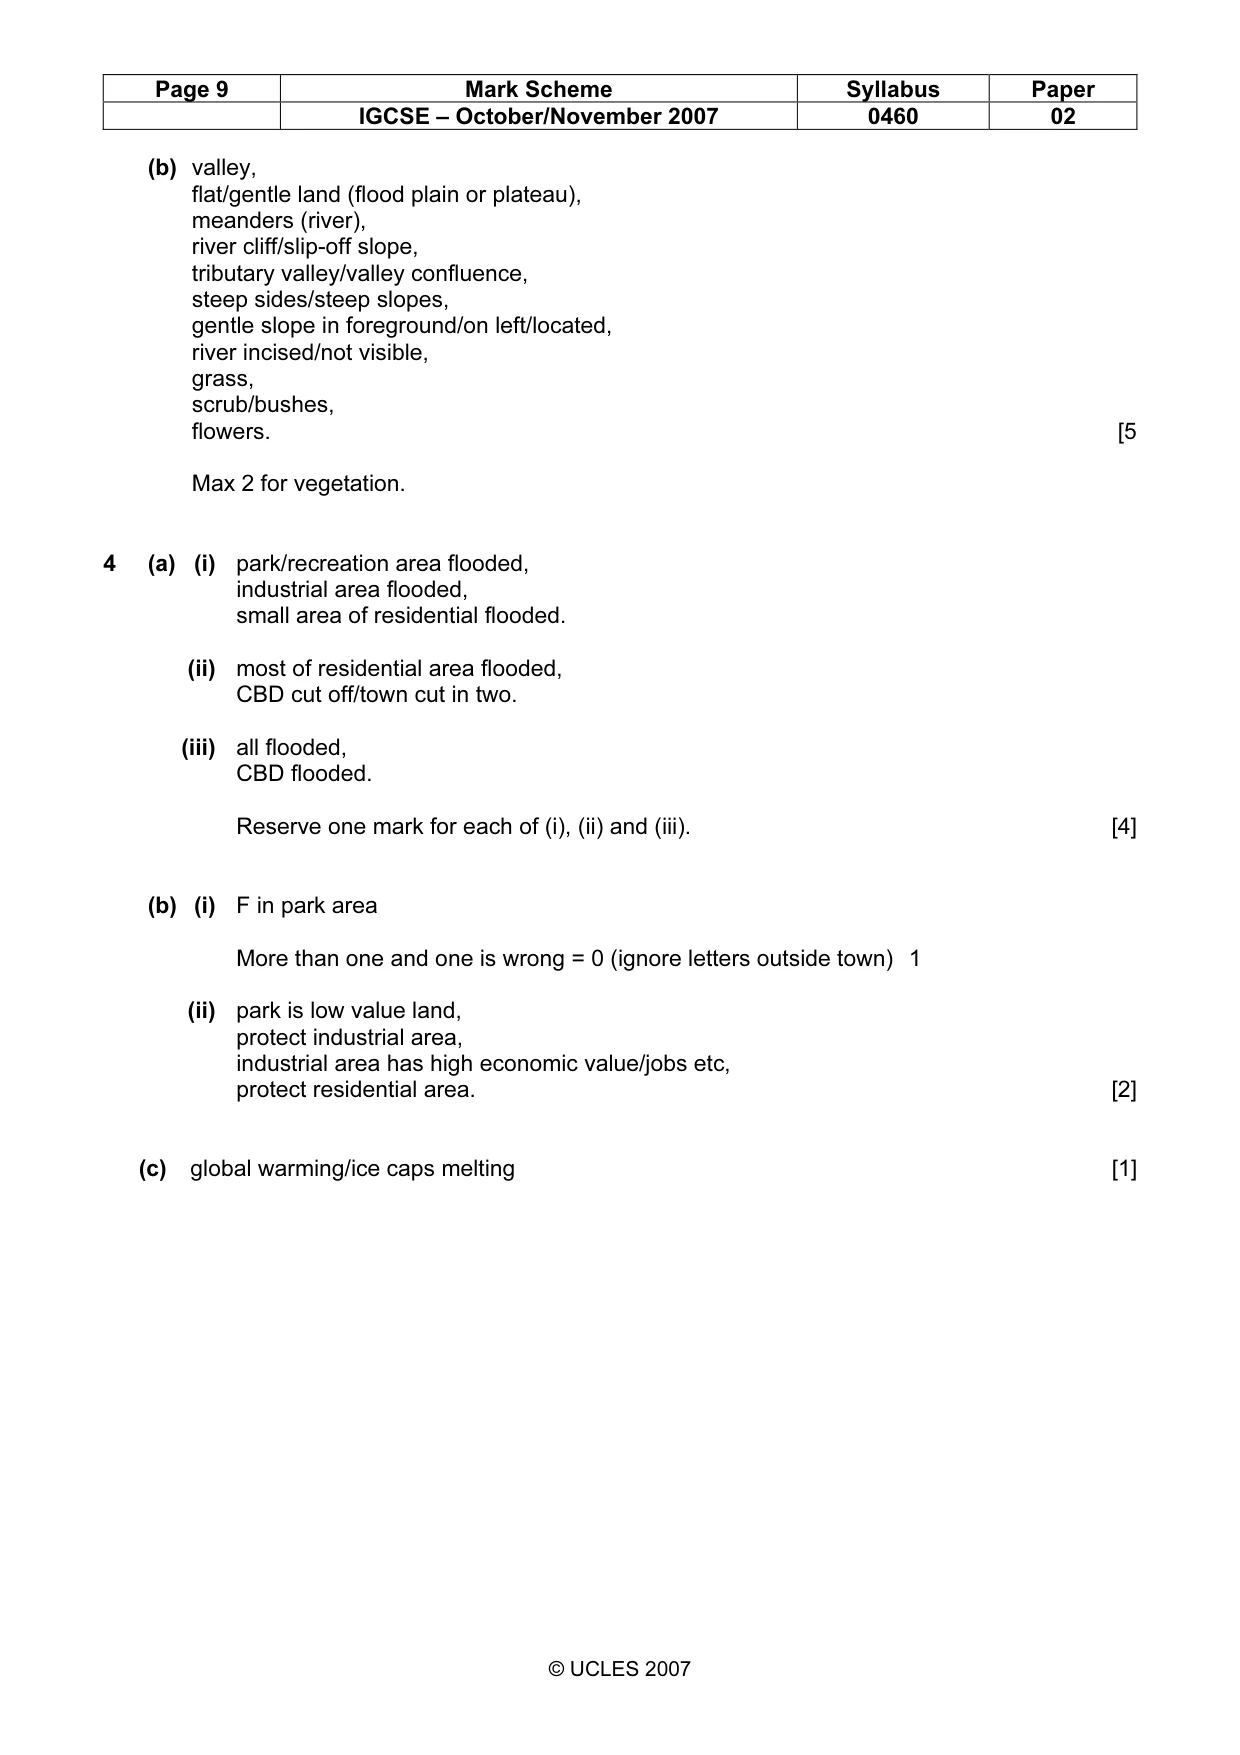
Page 9 Mark Scheme Syllabus Paper IGCSE – October/November 2007 0460 02 © UCLES 2007 (b) valley, flat/gentle land (flood plain or plateau), meanders (river), river cliff/slip-off slope, tributary valley/valley confluence, steep sides/steep slopes, gentle slope in foreground/on left/located, river incised/not visible, grass, scrub/bushes, flowers. [5 Max 2 for vegetation. 4 (a) (i) park/recreation area flooded, industrial area flooded, small area of residential flooded. (ii) most of residential area flooded, CBD cut off/town cut in two. (iii) all flooded, CBD flooded. Reserve one mark for each of (i), (ii) and (iii). [4] (b) (i) F in park area More than one and one is wrong = 0 (ignore letters outside town) 1 (ii) park is low value land, protect industrial area, industrial area has high economic value/jobs etc, protect residential area. [2] (c) global warming/ice caps melting [1]
Mark scheme, page 10
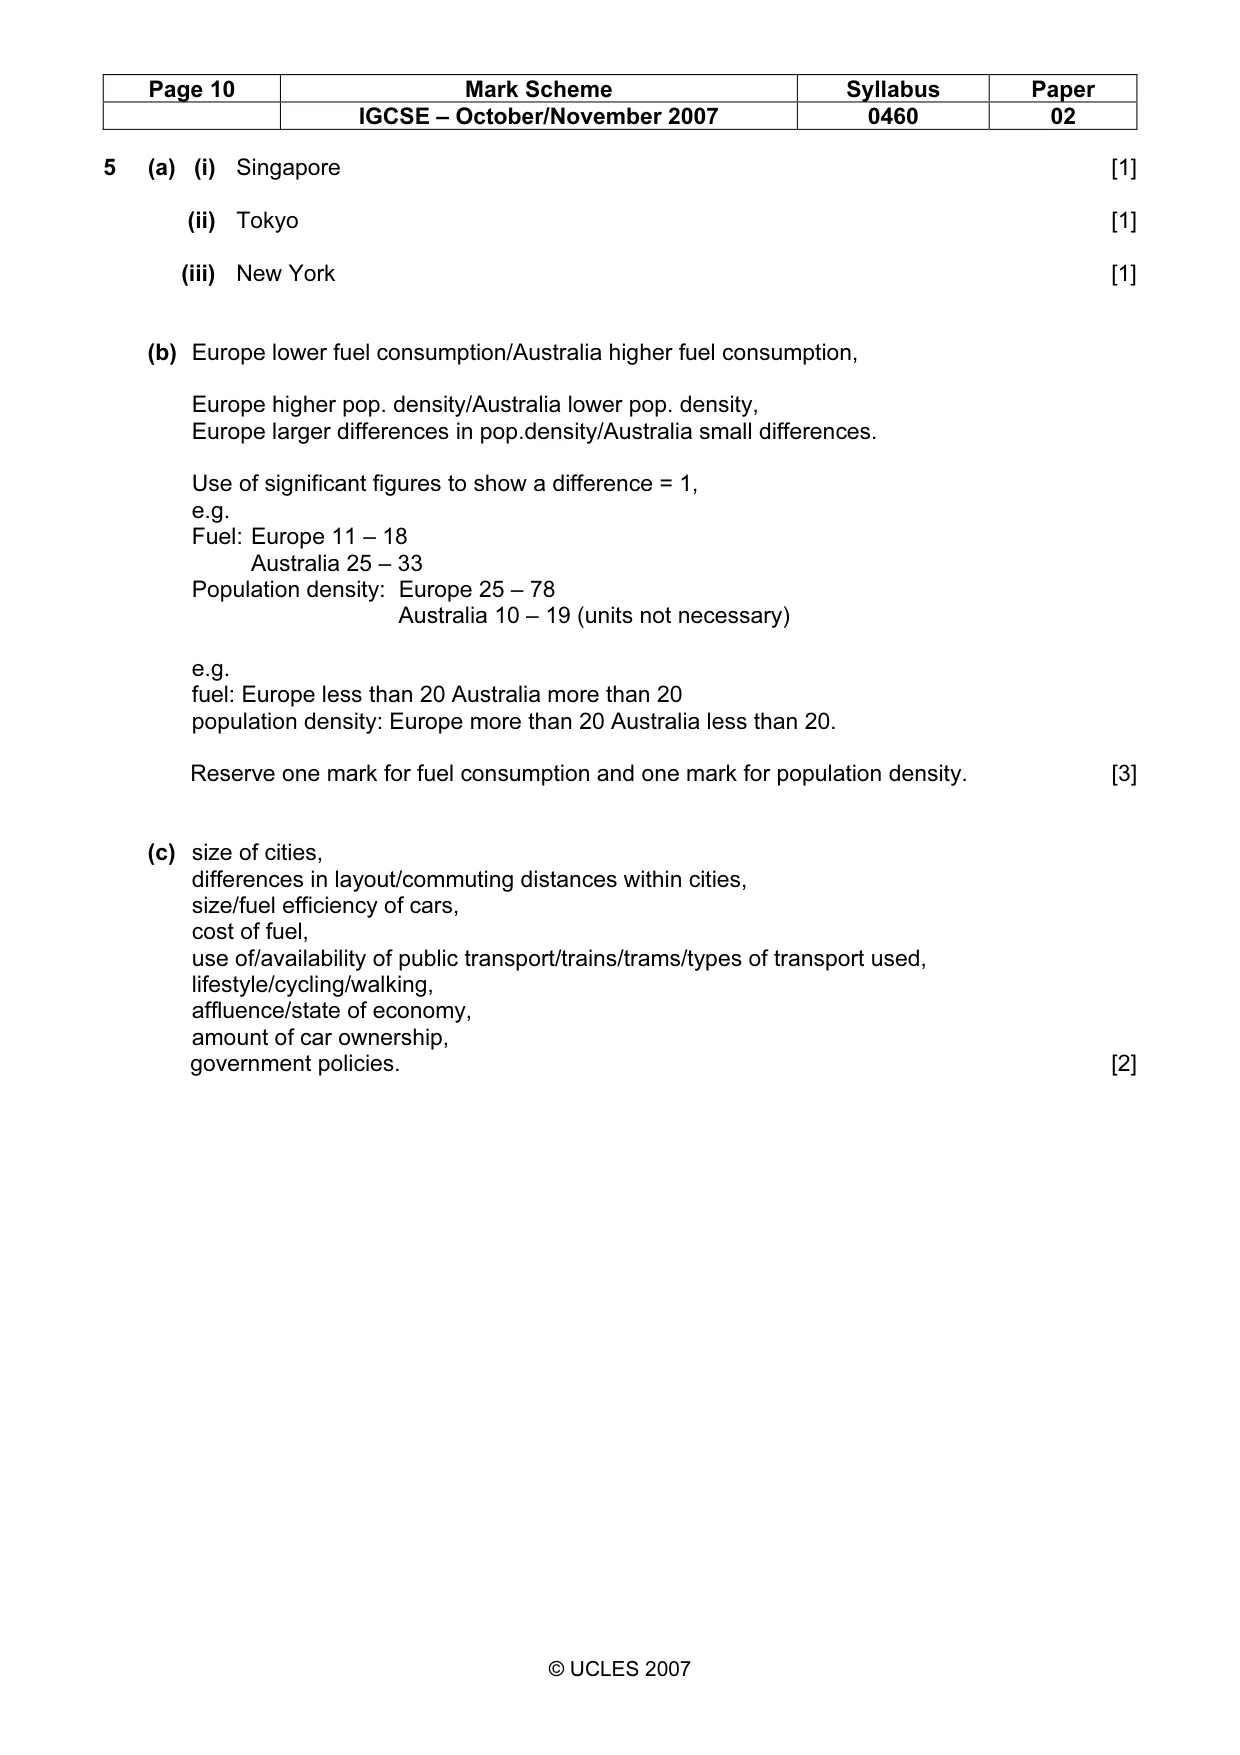
Page 10 Mark Scheme Syllabus Paper IGCSE – October/November 2007 0460 02 © UCLES 2007 5 (a) (i) Singapore [1] (ii) Tokyo [1] (iii) New York [1] (b) Europe lower fuel consumption/Australia higher fuel consumption, Europe higher pop. density/Australia lower pop. density, Europe larger differences in pop.density/Australia small differences. Use of significant figures to show a difference = 1, e.g. Fuel: Europe 11 – 18 Australia 25 – 33 Population density: Europe 25 – 78 Australia 10 – 19 (units not necessary) e.g. fuel: Europe less than 20 Australia more than 20 population density: Europe more than 20 Australia less than 20. Reserve one mark for fuel consumption and one mark for population density. [3] (c) size of cities, differences in layout/commuting distances within cities, size/fuel efficiency of cars, cost of fuel, use of/availability of public transport/trains/trams/types of transport used, lifestyle/cycling/walking, affluence/state of economy, amount of car ownership, government policies. [2]
Mark scheme, page 11
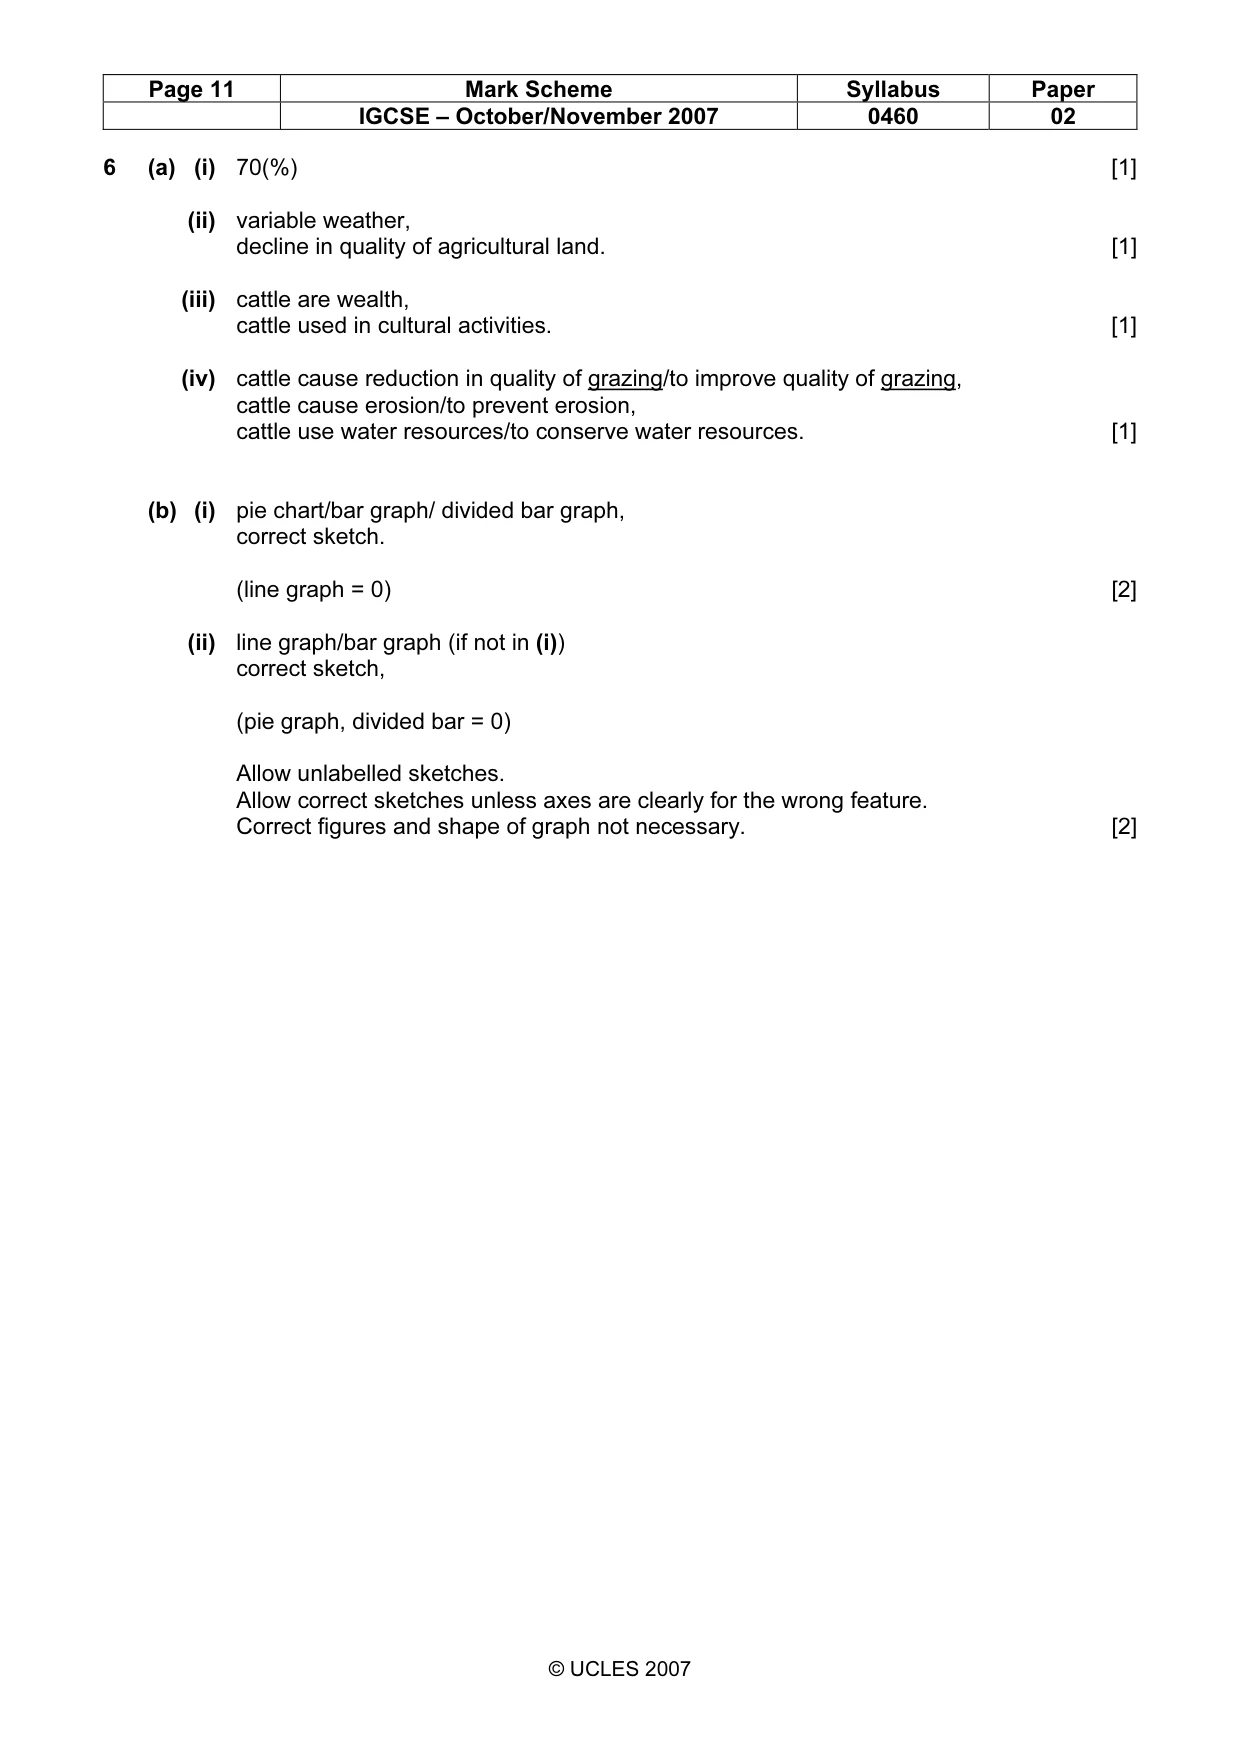
Page 11 Mark Scheme Syllabus Paper IGCSE – October/November 2007 0460 02 © UCLES 2007 6 (a) (i) 70(%) [1] (ii) variable weather, decline in quality of agricultural land. [1] (iii) cattle are wealth, cattle used in cultural activities. [1] (iv) cattle cause reduction in quality of grazing/to improve quality of grazing, cattle cause erosion/to prevent erosion, cattle use water resources/to conserve water resources. [1] (b) (i) pie chart/bar graph/ divided bar graph, correct sketch. (line graph = 0) [2] (ii) line graph/bar graph (if not in (i)) correct sketch, (pie graph, divided bar = 0) Allow unlabelled sketches. Allow correct sketches unless axes are clearly for the wrong feature. Correct figures and shape of graph not necessary. [2]
What you needed in this session
Cambridge’s own grade thresholds for 2007 Oct/Nov, Paper 2 · Variant 1. A higher threshold means an easier paper — the bar moves with how the cohort did.