Cambridge IGCSE Geography 0460 — 2007 May/June Paper 4 · Variant 1
0460/41/M/J/07 · 60 marks · ≈68 min
The question paper and its mark scheme, free to read here and free to download. This is Cambridge’s own paper, exactly as it was sat.
Question paper16 pages


Mark scheme
No mark scheme is in the library for this paper.
Paper as text
Question paper, page 1
This document consists of 14 printed pages and 2 blank pages and 1 Insert. SPA (SC/CGW) T27137/7 © UCLES 2007 [Turn over UNIVERSITY OF CAMBRIDGE INTERNATIONAL EXAMINATIONS International General Certificate of Secondary Education READ THESE INSTRUCTIONS FIRST Write your Centre number, candidate number and name on all the work you hand in. Write in dark blue or black pen. You may use a soft pencil for any diagrams, graphs or rough working. Do not use staples, paper clips, highlighters, glue or correction fluid. DO NOT WRITE ON ANY BARCODES. Answer all questions. The Insert contains Fig. 4 for Question 2. Sketch maps and diagrams should be drawn whenever they serve to illustrate an answer. At the end of the examination, fasten all your work securely together. The number of marks is given in brackets [ ] at the end of each question or part question. * 7 9 8 3 6 7 3 3 9 3 * GEOGRAPHY 0460/04 Paper 4 Alternative to Coursework May/June 2007 1 hour 30 minutes Candidates answer on the Question Paper. Additional Materials: Ruler Protractor Calculator For Examiner’s Use Q1 Q2 Total www.XtremePapers.com
Question paper, page 2
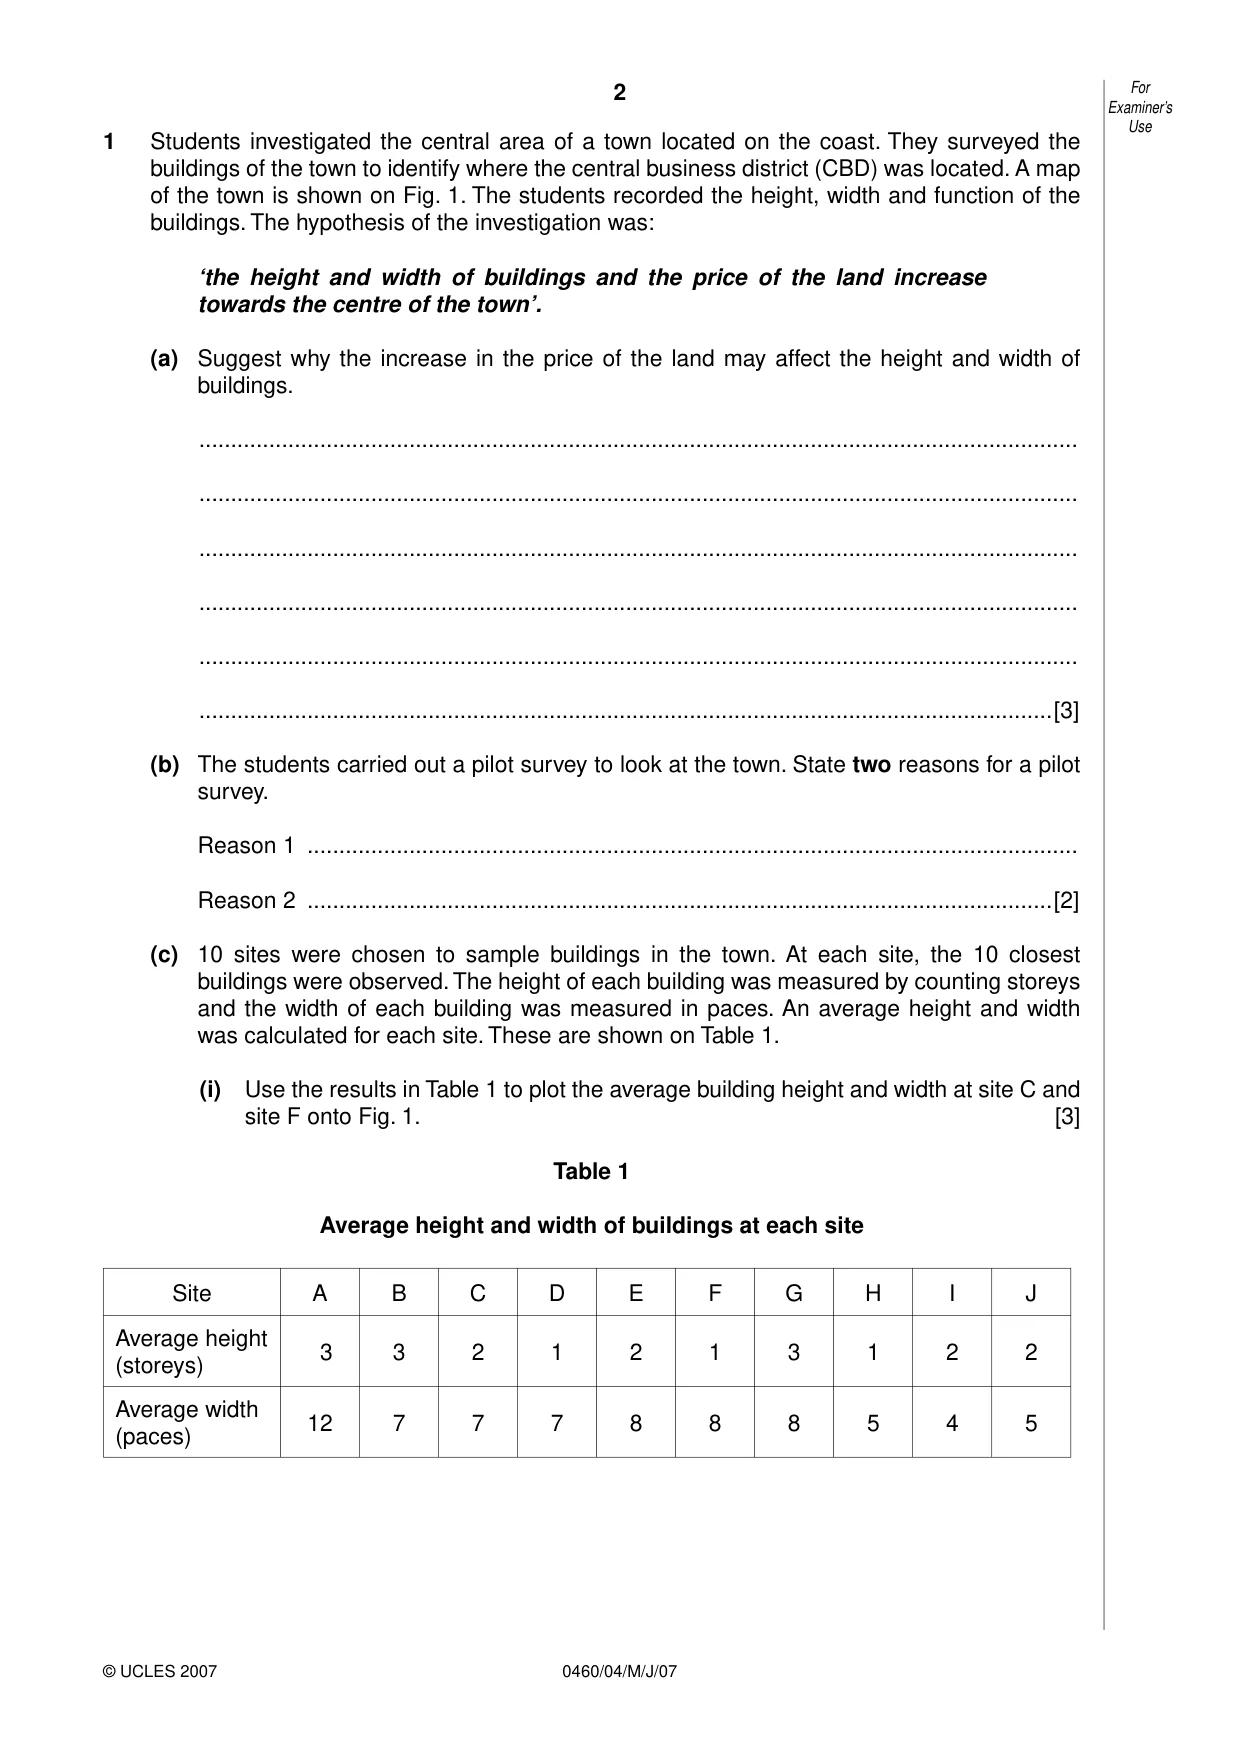
2 0460/04/M/J/07 For Examiner’s Use © UCLES 2007 1 Students investigated the central area of a town located on the coast. They surveyed the buildings of the town to identify where the central business district (CBD) was located. A map of the town is shown on Fig. 1. The students recorded the height, width and function of the buildings. The hypothesis of the investigation was: ‘the height and width of buildings and the price of the land increase towards the centre of the town’. (a) Suggest why the increase in the price of the land may affect the height and width of buildings. … … … … … …[3] (b) The students carried out a pilot survey to look at the town. State two reasons for a pilot survey. Reason 1 … Reason 2 …[2] (c) 10 sites were chosen to sample buildings in the town. At each site, the 10 closest buildings were observed. The height of each building was measured by counting storeys and the width of each building was measured in paces. An average height and width was calculated for each site. These are shown on Table 1. (i) Use the results in Table 1 to plot the average building height and width at site C and site F onto Fig. 1. [3] Table 1 Average height and width of buildings at each site Site A B C D E F G H I J Average height (storeys) 3 3 2 1 2 1 3 1 2 2 Average width (paces) 12 7 7 7 8 8 8 5 4 5
Question paper, page 3
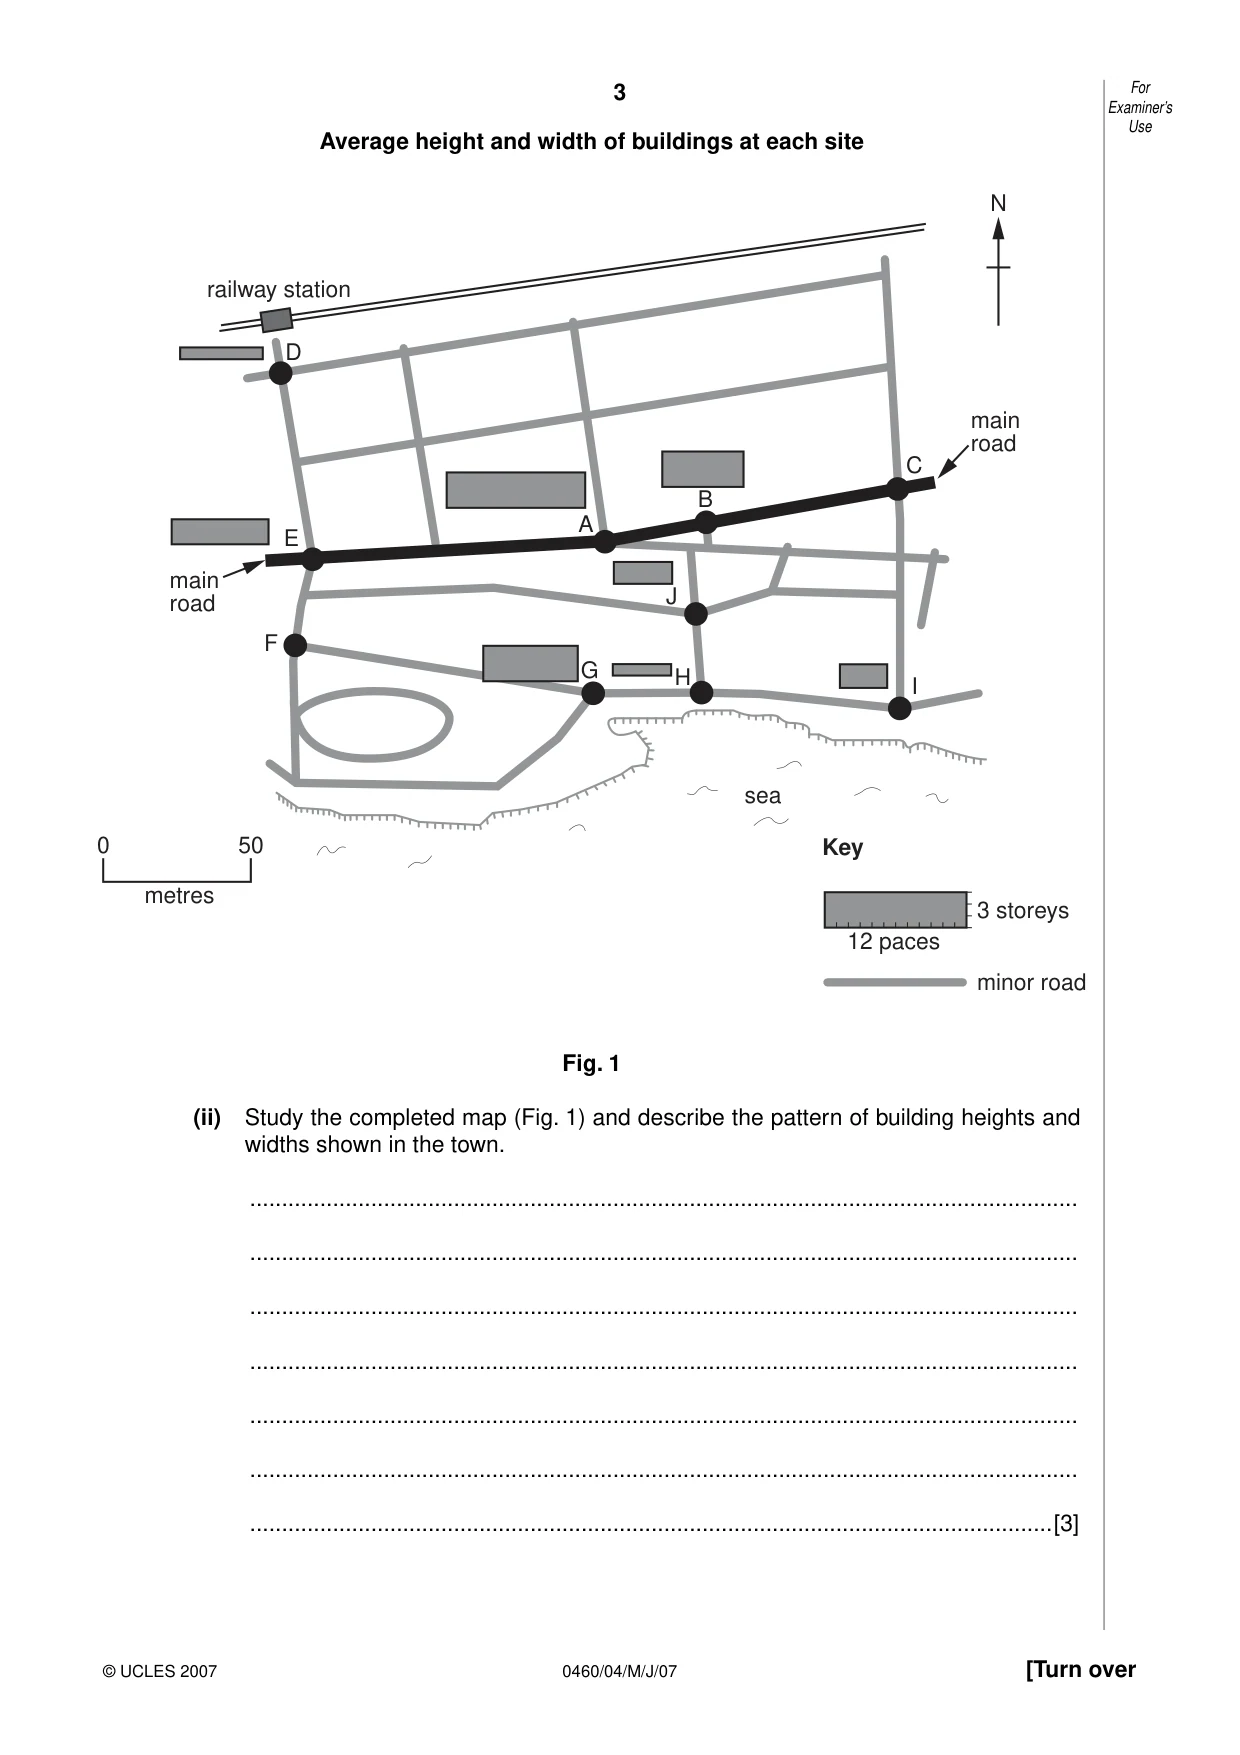
3 0460/04/M/J/07 [Turn over For Examiner’s Use © UCLES 2007 Average height and width of buildings at each site railway station sea 12 paces 3 storeys minor road main road main road C A B J H I G E Key D F 0 50 metres N Fig. 1 (ii) Study the completed map (Fig. 1) and describe the pattern of building heights and widths shown in the town. … … … … … … …[3]
Question paper, page 4
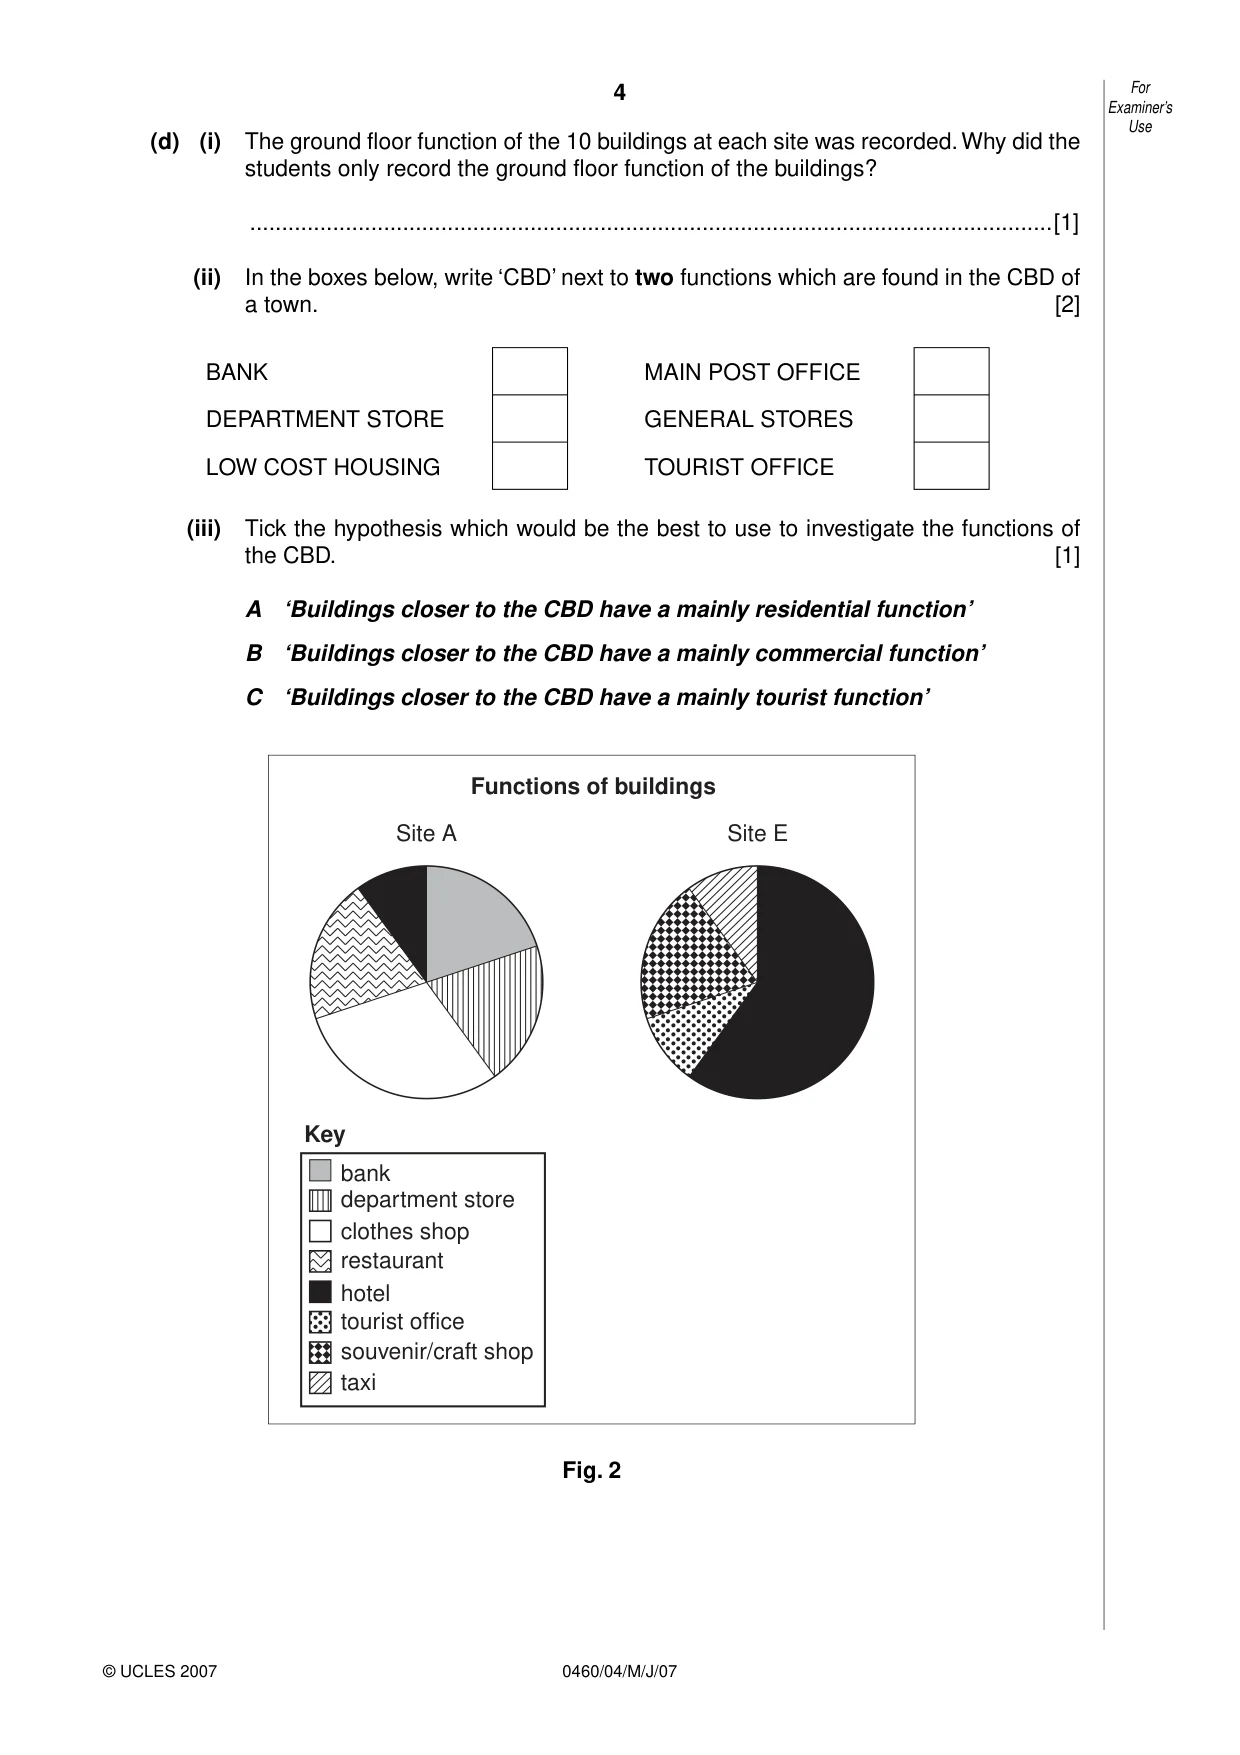
4 0460/04/M/J/07 For Examiner’s Use © UCLES 2007 (d) (i) The ground floor function of the 10 buildings at each site was recorded. Why did the students only record the ground floor function of the buildings? …[1] (ii) In the boxes below, write ‘CBD’ next to two functions which are found in the CBD of a town. [2] BANK MAIN POST OFFICE DEPARTMENT STORE GENERAL STORES LOW COST HOUSING TOURIST OFFICE (iii) Tick the hypothesis which would be the best to use to investigate the functions of the CBD. [1] A ‘Buildings closer to the CBD have a mainly residential function’ B ‘Buildings closer to the CBD have a mainly commercial function’ C ‘Buildings closer to the CBD have a mainly tourist function’ Functions of buildings Site A bank Key department store clothes shop restaurant hotel tourist office souvenir/craft shop taxi Site E Fig. 2
Question paper, page 5
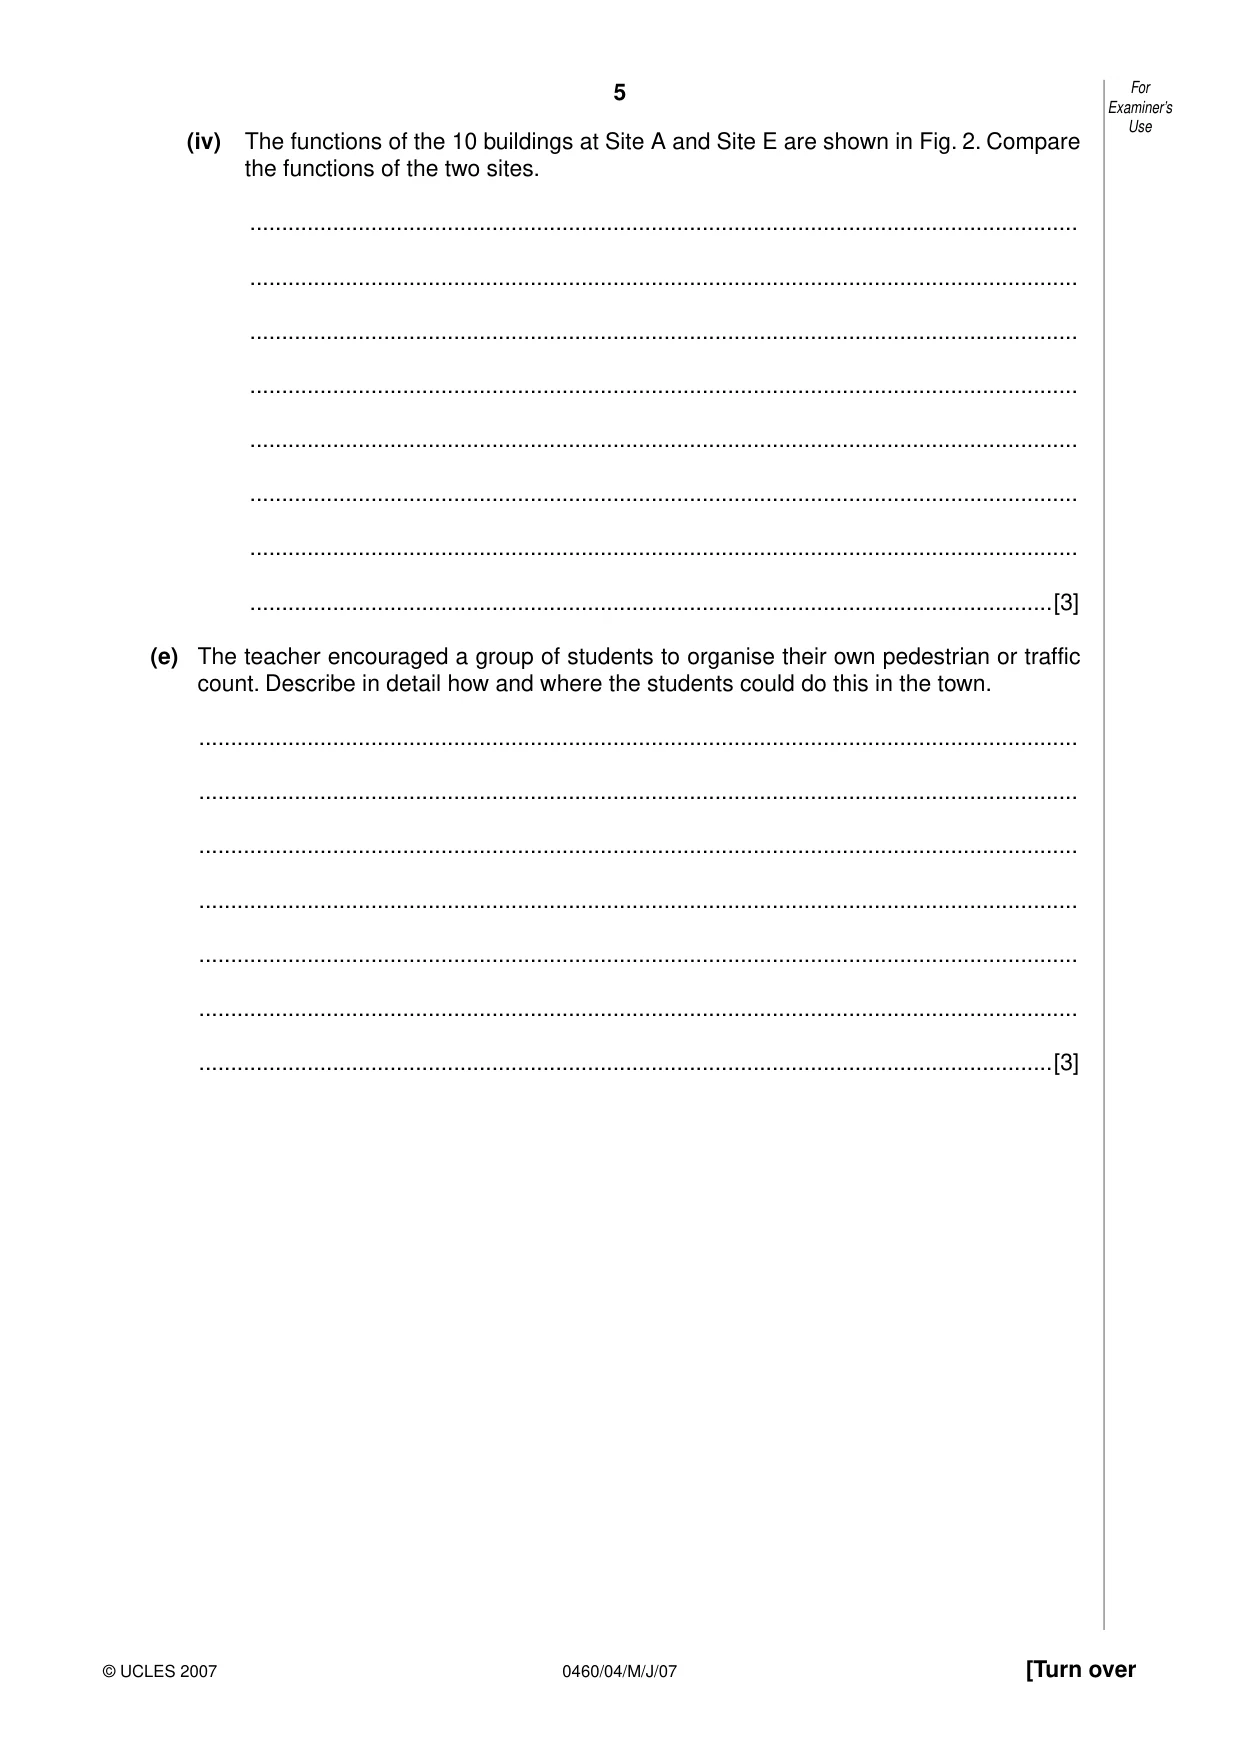
5 0460/04/M/J/07 [Turn over For Examiner’s Use © UCLES 2007 (iv) The functions of the 10 buildings at Site A and Site E are shown in Fig. 2. Compare the functions of the two sites. … … … … … … … …[3] (e) The teacher encouraged a group of students to organise their own pedestrian or traffic count. Describe in detail how and where the students could do this in the town. … … … … … … …[3]
Question paper, page 6
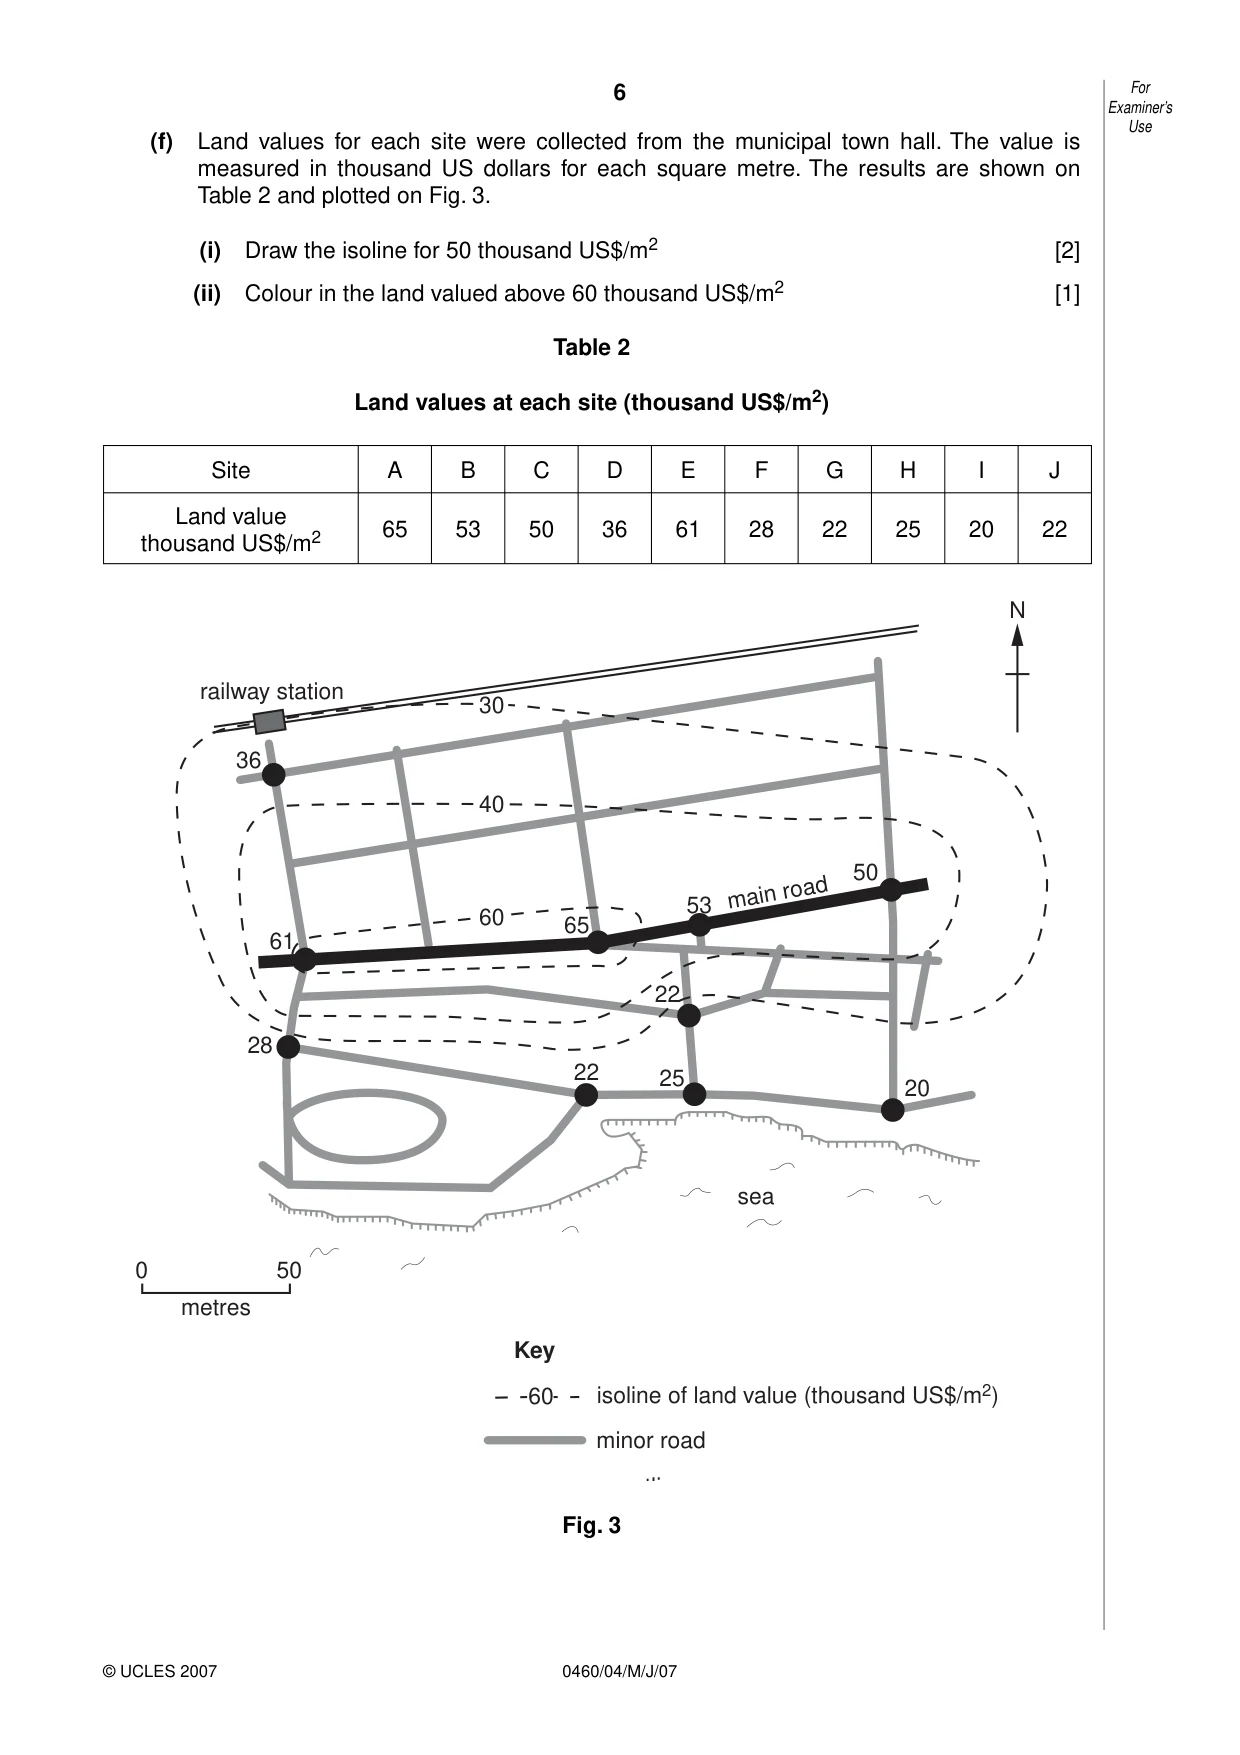
6 0460/04/M/J/07 For Examiner’s Use © UCLES 2007 (f) Land values for each site were collected from the municipal town hall. The value is measured in thousand US dollars for each square metre. The results are shown on Table 2 and plotted on Fig. 3. (i) Draw the isoline for 50 thousand US$/m2 [2] (ii) Colour in the land valued above 60 thousand US$/m2 [1] Table 2 Land values at each site (thousand US$/m2) Site A B C D E F G H I J Land value thousand US$/m2 65 53 50 36 61 28 22 25 20 22 railway station main road sea 50 0 metres 50 65 Key 53 22 25 20 22 isoline of land value (thousand US$/m2) 61 40 60 30 36 28 60 minor road tli N Fig. 3
Question paper, page 7
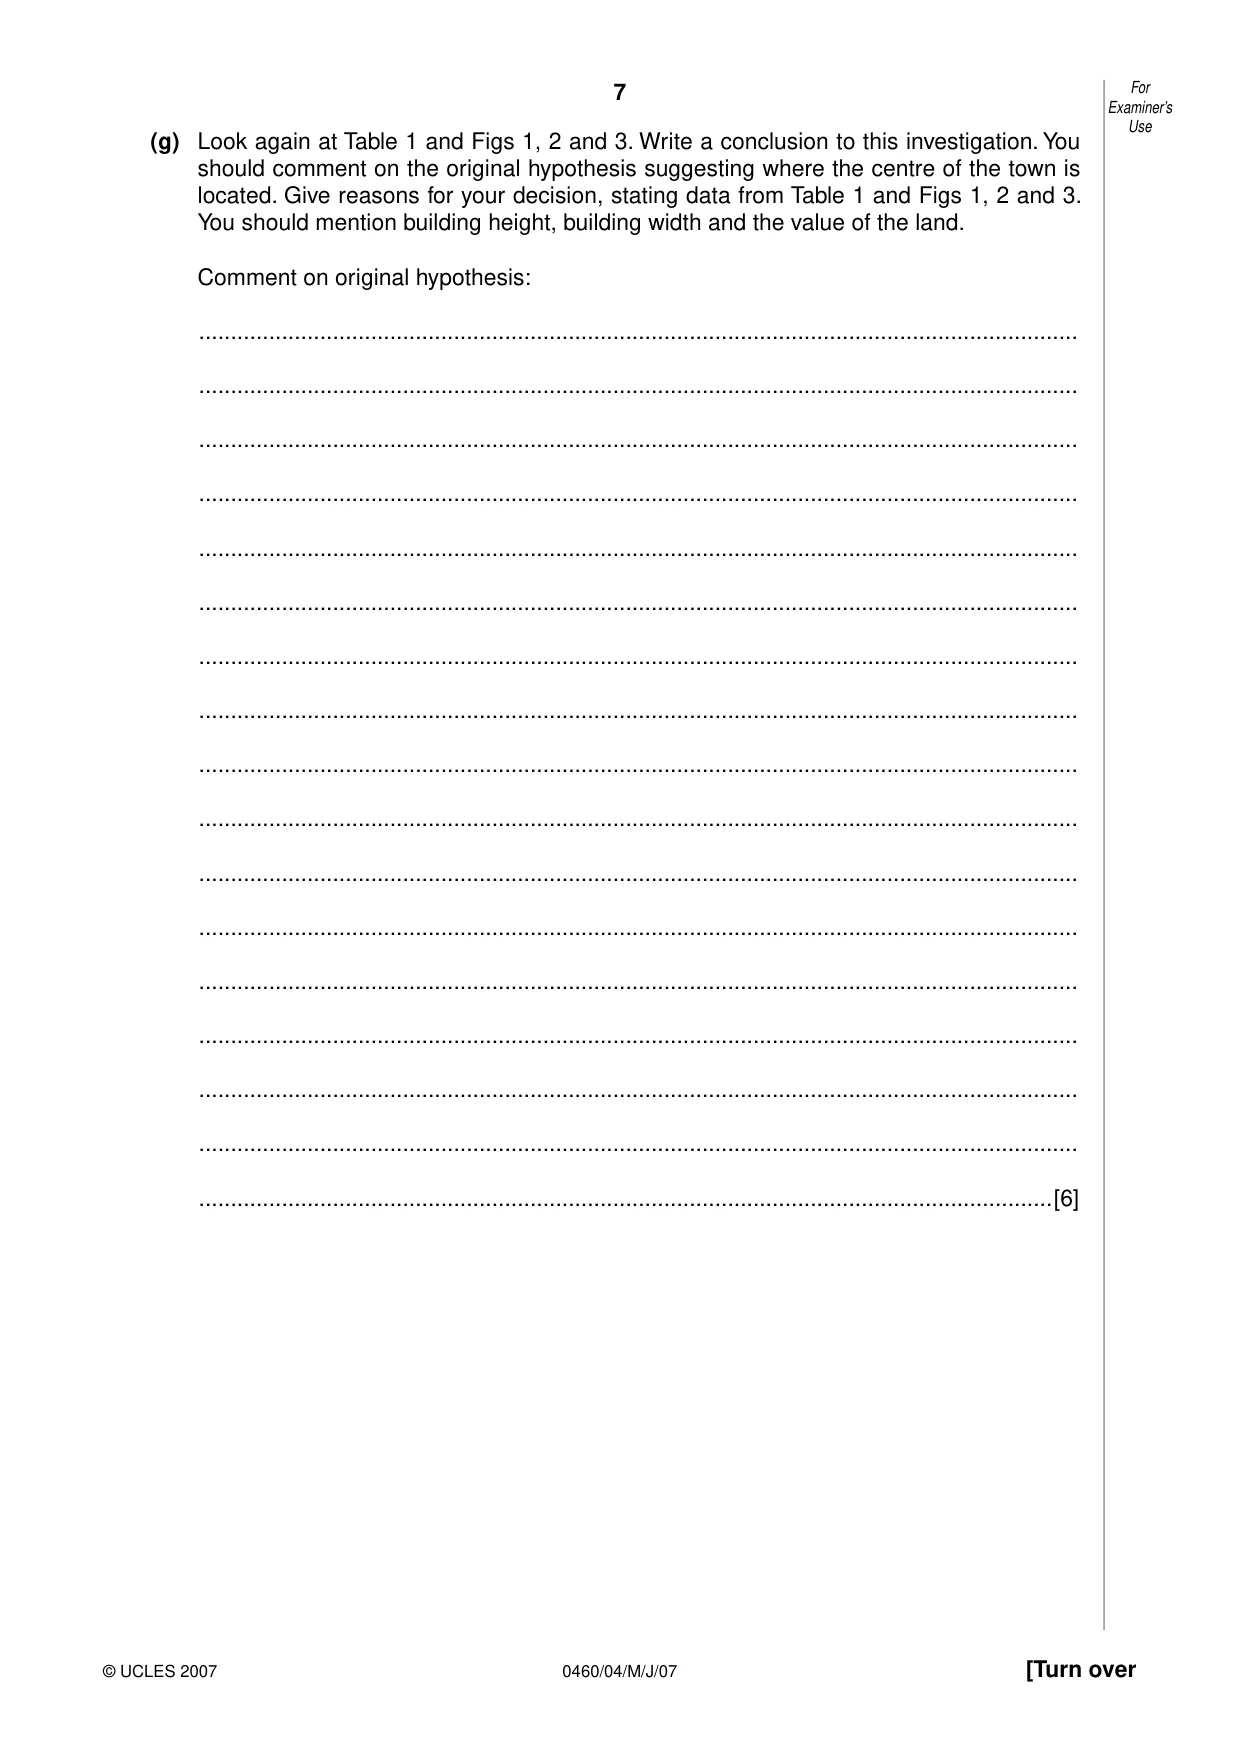
7 0460/04/M/J/07 [Turn over For Examiner’s Use © UCLES 2007 (g) Look again at Table 1 and Figs 1, 2 and 3. Write a conclusion to this investigation. You should comment on the original hypothesis suggesting where the centre of the town is located. Give reasons for your decision, stating data from Table 1 and Figs 1, 2 and 3. You should mention building height, building width and the value of the land. Comment on original hypothesis: … … … … … … … … … … … … … … … … …[6]
Question paper, page 8
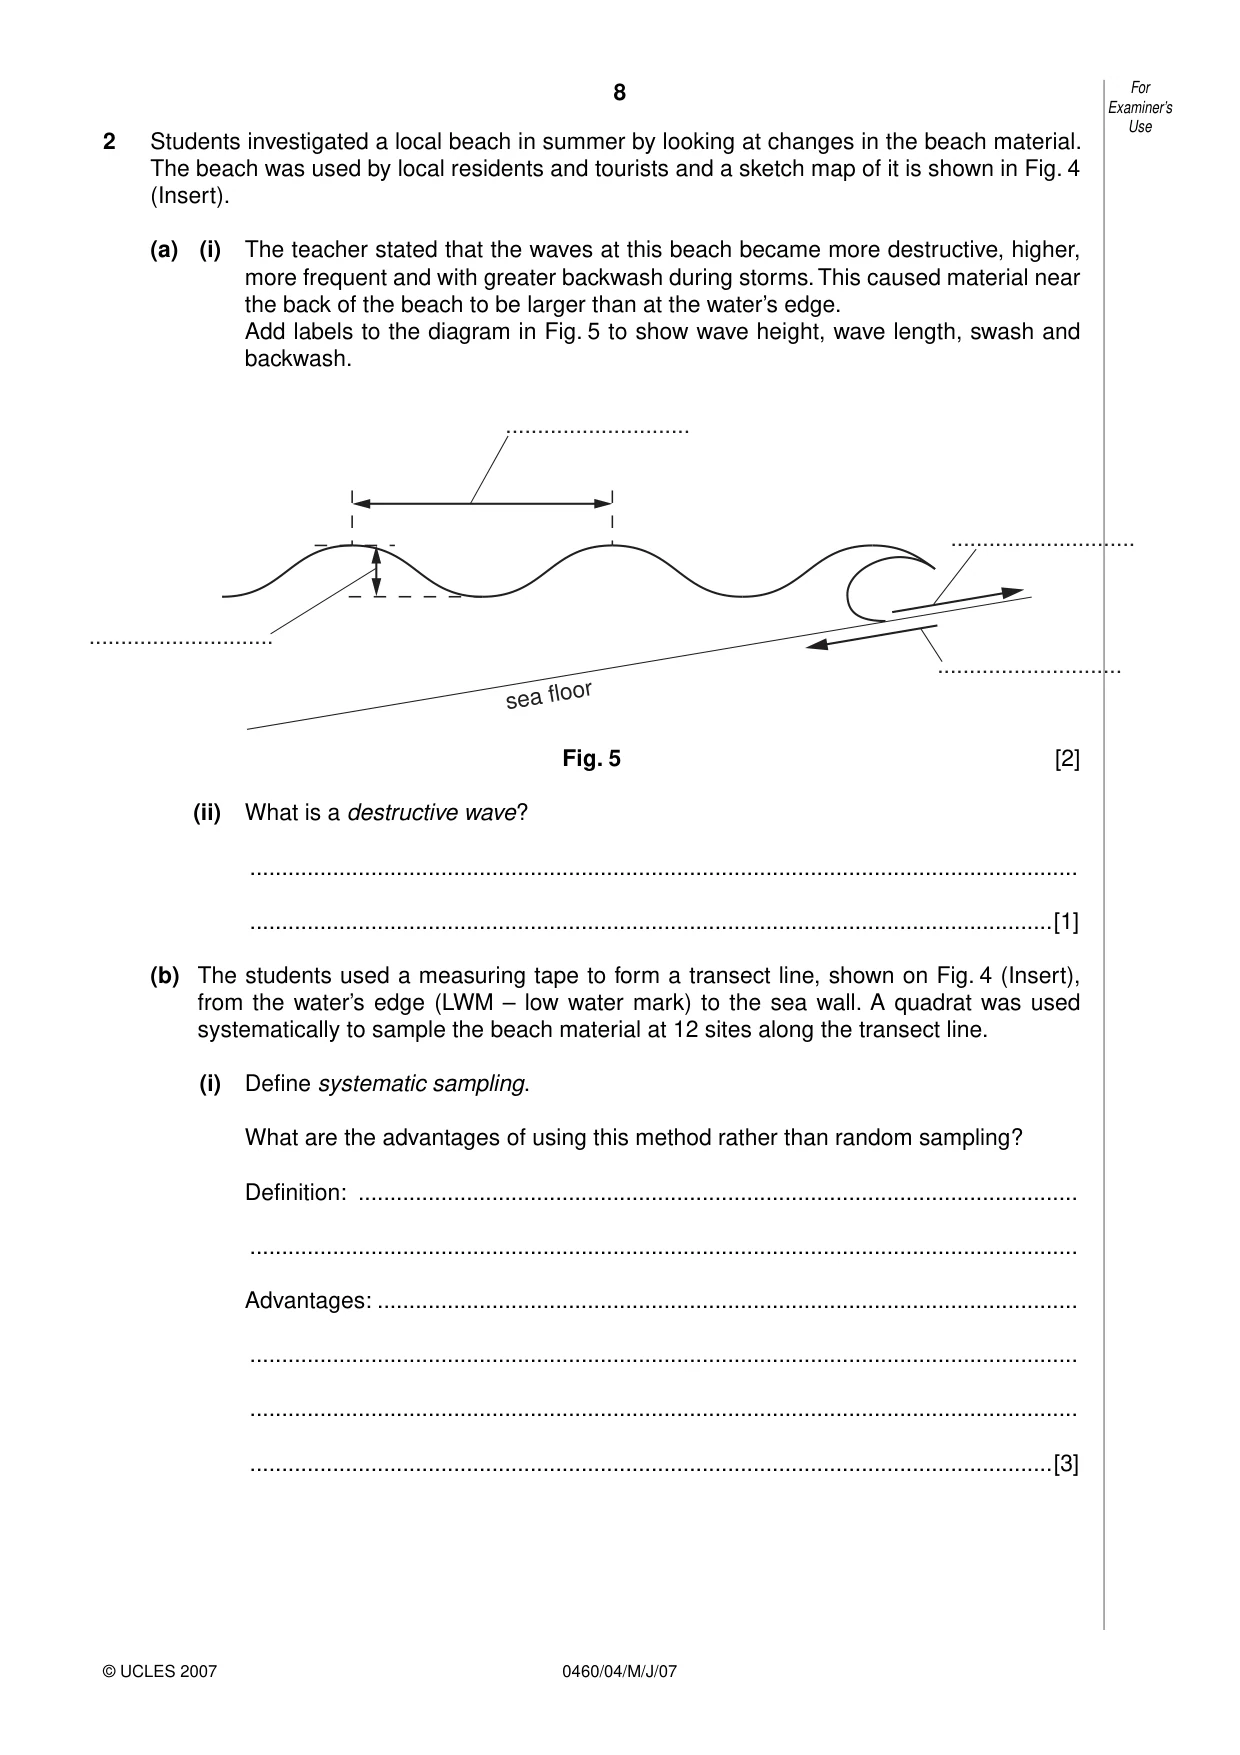
8 0460/04/M/J/07 For Examiner’s Use © UCLES 2007 2 Students investigated a local beach in summer by looking at changes in the beach material. The beach was used by local residents and tourists and a sketch map of it is shown in Fig. 4 (Insert). (a) (i) The teacher stated that the waves at this beach became more destructive, higher, more frequent and with greater backwash during storms. This caused material near the back of the beach to be larger than at the water’s edge. Add labels to the diagram in Fig. 5 to show wave height, wave length, swash and backwash. Fig. 5 [2] (ii) What is a destructive wave? … …[1] (b) The students used a measuring tape to form a transect line, shown on Fig. 4 (Insert), from the water’s edge (LWM – low water mark) to the sea wall. A quadrat was used systematically to sample the beach material at 12 sites along the transect line. (i) Define systematic sampling. What are the advantages of using this method rather than random sampling? Definition: … … Advantages: … … … …[3] sea floor … … … …
Question paper, page 9
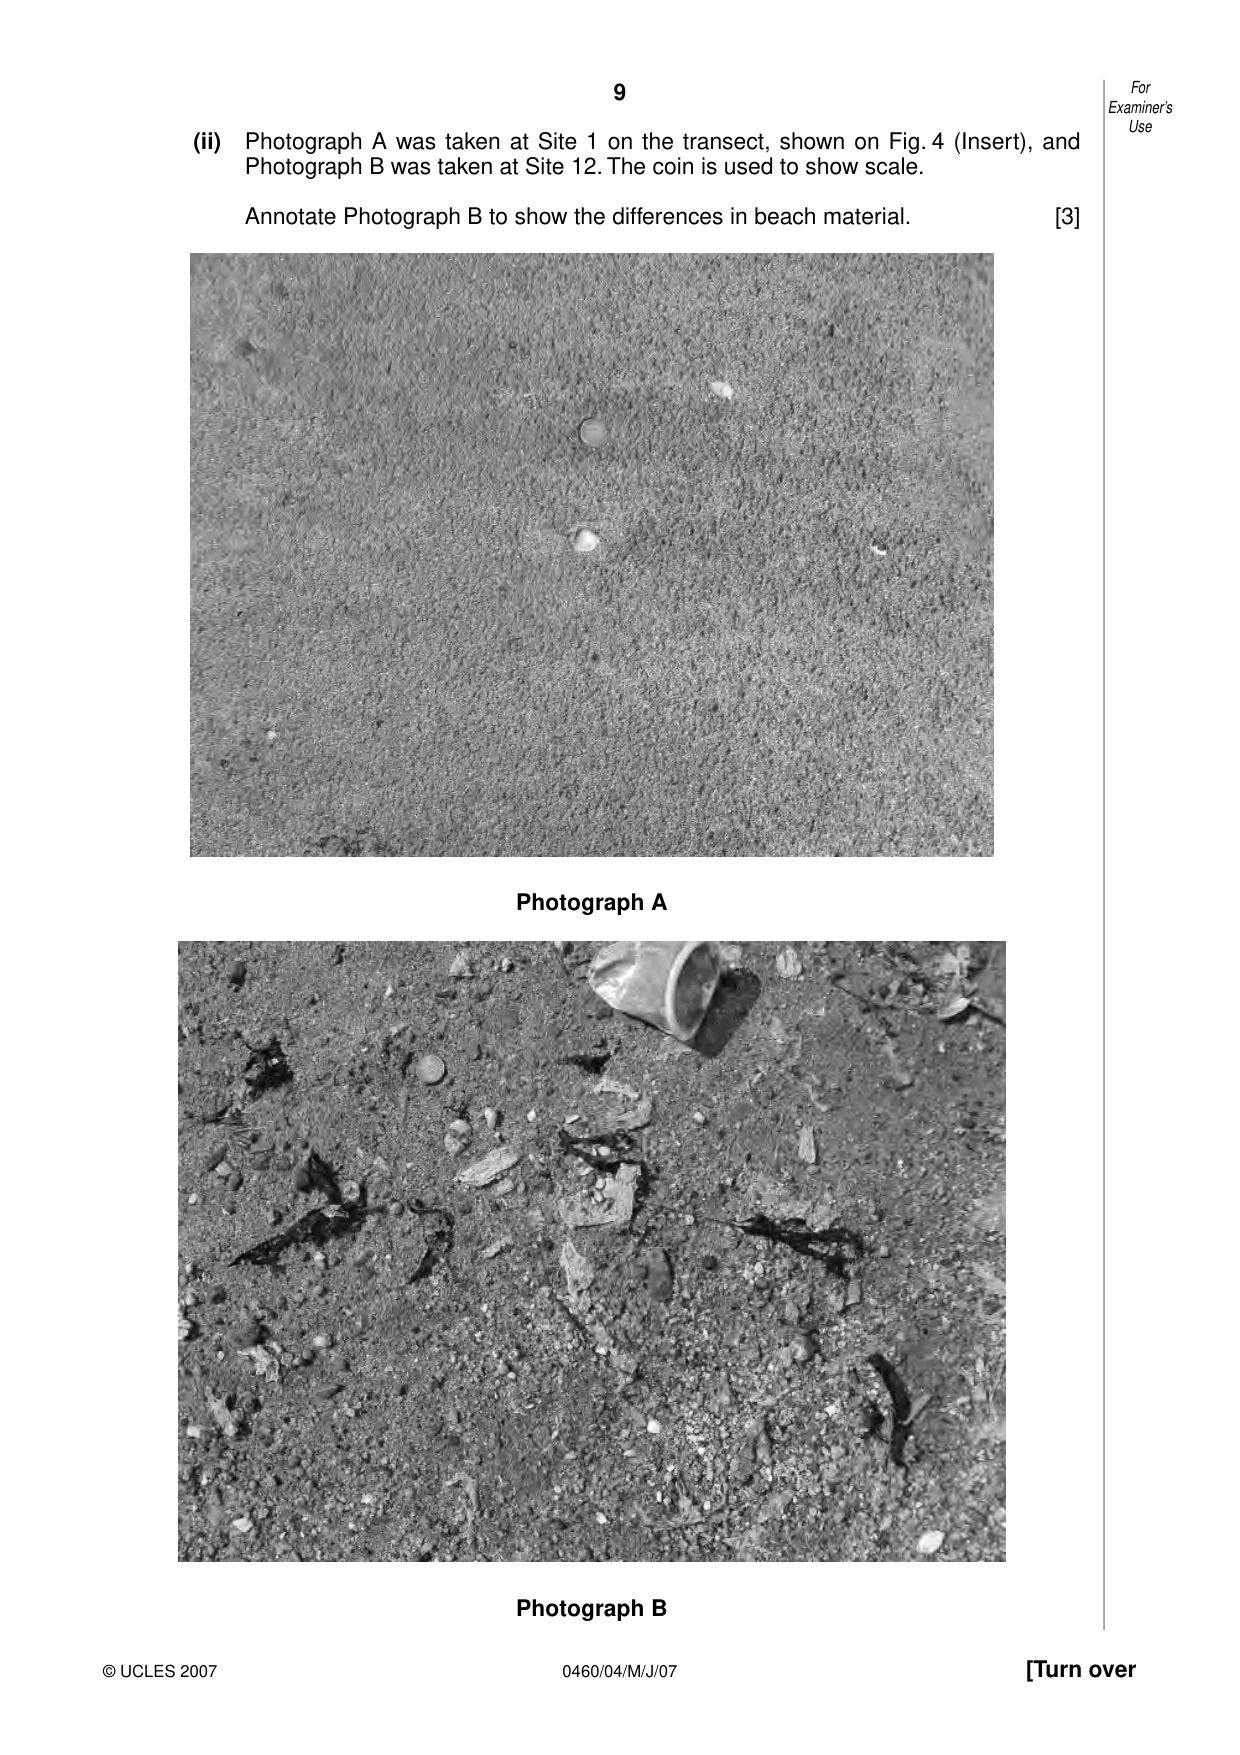
9 0460/04/M/J/07 [Turn over For Examiner’s Use © UCLES 2007 (ii) Photograph A was taken at Site 1 on the transect, shown on Fig. 4 (Insert), and Photograph B was taken at Site 12. The coin is used to show scale. Annotate Photograph B to show the differences in beach material. [3] Photograph A Photograph B
Question paper, page 10
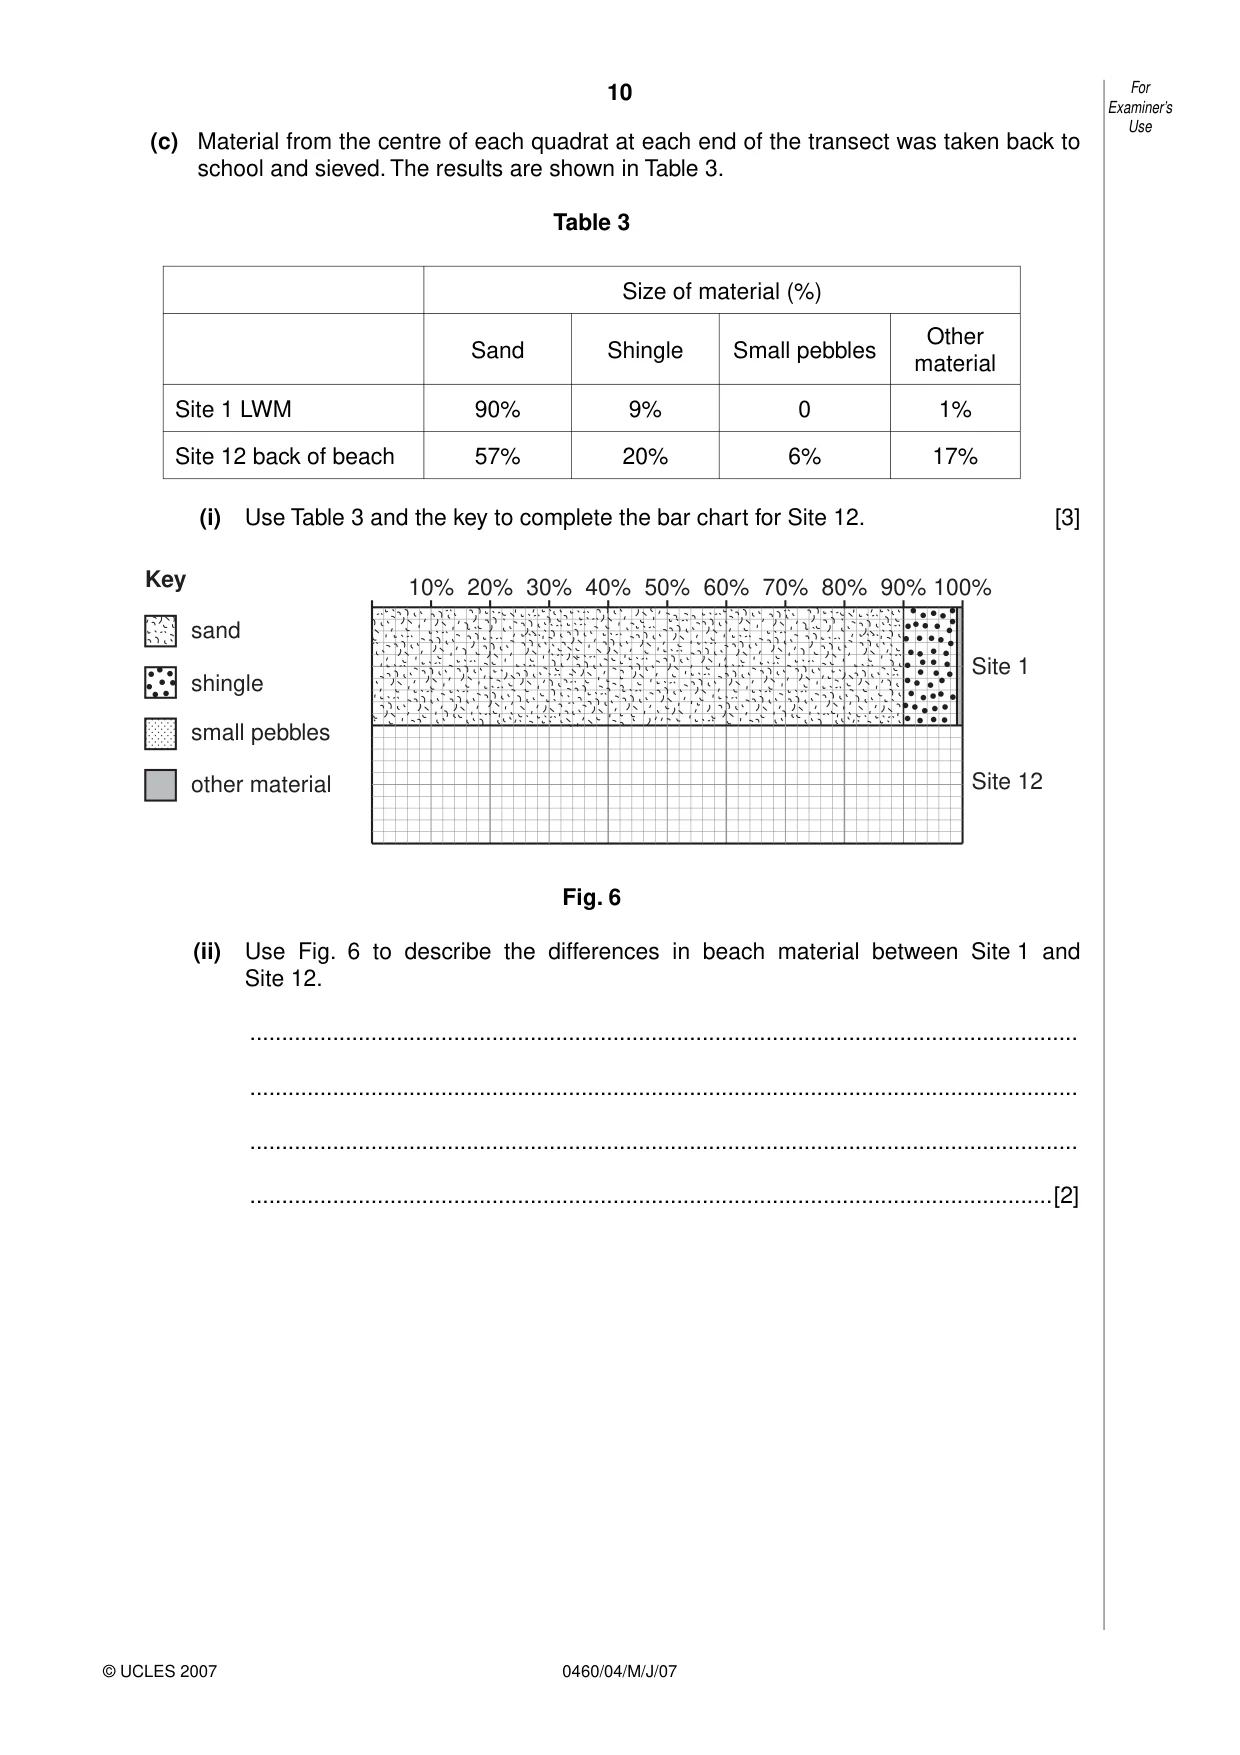
10 0460/04/M/J/07 For Examiner’s Use © UCLES 2007 (c) Material from the centre of each quadrat at each end of the transect was taken back to school and sieved. The results are shown in Table 3. Table 3 Size of material (%) Sand Shingle Small pebbles Other material Site 1 LWM 90% 9% 0 1% Site 12 back of beach 57% 20% 6% 17% (i) Use Table 3 and the key to complete the bar chart for Site 12. [3] 30% 40% 50% 60% 70% 80% 90% 100% Site 1 Site 12 20% 10% Key sand shingle small pebbles other material Fig. 6 (ii) Use Fig. 6 to describe the differences in beach material between Site 1 and Site 12. … … … …[2]
Question paper, page 11
11 0460/04/M/J/07 [Turn over For Examiner’s Use © UCLES 2007 (iii) Write a conclusion to the beach material investigation. Comment on the original ideas: … … Data evidence: … … … … …[3] (d) The photograph and sieving at Site 12 produced material which was not sand, shingle or small pebbles. This was classified as ‘other material’. The students returned to the beach to investigate the ‘other material’. Explain how ‘other material’ arrives at the beach. … … … … … …[3]
Question paper, page 12
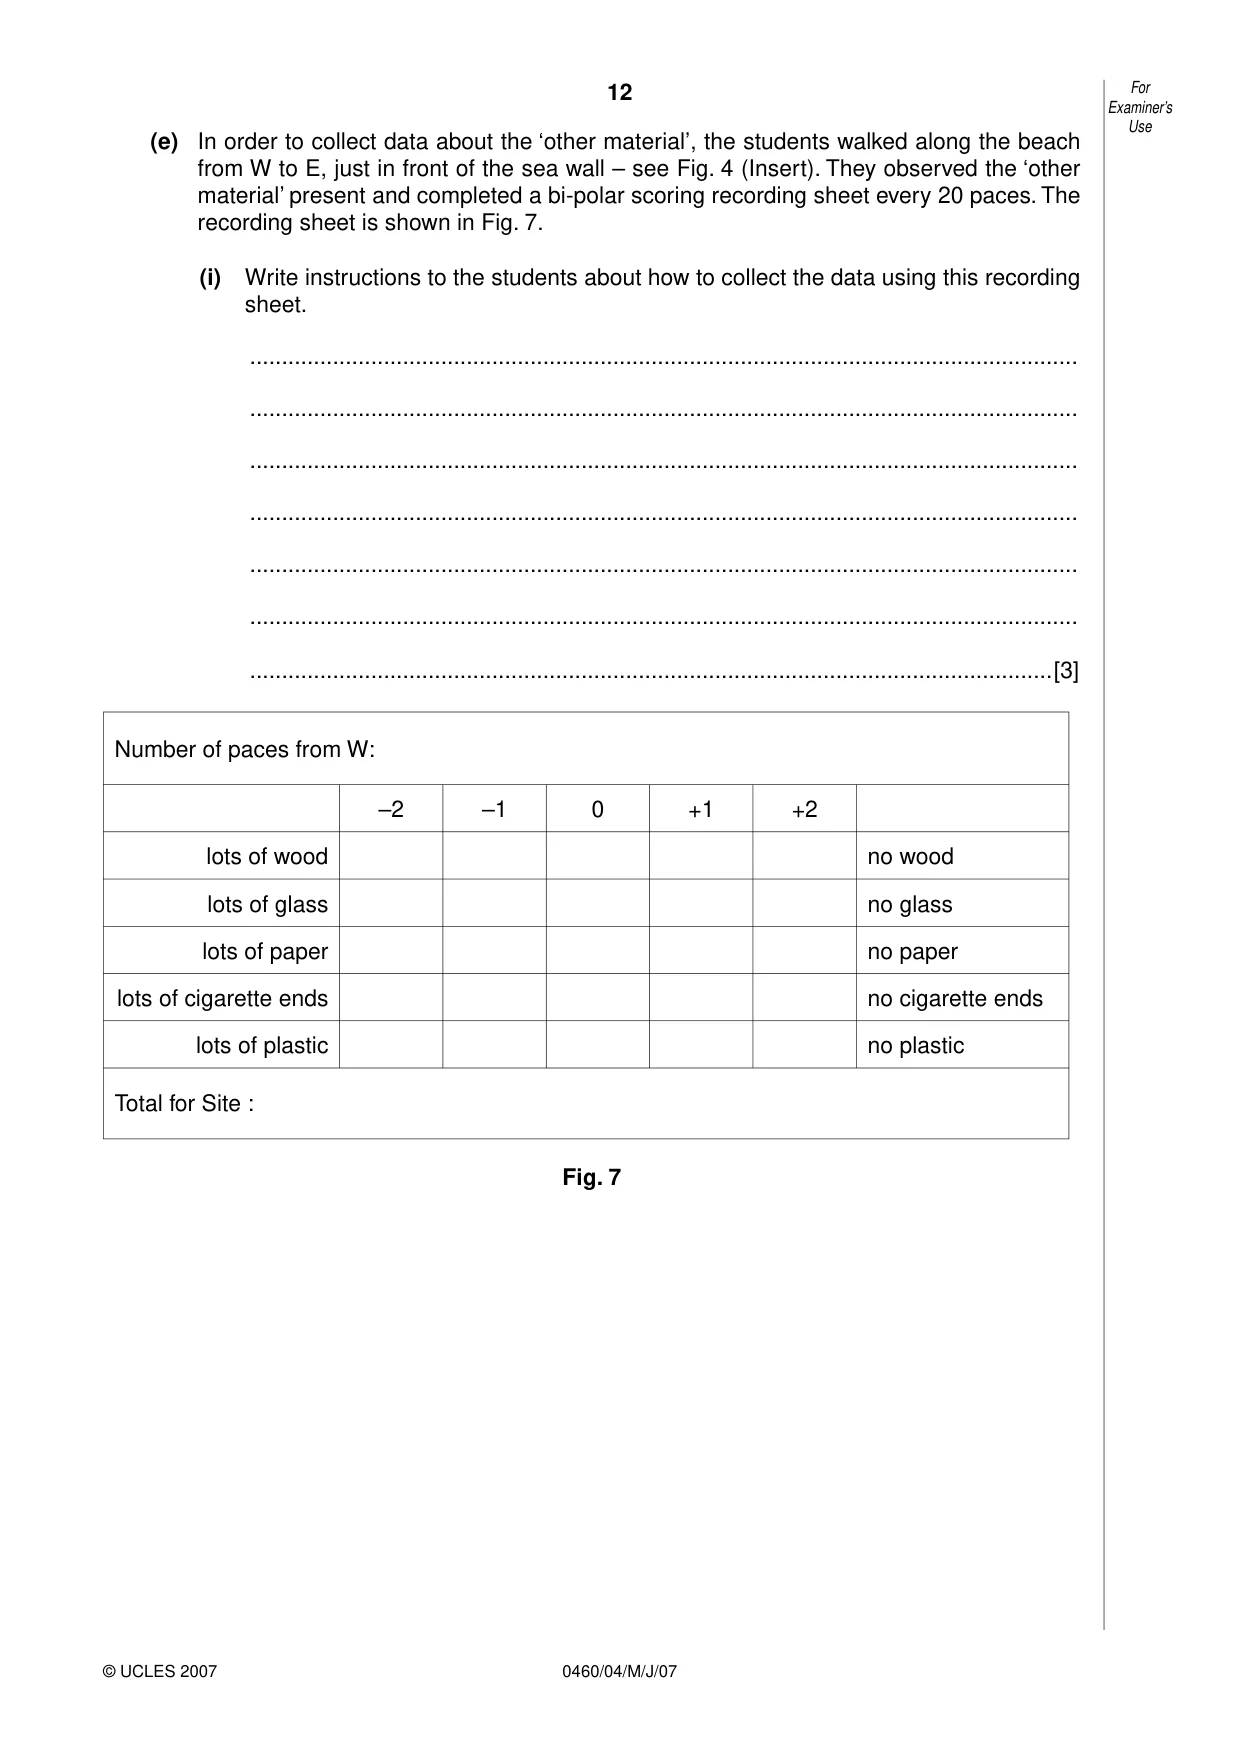
12 0460/04/M/J/07 For Examiner’s Use © UCLES 2007 (e) In order to collect data about the ‘other material’, the students walked along the beach from W to E, just in front of the sea wall – see Fig. 4 (Insert). They observed the ‘other material’ present and completed a bi-polar scoring recording sheet every 20 paces. The recording sheet is shown in Fig. 7. (i) Write instructions to the students about how to collect the data using this recording sheet. … … … … … … …[3] Number of paces from W: –2 –1 0 +1 +2 lots of wood no wood lots of glass no glass lots of paper no paper lots of cigarette ends no cigarette ends lots of plastic no plastic Total for Site : Fig. 7
Question paper, page 13
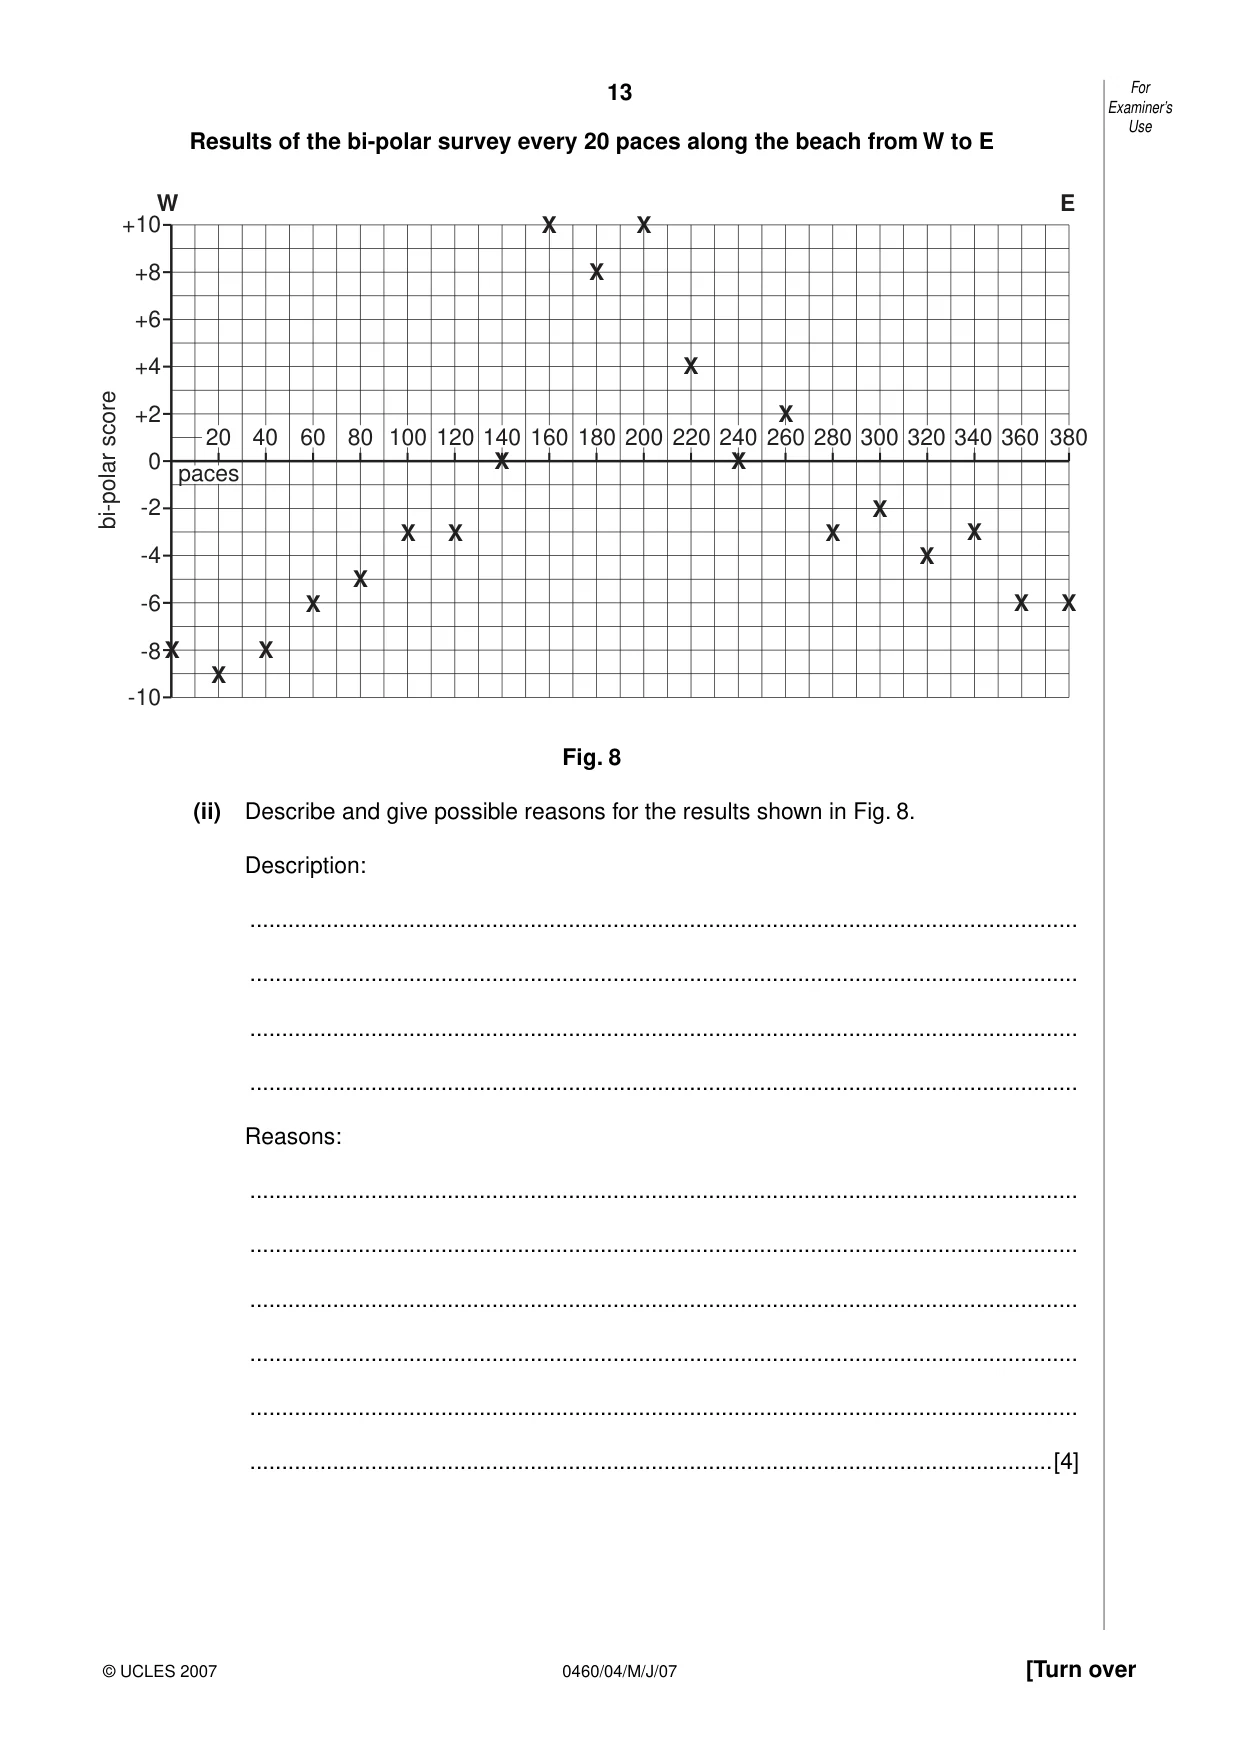
13 0460/04/M/J/07 [Turn over For Examiner’s Use © UCLES 2007 Results of the bi-polar survey every 20 paces along the beach from W to E +10 W E +8 +6 +4 +2 bi-polar score -2 -4 -6 -8 -10 0 paces X X X X X X X X X X X X X X X X X X X X 20 40 280 300 320 340 360 380 60 80 100 120 140 160 180 200 220 240 260 Fig. 8 (ii) Describe and give possible reasons for the results shown in Fig. 8. Description: … … … … Reasons: … … … … … …[4]
Question paper, page 14
14 0460/04/M/J/07 For Examiner’s Use © UCLES 2007 (f) Evaluate the data collection methods that the students used in their beach material investigations. You should suggest advantages, disadvantages and improvements. … … … … … … … … … … …[3]
Question paper, page 16
16 0460/04/M/J/07 BLANK PAGE Copyright Acknowledgements: Permission to reproduce items where third-party owned material protected by copyright is included has been sought and cleared where possible. Every reasonable effort has been made by the publisher (UCLES) to trace copyright holders, but if any items requiring clearance have unwittingly been included, the publisher will be pleased to make amends at the earliest possible opportunity. University of Cambridge International Examinations is part of the Cambridge Assessment Group. Cambridge Assessment is the brand name of University of Cambridge Local Examinations Syndicate (UCLES), which is itself a department of the University of Cambridge.
What you needed in this session
Cambridge’s own grade thresholds for 2007 May/June, Paper 4 · Variant 1. A higher threshold means an easier paper — the bar moves with how the cohort did.