Cambridge IGCSE Geography 0460 — 2007 May/June Paper 2 · Variant 1
0460/21/M/J/07 · 60 marks · ≈68 min
The question paper and its mark scheme, free to read here and free to download. This is Cambridge’s own paper, exactly as it was sat.
Question paper16 pages



Mark scheme7 pages
Answers below. Sit the paper first if you are practising.
Paper as text
Question paper, page 1
This document consists of 14 printed pages, 2 blank pages and 1 Insert. SPA (KN) T24055/6 © UCLES 2007 [Turn over UNIVERSITY OF CAMBRIDGE INTERNATIONAL EXAMINATIONS International General Certificate of Secondary Education READ THESE INSTRUCTIONS FIRST Write your Centre number, candidate number and name on all the work you hand in. Write in dark blue or black pen. You may use a soft pencil for any diagrams, graphs or rough working. Do not use staples, paper clips, highlighters, glue or correction fluid. DO NOT WRITE ON ANY BARCODES. Answer all questions. The Insert contains Photographs A and B for Question 3. Sketch maps and diagrams should be drawn whenever they serve to illustrate an answer. The Survey Map Extract and the Insert are not required by the Examiner. At the end of the examination, fasten all your work securely together. The number of marks is given in brackets [ ] at the end of each question or part question. * 3 4 6 1 3 0 5 9 5 5 * GEOGRAPHY 0460/02 Paper 2 May/June 2007 1 hour 30 minutes Candidates answer on the Question Paper. Additional Materials: Ruler 1:25 000 Survey Map Extract is enclosed with this question paper. For Examiner’s Use 1 2 3 4 5 6 Total www.XtremePapers.com
Question paper, page 2
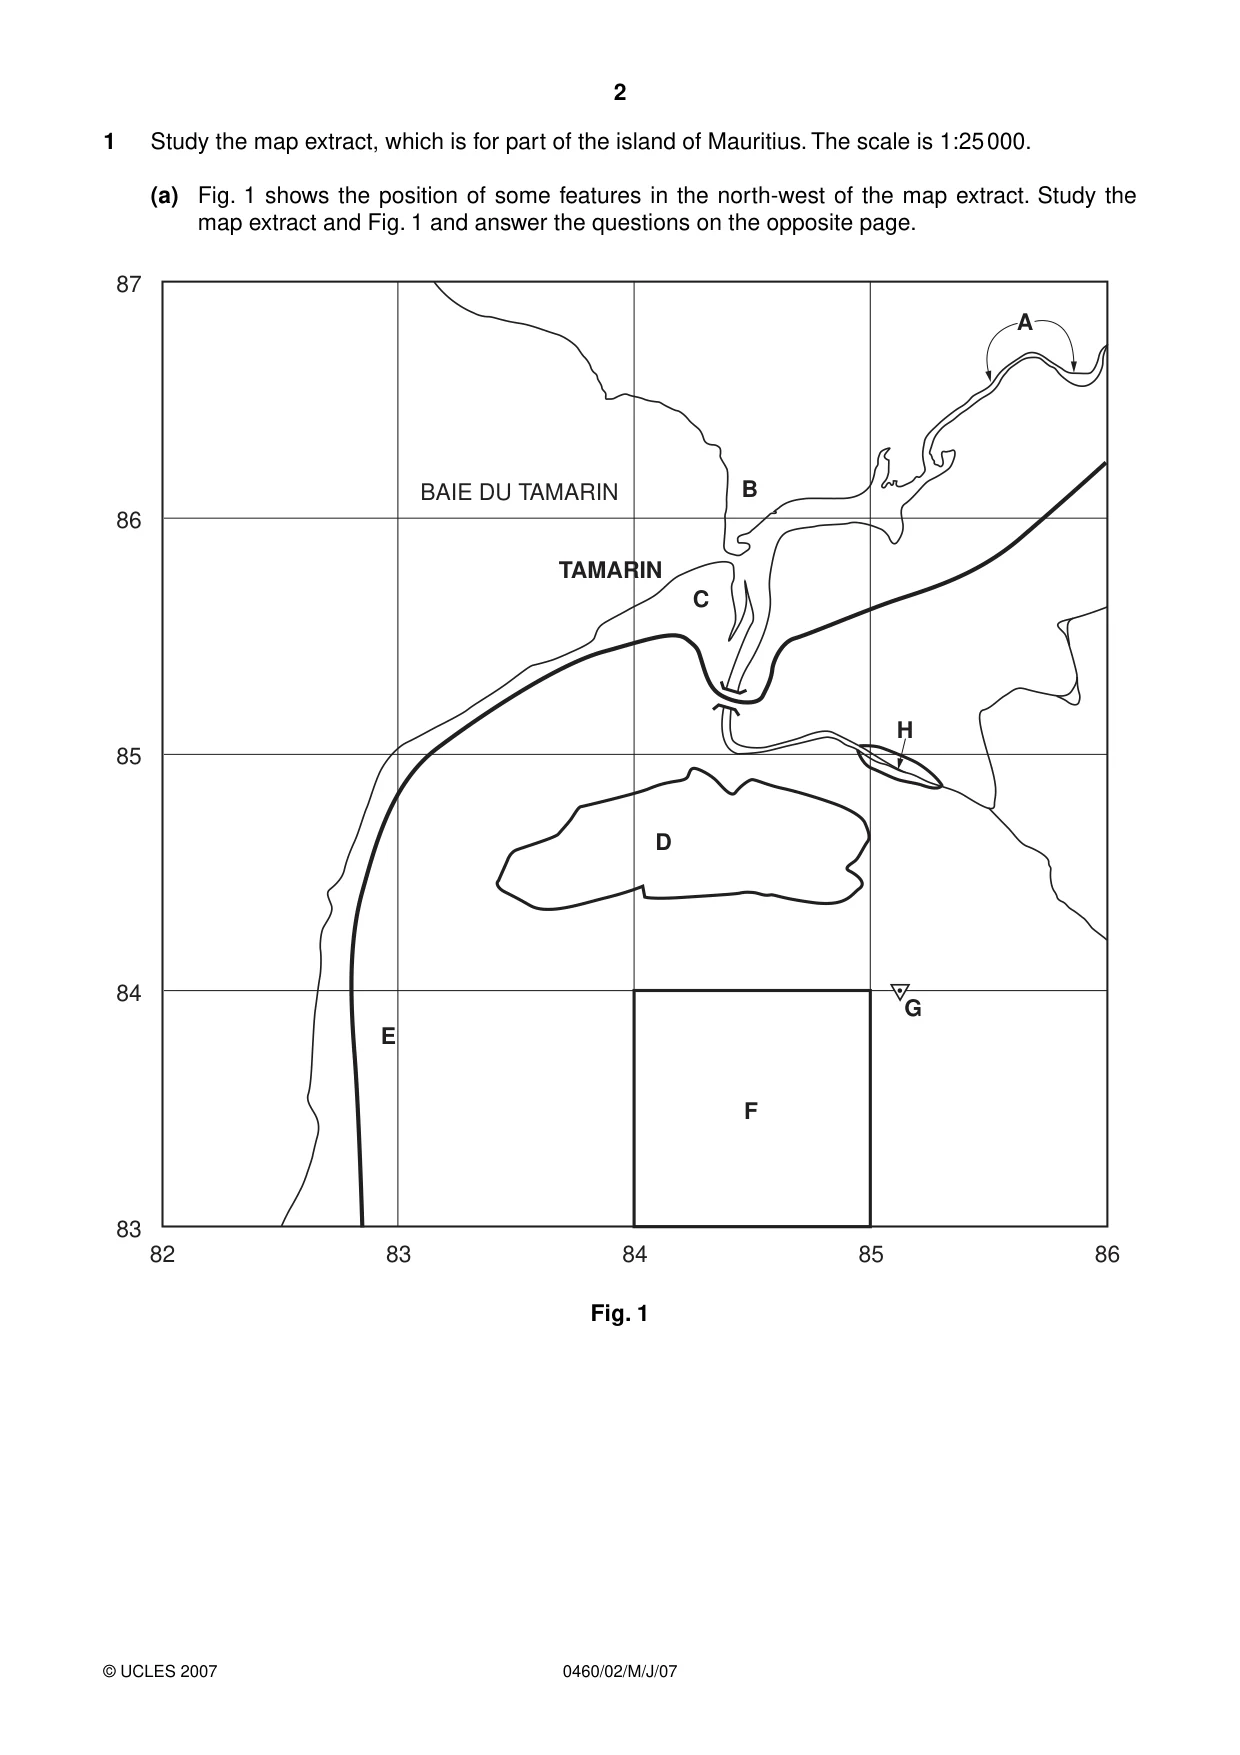
2 0460/02/M/J/07 © UCLES 2007 1 Study the map extract, which is for part of the island of Mauritius. The scale is 1:25 000. (a) Fig. 1 shows the position of some features in the north-west of the map extract. Study the map extract and Fig. 1 and answer the questions on the opposite page. 87 86 85 84 83 82 83 84 85 86 D C B A H F G E BAIE DU TAMARIN TAMARIN Fig. 1
Question paper, page 3
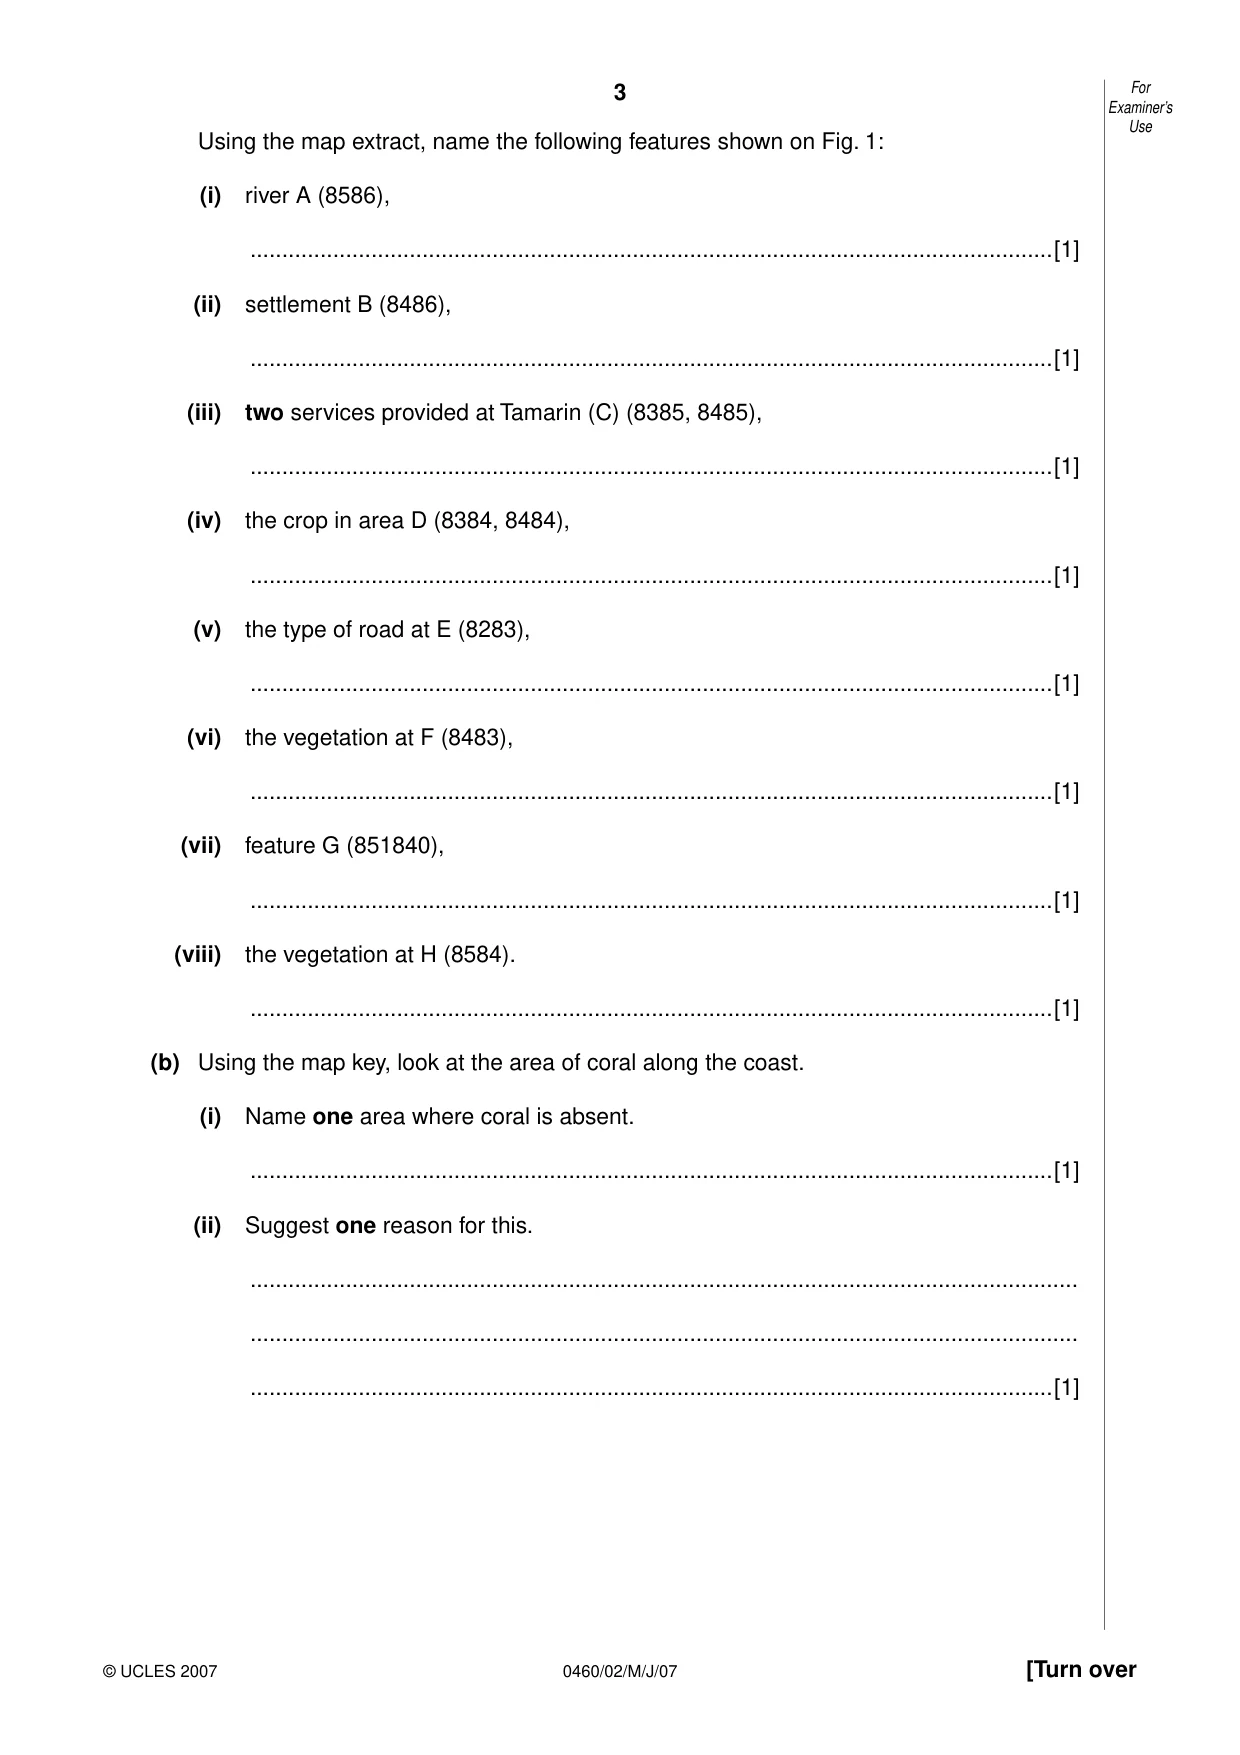
3 0460/02/M/J/07 [Turn over For Examiner’s Use © UCLES 2007 Using the map extract, name the following features shown on Fig. 1: (i) river A (8586), …[1] (ii) settlement B (8486), …[1] (iii) two services provided at Tamarin (C) (8385, 8485), …[1] (iv) the crop in area D (8384, 8484), …[1] (v) the type of road at E (8283), …[1] (vi) the vegetation at F (8483), …[1] (vii) feature G (851840), …[1] (viii) the vegetation at H (8584). …[1] (b) Using the map key, look at the area of coral along the coast. (i) Name one area where coral is absent. …[1] (ii) Suggest one reason for this. … … …[1]
Question paper, page 4
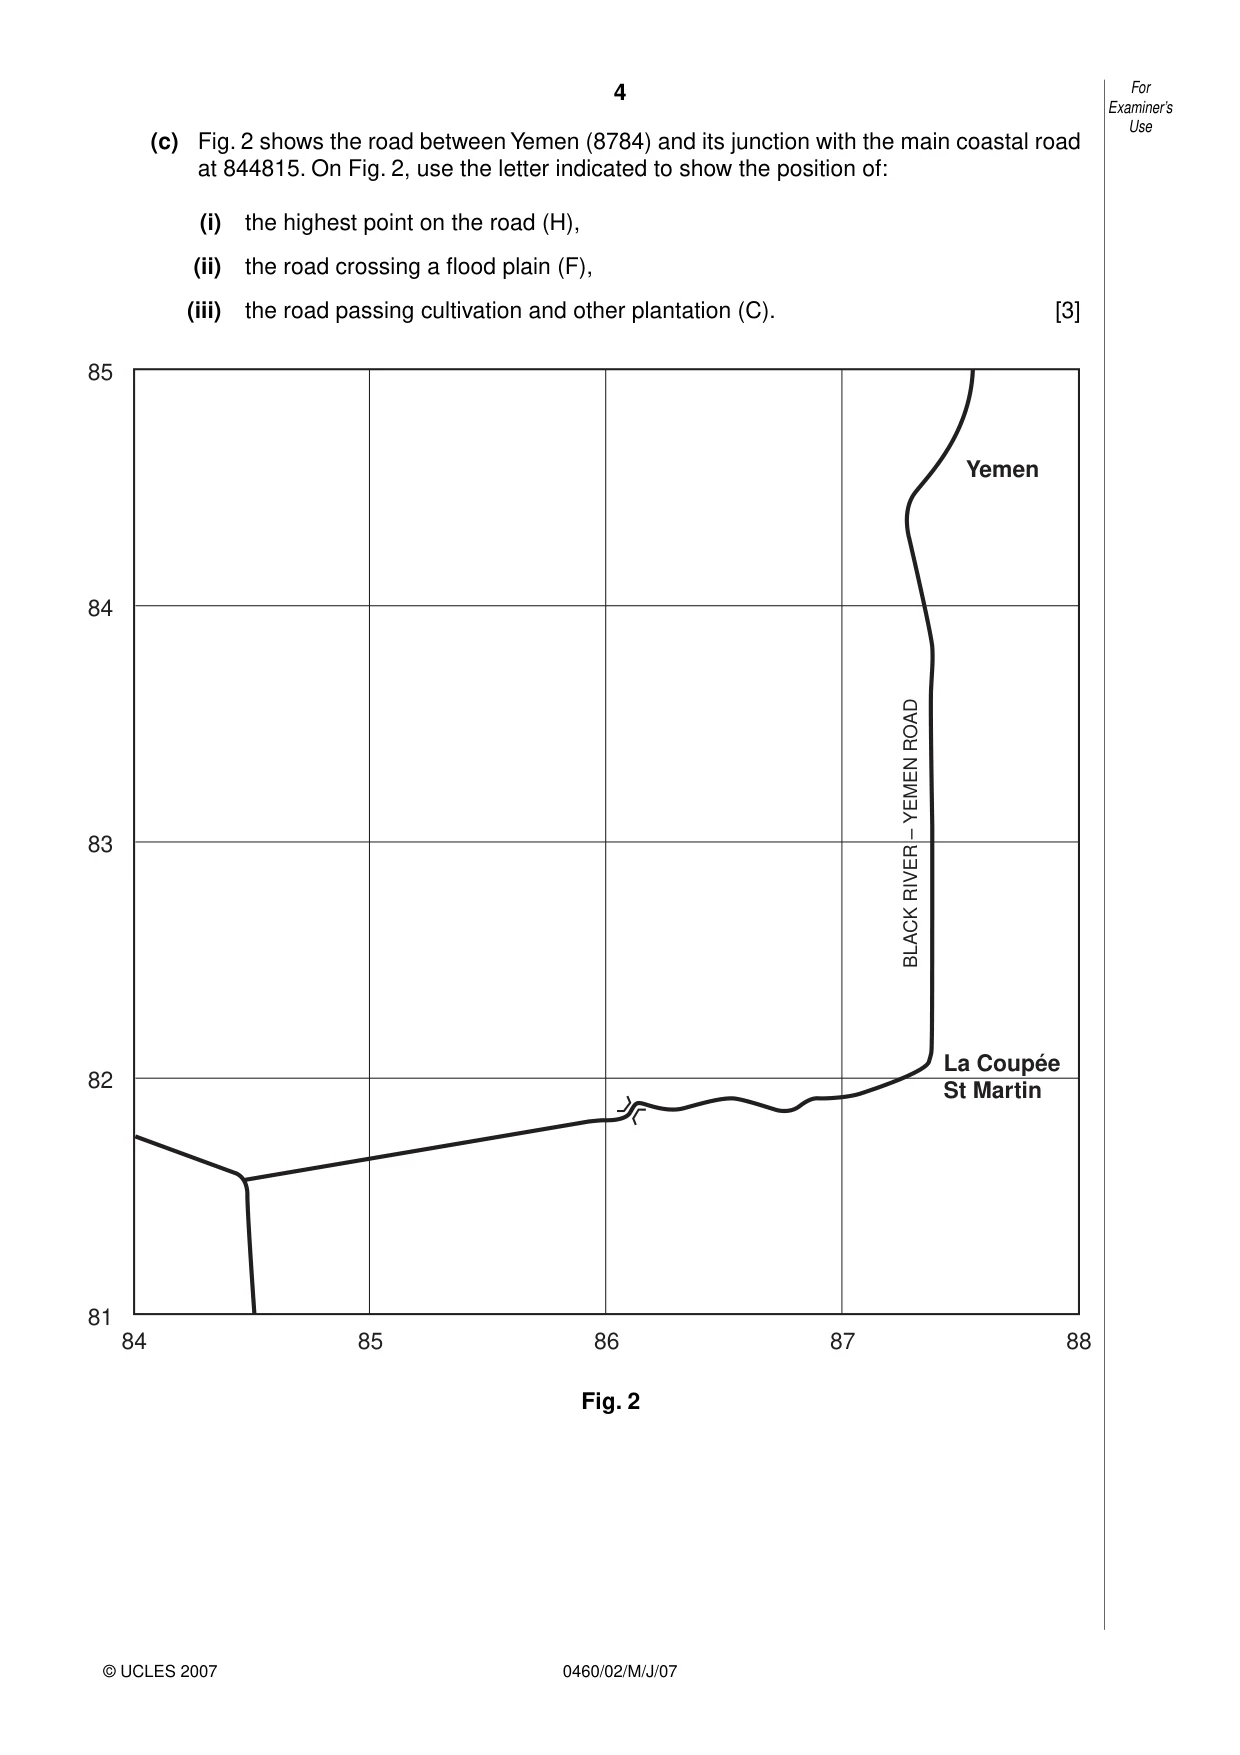
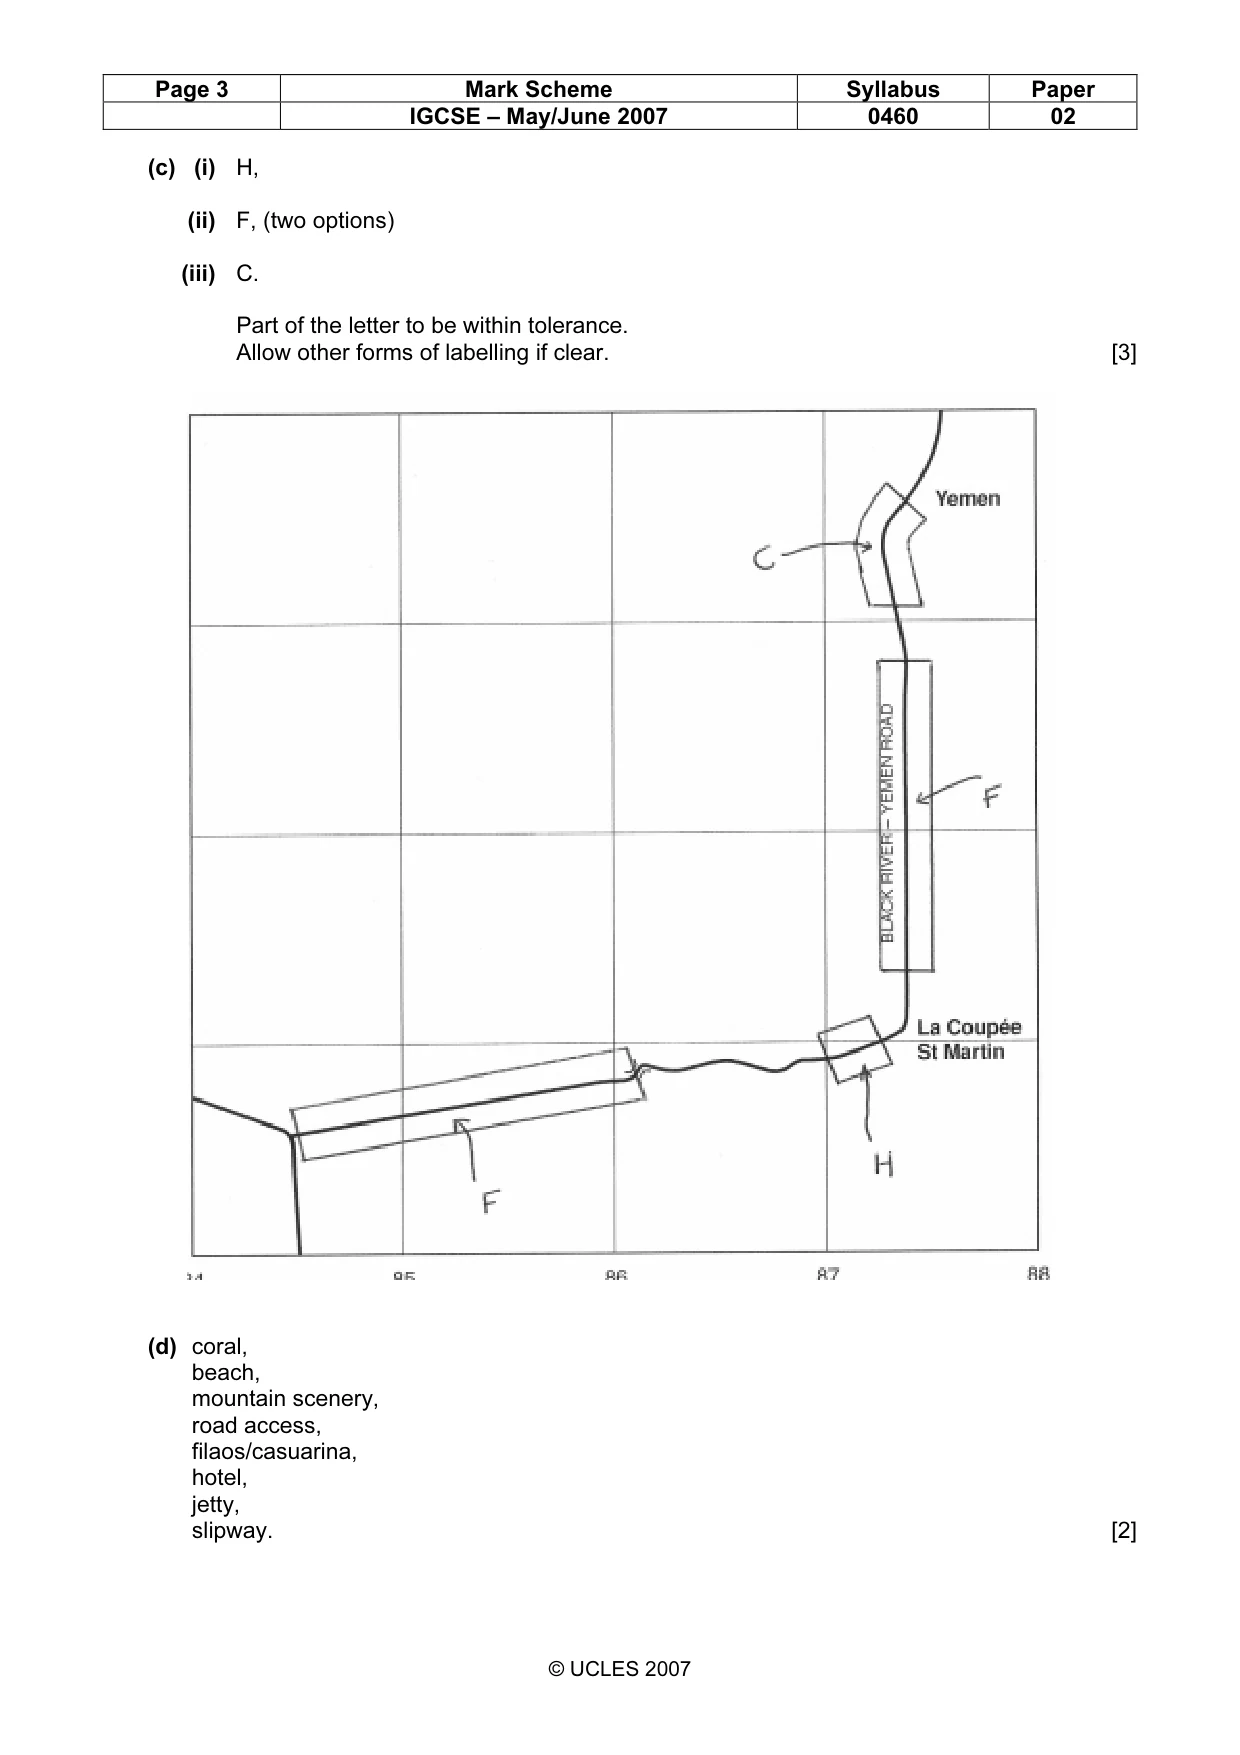
4 0460/02/M/J/07 For Examiner’s Use © UCLES 2007 (c) Fig. 2 shows the road between Yemen (8784) and its junction with the main coastal road at 844815. On Fig. 2, use the letter indicated to show the position of: (i) the highest point on the road (H), (ii) the road crossing a flood plain (F), (iii) the road passing cultivation and other plantation (C). [3] 85 84 83 82 81 84 85 86 87 88 Yemen BLACK RIVER – YEMEN ROAD La Coupée St Martin Fig. 2
Question paper, page 5
5 0460/02/M/J/07 [Turn over For Examiner’s Use © UCLES 2007 (d) There is a tourist industry along the coast of the area shown on the map extract. Suggest two advantages of the coastal area for tourism. … … … …[2] (e) A tourist stands at the Martello Tower (824827) and looks at the summit (highest point) of the Tourelle du Tamarin (840834). (i) In which compass direction is the tourist looking? …[1] (ii) State the height above sea level of the summit. …[1] (iii) Measure the distance in metres between the tower and the summit. …metres [1] (iv) Describe the changes in gradient of the land between the tower and the summit. … … … … …[2]
Question paper, page 6
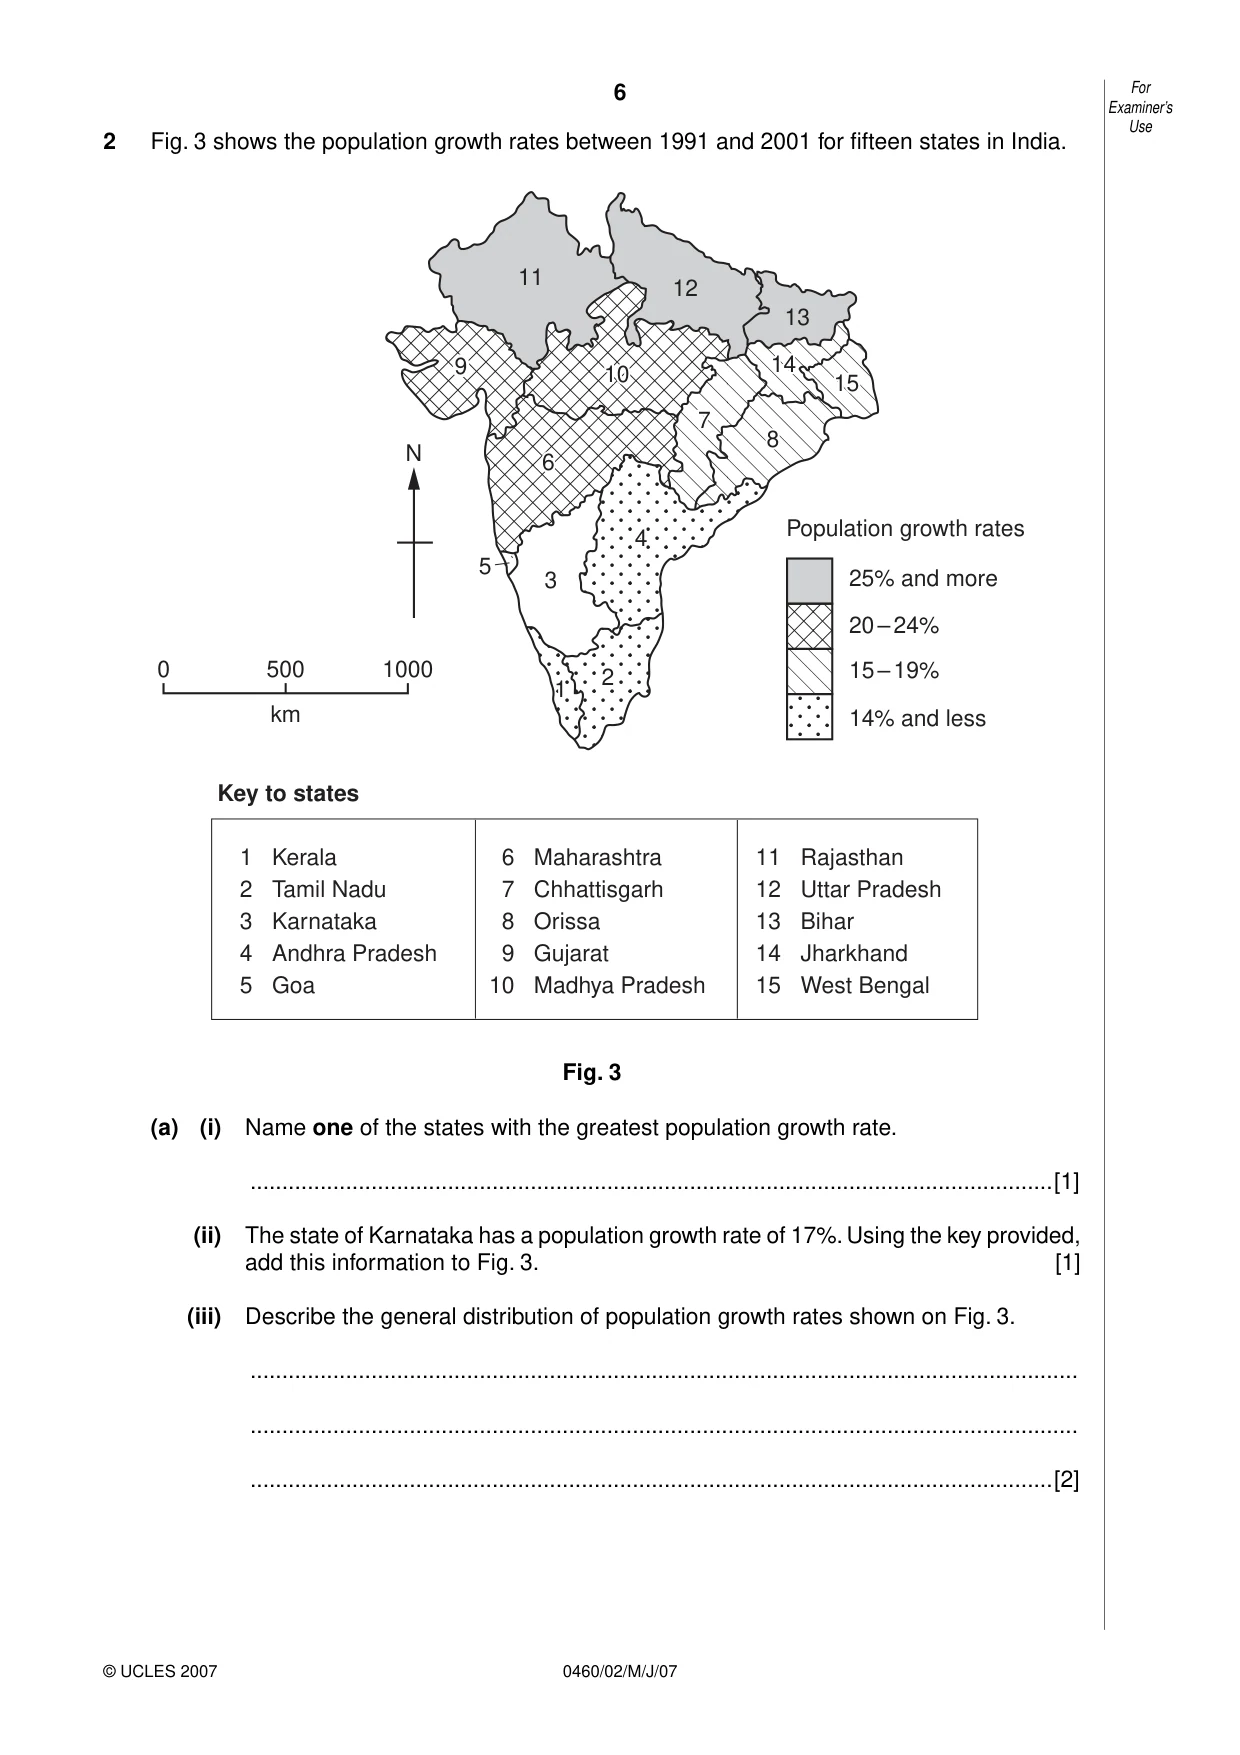
6 0460/02/M/J/07 For Examiner’s Use © UCLES 2007 2 Fig. 3 shows the population growth rates between 1991 and 2001 for fifteen states in India. 11 12 13 9 10 10 6 10 6 7 8 14 14 15 15 7 8 14 15 5 3 4 2 1 3 4 2 1 N 25% and more 20 – 24% 15 – 19% 14% and less Population growth rates Key to states 0 500 km 1000 1 Kerala 2 Tamil Nadu 3 Karnataka 4 Andhra Pradesh 5 Goa 6 Maharashtra 7 Chhattisgarh 8 Orissa 9 Gujarat 10 Madhya Pradesh 11 Rajasthan 12 Uttar Pradesh 13 Bihar 14 Jharkhand 15 West Bengal Fig. 3 (a) (i) Name one of the states with the greatest population growth rate. …[1] (ii) The state of Karnataka has a population growth rate of 17%. Using the key provided, add this information to Fig. 3. [1] (iii) Describe the general distribution of population growth rates shown on Fig. 3. … … …[2]
Question paper, page 7
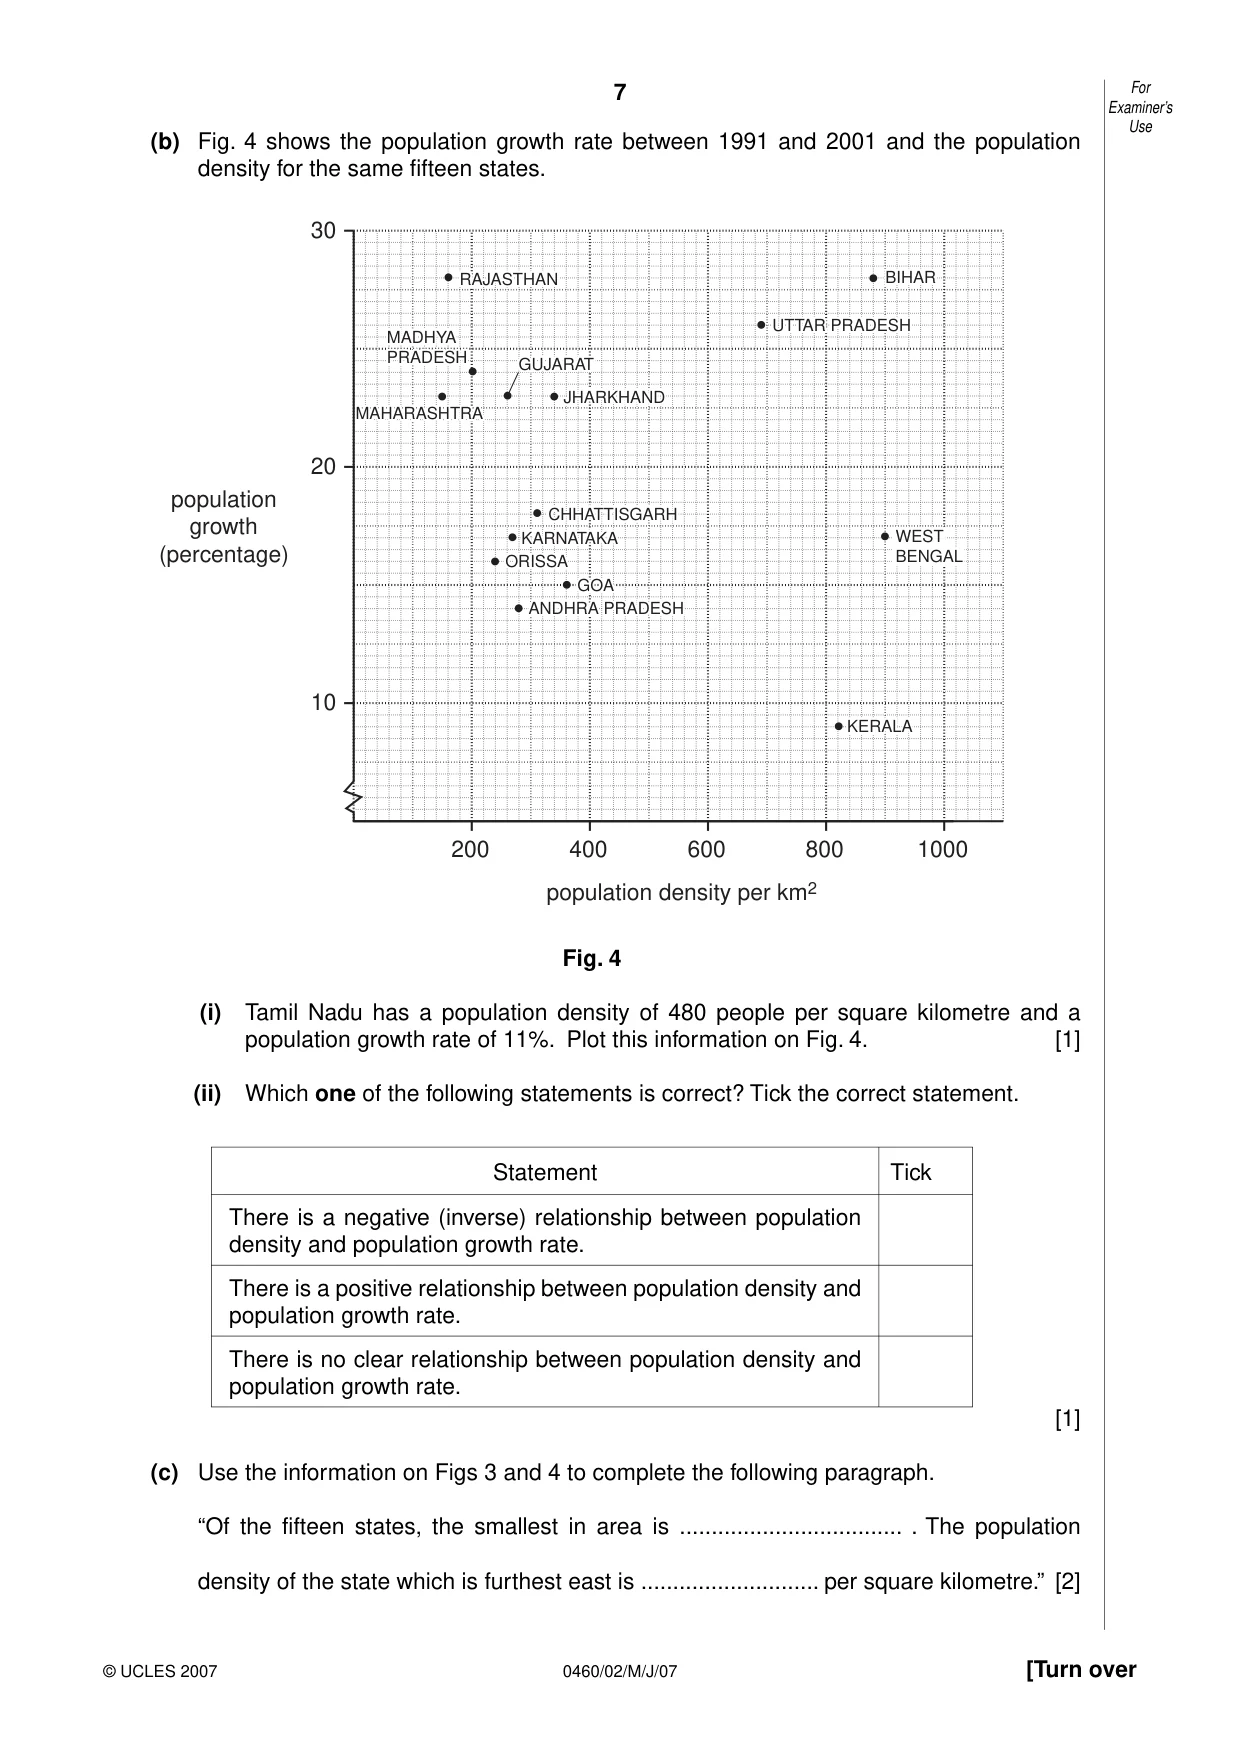
7 0460/02/M/J/07 [Turn over For Examiner’s Use © UCLES 2007 (b) Fig. 4 shows the population growth rate between 1991 and 2001 and the population density for the same fifteen states. KERALA KERALA UTTAR PRADESH UTTAR PRADESH BIHAR BIHAR GOA GOA KARNATAKA KARNATAKA ORISSA ORISSA MAHARASHTRA MAHARASHTRA CHHATTISGARH CHHATTISGARH GUJARAT GUJARAT JHARKHAND JHARKHAND RAJASTHAN RAJASTHAN MADHYA MADHYA PRADESH PRADESH ANDHRA PRADESH ANDHRA PRADESH 10 20 200 400 600 population density per km2 800 1000 30 population growth (percentage) KERALA UTTAR PRADESH BIHAR GOA KARNATAKA ORISSA MAHARASHTRA CHHATTISGARH GUJARAT JHARKHAND RAJASTHAN MADHYA PRADESH ANDHRA PRADESH WEST BENGAL Fig. 4 (i) Tamil Nadu has a population density of 480 people per square kilometre and a population growth rate of 11%. Plot this information on Fig. 4. [1] (ii) Which one of the following statements is correct? Tick the correct statement. Statement Tick There is a negative (inverse) relationship between population density and population growth rate. There is a positive relationship between population density and population growth rate. There is no clear relationship between population density and population growth rate. [1] (c) Use the information on Figs 3 and 4 to complete the following paragraph. “Of the fifteen states, the smallest in area is … . The population density of the state which is furthest east is … per square kilometre.” [2]
Question paper, page 8
8 0460/02/M/J/07 For Examiner’s Use © UCLES 2007 3 Photographs A and B (Insert) show two industrial sites in a town in northern England. (a) Describe the advantages of the site of the factory in Photograph A. … … … … … … …[3] (b) Describe the features of the site and buildings in Photograph B. Site … … Buildings … … … … … … … … …[5]
Question paper, page 10
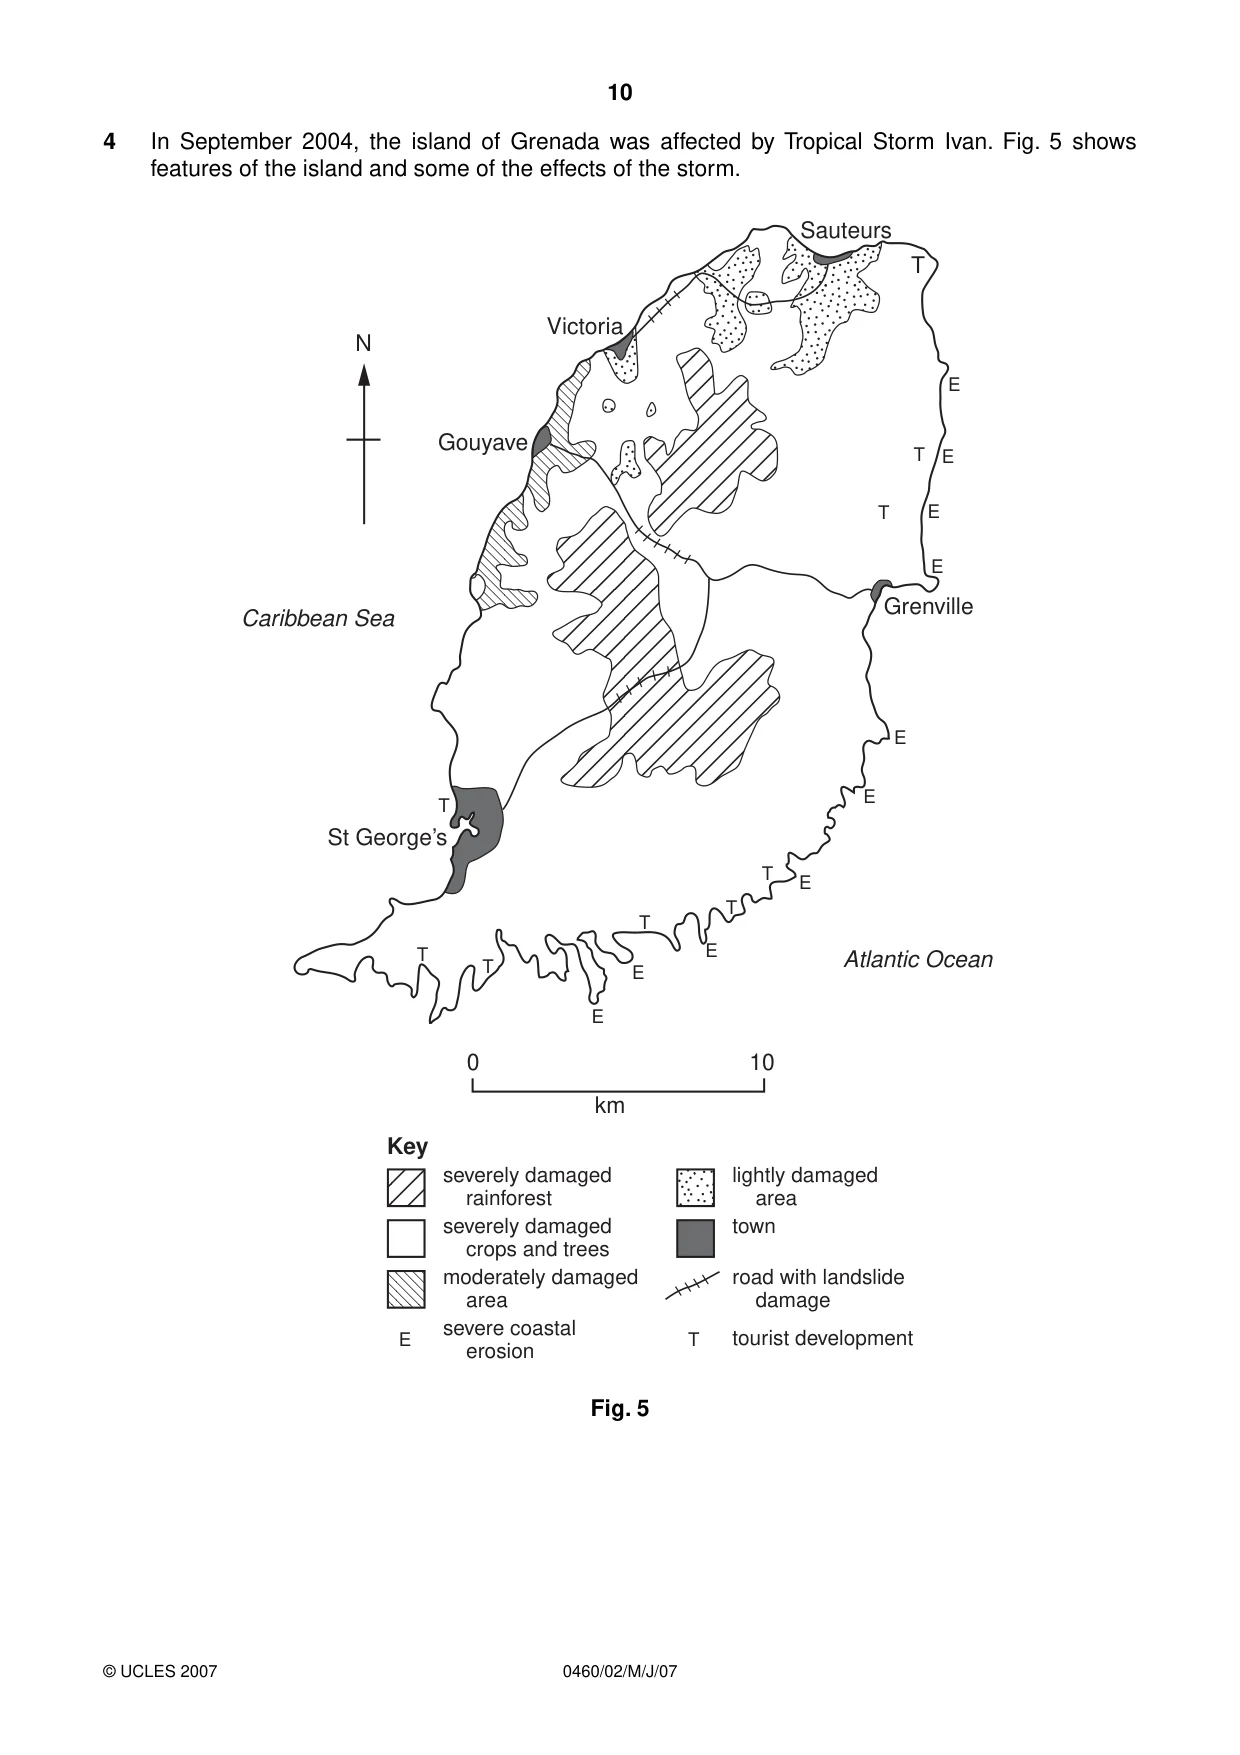
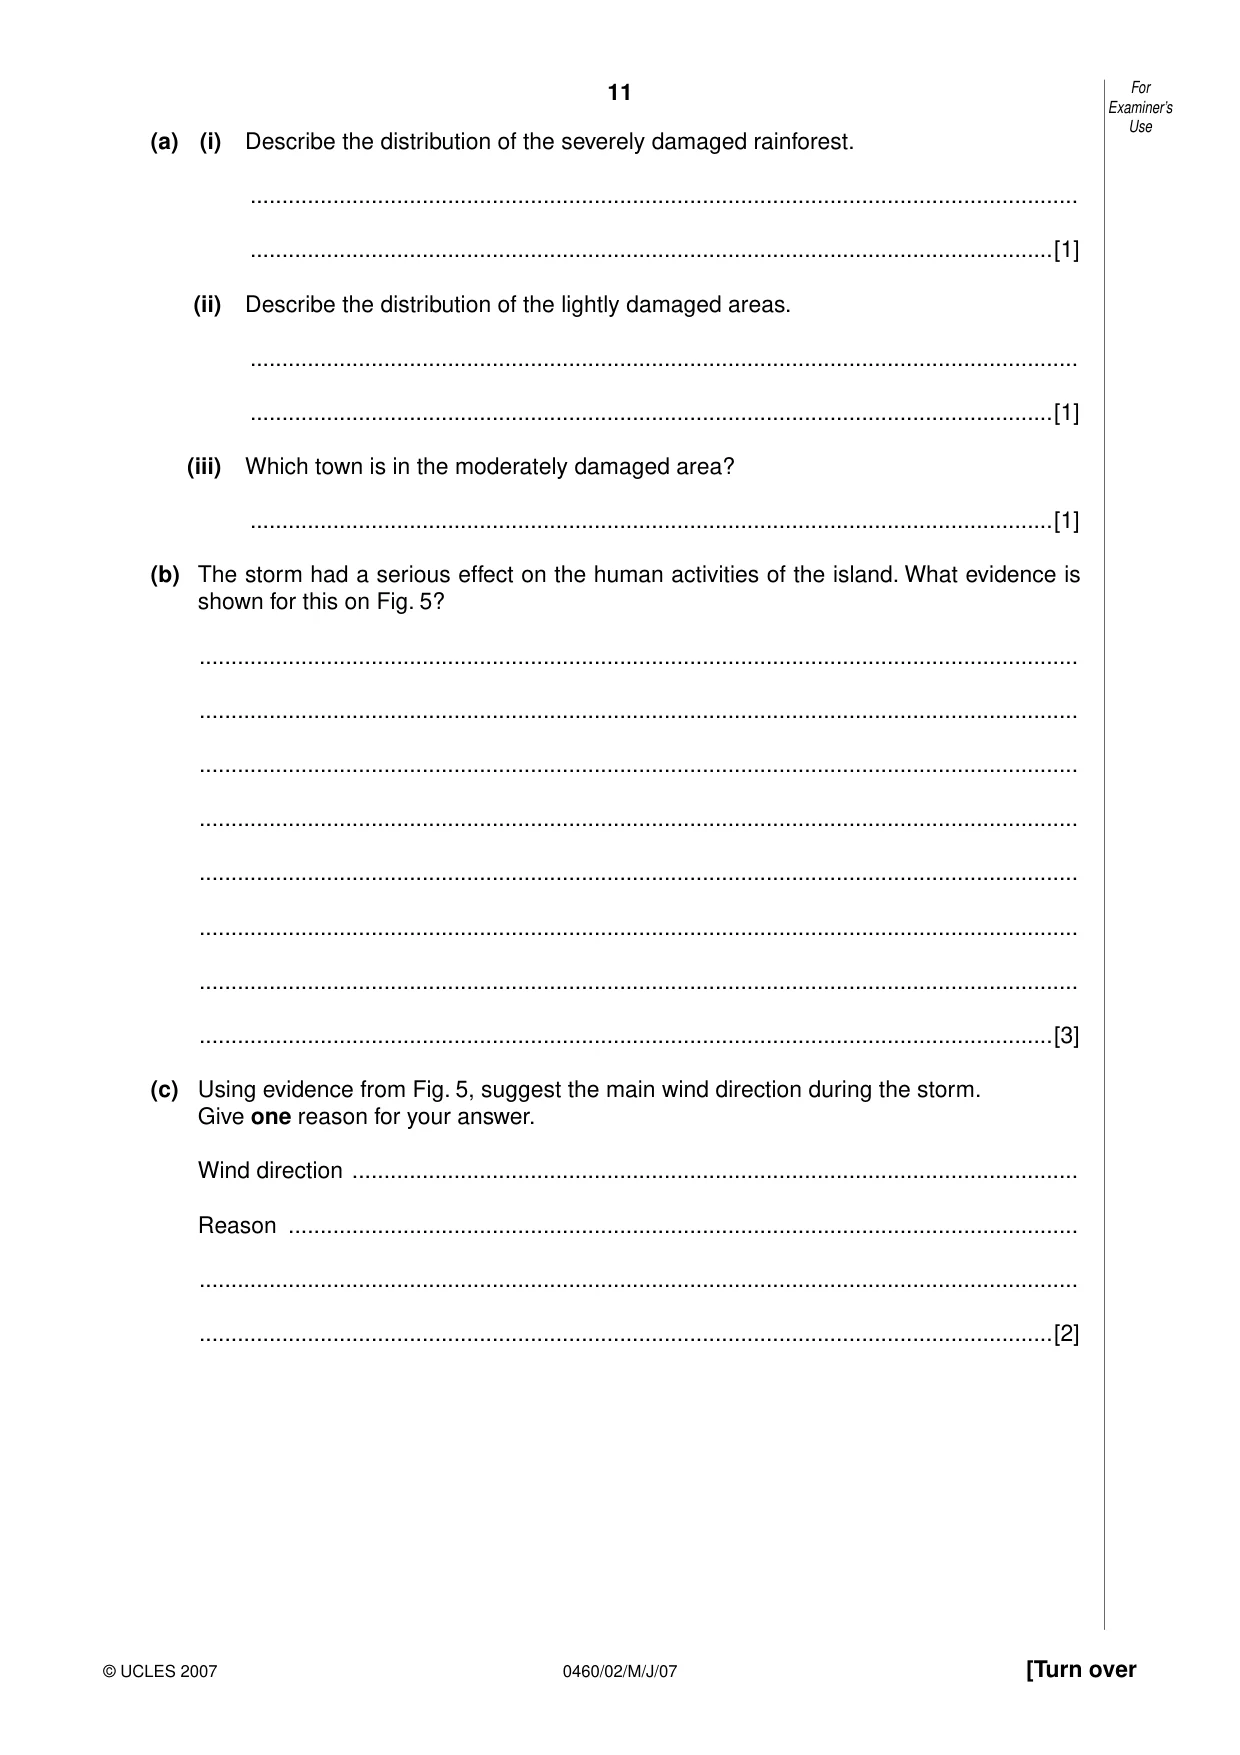
10 0460/02/M/J/07 © UCLES 2007 4 In September 2004, the island of Grenada was affected by Tropical Storm Ivan. Fig. 5 shows features of the island and some of the effects of the storm. Victoria Grenville Gouyave St George’s Sauteurs T T T T T T T T T E E E E E E E E E E E Caribbean Sea Atlantic Ocean N 0 10 km Key severely damaged rainforest severely damaged crops and trees moderately damaged area severe coastal erosion T lightly damaged area town road with landslide damage tourist development Fig. 5
Question paper, page 11
11 0460/02/M/J/07 [Turn over For Examiner’s Use © UCLES 2007 (a) (i) Describe the distribution of the severely damaged rainforest. … …[1] (ii) Describe the distribution of the lightly damaged areas. … …[1] (iii) Which town is in the moderately damaged area? …[1] (b) The storm had a serious effect on the human activities of the island. What evidence is shown for this on Fig. 5? … … … … … … … …[3] (c) Using evidence from Fig. 5, suggest the main wind direction during the storm. Give one reason for your answer. Wind direction … Reason … … …[2]
Question paper, page 12
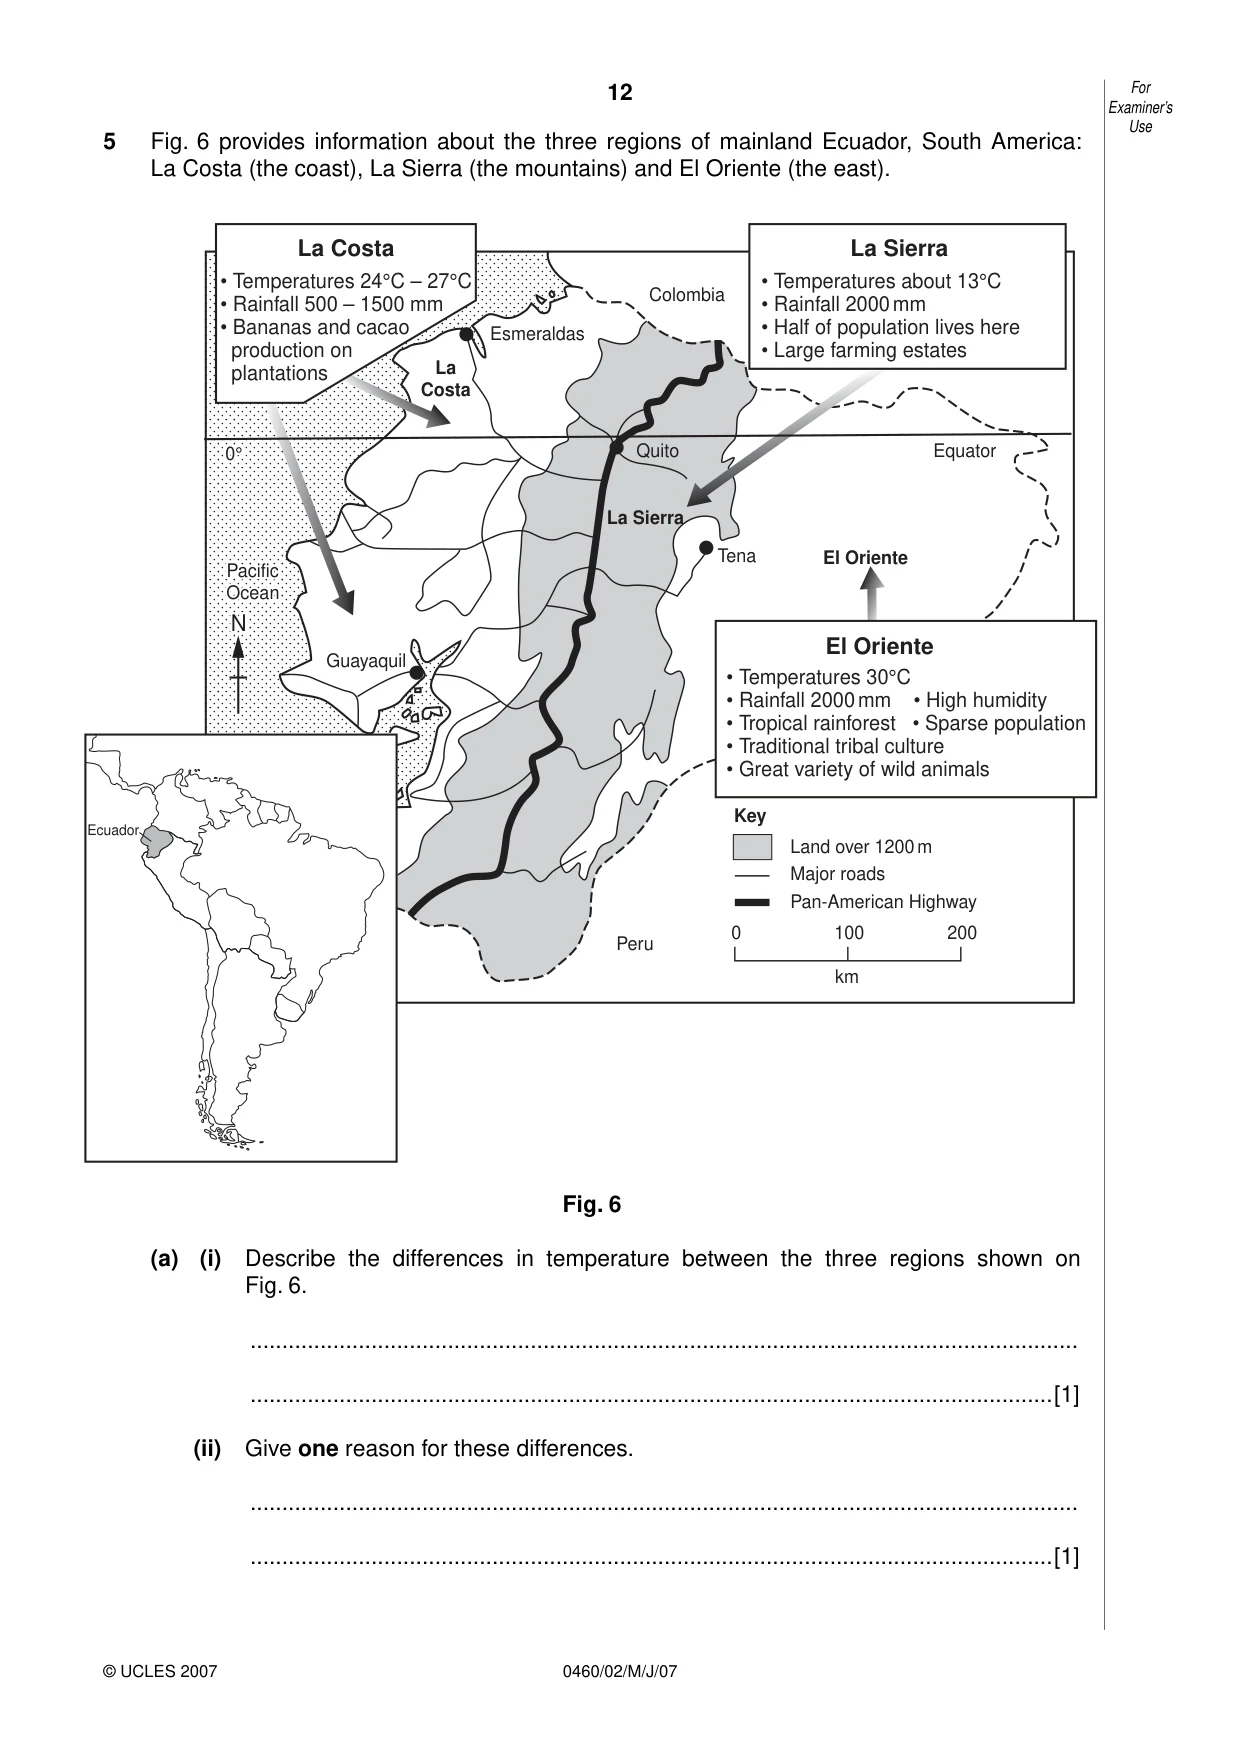
12 0460/02/M/J/07 For Examiner’s Use © UCLES 2007 5 Fig. 6 provides information about the three regions of mainland Ecuador, South America: La Costa (the coast), La Sierra (the mountains) and El Oriente (the east). La Costa • Temperatures 24°C – 27°C • Rainfall 500 – 1500 mm • Bananas and cacao production on plantations La Costa Quito Equator El Oriente La Sierra Guayaquil Esmeraldas Colombia Pacific Pacific Ocean Ocean 0° 0° N Ecuador Tena Peru Key Land over 1200 m Major roads Pan-American Highway 0 100 km 200 Pacific Ocean 0° N La Sierra • Temperatures about 13°C • Rainfall 2000 mm • Half of population lives here • Large farming estates El Oriente • Temperatures 30°C • Rainfall 2000 mm • High humidity • Tropical rainforest • Sparse population • Traditional tribal culture • Great variety of wild animals Fig. 6 (a) (i) Describe the differences in temperature between the three regions shown on Fig. 6. … …[1] (ii) Give one reason for these differences. … …[1]
Question paper, page 13
13 0460/02/M/J/07 [Turn over For Examiner’s Use © UCLES 2007 (b) Describe the road transport network of La Costa and La Sierra regions. … … … …[2] (c) In 1967 oil was discovered in El Oriente. (i) Using evidence from Fig. 6 only, explain the difficulties in exploiting oil in El Oriente. … … … … … … … … … … …[3] (ii) Using evidence from Fig. 6 only, suggest one problem which could be created by economic development of El Oriente. … … …[1]
Question paper, page 14
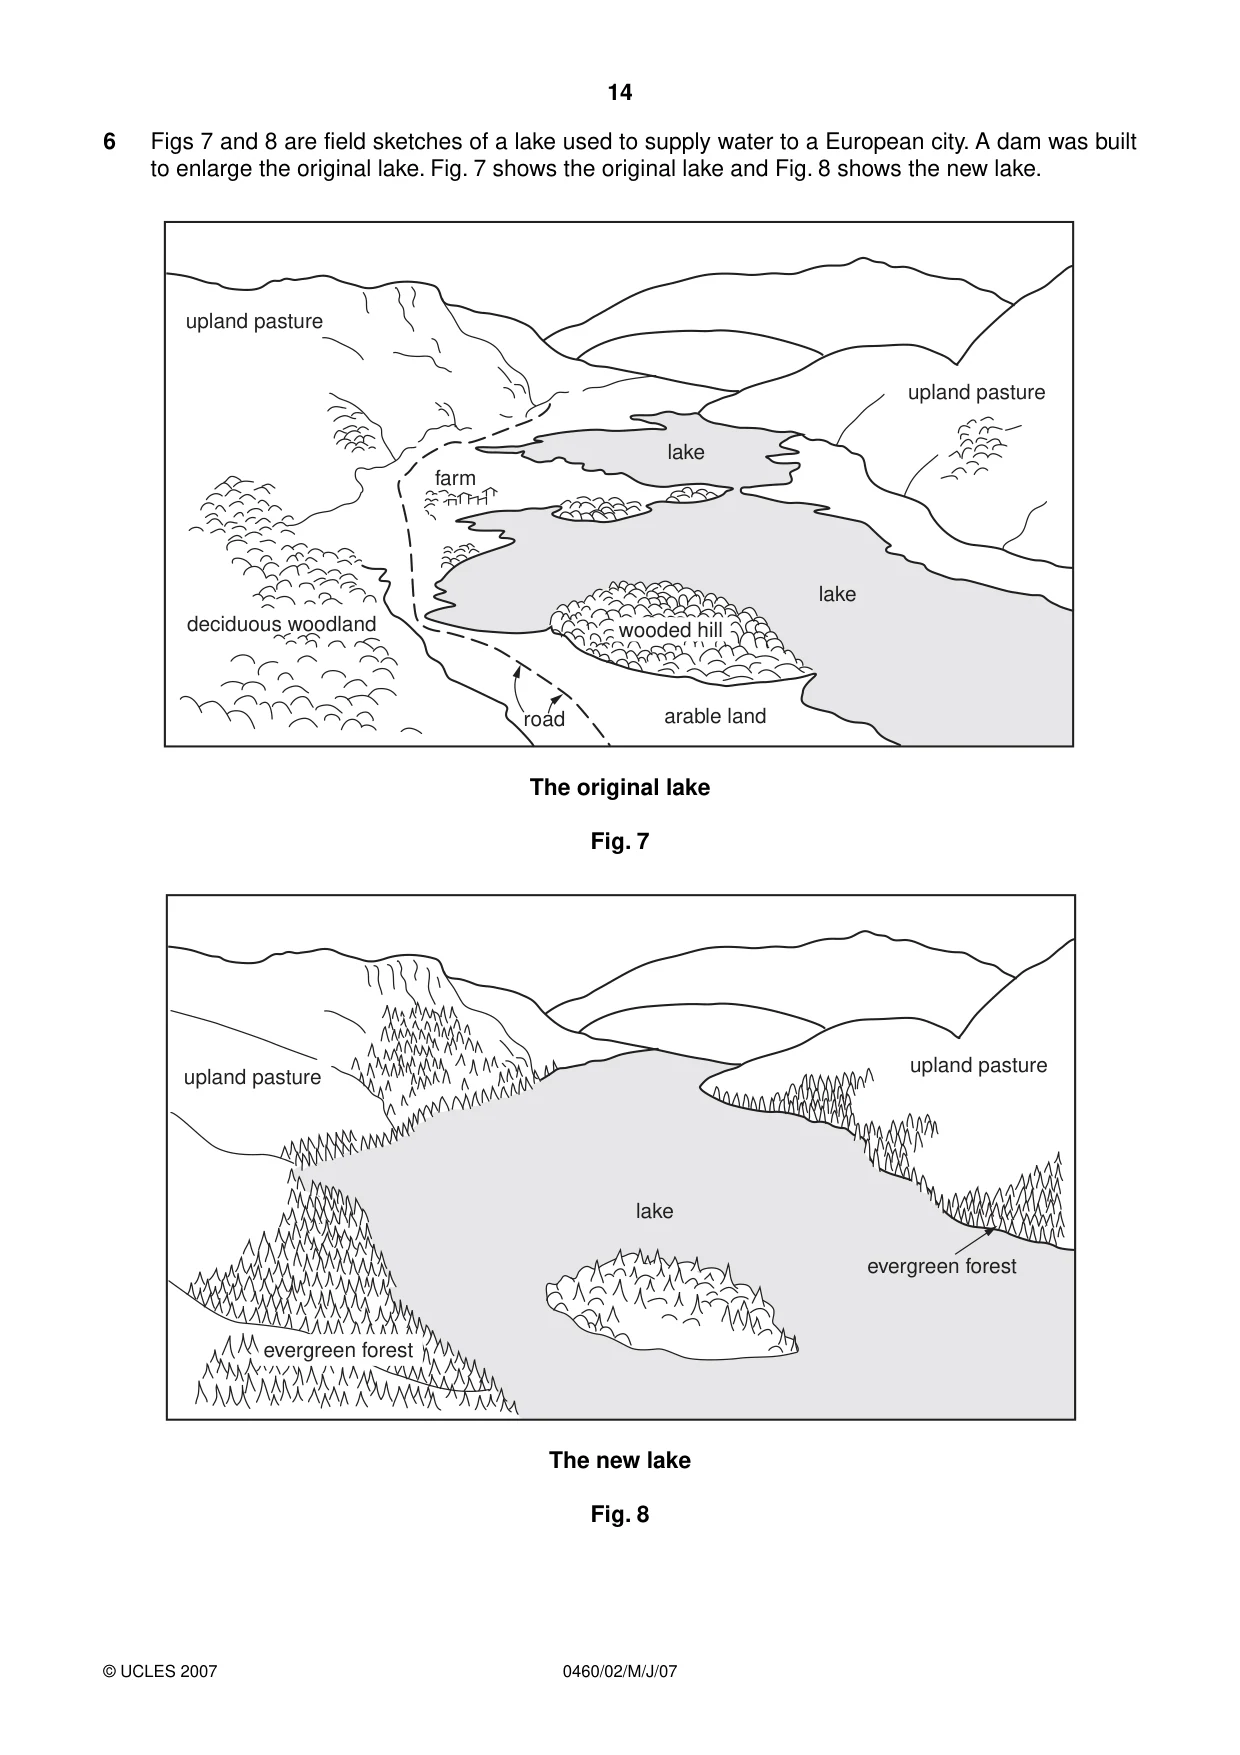
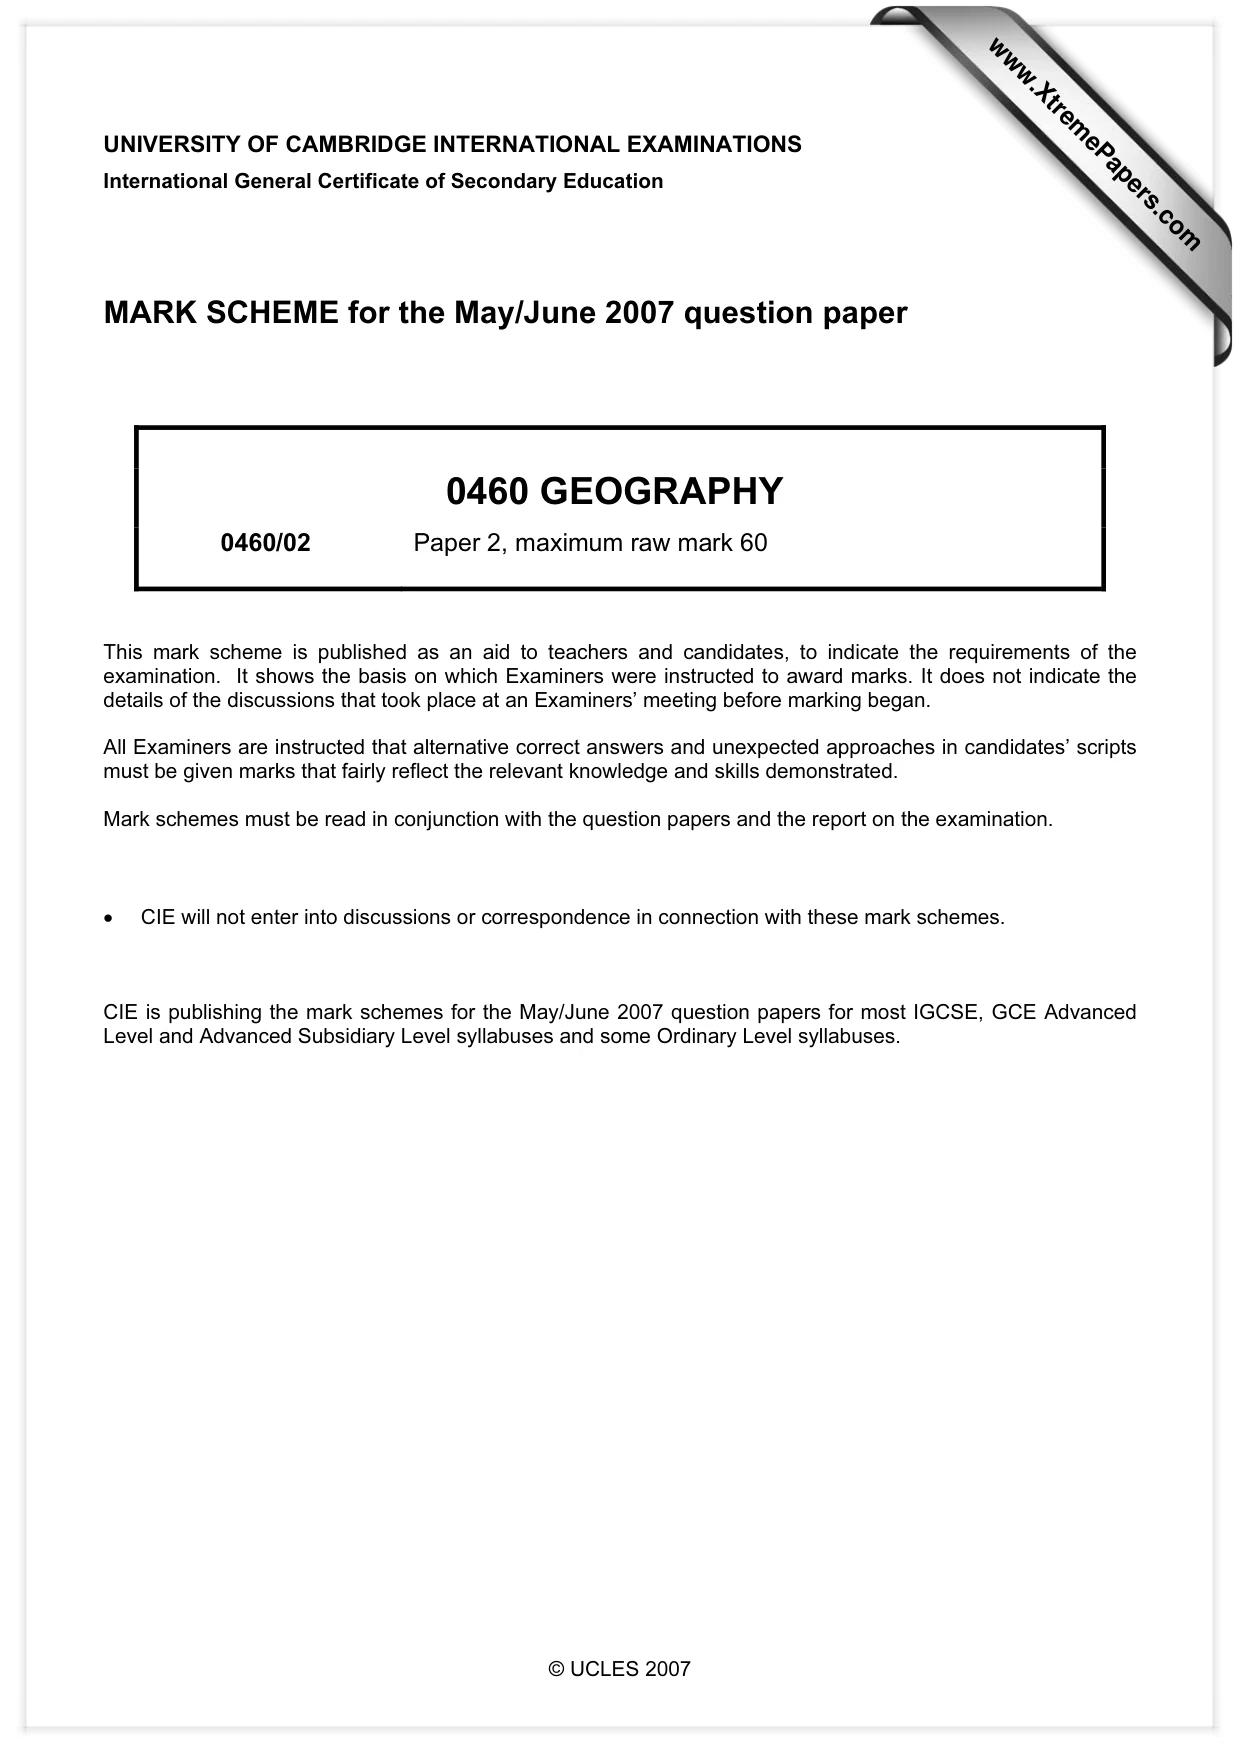
14 0460/02/M/J/07 © UCLES 2007 6 Figs 7 and 8 are field sketches of a lake used to supply water to a European city. A dam was built to enlarge the original lake. Fig. 7 shows the original lake and Fig. 8 shows the new lake. upland pasture upland pasture arable land farm lake lake wooded hill deciduous woodland road The original lake Fig. 7 upland pasture upland pasture evergreen forest lake evergreen forest The new lake Fig. 8
Question paper, page 15
15 0460/02/M/J/07 For Examiner’s Use © UCLES 2007 (a) Look at the wooded hill shown on Fig. 7. What happened to the hill when the lake was enlarged? … …[1] (b) Describe the advantages of the area shown in Figs 7 and 8 for water supply. … … … …[2] (c) Using evidence from Figs 7 and 8 only, suggest the likely effects of changes in the area on local farmers and tourists. Local farmers … … … … … … … Tourists … … … … … … …[5]
Question paper, page 16
16 0460/02/M/J/07 BLANK PAGE Copyright Acknowledgements: Photograph A D. Kelly © UCLES. Photograph B D. Kelly © UCLES. Question 5 Fig. 6 © Michael Naish (Editor), Sue Warn (Editor); Geography 16-19 Options: Core; Pearson Education Ltd; 1994. Question 6 Fig. 7 & Fig. 8; D. Kelly © UCLES. Permission to reproduce items where third-party owned material protected by copyright is included has been sought and cleared where possible. Every reasonable effort has been made by the publisher (UCLES) to trace copyright holders, but if any items requiring clearance have unwittingly been included, the publisher will be pleased to make amends at the earliest possible opportunity. University of Cambridge International Examinations is part of the Cambridge Assessment Group. Cambridge Assessment is the brand name of University of Cambridge Local Examinations Syndicate (UCLES), which is itself a department of the University of Cambridge.
Mark scheme, page 1
© UCLES 2007 UNIVERSITY OF CAMBRIDGE INTERNATIONAL EXAMINATIONS International General Certificate of Secondary Education MARK SCHEME for the May/June 2007 question paper 0460 GEOGRAPHY 0460/02 Paper 2, maximum raw mark 60 This mark scheme is published as an aid to teachers and candidates, to indicate the requirements of the examination. It shows the basis on which Examiners were instructed to award marks. It does not indicate the details of the discussions that took place at an Examiners’ meeting before marking began. All Examiners are instructed that alternative correct answers and unexpected approaches in candidates’ scripts must be given marks that fairly reflect the relevant knowledge and skills demonstrated. Mark schemes must be read in conjunction with the question papers and the report on the examination. • CIE will not enter into discussions or correspondence in connection with these mark schemes. CIE is publishing the mark schemes for the May/June 2007 question papers for most IGCSE, GCE Advanced Level and Advanced Subsidiary Level syllabuses and some Ordinary Level syllabuses. www.XtremePapers.com
Mark scheme, page 2
Page 2 Mark Scheme Syllabus Paper IGCSE – May/June 2007 0460 02 © UCLES 2007 1 (a) (i) (River du) Rempart, (ii) Barachois, (iii) playground, temple, school, church, village hall, hotel, market, dispensary, post office. 2 services = 1 mark Name of feature needed. Mark first two given. (iv) sugar/plantation - sugar, (v) main A, (vi) scattered trees/scrub, (vii) minor trigonometrical station, (viii) riverine trees. [8] (b) (i) river mouth, bay, Baie du Tamarin, Grand Rivière Noire Bay, Barachois, public beach, Riv Noire. [1] (ii) silt/sediment (from river), shelter/low energy, low salinity/fresh water. Allow a variety of expressions. [1]
Mark scheme, page 3
Page 3 Mark Scheme Syllabus Paper IGCSE – May/June 2007 0460 02 © UCLES 2007 (c) (i) H, (ii) F, (two options) (iii) C. Part of the letter to be within tolerance. Allow other forms of labelling if clear. [3] (d) coral, beach, mountain scenery, road access, filaos/casuarina, hotel, jetty, slipway. [2]
Mark scheme, page 4
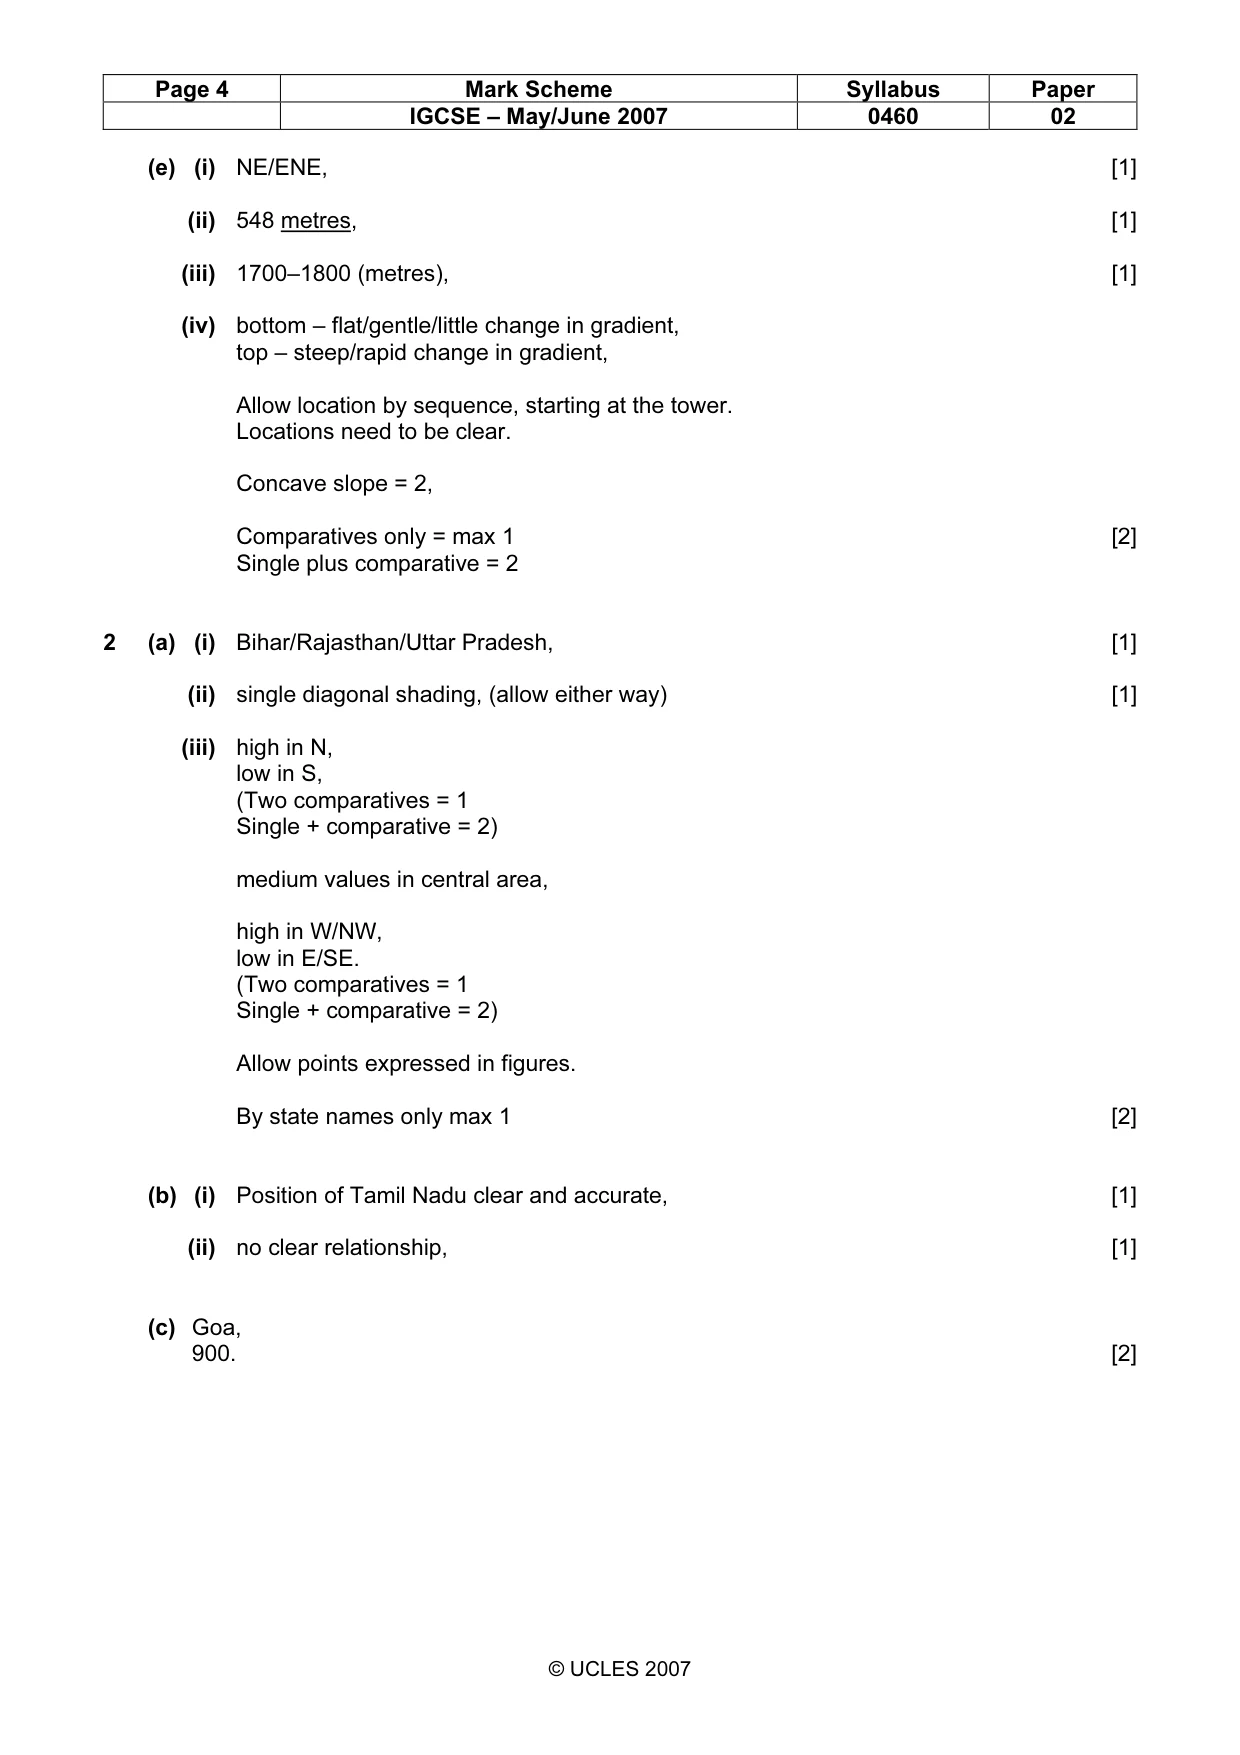
Page 4 Mark Scheme Syllabus Paper IGCSE – May/June 2007 0460 02 © UCLES 2007 (e) (i) NE/ENE, [1] (ii) 548 metres, [1] (iii) 1700–1800 (metres), [1] (iv) bottom – flat/gentle/little change in gradient, top – steep/rapid change in gradient, Allow location by sequence, starting at the tower. Locations need to be clear. Concave slope = 2, Comparatives only = max 1 [2] Single plus comparative = 2 2 (a) (i) Bihar/Rajasthan/Uttar Pradesh, [1] (ii) single diagonal shading, (allow either way) [1] (iii) high in N, low in S, (Two comparatives = 1 Single + comparative = 2) medium values in central area, high in W/NW, low in E/SE. (Two comparatives = 1 Single + comparative = 2) Allow points expressed in figures. By state names only max 1 [2] (b) (i) Position of Tamil Nadu clear and accurate, [1] (ii) no clear relationship, [1] (c) Goa, 900. [2]
Mark scheme, page 5
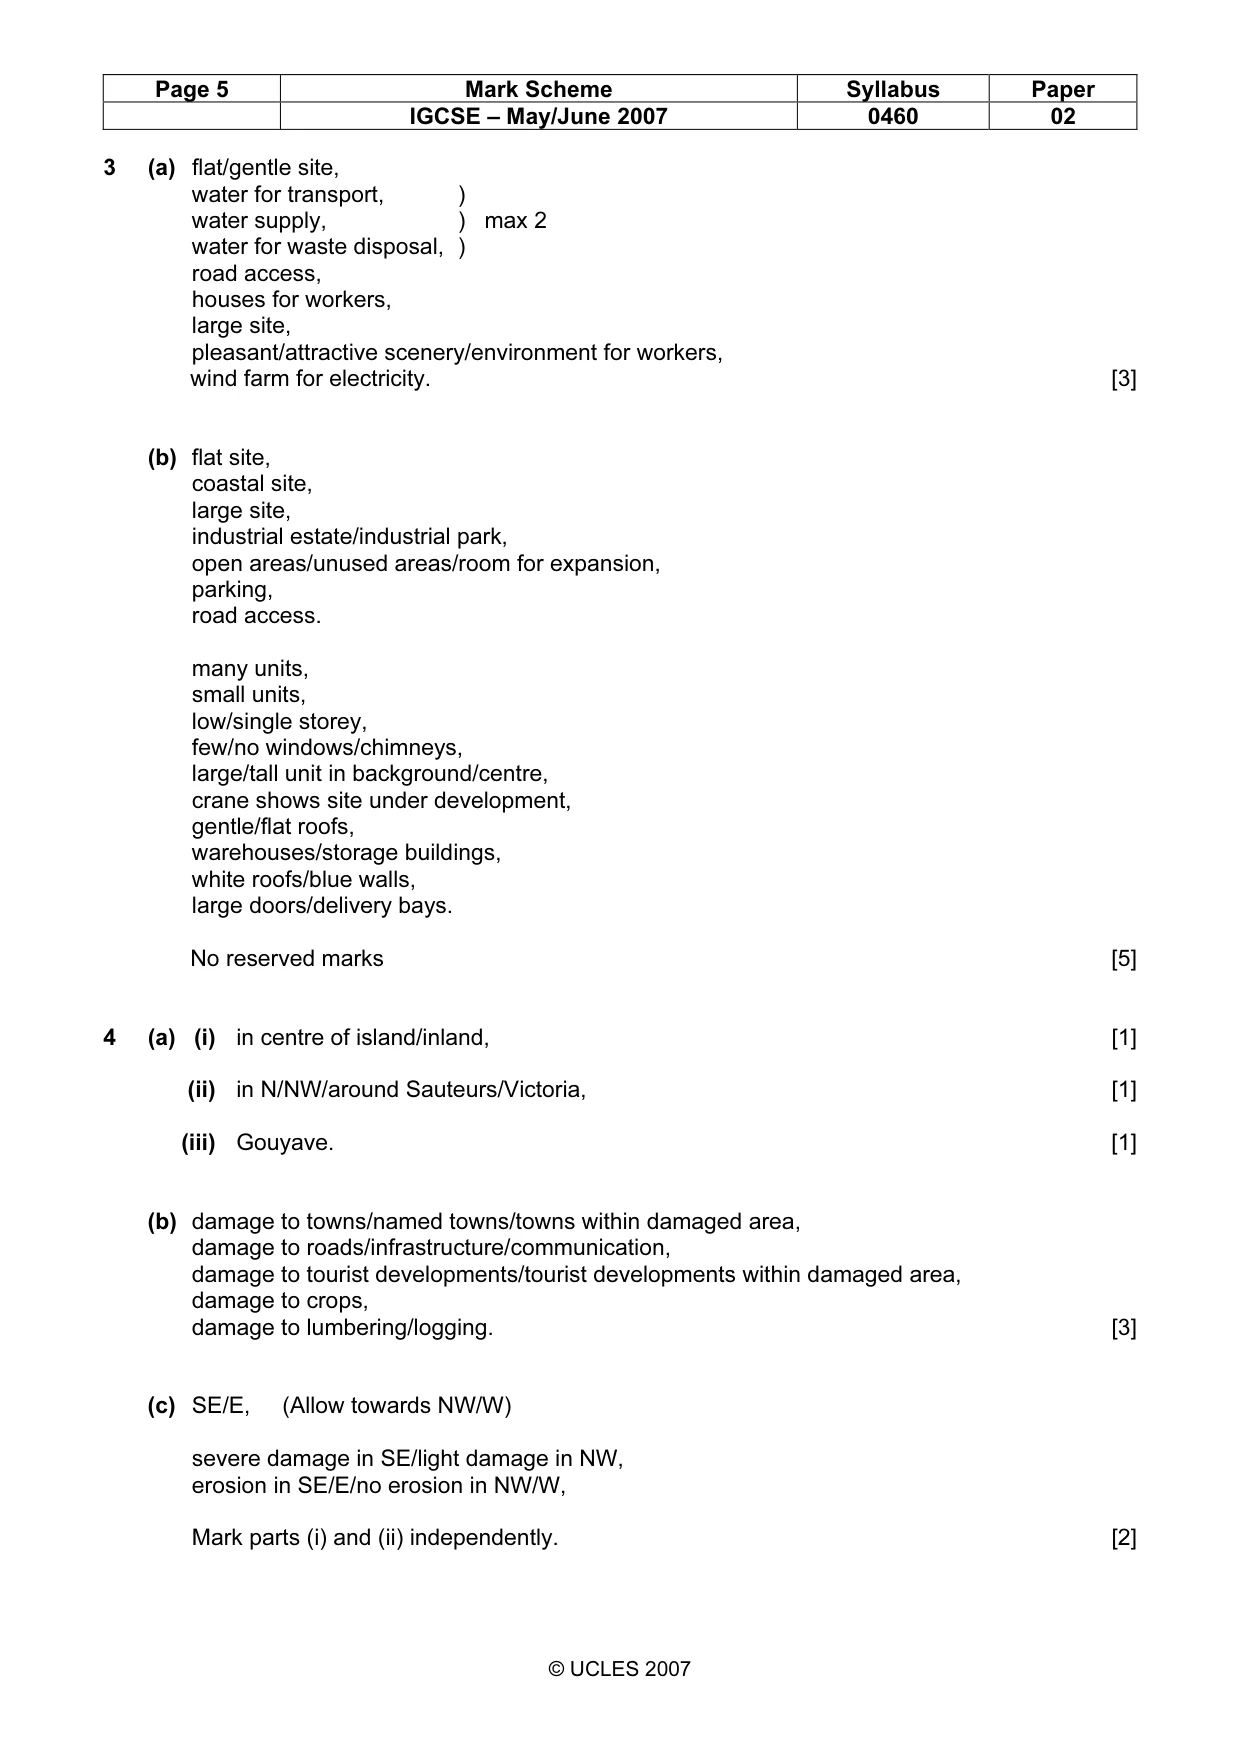
Page 5 Mark Scheme Syllabus Paper IGCSE – May/June 2007 0460 02 © UCLES 2007 3 (a) flat/gentle site, water for transport, ) water supply, ) max 2 water for waste disposal, ) road access, houses for workers, large site, pleasant/attractive scenery/environment for workers, wind farm for electricity. [3] (b) flat site, coastal site, large site, industrial estate/industrial park, open areas/unused areas/room for expansion, parking, road access. many units, small units, low/single storey, few/no windows/chimneys, large/tall unit in background/centre, crane shows site under development, gentle/flat roofs, warehouses/storage buildings, white roofs/blue walls, large doors/delivery bays. No reserved marks [5] 4 (a) (i) in centre of island/inland, [1] (ii) in N/NW/around Sauteurs/Victoria, [1] (iii) Gouyave. [1] (b) damage to towns/named towns/towns within damaged area, damage to roads/infrastructure/communication, damage to tourist developments/tourist developments within damaged area, damage to crops, damage to lumbering/logging. [3] (c) SE/E, (Allow towards NW/W) severe damage in SE/light damage in NW, erosion in SE/E/no erosion in NW/W, Mark parts (i) and (ii) independently. [2]
Mark scheme, page 6
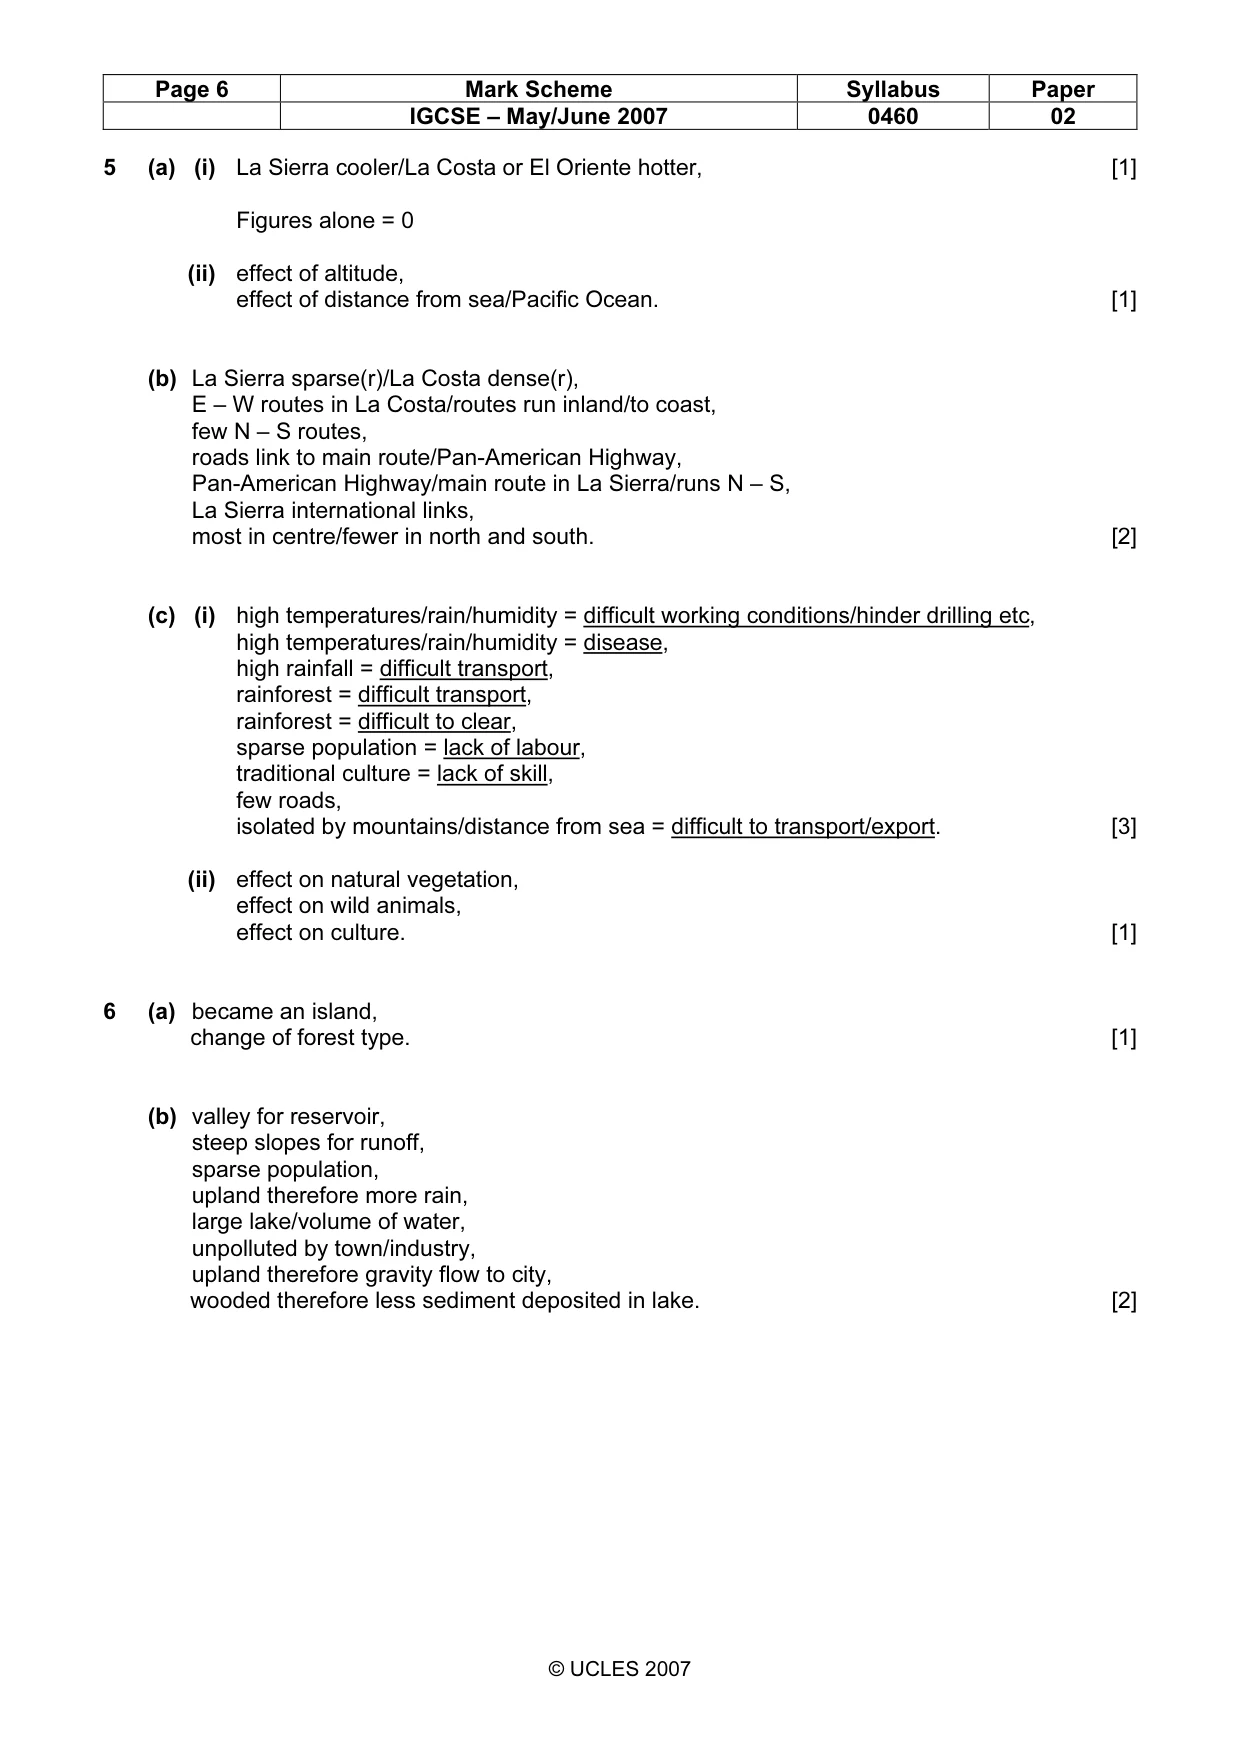
Page 6 Mark Scheme Syllabus Paper IGCSE – May/June 2007 0460 02 © UCLES 2007 5 (a) (i) La Sierra cooler/La Costa or El Oriente hotter, [1] Figures alone = 0 (ii) effect of altitude, effect of distance from sea/Pacific Ocean. [1] (b) La Sierra sparse(r)/La Costa dense(r), E – W routes in La Costa/routes run inland/to coast, few N – S routes, roads link to main route/Pan-American Highway, Pan-American Highway/main route in La Sierra/runs N – S, La Sierra international links, most in centre/fewer in north and south. [2] (c) (i) high temperatures/rain/humidity = difficult working conditions/hinder drilling etc, high temperatures/rain/humidity = disease, high rainfall = difficult transport, rainforest = difficult transport, rainforest = difficult to clear, sparse population = lack of labour, traditional culture = lack of skill, few roads, isolated by mountains/distance from sea = difficult to transport/export. [3] (ii) effect on natural vegetation, effect on wild animals, effect on culture. [1] 6 (a) became an island, change of forest type. [1] (b) valley for reservoir, steep slopes for runoff, sparse population, upland therefore more rain, large lake/volume of water, unpolluted by town/industry, upland therefore gravity flow to city, wooded therefore less sediment deposited in lake. [2]
Mark scheme, page 7
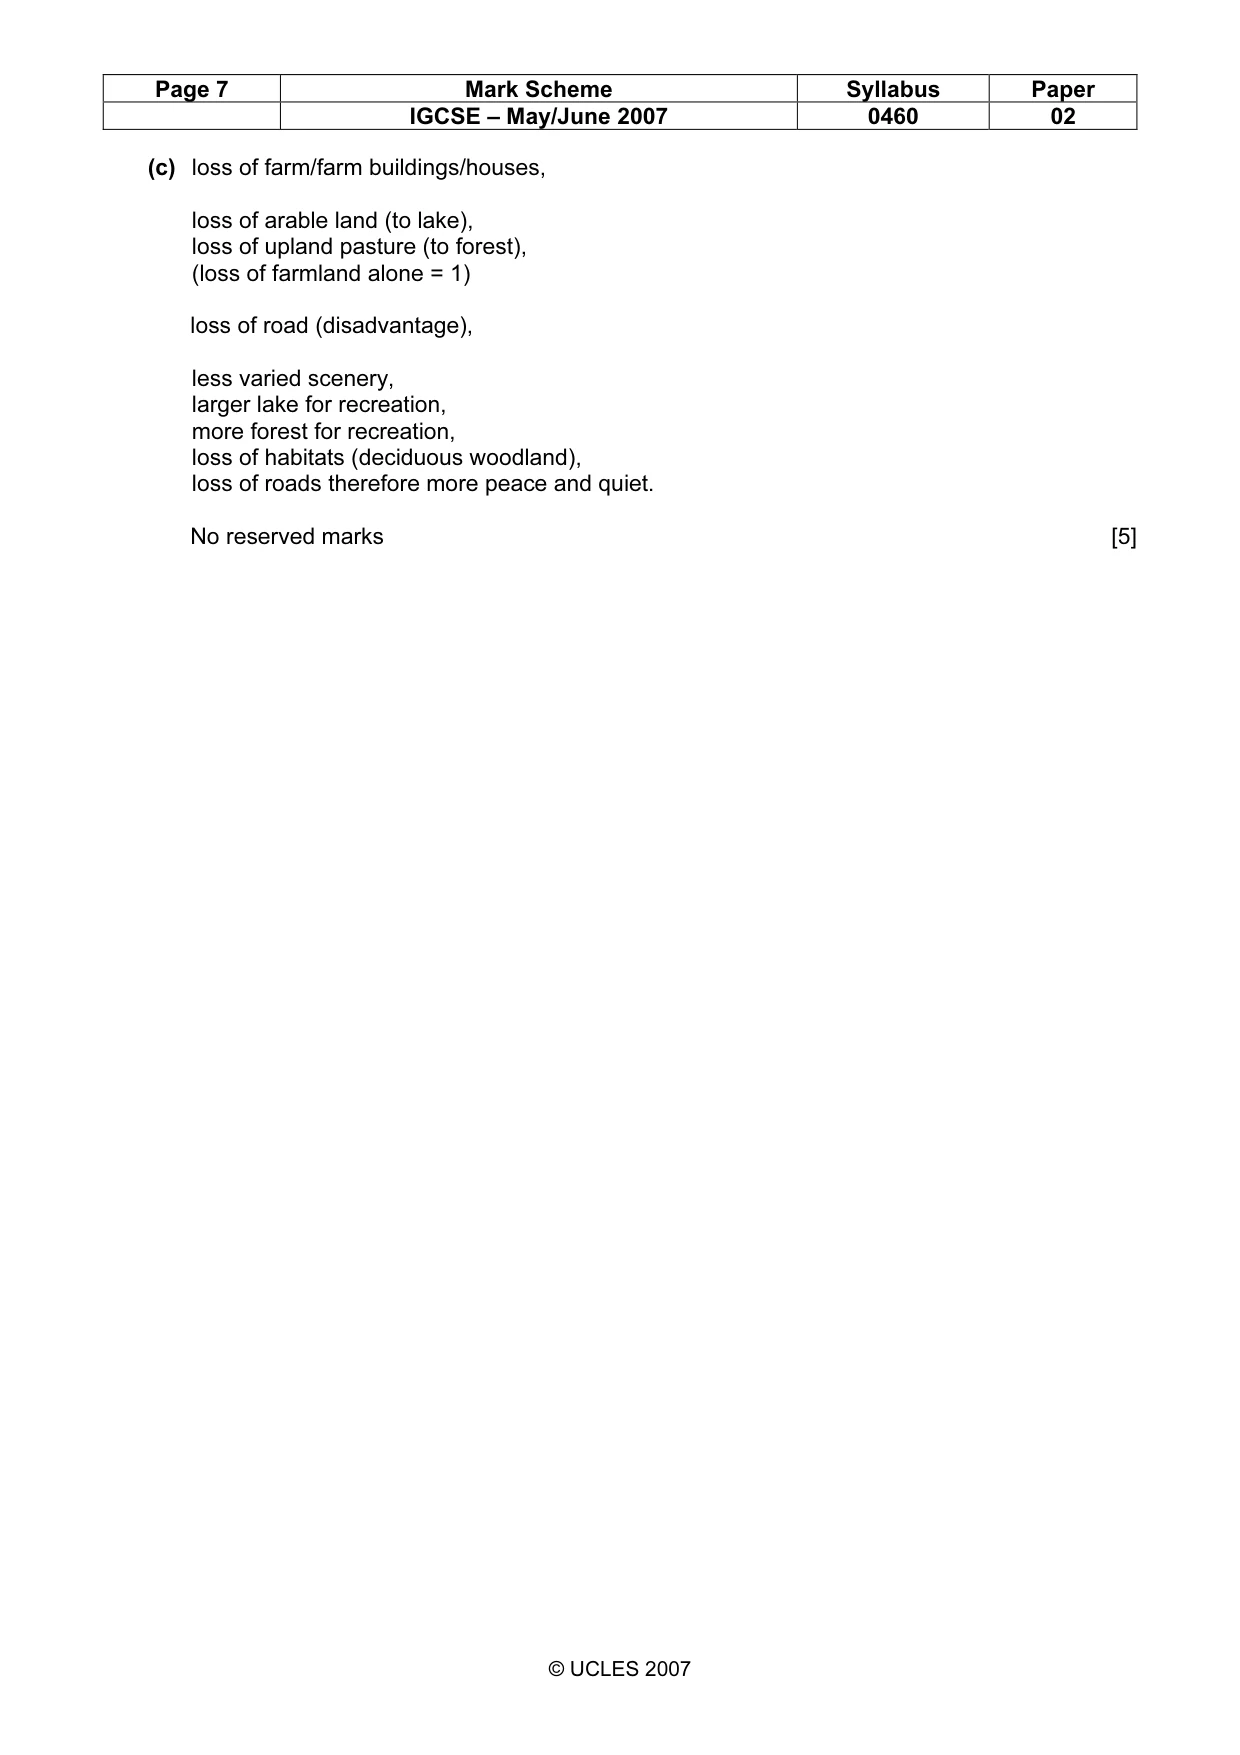
Page 7 Mark Scheme Syllabus Paper IGCSE – May/June 2007 0460 02 © UCLES 2007 (c) loss of farm/farm buildings/houses, loss of arable land (to lake), loss of upland pasture (to forest), (loss of farmland alone = 1) loss of road (disadvantage), less varied scenery, larger lake for recreation, more forest for recreation, loss of habitats (deciduous woodland), loss of roads therefore more peace and quiet. No reserved marks [5]
What you needed in this session
Cambridge’s own grade thresholds for 2007 May/June, Paper 2 · Variant 1. A higher threshold means an easier paper — the bar moves with how the cohort did.