Cambridge IGCSE Geography 0460 — 2006 Oct/Nov Paper 4 · Variant 1
0460/41/O/N/06 · 60 marks · ≈68 min
The question paper and its mark scheme, free to read here and free to download. This is Cambridge’s own paper, exactly as it was sat.
Question paper12 pages



Mark scheme4 pages
Answers below. Sit the paper first if you are practising.
Paper as text
Question paper, page 1
This document consists of 12 printed pages. SP (SLM/CGW) T06097/5 © UCLES 2006 [Turn over UNIVERSITY OF CAMBRIDGE INTERNATIONAL EXAMINATIONS International General Certificate of Secondary Education GEOGRAPHY 0460/04 Paper 4 Alternative to Coursework October/November 2006 1 hour 30 minutes Candidates answer on the Question Paper. Additional Materials: Calculator Protractor Ruler READ THESE INSTRUCTIONS FIRST Write your Centre number, candidate number and name on all the work you hand in. Write in dark blue or black pen. You may use a soft pencil for any diagrams, graphs or rough working. Do not use staples, paper clips, highlighters, glue or correction fluid. Answer all questions. Sketch maps and diagrams should be drawn whenever they serve to illustrate an answer. At the end of the examination, fasten all your work securely together. The number of marks is given in brackets [ ] at the end of each question or part question. Centre Number Candidate Number Name For Examiner’s Use Q1 Q2 Total www.XtremePapers.com
Question paper, page 2
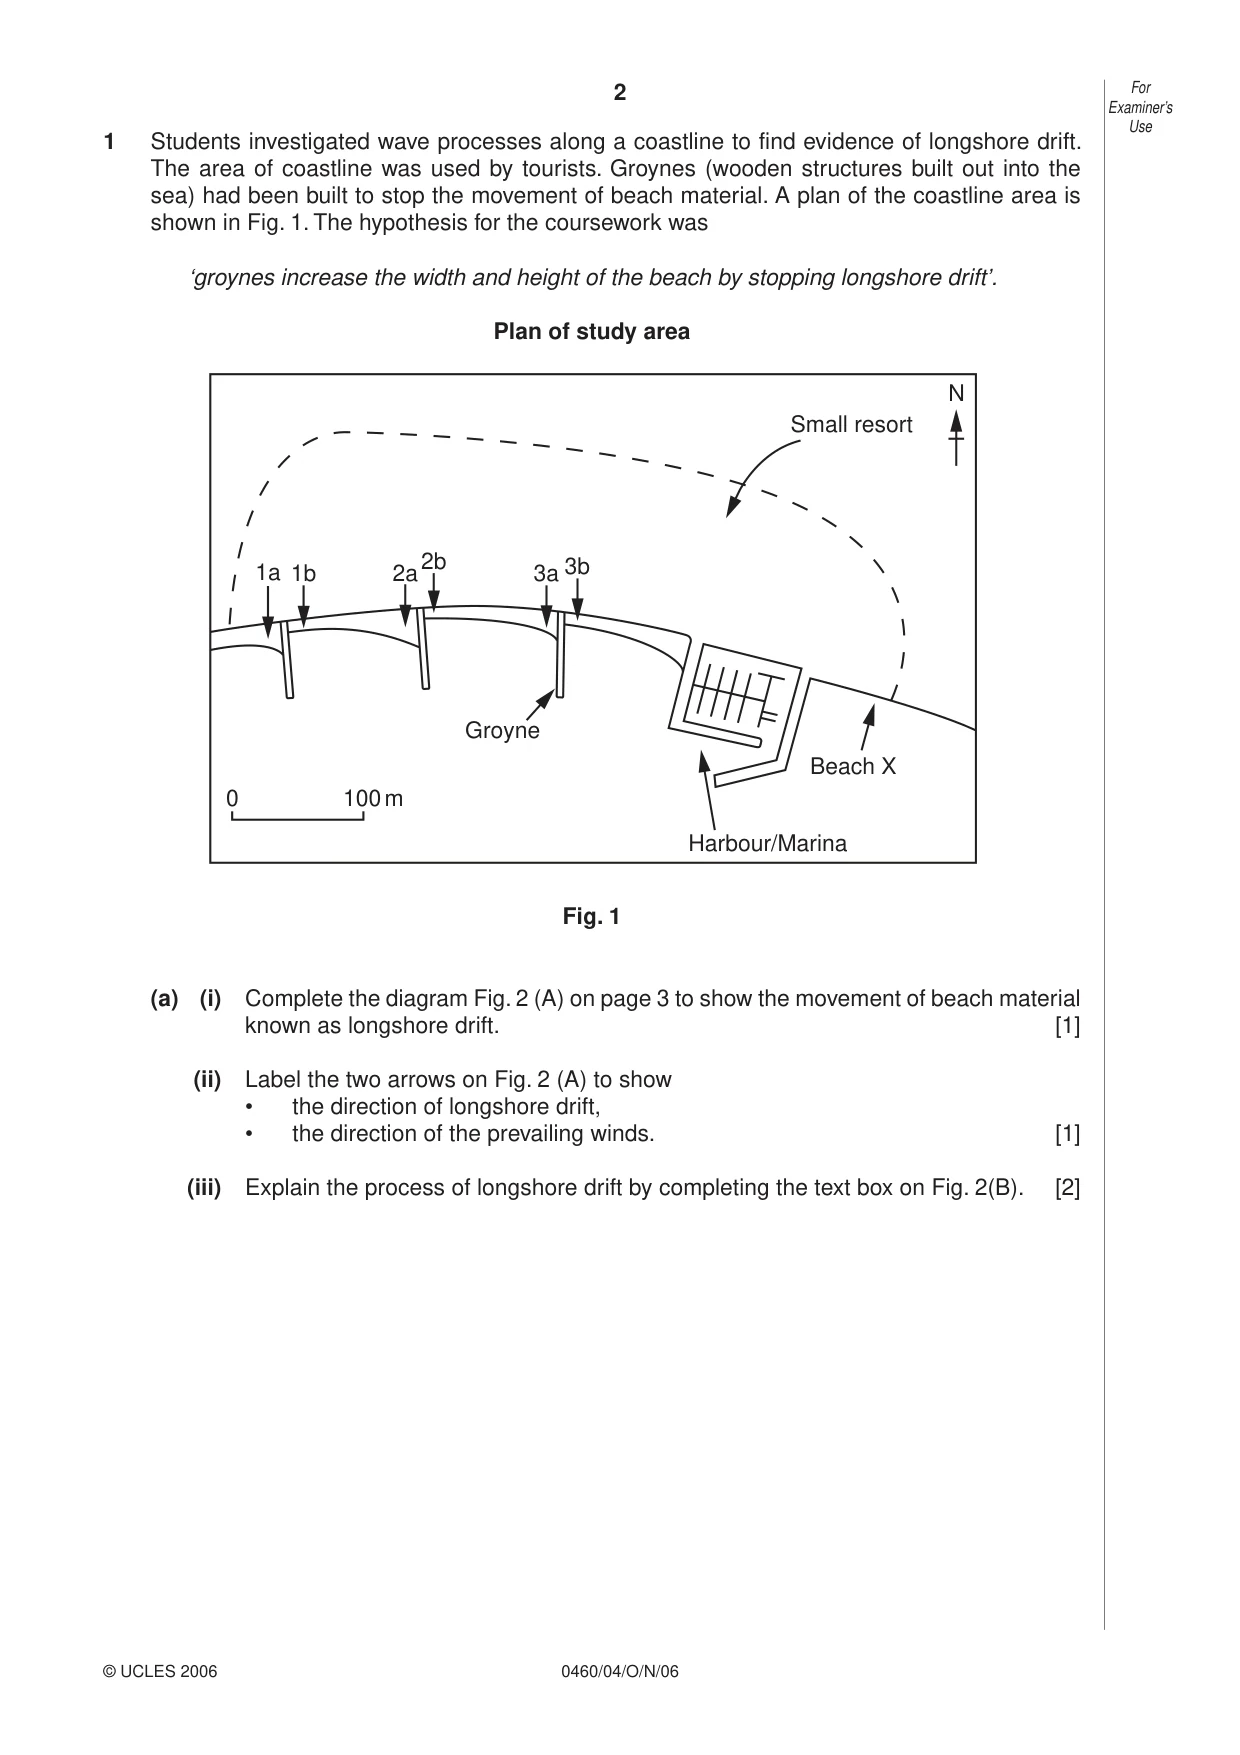
2 0460/04/O/N/06 For Examiner’s Use © UCLES 2006 1 Students investigated wave processes along a coastline to find evidence of longshore drift. The area of coastline was used by tourists. Groynes (wooden structures built out into the sea) had been built to stop the movement of beach material. A plan of the coastline area is shown in Fig. 1. The hypothesis for the coursework was ‘groynes increase the width and height of the beach by stopping longshore drift’. Plan of study area 1a 1b 2a2b 3a Groyne Beach X N Small resort Harbour/Marina 0 100 m 3b Fig. 1 (a) (i) Complete the diagram Fig. 2 (A) on page 3 to show the movement of beach material known as longshore drift. [1] (ii) Label the two arrows on Fig. 2 (A) to show • the direction of longshore drift, • the direction of the prevailing winds. [1] (iii) Explain the process of longshore drift by completing the text box on Fig. 2(B). [2]
Question paper, page 3
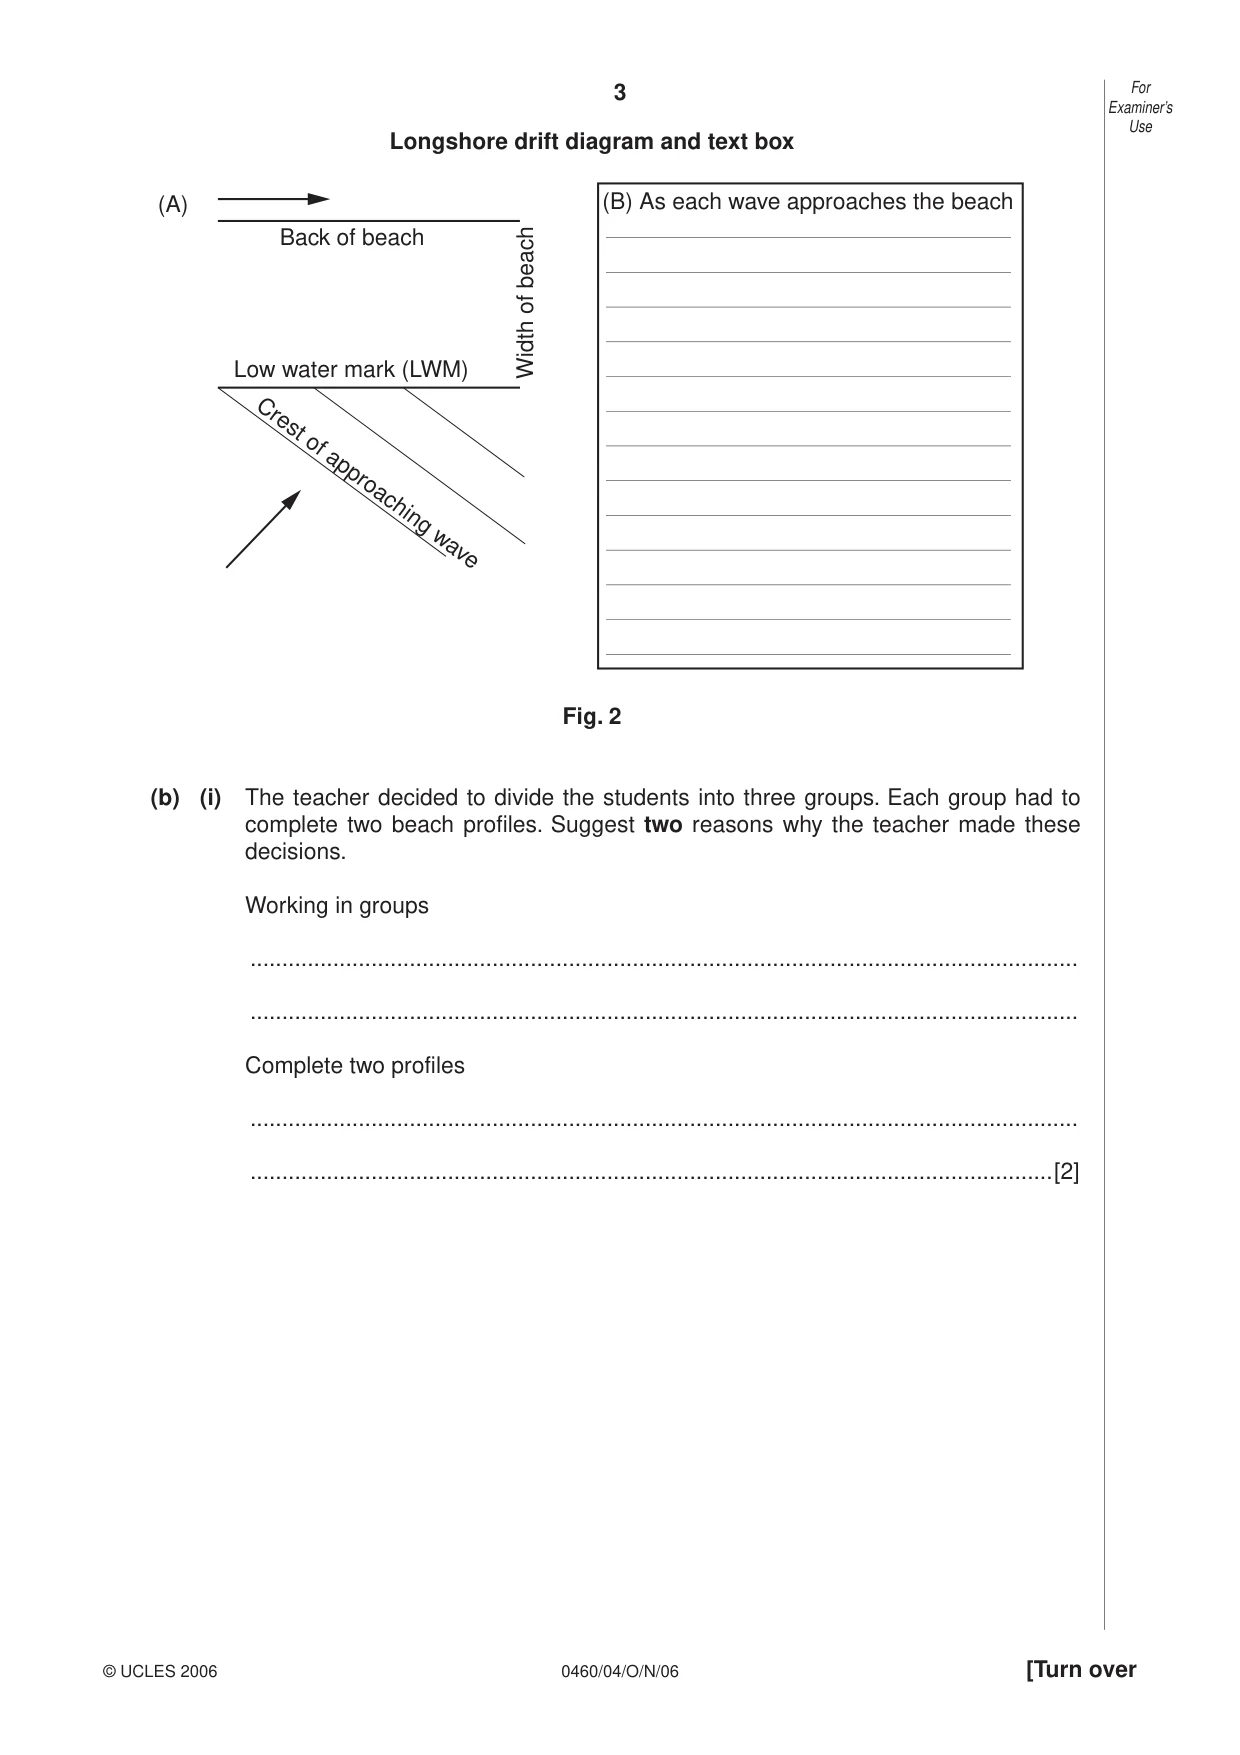
3 0460/04/O/N/06 [Turn over For Examiner’s Use © UCLES 2006 Longshore drift diagram and text box Back of beach (B) As each wave approaches the beach (A) Width of beach Low water mark (LWM) Crest of approaching wave Fig. 2 (b) (i) The teacher decided to divide the students into three groups. Each group had to complete two beach profiles. Suggest two reasons why the teacher made these decisions. Working in groups … … Complete two profiles … …[2]
Question paper, page 4
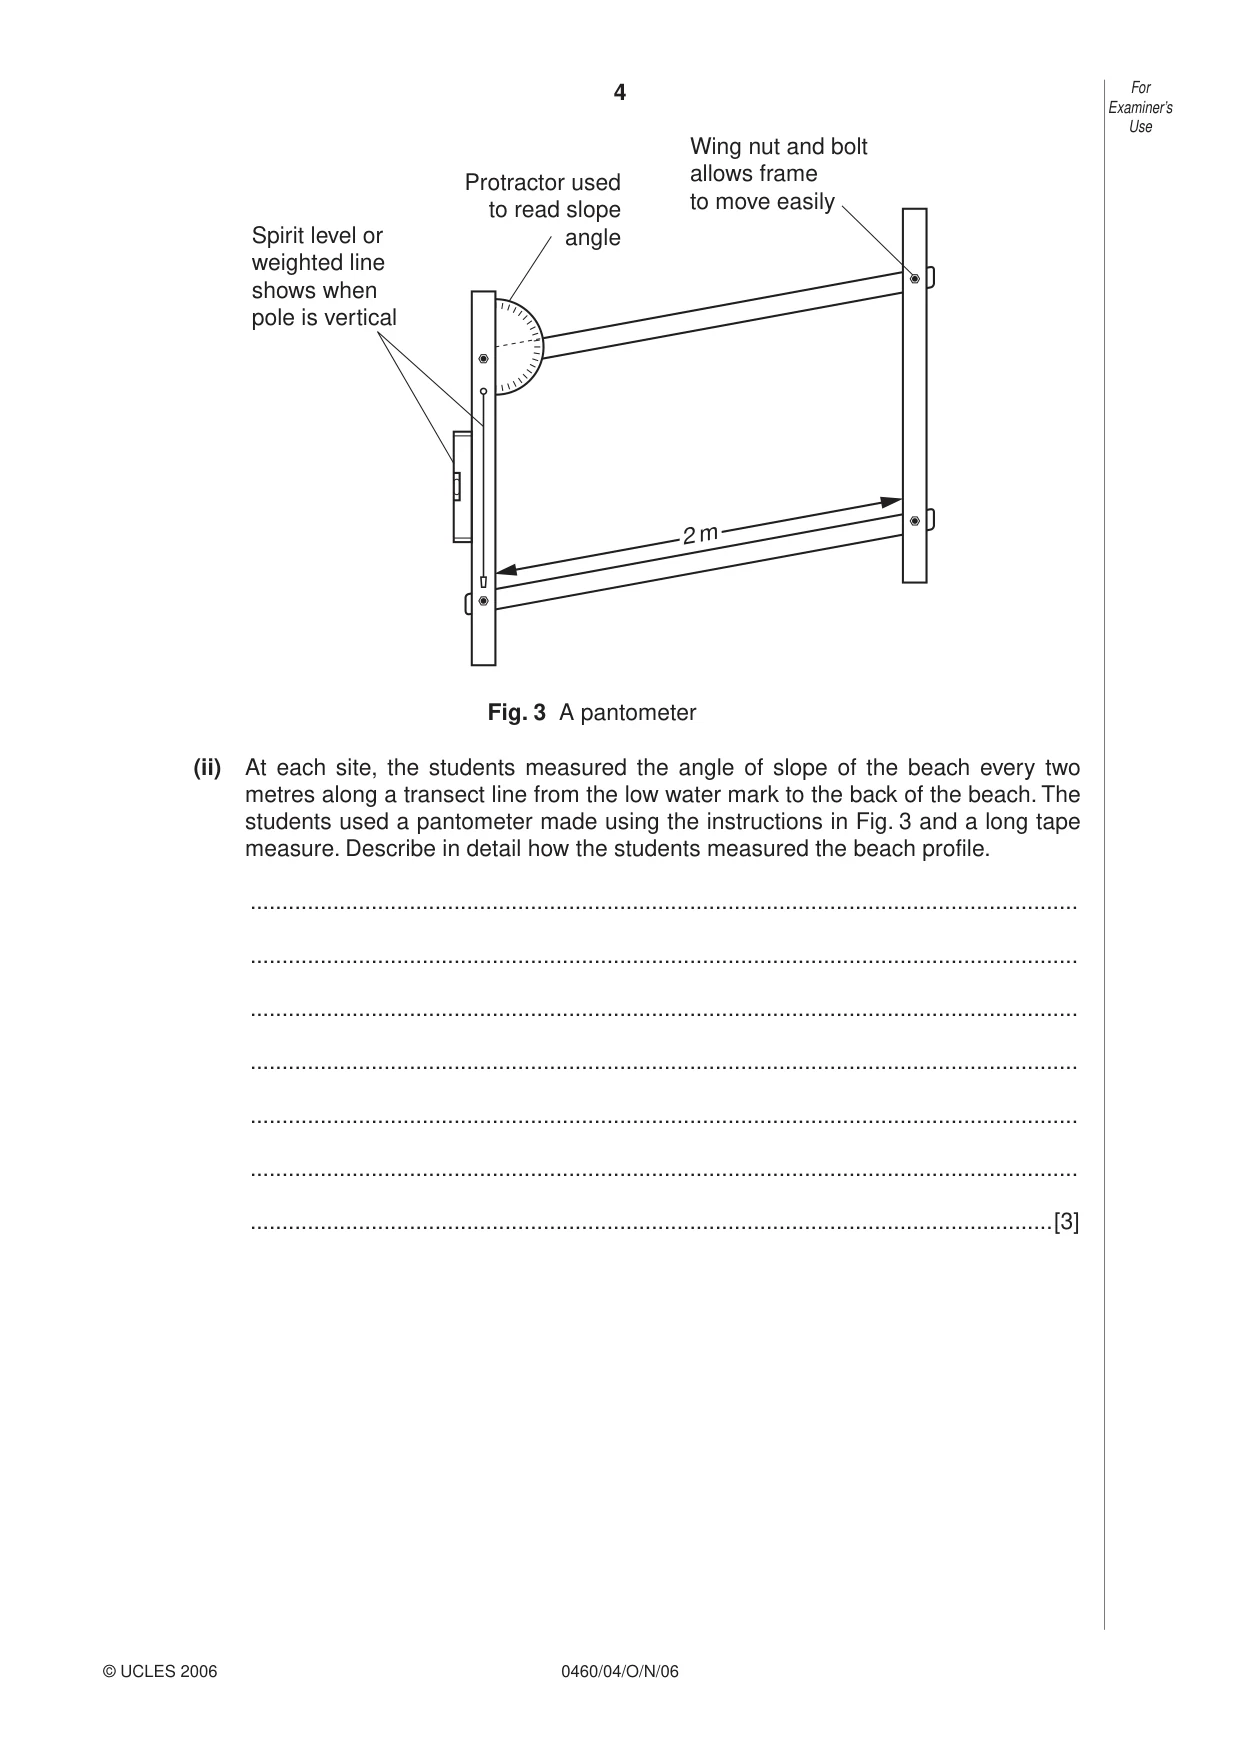
4 0460/04/O/N/06 For Examiner’s Use © UCLES 2006 Spirit level or weighted line shows when pole is vertical Protractor used to read slope angle Wing nut and bolt allows frame to move easily 2 m Fig. 3 A pantometer (ii) At each site, the students measured the angle of slope of the beach every two metres along a transect line from the low water mark to the back of the beach. The students used a pantometer made using the instructions in Fig. 3 and a long tape measure. Describe in detail how the students measured the beach profile. … … … … … … …[3]
Question paper, page 5
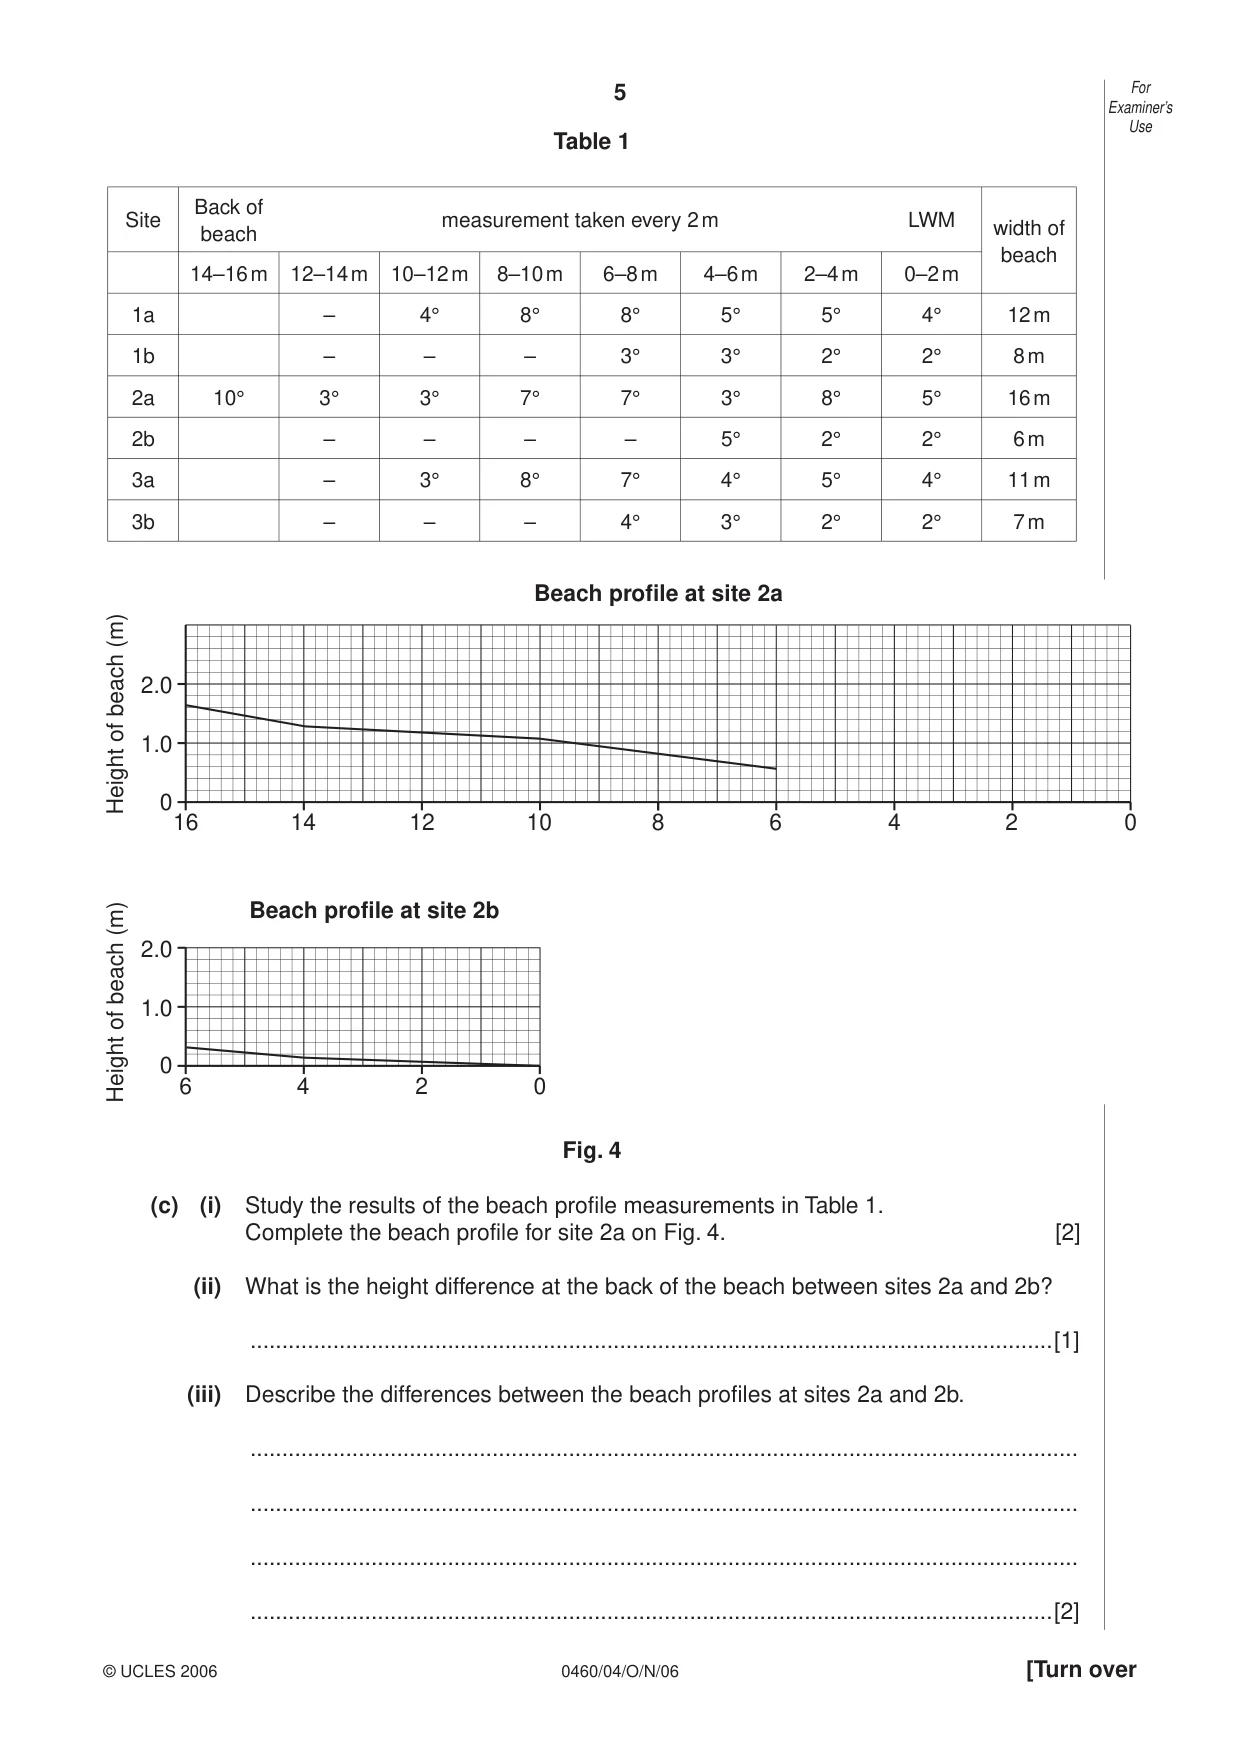
5 0460/04/O/N/06 [Turn over For Examiner’s Use © UCLES 2006 Table 1 Site Back of beach measurement taken every 2 m LWM width of beach 14–16 m 12–14 m 10–12 m 8–10 m 6–8 m 4–6 m 2–4 m 0–2 m 1a – 4° 8° 8° 5° 5° 4° 12 m 1b – – – 3° 3° 2° 2° 8 m 2a 10° 3° 3° 7° 7° 3° 8° 5° 16 m 2b – – – – 5° 2° 2° 6 m 3a – 3° 8° 7° 4° 5° 4° 11 m 3b – – – 4° 3° 2° 2° 7 m 16 1.0 2.0 0 0 14 Beach profile at site 2a Beach profile at site 2b Height of beach (m) 12 10 8 6 4 2 0 6 1.0 2.0 2 4 Height of beach (m) 0 Fig. 4 (c) (i) Study the results of the beach profile measurements in Table 1. Complete the beach profile for site 2a on Fig. 4. [2] (ii) What is the height difference at the back of the beach between sites 2a and 2b? …[1] (iii) Describe the differences between the beach profiles at sites 2a and 2b. … … … …[2]
Question paper, page 6
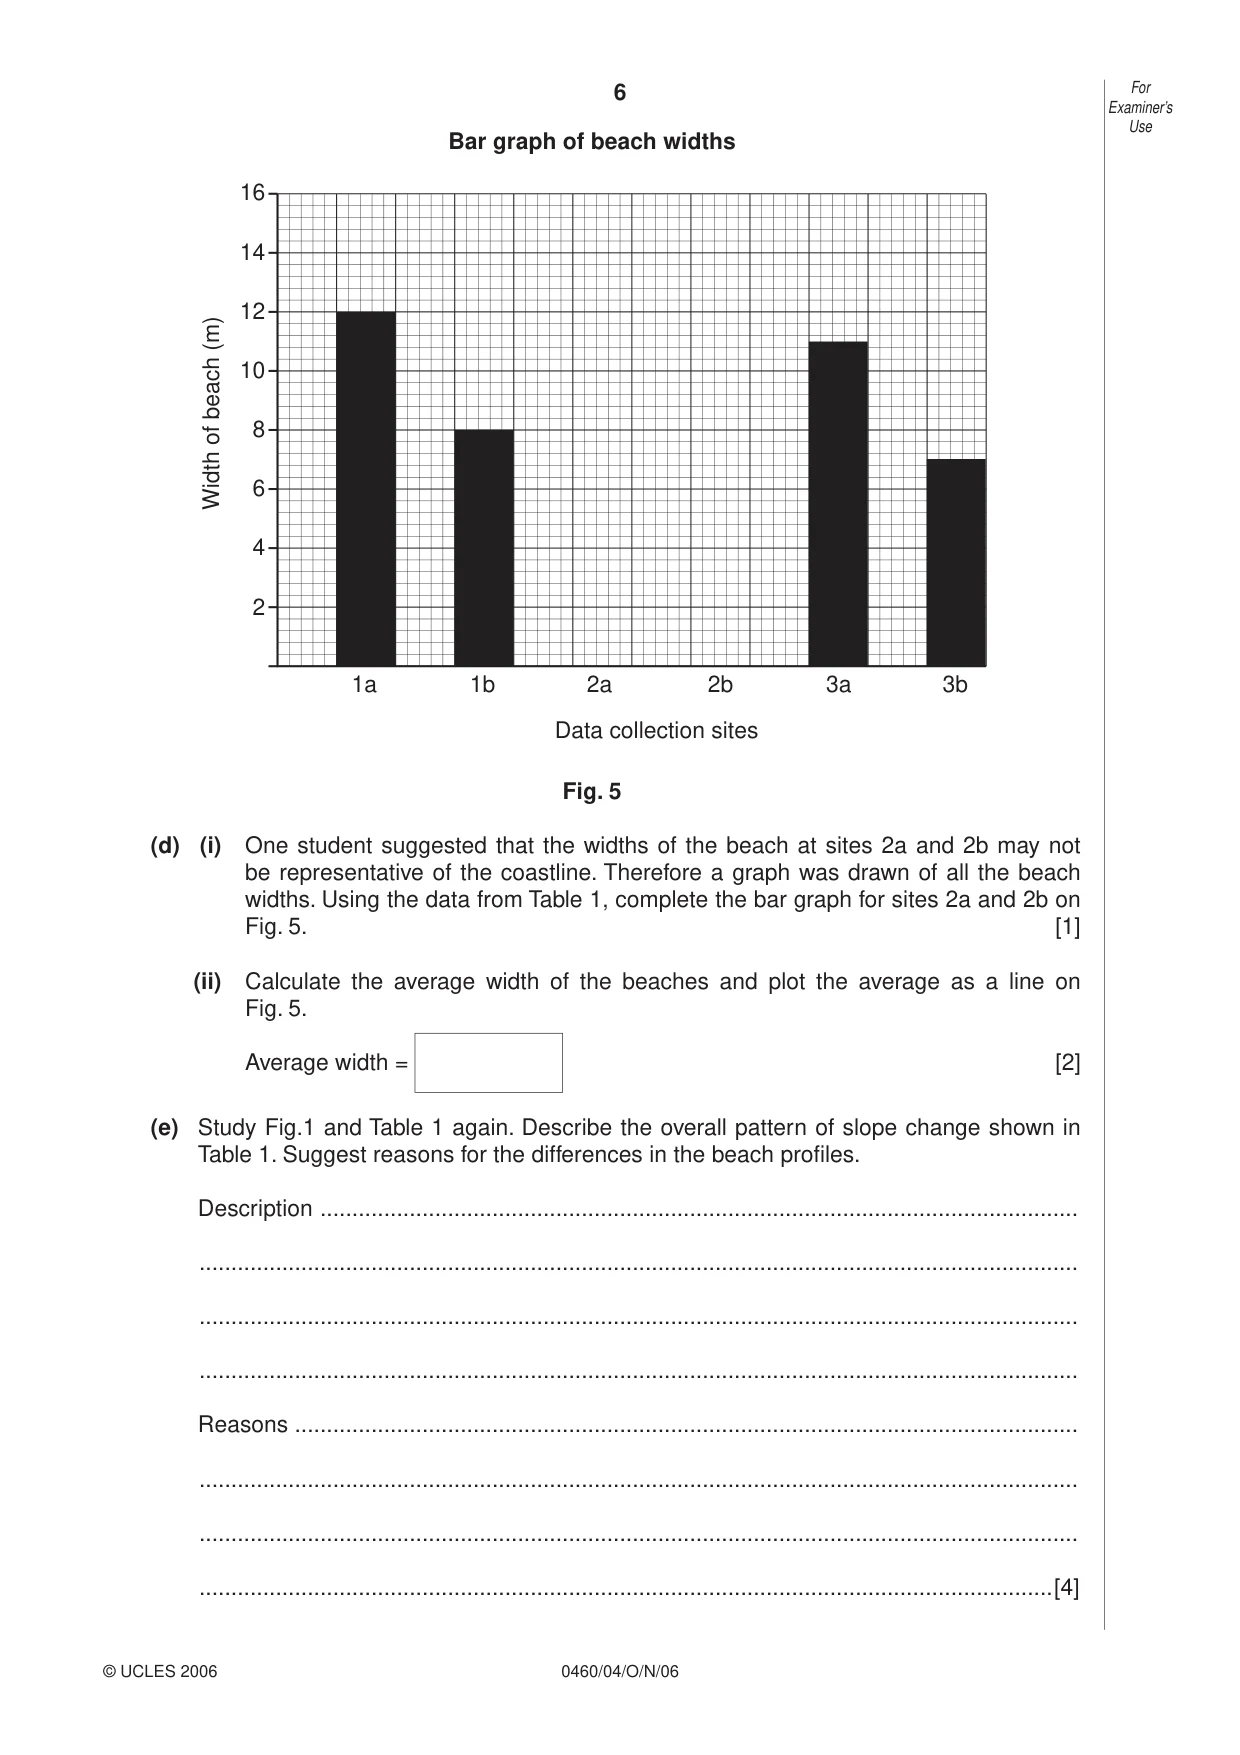
6 0460/04/O/N/06 For Examiner’s Use © UCLES 2006 Bar graph of beach widths 2 1a 1b 2a Data collection sites Width of beach (m) 2b 3a 3b 4 6 8 10 12 14 16 Fig. 5 (d) (i) One student suggested that the widths of the beach at sites 2a and 2b may not be representative of the coastline. Therefore a graph was drawn of all the beach widths. Using the data from Table 1, complete the bar graph for sites 2a and 2b on Fig. 5. [1] (ii) Calculate the average width of the beaches and plot the average as a line on Fig. 5. Average width = [2] (e) Study Fig.1 and Table 1 again. Describe the overall pattern of slope change shown in Table 1. Suggest reasons for the differences in the beach profiles. Description … … … … Reasons … … … …[4]
Question paper, page 7
7 0460/04/O/N/06 [Turn over For Examiner’s Use © UCLES 2006 (f) (i) Study Fig. 1 again. It shows a harbour/marina has been built along the coastline. Describe the likely height and width of the beach profile at beach X. … … … …[2] (ii) Suggest how wave processes will be different at beach X compared to the beaches investigated by the students. … … … …[2] (g) Write a conclusion to this investigation. You should comment on • the accuracy of the hypothesis, • data to support your decision, • limitations of the data. … … … … … … … … … … …[5] [Total: 30 marks]
Question paper, page 8
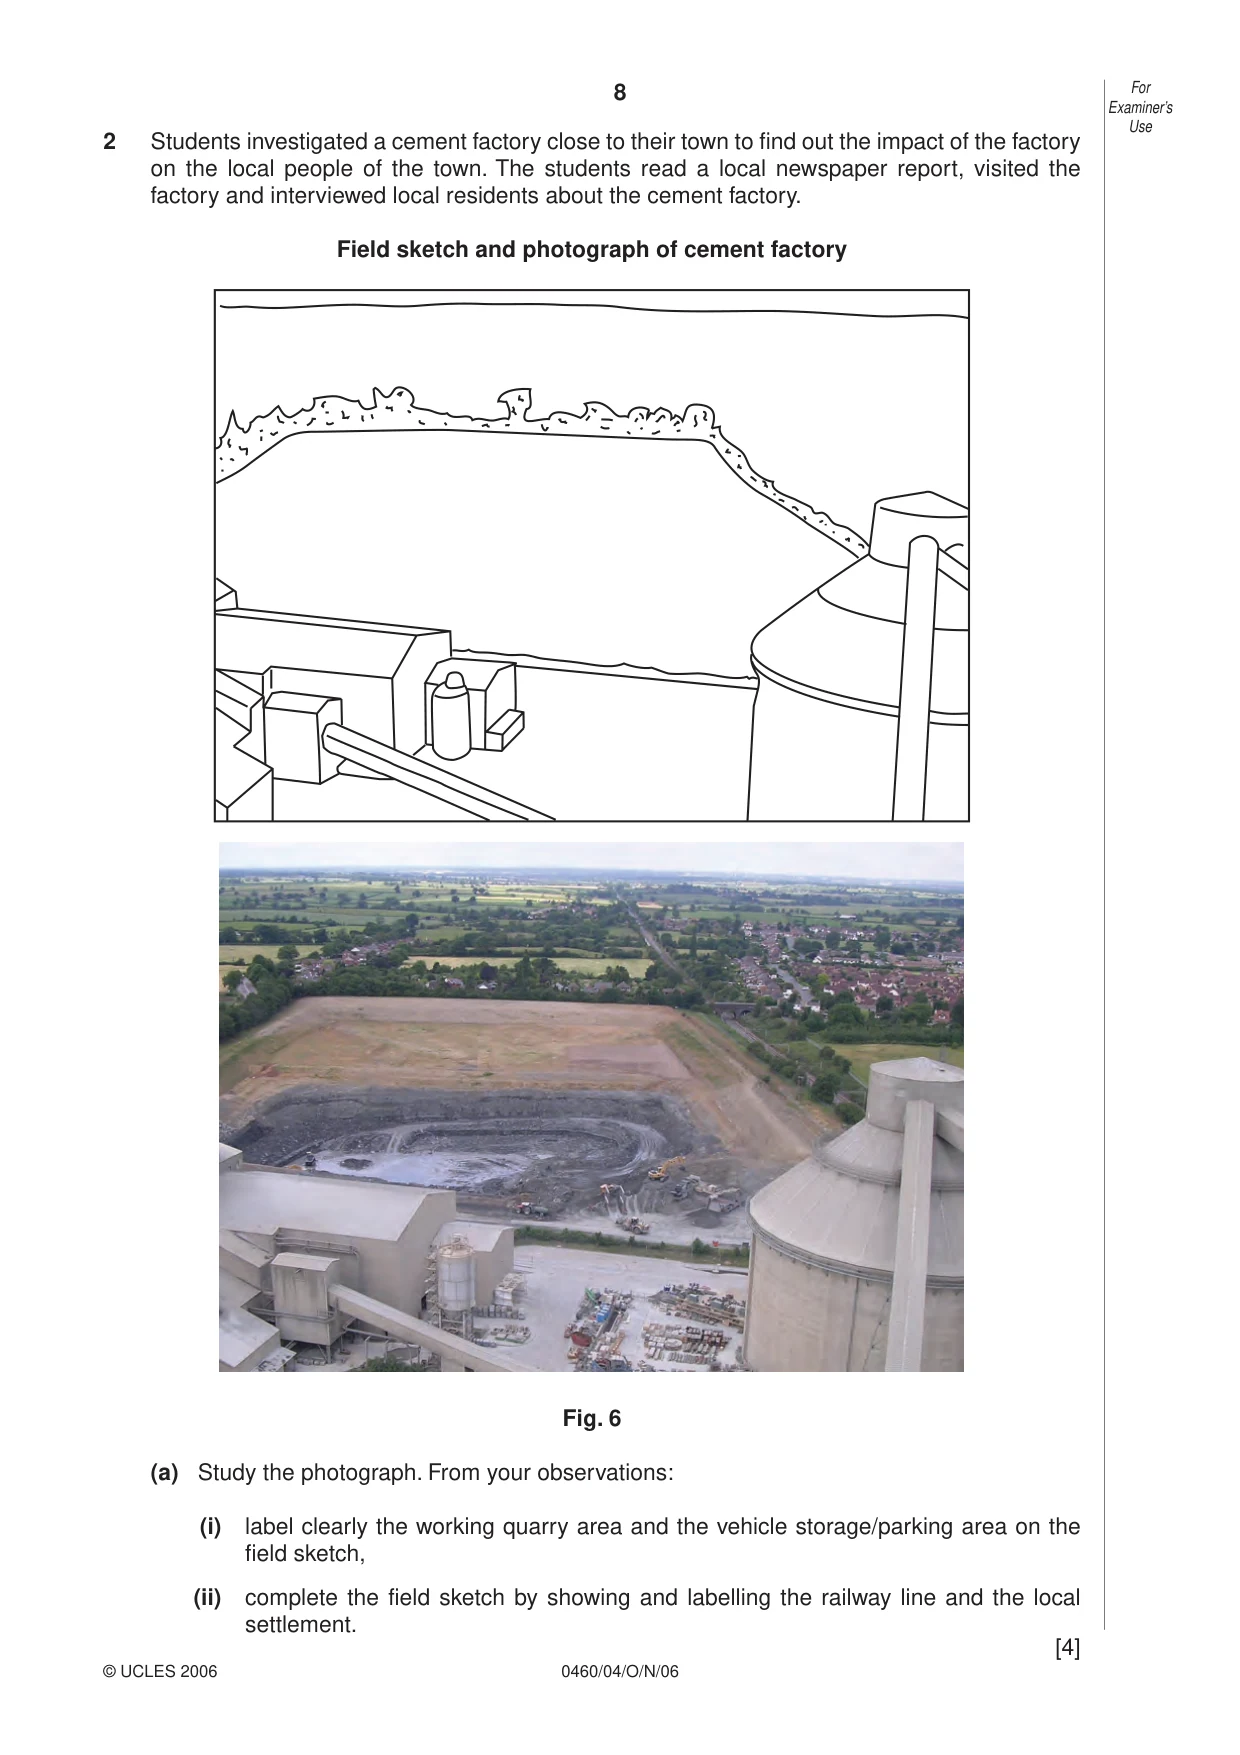
8 0460/04/O/N/06 For Examiner’s Use © UCLES 2006 2 Students investigated a cement factory close to their town to find out the impact of the factory on the local people of the town. The students read a local newspaper report, visited the factory and interviewed local residents about the cement factory. Field sketch and photograph of cement factory Fig. 6 (a) Study the photograph. From your observations: (i) label clearly the working quarry area and the vehicle storage/parking area on the field sketch, (ii) complete the field sketch by showing and labelling the railway line and the local settlement. [4]
Question paper, page 9
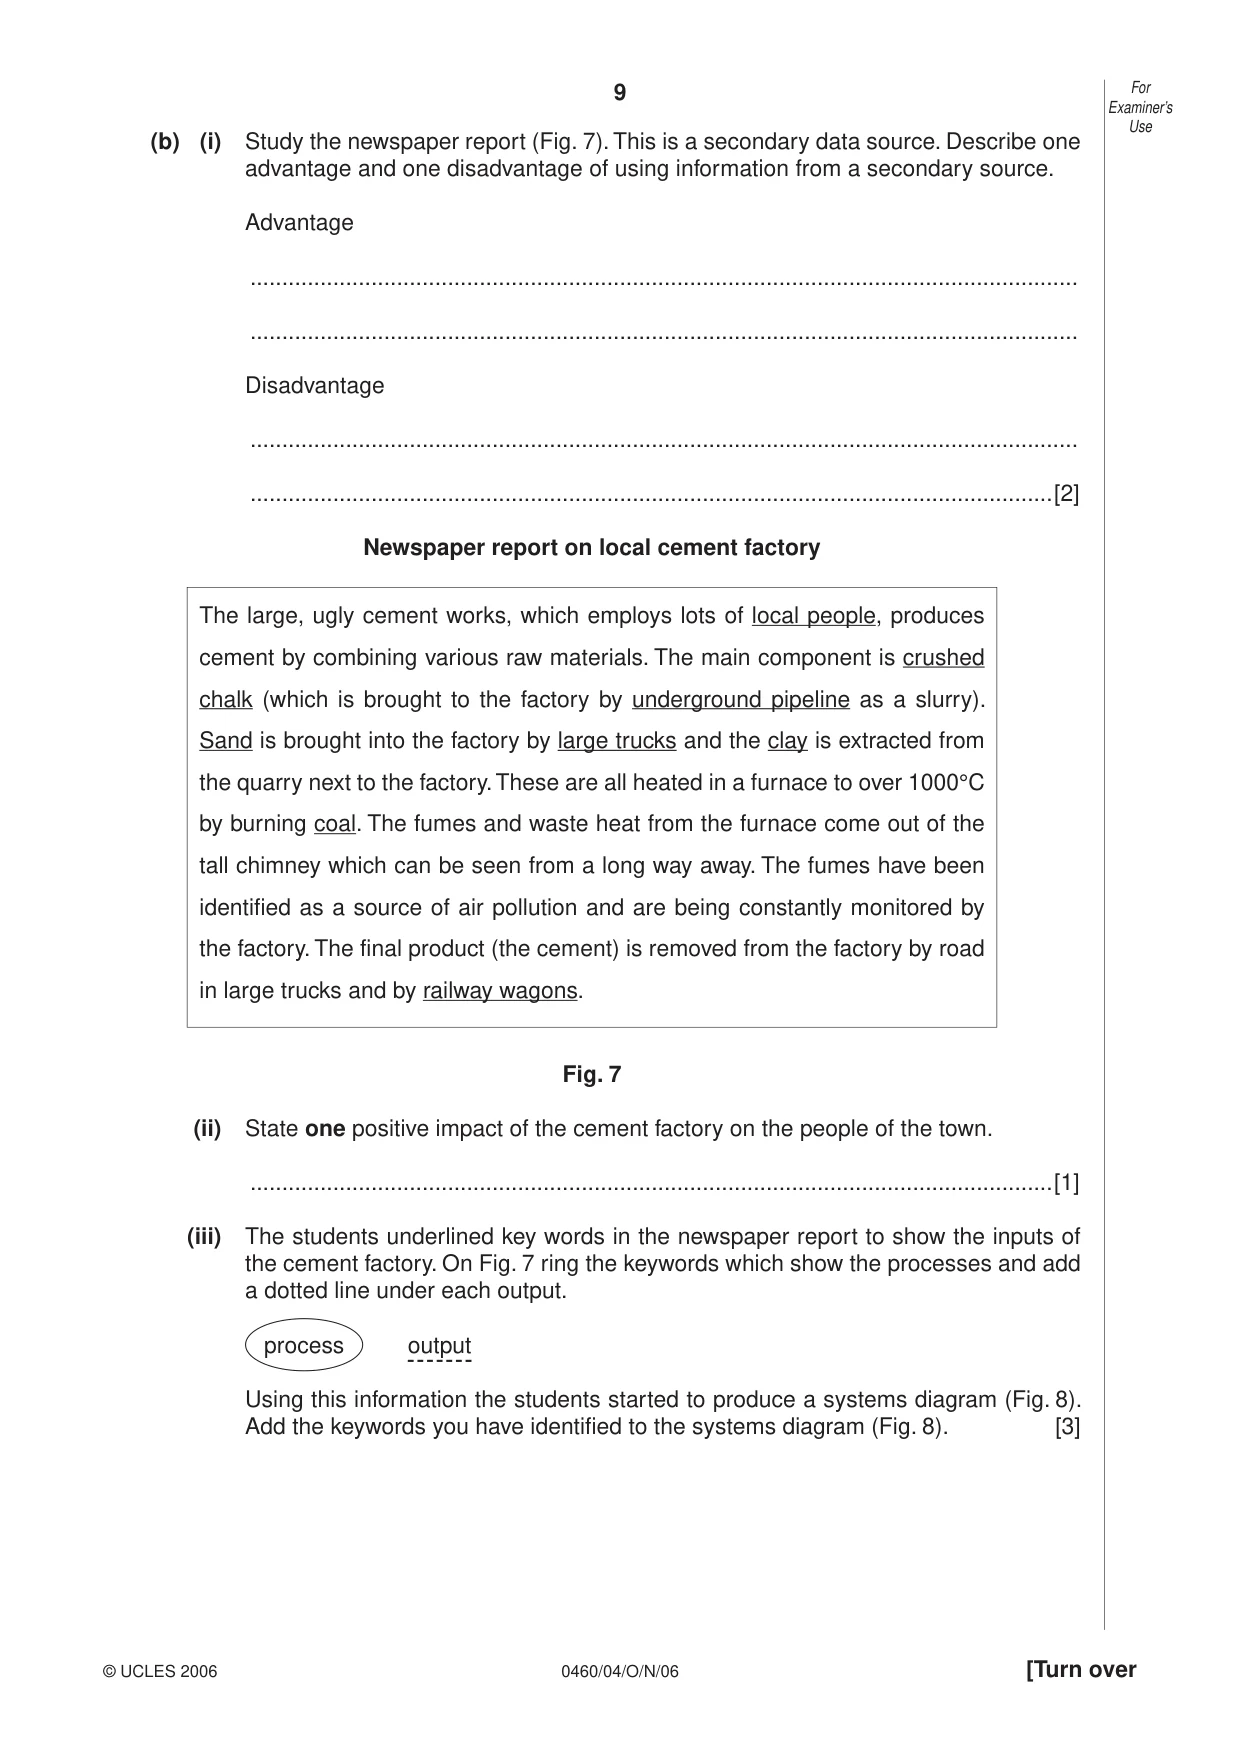
9 0460/04/O/N/06 [Turn over For Examiner’s Use © UCLES 2006 (b) (i) Study the newspaper report (Fig. 7). This is a secondary data source. Describe one advantage and one disadvantage of using information from a secondary source. Advantage … … Disadvantage … …[2] Newspaper report on local cement factory The large, ugly cement works, which employs lots of local people, produces cement by combining various raw materials. The main component is crushed chalk (which is brought to the factory by underground pipeline as a slurry). Sand is brought into the factory by large trucks and the clay is extracted from the quarry next to the factory. These are all heated in a furnace to over 1000°C by burning coal. The fumes and waste heat from the furnace come out of the tall chimney which can be seen from a long way away. The fumes have been identified as a source of air pollution and are being constantly monitored by the factory. The final product (the cement) is removed from the factory by road in large trucks and by railway wagons. Fig. 7 (ii) State one positive impact of the cement factory on the people of the town. …[1] (iii) The students underlined key words in the newspaper report to show the inputs of the cement factory. On Fig. 7 ring the keywords which show the processes and add a dotted line under each output. process output Using this information the students started to produce a systems diagram (Fig. 8). Add the keywords you have identified to the systems diagram (Fig. 8). [3]
Question paper, page 10
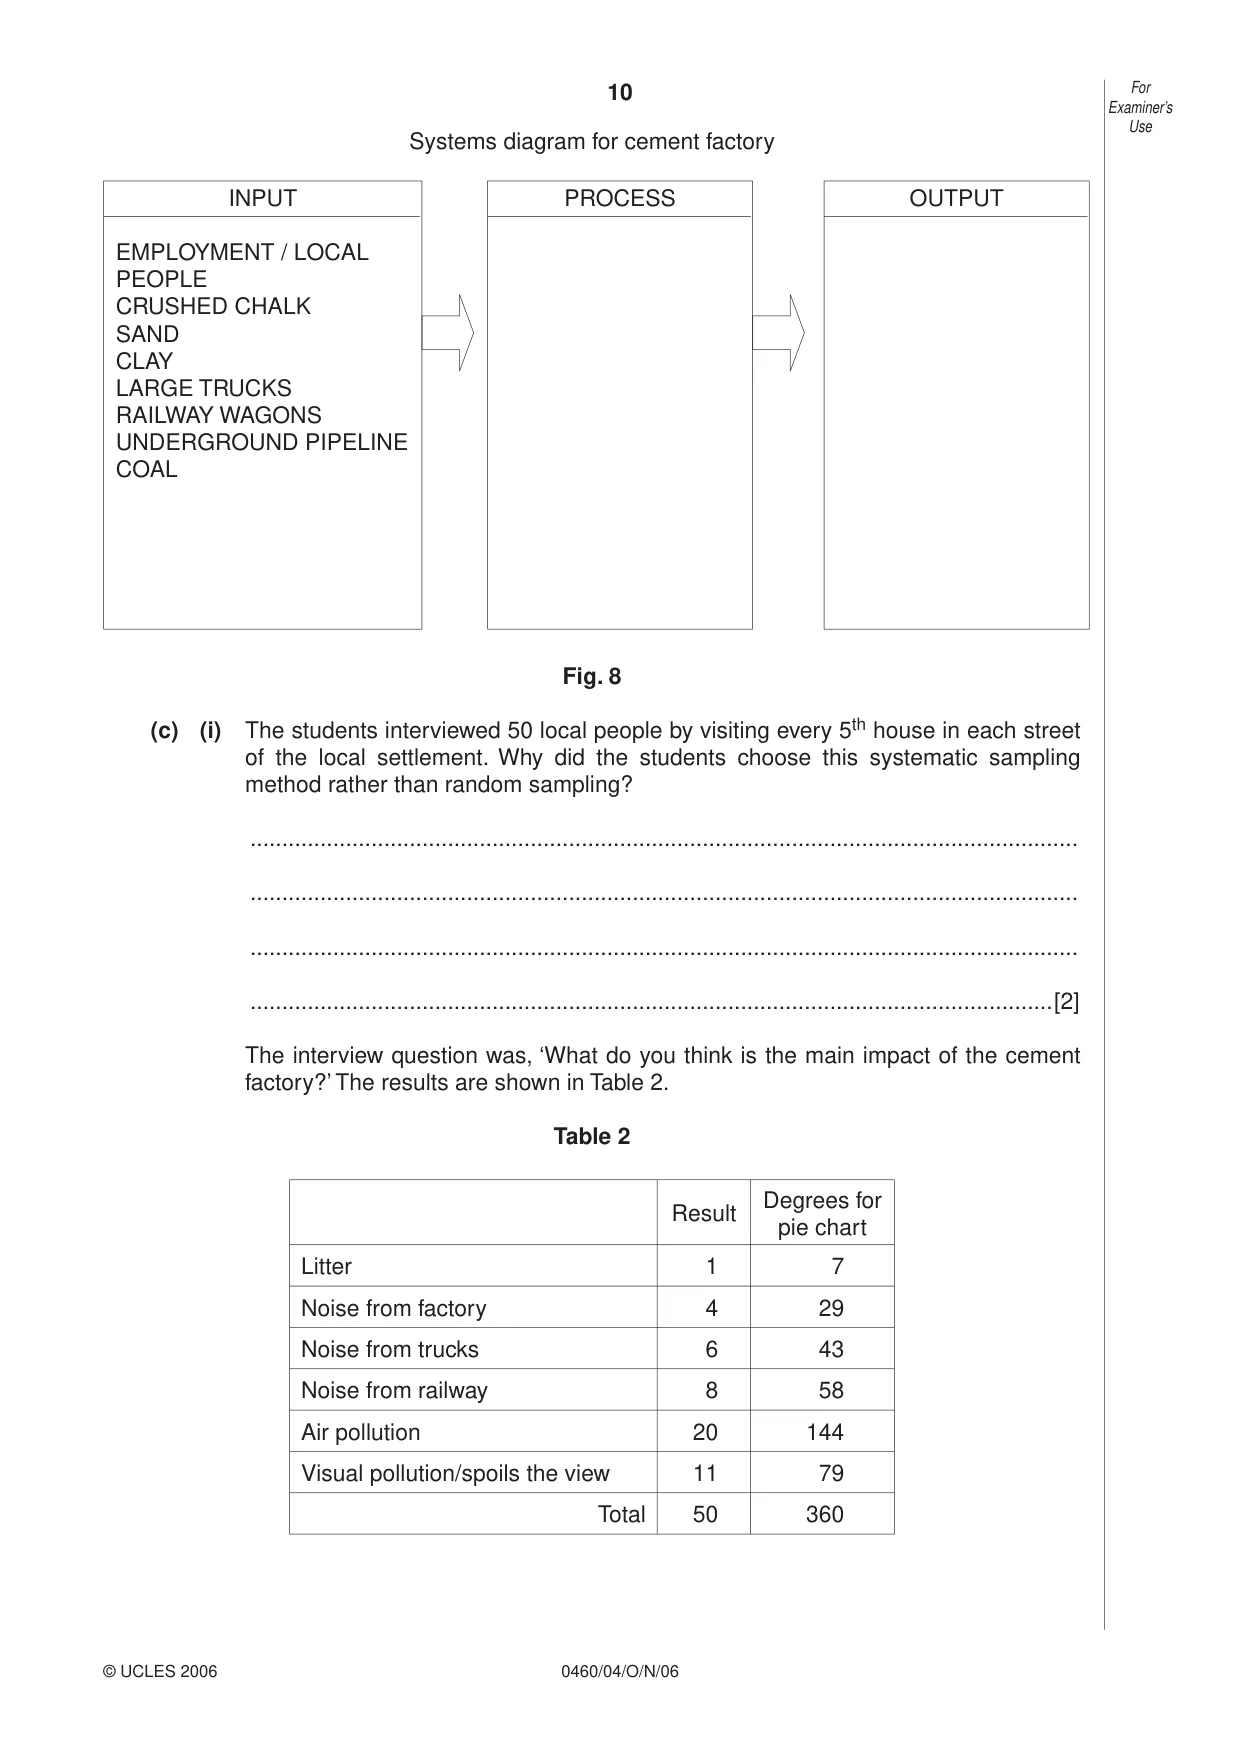
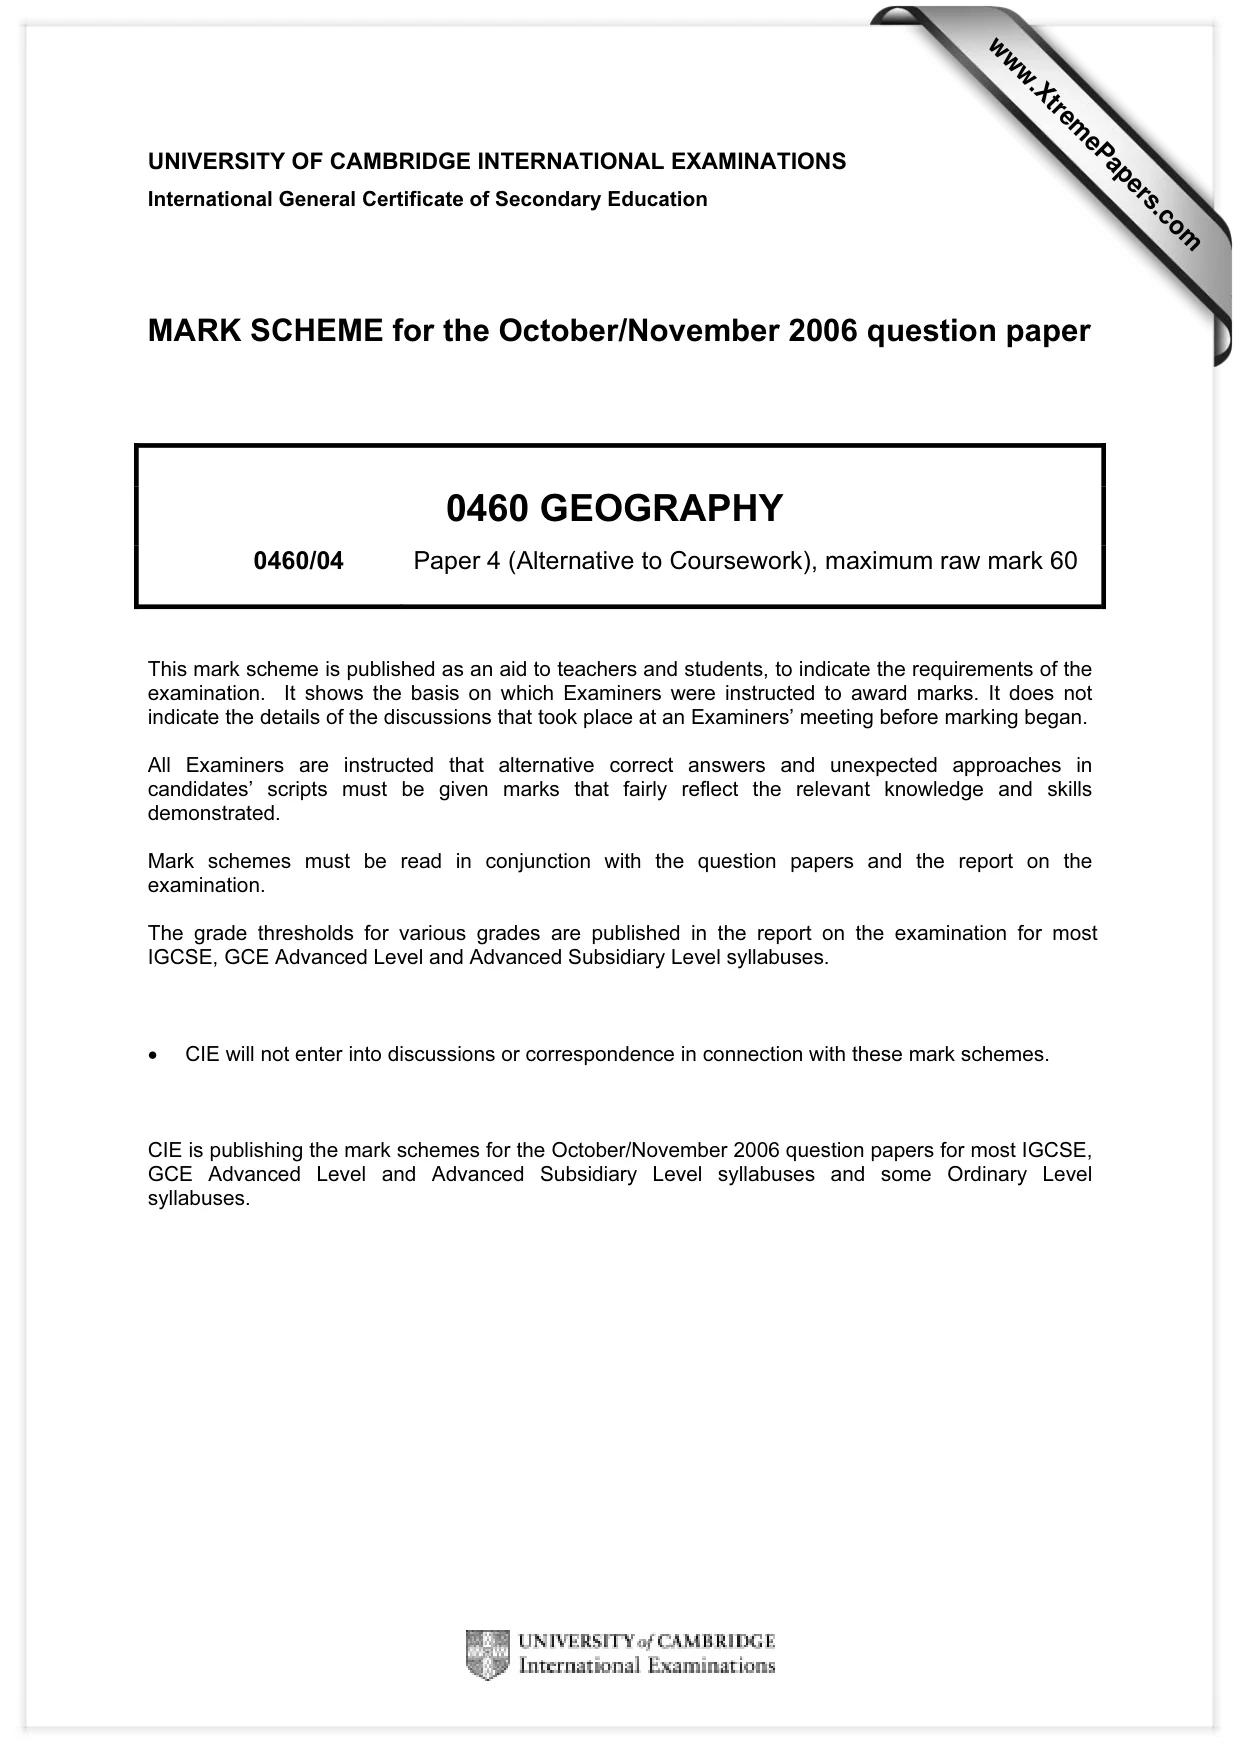
10 0460/04/O/N/06 For Examiner’s Use © UCLES 2006 Systems diagram for cement factory INPUT EMPLOYMENT / LOCAL PEOPLE CRUSHED CHALK SAND CLAY LARGE TRUCKS RAILWAY WAGONS UNDERGROUND PIPELINE COAL PROCESS OUTPUT Fig. 8 (c) (i) The students interviewed 50 local people by visiting every 5th house in each street of the local settlement. Why did the students choose this systematic sampling method rather than random sampling? … … … …[2] The interview question was, ‘What do you think is the main impact of the cement factory?’ The results are shown in Table 2. Table 2 Result Degrees for pie chart Litter 1 7 Noise from factory 4 29 Noise from trucks 6 43 Noise from railway 8 58 Air pollution 20 144 Visual pollution/spoils the view 11 79 Total 50 360
Question paper, page 11
11 0460/04/O/N/06 [Turn over For Examiner’s Use © UCLES 2006 Key Litter Noise from factory Fig. 9 (ii) Complete the pie chart (divided circle), Fig. 9, to show people’s opinions of the impact of the cement factory. You should include a title and finish the key. [5] (iii) Describe the pattern shown by these results. … … … …[2] (d) Air pollution can affect people’s health and cause environmental problems. Describe some of the problems caused by air pollution. … … … … … … … …[3]
Question paper, page 12
12 0460/04/O/N/06 For Examiner’s Use © UCLES 2006 (e) The raw materials and finished product are transported by road, railway and underground pipeline. Stating relevant data, compare the impact of each transport method on the local people. Suggest reasons for your answer. … … … … … …[3] (f) The students decided to extend the investigation to include their own survey of the impact of the cement works on the local environment. Describe in detail possible data collection methods. You should suggest what data the students should collect and how the data could be measured and recorded. … … … … … … … … … … …[5] [Total: 30 marks] Permission to reproduce items where third-party owned material protected by copyright is included has been sought and cleared where possible. Every reasonable effort has been made by the publisher (UCLES) to trace copyright holders, but if any items requiring clearance have unwittingly been included, the publisher will be pleased to make amends at the earliest possible opportunity. University of Cambridge International Examinations is part of the University of Cambridge Local Examinations Syndicate (UCLES), which is itself a department of the University of Cambridge.
Mark scheme, page 1
UNIVERSITY OF CAMBRIDGE INTERNATIONAL EXAMINATIONS International General Certificate of Secondary Education MARK SCHEME for the October/November 2006 question paper 0460 GEOGRAPHY 0460/04 Paper 4 (Alternative to Coursework), maximum raw mark 60 This mark scheme is published as an aid to teachers and students, to indicate the requirements of the examination. It shows the basis on which Examiners were instructed to award marks. It does not indicate the details of the discussions that took place at an Examiners’ meeting before marking began. All Examiners are instructed that alternative correct answers and unexpected approaches in candidates’ scripts must be given marks that fairly reflect the relevant knowledge and skills demonstrated. Mark schemes must be read in conjunction with the question papers and the report on the examination. The grade thresholds for various grades are published in the report on the examination for most IGCSE, GCE Advanced Level and Advanced Subsidiary Level syllabuses. • CIE will not enter into discussions or correspondence in connection with these mark schemes. CIE is publishing the mark schemes for the October/November 2006 question papers for most IGCSE, GCE Advanced Level and Advanced Subsidiary Level syllabuses and some Ordinary Level syllabuses. www.XtremePapers.com
Mark scheme, page 2
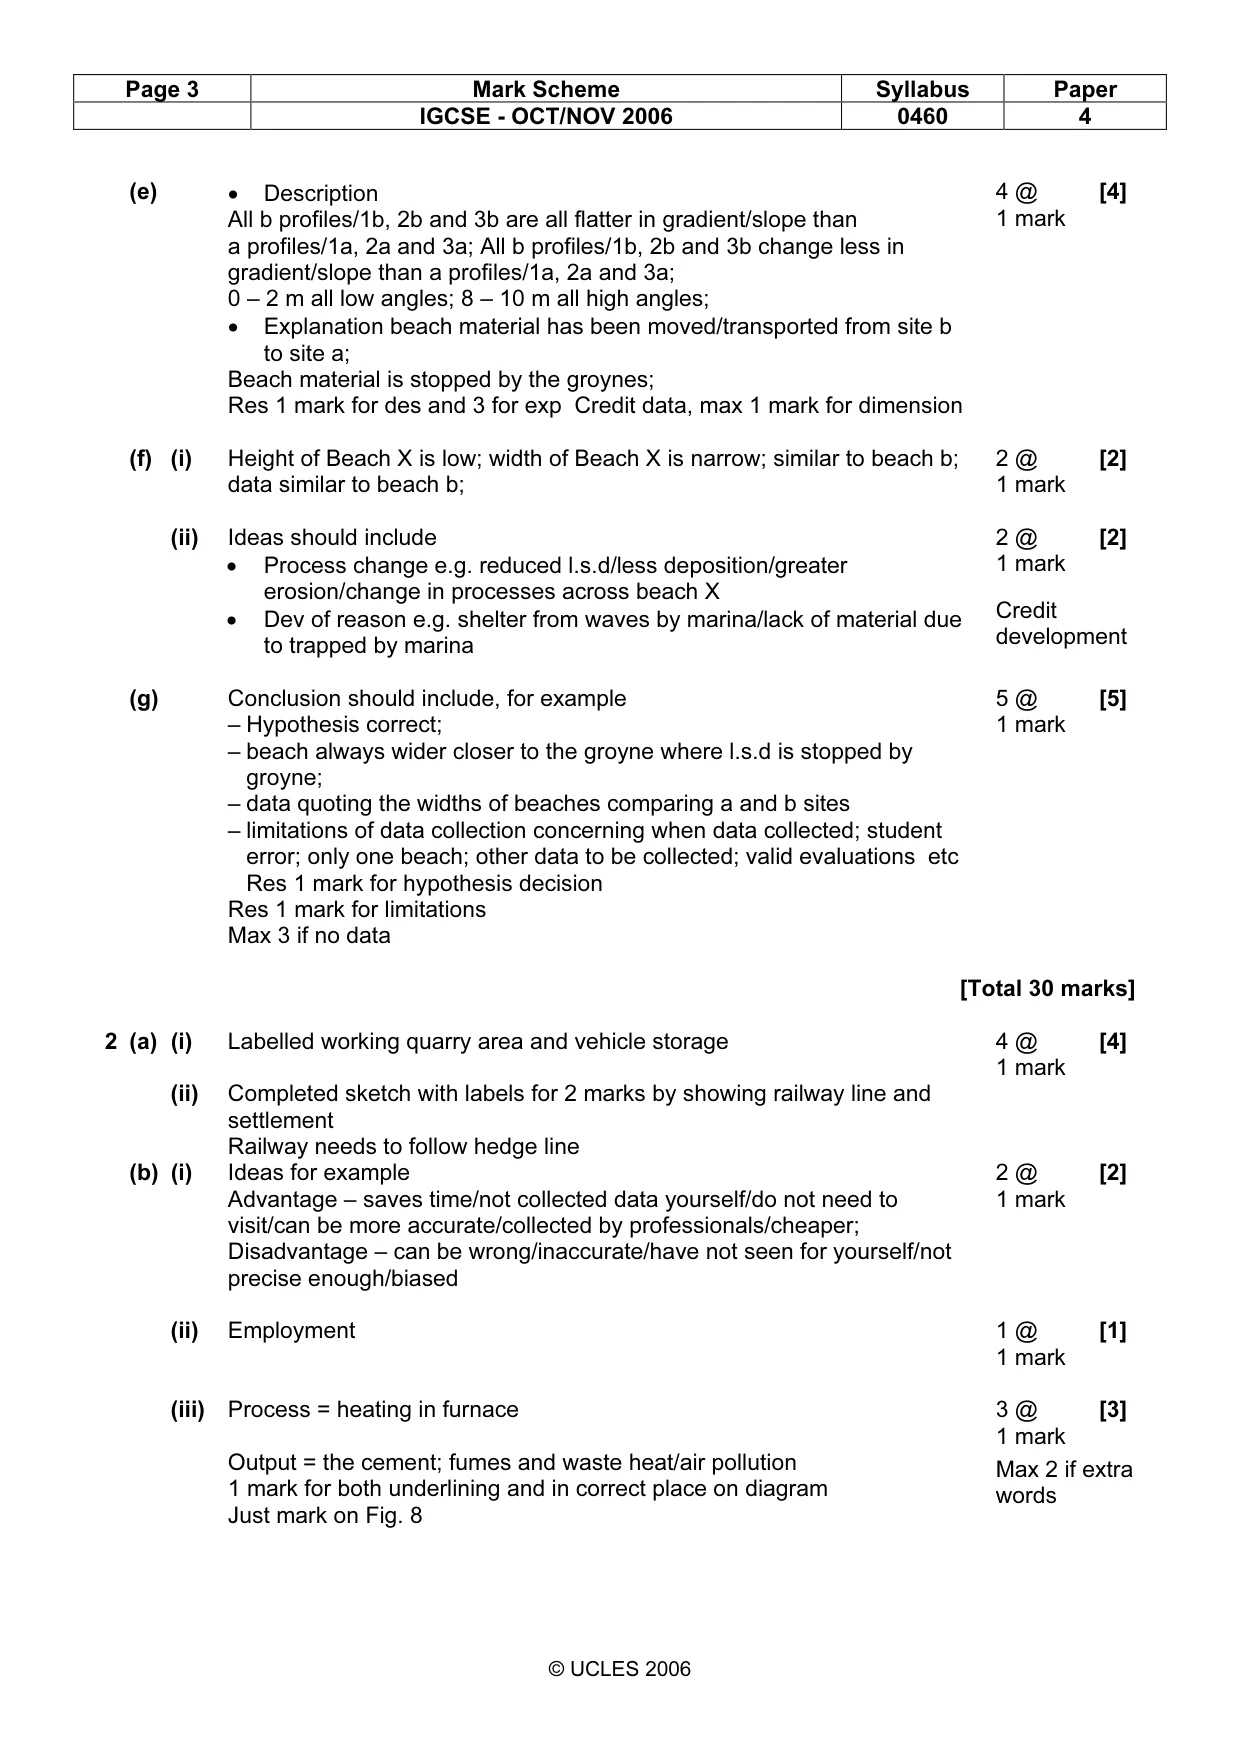
Page 2 Mark Scheme Syllabus Paper IGCSE - OCT/NOV 2006 0460 4 © UCLES 2006 1 (a) (i) Completion of the diagram to show the upward movement of a pebble at an angle and the downward movement of the pebble perpendicular to the foreshore. 1 @ 1 mark [1] (ii) Correct positioning of the direction of l.s.d. and direction of prevailing wind Both correct for mark 1 @ 1 mark [1] (iii) Ideas should include The pebbles/beach material is pushed up the beach at an angle by the swash/waves/direction of prevailing wind; The pebbles/beach material is dragged straight down/returns/perpendicular under the force of gravity; Repeated action 2 @ 1 mark [2] (b) (i) • Saves time/faster; cover more sites in the time; all students experience fieldwork/sharing of work; safer; discuss ideas; easier if qualified • Comparison/fairer test/to get an average/control/minimising student error 2 @ 1 mark [2] (ii) Ideas should include – Use of tape to set out transect line/straight line from water’s edge to back of beach – Starting at the water’s edge the pantometer is placed along the transect line – vertical pole – The angle of slope change is measured using the protractor – Record the measured angle – Repeat the measurement for the width of the beach/length of the transect 3 @ 1 mark [3] (c) (i) Correct marking of profile at 2 m (5°) and 4 m (8°) and line Look for change in the slope at 2 m and 4 m 2 @ 1 mark [2] (ii) Height difference measured from graph as 1.3 m. Accept 1.2 – 1.4 m Award mark for correct number, no penalty for no unit/wrong unit 1 @ 1 mark [1] (iii) 2a wider/longer/higher than 2b; 2a steeper gradient than 2b; greater angle change in 2a than 2b; exception at 4 – 6 m; credit data 2 @ 1 mark [2] (d) (i) Correct plotting of bars at 2a (16 m) and 2b (6 m) Size and location matters but not shading 1 @ 1 mark [1] (ii) 10 m; plotted as line onto bar graph Fig. 5 2 @ 1 mark [2]
Mark scheme, page 3
Page 3 Mark Scheme Syllabus Paper IGCSE - OCT/NOV 2006 0460 4 © UCLES 2006 (e) • Description All b profiles/1b, 2b and 3b are all flatter in gradient/slope than a profiles/1a, 2a and 3a; All b profiles/1b, 2b and 3b change less in gradient/slope than a profiles/1a, 2a and 3a; 0 – 2 m all low angles; 8 – 10 m all high angles; • Explanation beach material has been moved/transported from site b to site a; Beach material is stopped by the groynes; Res 1 mark for des and 3 for exp Credit data, max 1 mark for dimension 4 @ 1 mark [4] (f) (i) Height of Beach X is low; width of Beach X is narrow; similar to beach b; data similar to beach b; 2 @ 1 mark [2] 2 @ 1 mark [2] (ii) Ideas should include • Process change e.g. reduced l.s.d/less deposition/greater erosion/change in processes across beach X • Dev of reason e.g. shelter from waves by marina/lack of material due to trapped by marina Credit development (g) Conclusion should include, for example – Hypothesis correct; – beach always wider closer to the groyne where l.s.d is stopped by groyne; – data quoting the widths of beaches comparing a and b sites – limitations of data collection concerning when data collected; student error; only one beach; other data to be collected; valid evaluations etc Res 1 mark for hypothesis decision Res 1 mark for limitations Max 3 if no data 5 @ 1 mark [5] [Total 30 marks] 2 (a) (i) 4 @ 1 mark [4] (ii) Labelled working quarry area and vehicle storage Completed sketch with labels for 2 marks by showing railway line and settlement Railway needs to follow hedge line (b) (i) Ideas for example Advantage – saves time/not collected data yourself/do not need to visit/can be more accurate/collected by professionals/cheaper; Disadvantage – can be wrong/inaccurate/have not seen for yourself/not precise enough/biased 2 @ 1 mark [2] (ii) Employment 1 @ 1 mark [1] 3 @ 1 mark [3] (iii) Process = heating in furnace Output = the cement; fumes and waste heat/air pollution 1 mark for both underlining and in correct place on diagram Just mark on Fig. 8 Max 2 if extra words
Mark scheme, page 4
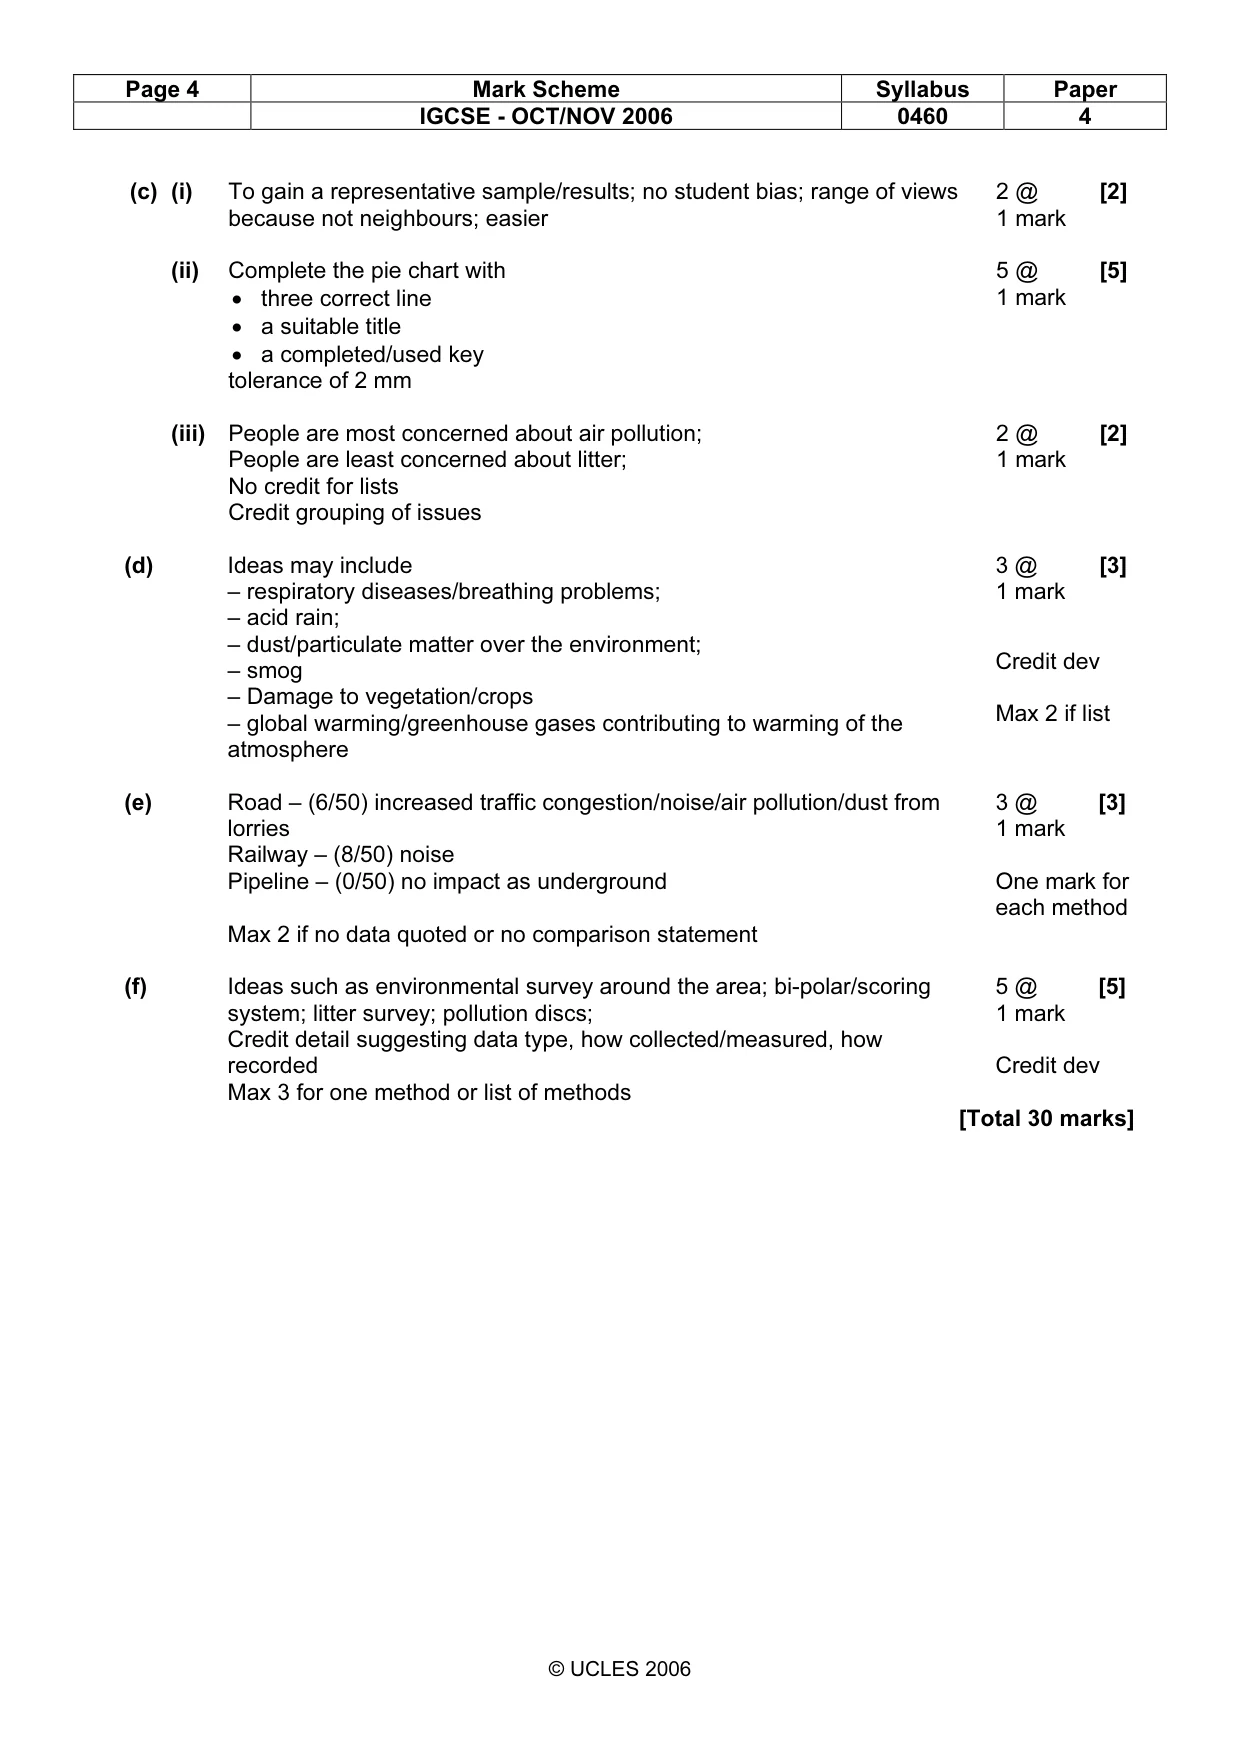
Page 4 Mark Scheme Syllabus Paper IGCSE - OCT/NOV 2006 0460 4 © UCLES 2006 (c) (i) To gain a representative sample/results; no student bias; range of views because not neighbours; easier 2 @ 1 mark [2] (ii) Complete the pie chart with • three correct line • a suitable title • a completed/used key tolerance of 2 mm 5 @ 1 mark [5] (iii) People are most concerned about air pollution; People are least concerned about litter; No credit for lists Credit grouping of issues 2 @ 1 mark [2] 3 @ 1 mark [3] (d) Ideas may include – respiratory diseases/breathing problems; – acid rain; – dust/particulate matter over the environment; – smog – Damage to vegetation/crops – global warming/greenhouse gases contributing to warming of the atmosphere Credit dev Max 2 if list 3 @ 1 mark [3] (e) Road – (6/50) increased traffic congestion/noise/air pollution/dust from lorries Railway – (8/50) noise Pipeline – (0/50) no impact as underground Max 2 if no data quoted or no comparison statement One mark for each method 5 @ 1 mark [5] (f) Ideas such as environmental survey around the area; bi-polar/scoring system; litter survey; pollution discs; Credit detail suggesting data type, how collected/measured, how recorded Max 3 for one method or list of methods Credit dev [Total 30 marks]
What you needed in this session
Cambridge’s own grade thresholds for 2006 Oct/Nov, Paper 4 · Variant 1. A higher threshold means an easier paper — the bar moves with how the cohort did.