Cambridge IGCSE Geography 0460 — 2006 Oct/Nov Paper 2 · Variant 1
0460/21/O/N/06 · 60 marks · ≈68 min
The question paper and its mark scheme, free to read here and free to download. This is Cambridge’s own paper, exactly as it was sat.
Question paper16 pages
Mark scheme6 pages
Answers below. Sit the paper first if you are practising.
Paper as text
Question paper, page 1
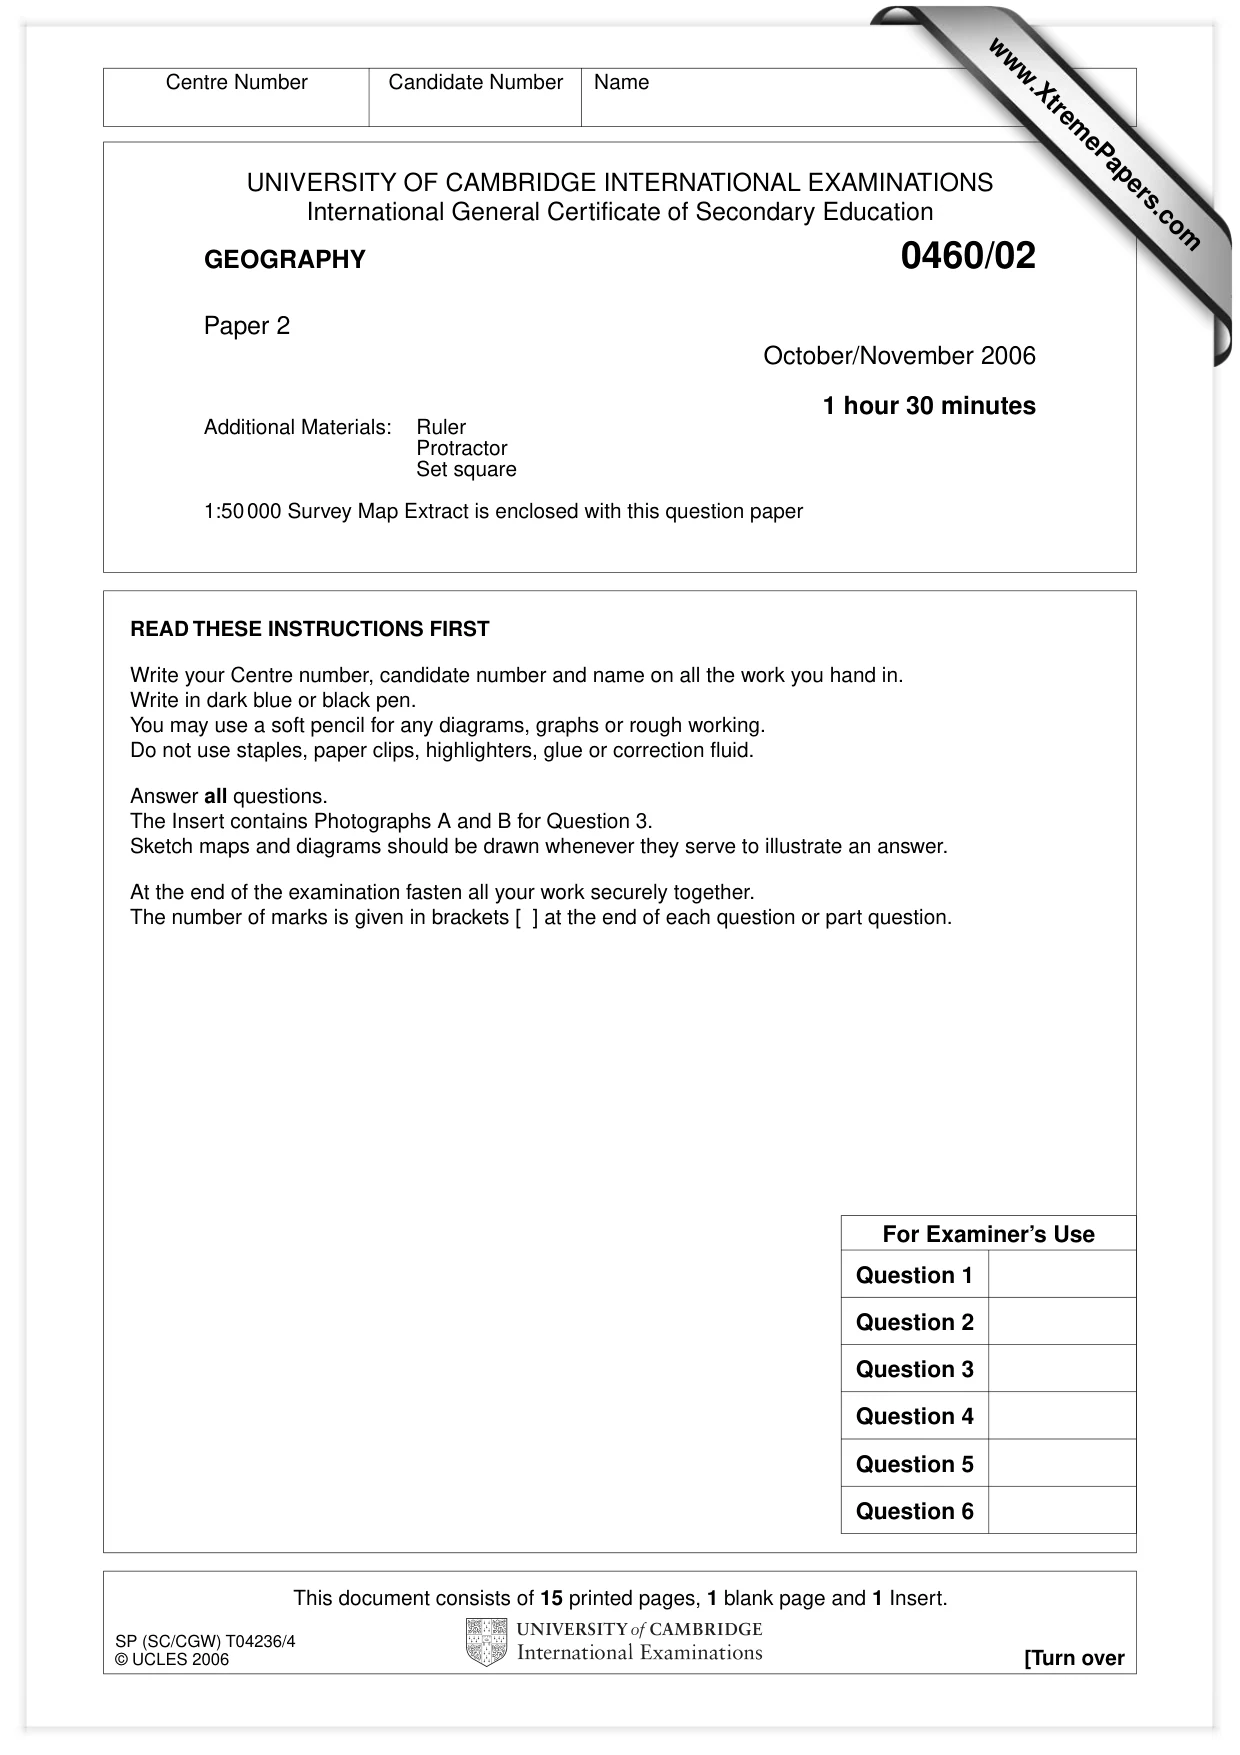
This document consists of 15 printed pages, 1 blank page and 1 Insert. SP (SC/CGW) T04236/4 © UCLES 2006 [Turn over UNIVERSITY OF CAMBRIDGE INTERNATIONAL EXAMINATIONS International General Certificate of Secondary Education GEOGRAPHY 0460/02 Paper 2 October/November 2006 1 hour 30 minutes Additional Materials: Ruler Protractor Set square 1:50 000 Survey Map Extract is enclosed with this question paper READ THESE INSTRUCTIONS FIRST Write your Centre number, candidate number and name on all the work you hand in. Write in dark blue or black pen. You may use a soft pencil for any diagrams, graphs or rough working. Do not use staples, paper clips, highlighters, glue or correction fluid. Answer all questions. The Insert contains Photographs A and B for Question 3. Sketch maps and diagrams should be drawn whenever they serve to illustrate an answer. At the end of the examination fasten all your work securely together. The number of marks is given in brackets [ ] at the end of each question or part question. For Examiner’s Use Question 1 Question 2 Question 3 Question 4 Question 5 Question 6 Centre Number Candidate Number Name www.XtremePapers.com
Question paper, page 2
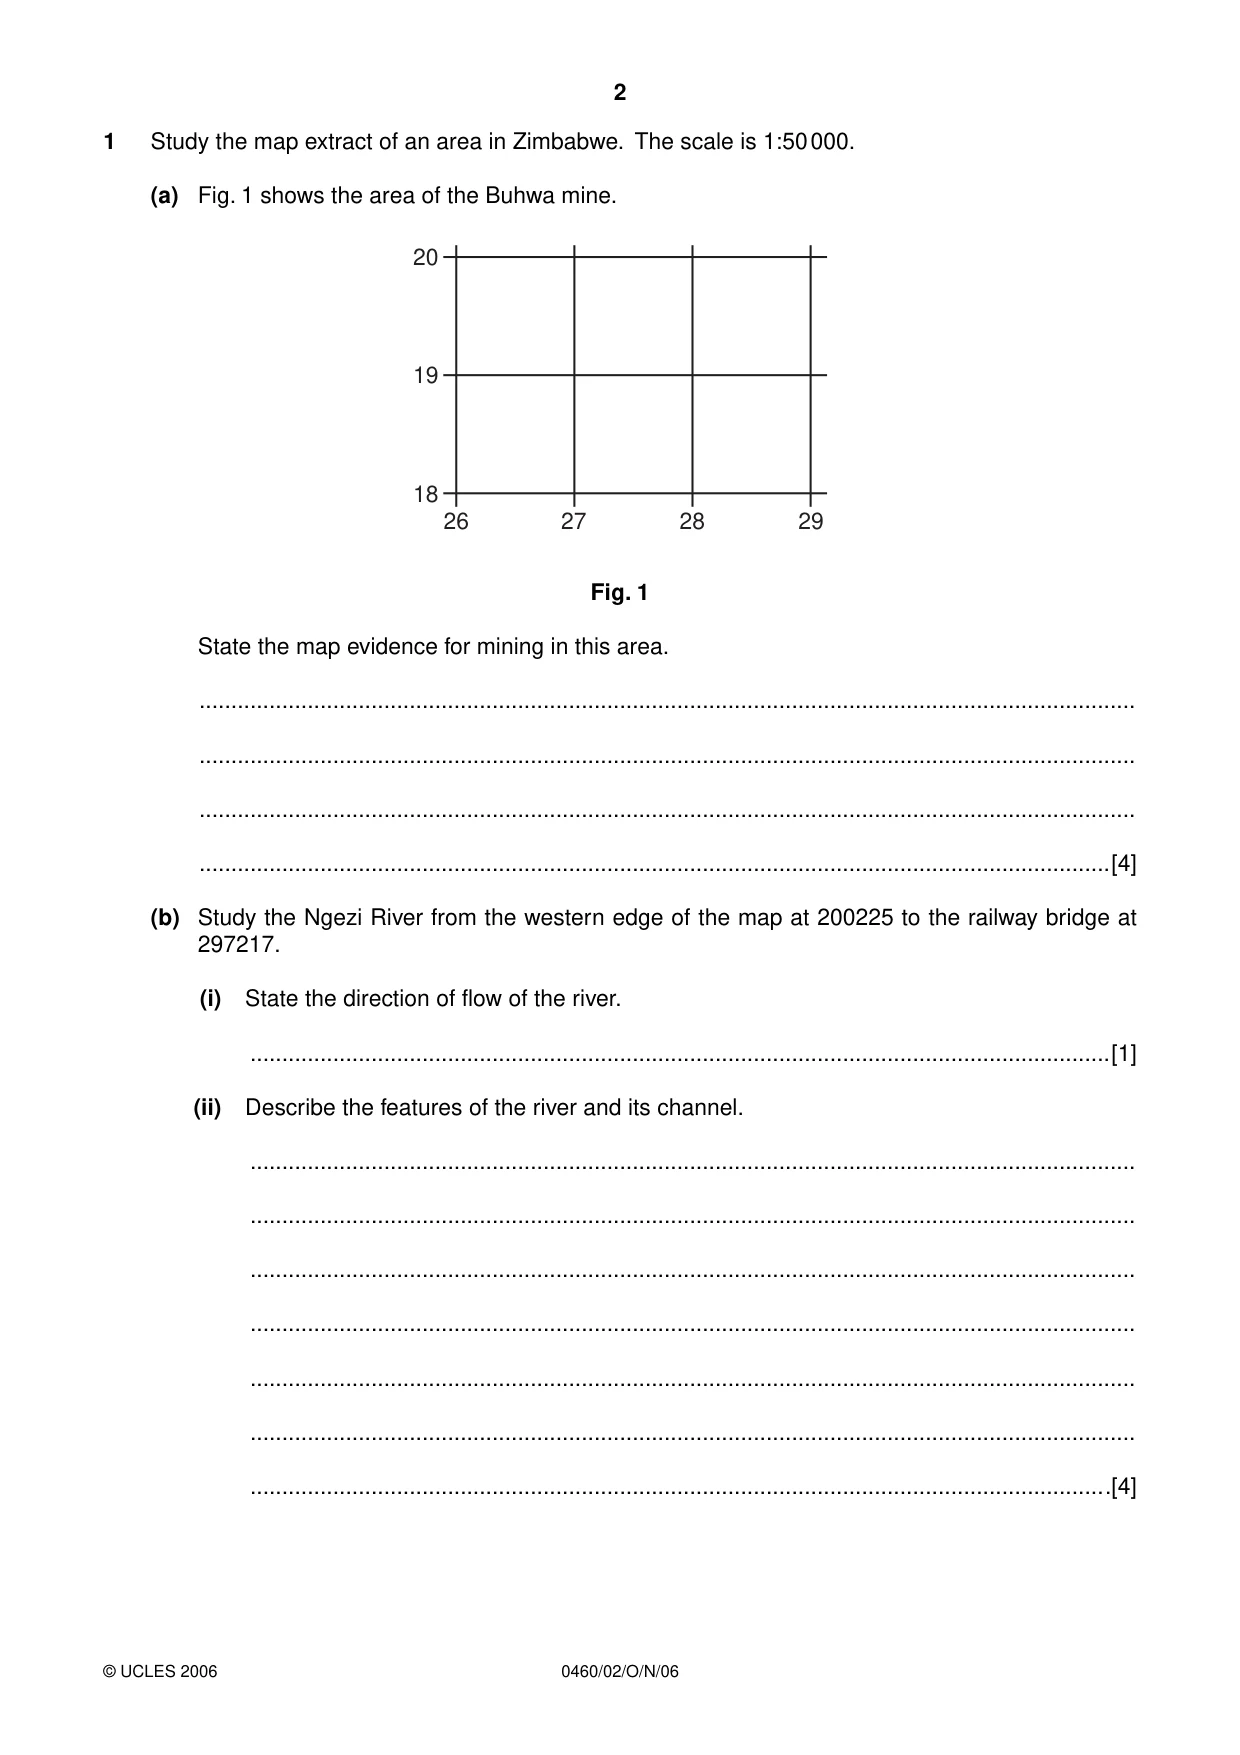
2 0460/02/O/N/06 © UCLES 2006 1 Study the map extract of an area in Zimbabwe. The scale is 1:50 000. (a) Fig. 1 shows the area of the Buhwa mine. 20 19 18 26 27 29 28 Fig. 1 State the map evidence for mining in this area. … … … …[4] (b) Study the Ngezi River from the western edge of the map at 200225 to the railway bridge at 297217. (i) State the direction of flow of the river. …[1] (ii) Describe the features of the river and its channel. … … … … … … …[4]
Question paper, page 3
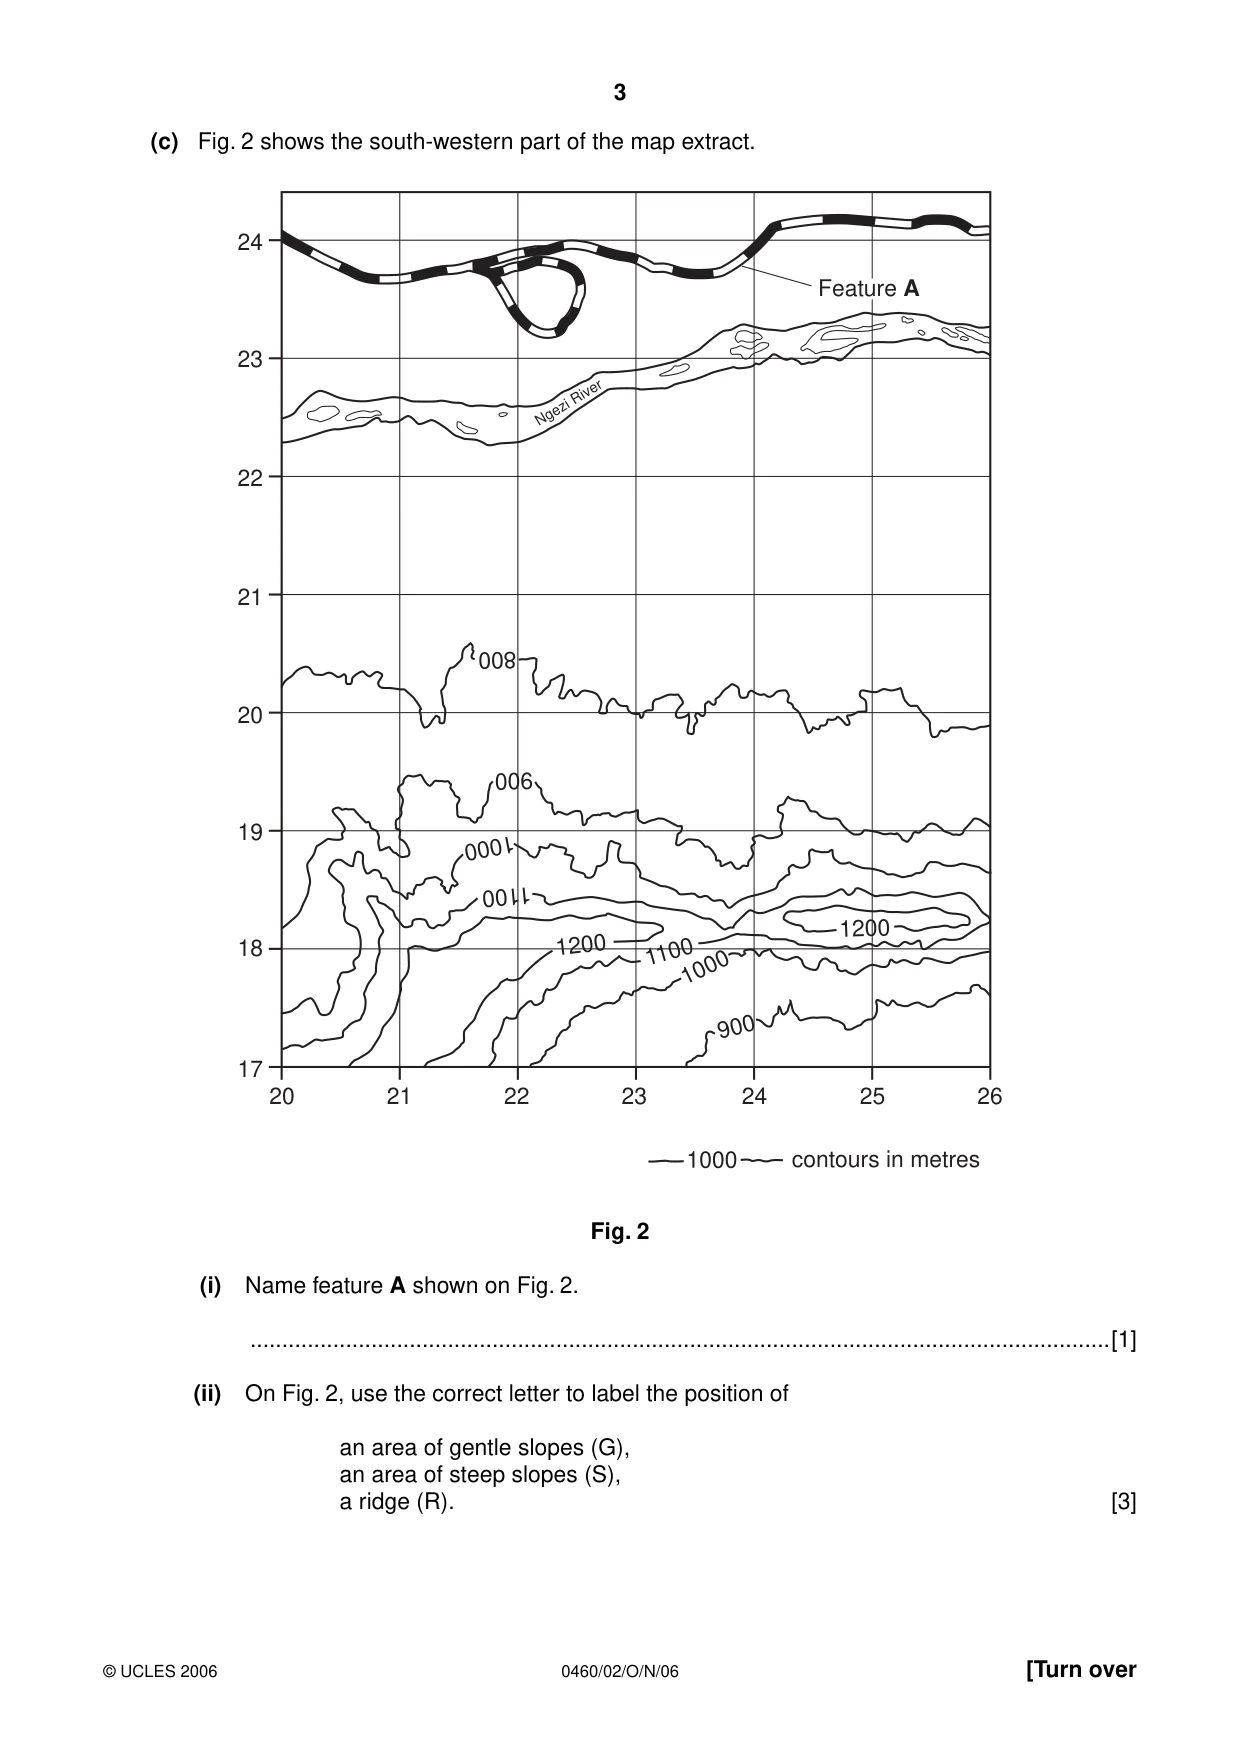
3 0460/02/O/N/06 © UCLES 2006 [Turn over (c) Fig. 2 shows the south-western part of the map extract. 24 23 22 21 Ngezi River 20 20 21 22 23 contours in metres 24 900 1000 1100 1200 1200 1000 1100 1000 900 800 25 26 19 18 17 Feature A Fig. 2 (i) Name feature A shown on Fig. 2. …[1] (ii) On Fig. 2, use the correct letter to label the position of an area of gentle slopes (G), an area of steep slopes (S), a ridge (R). [3]
Question paper, page 4
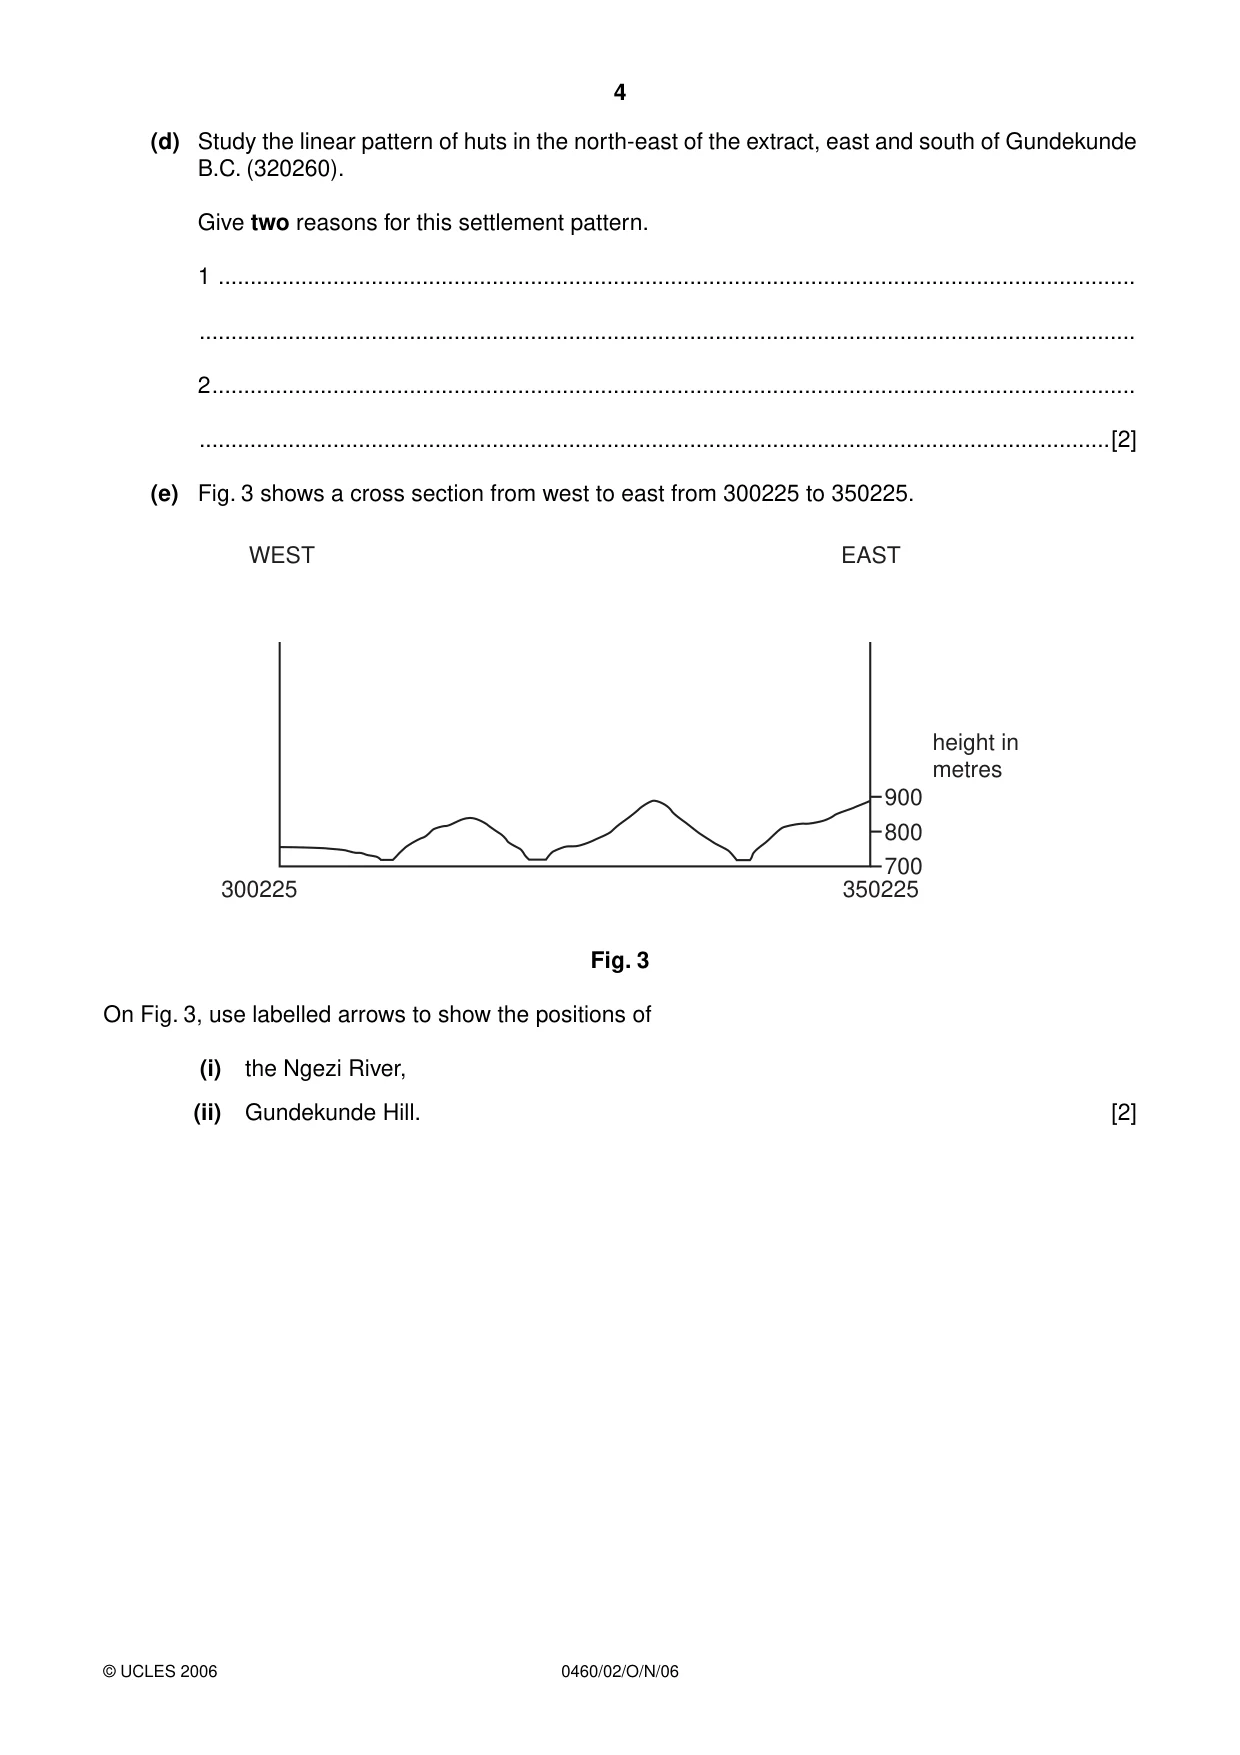
4 0460/02/O/N/06 © UCLES 2006 (d) Study the linear pattern of huts in the north-east of the extract, east and south of Gundekunde B.C. (320260). Give two reasons for this settlement pattern. 1 … … 2 … …[2] (e) Fig. 3 shows a cross section from west to east from 300225 to 350225. WEST 300225 350225 EAST 700 800 900 height in metres Fig. 3 On Fig. 3, use labelled arrows to show the positions of (i) the Ngezi River, (ii) Gundekunde Hill. [2]
Question paper, page 5
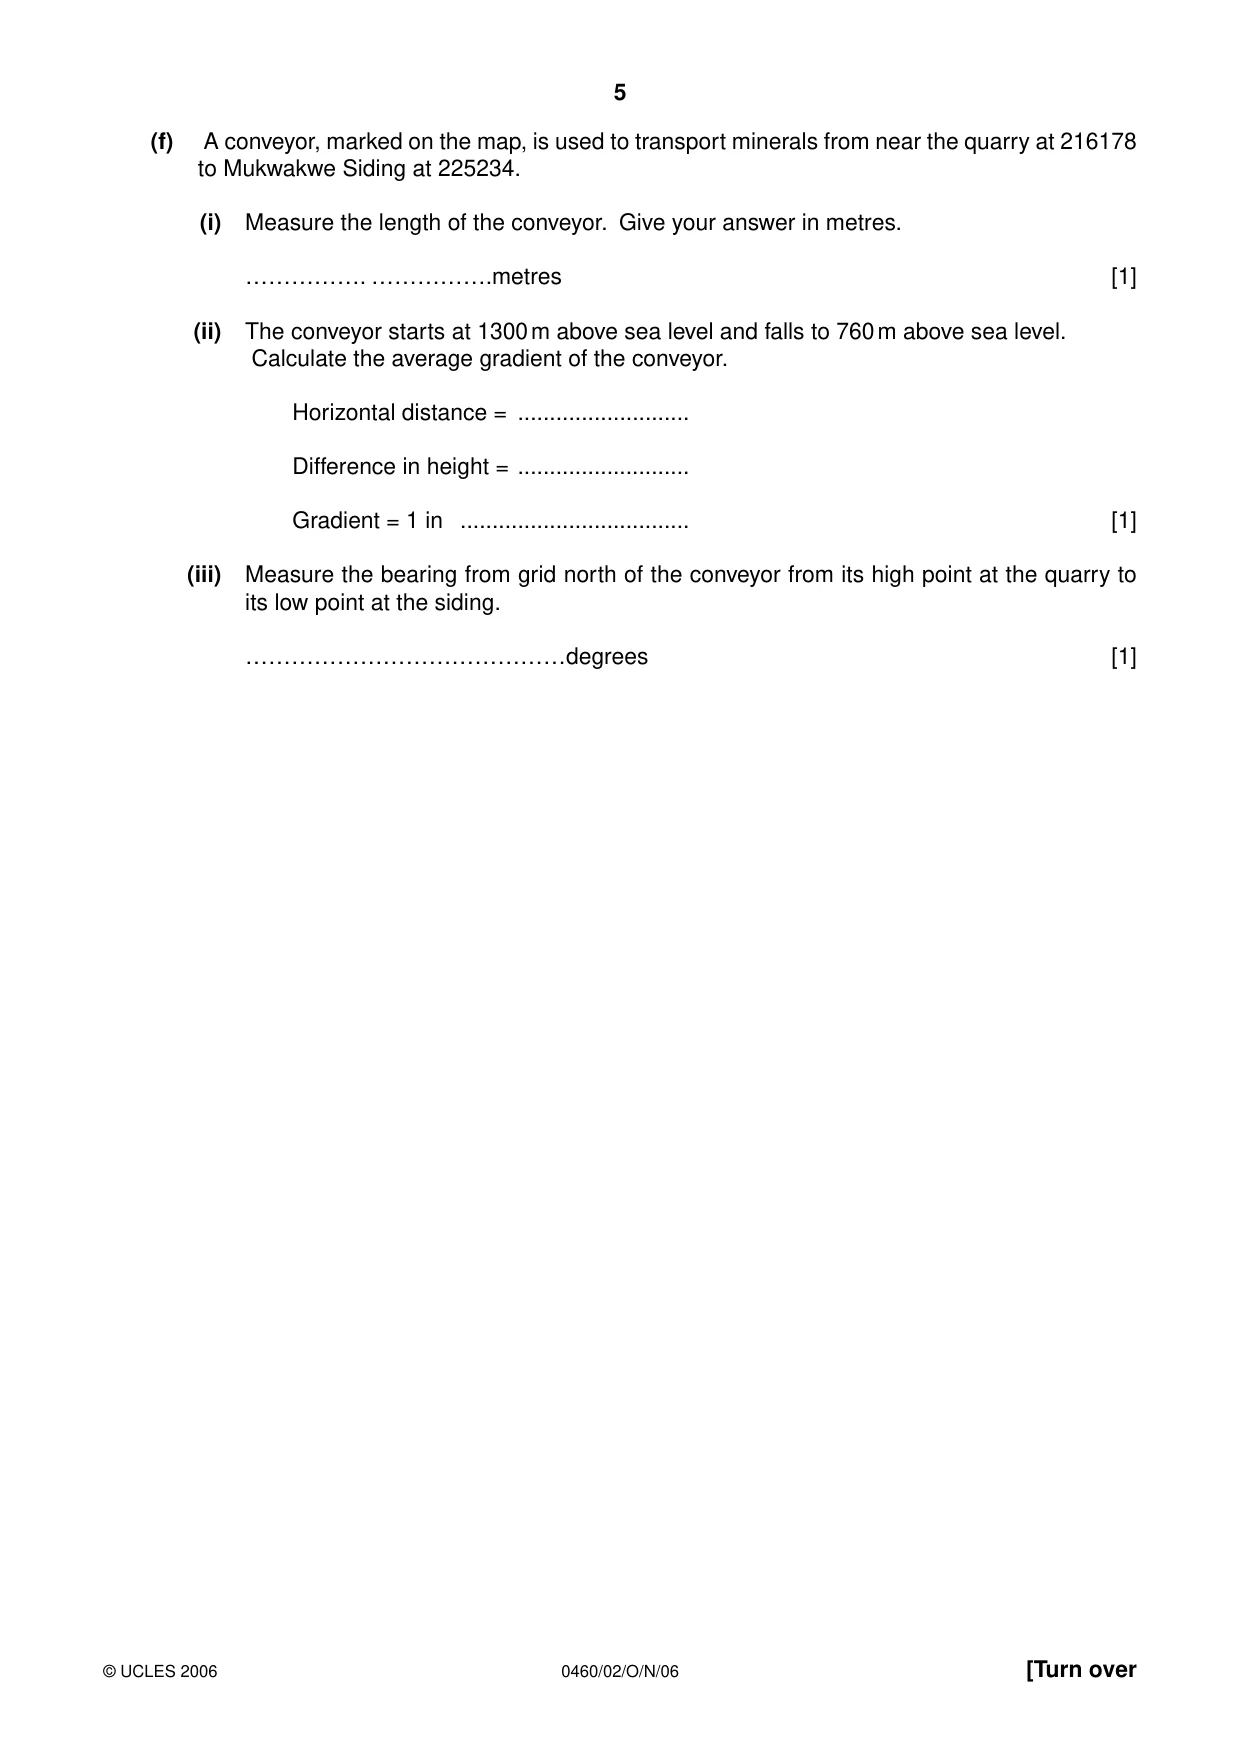
5 0460/02/O/N/06 © UCLES 2006 [Turn over (f) A conveyor, marked on the map, is used to transport minerals from near the quarry at 216178 to Mukwakwe Siding at 225234. (i) Measure the length of the conveyor. Give your answer in metres. ……………. …………….metres [1] (ii) The conveyor starts at 1300 m above sea level and falls to 760 m above sea level. Calculate the average gradient of the conveyor. Horizontal distance = … Difference in height = … Gradient = 1 in … [1] (iii) Measure the bearing from grid north of the conveyor from its high point at the quarry to its low point at the siding. ……………………………………degrees [1]
Question paper, page 6
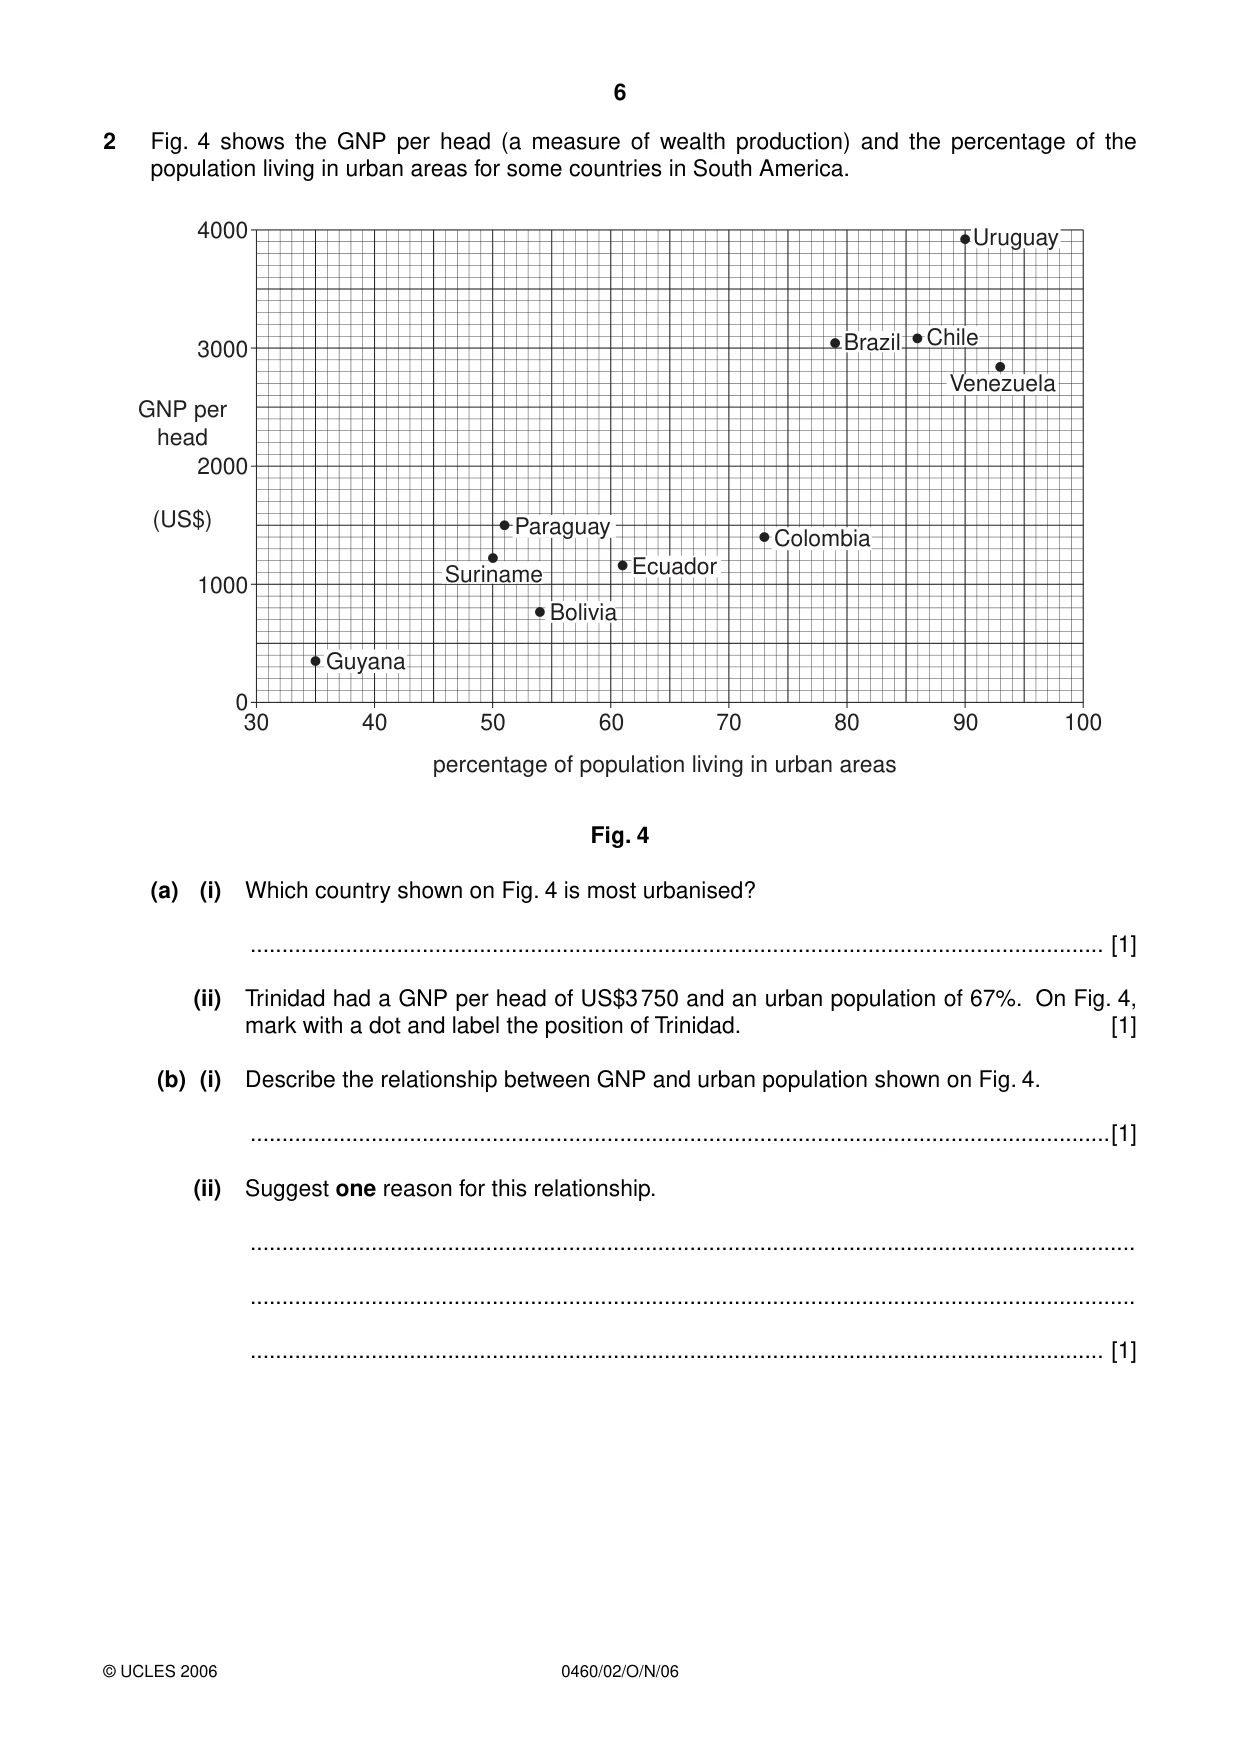
6 0460/02/O/N/06 © UCLES 2006 2 Fig. 4 shows the GNP per head (a measure of wealth production) and the percentage of the population living in urban areas for some countries in South America. 30 1000 0 2000 GNP per head (US$) 3000 4000 40 50 60 percentage of population living in urban areas 70 80 90 100 Bolivia Brazil Chile Colombia Ecuador Guyana Paraguay Uruguay Venezuela Suriname Fig. 4 (a) (i) Which country shown on Fig. 4 is most urbanised? … [1] (ii) Trinidad had a GNP per head of US$3 750 and an urban population of 67%. On Fig. 4, mark with a dot and label the position of Trinidad. [1] (b) (i) Describe the relationship between GNP and urban population shown on Fig. 4. …[1] (ii) Suggest one reason for this relationship. … … … [1]
Question paper, page 7
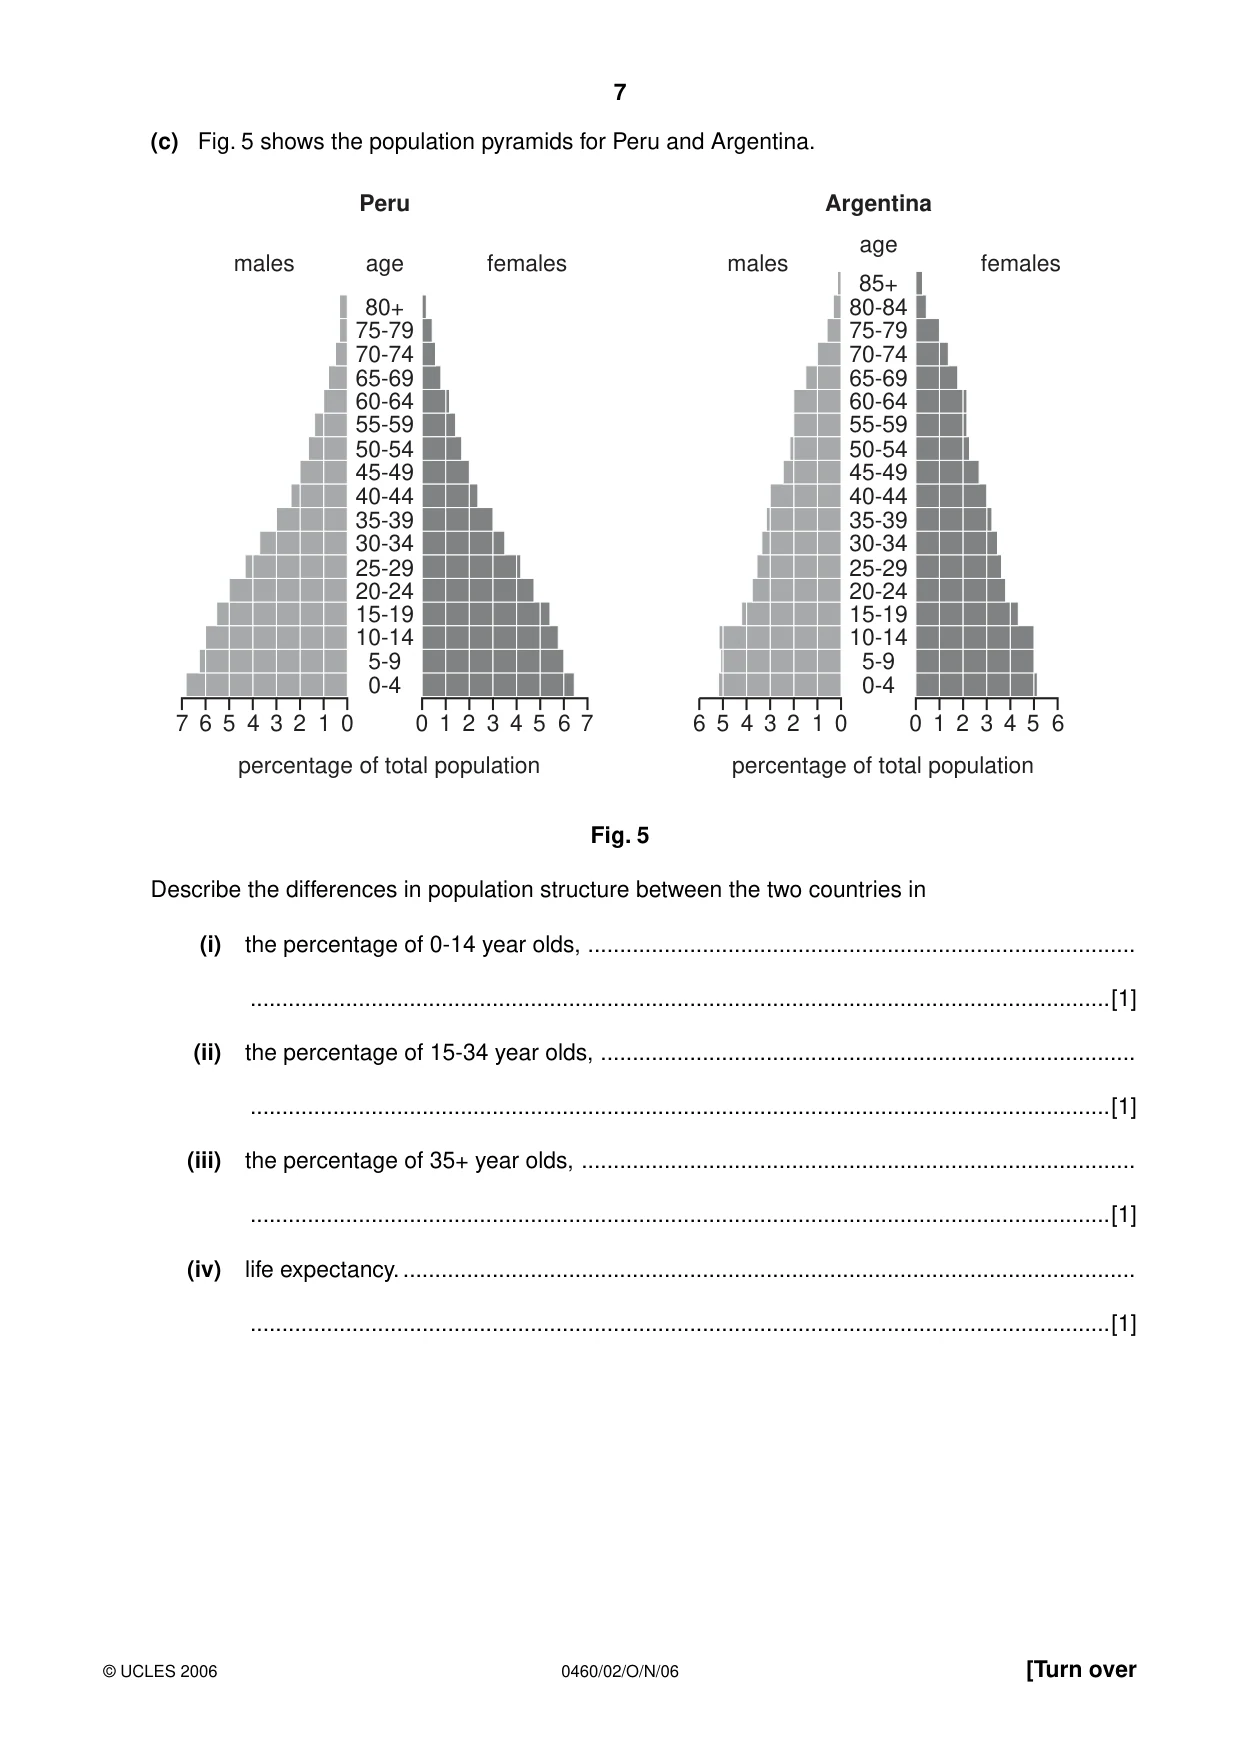
7 0460/02/O/N/06 © UCLES 2006 [Turn over (c) Fig. 5 shows the population pyramids for Peru and Argentina. 0 3 6 7 4 1 5 2 7 4 1 0 0-4 5-9 10-14 15-19 20-24 25-29 30-34 35-39 40-44 45-49 50-54 55-59 60-64 65-69 70-74 75-79 80+ age Peru males females percentage of total population 3 6 2 5 0 3 6 4 1 5 2 4 1 0 0-4 5-9 10-14 15-19 20-24 25-29 30-34 35-39 40-44 45-49 50-54 55-59 60-64 65-69 70-74 75-79 80-84 85+ age Argentina males females percentage of total population 3 6 2 5 Fig. 5 Describe the differences in population structure between the two countries in (i) the percentage of 0-14 year olds, … …[1] (ii) the percentage of 15-34 year olds, … …[1] (iii) the percentage of 35+ year olds, … …[1] (iv) life expectancy. … …[1]
Question paper, page 8
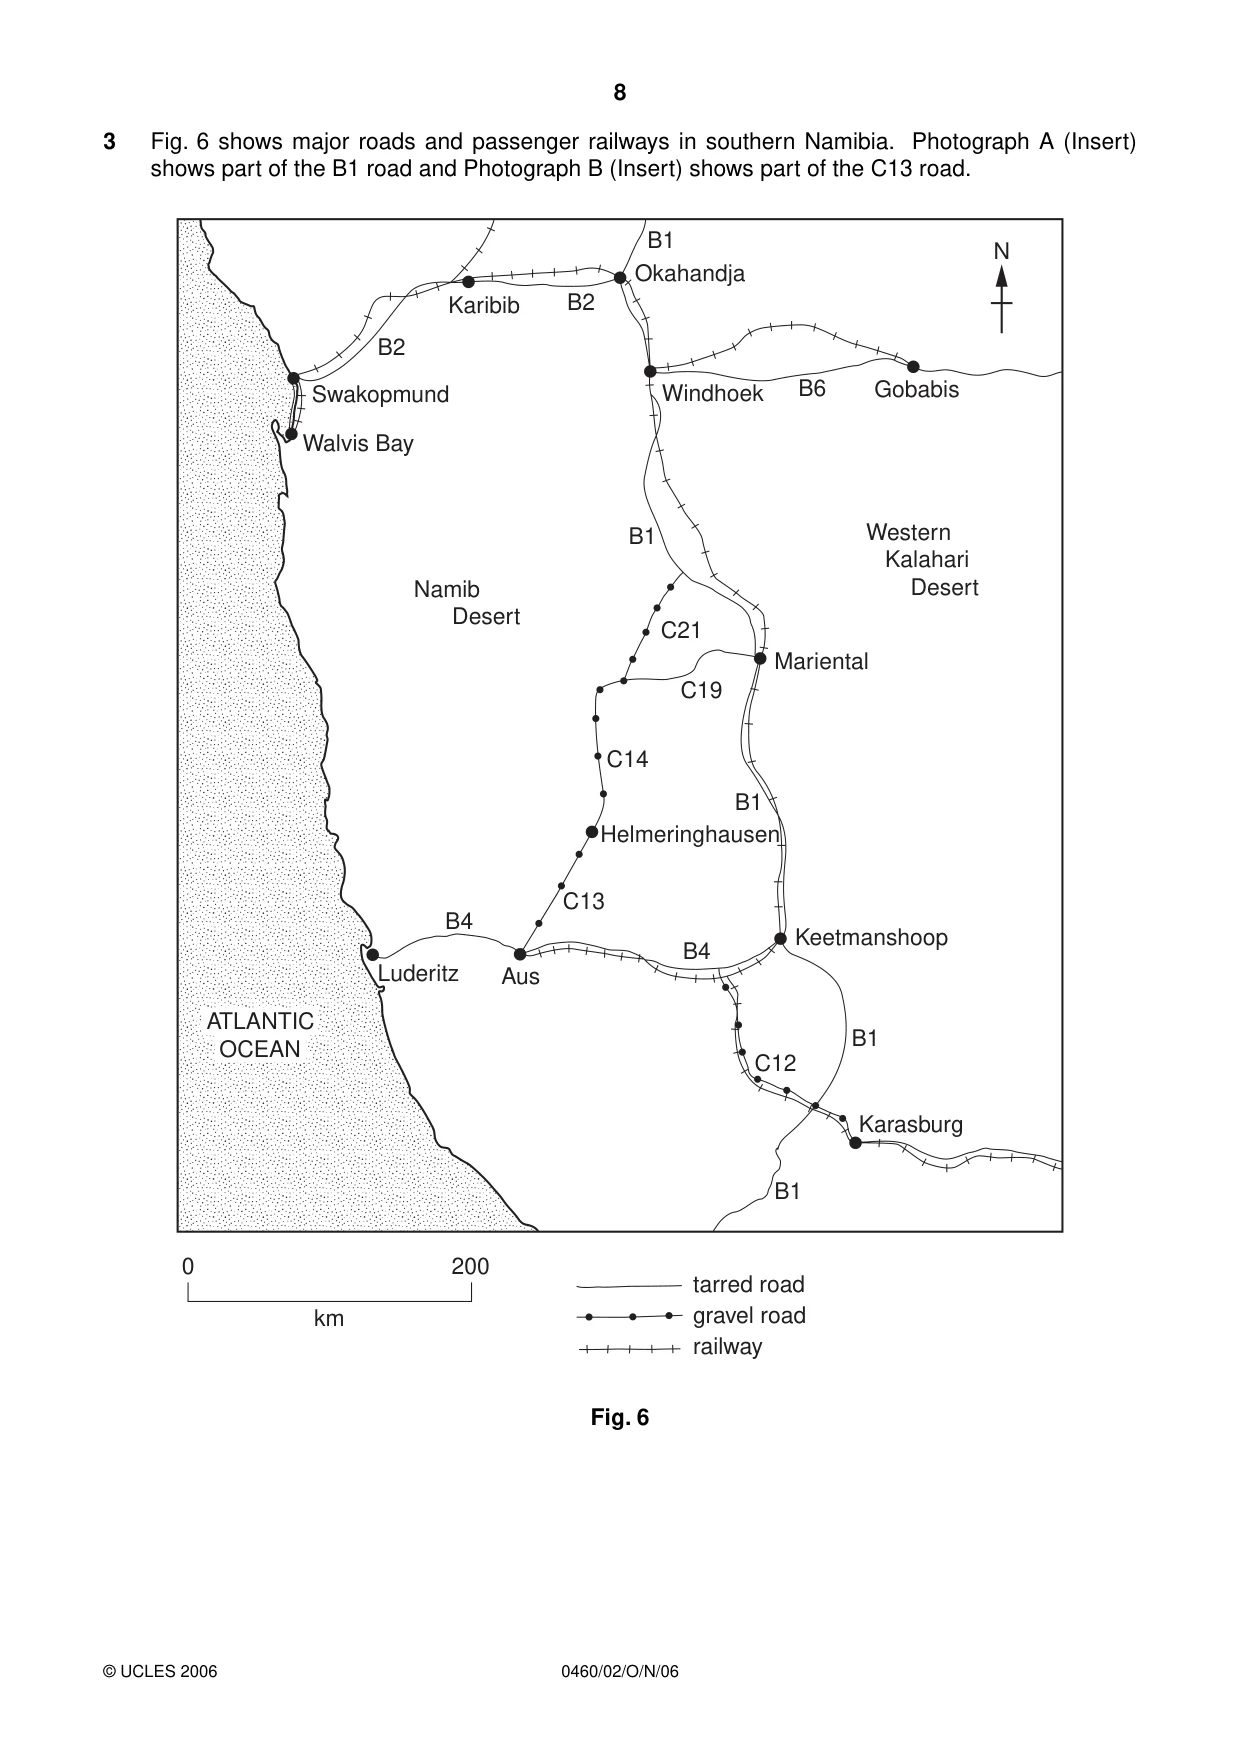
8 0460/02/O/N/06 © UCLES 2006 3 Fig. 6 shows major roads and passenger railways in southern Namibia. Photograph A (Insert) shows part of the B1 road and Photograph B (Insert) shows part of the C13 road. Namib Desert Western Kalahari Desert Helmeringhausen Keetmanshoop Mariental Luderitz 0 200 km Karasburg tarred road gravel road railway Aus Gobabis N Windhoek Walvis Bay Swakopmund B2 B2 B1 B1 B4 B6 C21 C19 B1 B1 B1 B4 C14 C13 C12 Karibib Okahandja ATLANTIC OCEAN Fig. 6
Question paper, page 9
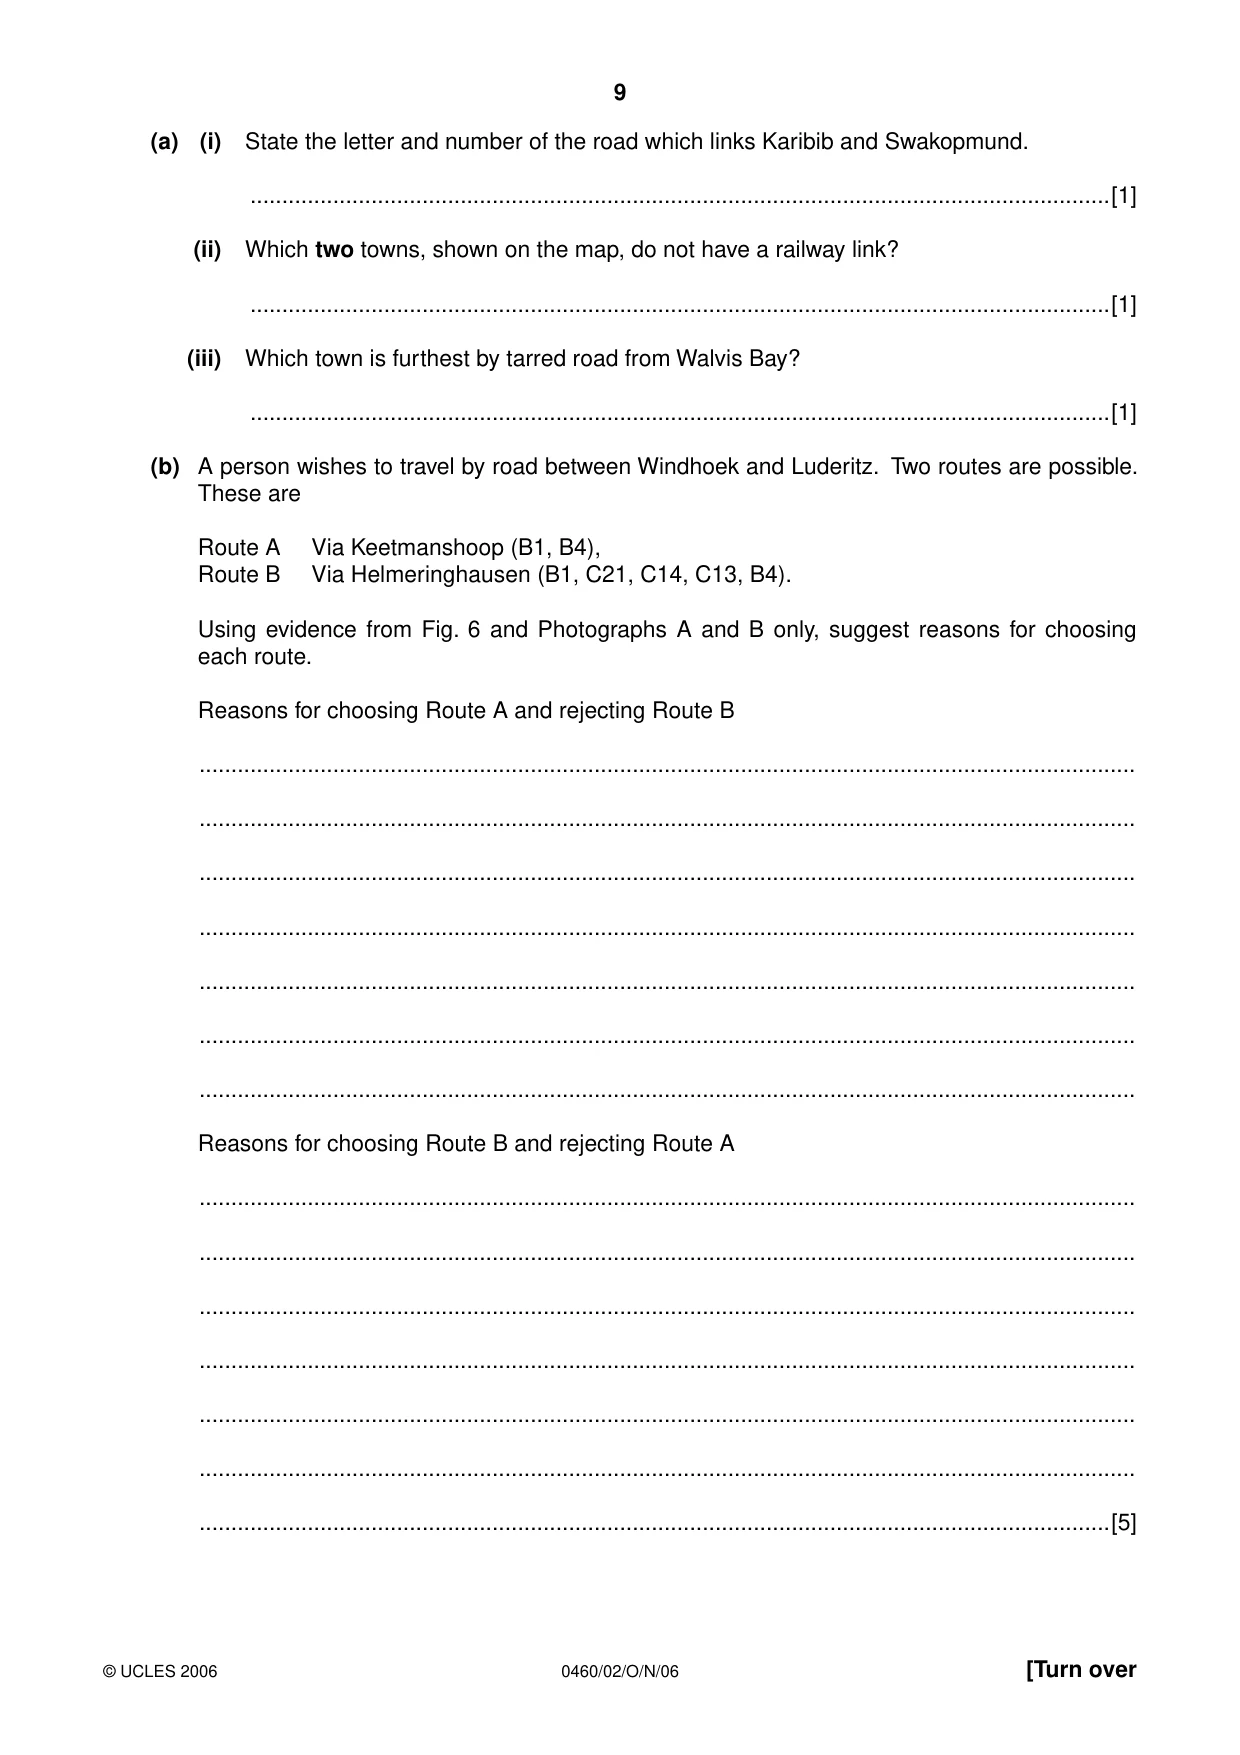
9 0460/02/O/N/06 © UCLES 2006 [Turn over (a) (i) State the letter and number of the road which links Karibib and Swakopmund. …[1] (ii) Which two towns, shown on the map, do not have a railway link? …[1] (iii) Which town is furthest by tarred road from Walvis Bay? …[1] (b) A person wishes to travel by road between Windhoek and Luderitz. Two routes are possible. These are Route A Via Keetmanshoop (B1, B4), Route B Via Helmeringhausen (B1, C21, C14, C13, B4). Using evidence from Fig. 6 and Photographs A and B only, suggest reasons for choosing each route. Reasons for choosing Route A and rejecting Route B … … … … … … … Reasons for choosing Route B and rejecting Route A … … … … … … …[5]
Question paper, page 10
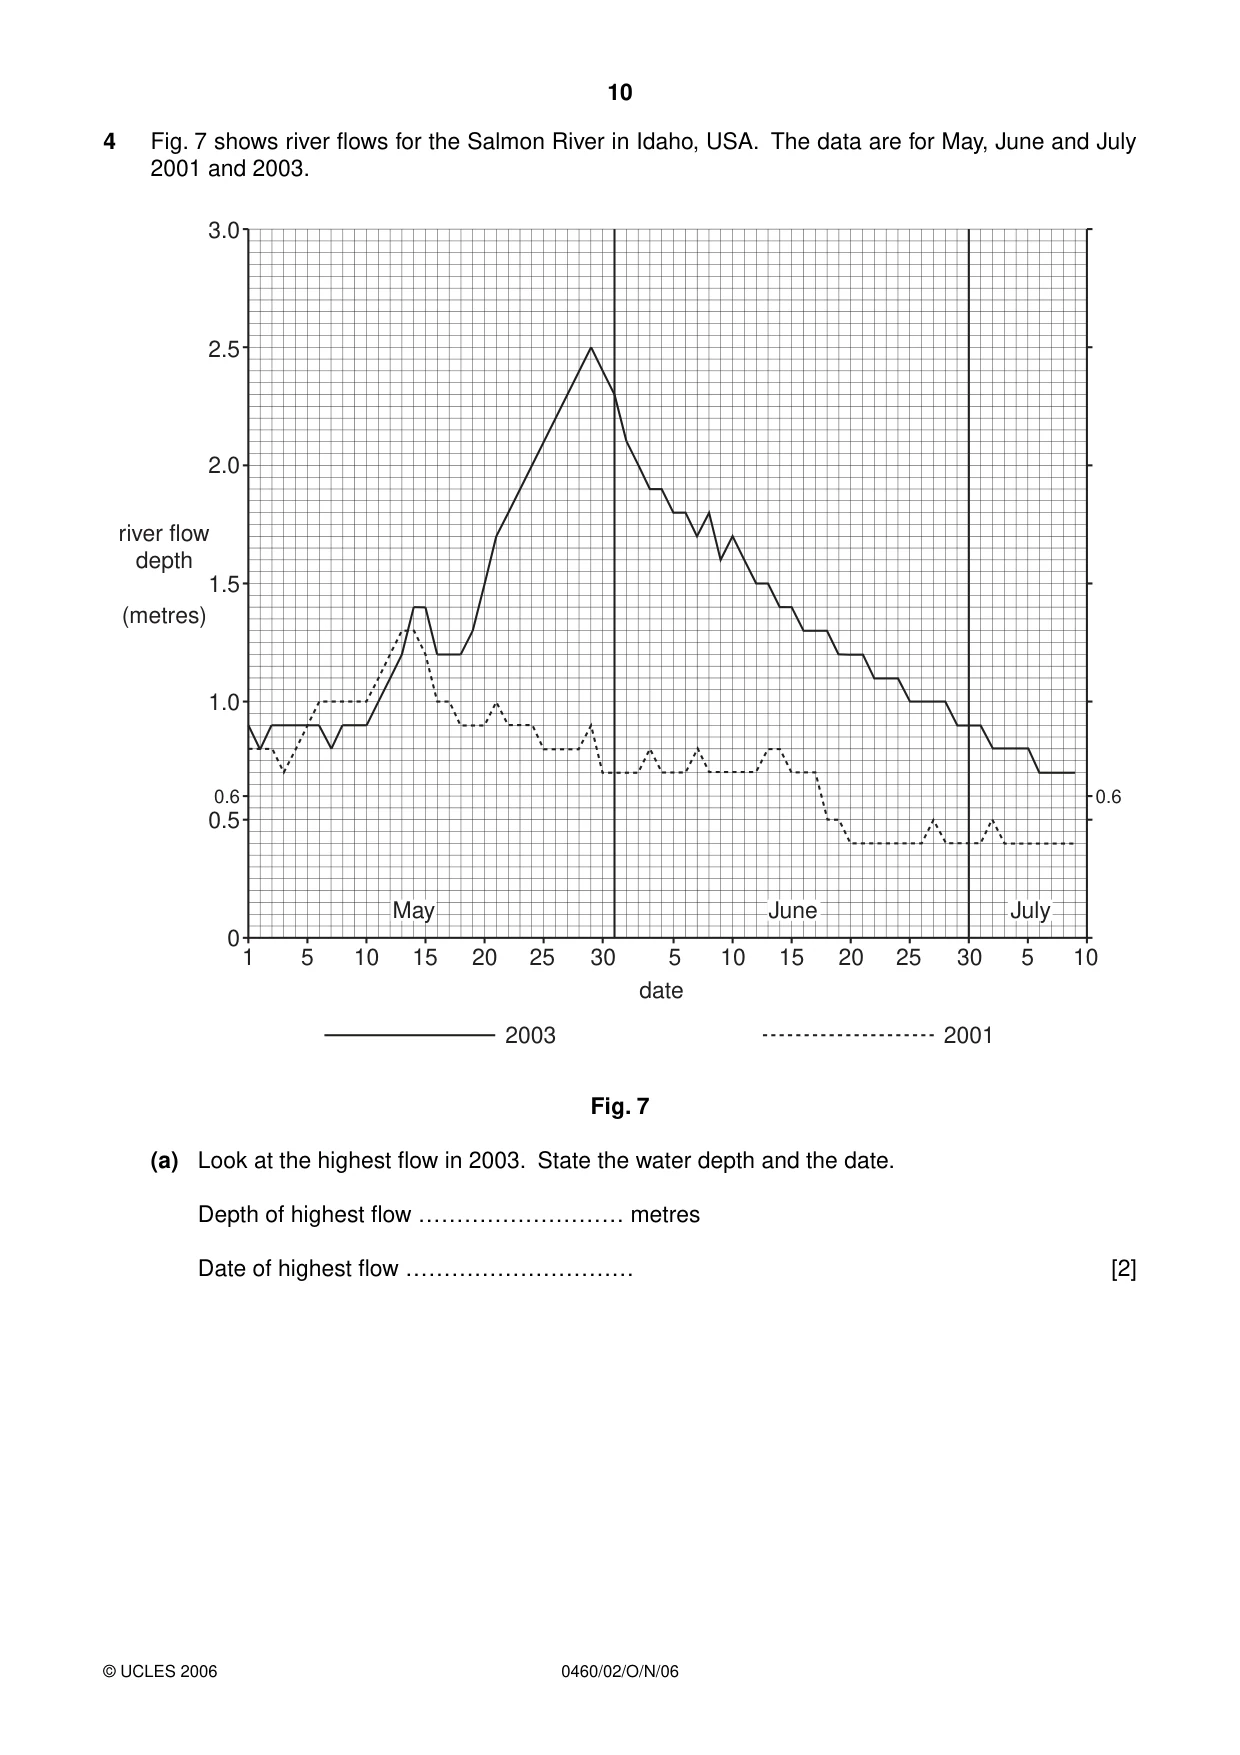
10 0460/02/O/N/06 © UCLES 2006 4 Fig. 7 shows river flows for the Salmon River in Idaho, USA. The data are for May, June and July 2001 and 2003. 1 5 5 0.5 0.6 0.6 0 1.0 river flow depth (metres) 1.5 2.0 2.5 3.0 10 15 25 20 30 10 5 10 15 25 20 30 date 2003 2001 May June July Fig. 7 (a) Look at the highest flow in 2003. State the water depth and the date. Depth of highest flow ……………………… metres Date of highest flow ………………………… [2]
Question paper, page 11
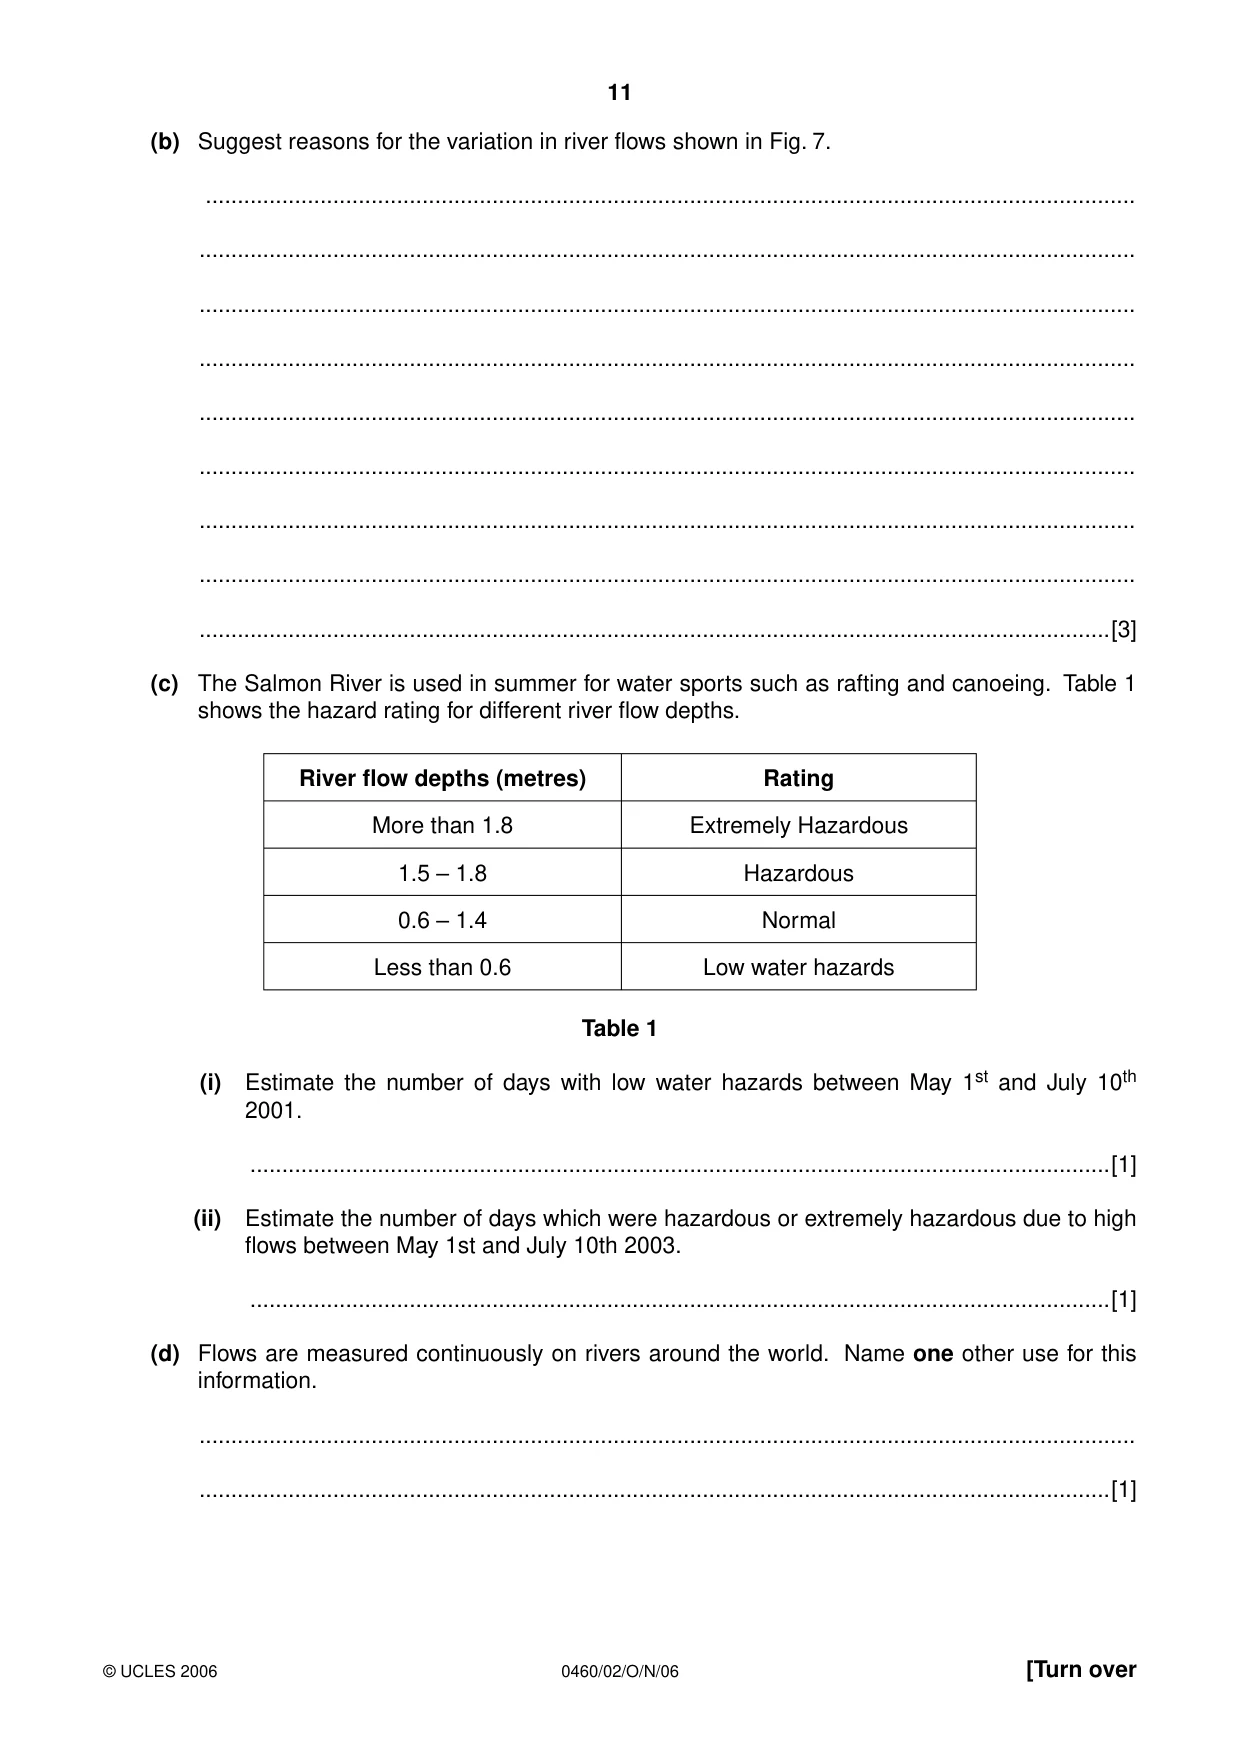
11 0460/02/O/N/06 © UCLES 2006 [Turn over (b) Suggest reasons for the variation in river flows shown in Fig. 7. … … … … … … … … …[3] (c) The Salmon River is used in summer for water sports such as rafting and canoeing. Table 1 shows the hazard rating for different river flow depths. River flow depths (metres) Rating More than 1.8 Extremely Hazardous 1.5 – 1.8 Hazardous 0.6 – 1.4 Normal Less than 0.6 Low water hazards Table 1 (i) Estimate the number of days with low water hazards between May 1st and July 10th 2001. …[1] (ii) Estimate the number of days which were hazardous or extremely hazardous due to high flows between May 1st and July 10th 2003. …[1] (d) Flows are measured continuously on rivers around the world. Name one other use for this information. … …[1]
Question paper, page 12
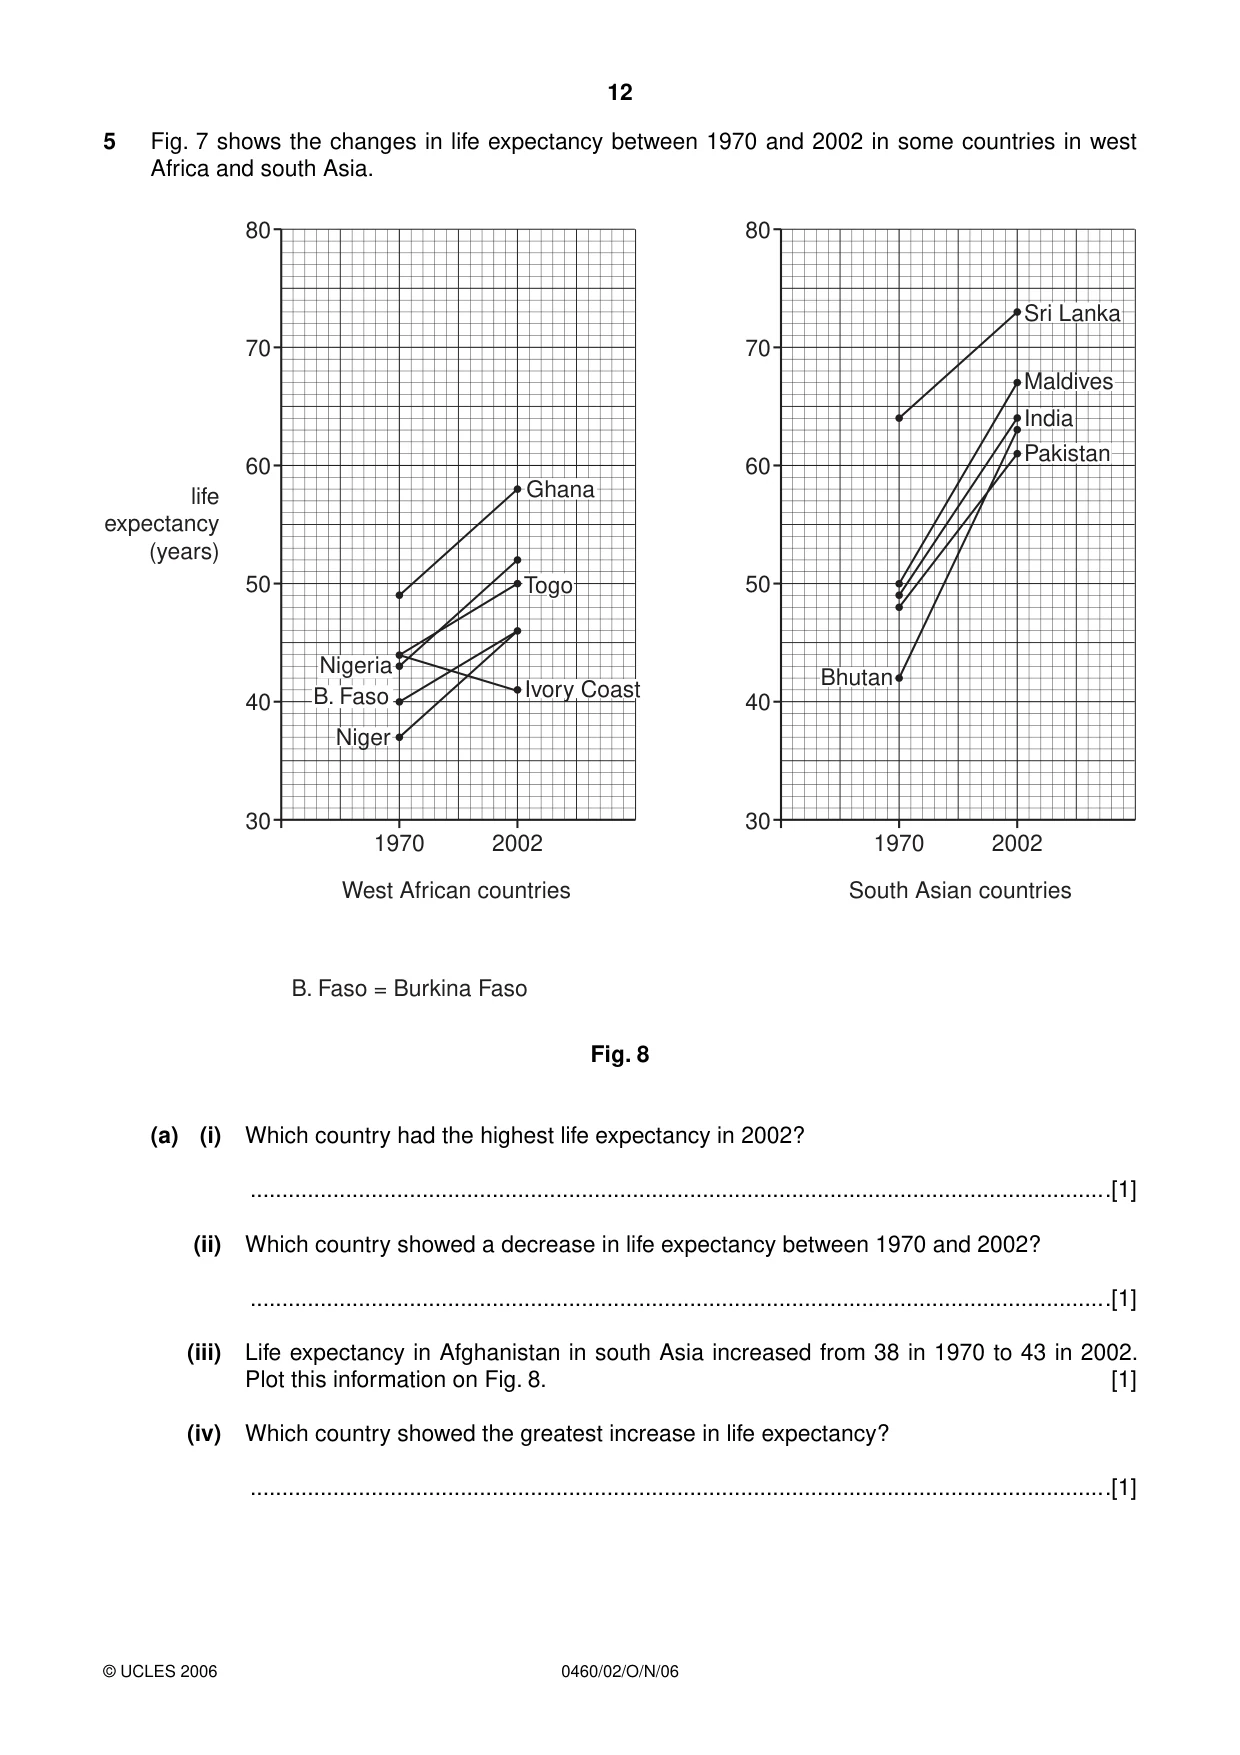
12 0460/02/O/N/06 © UCLES 2006 5 Fig. 7 shows the changes in life expectancy between 1970 and 2002 in some countries in west Africa and south Asia. 30 1970 2002 West African countries B. Faso = Burkina Faso life expectancy (years) South Asian countries 40 50 60 70 80 30 1970 2002 40 50 60 70 80 Nigeria Togo Ghana Ivory Coast Niger B. Faso India Pakistan Sri Lanka Maldives Bhutan Fig. 8 (a) (i) Which country had the highest life expectancy in 2002? …[1] (ii) Which country showed a decrease in life expectancy between 1970 and 2002? …[1] (iii) Life expectancy in Afghanistan in south Asia increased from 38 in 1970 to 43 in 2002. Plot this information on Fig. 8. [1] (iv) Which country showed the greatest increase in life expectancy? …[1]
Question paper, page 13
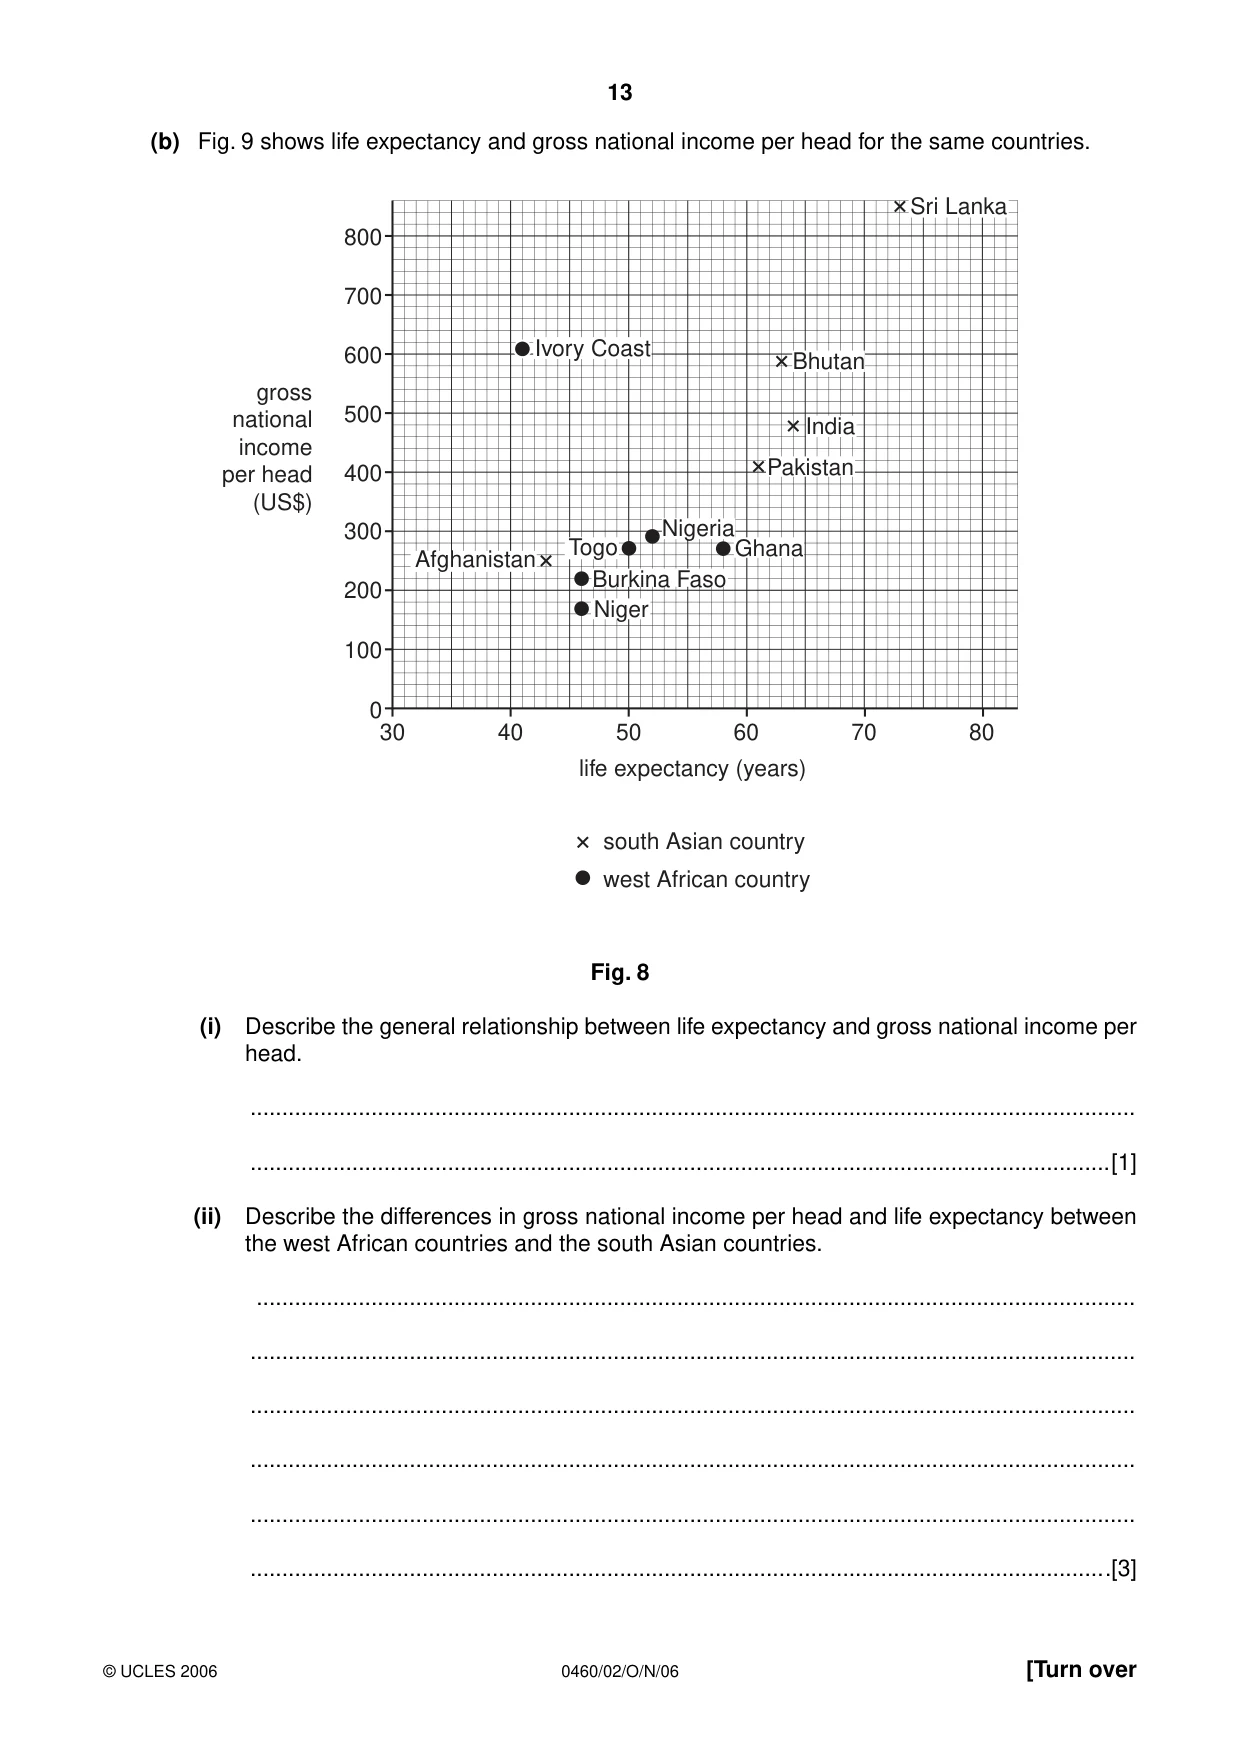
13 0460/02/O/N/06 © UCLES 2006 [Turn over (b) Fig. 9 shows life expectancy and gross national income per head for the same countries. 0 40 30 50 60 70 80 life expectancy (years) west African country south Asian country gross national income per head (US$) 100 200 300 400 500 600 700 800 Nigeria Togo Ghana Ivory Coast Niger Burkina Faso India Pakistan Sri Lanka Bhutan Afghanistan Fig. 8 (i) Describe the general relationship between life expectancy and gross national income per head. … …[1] (ii) Describe the differences in gross national income per head and life expectancy between the west African countries and the south Asian countries. … … … … … …[3]
Question paper, page 14
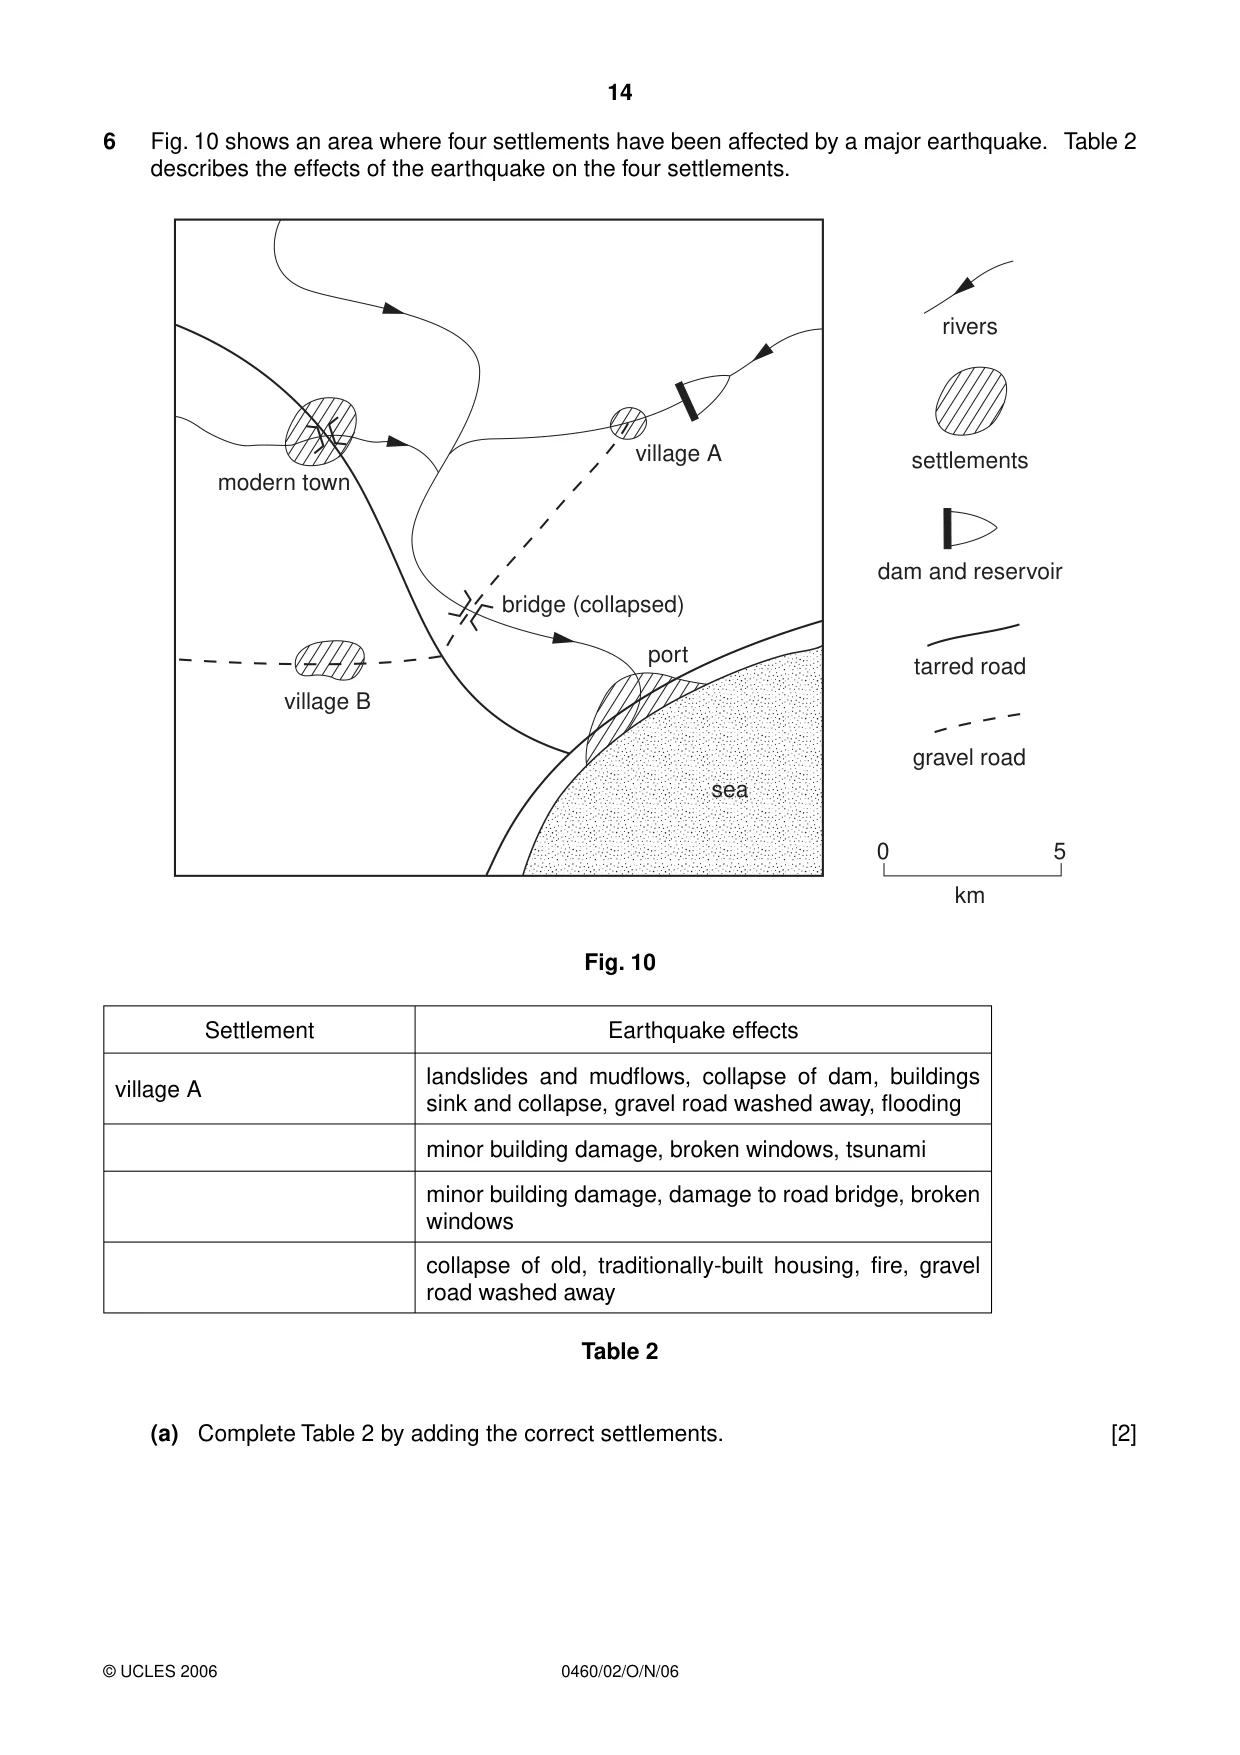
14 0460/02/O/N/06 © UCLES 2006 6 Fig. 10 shows an area where four settlements have been affected by a major earthquake. Table 2 describes the effects of the earthquake on the four settlements. village A rivers settlements dam and reservoir tarred road gravel road 5 0 km village B modern town bridge (collapsed) port sea Fig. 10 Settlement Earthquake effects village A landslides and mudflows, collapse of dam, buildings sink and collapse, gravel road washed away, flooding minor building damage, broken windows, tsunami minor building damage, damage to road bridge, broken windows collapse of old, traditionally-built housing, fire, gravel road washed away Table 2 (a) Complete Table 2 by adding the correct settlements. [2]
Question paper, page 15
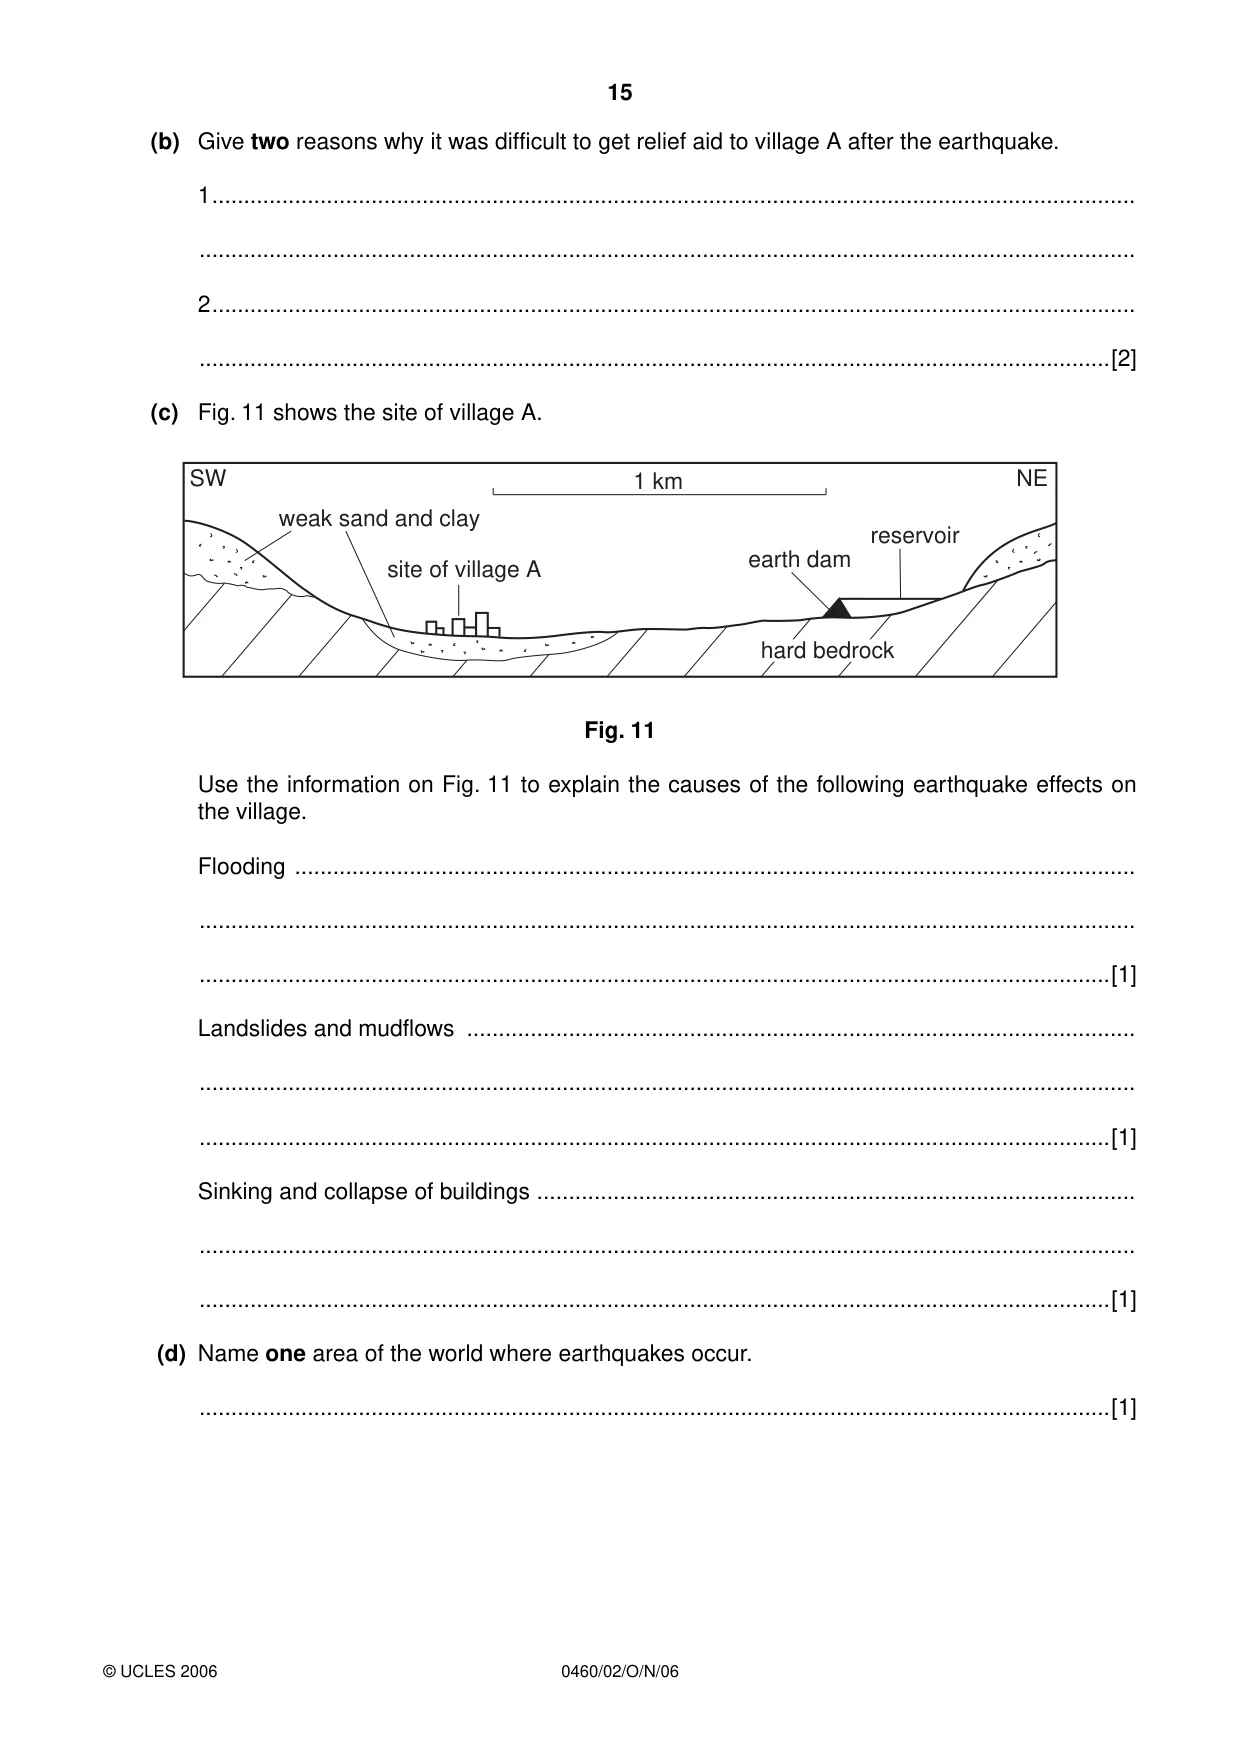
15 0460/02/O/N/06 © UCLES 2006 (b) Give two reasons why it was difficult to get relief aid to village A after the earthquake. 1 … … 2 … …[2] (c) Fig. 11 shows the site of village A. reservoir earth dam site of village A weak sand and clay NE SW 1 km hard bedrock Fig. 11 Use the information on Fig. 11 to explain the causes of the following earthquake effects on the village. Flooding … … …[1] Landslides and mudflows … … …[1] Sinking and collapse of buildings … … …[1] (d) Name one area of the world where earthquakes occur. …[1]
Question paper, page 16
16 0460/02/O/N/06 BLANK PAGE Copyright Acknowledgements: Question 3. Photograph A; D. Kelly © UCLES Question 3. Photograph B; D. Kelly © UCLES Permission to reproduce items where third-party owned material protected by copyright is included has been sought and cleared where possible. Every reasonable effort has been made by the publisher (UCLES) to trace copyright holders, but if any items requiring clearance have unwittingly been included, the publisher will be pleased to make amends at the earliest possible opportunity. University of Cambridge International Examinations is part of the University of Cambridge Local Examinations Syndicate (UCLES), which is itself a department of the University of Cambridge.
Mark scheme, page 1
UNIVERSITY OF CAMBRIDGE INTERNATIONAL EXAMINATIONS International General Certificate of Secondary Education MARK SCHEME for the October/November 2006 question paper 0460 GEOGRAPHY 0460/2 Paper 2, maximum raw mark 60 This mark scheme is published as an aid to teachers and students, to indicate the requirements of the examination. It shows the basis on which Examiners were instructed to award marks. It does not indicate the details of the discussions that took place at an Examiners’ meeting before marking began. All Examiners are instructed that alternative correct answers and unexpected approaches in candidates’ scripts must be given marks that fairly reflect the relevant knowledge and skills demonstrated. Mark schemes must be read in conjunction with the question papers and the report on the examination. The grade thresholds for various grades are published in the report on the examination for most IGCSE, GCE Advanced Level and Advanced Subsidiary Level syllabuses. • CIE will not enter into discussions or correspondence in connection with these mark schemes. CIE is publishing the mark schemes for the October/November 2006 question papers for most IGCSE, GCE Advanced Level and Advanced Subsidiary Level syllabuses and some Ordinary Level syllabuses. www.XtremePapers.com
Mark scheme, page 2
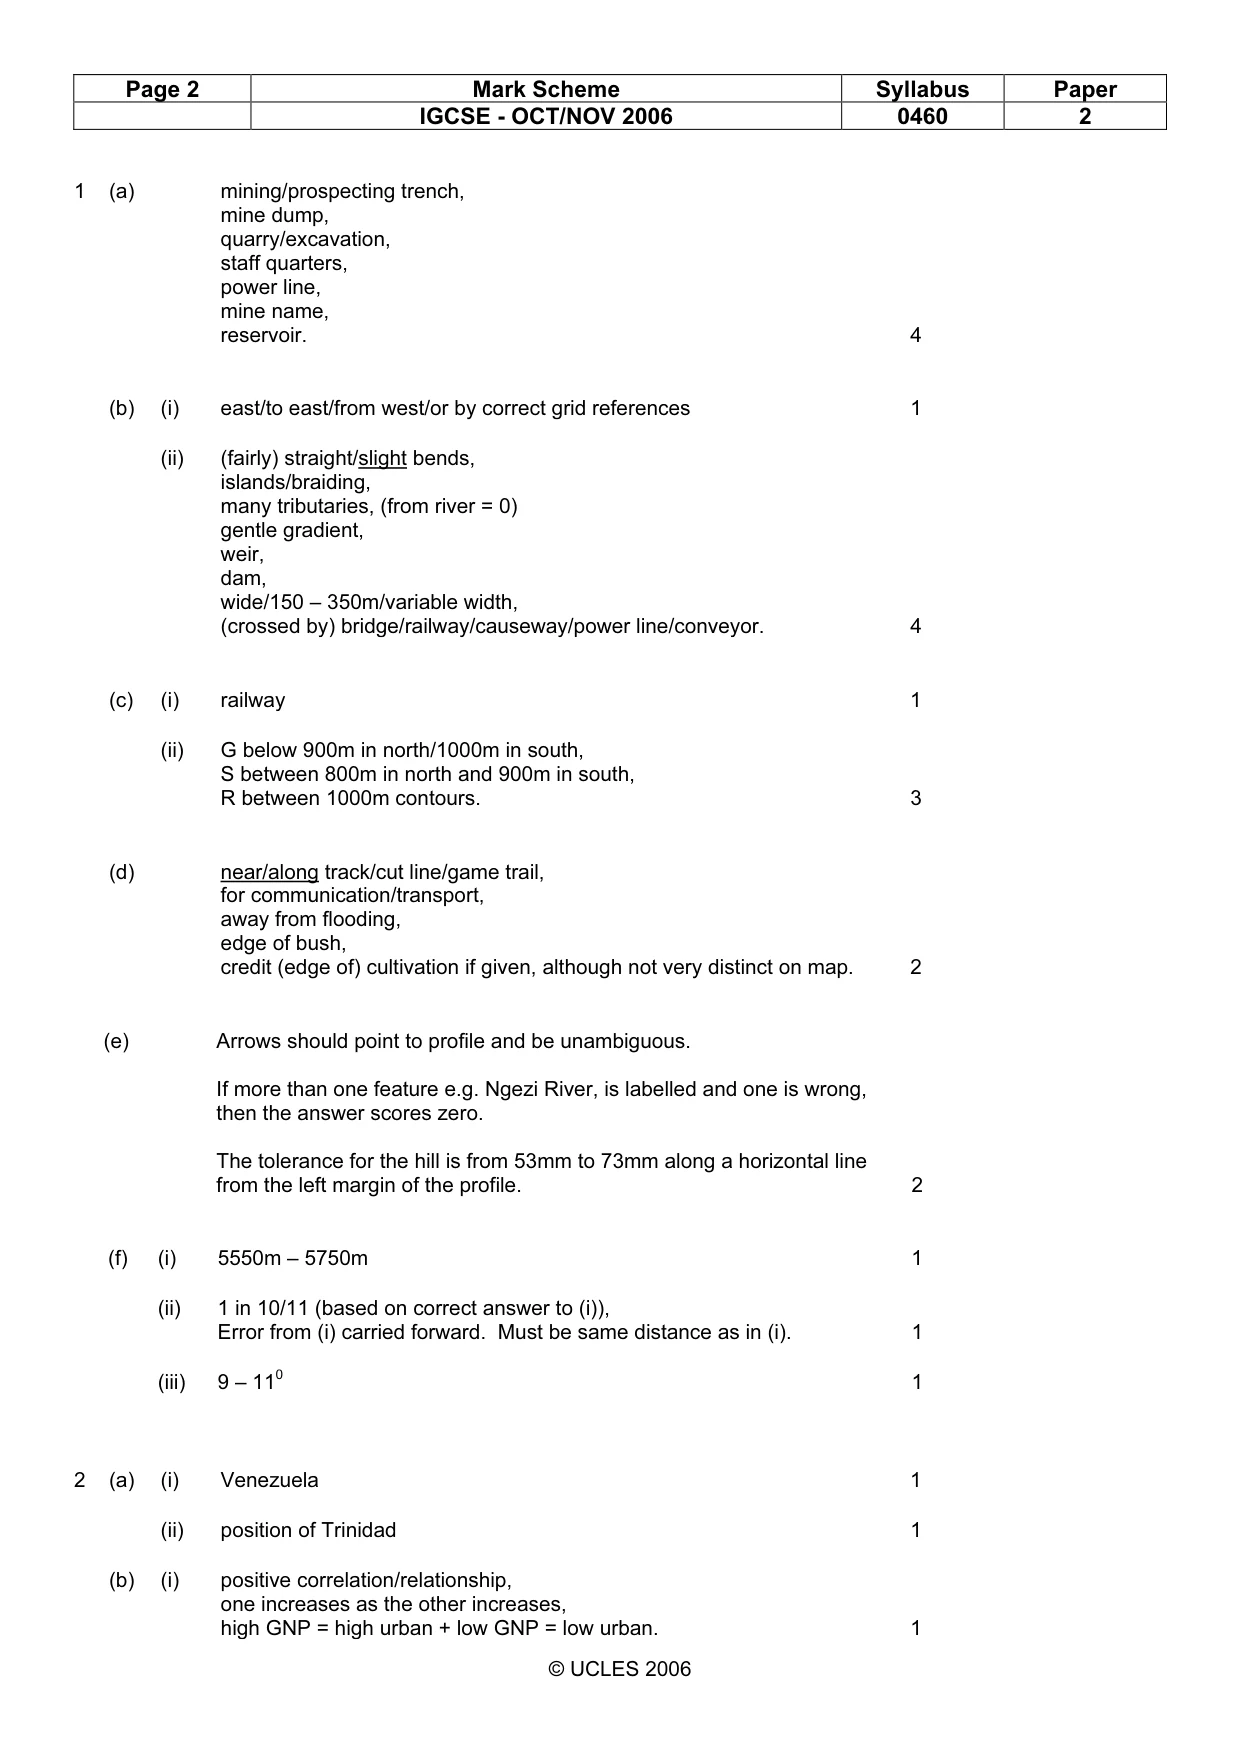
Page 2 Mark Scheme Syllabus Paper IGCSE - OCT/NOV 2006 0460 2 © UCLES 2006 1 (a) mining/prospecting trench, mine dump, quarry/excavation, staff quarters, power line, mine name, reservoir. 4 (b) (i) east/to east/from west/or by correct grid references 1 (ii) (fairly) straight/slight bends, islands/braiding, many tributaries, (from river = 0) gentle gradient, weir, dam, wide/150 – 350m/variable width, (crossed by) bridge/railway/causeway/power line/conveyor. 4 (c) (i) railway 1 (ii) G below 900m in north/1000m in south, S between 800m in north and 900m in south, R between 1000m contours. 3 (d) near/along track/cut line/game trail, for communication/transport, away from flooding, edge of bush, credit (edge of) cultivation if given, although not very distinct on map. 2 (e) Arrows should point to profile and be unambiguous. If more than one feature e.g. Ngezi River, is labelled and one is wrong, then the answer scores zero. The tolerance for the hill is from 53mm to 73mm along a horizontal line from the left margin of the profile. 2 (f) (i) 5550m – 5750m 1 (ii) 1 in 10/11 (based on correct answer to (i)), Error from (i) carried forward. Must be same distance as in (i). 1 (iii) 9 – 110 1 2 (a) (i) Venezuela 1 (ii) position of Trinidad 1 (b) (i) positive correlation/relationship, one increases as the other increases, high GNP = high urban + low GNP = low urban. 1
Mark scheme, page 3
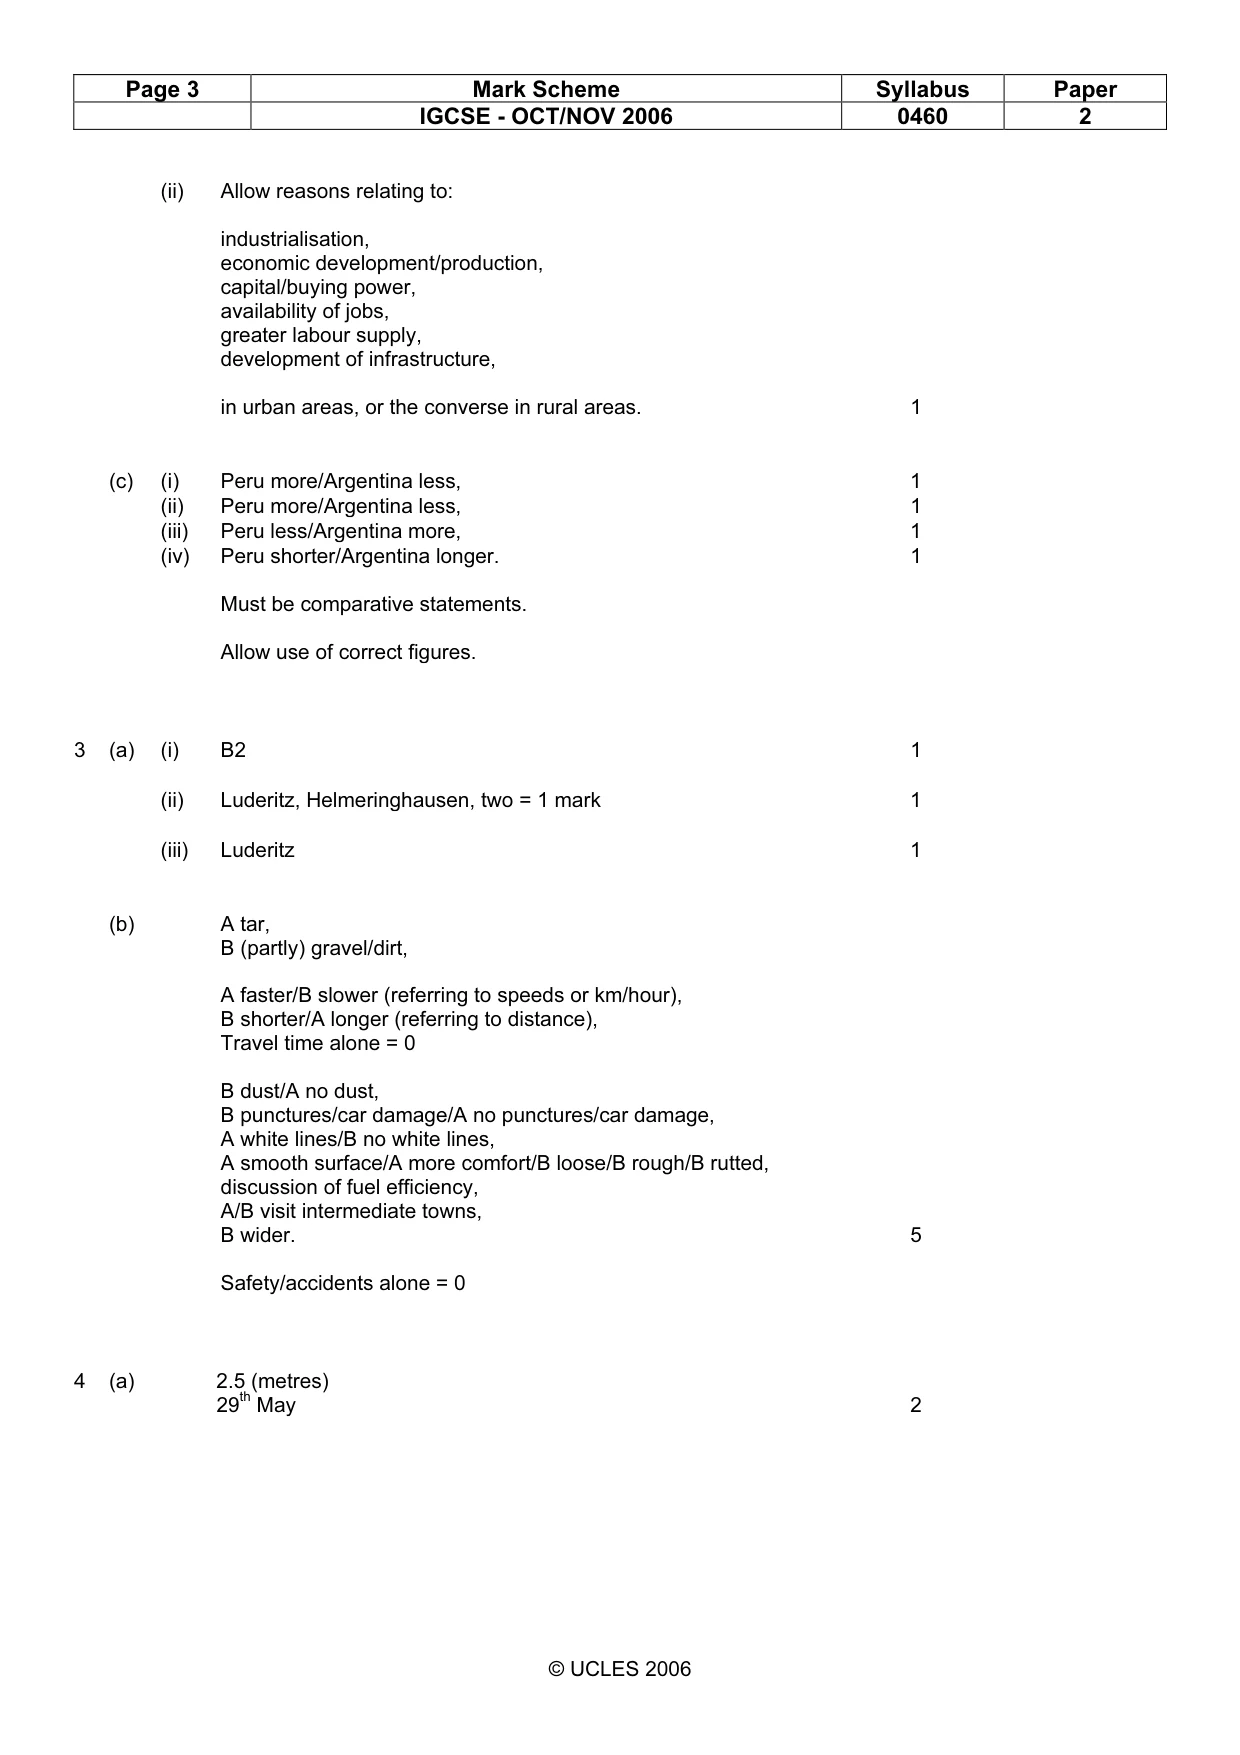
Page 3 Mark Scheme Syllabus Paper IGCSE - OCT/NOV 2006 0460 2 © UCLES 2006 (ii) Allow reasons relating to: industrialisation, economic development/production, capital/buying power, availability of jobs, greater labour supply, development of infrastructure, in urban areas, or the converse in rural areas. 1 (c) (i) Peru more/Argentina less, 1 (ii) Peru more/Argentina less, 1 (iii) Peru less/Argentina more, 1 (iv) Peru shorter/Argentina longer. Must be comparative statements. Allow use of correct figures. 1 3 (a) (i) B2 1 (ii) Luderitz, Helmeringhausen, two = 1 mark 1 (iii) Luderitz 1 (b) A tar, B (partly) gravel/dirt, A faster/B slower (referring to speeds or km/hour), B shorter/A longer (referring to distance), Travel time alone = 0 B dust/A no dust, B punctures/car damage/A no punctures/car damage, A white lines/B no white lines, A smooth surface/A more comfort/B loose/B rough/B rutted, discussion of fuel efficiency, A/B visit intermediate towns, B wider. Safety/accidents alone = 0 5 4 (a) 2.5 (metres) 29th May 2
Mark scheme, page 4
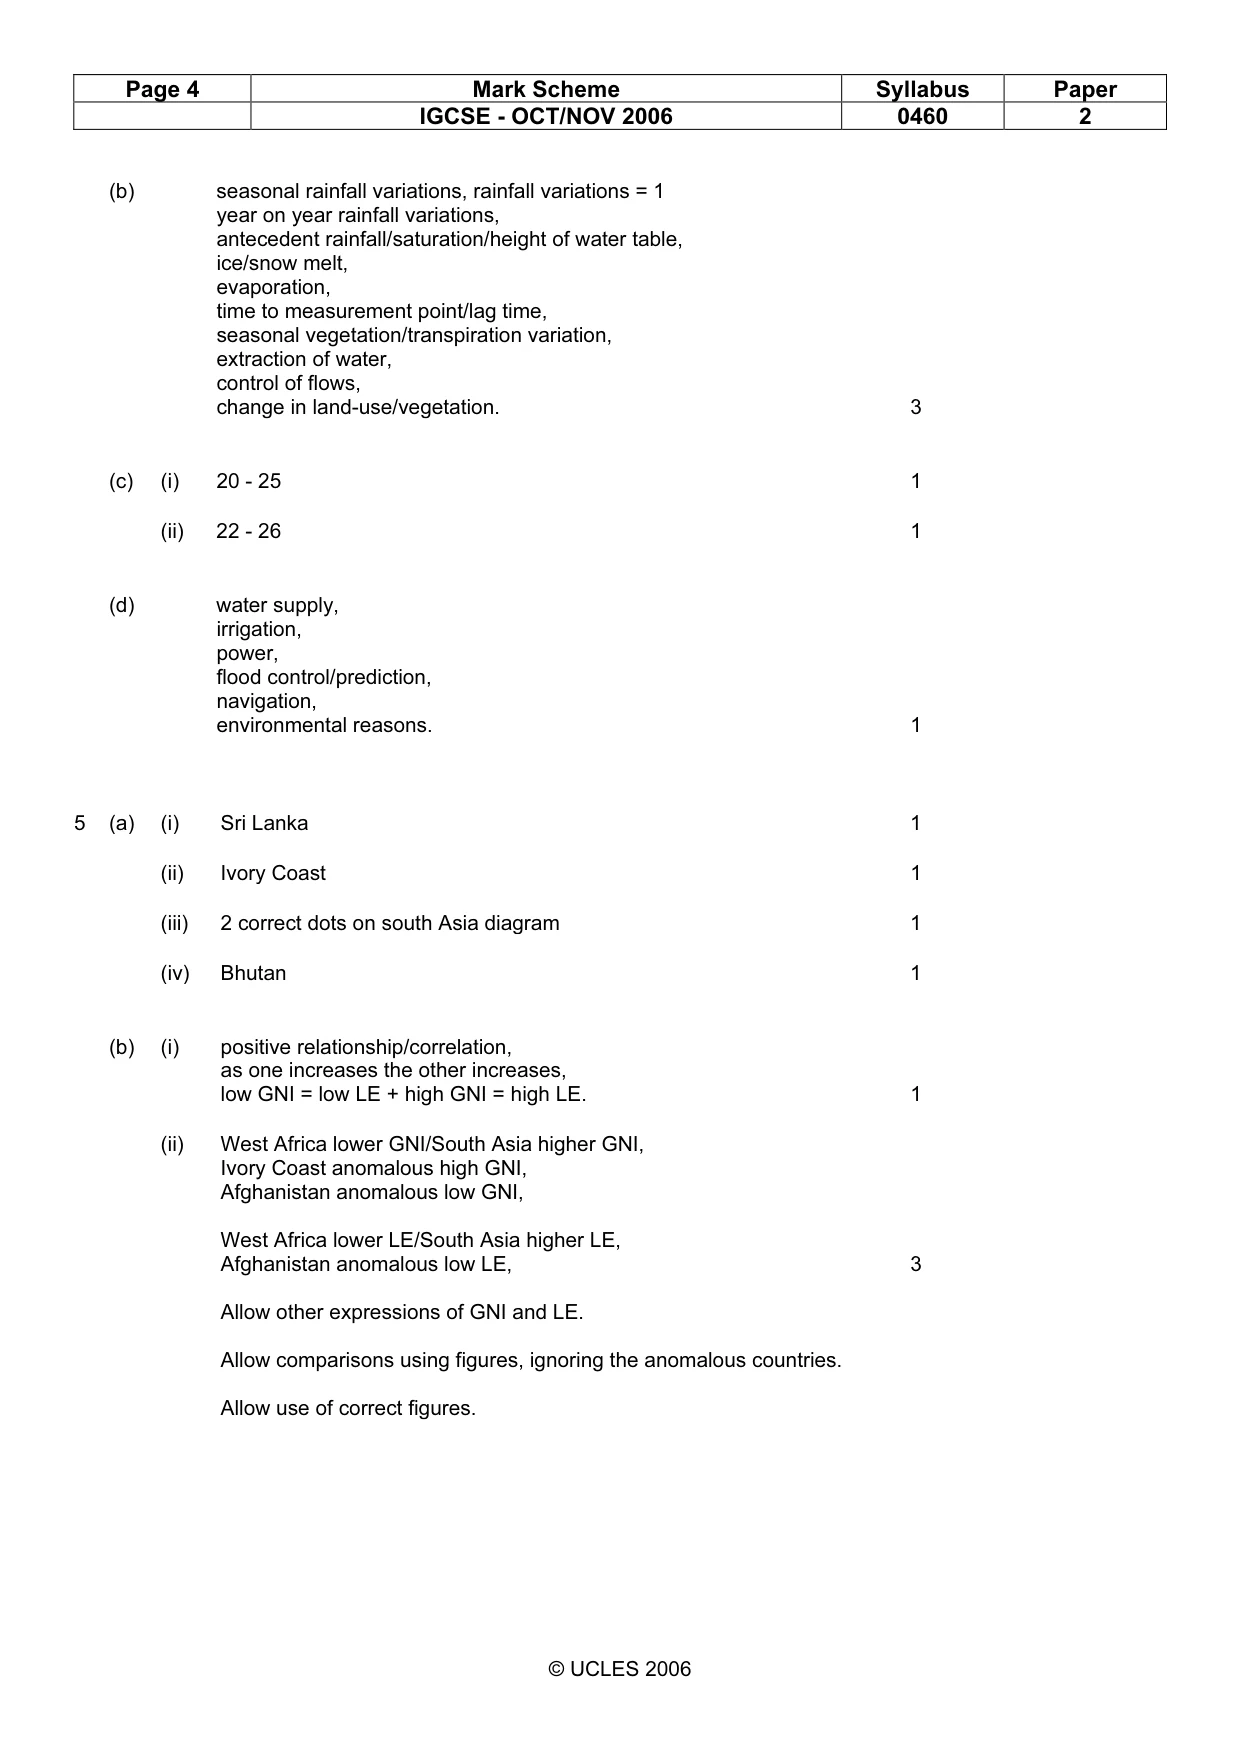
Page 4 Mark Scheme Syllabus Paper IGCSE - OCT/NOV 2006 0460 2 © UCLES 2006 (b) seasonal rainfall variations, rainfall variations = 1 year on year rainfall variations, antecedent rainfall/saturation/height of water table, ice/snow melt, evaporation, time to measurement point/lag time, seasonal vegetation/transpiration variation, extraction of water, control of flows, change in land-use/vegetation. 3 (c) (i) 20 - 25 1 (ii) 22 - 26 1 (d) water supply, irrigation, power, flood control/prediction, navigation, environmental reasons. 1 5 (a) (i) Sri Lanka 1 (ii) Ivory Coast 1 (iii) 2 correct dots on south Asia diagram 1 (iv) Bhutan 1 (b) (i) positive relationship/correlation, as one increases the other increases, low GNI = low LE + high GNI = high LE. 1 (ii) West Africa lower GNI/South Asia higher GNI, Ivory Coast anomalous high GNI, Afghanistan anomalous low GNI, West Africa lower LE/South Asia higher LE, Afghanistan anomalous low LE, Allow other expressions of GNI and LE. Allow comparisons using figures, ignoring the anomalous countries. Allow use of correct figures. 3
Mark scheme, page 5
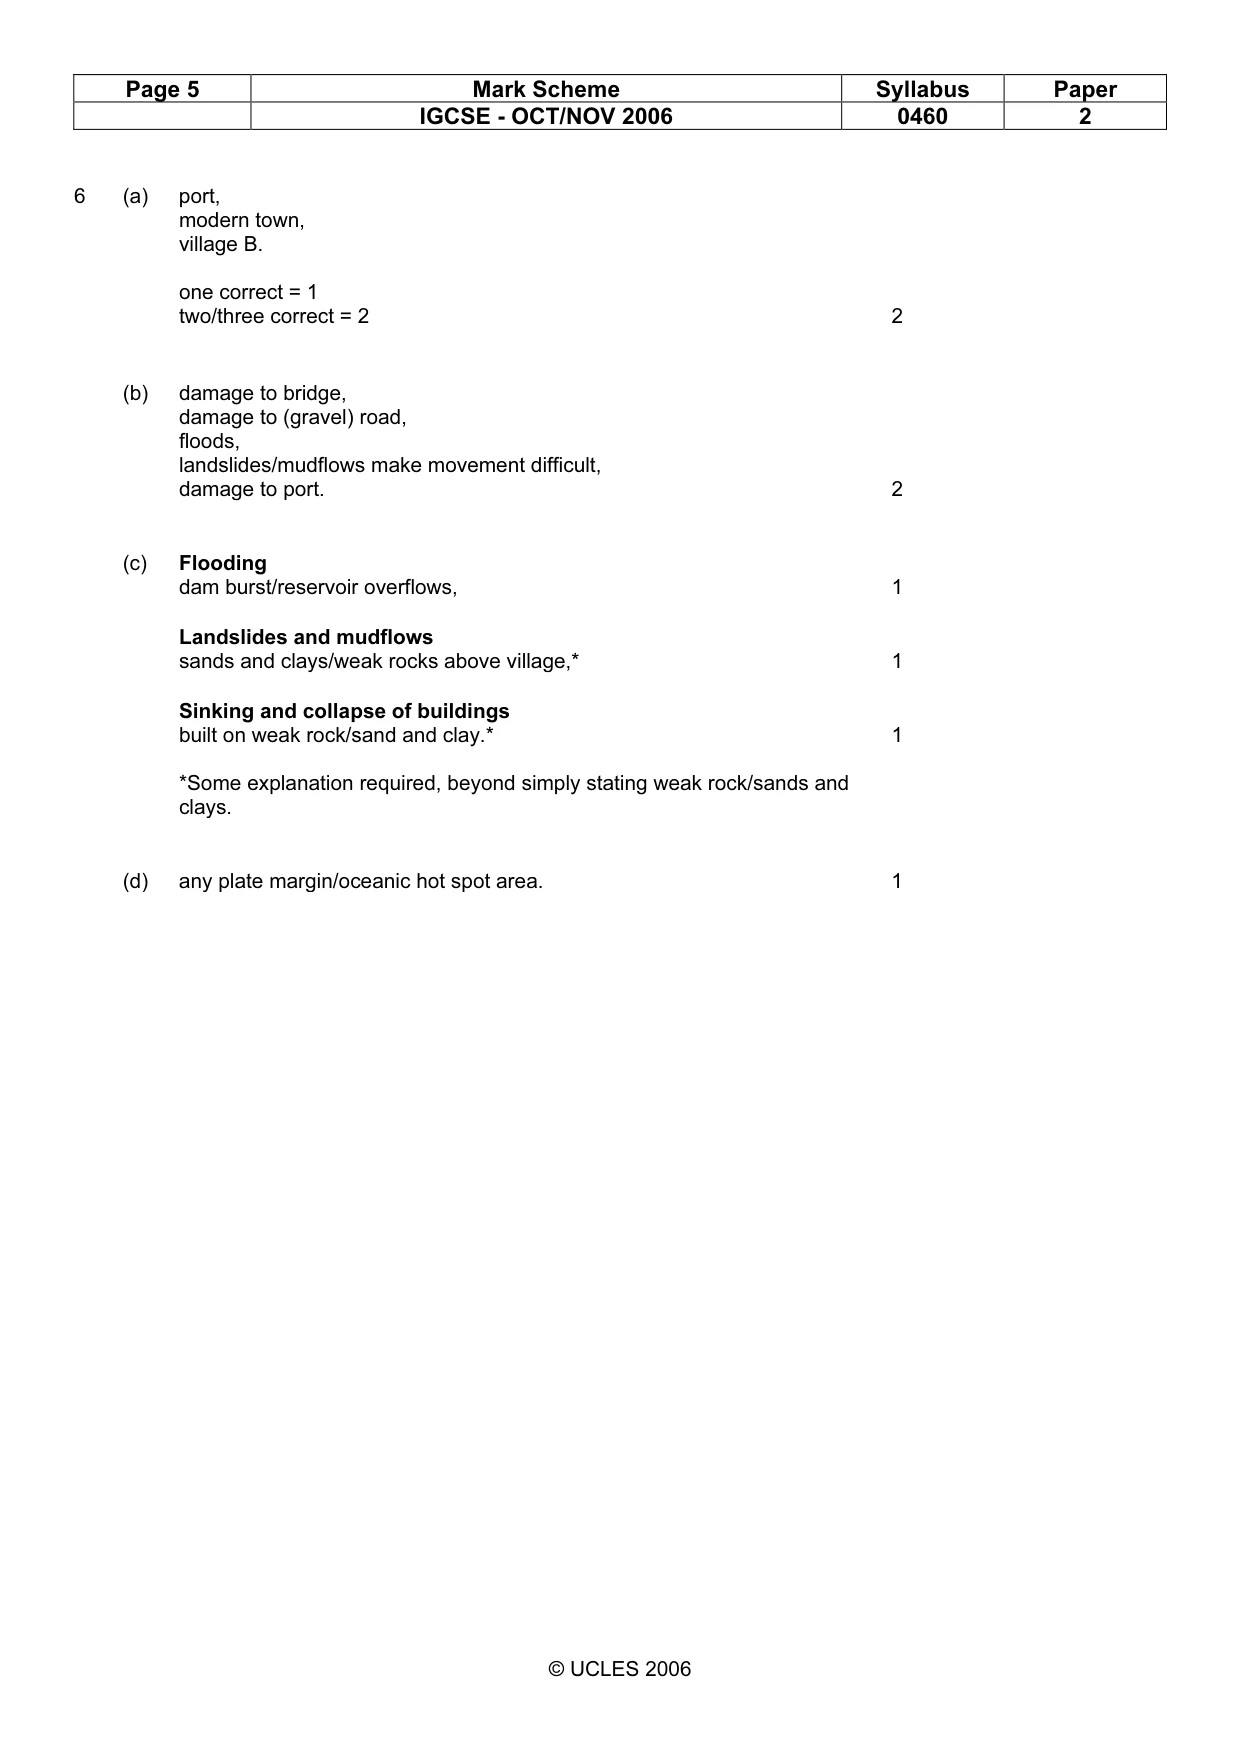
Page 5 Mark Scheme Syllabus Paper IGCSE - OCT/NOV 2006 0460 2 © UCLES 2006 6 (a) port, modern town, village B. one correct = 1 two/three correct = 2 2 (b) damage to bridge, damage to (gravel) road, floods, landslides/mudflows make movement difficult, damage to port. 2 (c) Flooding dam burst/reservoir overflows, 1 Landslides and mudflows sands and clays/weak rocks above village,* 1 Sinking and collapse of buildings built on weak rock/sand and clay.* *Some explanation required, beyond simply stating weak rock/sands and clays. 1 (d) any plate margin/oceanic hot spot area. 1
Mark scheme, page 6
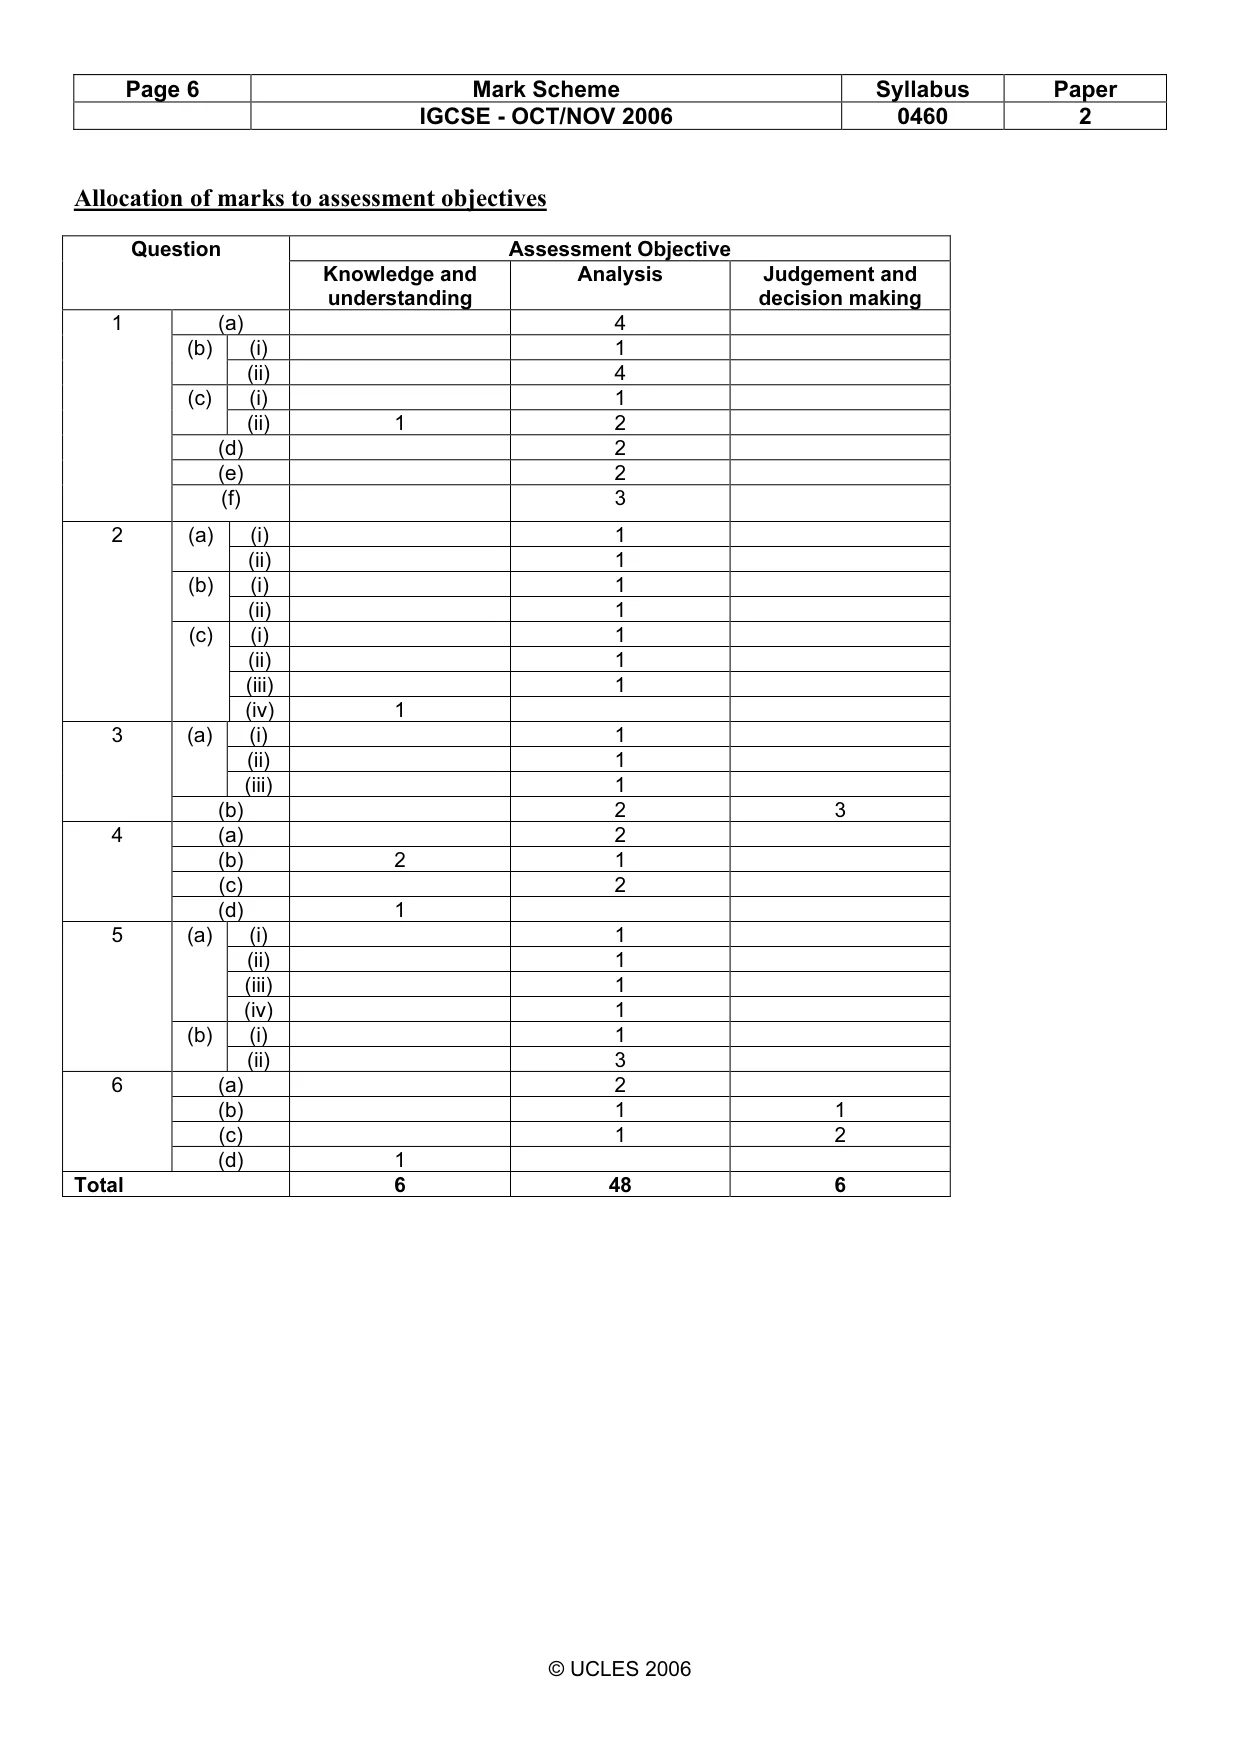
Page 6 Mark Scheme Syllabus Paper IGCSE - OCT/NOV 2006 0460 2 © UCLES 2006 Allocation of marks to assessment objectives Assessment Objective Question Knowledge and understanding Analysis Judgement and decision making (a) 4 (i) 1 (b) (ii) 4 (i) 1 (c) (ii) 1 2 (d) 2 (e) 2 1 (f) 3 (i) 1 (a) (ii) 1 (i) 1 (b) (ii) 1 (i) 1 (ii) 1 (iii) 1 2 (c) (iv) 1 (i) 1 (ii) 1 (a) (iii) 1 3 (b) 2 3 (a) 2 (b) 2 1 (c) 2 4 (d) 1 (i) 1 (ii) 1 (iii) 1 (a) (iv) 1 (i) 1 5 (b) (ii) 3 (a) 2 (b) 1 1 (c) 1 2 6 (d) 1 Total 6 48 6
What you needed in this session
Cambridge’s own grade thresholds for 2006 Oct/Nov, Paper 2 · Variant 1. A higher threshold means an easier paper — the bar moves with how the cohort did.