Cambridge IGCSE Geography 0460 — 2006 May/June Paper 4 · Variant 1
0460/41/M/J/06 · 60 marks · ≈68 min
The question paper and its mark scheme, free to read here and free to download. This is Cambridge’s own paper, exactly as it was sat.
Question paper12 pages

Mark scheme3 pages
Answers below. Sit the paper first if you are practising.
Paper as text
Question paper, page 1
This document consists of 11 printed pages and 1 blank page. SP (SLM/CGW) T04985/4 © UCLES 2006 [Turn over UNIVERSITY OF CAMBRIDGE INTERNATIONAL EXAMINATIONS International General Certificate of Secondary Education GEOGRAPHY 0460/04 Paper 4 Alternative to Coursework May/June 2006 1 hour 30 minutes Additional Materials: Ruler Calculator READ THESE INSTRUCTIONS FIRST Write your Centre number, candidate number and name in the spaces provided. Write in dark blue or black pen. You may use a soft pencil for any diagrams, graphs or rough working. Do not use staples, paper clips, highlighters, glue or correction fluid. Answer all questions. Sketch maps and diagrams should be drawn whenever they serve to illustrate an answer. At the end of the examination, fasten all your work securely together. The number of marks is given in brackets [ ] at the end of each question or part question. Centre Number Candidate Number Name For Examiner’s Use Q1 Q2 Total www.XtremePapers.com
Question paper, page 2
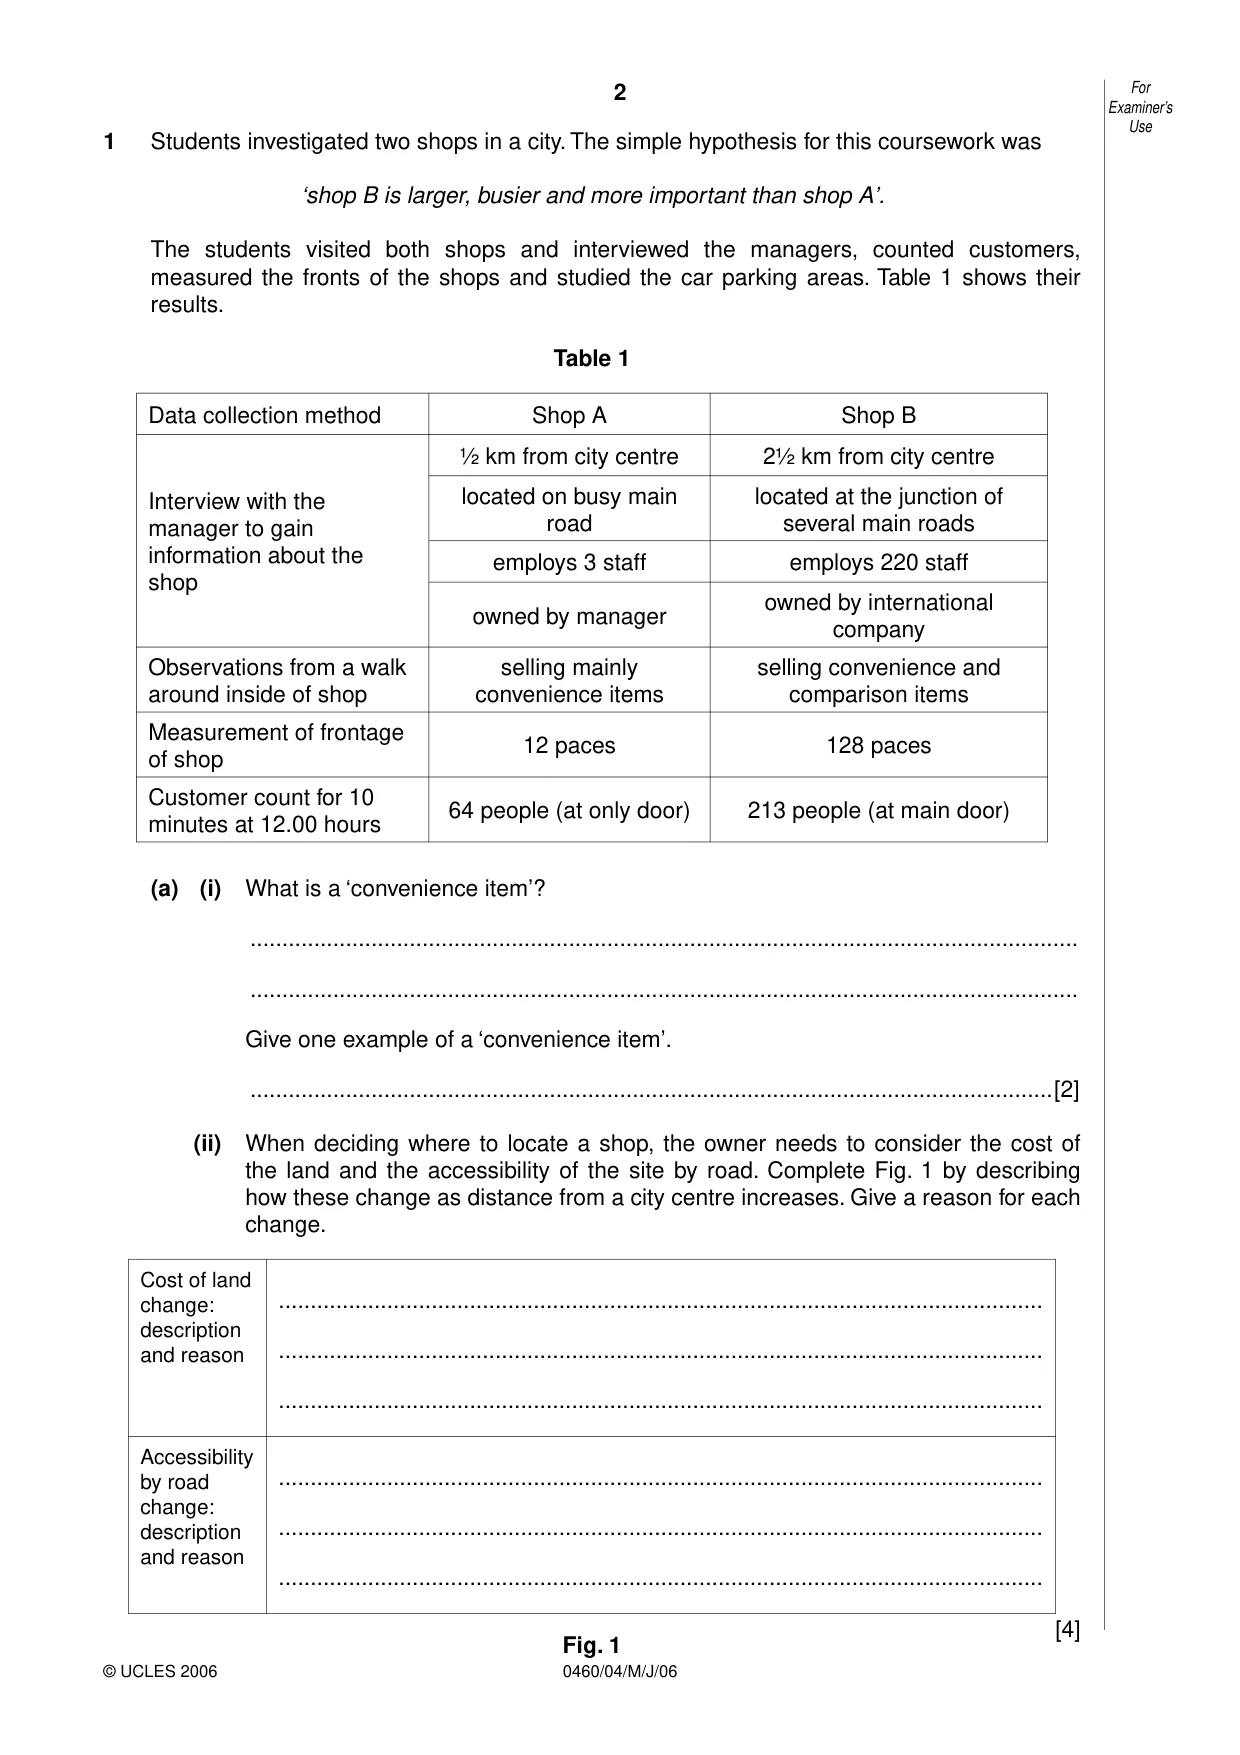
2 0460/04/M/J/06 For Examiner’s Use © UCLES 2006 1 Students investigated two shops in a city. The simple hypothesis for this coursework was ‘shop B is larger, busier and more important than shop A’. The students visited both shops and interviewed the managers, counted customers, measured the fronts of the shops and studied the car parking areas. Table 1 shows their results. Table 1 Data collection method Shop A Shop B Interview with the manager to gain information about the shop ½ km from city centre 2½ km from city centre located on busy main road located at the junction of several main roads employs 3 staff employs 220 staff owned by manager owned by international company Observations from a walk around inside of shop selling mainly convenience items selling convenience and comparison items Measurement of frontage of shop 12 paces 128 paces Customer count for 10 minutes at 12.00 hours 64 people (at only door) 213 people (at main door) (a) (i) What is a ‘convenience item’? … … Give one example of a ‘convenience item’. …[2] (ii) When deciding where to locate a shop, the owner needs to consider the cost of the land and the accessibility of the site by road. Complete Fig. 1 by describing how these change as distance from a city centre increases. Give a reason for each change. Cost of land change: description and reason … … … Accessibility by road change: description and reason … … … [4] Fig. 1
Question paper, page 3
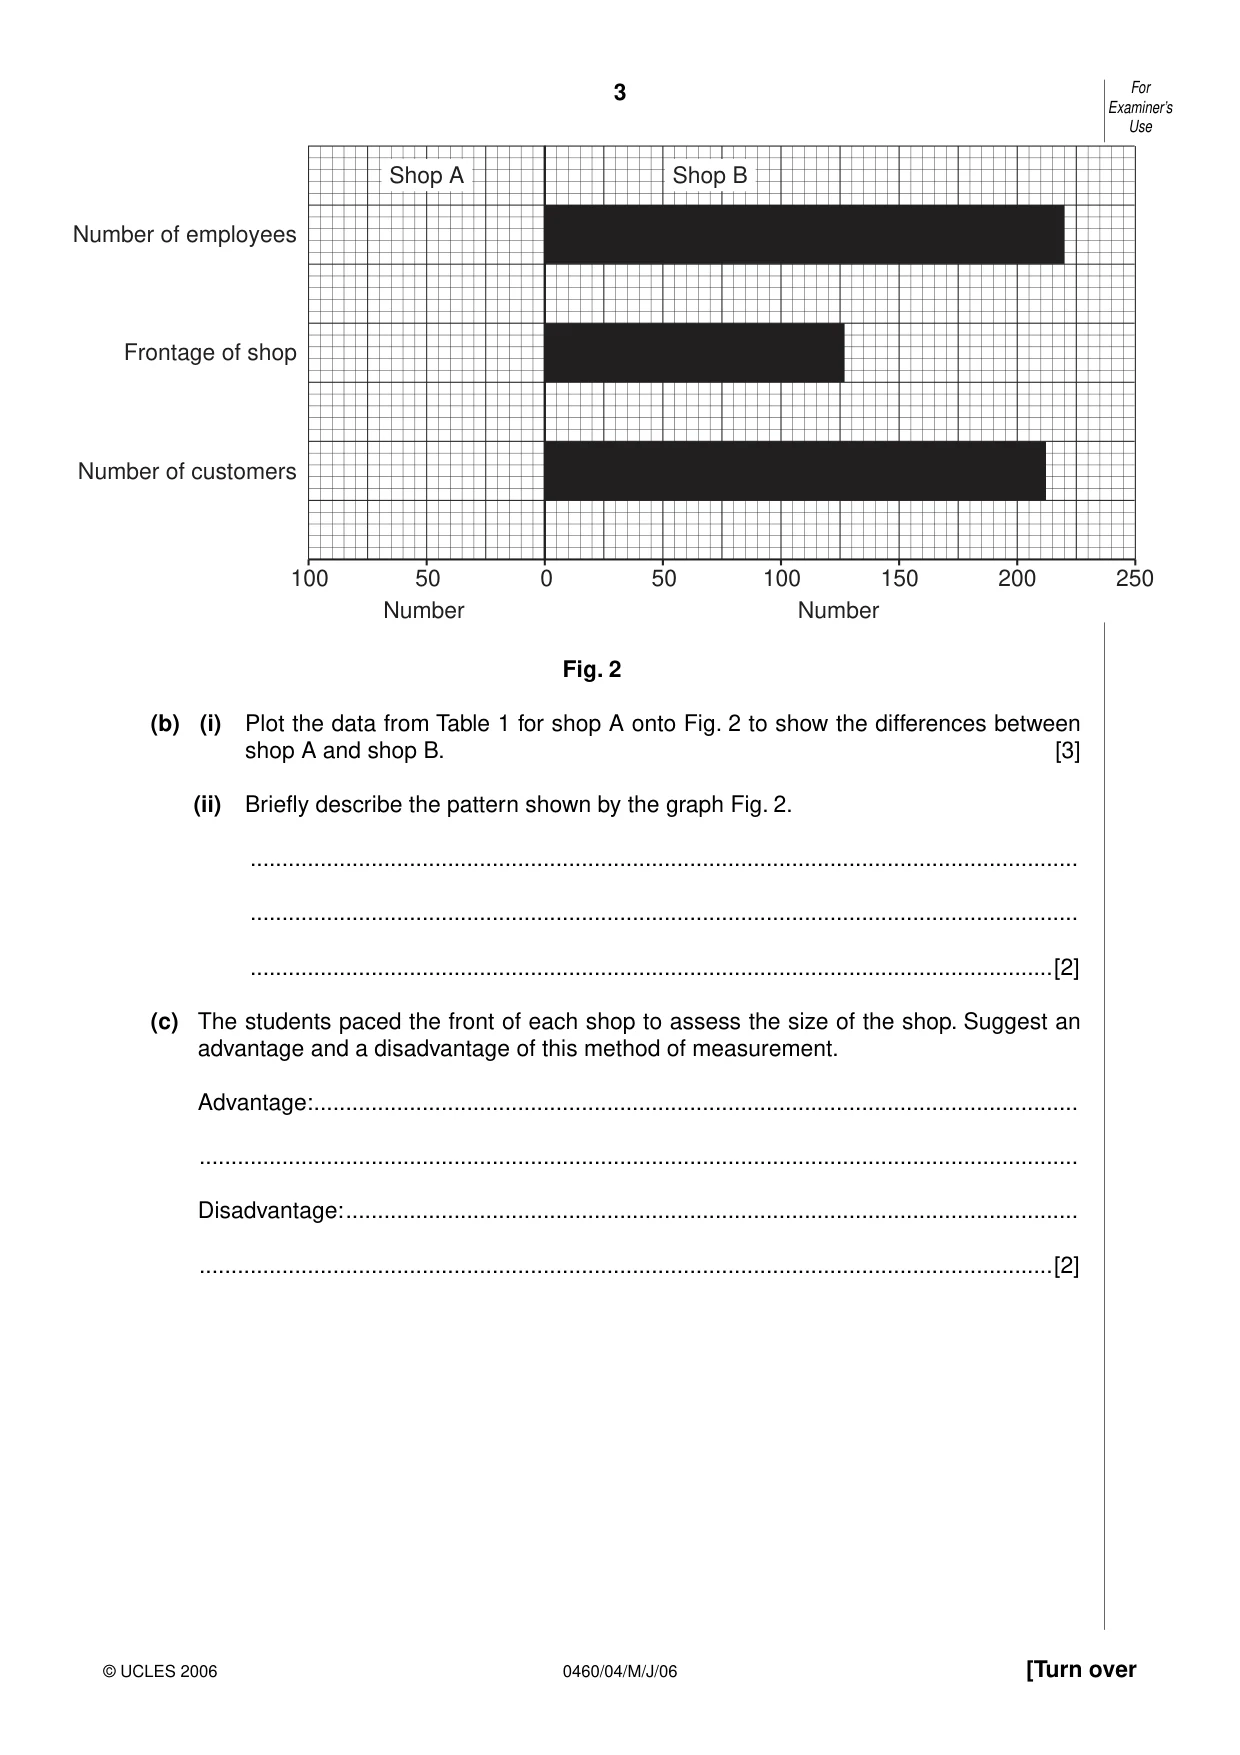
3 0460/04/M/J/06 [Turn over For Examiner’s Use © UCLES 2006 0 50 Number Number 100 50 100 150 200 250 Shop B Shop A Number of employees Frontage of shop Number of customers Fig. 2 (b) (i) Plot the data from Table 1 for shop A onto Fig. 2 to show the differences between shop A and shop B. [3] (ii) Briefly describe the pattern shown by the graph Fig. 2. … … …[2] (c) The students paced the front of each shop to assess the size of the shop. Suggest an advantage and a disadvantage of this method of measurement. Advantage: … … Disadvantage: … …[2]
Question paper, page 4
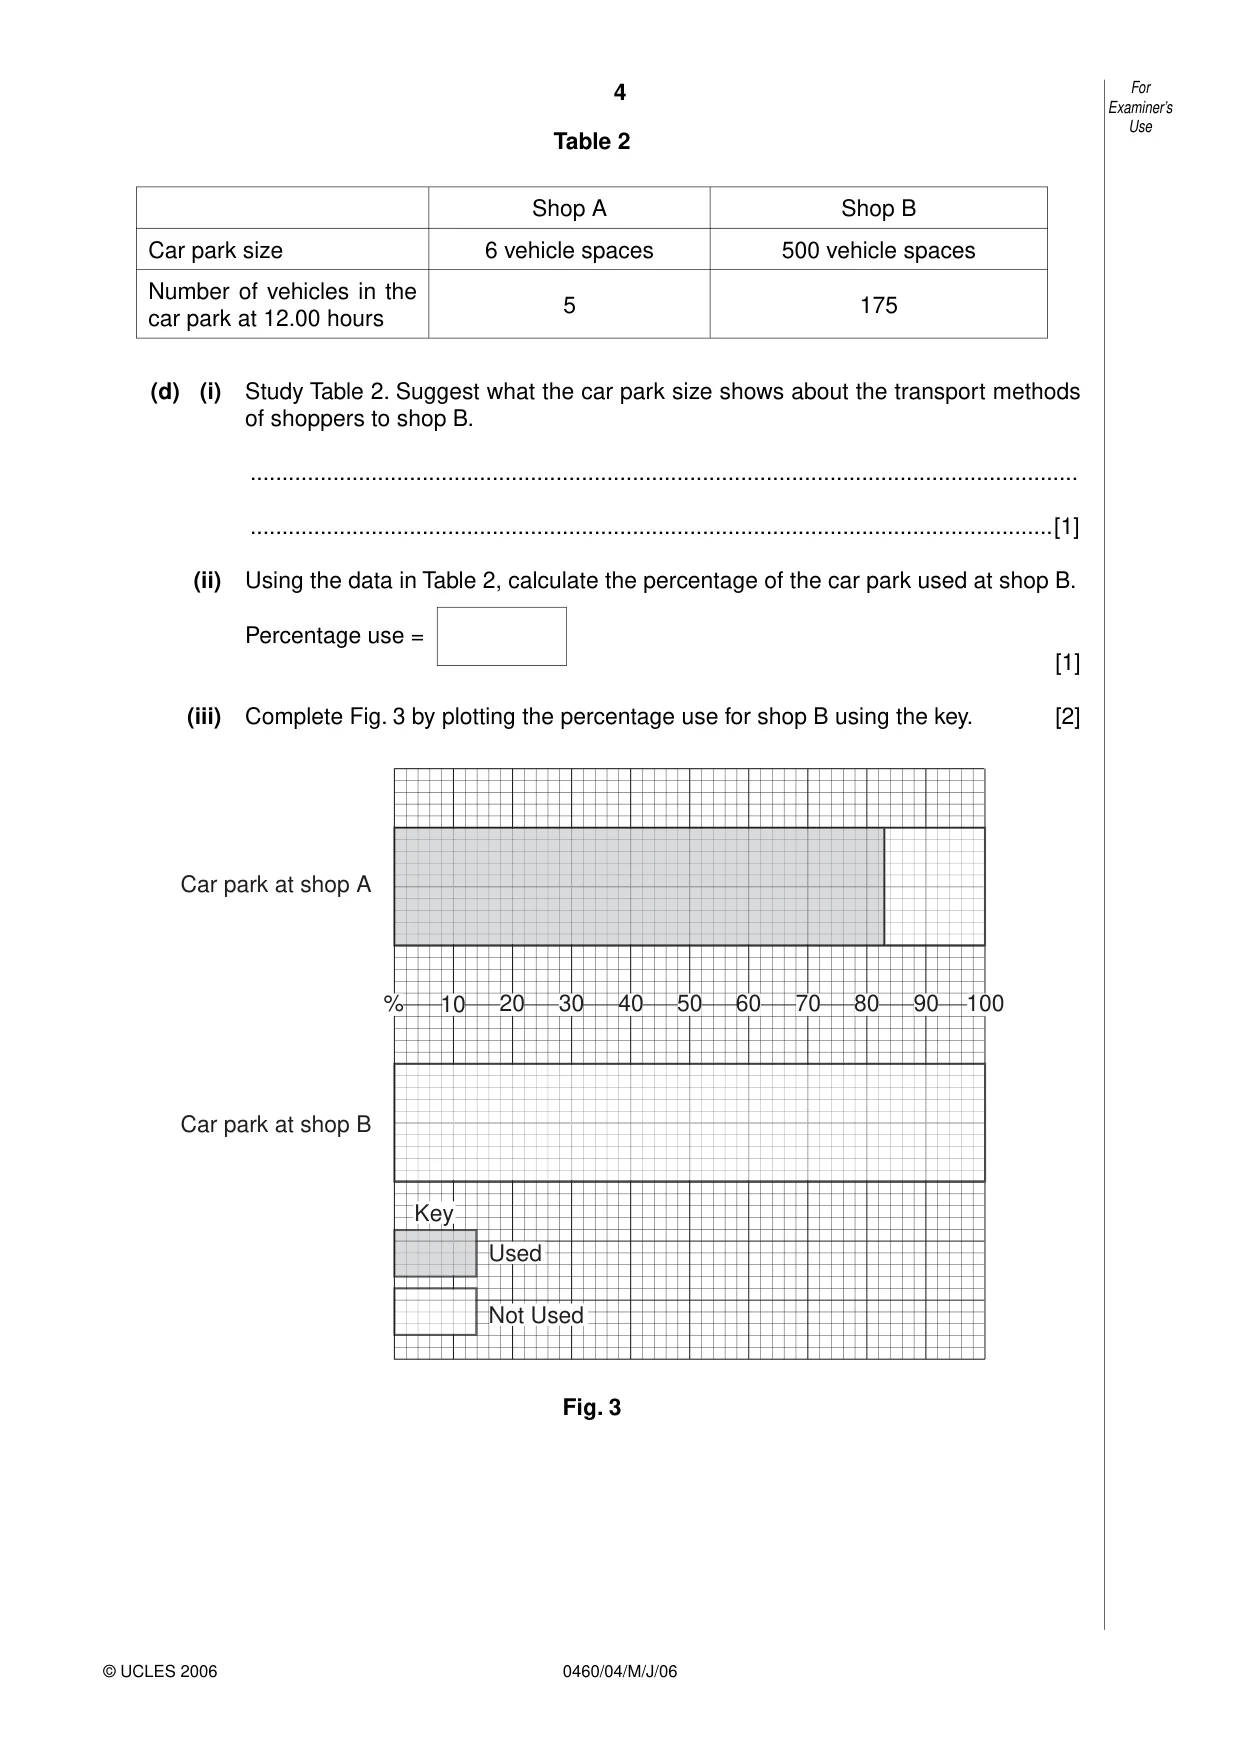
4 0460/04/M/J/06 For Examiner’s Use © UCLES 2006 Table 2 Shop A Shop B Car park size 6 vehicle spaces 500 vehicle spaces Number of vehicles in the car park at 12.00 hours 5 175 (d) (i) Study Table 2. Suggest what the car park size shows about the transport methods of shoppers to shop B. … …[1] (ii) Using the data in Table 2, calculate the percentage of the car park used at shop B. Percentage use = [1] (iii) Complete Fig. 3 by plotting the percentage use for shop B using the key. [2] 10 90 100 80 70 20 Car park at shop A Car park at shop B Key Used Not Used 30 40 50 60 % Fig. 3
Question paper, page 5
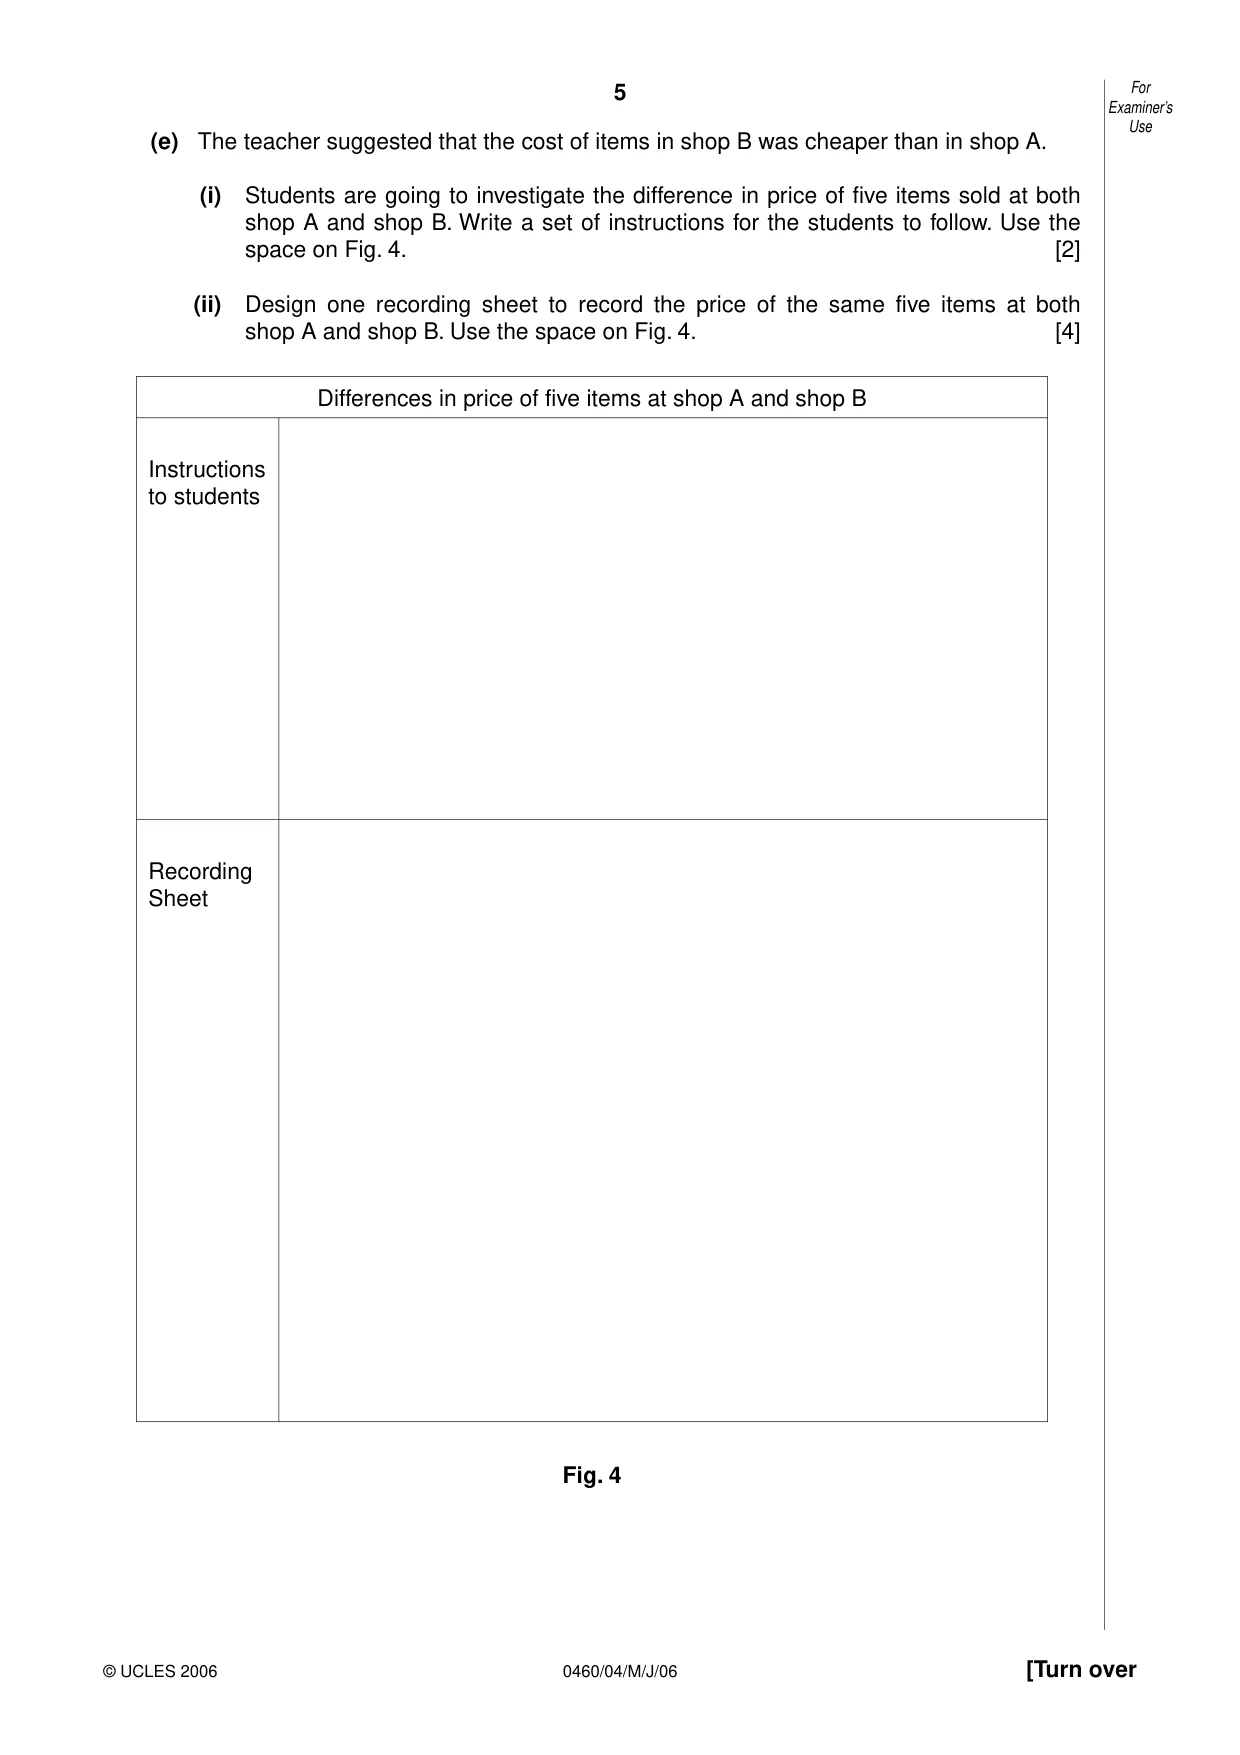
5 0460/04/M/J/06 [Turn over For Examiner’s Use © UCLES 2006 (e) The teacher suggested that the cost of items in shop B was cheaper than in shop A. (i) Students are going to investigate the difference in price of five items sold at both shop A and shop B. Write a set of instructions for the students to follow. Use the space on Fig. 4. [2] (ii) Design one recording sheet to record the price of the same five items at both shop A and shop B. Use the space on Fig. 4. [4] Differences in price of five items at shop A and shop B Instructions to students Recording Sheet Fig. 4
Question paper, page 6
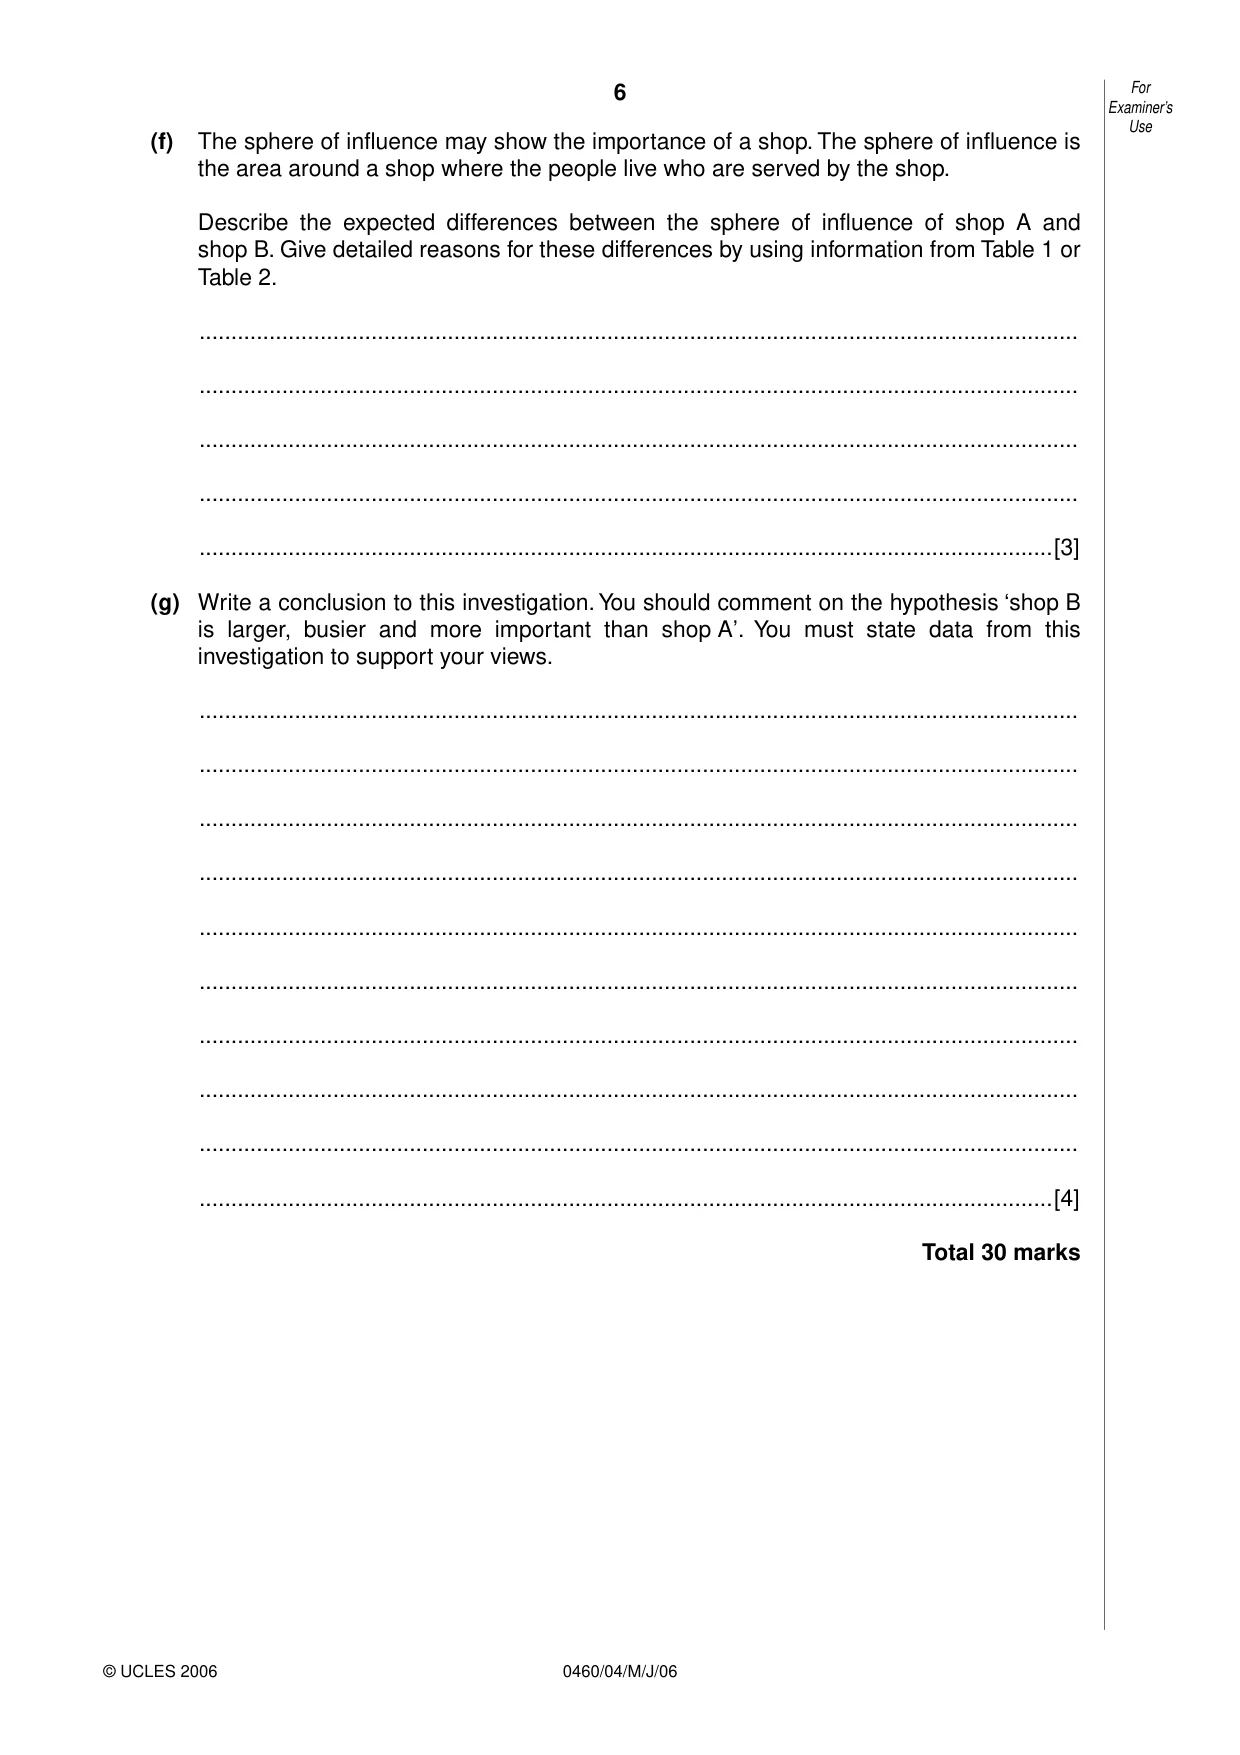
6 0460/04/M/J/06 For Examiner’s Use © UCLES 2006 (f) The sphere of influence may show the importance of a shop. The sphere of influence is the area around a shop where the people live who are served by the shop. Describe the expected differences between the sphere of influence of shop A and shop B. Give detailed reasons for these differences by using information from Table 1 or Table 2. … … … … …[3] (g) Write a conclusion to this investigation. You should comment on the hypothesis ‘shop B is larger, busier and more important than shop A’. You must state data from this investigation to support your views. … … … … … … … … … …[4] Total 30 marks
Question paper, page 7
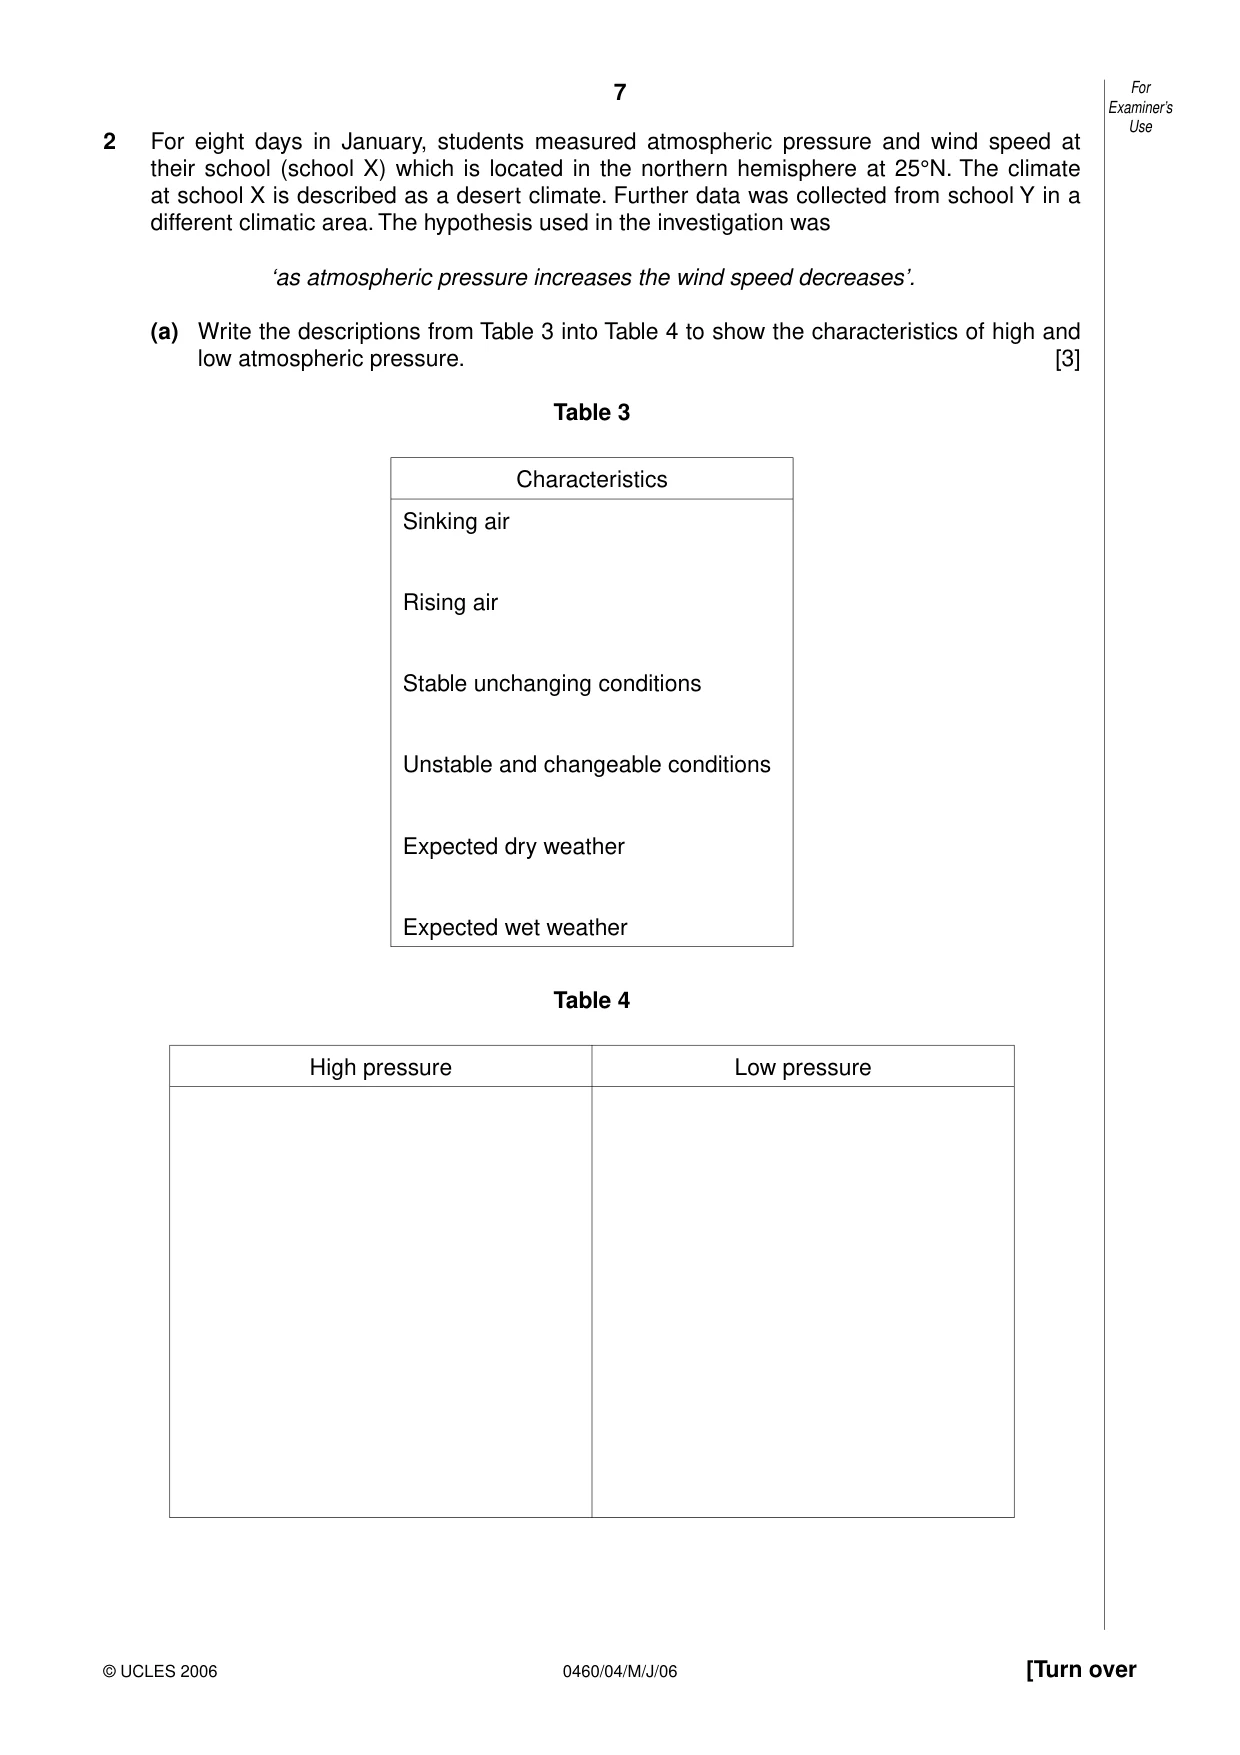
7 0460/04/M/J/06 [Turn over For Examiner’s Use © UCLES 2006 2 For eight days in January, students measured atmospheric pressure and wind speed at their school (school X) which is located in the northern hemisphere at 25°N. The climate at school X is described as a desert climate. Further data was collected from school Y in a different climatic area. The hypothesis used in the investigation was ‘as atmospheric pressure increases the wind speed decreases’. (a) Write the descriptions from Table 3 into Table 4 to show the characteristics of high and low atmospheric pressure. [3] Table 3 Characteristics Sinking air Rising air Stable unchanging conditions Unstable and changeable conditions Expected dry weather Expected wet weather Table 4 High pressure Low pressure
Question paper, page 8
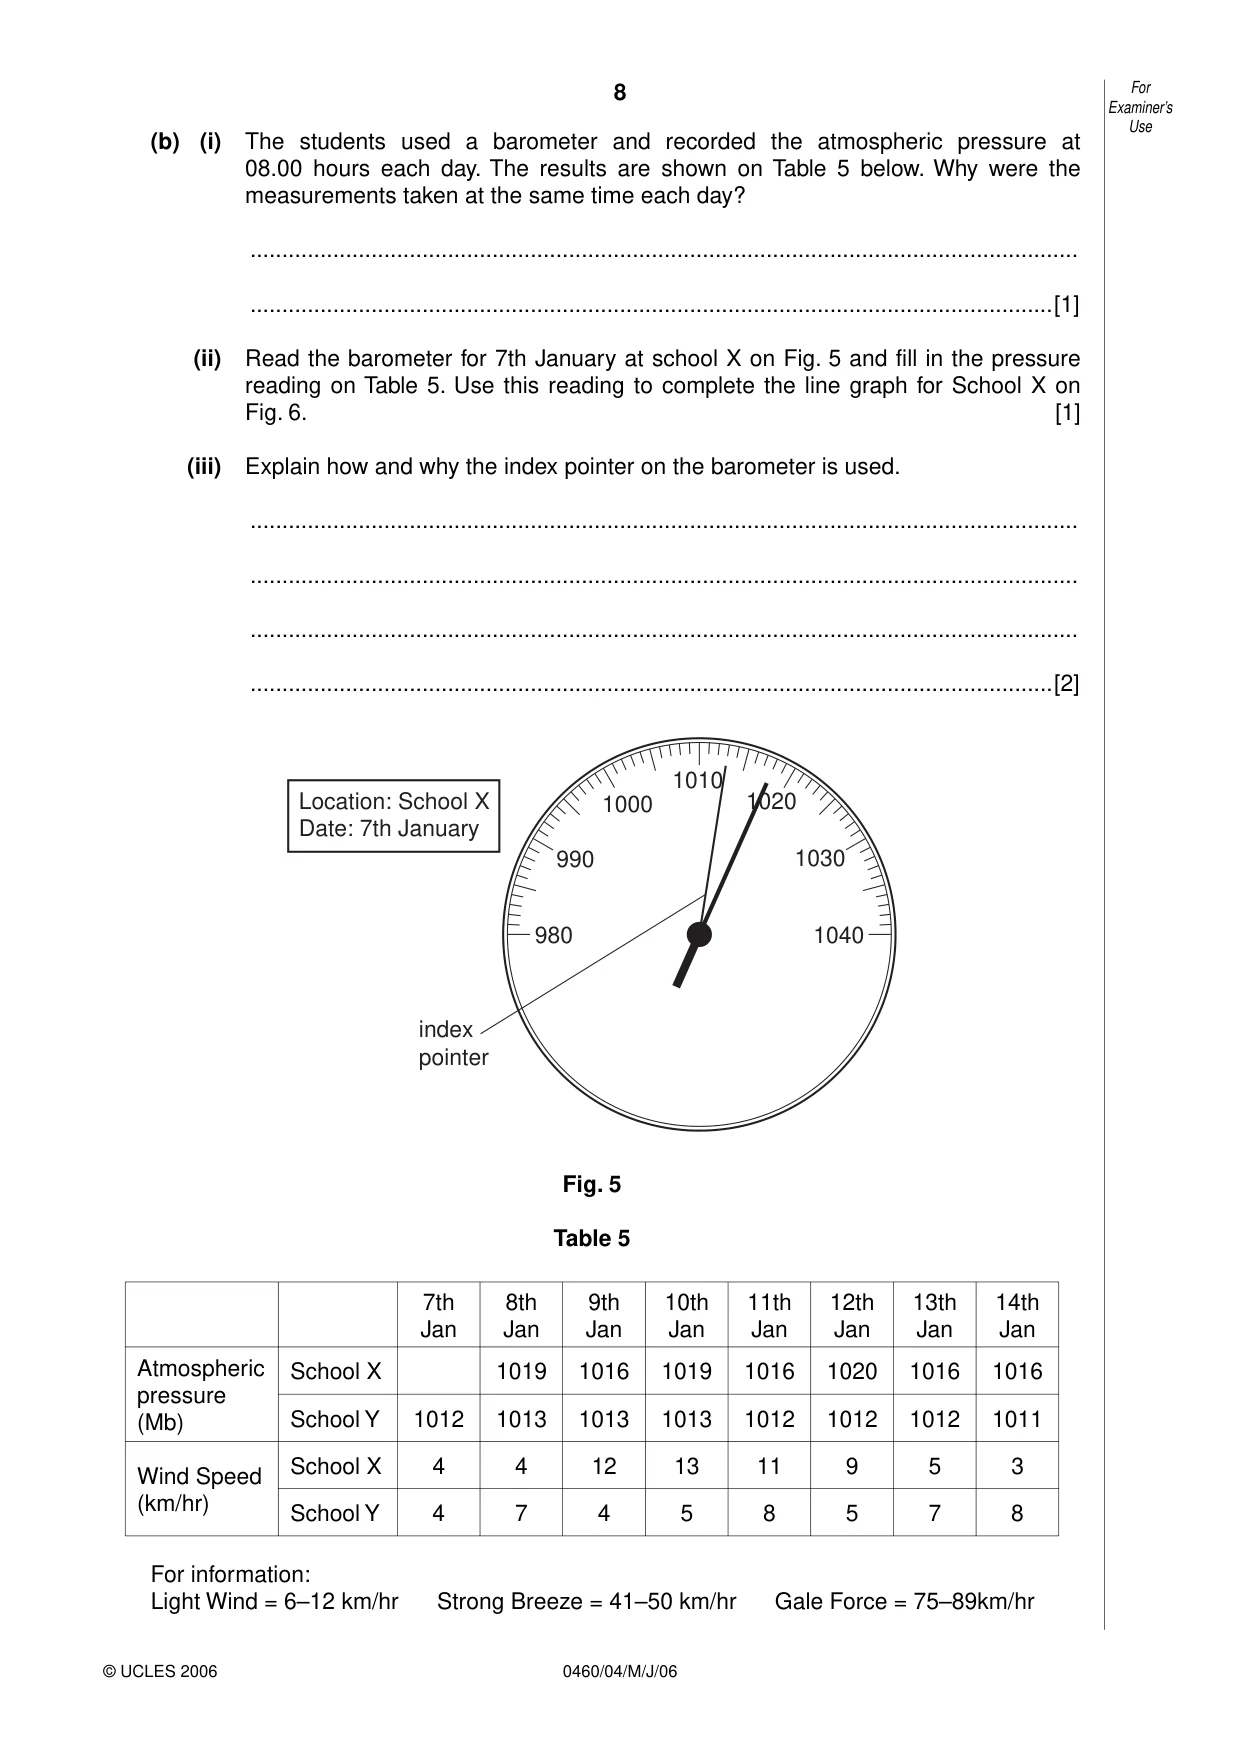
8 0460/04/M/J/06 For Examiner’s Use © UCLES 2006 (b) (i) The students used a barometer and recorded the atmospheric pressure at 08.00 hours each day. The results are shown on Table 5 below. Why were the measurements taken at the same time each day? … …[1] (ii) Read the barometer for 7th January at school X on Fig. 5 and fill in the pressure reading on Table 5. Use this reading to complete the line graph for School X on Fig. 6. [1] (iii) Explain how and why the index pointer on the barometer is used. … … … …[2] 980 index pointer 990 Location: School X Date: 7th January 1000 1010 1020 1030 1040 Fig. 5 Table 5 7th Jan 8th Jan 9th Jan 10th Jan 11th Jan 12th Jan 13th Jan 14th Jan Atmospheric pressure (Mb) School X 1019 1016 1019 1016 1020 1016 1016 School Y 1012 1013 1013 1013 1012 1012 1012 1011 Wind Speed (km/hr) School X 4 4 12 13 11 9 5 3 School Y 4 7 4 5 8 5 7 8 For information: Light Wind = 6–12 km/hr Strong Breeze = 41–50 km/hr Gale Force = 75–89km/hr
Question paper, page 9
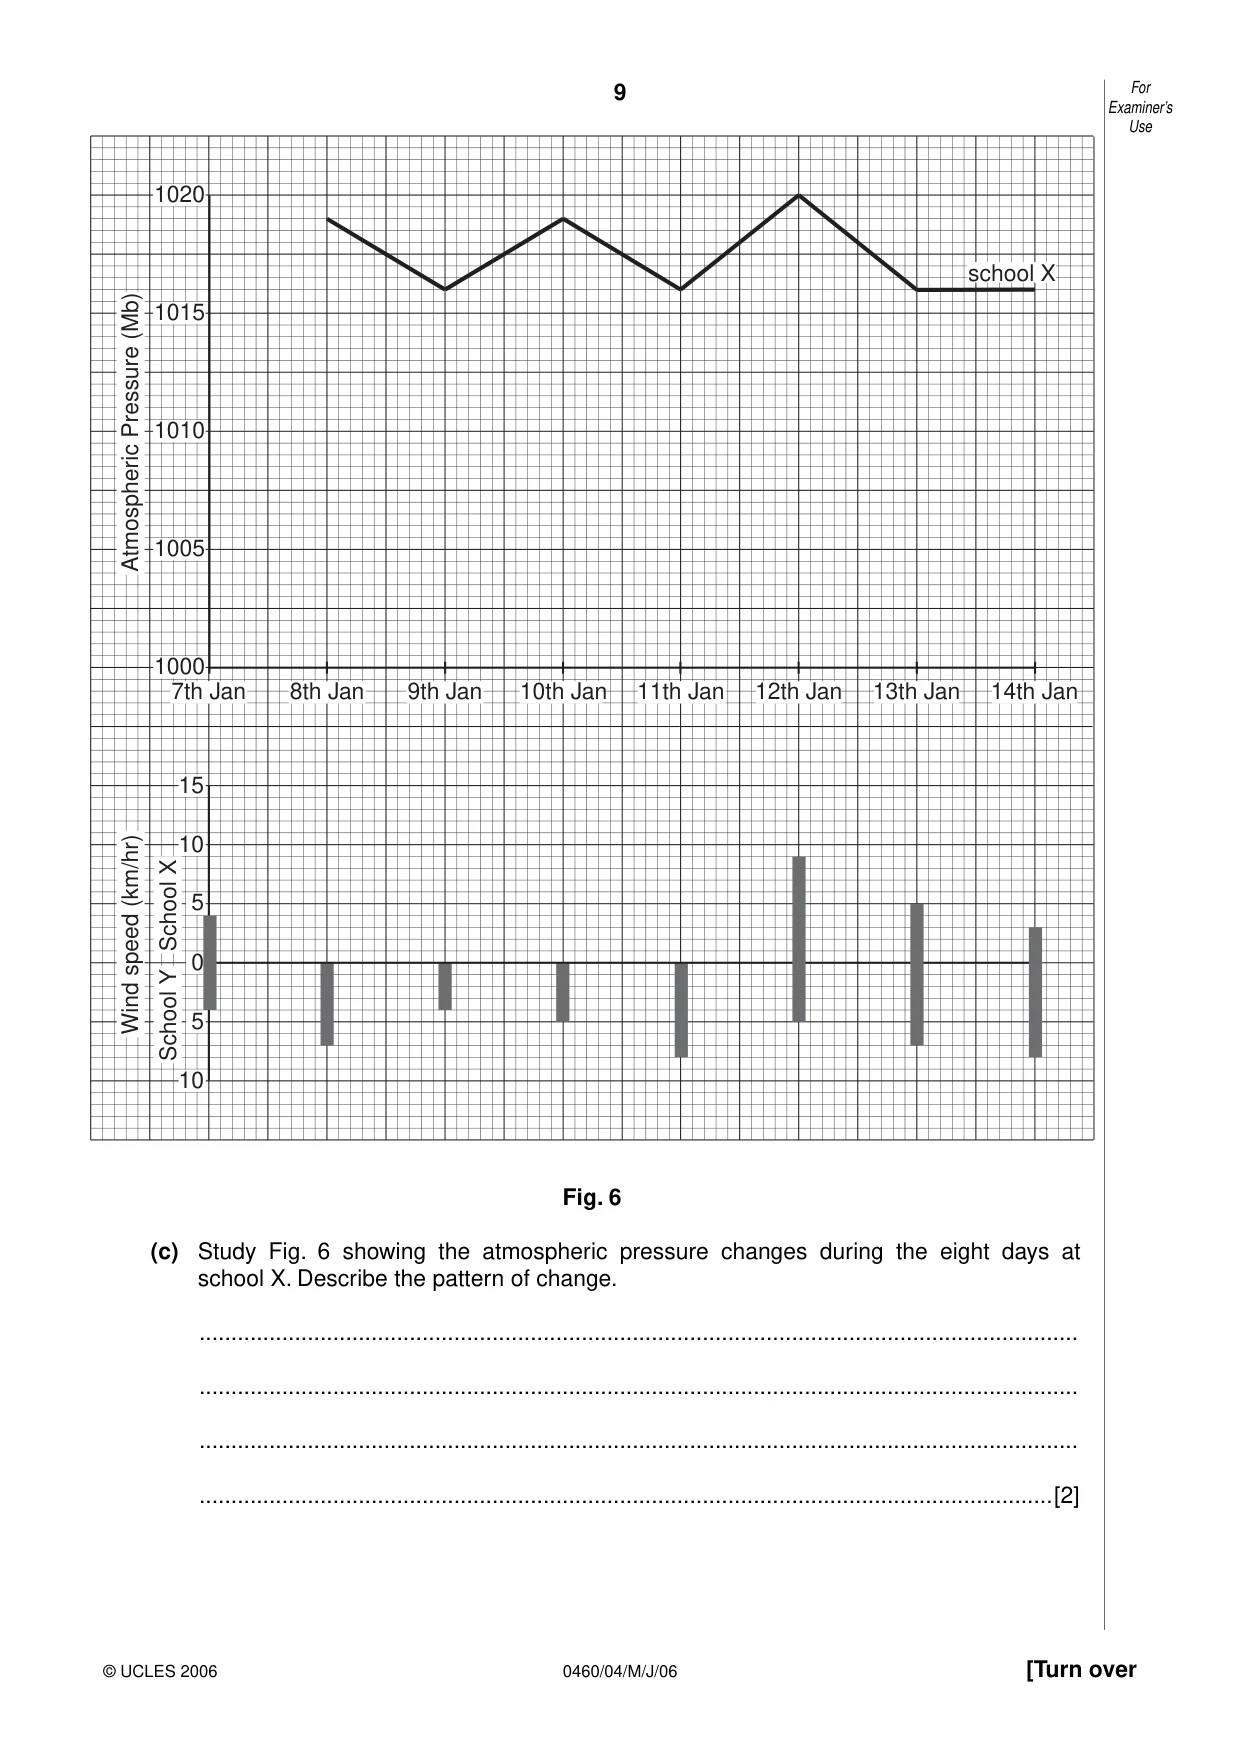
9 0460/04/M/J/06 [Turn over For Examiner’s Use © UCLES 2006 1020 1015 1010 Atmospheric Pressure (Mb) Wind speed (km/hr) School Y School X 1005 1000 0 5 5 10 10 15 7th Jan 8th Jan 9th Jan 10th Jan 11th Jan 12th Jan 13th Jan 14th Jan school X Fig. 6 (c) Study Fig. 6 showing the atmospheric pressure changes during the eight days at school X. Describe the pattern of change. … … … …[2]
Question paper, page 10
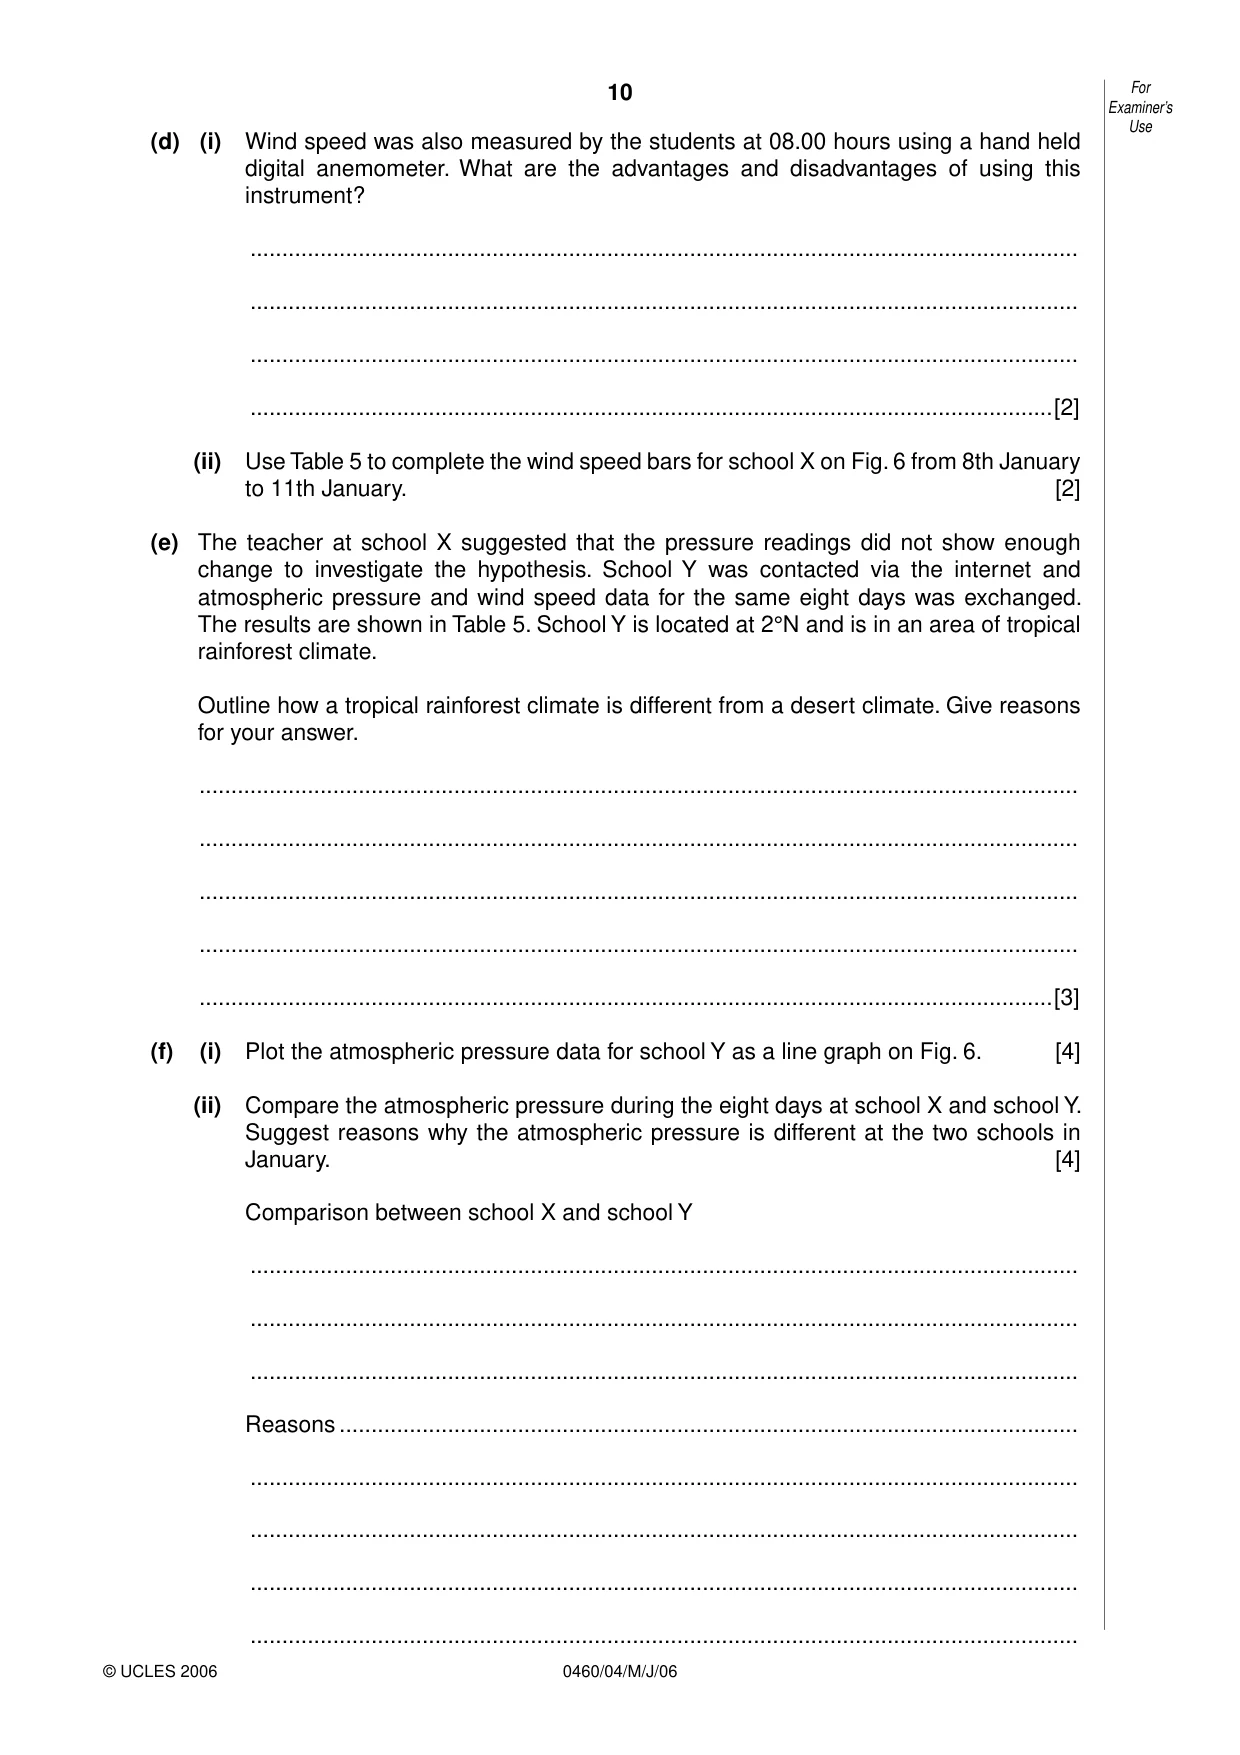
10 0460/04/M/J/06 For Examiner’s Use © UCLES 2006 (d) (i) Wind speed was also measured by the students at 08.00 hours using a hand held digital anemometer. What are the advantages and disadvantages of using this instrument? … … … …[2] (ii) Use Table 5 to complete the wind speed bars for school X on Fig. 6 from 8th January to 11th January. [2] (e) The teacher at school X suggested that the pressure readings did not show enough change to investigate the hypothesis. School Y was contacted via the internet and atmospheric pressure and wind speed data for the same eight days was exchanged. The results are shown in Table 5. School Y is located at 2°N and is in an area of tropical rainforest climate. Outline how a tropical rainforest climate is different from a desert climate. Give reasons for your answer. … … … … …[3] (f) (i) Plot the atmospheric pressure data for school Y as a line graph on Fig. 6. [4] (ii) Compare the atmospheric pressure during the eight days at school X and school Y. Suggest reasons why the atmospheric pressure is different at the two schools in January. [4] Comparison between school X and school Y … … … Reasons … … … … …
Question paper, page 11
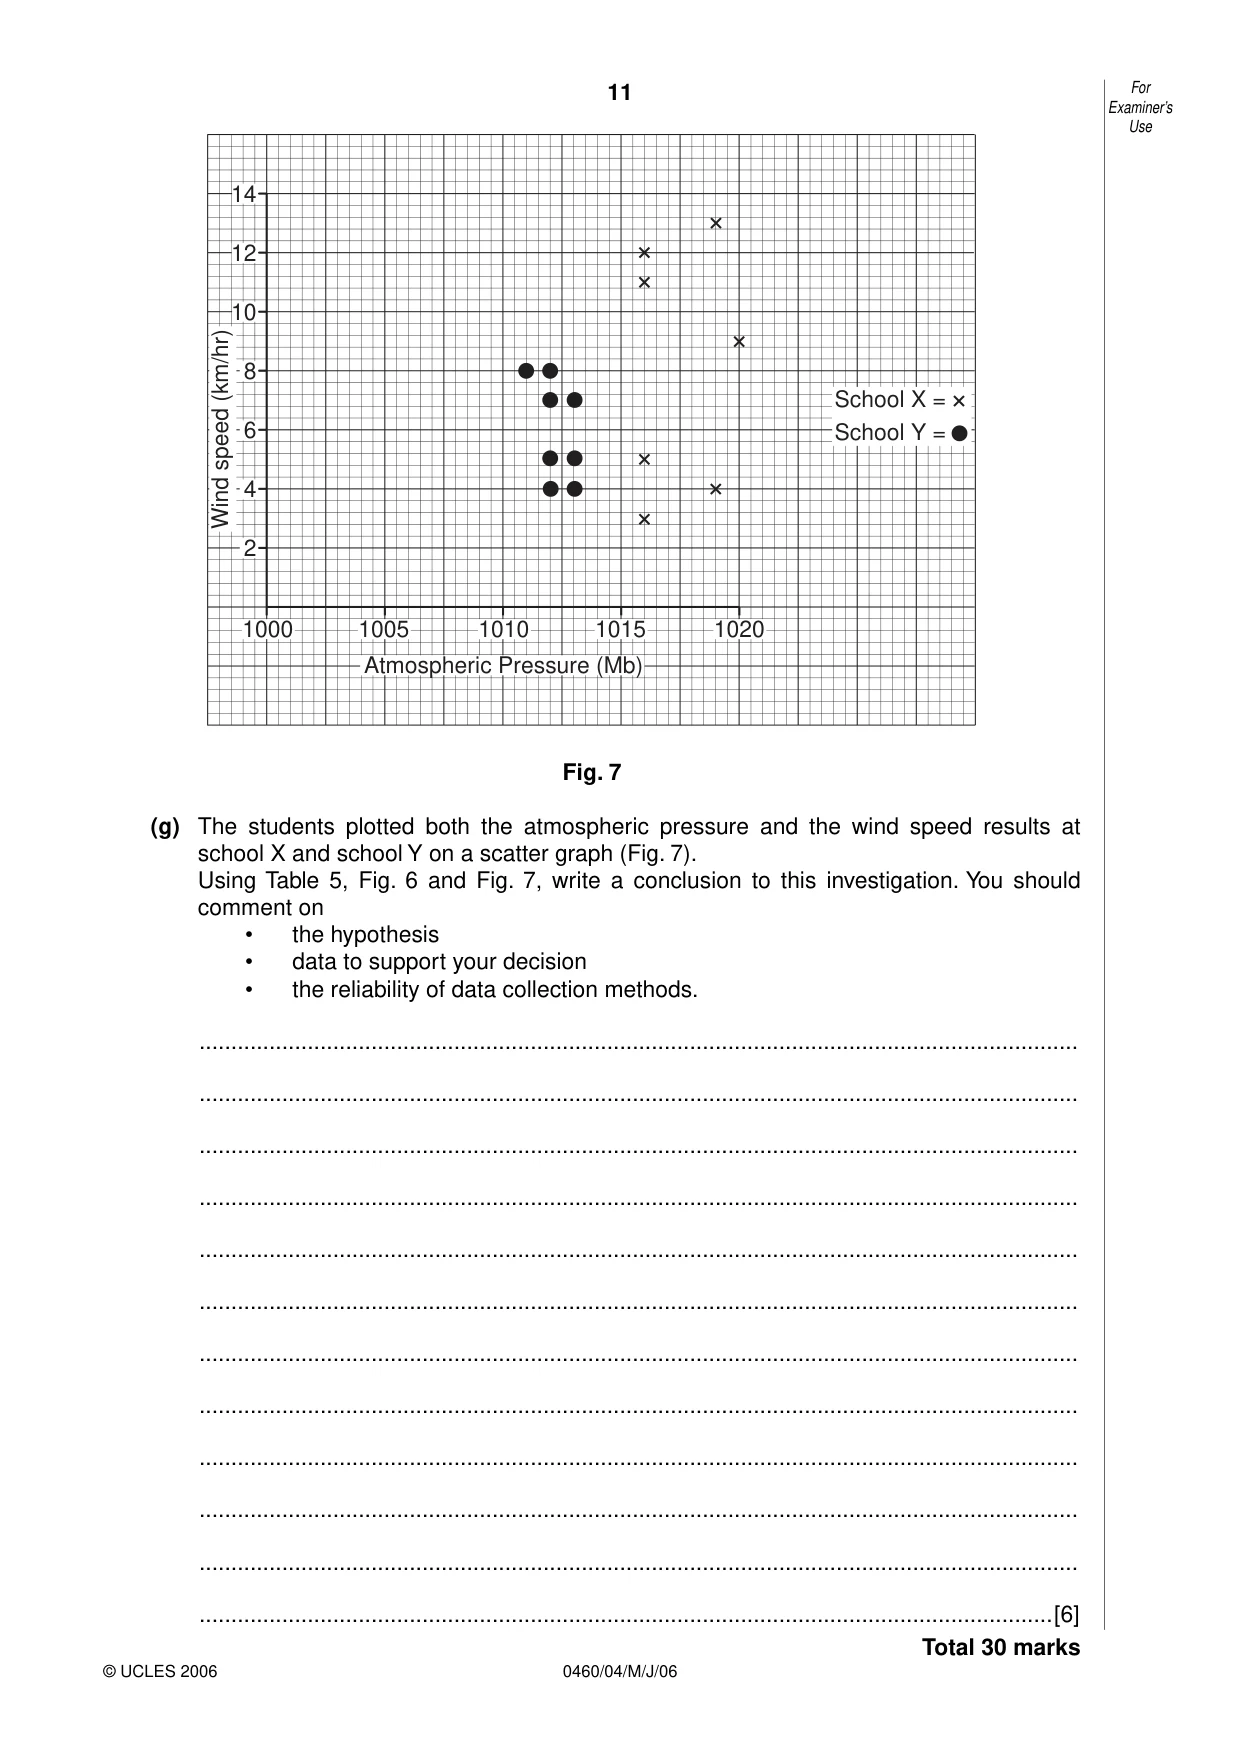
11 0460/04/M/J/06 For Examiner’s Use © UCLES 2006 2 Atmospheric Pressure (Mb) Wind speed (km/hr) 1000 1005 1010 1015 1020 School X = School Y = 4 6 8 10 12 14 Fig. 7 (g) The students plotted both the atmospheric pressure and the wind speed results at school X and school Y on a scatter graph (Fig. 7). Using Table 5, Fig. 6 and Fig. 7, write a conclusion to this investigation. You should comment on • the hypothesis • data to support your decision • the reliability of data collection methods. … … … … … … … … … … … …[6] Total 30 marks
Question paper, page 12
12 0460/04/M/J/06 BLANK PAGE Permission to reproduce items where third-party owned material protected by copyright is included has been sought and cleared where possible. Every reasonable effort has been made by the publisher (UCLES) to trace copyright holders, but if any items requiring clearance have unwittingly been included, the publisher will be pleased to make amends at the earliest possible opportunity. University of Cambridge International Examinations is part of the University of Cambridge Local Examinations Syndicate (UCLES), which is itself a department of the University of Cambridge.
Mark scheme, page 1
UNIVERSITY OF CAMBRIDGE INTERNATIONAL EXAMINATIONS International General Certificate of Secondary Education MARK SCHEME for the May/June 2006 question paper 0460 GEOGRAPHY 0460/04 Paper 4, maximum raw mark 60 These mark schemes are published as an aid to teachers and students, to indicate the requirements of the examination. They show the basis on which Examiners were initially instructed to award marks. They do not indicate the details of the discussions that took place at an Examiners’ meeting before marking began. Any substantial changes to the mark scheme that arose from these discussions will be recorded in the published Report on the Examination. All Examiners are instructed that alternative correct answers and unexpected approaches in candidates’ scripts must be given marks that fairly reflect the relevant knowledge and skills demonstrated. Mark schemes must be read in conjunction with the question papers and the Report on the Examination. The minimum marks in these components needed for various grades were previously published with these mark schemes, but are now instead included in the Report on the Examination for this session. • CIE will not enter into discussion or correspondence in connection with these mark schemes. CIE is publishing the mark schemes for the May/June 2006 question papers for most IGCSE and GCE Advanced Level and Advanced Subsidiary Level syllabuses and some Ordinary Level syllabuses. www.XtremePapers.com
Mark scheme, page 2
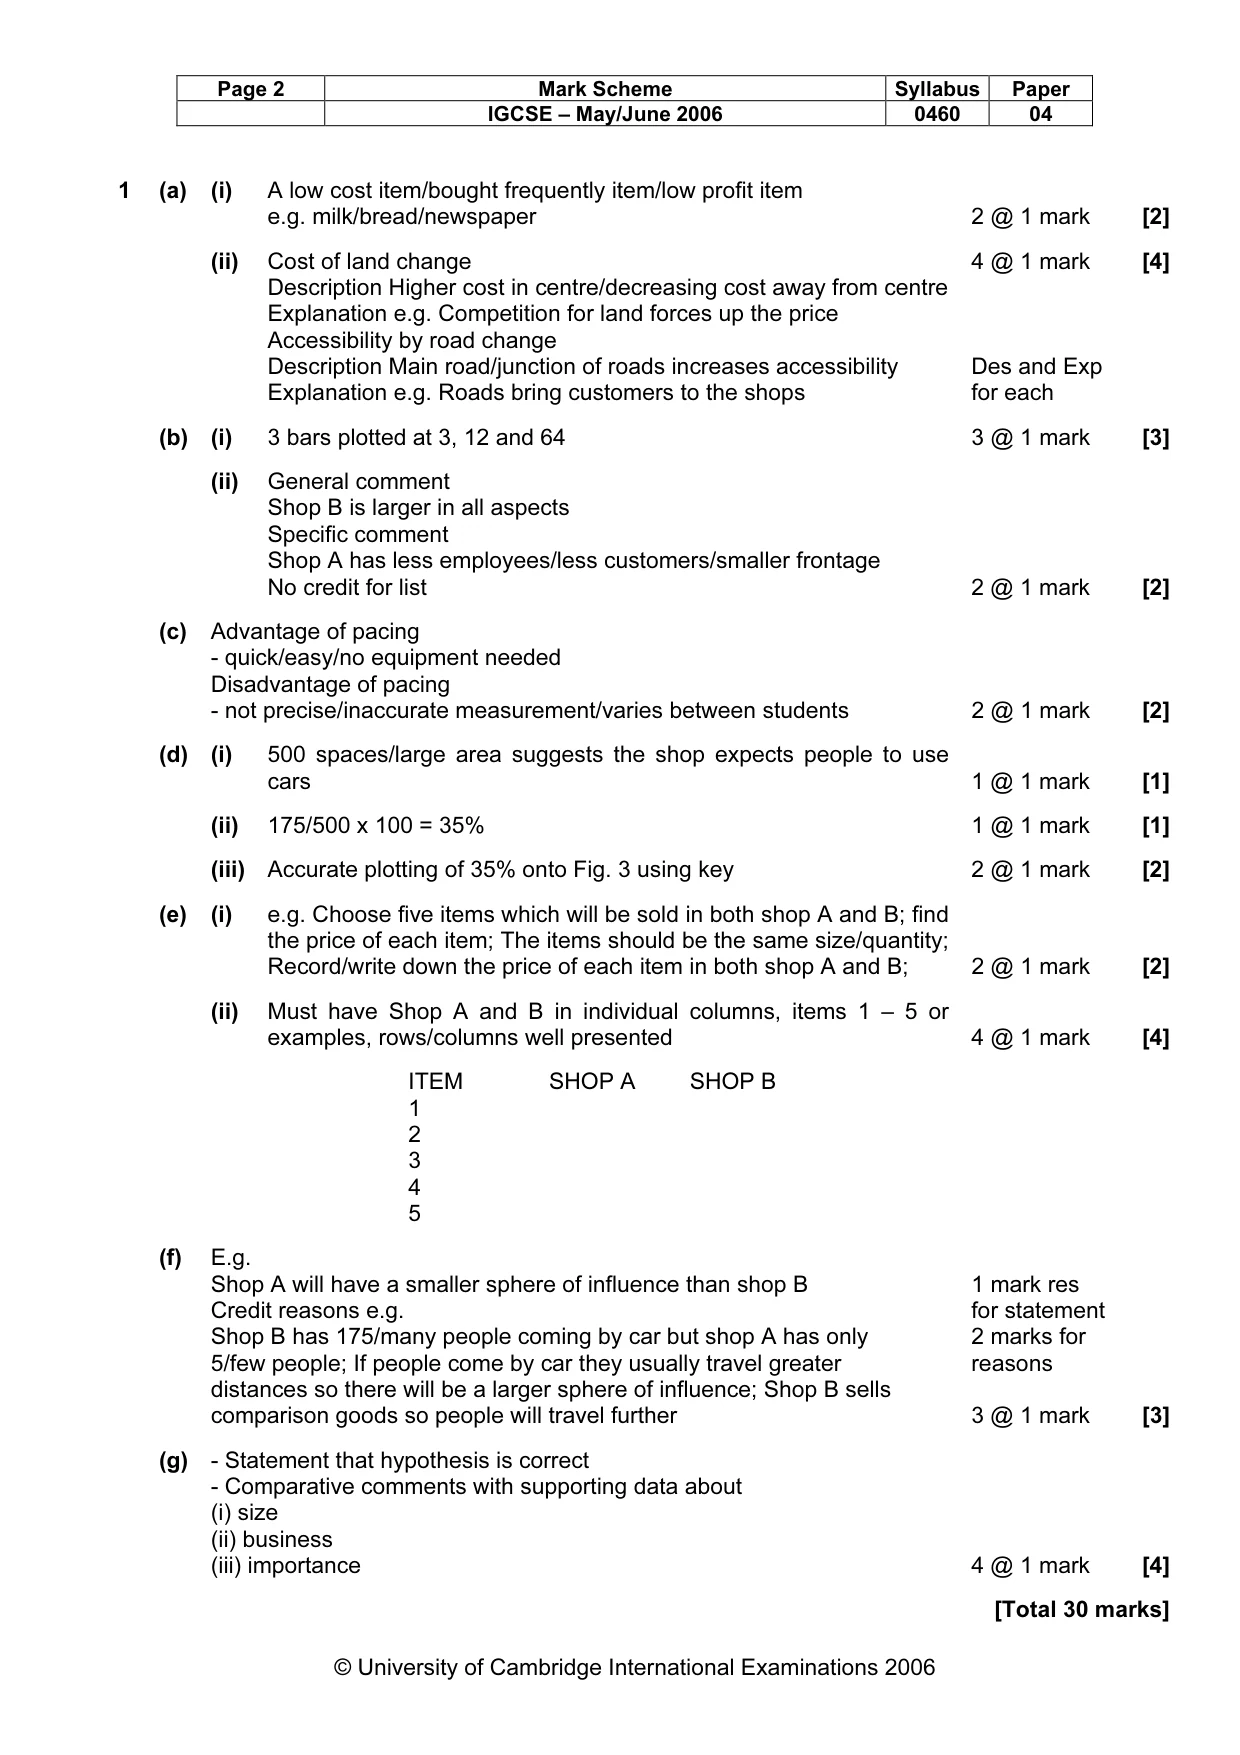
Page 2 Mark Scheme Syllabus Paper IGCSE – May/June 2006 0460 04 © University of Cambridge International Examinations 2006 1 (a) (i) A low cost item/bought frequently item/low profit item e.g. milk/bread/newspaper 2 @ 1 mark [2] (ii) Cost of land change 4 @ 1 mark [4] Description Higher cost in centre/decreasing cost away from centre Explanation e.g. Competition for land forces up the price Accessibility by road change Description Main road/junction of roads increases accessibility Explanation e.g. Roads bring customers to the shops Des and Exp for each (b) (i) 3 bars plotted at 3, 12 and 64 3 @ 1 mark [3] (ii) General comment Shop B is larger in all aspects Specific comment Shop A has less employees/less customers/smaller frontage No credit for list 2 @ 1 mark [2] (c) Advantage of pacing - quick/easy/no equipment needed Disadvantage of pacing - not precise/inaccurate measurement/varies between students 2 @ 1 mark [2] (d) (i) 500 spaces/large area suggests the shop expects people to use cars 1 @ 1 mark [1] (ii) 175/500 x 100 = 35% 1 @ 1 mark [1] (iii) Accurate plotting of 35% onto Fig. 3 using key 2 @ 1 mark [2] (e) (i) e.g. Choose five items which will be sold in both shop A and B; find the price of each item; The items should be the same size/quantity; Record/write down the price of each item in both shop A and B; 2 @ 1 mark [2] (ii) Must have Shop A and B in individual columns, items 1 – 5 or examples, rows/columns well presented 4 @ 1 mark [4] ITEM SHOP A SHOP B 1 2 3 4 5 (f) E.g. Shop A will have a smaller sphere of influence than shop B Credit reasons e.g. Shop B has 175/many people coming by car but shop A has only 5/few people; If people come by car they usually travel greater distances so there will be a larger sphere of influence; Shop B sells comparison goods so people will travel further 1 mark res for statement 2 marks for reasons 3 @ 1 mark [3] (g) - Statement that hypothesis is correct - Comparative comments with supporting data about (i) size (ii) business (iii) importance 4 @ 1 mark [4] [Total 30 marks]
Mark scheme, page 3
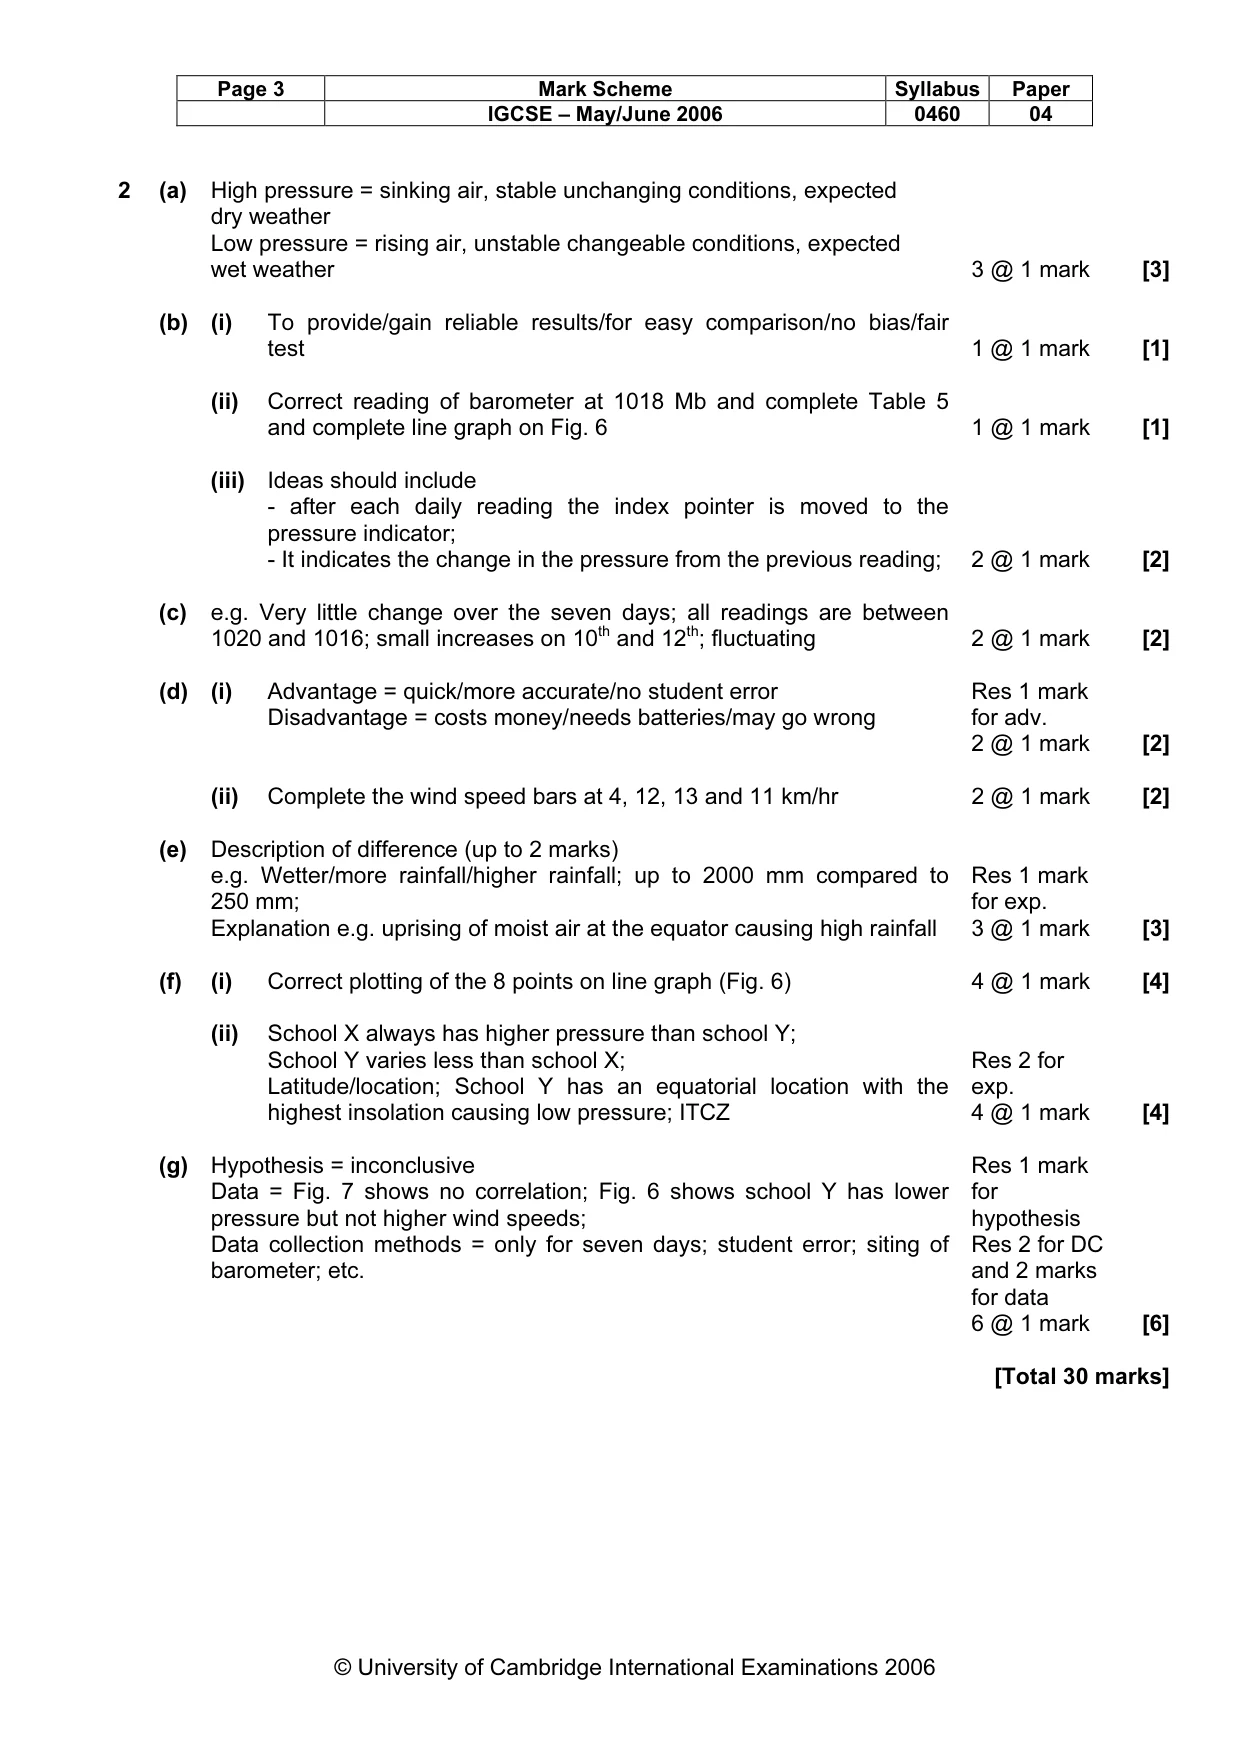
Page 3 Mark Scheme Syllabus Paper IGCSE – May/June 2006 0460 04 © University of Cambridge International Examinations 2006 2 (a) High pressure = sinking air, stable unchanging conditions, expected dry weather Low pressure = rising air, unstable changeable conditions, expected wet weather 3 @ 1 mark [3] (b) (i) To provide/gain reliable results/for easy comparison/no bias/fair test 1 @ 1 mark [1] (ii) Correct reading of barometer at 1018 Mb and complete Table 5 and complete line graph on Fig. 6 1 @ 1 mark [1] (iii) Ideas should include - after each daily reading the index pointer is moved to the pressure indicator; - It indicates the change in the pressure from the previous reading; 2 @ 1 mark [2] (c) e.g. Very little change over the seven days; all readings are between 1020 and 1016; small increases on 10th and 12th; fluctuating 2 @ 1 mark [2] (d) (i) Advantage = quick/more accurate/no student error Disadvantage = costs money/needs batteries/may go wrong Res 1 mark for adv. 2 @ 1 mark [2] (ii) Complete the wind speed bars at 4, 12, 13 and 11 km/hr 2 @ 1 mark [2] (e) Description of difference (up to 2 marks) e.g. Wetter/more rainfall/higher rainfall; up to 2000 mm compared to 250 mm; Explanation e.g. uprising of moist air at the equator causing high rainfall Res 1 mark for exp. 3 @ 1 mark [3] (f) (i) Correct plotting of the 8 points on line graph (Fig. 6) 4 @ 1 mark [4] (ii) School X always has higher pressure than school Y; School Y varies less than school X; Latitude/location; School Y has an equatorial location with the highest insolation causing low pressure; ITCZ Res 2 for exp. 4 @ 1 mark [4] (g) Hypothesis = inconclusive Data = Fig. 7 shows no correlation; Fig. 6 shows school Y has lower pressure but not higher wind speeds; Data collection methods = only for seven days; student error; siting of barometer; etc. Res 1 mark for hypothesis Res 2 for DC and 2 marks for data 6 @ 1 mark [6] [Total 30 marks]
What you needed in this session
Cambridge’s own grade thresholds for 2006 May/June, Paper 4 · Variant 1. A higher threshold means an easier paper — the bar moves with how the cohort did.