Cambridge IGCSE Geography 0460 — 2005 Oct/Nov Paper 4 · Variant 1
0460/41/O/N/05
The question paper and its mark scheme, free to read here and free to download. This is Cambridge’s own paper, exactly as it was sat.
Question paper4 pages
Mark scheme4 pages
Answers below. Sit the paper first if you are practising.
Paper as text
Question paper, page 1
This document consists of 4 printed pages and 1 insert. SPA (DR) S85609/2 © UCLES 2005 [Turn over UNIVERSITY OF CAMBRIDGE INTERNATIONAL EXAMINATIONS International General Certificate of Secondary Education GEOGRAPHY 0460/04 Paper 4 Alternative to Coursework October/November 2005 1 hour 45 minutes Additional Materials: Answer Booklet/Paper Ruler READ THESE INSTRUCTIONS FIRST If you have been given an Answer Booklet, follow the instructions on the front cover of the Booklet. Write your Centre number, candidate number and name on all the work you hand in. Write in dark blue or black pen on both sides of the paper. You may use a soft pencil for any diagrams, graphs or rough working. Do not use staples, paper clips, highlighters, glue or correction fluid. Answer all questions. At the end of the examination, fasten all your work securely together. The number of marks is given in brackets [ ] at the end of each question or part question. Sketch maps and diagrams should be drawn whenever they serve to illustrate an answer. The insert contains all the Figures, Tables and Photograph referred to in the Questions. www.XtremePapers.com
Question paper, page 2
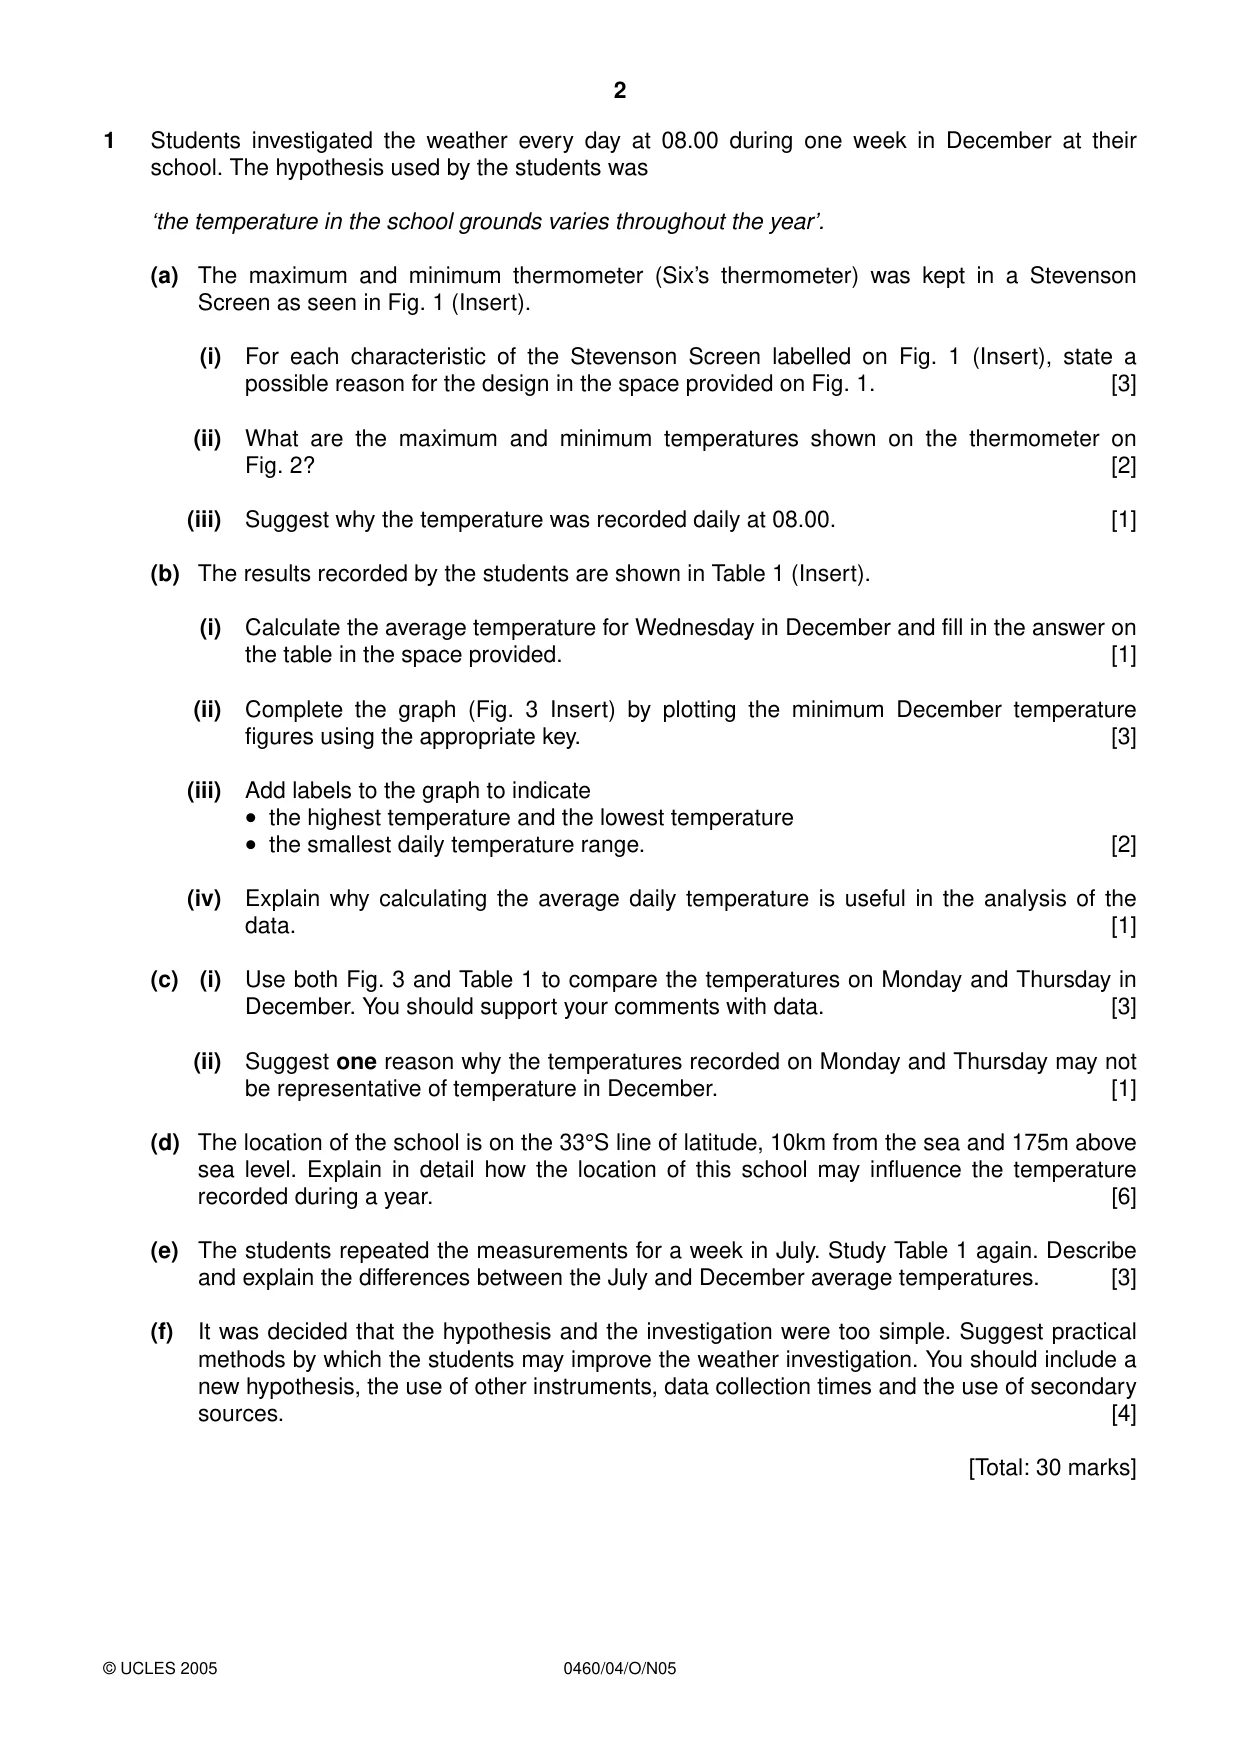
2 0460/04/O/N05 1 Students investigated the weather every day at 08.00 during one week in December at their school. The hypothesis used by the students was ‘the temperature in the school grounds varies throughout the year’. (a) The maximum and minimum thermometer (Six’s thermometer) was kept in a Stevenson Screen as seen in Fig. 1 (Insert). (i) For each characteristic of the Stevenson Screen labelled on Fig. 1 (Insert), state a possible reason for the design in the space provided on Fig. 1. [3] (ii) What are the maximum and minimum temperatures shown on the thermometer on Fig. 2? [2] (iii) Suggest why the temperature was recorded daily at 08.00. [1] (b) The results recorded by the students are shown in Table 1 (Insert). (i) Calculate the average temperature for Wednesday in December and fill in the answer on the table in the space provided. [1] (ii) Complete the graph (Fig. 3 Insert) by plotting the minimum December temperature figures using the appropriate key. [3] (iii) Add labels to the graph to indicate • the highest temperature and the lowest temperature • the smallest daily temperature range. [2] (iv) Explain why calculating the average daily temperature is useful in the analysis of the data. [1] (c) (i) Use both Fig. 3 and Table 1 to compare the temperatures on Monday and Thursday in December. You should support your comments with data. [3] (ii) Suggest one reason why the temperatures recorded on Monday and Thursday may not be representative of temperature in December. [1] (d) The location of the school is on the 33°S line of latitude, 10km from the sea and 175m above sea level. Explain in detail how the location of this school may influence the temperature recorded during a year. [6] (e) The students repeated the measurements for a week in July. Study Table 1 again. Describe and explain the differences between the July and December average temperatures. [3] (f) It was decided that the hypothesis and the investigation were too simple. Suggest practical methods by which the students may improve the weather investigation. You should include a new hypothesis, the use of other instruments, data collection times and the use of secondary sources. [4] [Total: 30 marks] © UCLES 2005
Question paper, page 3
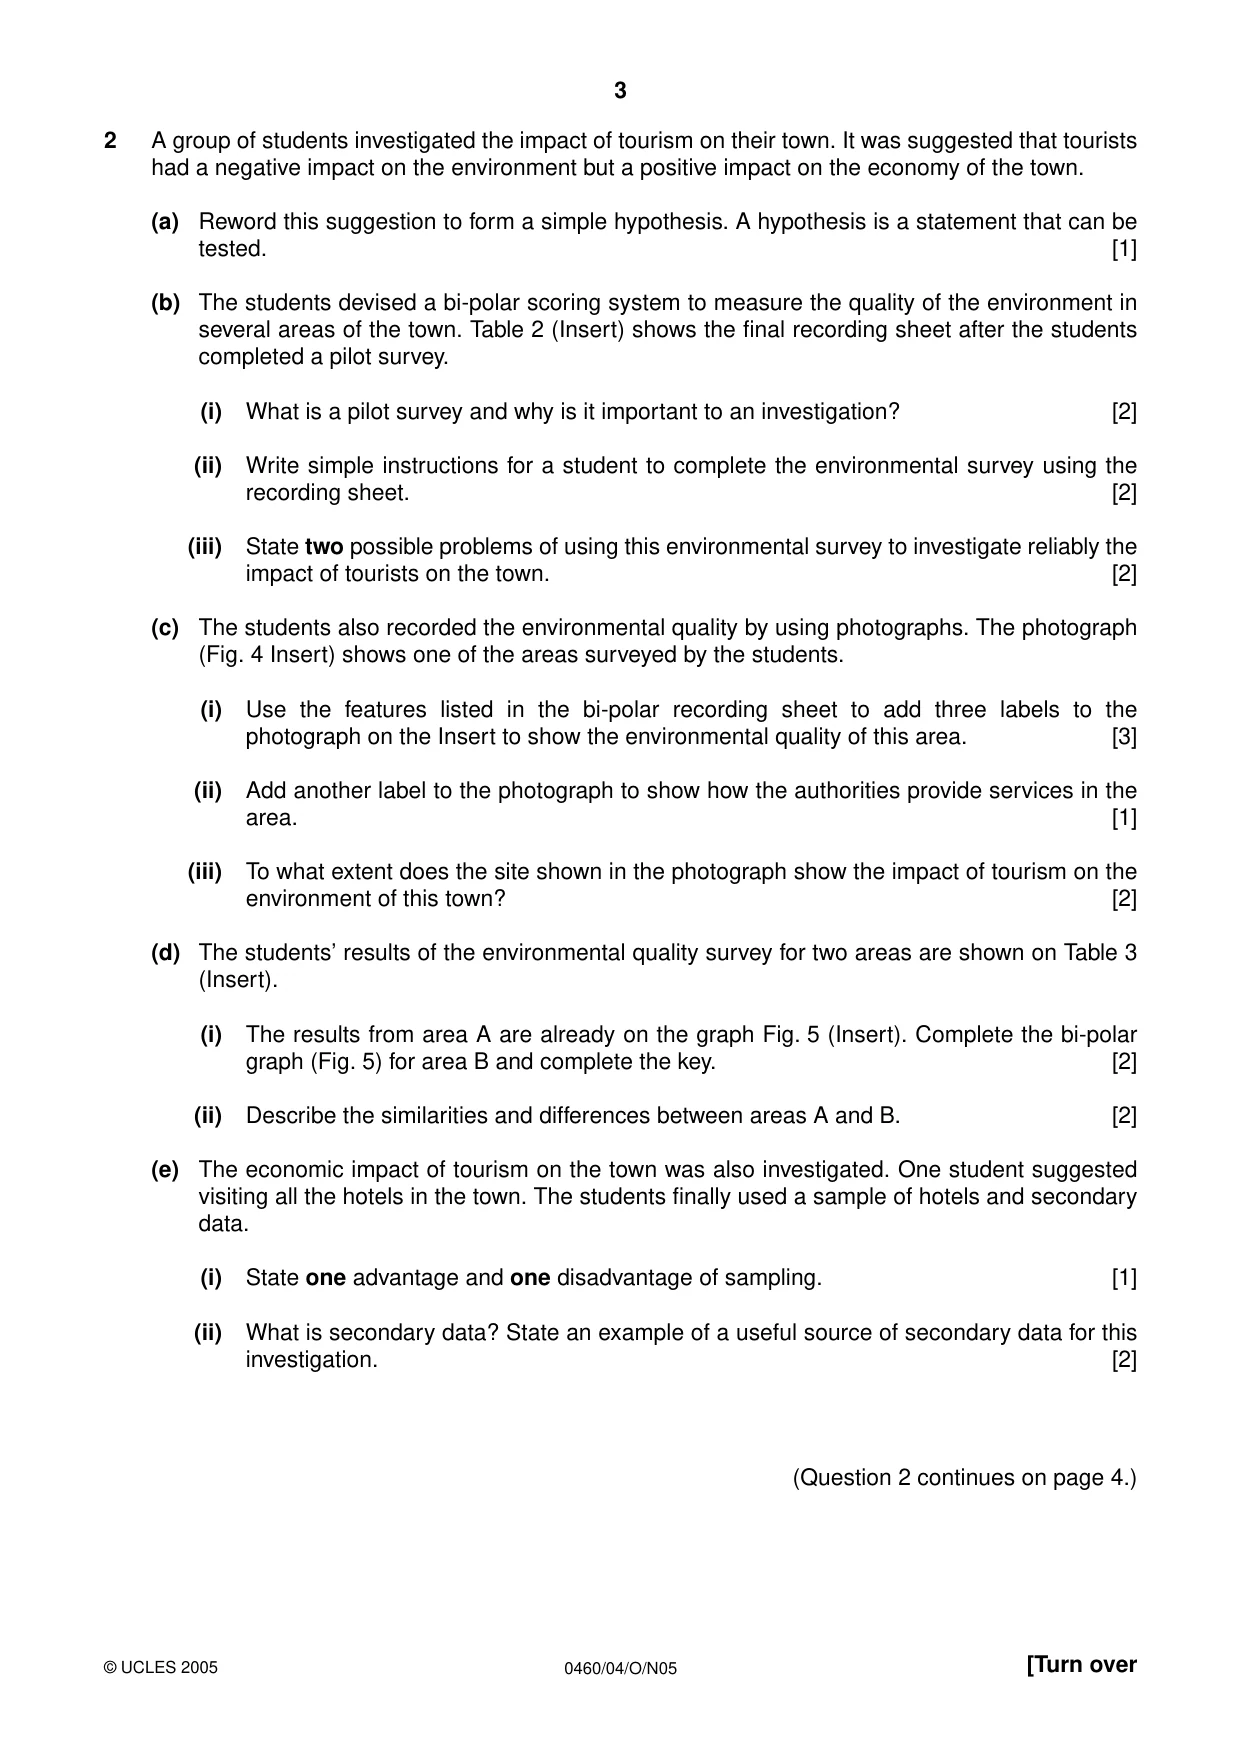
3 0460/04/O/N05 [Turn over 2 A group of students investigated the impact of tourism on their town. It was suggested that tourists had a negative impact on the environment but a positive impact on the economy of the town. (a) Reword this suggestion to form a simple hypothesis. A hypothesis is a statement that can be tested. [1] (b) The students devised a bi-polar scoring system to measure the quality of the environment in several areas of the town. Table 2 (Insert) shows the final recording sheet after the students completed a pilot survey. (i) What is a pilot survey and why is it important to an investigation? [2] (ii) Write simple instructions for a student to complete the environmental survey using the recording sheet. [2] (iii) State two possible problems of using this environmental survey to investigate reliably the impact of tourists on the town. [2] (c) The students also recorded the environmental quality by using photographs. The photograph (Fig. 4 Insert) shows one of the areas surveyed by the students. (i) Use the features listed in the bi-polar recording sheet to add three labels to the photograph on the Insert to show the environmental quality of this area. [3] (ii) Add another label to the photograph to show how the authorities provide services in the area. [1] (iii) To what extent does the site shown in the photograph show the impact of tourism on the environment of this town? [2] (d) The students’ results of the environmental quality survey for two areas are shown on Table 3 (Insert). (i) The results from area A are already on the graph Fig. 5 (Insert). Complete the bi-polar graph (Fig. 5) for area B and complete the key. [2] (ii) Describe the similarities and differences between areas A and B. [2] (e) The economic impact of tourism on the town was also investigated. One student suggested visiting all the hotels in the town. The students finally used a sample of hotels and secondary data. (i) State one advantage and one disadvantage of sampling. [1] (ii) What is secondary data? State an example of a useful source of secondary data for this investigation. [2] (Question 2 continues on page 4.) © UCLES 2005
Question paper, page 4
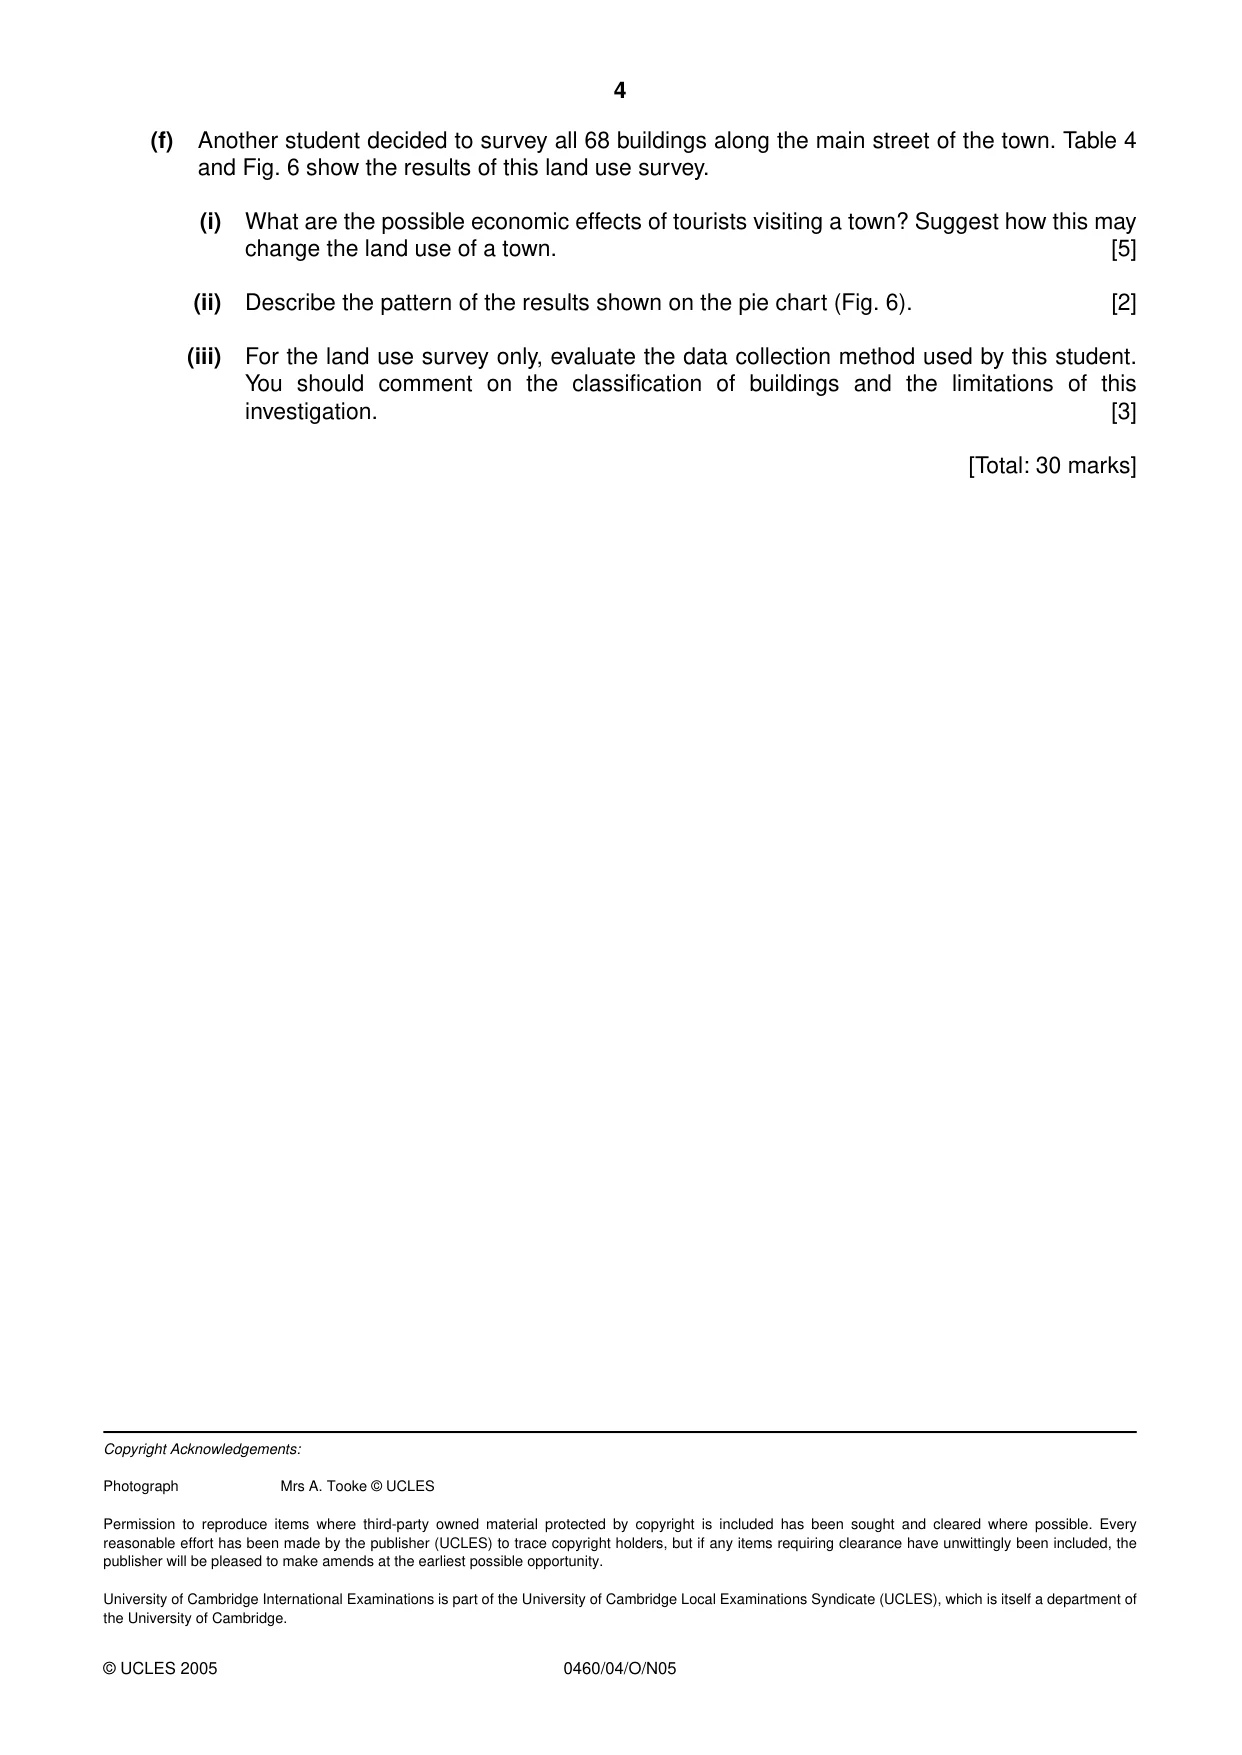
4 0460/04/O/N05 (f) Another student decided to survey all 68 buildings along the main street of the town. Table 4 and Fig. 6 show the results of this land use survey. (i) What are the possible economic effects of tourists visiting a town? Suggest how this may change the land use of a town. [5] (ii) Describe the pattern of the results shown on the pie chart (Fig. 6). [2] (iii) For the land use survey only, evaluate the data collection method used by this student. You should comment on the classification of buildings and the limitations of this investigation. [3] [Total: 30 marks] © UCLES 2005 Copyright Acknowledgements: Photograph Mrs A. Tooke © UCLES Permission to reproduce items where third-party owned material protected by copyright is included has been sought and cleared where possible. Every reasonable effort has been made by the publisher (UCLES) to trace copyright holders, but if any items requiring clearance have unwittingly been included, the publisher will be pleased to make amends at the earliest possible opportunity. University of Cambridge International Examinations is part of the University of Cambridge Local Examinations Syndicate (UCLES), which is itself a department of the University of Cambridge.
Mark scheme, page 1
UNIVERSITY OF CAMBRIDGE INTERNATIONAL EXAMINATIONS International General Certificate of Secondary Education MARK SCHEME for the November 2005 question paper GEOGRAPHY 0460/04 Paper 4 maximum raw mark 60 This mark scheme is published as an aid to teachers and students, to indicate the requirements of the examination. It shows the basis on which Examiners were initially instructed to award marks. It does not indicate the details of the discussions that took place at an Examiners’ meeting before marking began. Any substantial changes to the mark scheme that arose from these discussions will be recorded in the published Report on the Examination. All Examiners are instructed that alternative correct answers and unexpected approaches in candidates’ scripts must be given marks that fairly reflect the relevant knowledge and skills demonstrated. Mark schemes must be read in conjunction with the question papers and the Report on the Examination. The minimum marks in these components needed for various grades were previously published with these mark schemes, but are now instead included in the Report on the Examination for this session. • CIE will not enter into discussion or correspondence in connection with these mark schemes. CIE is publishing the mark schemes for the November 2005 question papers for most IGCSE and GCE Advanced Level and Advanced Subsidiary Level syllabuses and some Ordinary Level syllabuses. www.XtremePapers.com
Mark scheme, page 2
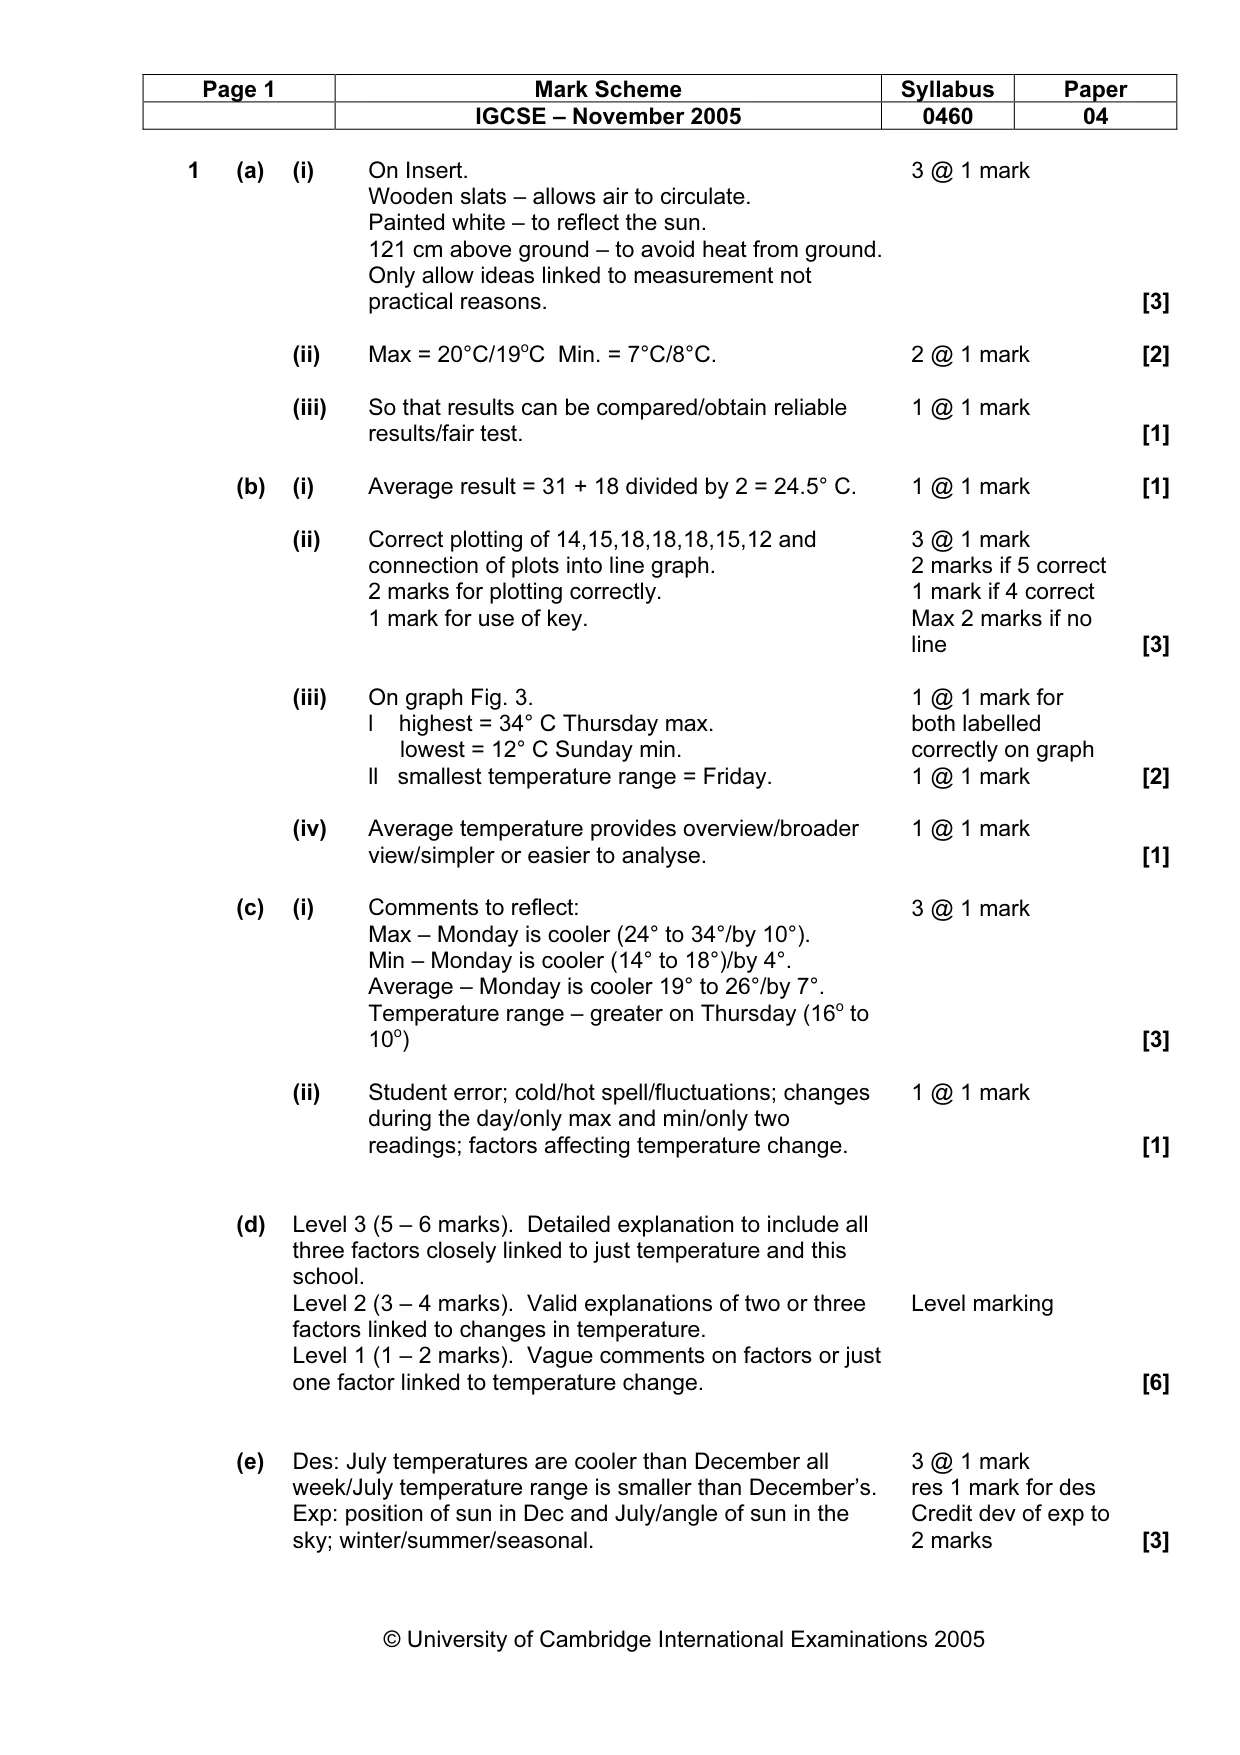
Page 1 Mark Scheme Syllabus Paper IGCSE – November 2005 0460 04 © University of Cambridge International Examinations 2005 1 (a) (i) On Insert. Wooden slats – allows air to circulate. Painted white – to reflect the sun. 121 cm above ground – to avoid heat from ground. Only allow ideas linked to measurement not practical reasons. 3 @ 1 mark [3] (ii) Max = 20°C/19oC Min. = 7°C/8°C. 2 @ 1 mark [2] (iii) So that results can be compared/obtain reliable results/fair test. 1 @ 1 mark [1] (b) (i) Average result = 31 + 18 divided by 2 = 24.5° C. 1 @ 1 mark [1] (ii) Correct plotting of 14,15,18,18,18,15,12 and connection of plots into line graph. 2 marks for plotting correctly. 1 mark for use of key. 3 @ 1 mark 2 marks if 5 correct 1 mark if 4 correct Max 2 marks if no line [3] (iii) On graph Fig. 3. l highest = 34° C Thursday max. lowest = 12° C Sunday min. ll smallest temperature range = Friday. 1 @ 1 mark for both labelled correctly on graph 1 @ 1 mark [2] (iv) Average temperature provides overview/broader view/simpler or easier to analyse. 1 @ 1 mark [1] (c) (i) Comments to reflect: Max – Monday is cooler (24° to 34°/by 10°). Min – Monday is cooler (14° to 18°)/by 4°. Average – Monday is cooler 19° to 26°/by 7°. Temperature range – greater on Thursday (16o to 10o) 3 @ 1 mark [3] (ii) Student error; cold/hot spell/fluctuations; changes during the day/only max and min/only two readings; factors affecting temperature change. 1 @ 1 mark [1] (d) Level 3 (5 – 6 marks). Detailed explanation to include all three factors closely linked to just temperature and this school. Level 2 (3 – 4 marks). Valid explanations of two or three factors linked to changes in temperature. Level 1 (1 – 2 marks). Vague comments on factors or just one factor linked to temperature change. Level marking [6] (e) Des: July temperatures are cooler than December all week/July temperature range is smaller than December’s. Exp: position of sun in Dec and July/angle of sun in the sky; winter/summer/seasonal. 3 @ 1 mark res 1 mark for des Credit dev of exp to 2 marks [3]
Mark scheme, page 3
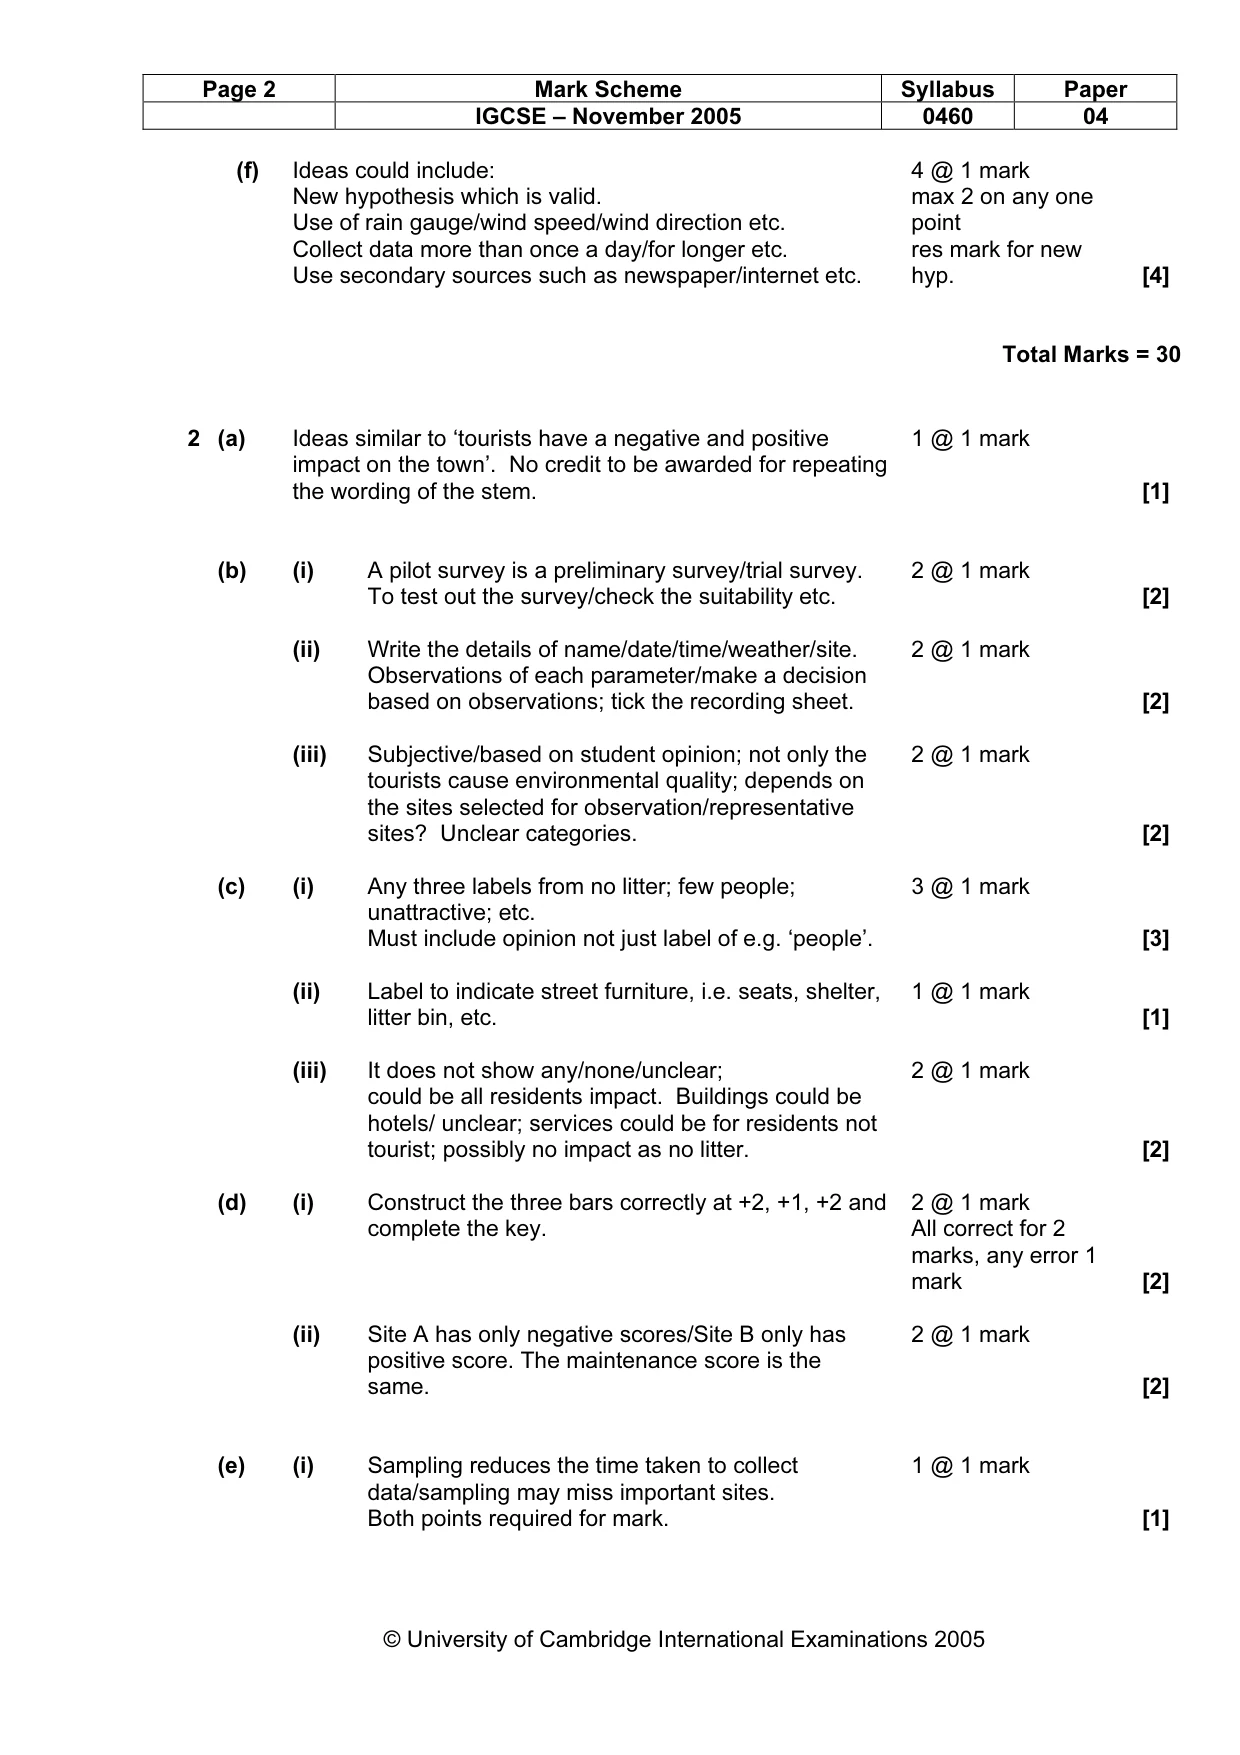
Page 2 Mark Scheme Syllabus Paper IGCSE – November 2005 0460 04 © University of Cambridge International Examinations 2005 (f) Ideas could include: New hypothesis which is valid. Use of rain gauge/wind speed/wind direction etc. Collect data more than once a day/for longer etc. Use secondary sources such as newspaper/internet etc. 4 @ 1 mark max 2 on any one point res mark for new hyp. [4] Total Marks = 30 2 (a) Ideas similar to ‘tourists have a negative and positive impact on the town’. No credit to be awarded for repeating the wording of the stem. 1 @ 1 mark [1] (b) (i) A pilot survey is a preliminary survey/trial survey. To test out the survey/check the suitability etc. 2 @ 1 mark [2] (ii) Write the details of name/date/time/weather/site. Observations of each parameter/make a decision based on observations; tick the recording sheet. 2 @ 1 mark [2] (iii) Subjective/based on student opinion; not only the tourists cause environmental quality; depends on the sites selected for observation/representative sites? Unclear categories. 2 @ 1 mark [2] (c) (i) Any three labels from no litter; few people; unattractive; etc. Must include opinion not just label of e.g. ‘people’. 3 @ 1 mark [3] (ii) Label to indicate street furniture, i.e. seats, shelter, litter bin, etc. 1 @ 1 mark [1] (iii) It does not show any/none/unclear; could be all residents impact. Buildings could be hotels/ unclear; services could be for residents not tourist; possibly no impact as no litter. 2 @ 1 mark [2] (d) (i) Construct the three bars correctly at +2, +1, +2 and complete the key. 2 @ 1 mark All correct for 2 marks, any error 1 mark [2] (ii) Site A has only negative scores/Site B only has positive score. The maintenance score is the same. 2 @ 1 mark [2] (e) (i) Sampling reduces the time taken to collect data/sampling may miss important sites. Both points required for mark. 1 @ 1 mark [1]
Mark scheme, page 4
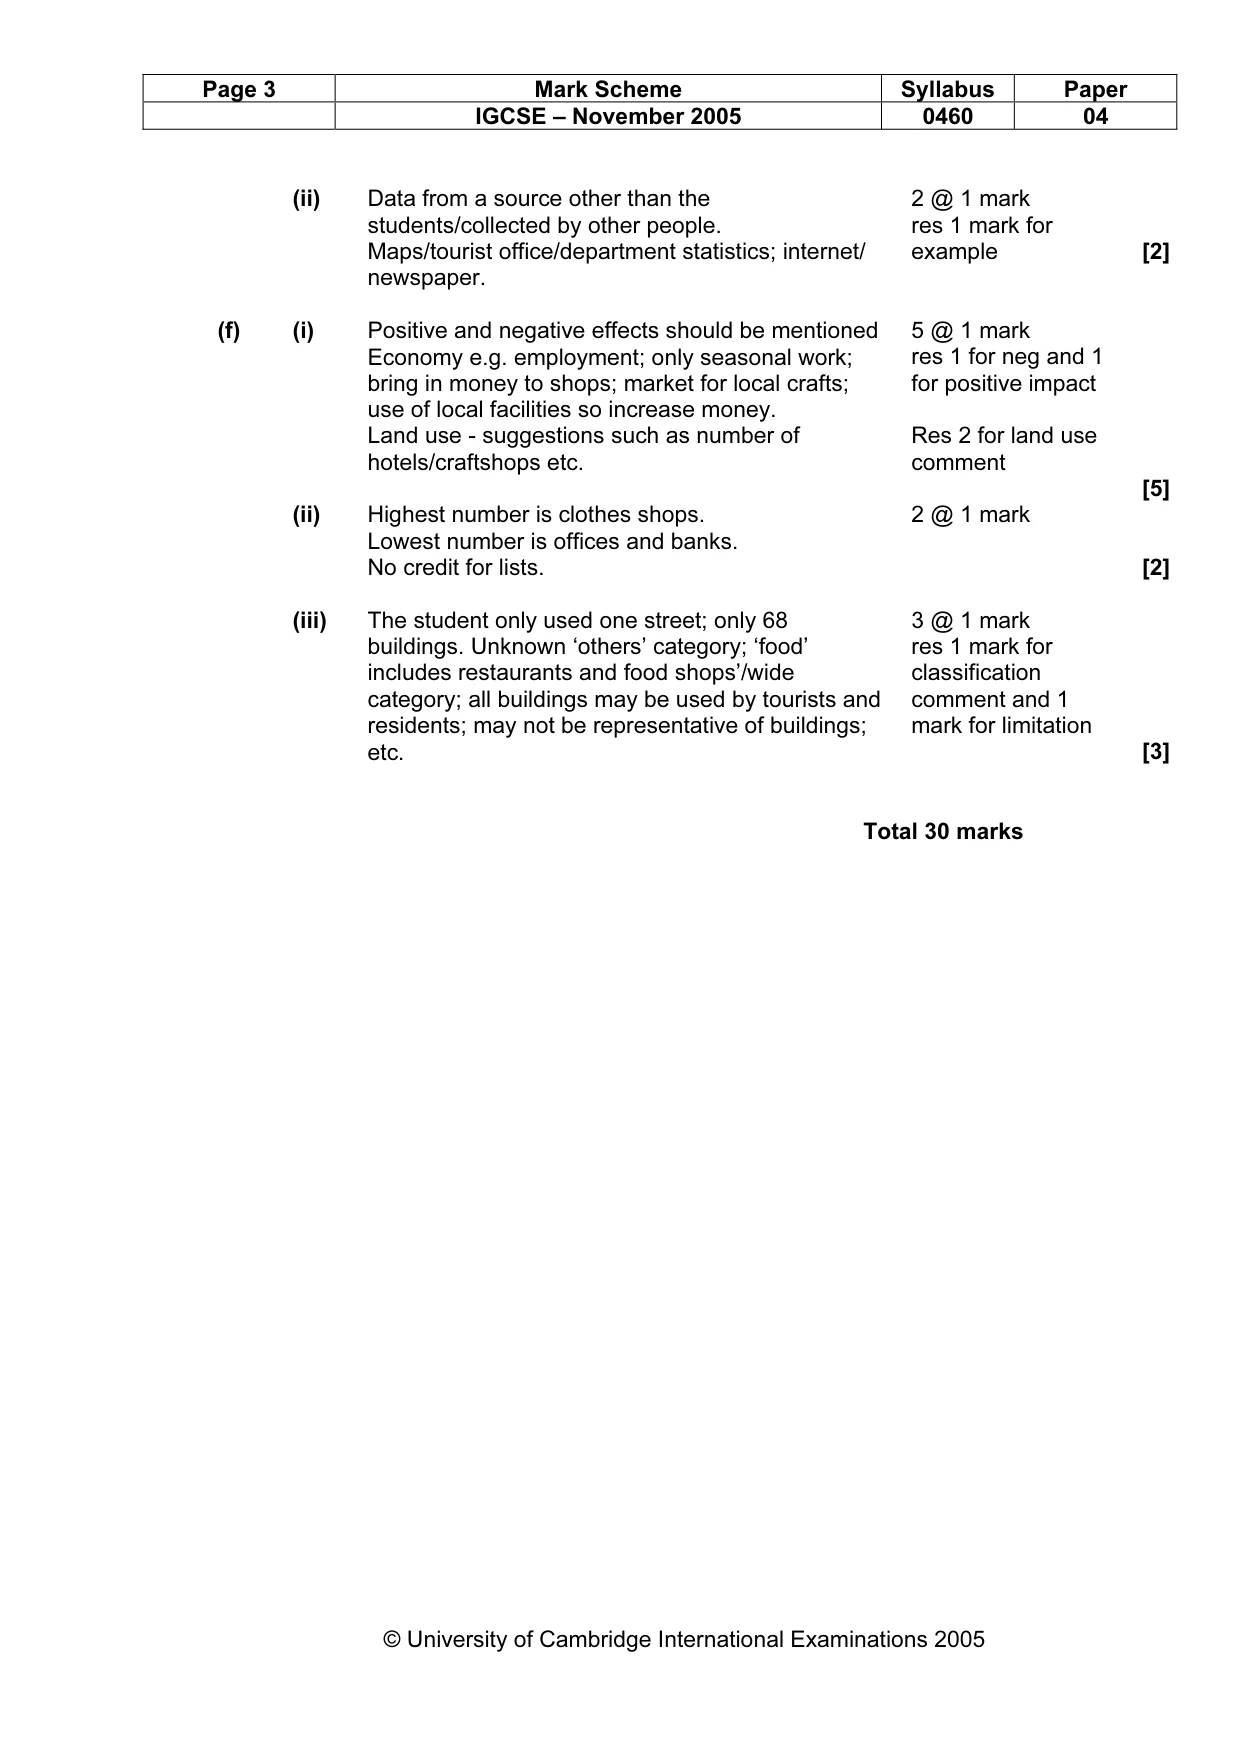
Page 3 Mark Scheme Syllabus Paper IGCSE – November 2005 0460 04 © University of Cambridge International Examinations 2005 (ii) Data from a source other than the students/collected by other people. Maps/tourist office/department statistics; internet/ newspaper. 2 @ 1 mark res 1 mark for example [2] (f) (i) Positive and negative effects should be mentioned Economy e.g. employment; only seasonal work; bring in money to shops; market for local crafts; use of local facilities so increase money. Land use - suggestions such as number of hotels/craftshops etc. 5 @ 1 mark res 1 for neg and 1 for positive impact Res 2 for land use comment [5] (ii) Highest number is clothes shops. Lowest number is offices and banks. No credit for lists. 2 @ 1 mark [2] (iii) The student only used one street; only 68 buildings. Unknown ‘others’ category; ‘food’ includes restaurants and food shops’/wide category; all buildings may be used by tourists and residents; may not be representative of buildings; etc. 3 @ 1 mark res 1 mark for classification comment and 1 mark for limitation [3] Total 30 marks