Cambridge IGCSE Geography 0460 — 2005 May/June Paper 4 · Variant 1
0460/41/M/J/05
The question paper and its mark scheme, free to read here and free to download. This is Cambridge’s own paper, exactly as it was sat.
Question paper4 pages

Mark scheme7 pages
Answers below. Sit the paper first if you are practising.

Paper as text
Question paper, page 1
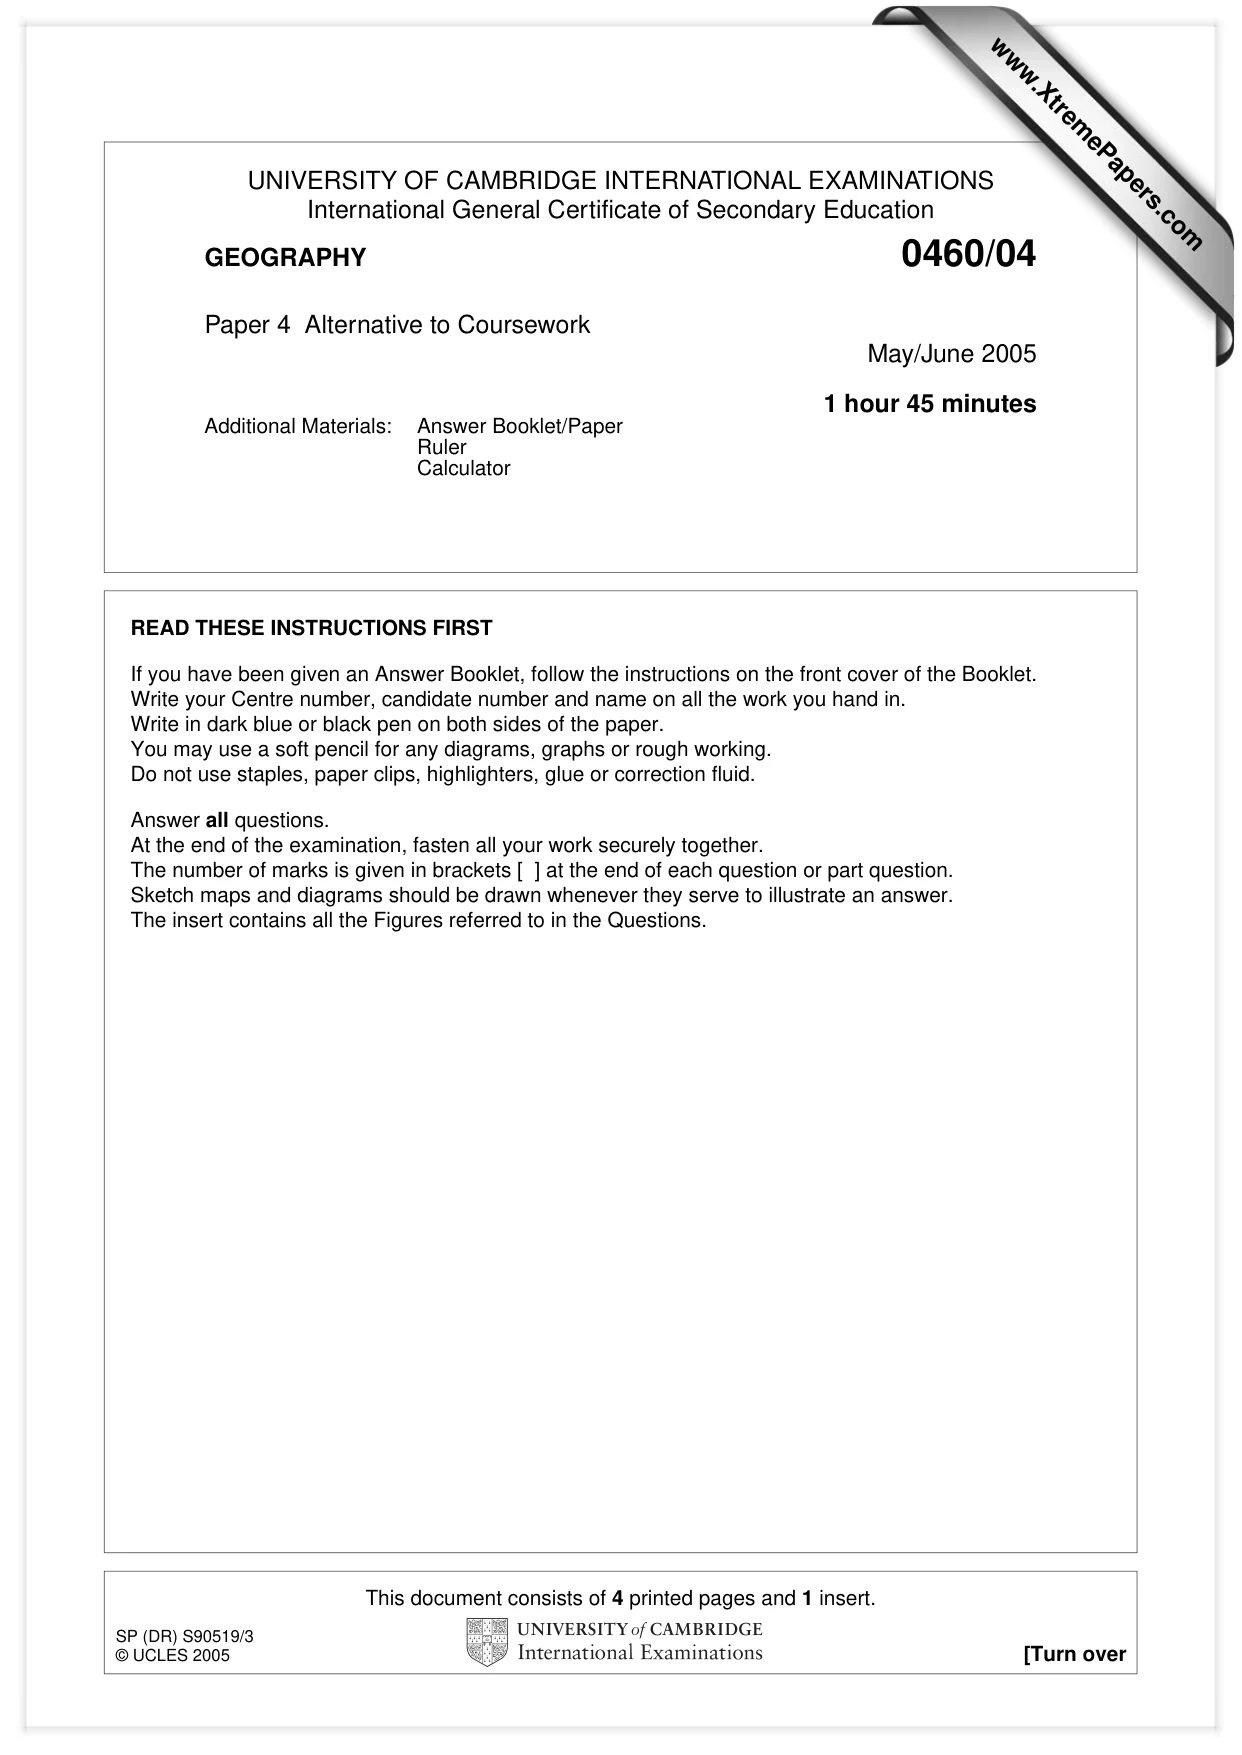
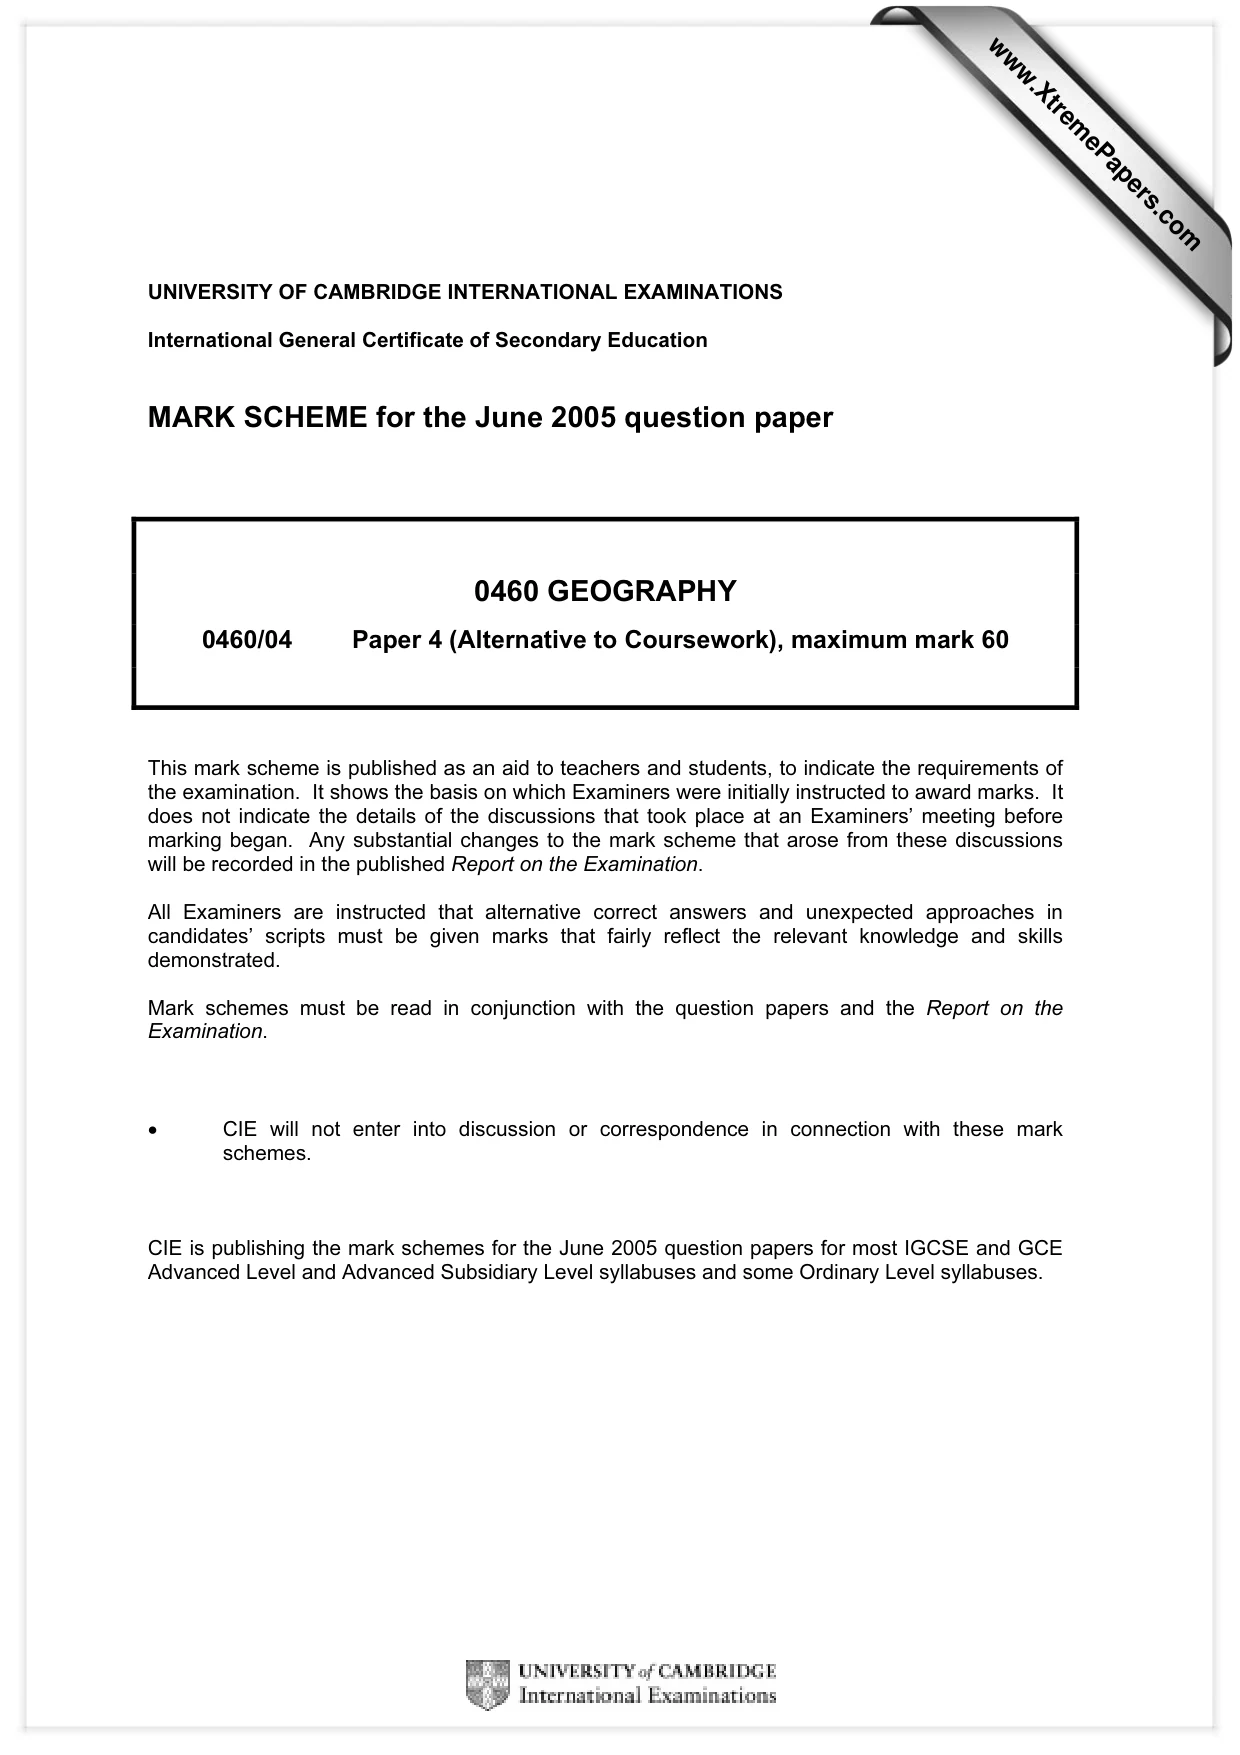
This document consists of 4 printed pages and 1 insert. SP (DR) S90519/3 © UCLES 2005 [Turn over UNIVERSITY OF CAMBRIDGE INTERNATIONAL EXAMINATIONS International General Certificate of Secondary Education GEOGRAPHY 0460/04 Paper 4 Alternative to Coursework May/June 2005 1 hour 45 minutes Additional Materials: Answer Booklet/Paper Ruler Calculator READ THESE INSTRUCTIONS FIRST If you have been given an Answer Booklet, follow the instructions on the front cover of the Booklet. Write your Centre number, candidate number and name on all the work you hand in. Write in dark blue or black pen on both sides of the paper. You may use a soft pencil for any diagrams, graphs or rough working. Do not use staples, paper clips, highlighters, glue or correction fluid. Answer all questions. At the end of the examination, fasten all your work securely together. The number of marks is given in brackets [ ] at the end of each question or part question. Sketch maps and diagrams should be drawn whenever they serve to illustrate an answer. The insert contains all the Figures referred to in the Questions. www.XtremePapers.com
Question paper, page 2
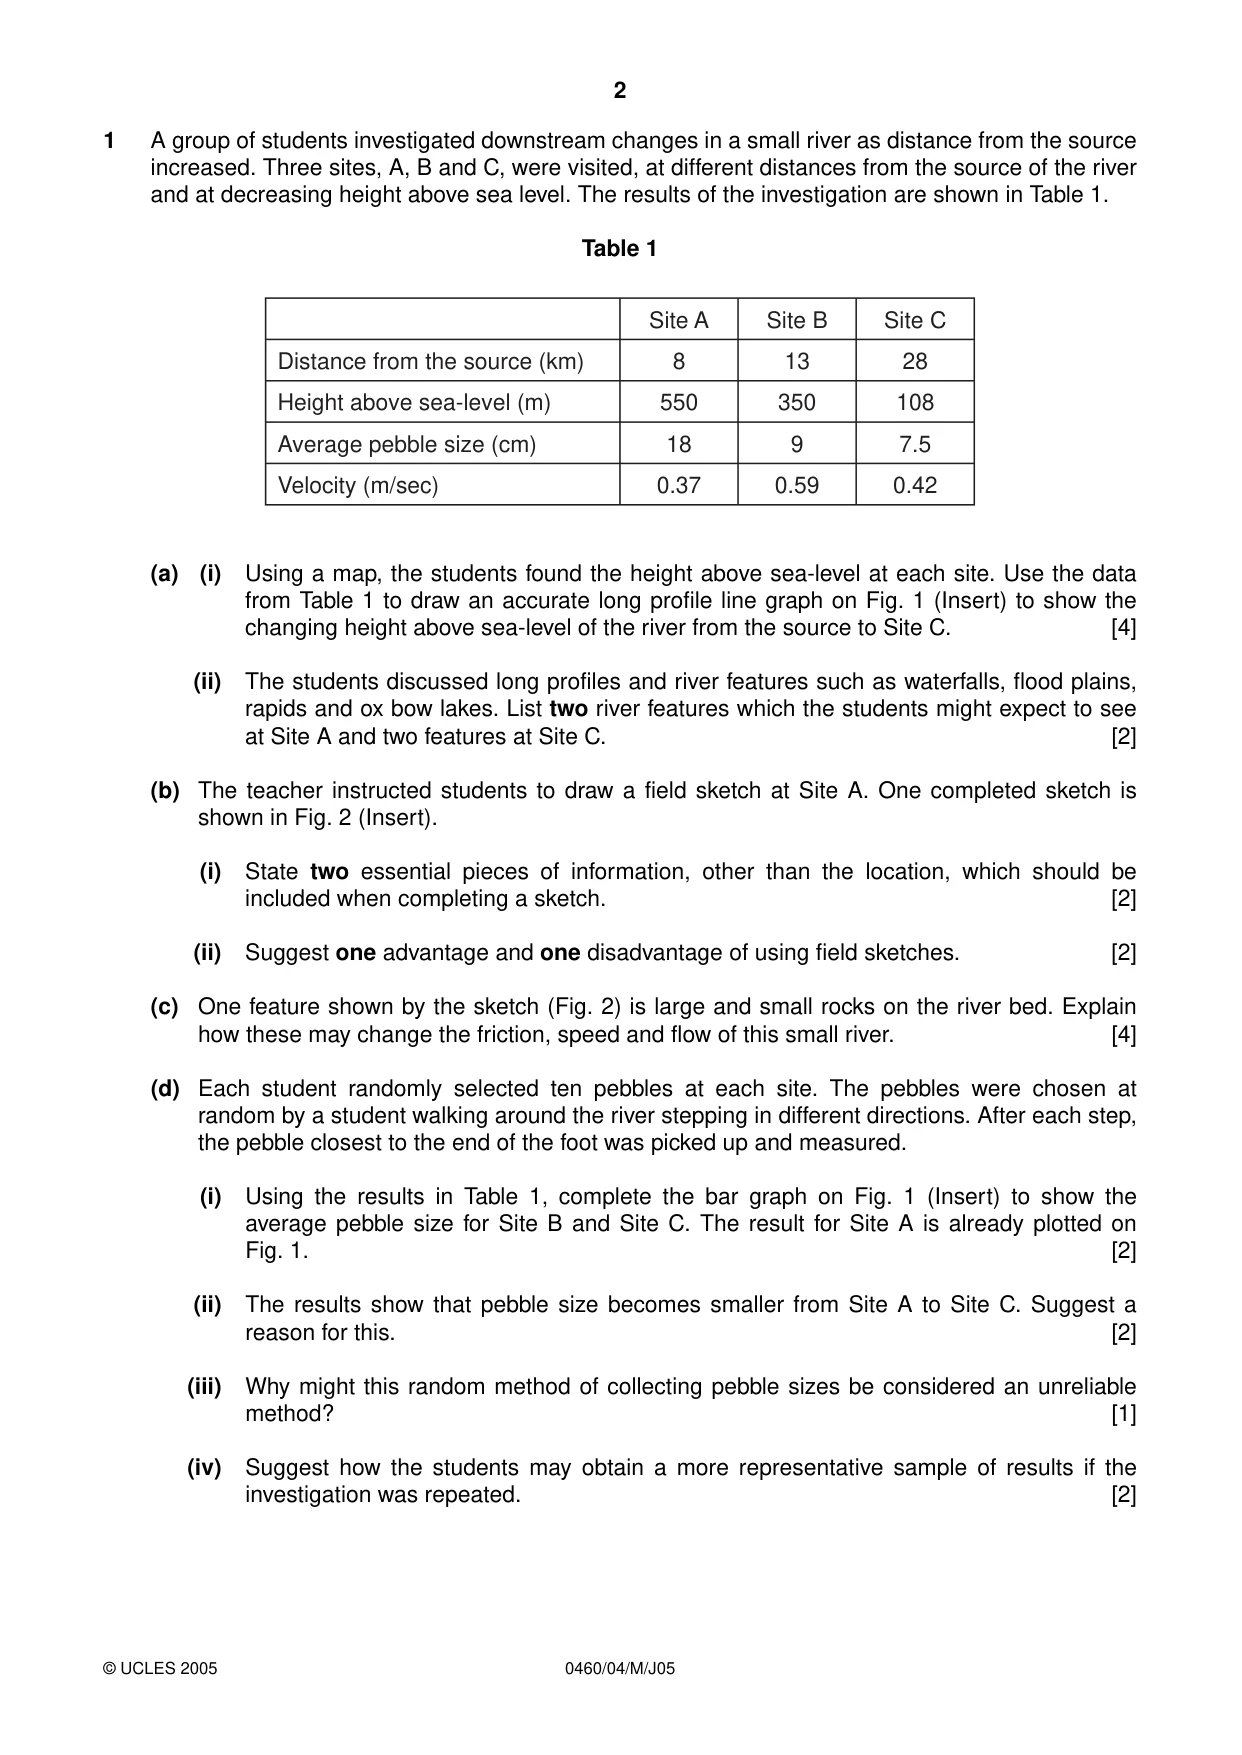
2 0460/04/M/J05 1 A group of students investigated downstream changes in a small river as distance from the source increased. Three sites, A, B and C, were visited, at different distances from the source of the river and at decreasing height above sea level. The results of the investigation are shown in Table 1. Table 1 (a) (i) Using a map, the students found the height above sea-level at each site. Use the data from Table 1 to draw an accurate long profile line graph on Fig. 1 (Insert) to show the changing height above sea-level of the river from the source to Site C. [4] (ii) The students discussed long profiles and river features such as waterfalls, flood plains, rapids and ox bow lakes. List two river features which the students might expect to see at Site A and two features at Site C. [2] (b) The teacher instructed students to draw a field sketch at Site A. One completed sketch is shown in Fig. 2 (Insert). (i) State two essential pieces of information, other than the location, which should be included when completing a sketch. [2] (ii) Suggest one advantage and one disadvantage of using field sketches. [2] (c) One feature shown by the sketch (Fig. 2) is large and small rocks on the river bed. Explain how these may change the friction, speed and flow of this small river. [4] (d) Each student randomly selected ten pebbles at each site. The pebbles were chosen at random by a student walking around the river stepping in different directions. After each step, the pebble closest to the end of the foot was picked up and measured. (i) Using the results in Table 1, complete the bar graph on Fig. 1 (Insert) to show the average pebble size for Site B and Site C. The result for Site A is already plotted on Fig. 1. [2] (ii) The results show that pebble size becomes smaller from Site A to Site C. Suggest a reason for this. [2] (iii) Why might this random method of collecting pebble sizes be considered an unreliable method? [1] (iv) Suggest how the students may obtain a more representative sample of results if the investigation was repeated. [2] Distance from the source (km) Height above sea-level (m) Average pebble size (cm) Velocity (m/sec) Site A Site B Site C 8 13 28 550 350 108 18 9 7.5 0.37 0.59 0.42 © UCLES 2005
Question paper, page 3
3 0460/04/M/J05 [Turn over (e) Study Table 1 again. The velocity at each site was also recorded and the results shown in Table 1. (i) Describe the changing pattern of velocity from Site A to Site C. [1] (ii) Water was extracted by a bottling factory upstream from Site C. Suggest how and why this: • changed the velocity readings, • increased the depositional features at Site C. [3] (f) Stating data evidence from Table 1 and Fig. 1, write a conclusion to the investigation about the changes in this small river as distance from the source increased. [5] Total 30 marks 2 Students investigated traffic flow in and around the centre of a town. A simplified map of the area studied is shown on Fig. 3. The students proposed to investigate two hypotheses. • The amount of traffic is highest in the centre of the town and decreases away from the centre. • Traffic flow will change during the day. Six sites (P, Q, R, S, U and V) were chosen at different distances from the town centre. These sites are shown on Fig. 3. Site P was identified as the centre of the town. (a) Suggest how and why the amount of traffic is often a problem in the centre of towns. [3] (b) The traffic was counted three times during a weekday. A student at each site counted vehicles for five minutes at 08.30, 13.00 and 16.30. The results of the traffic survey are shown in Table 2 below. (i) A tally system was used for recording the vehicles passing each student. Suggest two reasons why this is a suitable recording method. [2] (ii) Using the data from Table 2, draw proportional squares to show the total number of vehicles at Sites S and U onto Fig. 3. [4] (iii) Describe the changes in total traffic as distance from the centre of the town increases. [2] Table 2 Site Total Distance in metres from Centre (P) 08.30 Away from P 08.30 Towards P 140 0 289 200 64 144 81 256 P Q R S U V 200 250 420 580 470 31 81 26 46 30 60 7 19 9 33 13.00 Away from P 13.00 Towards P 56 14 16 8 14 7 29 2 8 6 25 16.30 Away from P 16.30 Towards P 93 44 14 10 22 10 40 11 35 19 69 © UCLES 2005
Question paper, page 4
4 0460/04/M/J05 (c) (i) Study Fig. 4 showing flow diagrams for traffic flow at Sites U and V. Compare the traffic flow during the day at Site U with that at Site V. You should state data to support your comments. [4] (ii) If a similar flow diagram was drawn for Site Q for 16.30, state in mm the width of the flow diagram for both towards and away from the centre of the town. [1] (iii) Calculate the percentage of traffic recorded at Site R at 08.30 travelling towards the town centre as a proportion of the total passing Site R. [1] (d) Students decided to investigate land use to see if a link existed between land use and traffic flow. (i) Outline the reasons why traffic flow may be linked to land use in a town. [3] (ii) Describe in detail what the students should do to collect data about the land use of this town. [4] (e) Write a conclusion to this investigation into traffic flow. It should include • comments on both hypotheses 1 and 2, • data evidence to support your conclusions, • critical evaluation of the data collection methods used in the investigation. [6] Total 30 marks © UCLES 2005 Permission to reproduce items where third-party owned material protected by copyright is included has been sought and cleared where possible. Every reasonable effort has been made by the publisher (UCLES) to trace copyright holders, but if any items requiring clearance have unwittingly been included, the publisher will be pleased to make amends at the earliest possible opportunity. University of Cambridge International Examinations is part of the University of Cambridge Local Examinations Syndicate (UCLES), which is itself a department of the University of Cambridge.
Mark scheme, page 1
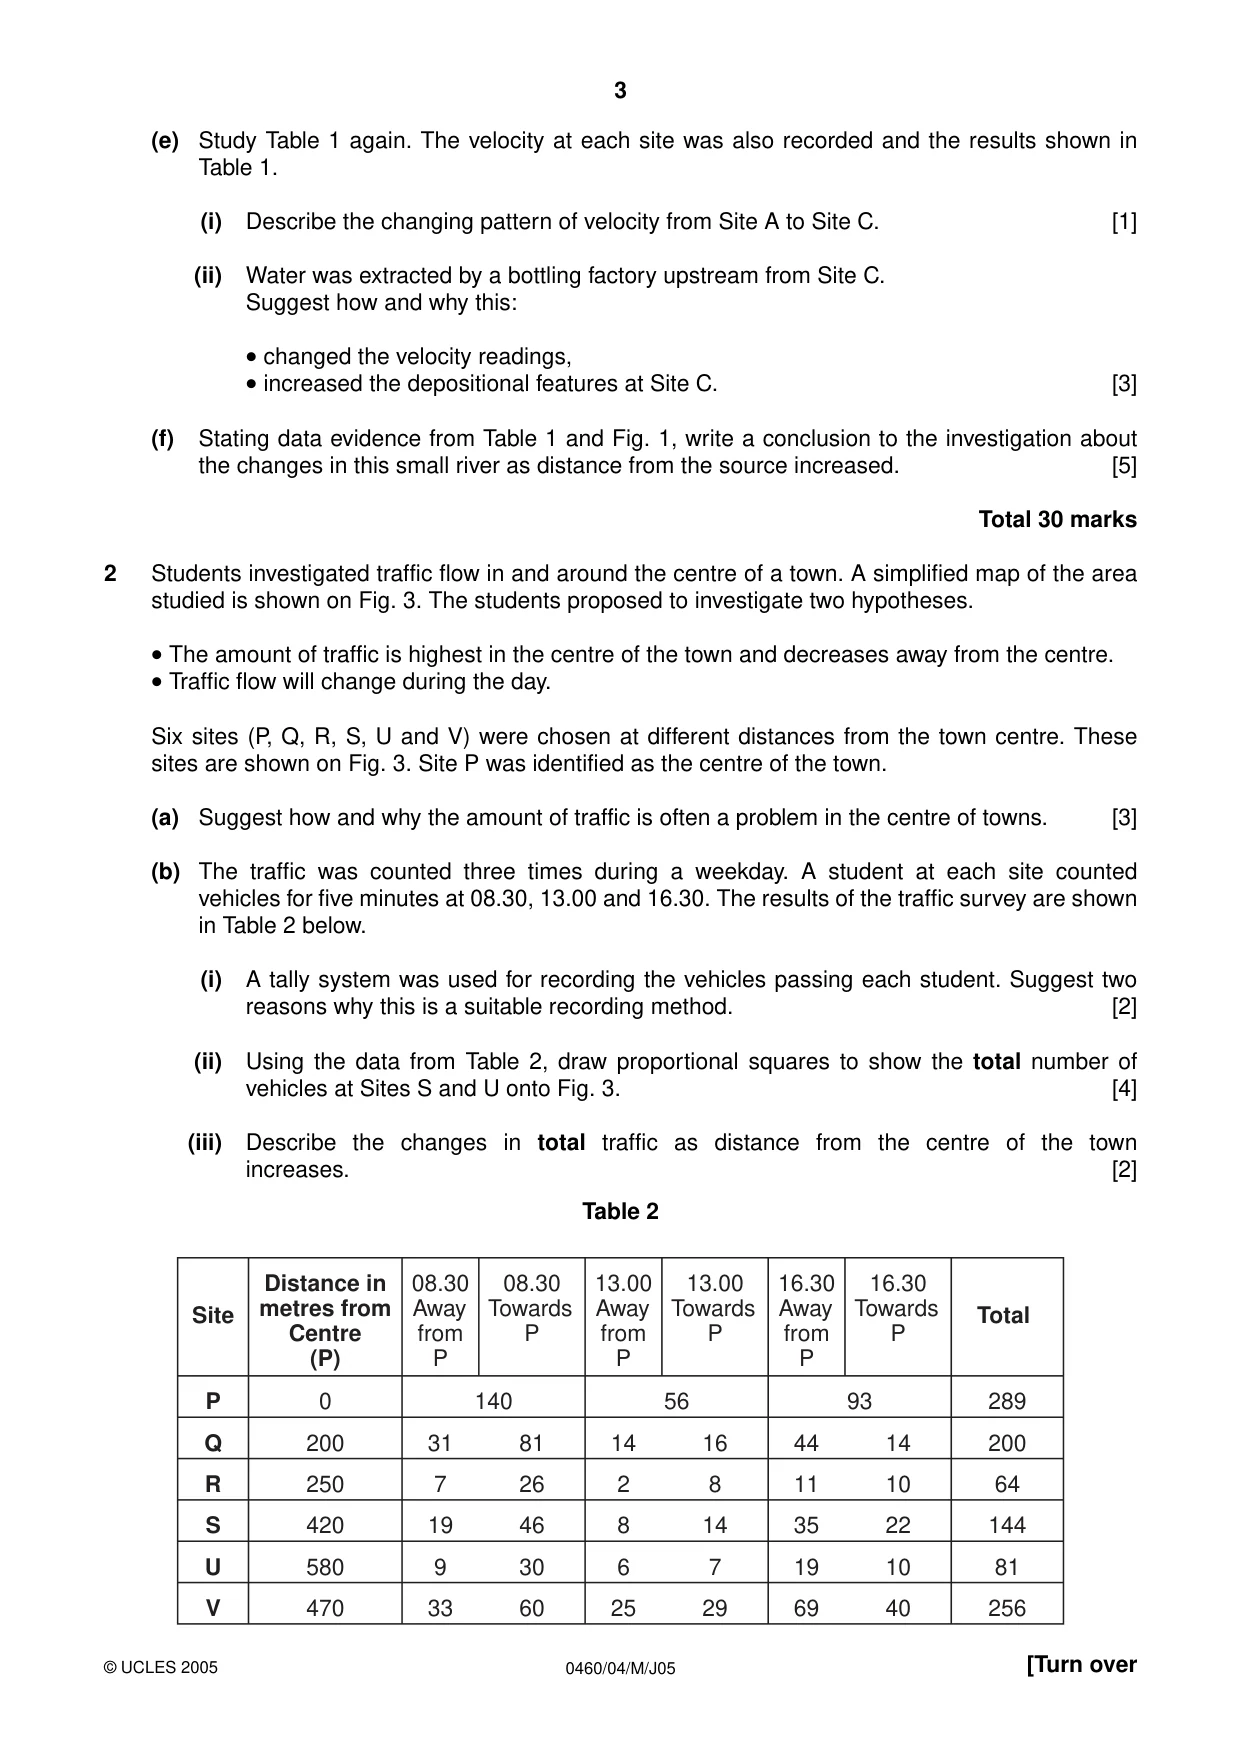
UNIVERSITY OF CAMBRIDGE INTERNATIONAL EXAMINATIONS International General Certificate of Secondary Education MARK SCHEME for the June 2005 question paper 0460 GEOGRAPHY 0460/04 Paper 4 (Alternative to Coursework), maximum mark 60 This mark scheme is published as an aid to teachers and students, to indicate the requirements of the examination. It shows the basis on which Examiners were initially instructed to award marks. It does not indicate the details of the discussions that took place at an Examiners’ meeting before marking began. Any substantial changes to the mark scheme that arose from these discussions will be recorded in the published Report on the Examination. All Examiners are instructed that alternative correct answers and unexpected approaches in candidates’ scripts must be given marks that fairly reflect the relevant knowledge and skills demonstrated. Mark schemes must be read in conjunction with the question papers and the Report on the Examination. • CIE will not enter into discussion or correspondence in connection with these mark schemes. CIE is publishing the mark schemes for the June 2005 question papers for most IGCSE and GCE Advanced Level and Advanced Subsidiary Level syllabuses and some Ordinary Level syllabuses. www.XtremePapers.com
Mark scheme, page 2
Grade thresholds for Syllabus 0460 (Geography) in the June 2005 examination. minimum mark required for grade: maximum mark available A C E F Component 4 60 41 29 17 12 The threshold (minimum mark) for B is set halfway between those for Grades A and C. The threshold (minimum mark) for D is set halfway between those for Grades C and E. The threshold (minimum mark) for G is set as many marks below the F threshold as the E threshold is above it. Grade A* does not exist at the level of an individual component.
Mark scheme, page 3
June 2005 IGCSE MARK SCHEME MAXIMUM MARK: 60 SYLLABUS/COMPONENT: 0460/04 GEOGRAPHY Alternative to Coursework
Mark scheme, page 4
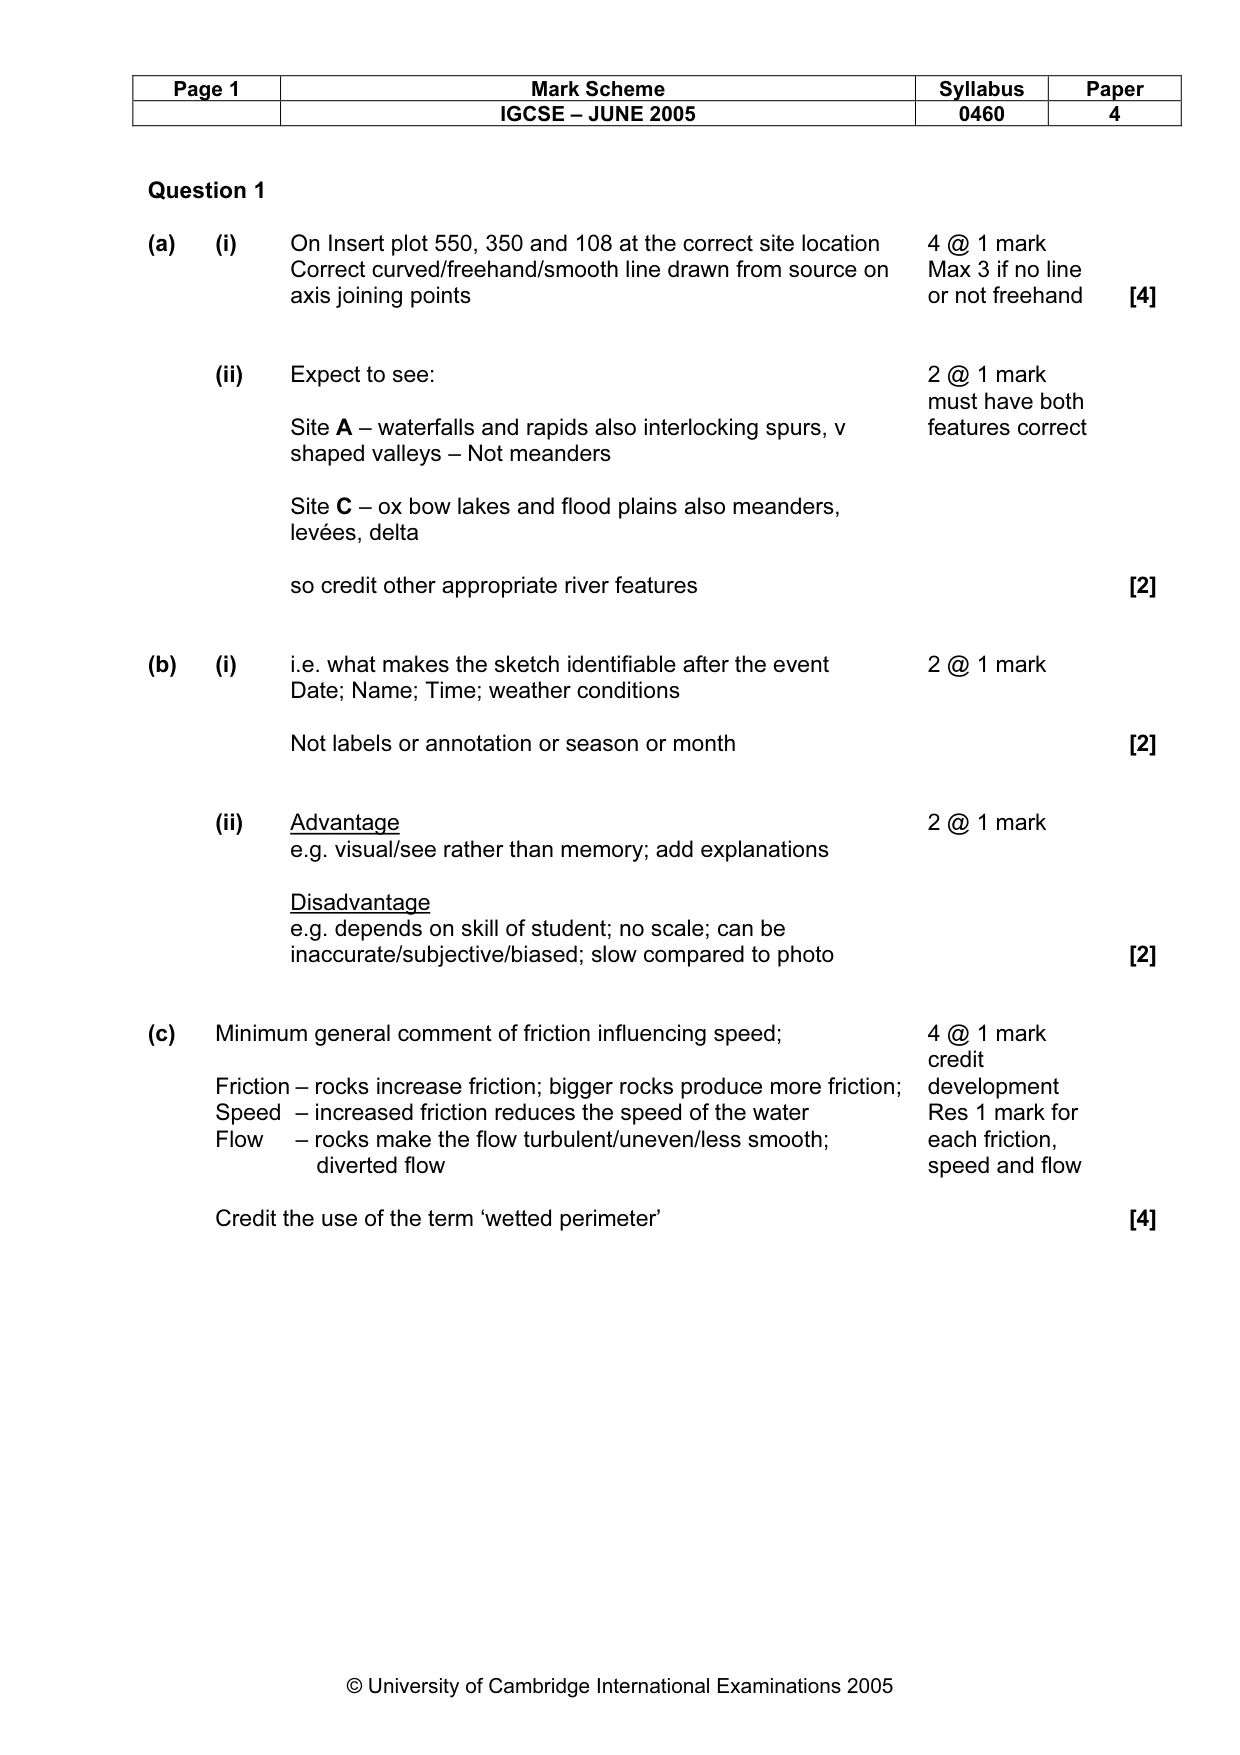
Page 1 Mark Scheme Syllabus Paper IGCSE – JUNE 2005 0460 4 © University of Cambridge International Examinations 2005 Question 1 (a) (i) On Insert plot 550, 350 and 108 at the correct site location Correct curved/freehand/smooth line drawn from source on axis joining points 4 @ 1 mark Max 3 if no line or not freehand [4] (ii) Expect to see: Site A – waterfalls and rapids also interlocking spurs, v shaped valleys – Not meanders Site C – ox bow lakes and flood plains also meanders, levées, delta so credit other appropriate river features 2 @ 1 mark must have both features correct [2] (b) (i) i.e. what makes the sketch identifiable after the event Date; Name; Time; weather conditions Not labels or annotation or season or month 2 @ 1 mark [2] (ii) Advantage e.g. visual/see rather than memory; add explanations Disadvantage e.g. depends on skill of student; no scale; can be inaccurate/subjective/biased; slow compared to photo 2 @ 1 mark [2] (c) Minimum general comment of friction influencing speed; Friction – rocks increase friction; bigger rocks produce more friction; Speed – increased friction reduces the speed of the water Flow – rocks make the flow turbulent/uneven/less smooth; diverted flow Credit the use of the term ‘wetted perimeter’ 4 @ 1 mark credit development Res 1 mark for each friction, speed and flow [4]
Mark scheme, page 5
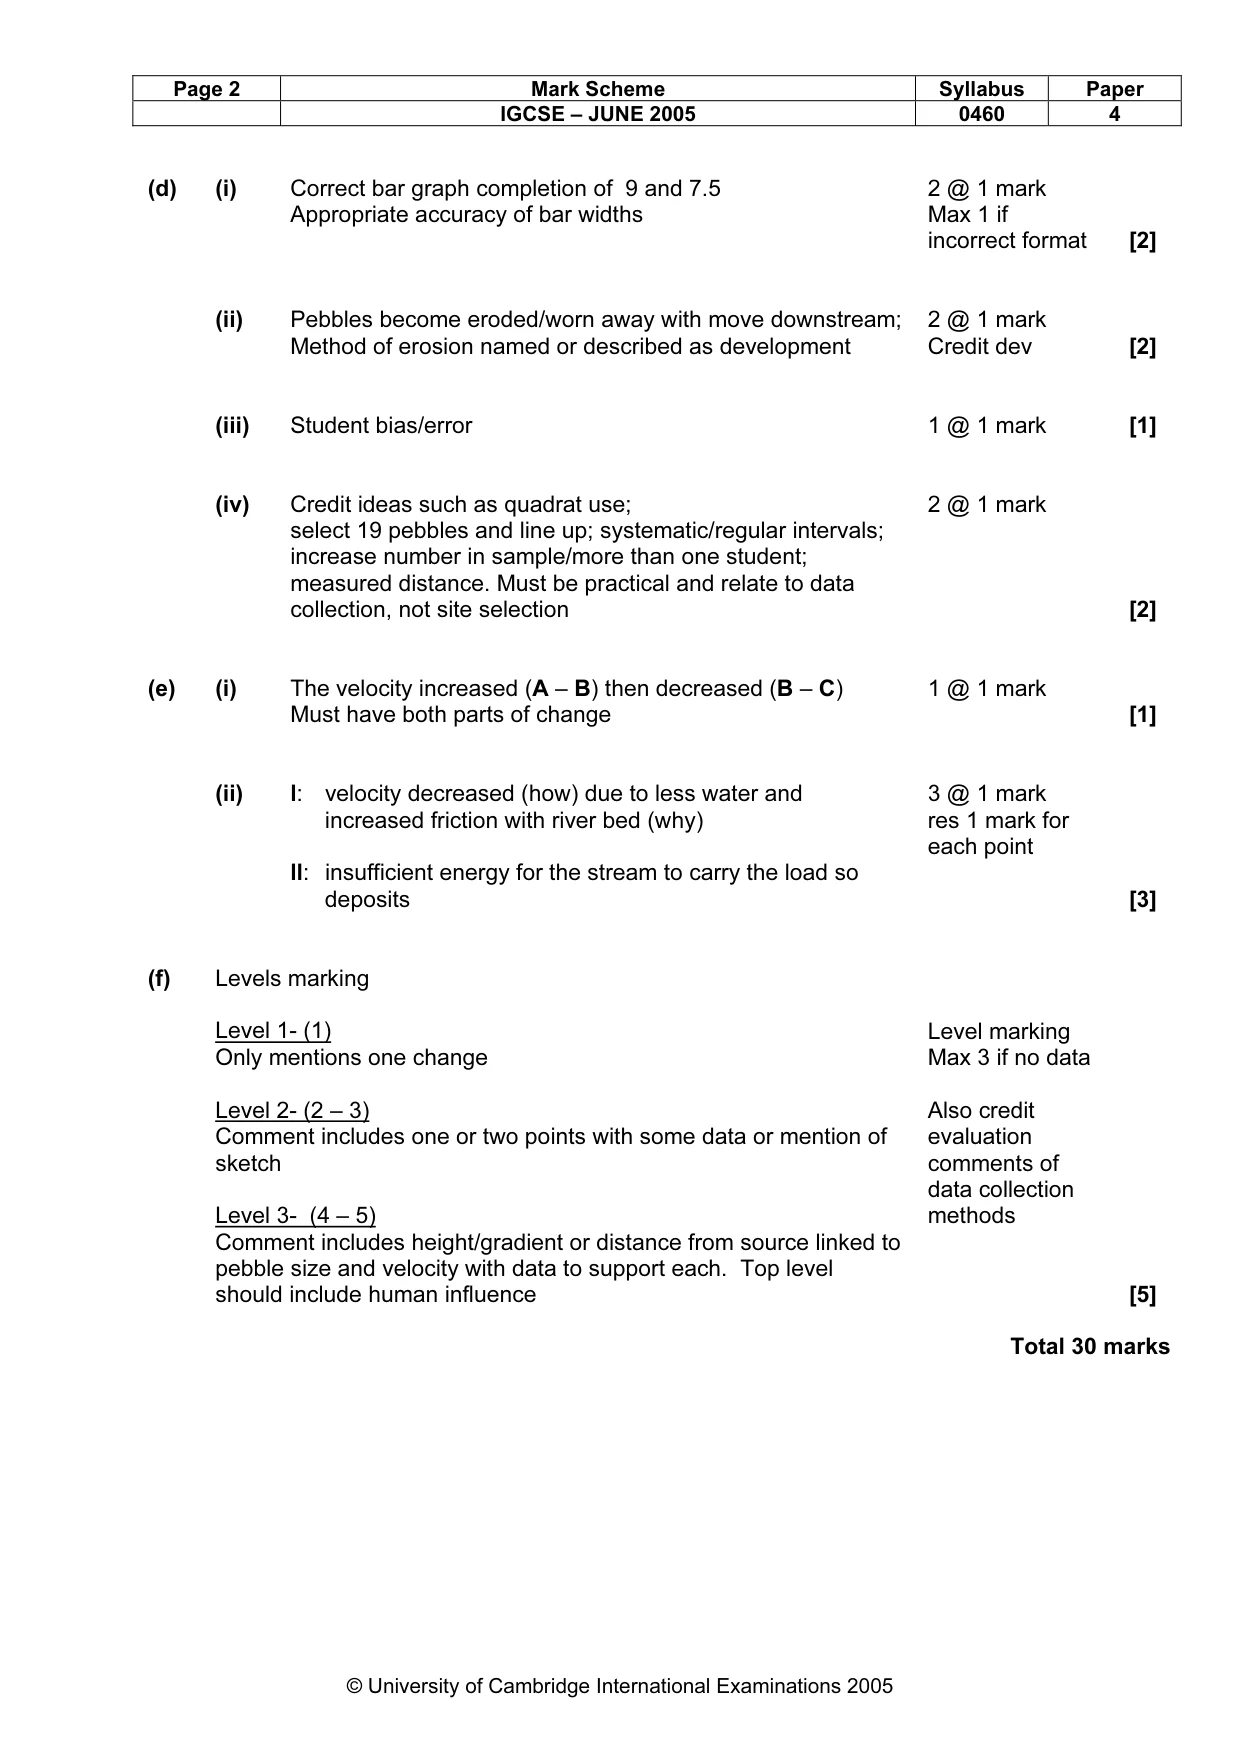
Page 2 Mark Scheme Syllabus Paper IGCSE – JUNE 2005 0460 4 © University of Cambridge International Examinations 2005 (d) (i) Correct bar graph completion of 9 and 7.5 Appropriate accuracy of bar widths 2 @ 1 mark Max 1 if incorrect format [2] (ii) Pebbles become eroded/worn away with move downstream; Method of erosion named or described as development 2 @ 1 mark Credit dev [2] (iii) Student bias/error 1 @ 1 mark [1] (iv) Credit ideas such as quadrat use; select 19 pebbles and line up; systematic/regular intervals; increase number in sample/more than one student; measured distance. Must be practical and relate to data collection, not site selection 2 @ 1 mark [2] (e) (i) The velocity increased (A – B) then decreased (B – C) Must have both parts of change 1 @ 1 mark [1] (ii) l: velocity decreased (how) due to less water and increased friction with river bed (why) ll: insufficient energy for the stream to carry the load so deposits 3 @ 1 mark res 1 mark for each point [3] Levels marking (f) Level 1- (1) Only mentions one change Level 2- (2 – 3) Comment includes one or two points with some data or mention of sketch Level 3- (4 – 5) Comment includes height/gradient or distance from source linked to pebble size and velocity with data to support each. Top level should include human influence Level marking Max 3 if no data Also credit evaluation comments of data collection methods [5] Total 30 marks
Mark scheme, page 6
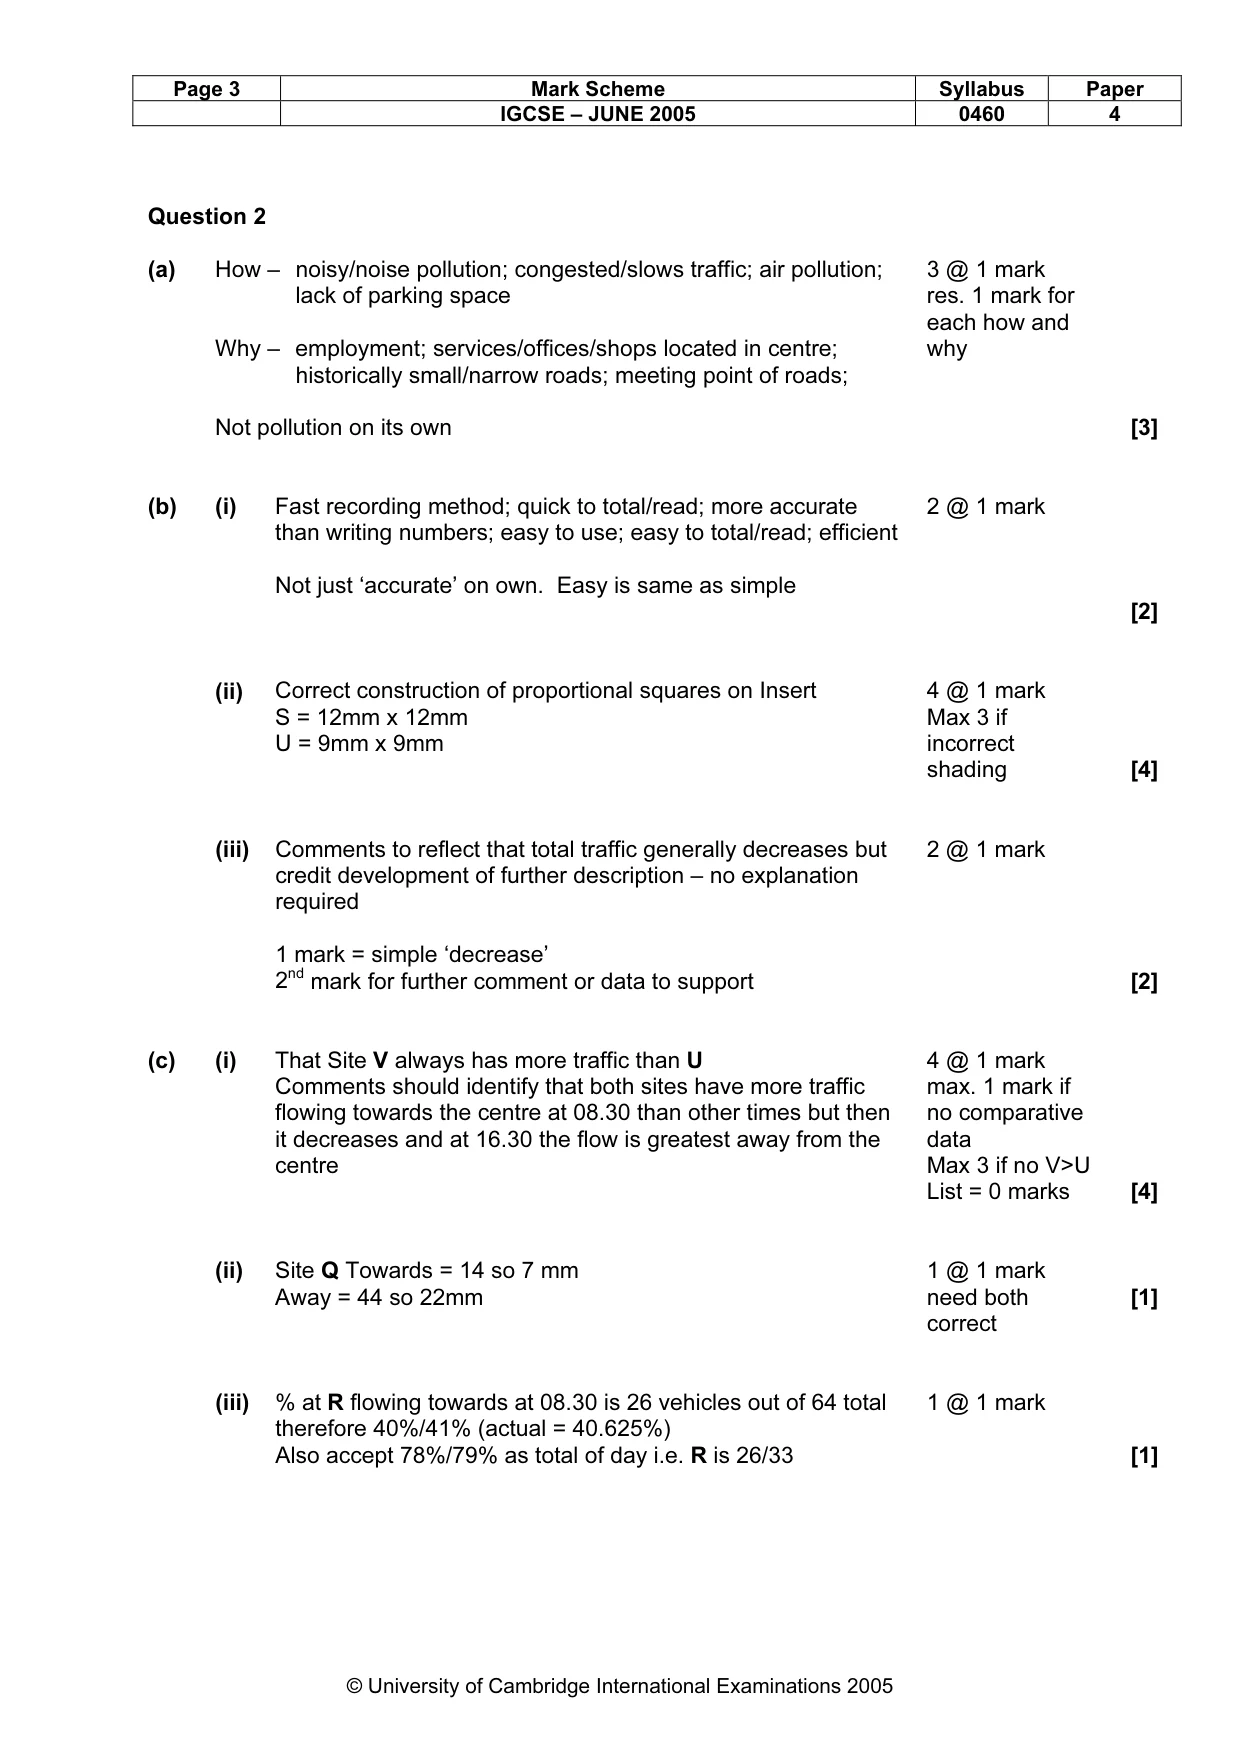
Page 3 Mark Scheme Syllabus Paper IGCSE – JUNE 2005 0460 4 © University of Cambridge International Examinations 2005 Question 2 (a) How – noisy/noise pollution; congested/slows traffic; air pollution; lack of parking space Why – employment; services/offices/shops located in centre; historically small/narrow roads; meeting point of roads; Not pollution on its own 3 @ 1 mark res. 1 mark for each how and why [3] (b) (i) Fast recording method; quick to total/read; more accurate than writing numbers; easy to use; easy to total/read; efficient Not just ‘accurate’ on own. Easy is same as simple 2 @ 1 mark [2] (ii) Correct construction of proportional squares on Insert S = 12mm x 12mm U = 9mm x 9mm 4 @ 1 mark Max 3 if incorrect shading [4] (iii) Comments to reflect that total traffic generally decreases but credit development of further description – no explanation required 1 mark = simple ‘decrease’ 2nd mark for further comment or data to support 2 @ 1 mark [2] (c) (i) That Site V always has more traffic than U Comments should identify that both sites have more traffic flowing towards the centre at 08.30 than other times but then it decreases and at 16.30 the flow is greatest away from the centre 4 @ 1 mark max. 1 mark if no comparative data Max 3 if no V>U List = 0 marks [4] (ii) Site Q Towards = 14 so 7 mm Away = 44 so 22mm 1 @ 1 mark need both correct [1] (iii) % at R flowing towards at 08.30 is 26 vehicles out of 64 total therefore 40%/41% (actual = 40.625%) Also accept 78%/79% as total of day i.e. R is 26/33 1 @ 1 mark [1]
Mark scheme, page 7
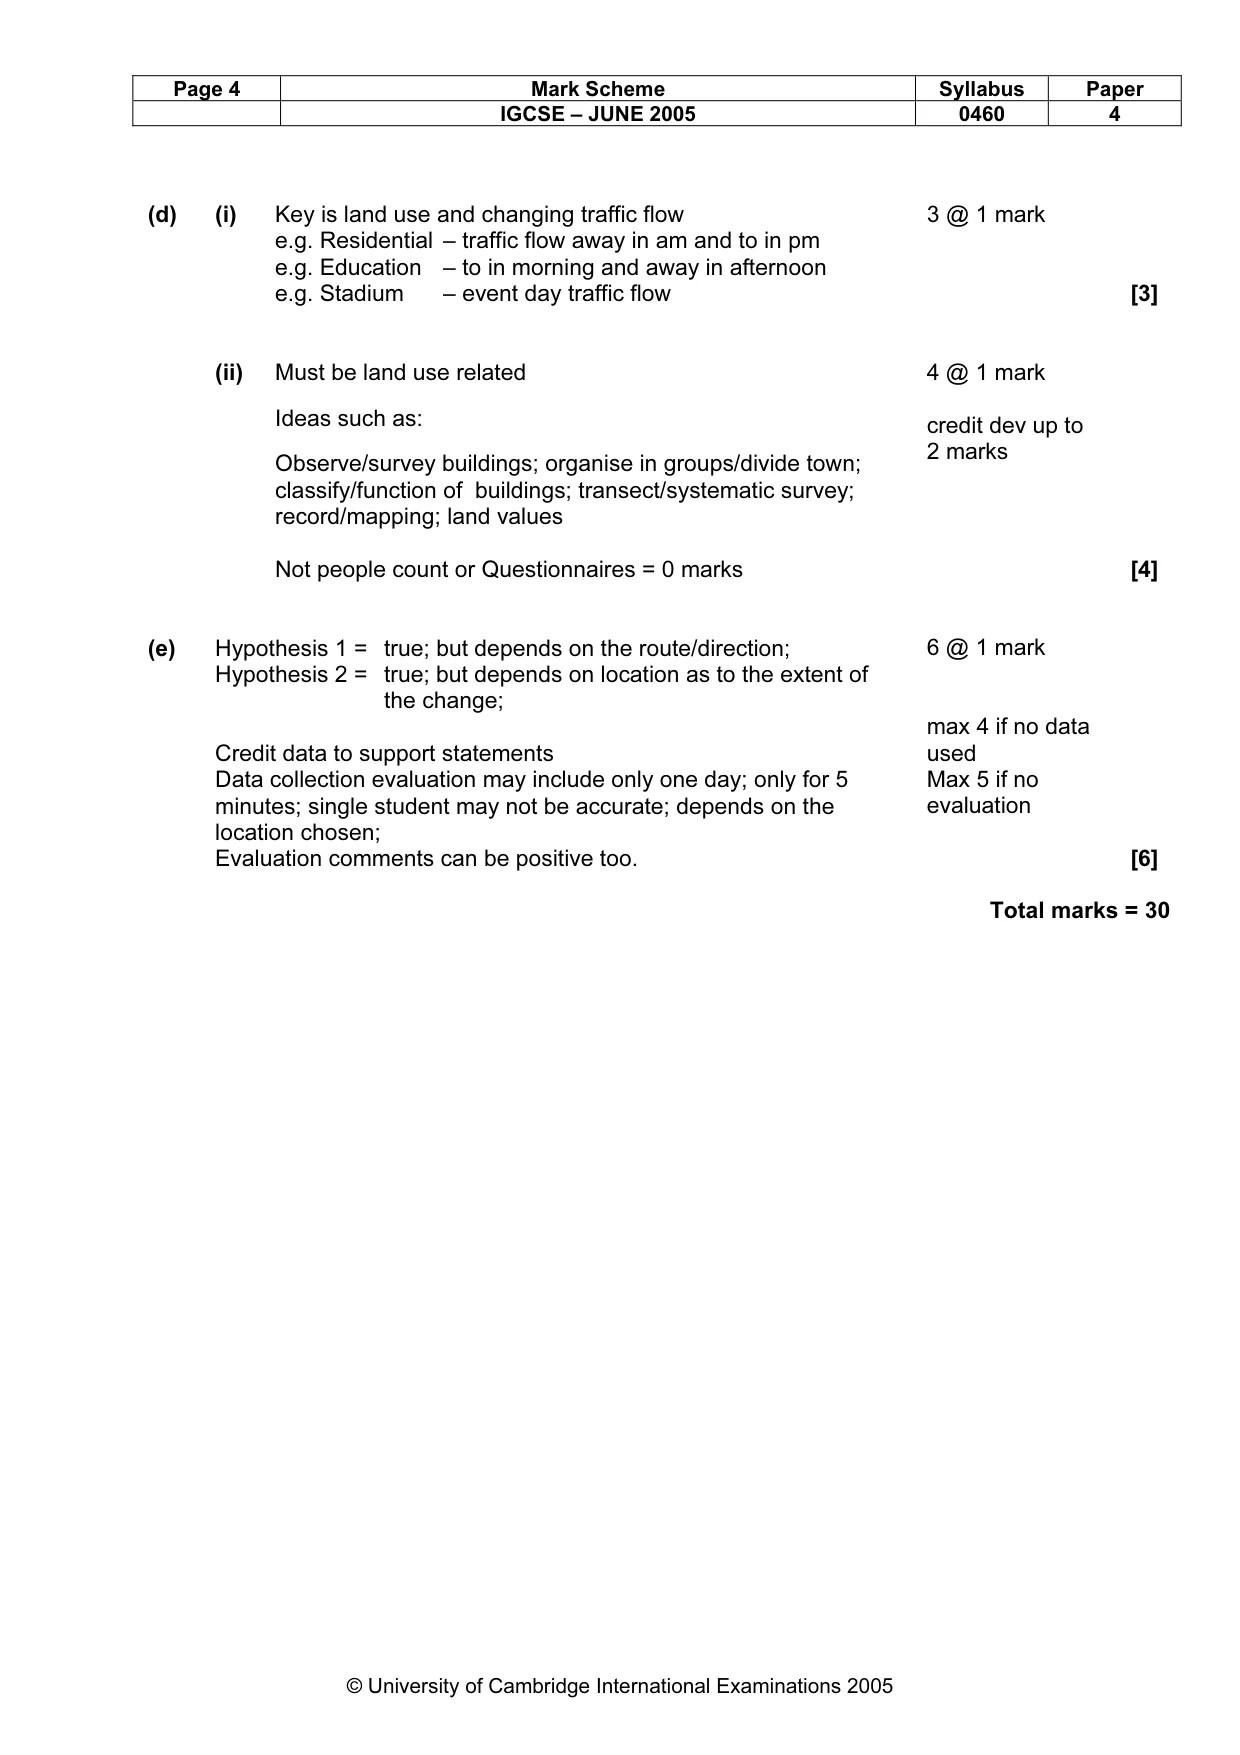
Page 4 Mark Scheme Syllabus Paper IGCSE – JUNE 2005 0460 4 © University of Cambridge International Examinations 2005 (d) (i) Key is land use and changing traffic flow e.g. Residential – traffic flow away in am and to in pm e.g. Education – to in morning and away in afternoon e.g. Stadium – event day traffic flow 3 @ 1 mark [3] (ii) Must be land use related Ideas such as: Observe/survey buildings; organise in groups/divide town; classify/function of buildings; transect/systematic survey; record/mapping; land values Not people count or Questionnaires = 0 marks 4 @ 1 mark credit dev up to 2 marks [4] (e) Hypothesis 1 = true; but depends on the route/direction; Hypothesis 2 = true; but depends on location as to the extent of the change; Credit data to support statements Data collection evaluation may include only one day; only for 5 minutes; single student may not be accurate; depends on the location chosen; Evaluation comments can be positive too. 6 @ 1 mark max 4 if no data used Max 5 if no evaluation [6] Total marks = 30