Cambridge IGCSE Geography 0460 — 2005 May/June Paper 2 · Variant 1
0460/21/M/J/05
The question paper and its mark scheme, free to read here and free to download. This is Cambridge’s own paper, exactly as it was sat.
Question paper8 pages
Mark scheme7 pages
Answers below. Sit the paper first if you are practising.
Paper as text
Question paper, page 1
This document consists of 7 printed pages, 1 blank page and 2 inserts. SPA (DR) S84250/2 © UCLES 2005 [Turn over UNIVERSITY OF CAMBRIDGE INTERNATIONAL EXAMINATIONS International General Certificate of Secondary Education GEOGRAPHY 0460/02 Paper 2 May/June 2005 1 hour 30 minutes Additional Materials: Answer Booklet/Paper; Ruler; Protractor; 1:50000 Survey Map Extract is enclosed with this question paper. READ THESE INSTRUCTIONS FIRST If you have been given an Answer Booklet, follow the instructions on the front cover of the Booklet. Write your Centre number, candidate number and name on all the work you hand in. Write in dark blue or black pen on both sides of the paper. You may use a soft pencil for any diagrams, graphs or rough working. Do not use staples, paper clips, highlighters, glue or correction fluid. Answer all questions. At the end of the examination, fasten all your work securely together. The number of marks is given in brackets [ ] at the end of each question or part question. Insert 1 contains Fig. 2 for Question 3 and Figs 6 and 7 for Question 6. Insert 2 contains Photograph A for Question 7. Sketch maps and diagrams should be drawn whenever they serve to illustrate an answer. www.XtremePapers.com
Question paper, page 2
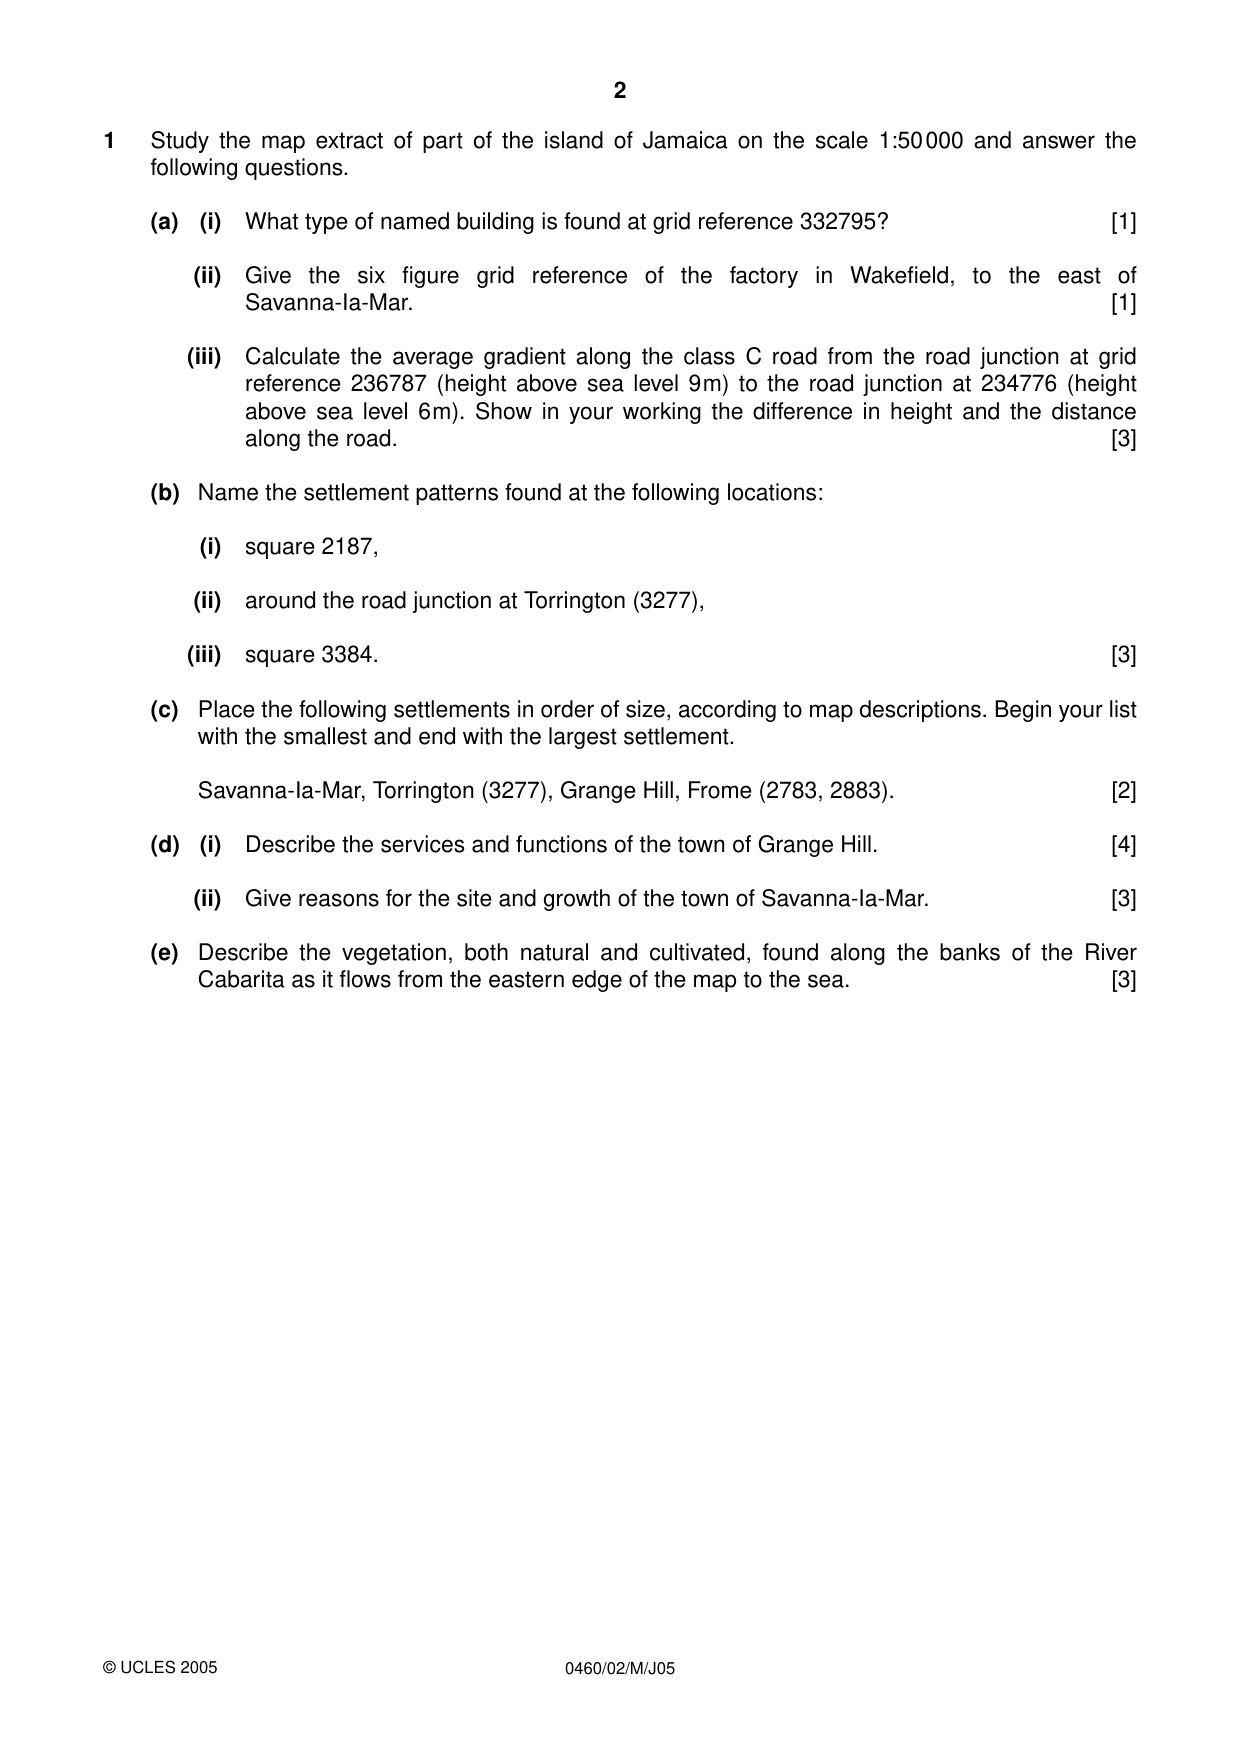
2 0460/02/M/J05 1 Study the map extract of part of the island of Jamaica on the scale 1:50000 and answer the following questions. (a) (i) What type of named building is found at grid reference 332795? [1] (ii) Give the six figure grid reference of the factory in Wakefield, to the east of Savanna-Ia-Mar. [1] (iii) Calculate the average gradient along the class C road from the road junction at grid reference 236787 (height above sea level 9m) to the road junction at 234776 (height above sea level 6m). Show in your working the difference in height and the distance along the road. [3] (b) Name the settlement patterns found at the following locations: (i) square 2187, (ii) around the road junction at Torrington (3277), (iii) square 3384. [3] (c) Place the following settlements in order of size, according to map descriptions. Begin your list with the smallest and end with the largest settlement. Savanna-Ia-Mar, Torrington (3277), Grange Hill, Frome (2783, 2883). [2] (d) (i) Describe the services and functions of the town of Grange Hill. [4] (ii) Give reasons for the site and growth of the town of Savanna-Ia-Mar. [3] (e) Describe the vegetation, both natural and cultivated, found along the banks of the River Cabarita as it flows from the eastern edge of the map to the sea. [3] © UCLES 2005
Question paper, page 3
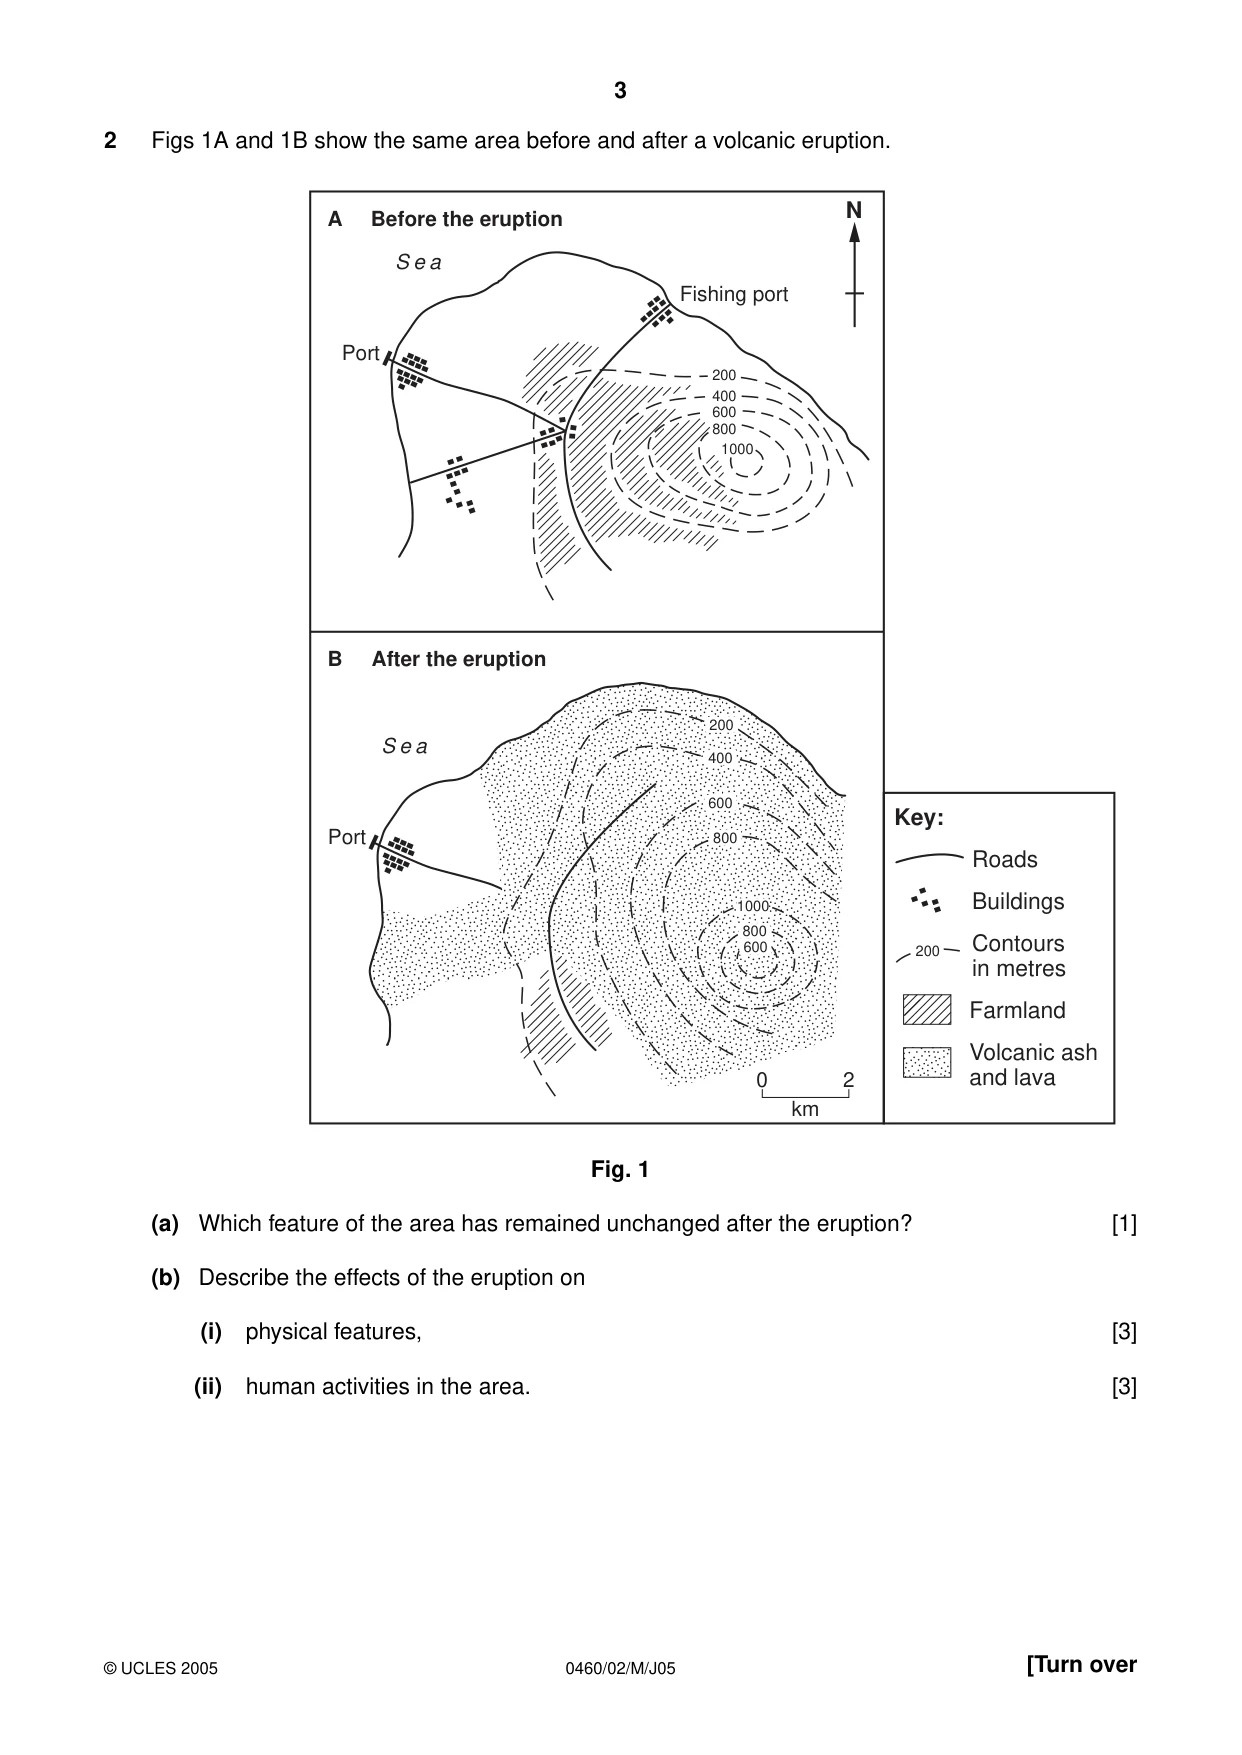
3 0460/02/M/J05 [Turn over 2 Figs 1A and 1B show the same area before and after a volcanic eruption. Fig. 1 (a) Which feature of the area has remained unchanged after the eruption? [1] (b) Describe the effects of the eruption on (i) physical features, [3] (ii) human activities in the area. [3] 200 400 600 800 1000 Fishing port S e a Port S e a Port N A Before the eruption B After the eruption 200 400 600 800 800 600 1000 0 2 km Roads Buildings Farmland Volcanic ash and lava Contours in metres Key: 200 © UCLES 2005
Question paper, page 4
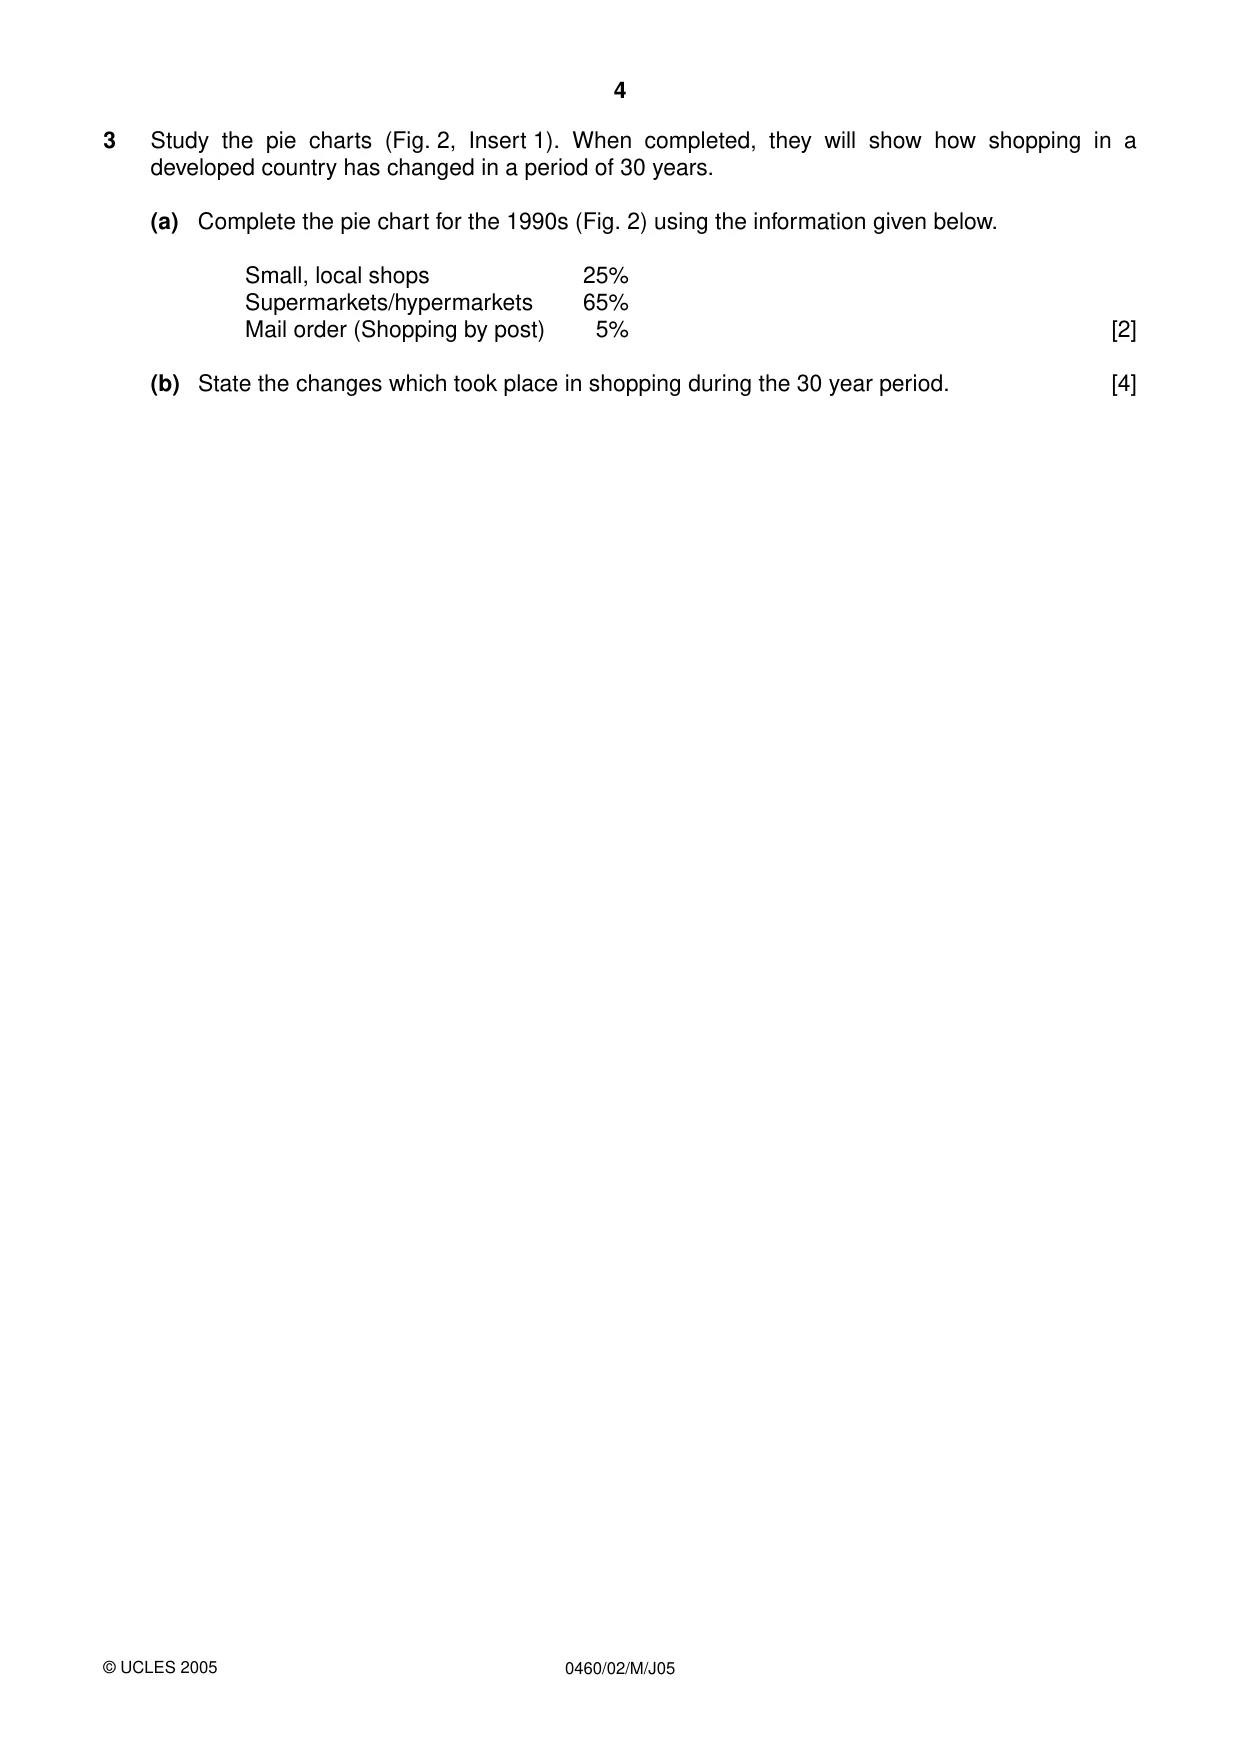
4 0460/02/M/J05 3 Study the pie charts (Fig. 2, Insert 1). When completed, they will show how shopping in a developed country has changed in a period of 30 years. (a) Complete the pie chart for the 1990s (Fig. 2) using the information given below. Small, local shops 25% Supermarkets/hypermarkets 65% Mail order (Shopping by post) 5% [2] (b) State the changes which took place in shopping during the 30 year period. [4] © UCLES 2005
Question paper, page 5
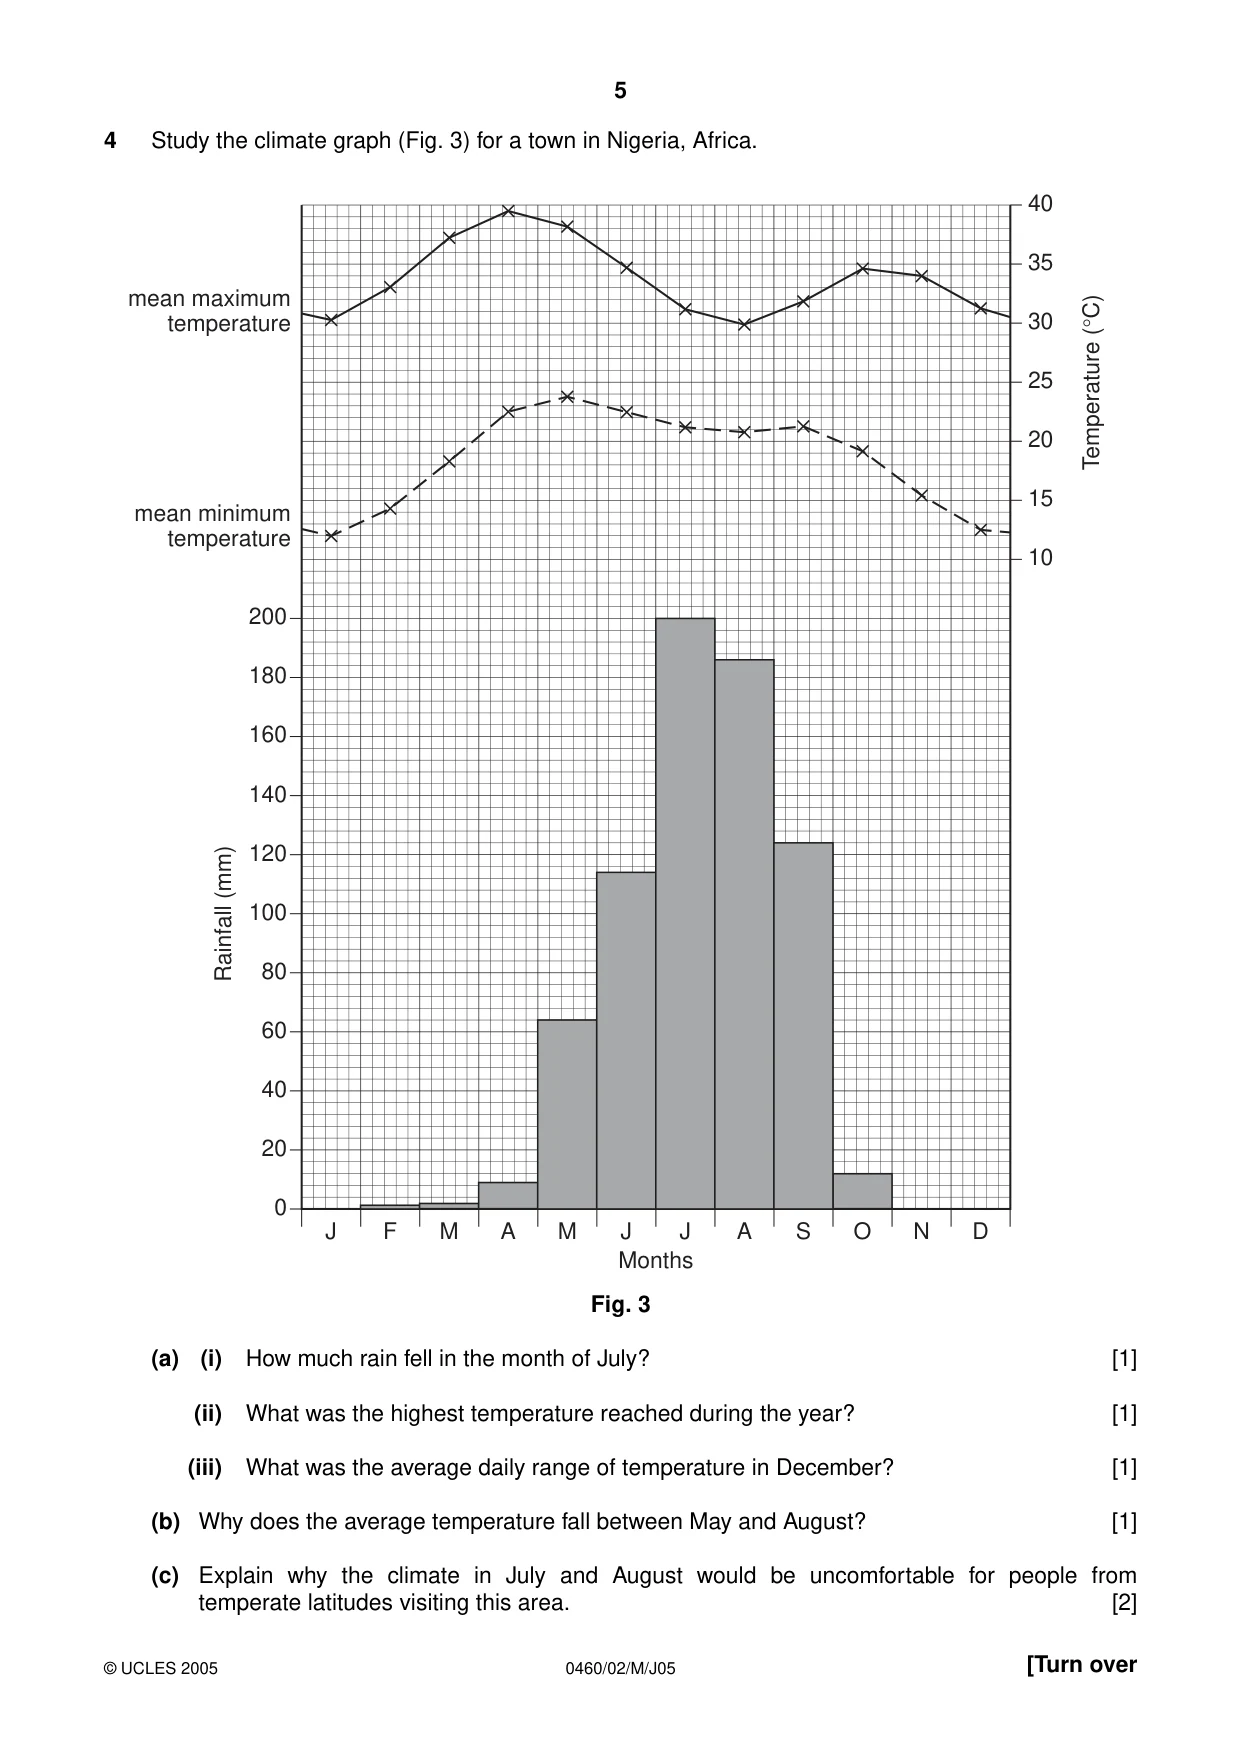
5 0460/02/M/J05 [Turn over 4 Study the climate graph (Fig. 3) for a town in Nigeria, Africa. Fig. 3 (a) (i) How much rain fell in the month of July? [1] (ii) What was the highest temperature reached during the year? [1] (iii) What was the average daily range of temperature in December? [1] (b) Why does the average temperature fall between May and August? [1] (c) Explain why the climate in July and August would be uncomfortable for people from temperate latitudes visiting this area. [2] J F M A M J J A S O N D 0 20 40 60 80 100 120 140 160 180 200 10 15 20 25 30 35 40 Rainfall (mm) Temperature (°C) Months mean maximum temperature mean minimum temperature © UCLES 2005
Question paper, page 6
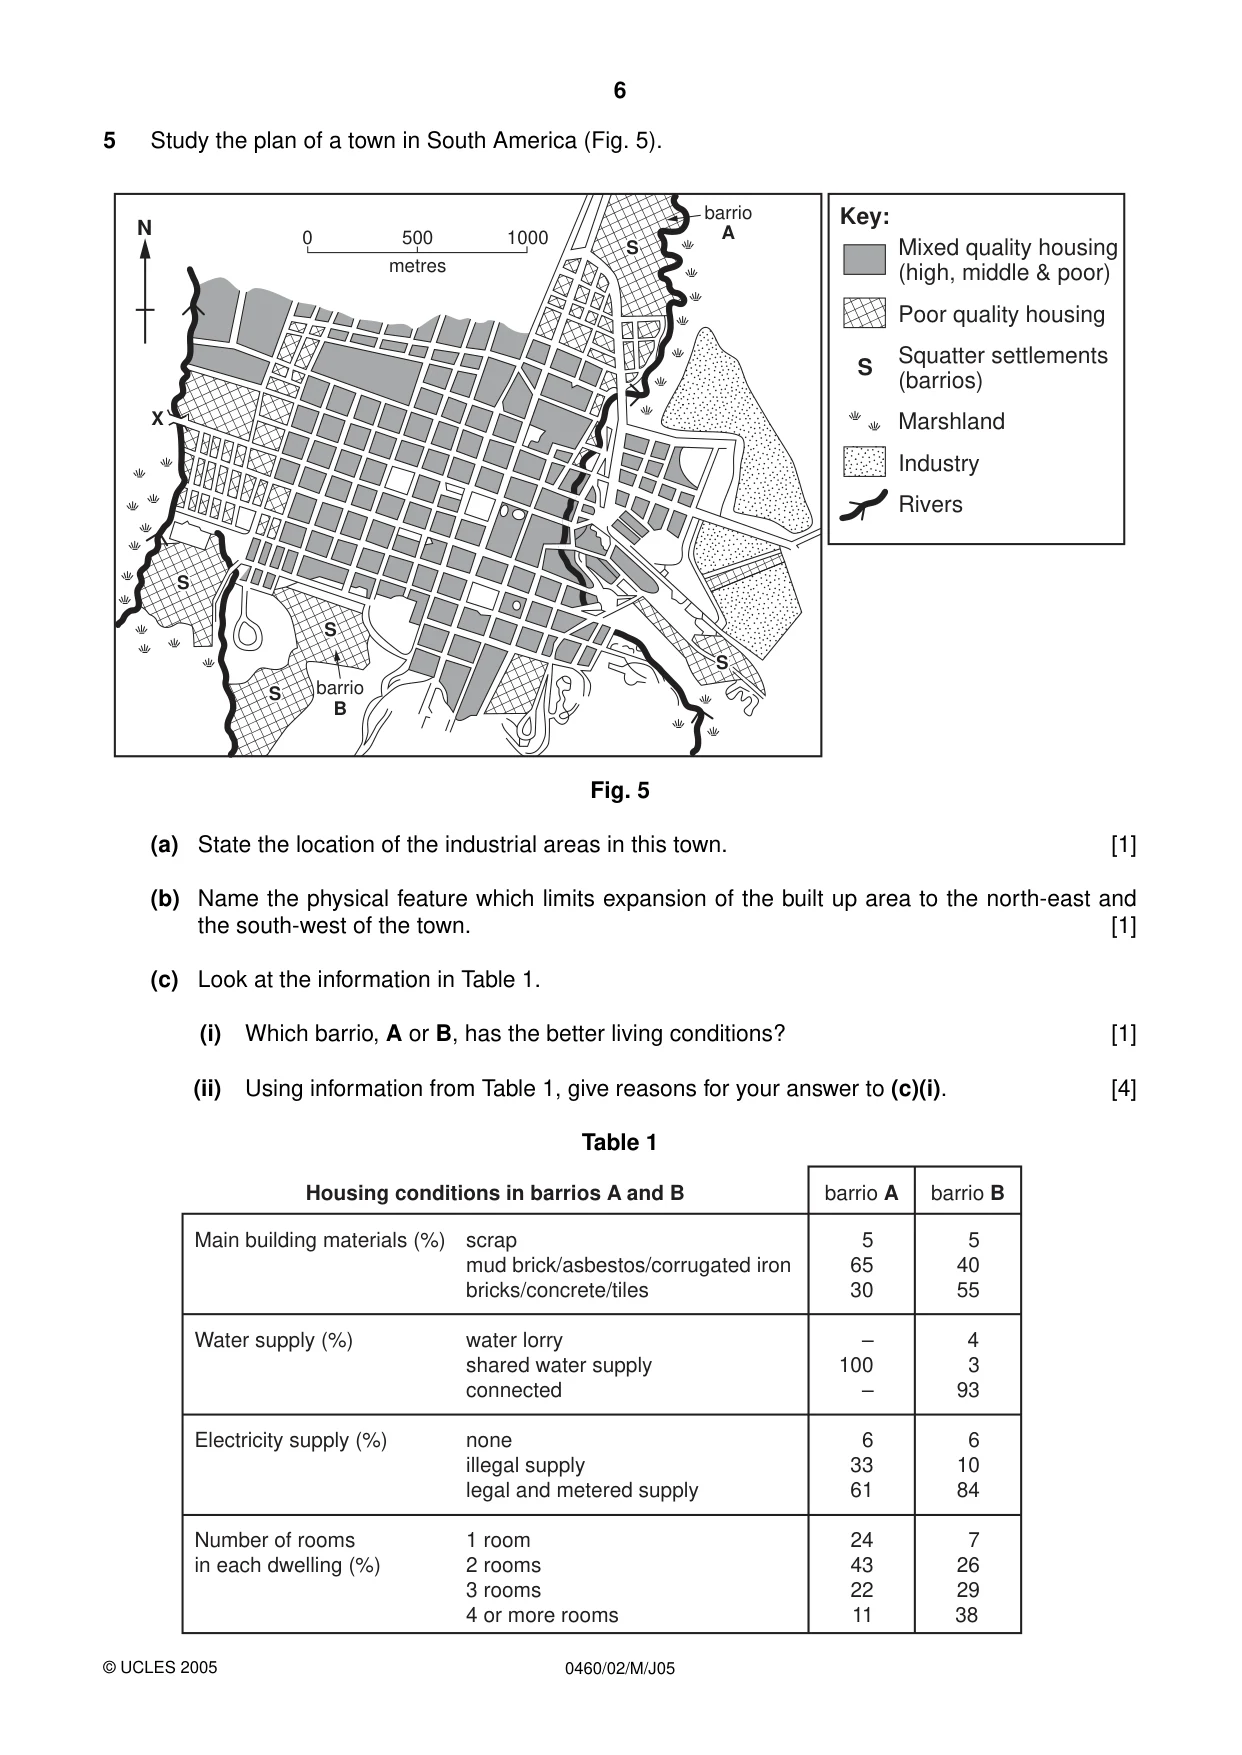
6 0460/02/M/J05 5 Study the plan of a town in South America (Fig. 5). Fig. 5 (a) State the location of the industrial areas in this town. [1] (b) Name the physical feature which limits expansion of the built up area to the north-east and the south-west of the town. [1] (c) Look at the information in Table 1. (i) Which barrio, A or B, has the better living conditions? [1] (ii) Using information from Table 1, give reasons for your answer to (c)(i). [4] Table 1 Main building materials (%) scrap 5 5 mud brick/asbestos/corrugated iron 65 40 bricks/concrete/tiles 30 55 Water supply (%) water lorry – 4 shared water supply 100 3 connected – 93 Electricity supply (%) none 6 6 illegal supply 33 10 legal and metered supply 61 84 Number of rooms 1 room 24 7 in each dwelling (%) 2 rooms 43 26 3 rooms 22 29 4 or more rooms 11 38 barrio A barrio B Housing conditions in barrios A and B 0 500 metres 1000 barrio B barrio A X S S S S S S Key: Mixed quality housing (high, middle & poor) Poor quality housing Squatter settlements (barrios) Marshland Industry Rivers N © UCLES 2005
Question paper, page 7
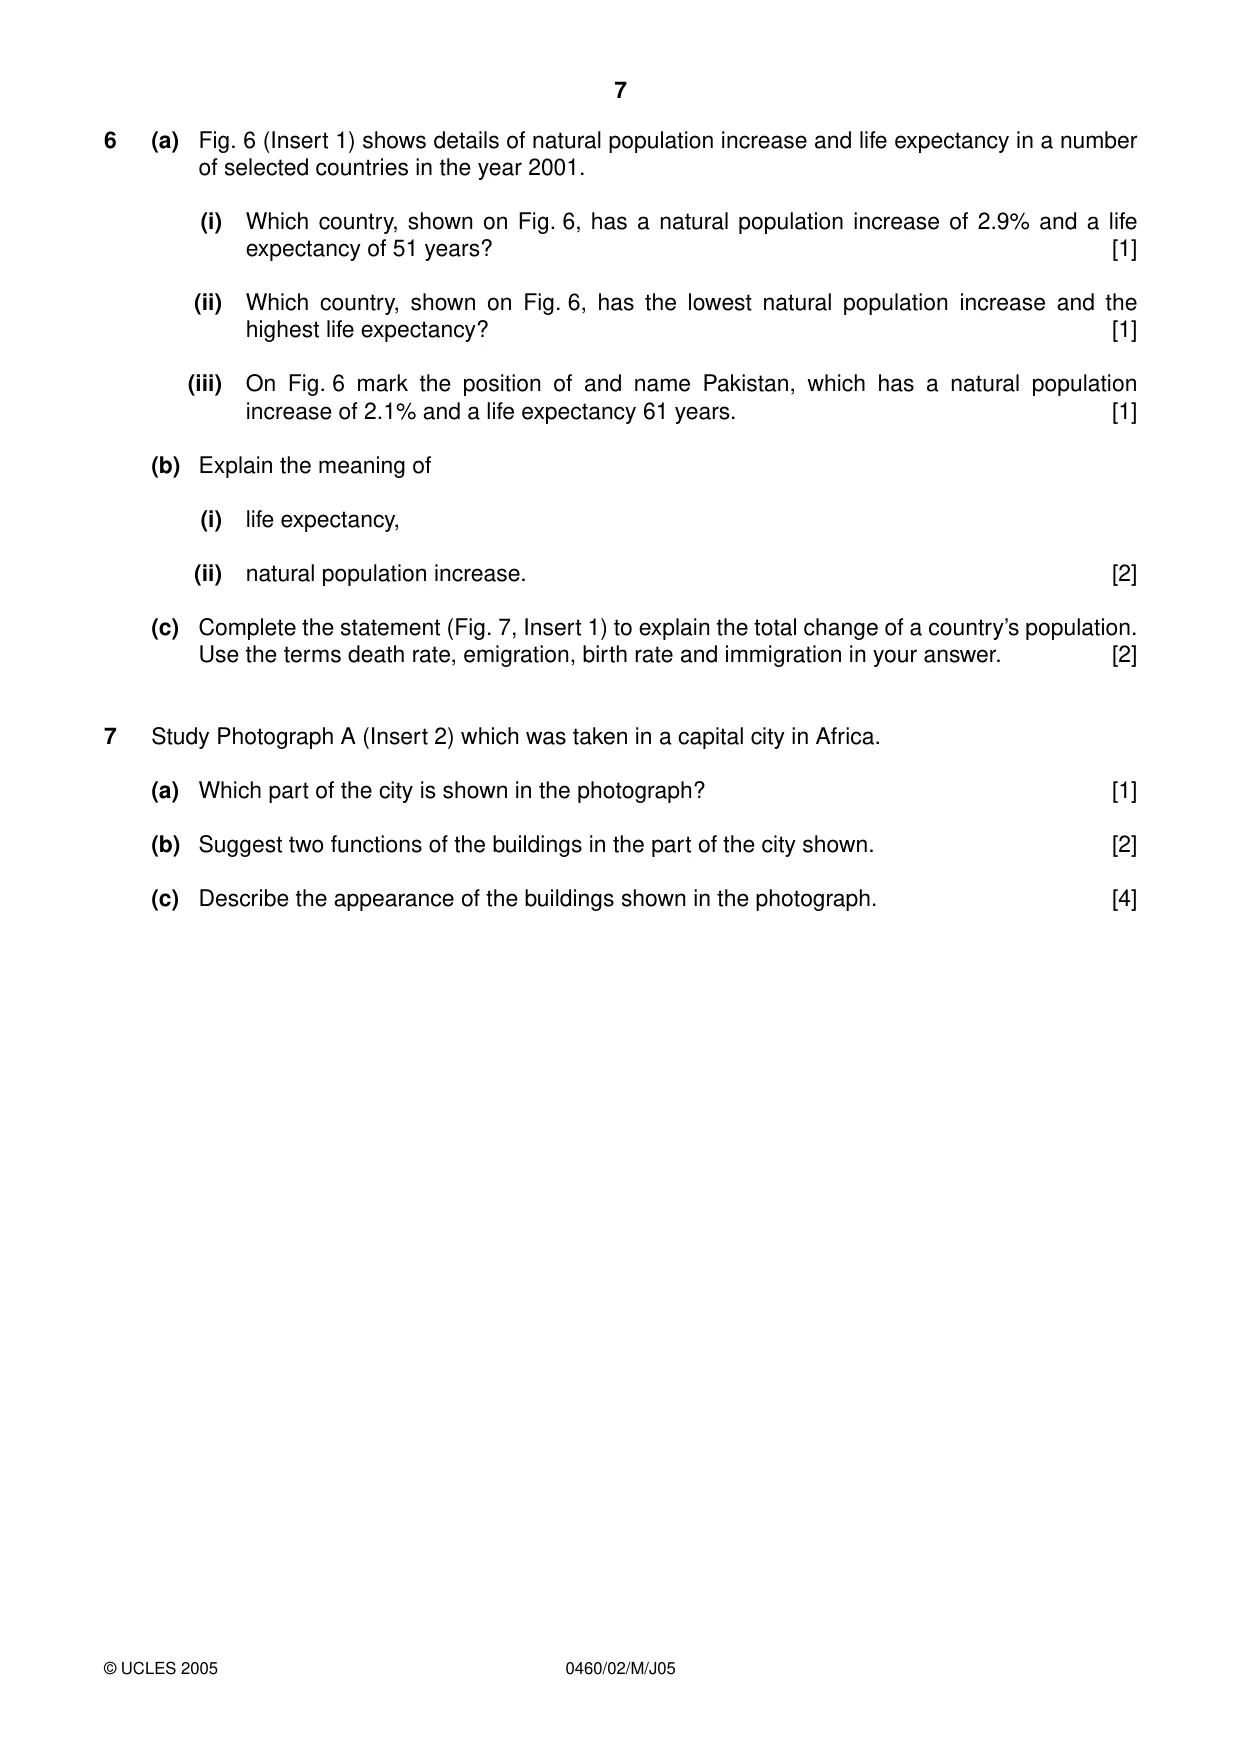
7 0460/02/M/J05 6 (a) Fig. 6 (Insert 1) shows details of natural population increase and life expectancy in a number of selected countries in the year 2001. (i) Which country, shown on Fig. 6, has a natural population increase of 2.9% and a life expectancy of 51 years? [1] (ii) Which country, shown on Fig. 6, has the lowest natural population increase and the highest life expectancy? [1] (iii) On Fig. 6 mark the position of and name Pakistan, which has a natural population increase of 2.1% and a life expectancy 61 years. [1] (b) Explain the meaning of (i) life expectancy, (ii) natural population increase. [2] (c) Complete the statement (Fig. 7, Insert 1) to explain the total change of a country’s population. Use the terms death rate, emigration, birth rate and immigration in your answer. [2] 7 Study Photograph A (Insert 2) which was taken in a capital city in Africa. (a) Which part of the city is shown in the photograph? [1] (b) Suggest two functions of the buildings in the part of the city shown. [2] (c) Describe the appearance of the buildings shown in the photograph. [4] © UCLES 2005
Question paper, page 8
8 0460/02/M/J05 BLANK PAGE Permission to reproduce items where third-party owned material protected by copyright is included has been sought and cleared where possible. Every reasonable effort has been made by the publisher (UCLES) to trace copyright holders, but if any items requiring clearance have unwittingly been included, the publisher will be pleased to make amends at the earliest possible opportunity. University of Cambridge International Examinations is part of the University of Cambridge Local Examinations Syndicate (UCLES), which is itself a department of the University of Cambridge.
Mark scheme, page 1
UNIVERSITY OF CAMBRIDGE INTERNATIONAL EXAMINATIONS International General Certificate of Secondary Education MARK SCHEME for the June 2005 question paper 0460 GEOGRAPHY 0460/02 Paper 2, maximum mark 60 This mark scheme is published as an aid to teachers and students, to indicate the requirements of the examination. It shows the basis on which Examiners were initially instructed to award marks. It does not indicate the details of the discussions that took place at an Examiners’ meeting before marking began. Any substantial changes to the mark scheme that arose from these discussions will be recorded in the published Report on the Examination. All Examiners are instructed that alternative correct answers and unexpected approaches in candidates’ scripts must be given marks that fairly reflect the relevant knowledge and skills demonstrated. Mark schemes must be read in conjunction with the question papers and the Report on the Examination. • CIE will not enter into discussion or correspondence in connection with these mark schemes. CIE is publishing the mark schemes for the June 2005 question papers for most IGCSE and GCE Advanced Level and Advanced Subsidiary Level syllabuses and some Ordinary Level syllabuses. www.XtremePapers.com
Mark scheme, page 2
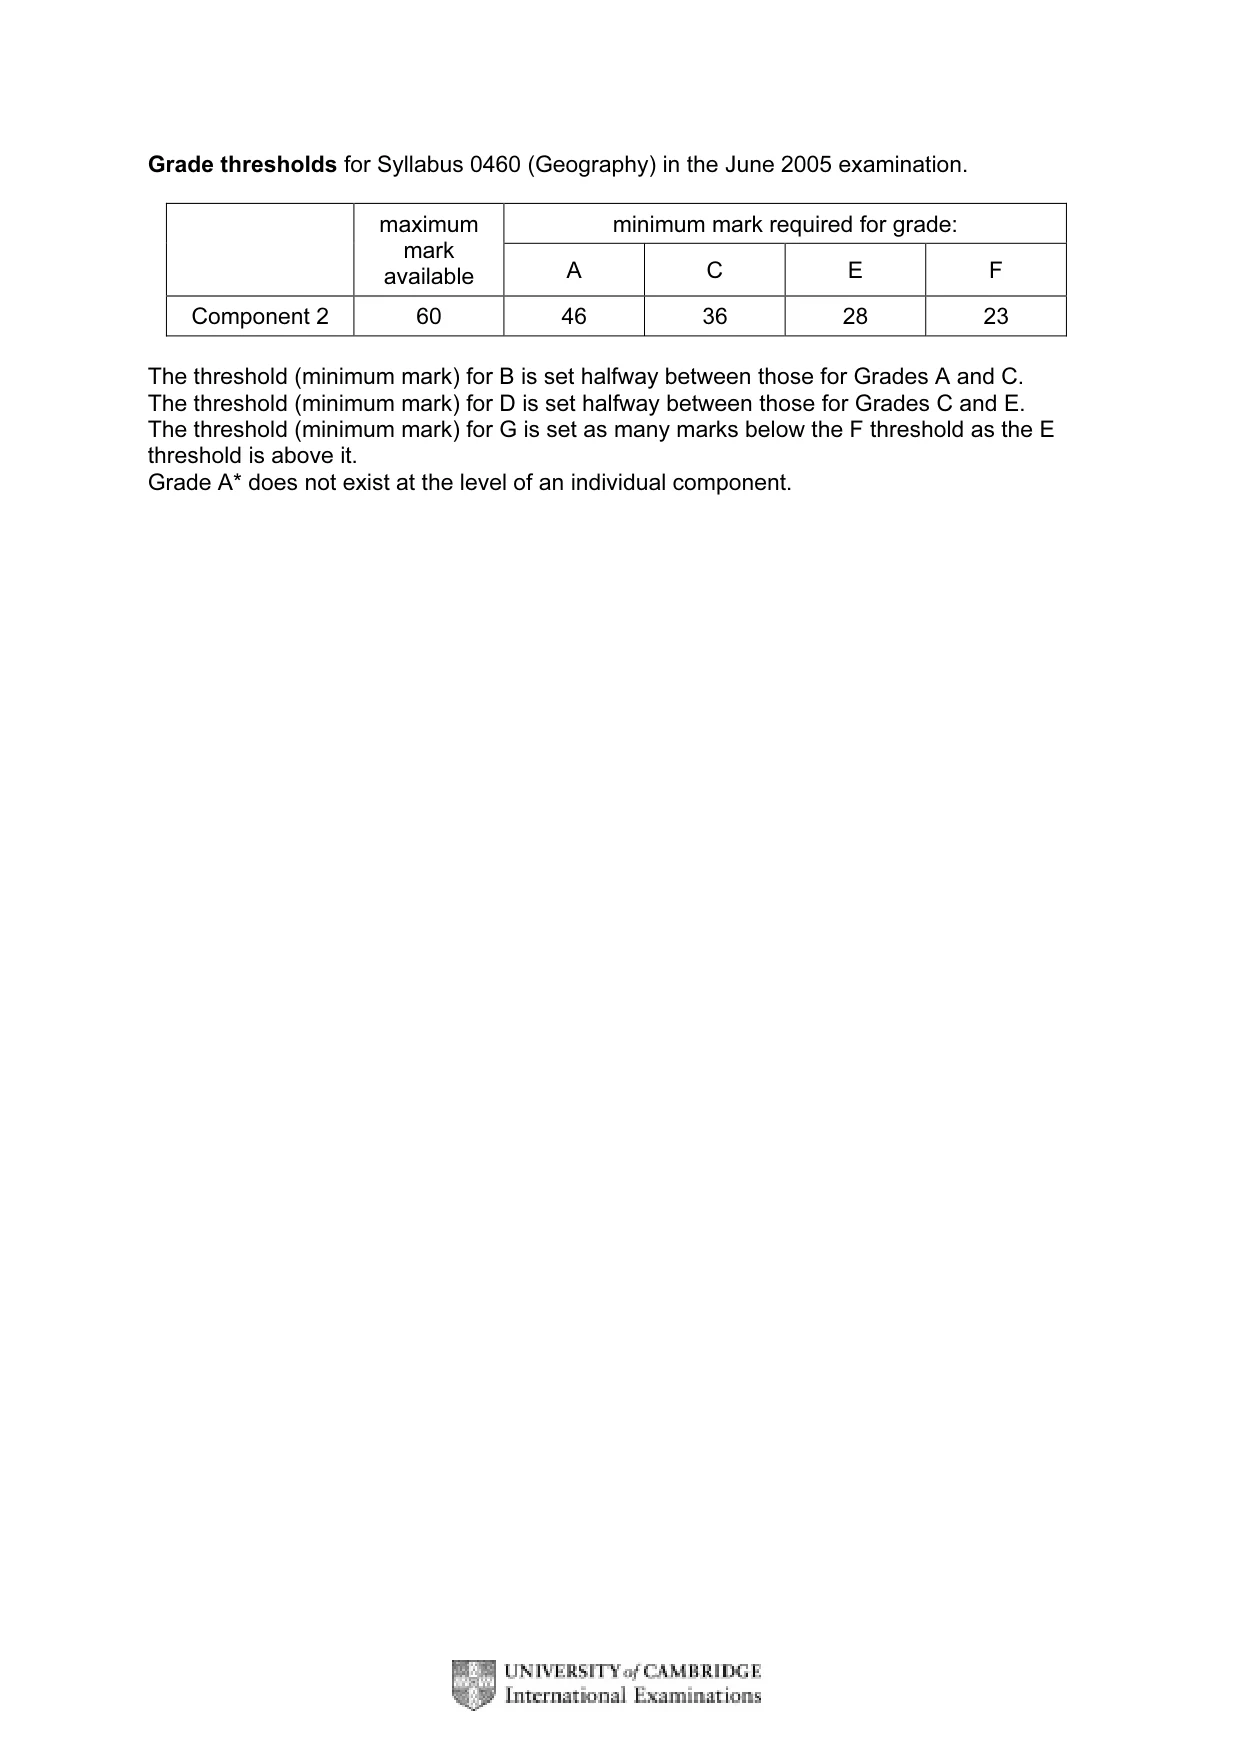
Grade thresholds for Syllabus 0460 (Geography) in the June 2005 examination. minimum mark required for grade: maximum mark available A C E F Component 2 60 46 36 28 23 The threshold (minimum mark) for B is set halfway between those for Grades A and C. The threshold (minimum mark) for D is set halfway between those for Grades C and E. The threshold (minimum mark) for G is set as many marks below the F threshold as the E threshold is above it. Grade A* does not exist at the level of an individual component.
Mark scheme, page 3
June 2005 IGCSE MARK SCHEME MAXIMUM MARK: 60 SYLLABUS/COMPONENT: 0460/02 GEOGRAPHY Paper 2
Mark scheme, page 4
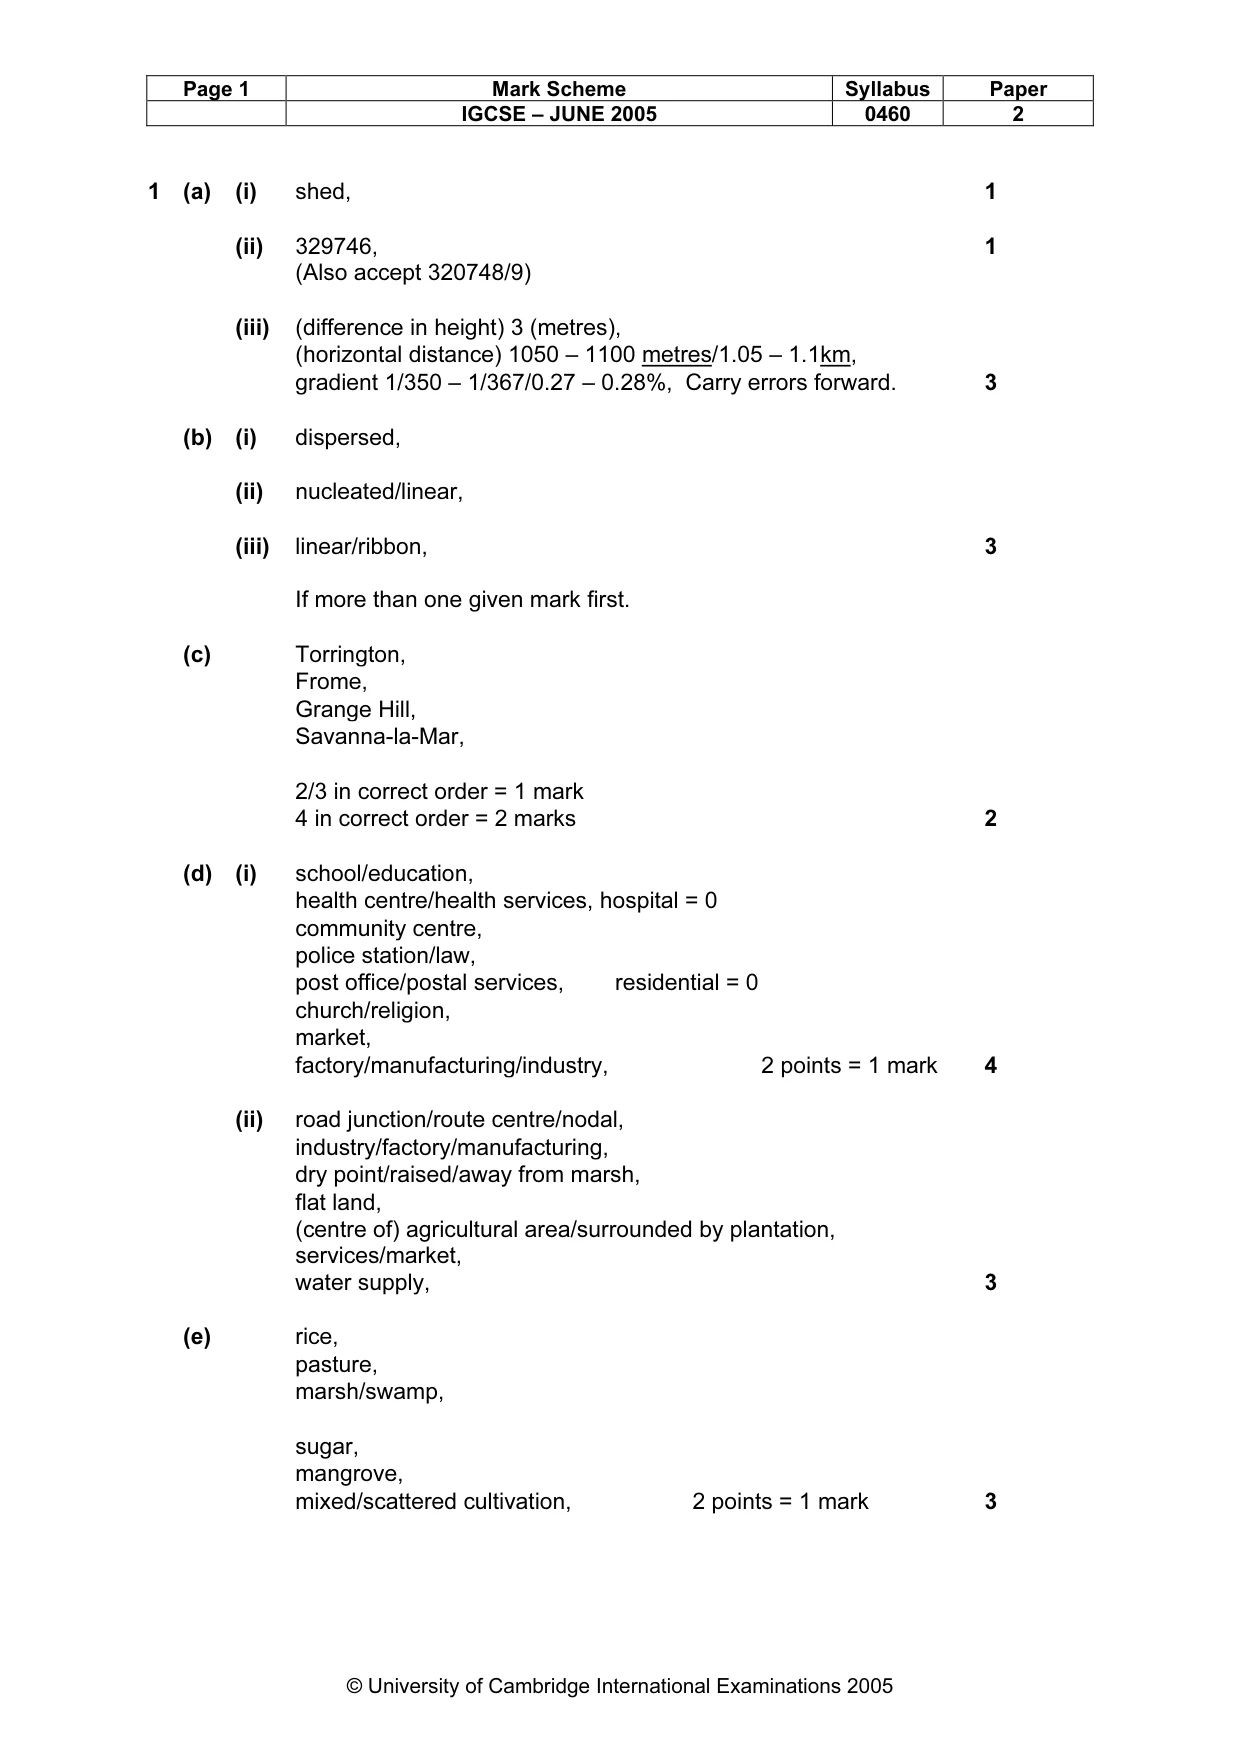
Page 1 Mark Scheme Syllabus Paper IGCSE – JUNE 2005 0460 2 © University of Cambridge International Examinations 2005 1 (a) (i) shed, 1 (ii) 329746, (Also accept 320748/9) 1 (iii) (difference in height) 3 (metres), (horizontal distance) 1050 – 1100 metres/1.05 – 1.1km, gradient 1/350 – 1/367/0.27 – 0.28%, Carry errors forward. 3 (b) (i) dispersed, (ii) nucleated/linear, (iii) linear/ribbon, If more than one given mark first. 3 (c) Torrington, Frome, Grange Hill, Savanna-la-Mar, 2/3 in correct order = 1 mark 4 in correct order = 2 marks 2 (d) (i) school/education, health centre/health services, hospital = 0 community centre, police station/law, post office/postal services, residential = 0 church/religion, market, factory/manufacturing/industry, 2 points = 1 mark 4 (ii) road junction/route centre/nodal, industry/factory/manufacturing, dry point/raised/away from marsh, flat land, (centre of) agricultural area/surrounded by plantation, services/market, water supply, 3 (e) rice, pasture, marsh/swamp, sugar, mangrove, mixed/scattered cultivation, 2 points = 1 mark 3
Mark scheme, page 5
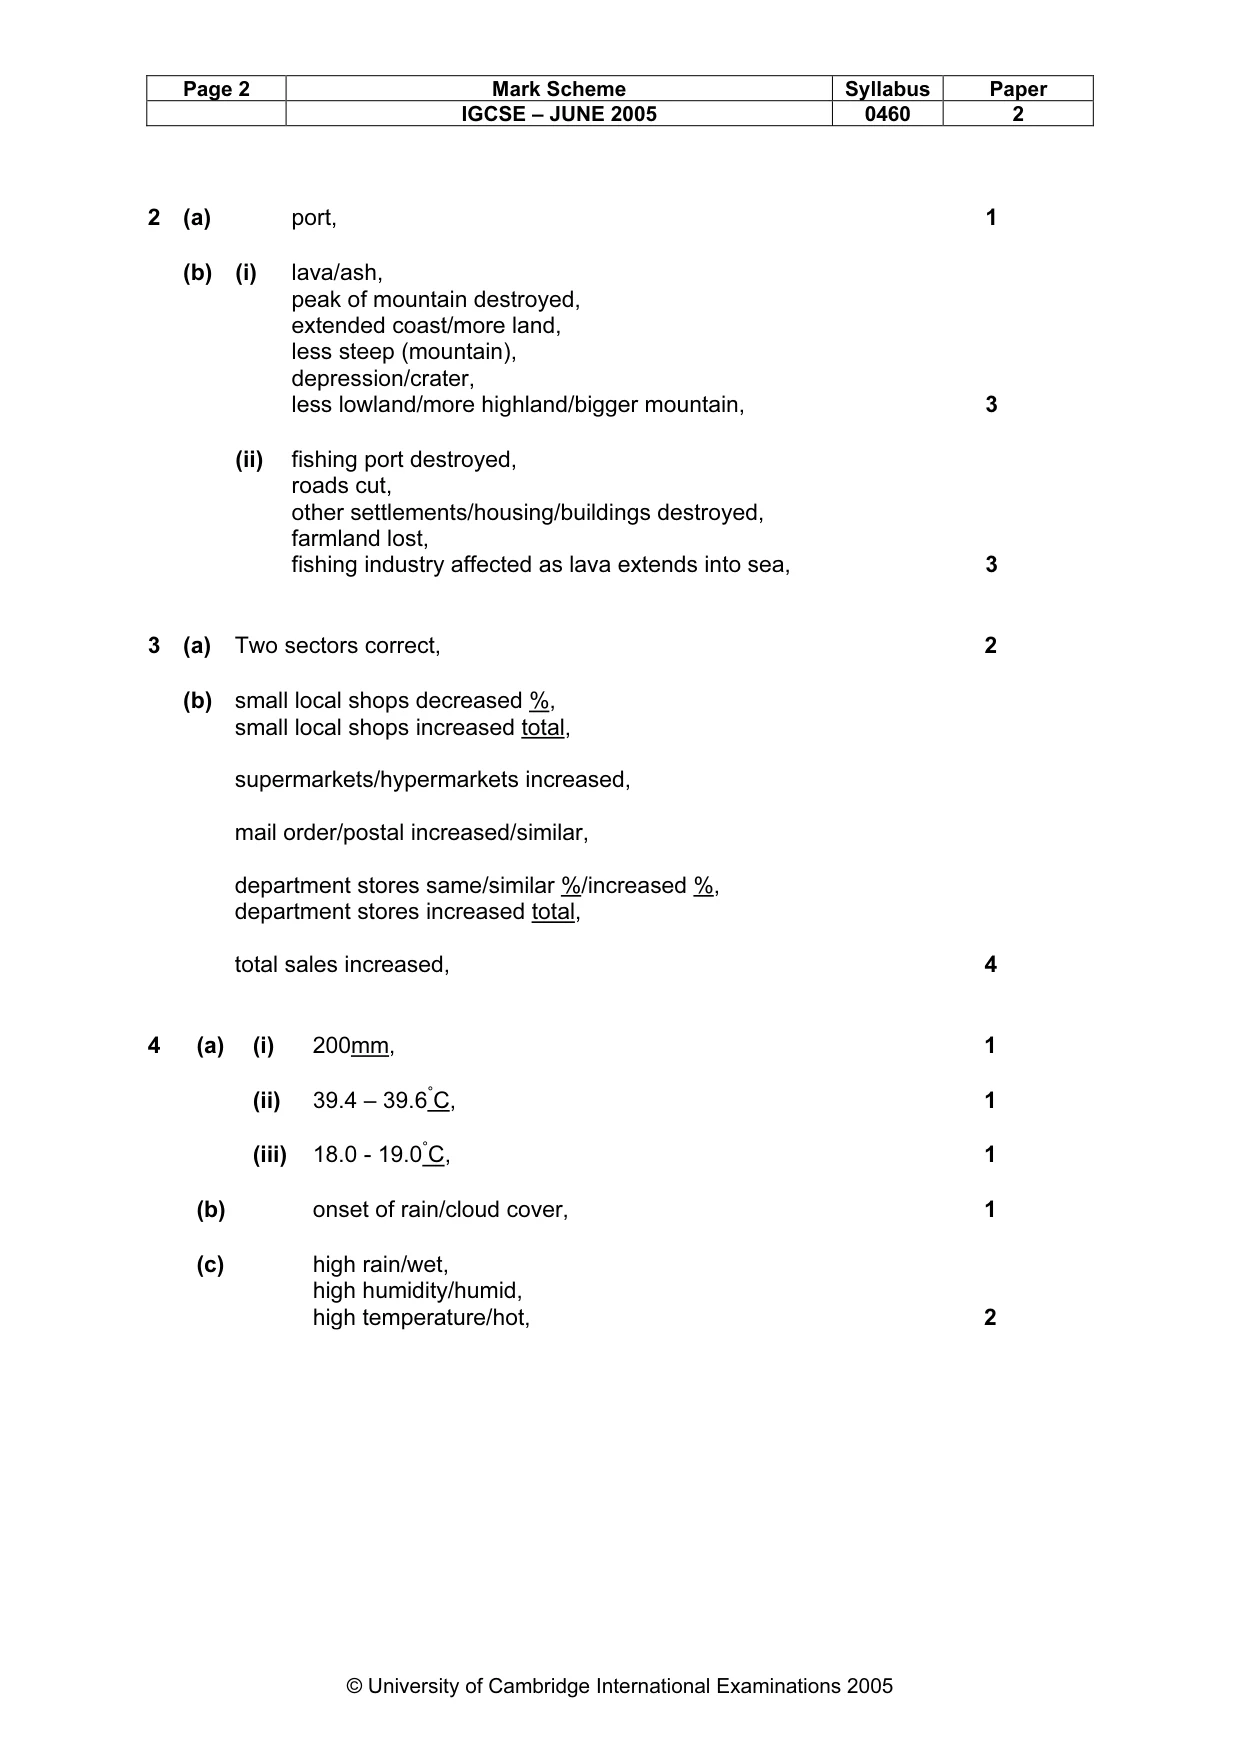
Page 2 Mark Scheme Syllabus Paper IGCSE – JUNE 2005 0460 2 © University of Cambridge International Examinations 2005 2 (a) port, 1 (b) (i) lava/ash, peak of mountain destroyed, extended coast/more land, less steep (mountain), depression/crater, less lowland/more highland/bigger mountain, 3 (ii) fishing port destroyed, roads cut, other settlements/housing/buildings destroyed, farmland lost, fishing industry affected as lava extends into sea, 3 3 (a) Two sectors correct, 2 (b) small local shops decreased %, small local shops increased total, supermarkets/hypermarkets increased, mail order/postal increased/similar, department stores same/similar %/increased %, department stores increased total, total sales increased, 4 4 (a) (i) 200mm, 1 (ii) 39.4 – 39.6°C, 1 (iii) 18.0 - 19.0°C, 1 (b) onset of rain/cloud cover, 1 (c) high rain/wet, high humidity/humid, high temperature/hot, 2
Mark scheme, page 6
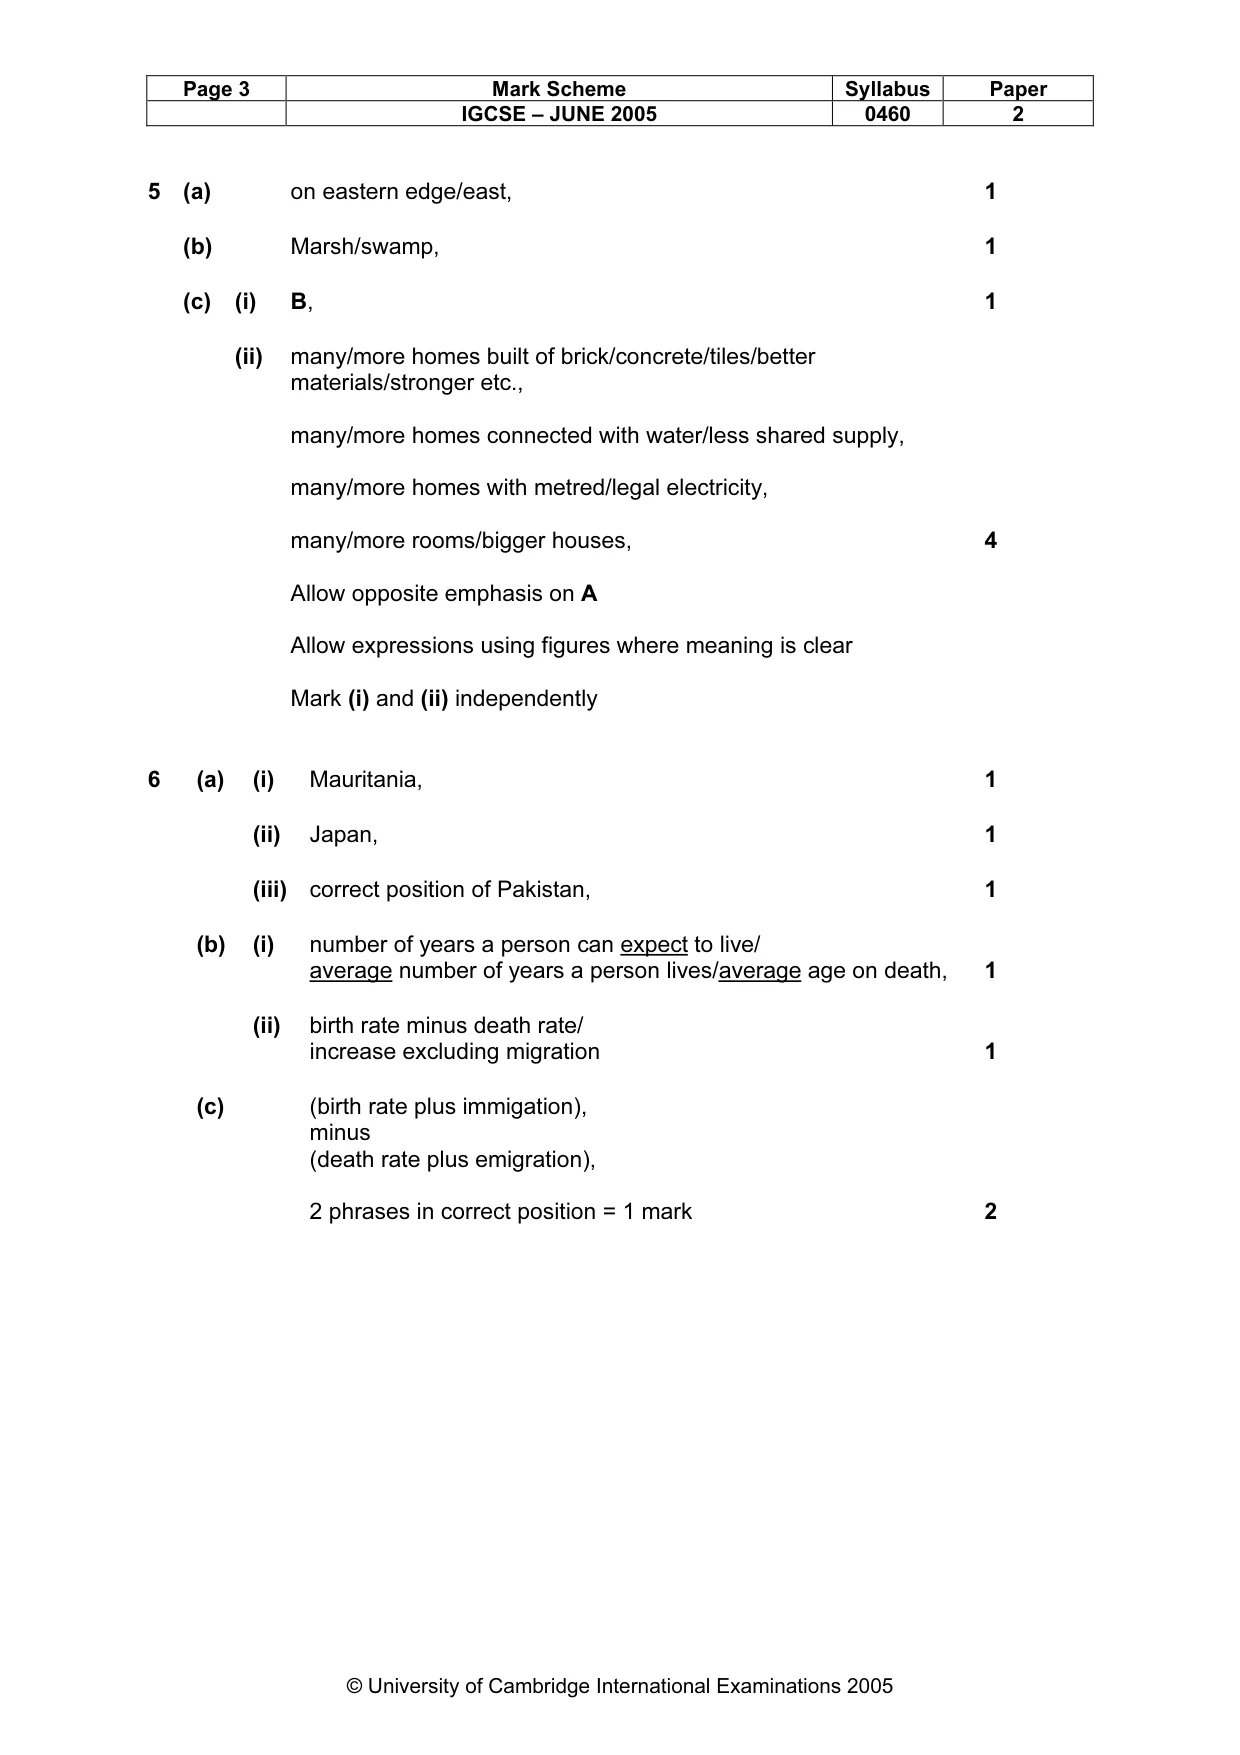
Page 3 Mark Scheme Syllabus Paper IGCSE – JUNE 2005 0460 2 © University of Cambridge International Examinations 2005 5 (a) on eastern edge/east, 1 (b) Marsh/swamp, 1 (c) (i) B, 1 (ii) many/more homes built of brick/concrete/tiles/better materials/stronger etc., many/more homes connected with water/less shared supply, many/more homes with metred/legal electricity, many/more rooms/bigger houses, Allow opposite emphasis on A Allow expressions using figures where meaning is clear Mark (i) and (ii) independently 4 6 (a) (i) Mauritania, 1 (ii) Japan, 1 (iii) correct position of Pakistan, 1 (b) (i) number of years a person can expect to live/ average number of years a person lives/average age on death, 1 (ii) birth rate minus death rate/ increase excluding migration 1 (c) (birth rate plus immigation), minus (death rate plus emigration), 2 phrases in correct position = 1 mark 2
Mark scheme, page 7
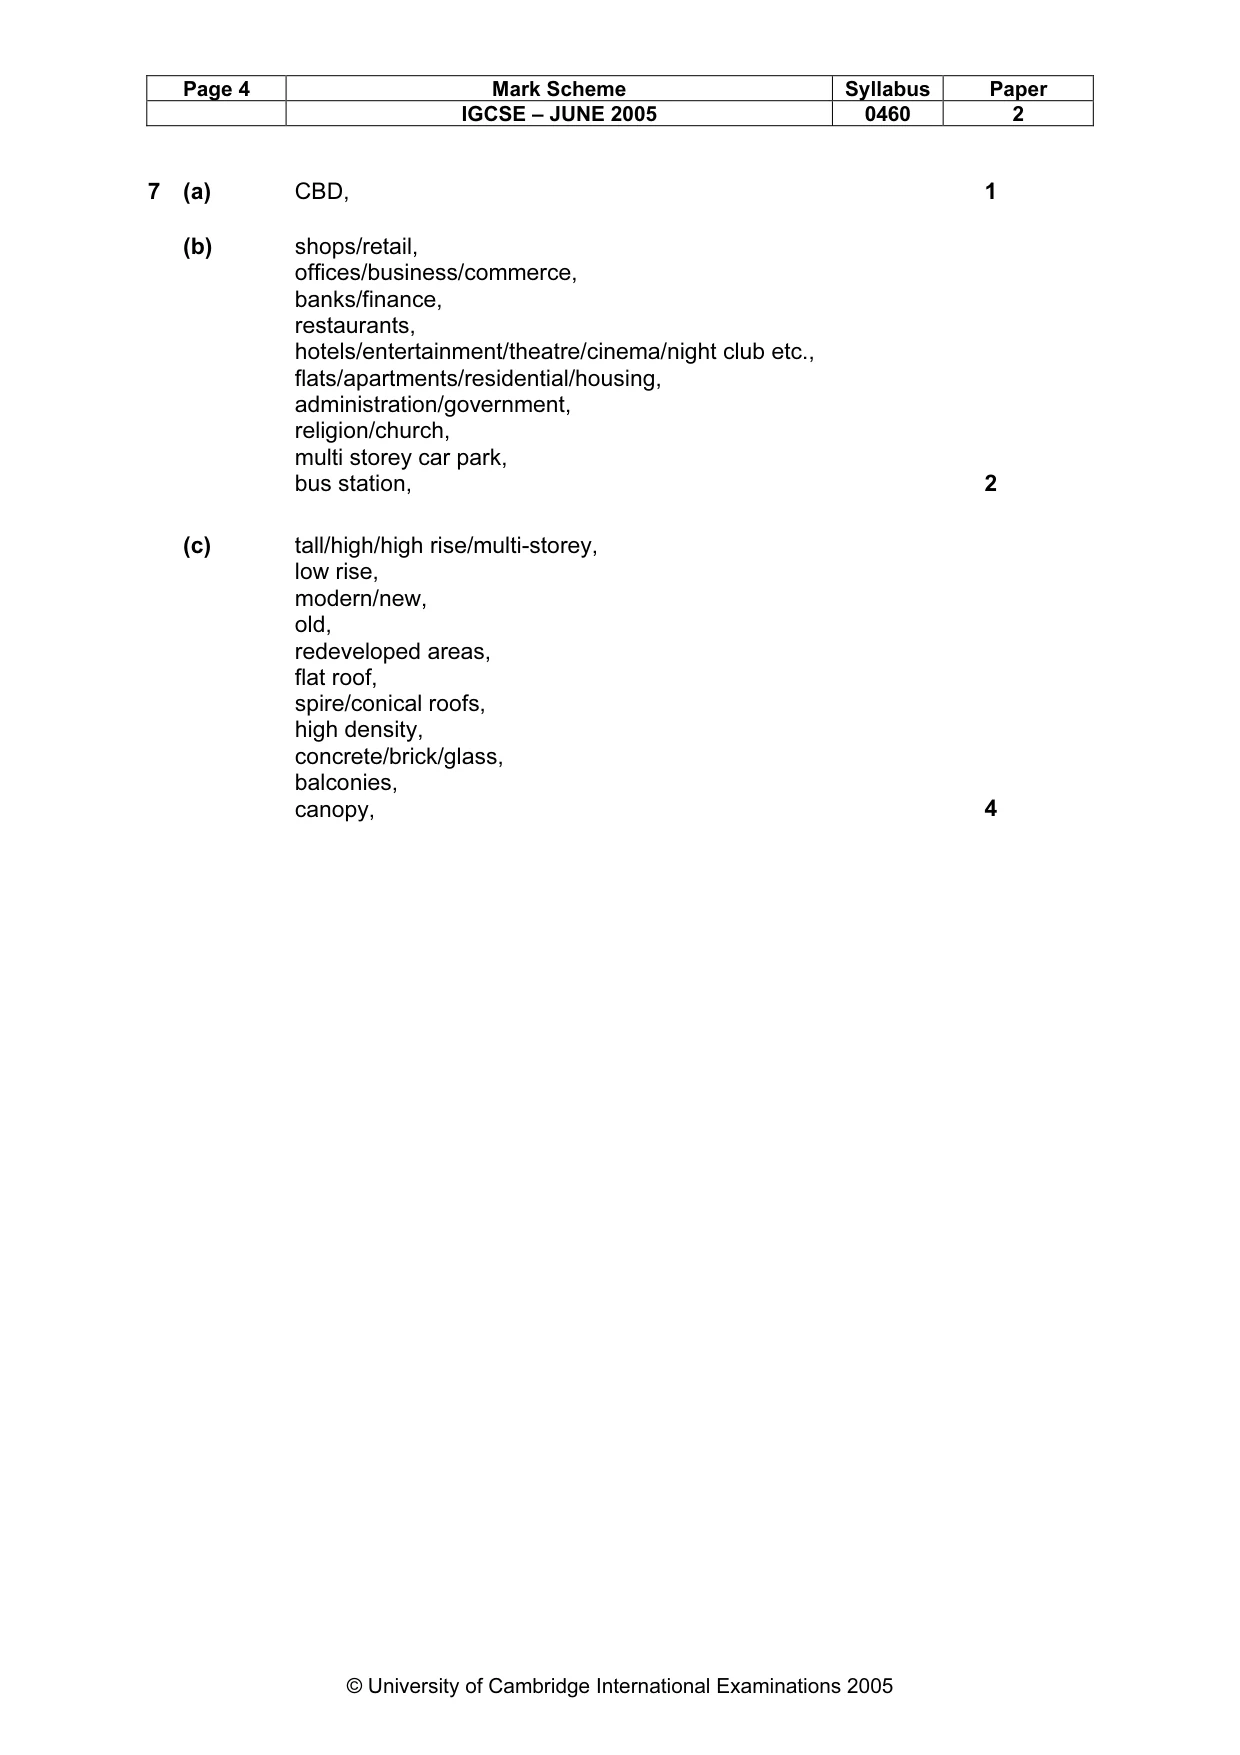
Page 4 Mark Scheme Syllabus Paper IGCSE – JUNE 2005 0460 2 © University of Cambridge International Examinations 2005 7 (a) CBD, 1 (b) shops/retail, offices/business/commerce, banks/finance, restaurants, hotels/entertainment/theatre/cinema/night club etc., flats/apartments/residential/housing, administration/government, religion/church, multi storey car park, bus station, 2 (c) tall/high/high rise/multi-storey, low rise, modern/new, old, redeveloped areas, flat roof, spire/conical roofs, high density, concrete/brick/glass, balconies, canopy, 4