Cambridge IGCSE Geography 0460 — 2004 Oct/Nov Paper 4 · Variant 1
0460/41/O/N/04
The question paper and its mark scheme, free to read here and free to download. This is Cambridge’s own paper, exactly as it was sat.
Question paper4 pages
Mark scheme7 pages
Answers below. Sit the paper first if you are practising.
Paper as text
Question paper, page 1
This document consists of 3 printed pages, 1 blank page and 1 insert. SP (DR) S60096/4 © UCLES 2004 [Turn over UNIVERSITY OF CAMBRIDGE INTERNATIONAL EXAMINATIONS International General Certificate of Secondary Education GEOGRAPHY 0460/04 Paper 4 Alternative to Coursework October/November 2004 1 hour 45 minutes Additional Materials: Answer Booklet/Paper; Ruler. READ THESE INSTRUCTIONS FIRST If you have been given an Answer Booklet, follow the instructions on the front cover of the Booklet. Write your Centre number, candidate number and name on all the work you hand in. Write in dark blue or black pen on both sides of the paper. You may use a soft pencil for any diagrams, graphs or rough working. Do not use staples, paper clips, highlighters, glue or correction fluid. Answer all questions. At the end of the examination, fasten all your work securely together. The number of marks is given in brackets [ ] at the end of each question or part question. Sketch maps and diagrams should be drawn whenever they serve to illustrate an answer. The insert contains Fig. 1 for Question 1, Fig. 2 for Question 2 and Photograph A for Question 2. www.XtremePapers.com
Question paper, page 2
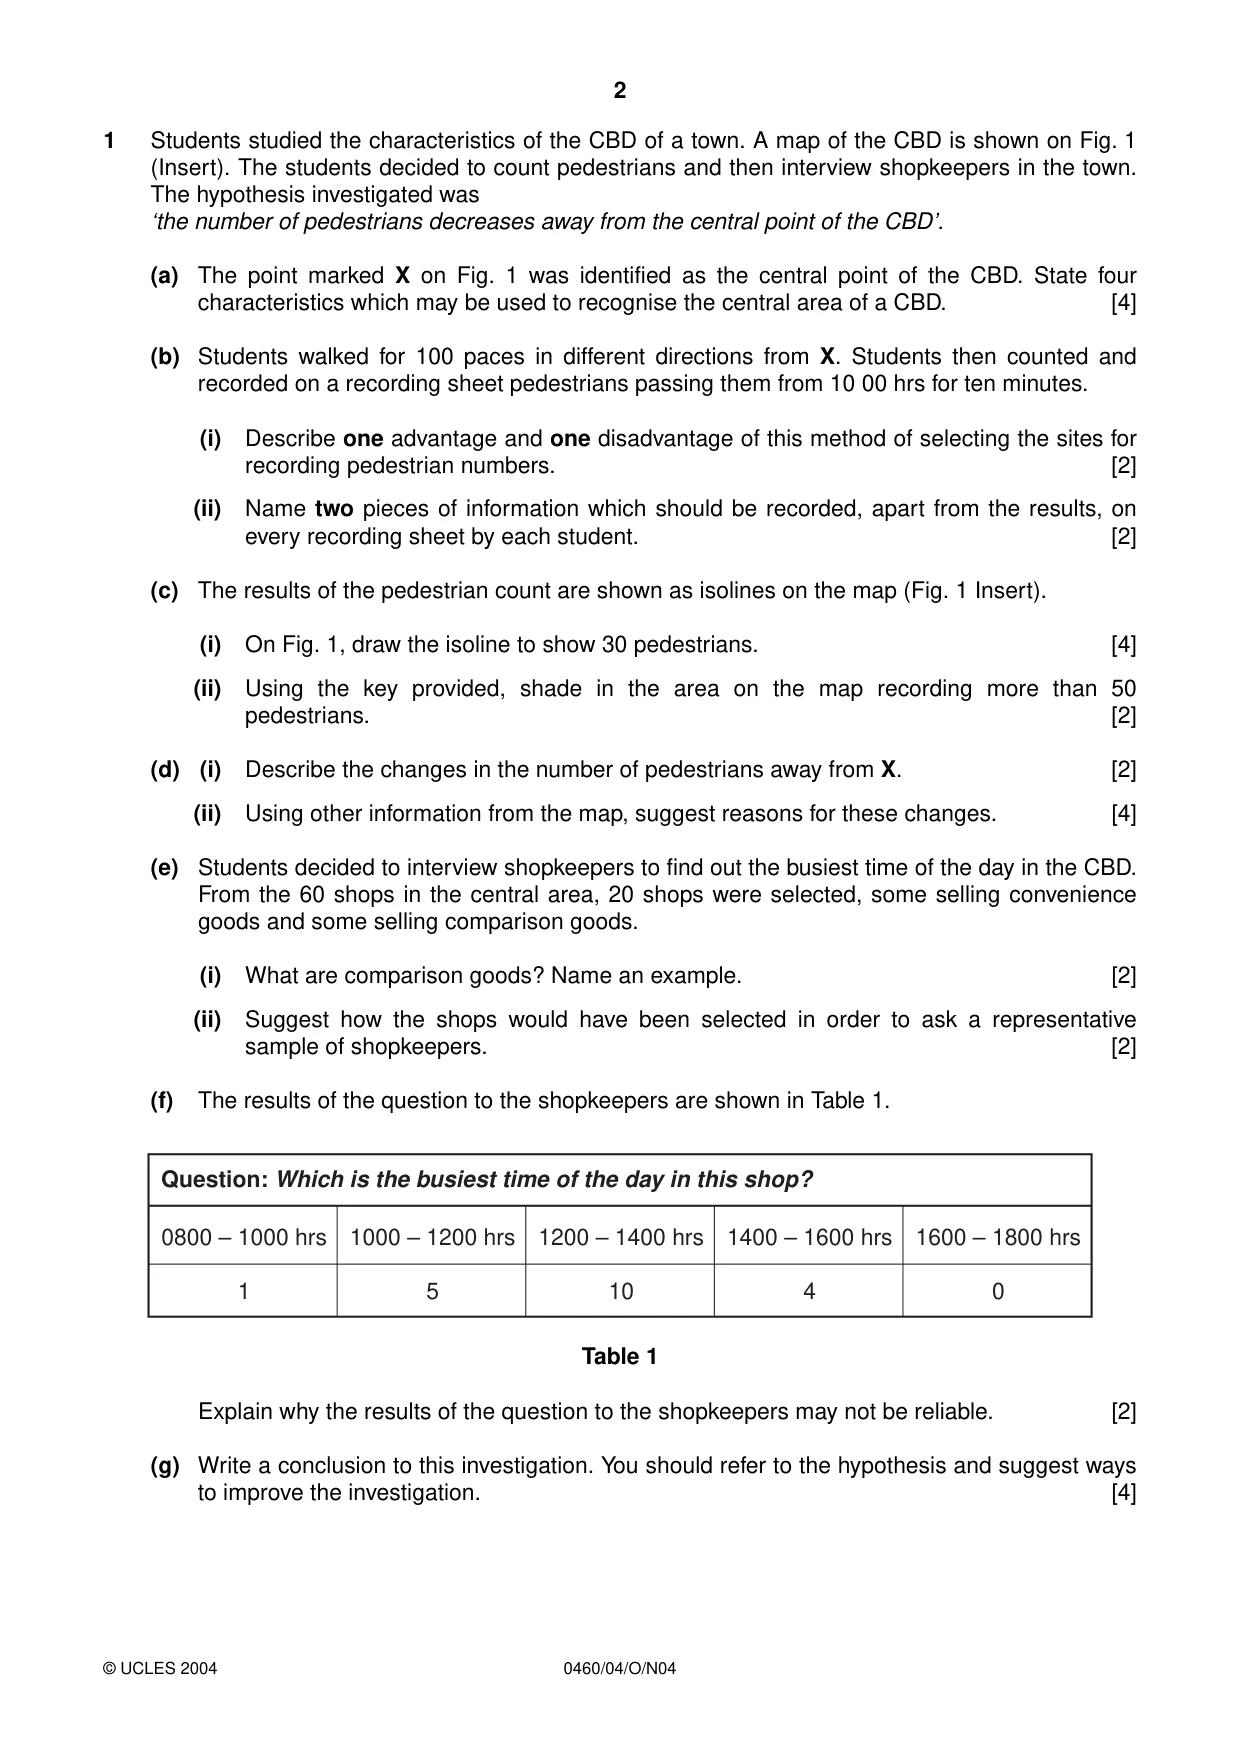
2 0460/04/O/N04 1 Students studied the characteristics of the CBD of a town. A map of the CBD is shown on Fig. 1 (Insert). The students decided to count pedestrians and then interview shopkeepers in the town. The hypothesis investigated was ‘the number of pedestrians decreases away from the central point of the CBD’. (a) The point marked X on Fig. 1 was identified as the central point of the CBD. State four characteristics which may be used to recognise the central area of a CBD. [4] (b) Students walked for 100 paces in different directions from X. Students then counted and recorded on a recording sheet pedestrians passing them from 10 00 hrs for ten minutes. (i) Describe one advantage and one disadvantage of this method of selecting the sites for recording pedestrian numbers. [2] (ii) Name two pieces of information which should be recorded, apart from the results, on every recording sheet by each student. [2] (c) The results of the pedestrian count are shown as isolines on the map (Fig. 1 Insert). (i) On Fig. 1, draw the isoline to show 30 pedestrians. [4] (ii) Using the key provided, shade in the area on the map recording more than 50 pedestrians. [2] (d) (i) Describe the changes in the number of pedestrians away from X. [2] (ii) Using other information from the map, suggest reasons for these changes. [4] (e) Students decided to interview shopkeepers to find out the busiest time of the day in the CBD. From the 60 shops in the central area, 20 shops were selected, some selling convenience goods and some selling comparison goods. (i) What are comparison goods? Name an example. [2] (ii) Suggest how the shops would have been selected in order to ask a representative sample of shopkeepers. [2] (f) The results of the question to the shopkeepers are shown in Table 1. Table 1 Explain why the results of the question to the shopkeepers may not be reliable. [2] (g) Write a conclusion to this investigation. You should refer to the hypothesis and suggest ways to improve the investigation. [4] Question: Which is the busiest time of the day in this shop? 0800 – 1000 hrs 1 1000 – 1200 hrs 5 1200 – 1400 hrs 10 1400 – 1600 hrs 4 1600 – 1800 hrs 0 © UCLES 2004
Question paper, page 3
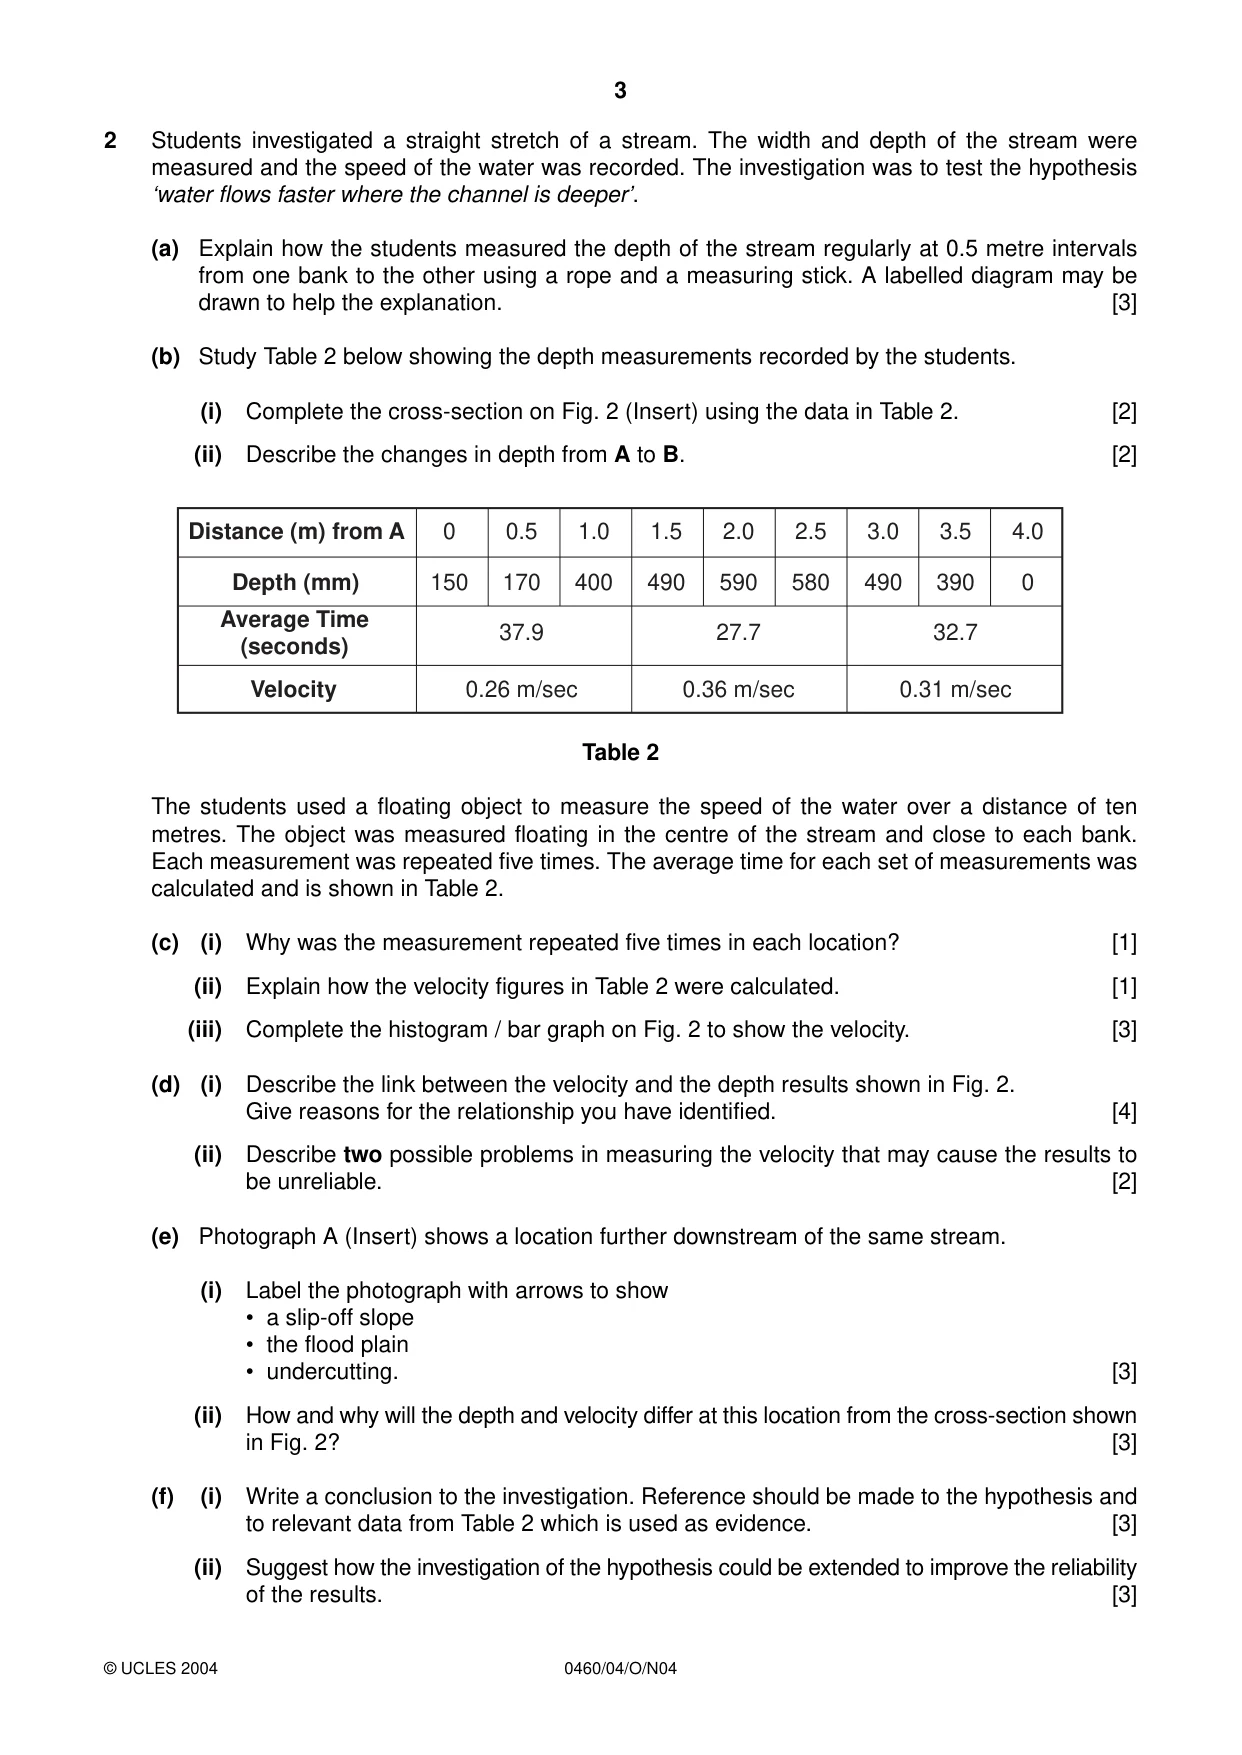
3 0460/04/O/N04 2 Students investigated a straight stretch of a stream. The width and depth of the stream were measured and the speed of the water was recorded. The investigation was to test the hypothesis ‘water flows faster where the channel is deeper’. (a) Explain how the students measured the depth of the stream regularly at 0.5 metre intervals from one bank to the other using a rope and a measuring stick. A labelled diagram may be drawn to help the explanation. [3] (b) Study Table 2 below showing the depth measurements recorded by the students. (i) Complete the cross-section on Fig. 2 (Insert) using the data in Table 2. [2] (ii) Describe the changes in depth from A to B. [2] Table 2 The students used a floating object to measure the speed of the water over a distance of ten metres. The object was measured floating in the centre of the stream and close to each bank. Each measurement was repeated five times. The average time for each set of measurements was calculated and is shown in Table 2. (c) (i) Why was the measurement repeated five times in each location? [1] (ii) Explain how the velocity figures in Table 2 were calculated. [1] (iii) Complete the histogram / bar graph on Fig. 2 to show the velocity. [3] (d) (i) Describe the link between the velocity and the depth results shown in Fig. 2. Give reasons for the relationship you have identified. [4] (ii) Describe two possible problems in measuring the velocity that may cause the results to be unreliable. [2] (e) Photograph A (Insert) shows a location further downstream of the same stream. (i) Label the photograph with arrows to show • a slip-off slope • the flood plain • undercutting. [3] (ii) How and why will the depth and velocity differ at this location from the cross-section shown in Fig. 2? [3] (f) (i) Write a conclusion to the investigation. Reference should be made to the hypothesis and to relevant data from Table 2 which is used as evidence. [3] (ii) Suggest how the investigation of the hypothesis could be extended to improve the reliability of the results. [3] Average Time (seconds) 37.9 27.7 32.7 Velocity 0.26 m/sec 0.36 m/sec 0.31 m/sec Distance (m) from A 0 1.0 1.5 2.5 3.0 0.5 2.0 3.5 4.0 Depth (mm) 150 400 490 580 490 170 590 390 0 © UCLES 2004
Question paper, page 4
4 0460/04/O/N04 BLANK PAGE Copyright Acknowledgements: Photograph Mrs C. Cheadle © UCLES Every reasonable effort has been made to trace all copyright holders where the publishers (i.e. UCLES) are aware that third-party material has been reproduced. The publishers would be pleased to hear from anyone whose rights they have unwittingly infringed. University of Cambridge International Examinations is part of the University of Cambridge Local Examinations Syndicate (UCLES), which is itself a department of the University of Cambridge.
Mark scheme, page 1
UNIVERSITY OF CAMBRIDGE INTERNATIONAL EXAMINATIONS International General Certificate of Secondary Education MARK SCHEME for the November 2004 question paper 0460 GEOGRAPHY 0460/04 Paper 4 (Alternative to Coursework), maximum mark 60 This mark scheme is published as an aid to teachers and students, to indicate the requirements of the examination. It shows the basis on which Examiners were initially instructed to award marks. It does not indicate the details of the discussions that took place at an Examiners’ meeting before marking began. Any substantial changes to the mark scheme that arose from these discussions will be recorded in the published Report on the Examination. All Examiners are instructed that alternative correct answers and unexpected approaches in candidates’ scripts must be given marks that fairly reflect the relevant knowledge and skills demonstrated. Mark schemes must be read in conjunction with the question papers and the Report on the Examination. CIE will not enter into discussion or correspondence in connection with these mark schemes. CIE is publishing the mark schemes for the November 2004 question papers for most IGCSE and GCE Advanced Level syllabuses. www.XtremePapers.com
Mark scheme, page 2
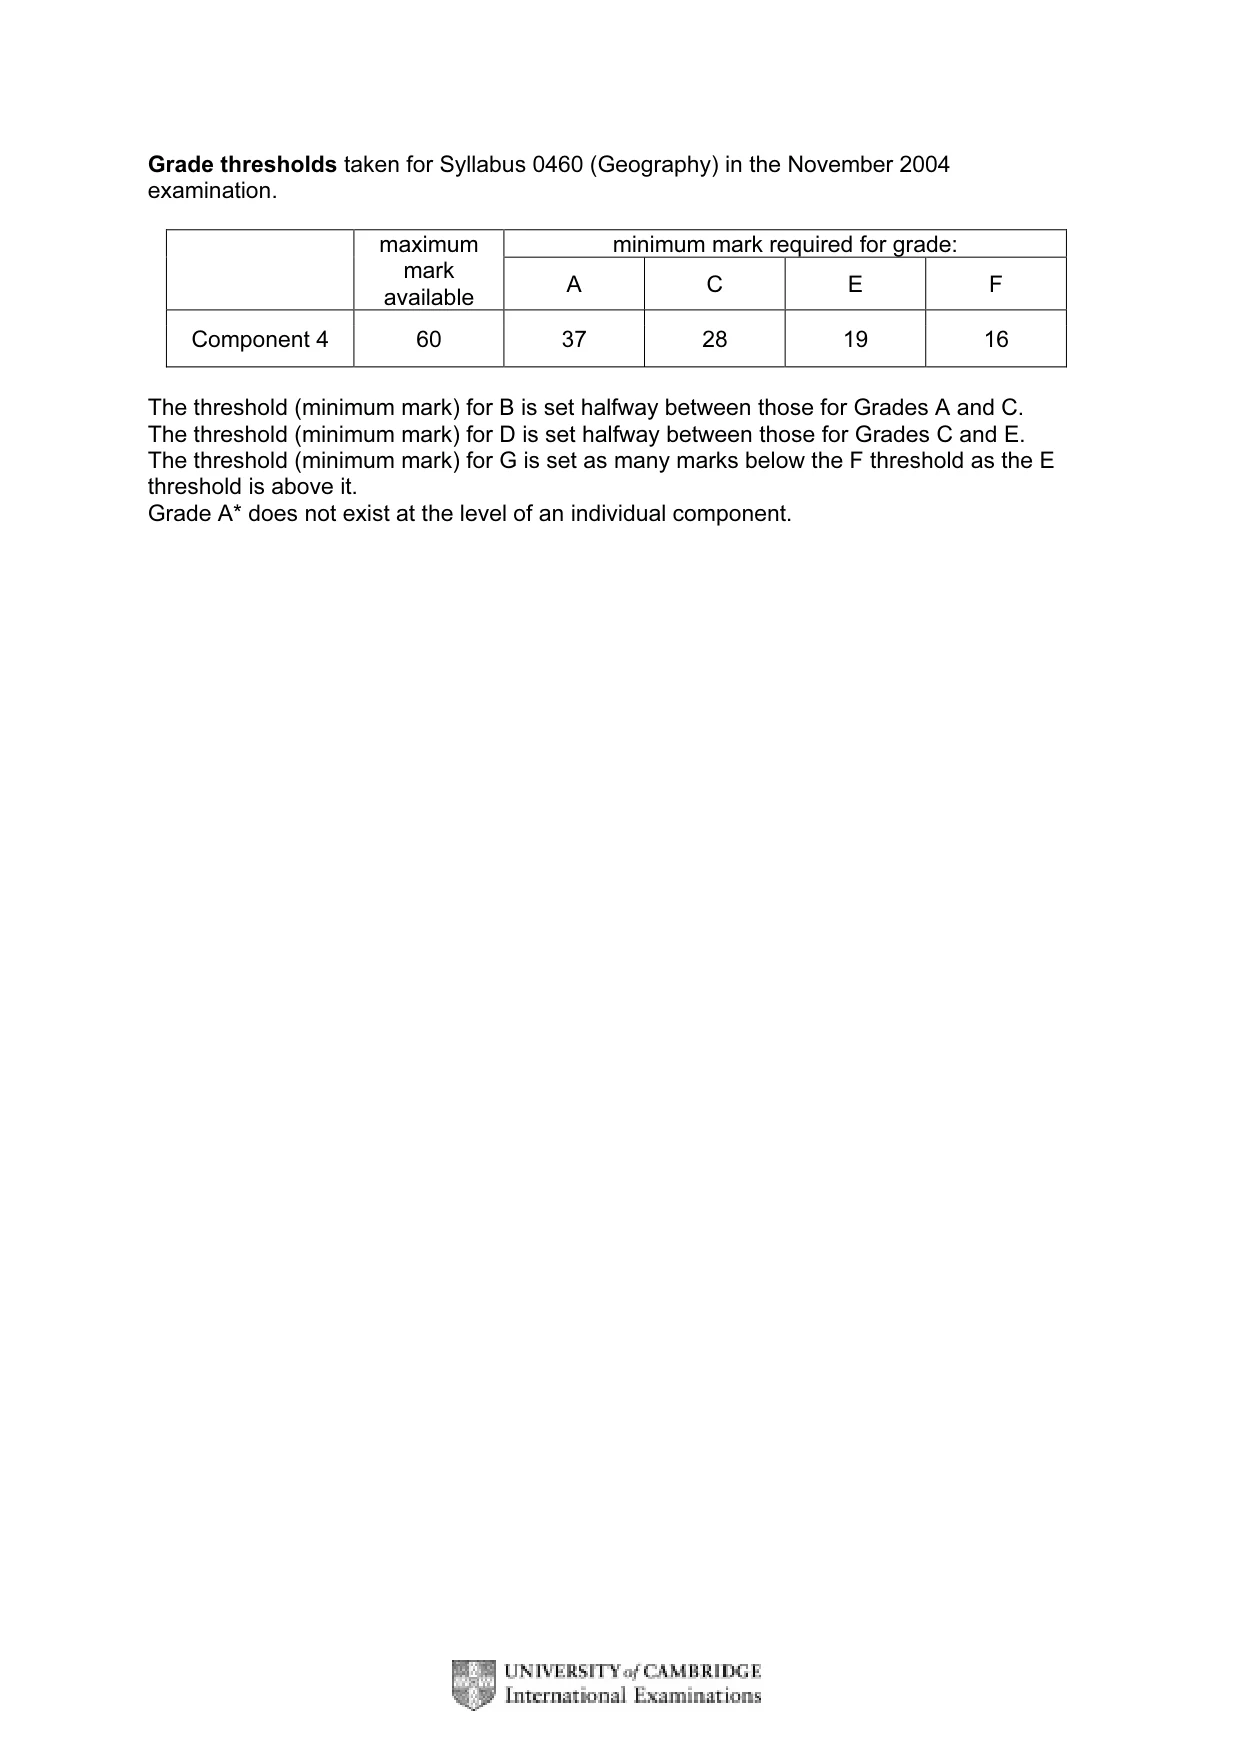
Grade thresholds taken for Syllabus 0460 (Geography) in the November 2004 examination. minimum mark required for grade: maximum mark available A C E F Component 4 60 37 28 19 16 The threshold (minimum mark) for B is set halfway between those for Grades A and C. The threshold (minimum mark) for D is set halfway between those for Grades C and E. The threshold (minimum mark) for G is set as many marks below the F threshold as the E threshold is above it. Grade A* does not exist at the level of an individual component.
Mark scheme, page 3
November 2004 INTERNATIONAL GCSE MARK SCHEME MAXIMUM MARK: 60 SYLLABUS/COMPONENT: 0460/04 GEOGRAPHY Alternative to Coursework
Mark scheme, page 4
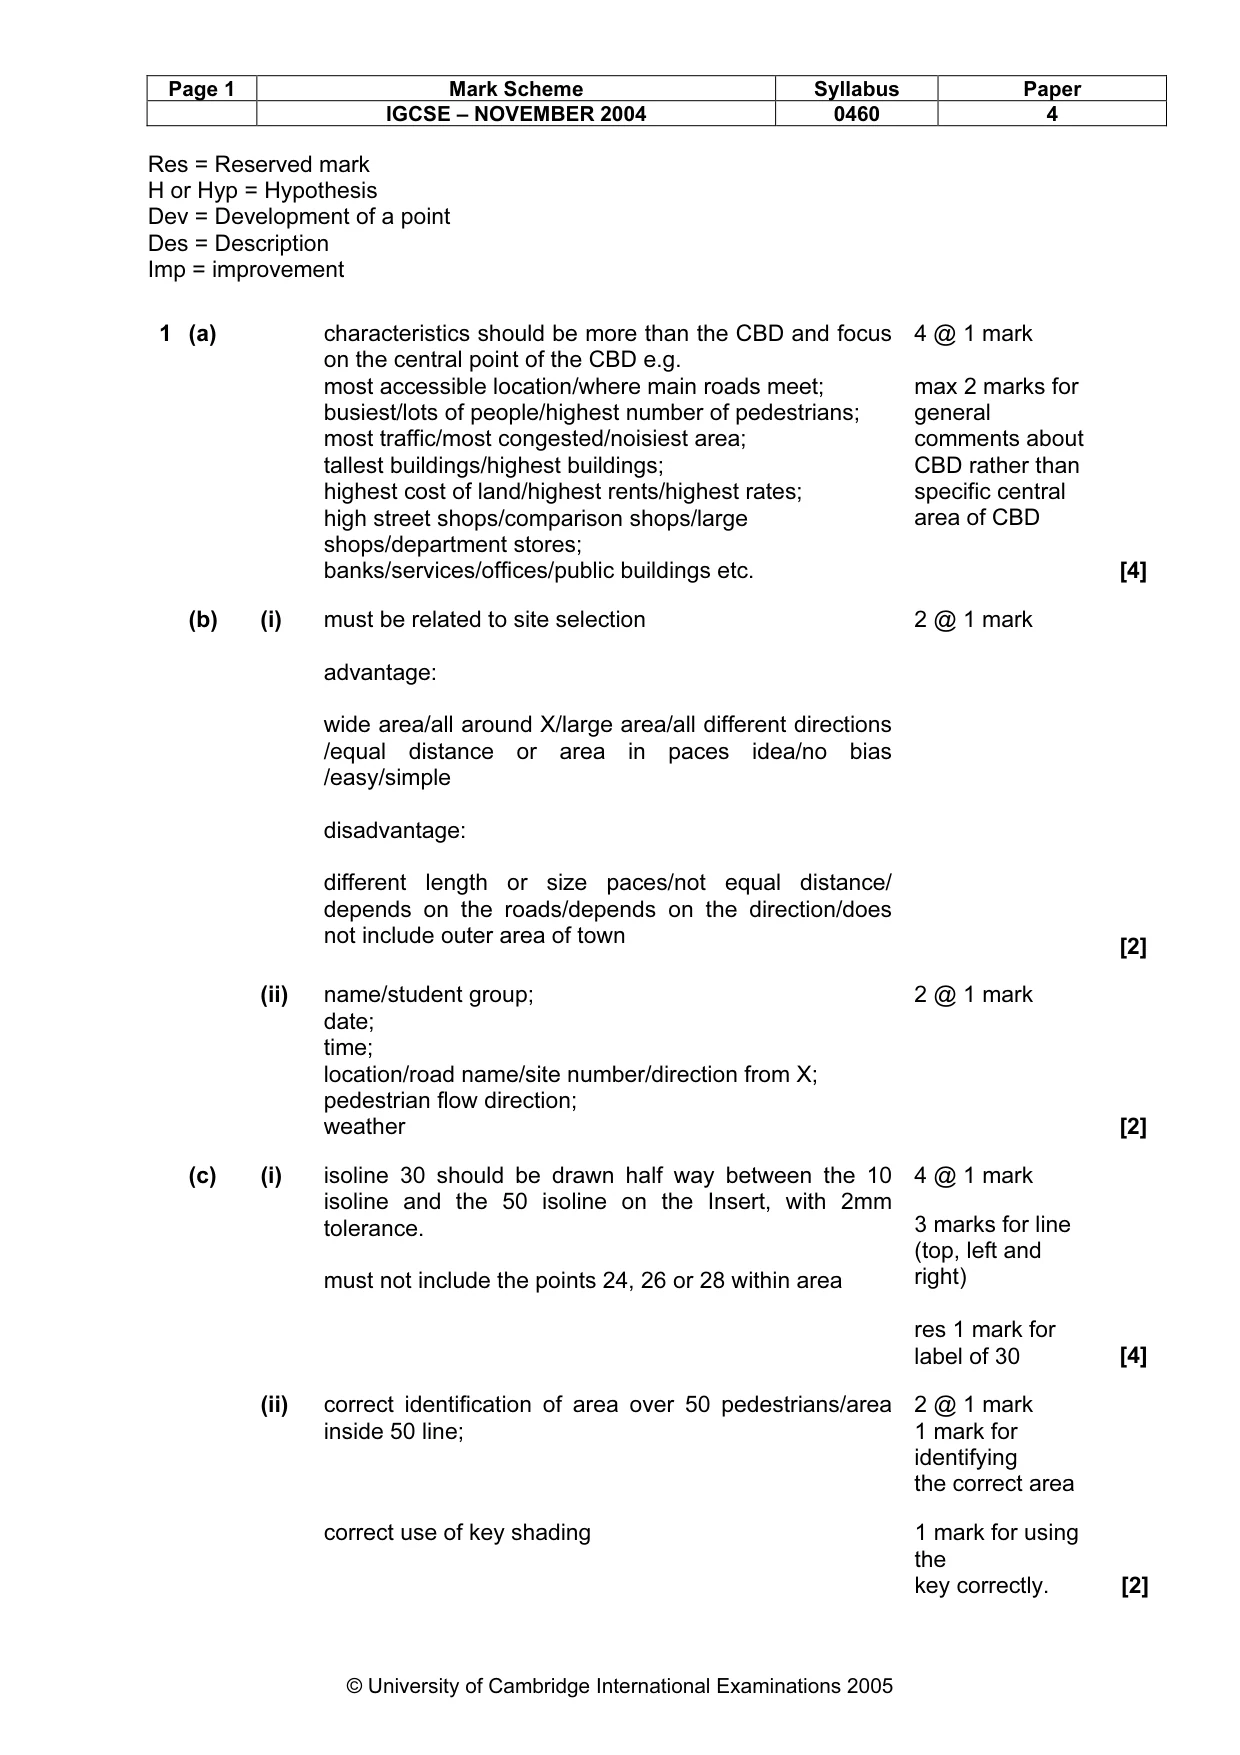
Page 1 Mark Scheme Syllabus Paper IGCSE – NOVEMBER 2004 0460 4 © University of Cambridge International Examinations 2005 Res = Reserved mark H or Hyp = Hypothesis Dev = Development of a point Des = Description Imp = improvement 1 (a) characteristics should be more than the CBD and focus on the central point of the CBD e.g. most accessible location/where main roads meet; busiest/lots of people/highest number of pedestrians; most traffic/most congested/noisiest area; tallest buildings/highest buildings; highest cost of land/highest rents/highest rates; high street shops/comparison shops/large shops/department stores; banks/services/offices/public buildings etc. 4 @ 1 mark max 2 marks for general comments about CBD rather than specific central area of CBD [4] (b) (i) must be related to site selection advantage: wide area/all around X/large area/all different directions /equal distance or area in paces idea/no bias /easy/simple disadvantage: different length or size paces/not equal distance/ depends on the roads/depends on the direction/does not include outer area of town 2 @ 1 mark [2] (ii) name/student group; date; time; location/road name/site number/direction from X; pedestrian flow direction; weather 2 @ 1 mark [2] (c) (i) 4 @ 1 mark isoline 30 should be drawn half way between the 10 isoline and the 50 isoline on the Insert, with 2mm tolerance. must not include the points 24, 26 or 28 within area 3 marks for line (top, left and right) res 1 mark for label of 30 [4] (ii) correct identification of area over 50 pedestrians/area inside 50 line; 2 @ 1 mark 1 mark for identifying the correct area correct use of key shading 1 mark for using the key correctly. [2]
Mark scheme, page 5
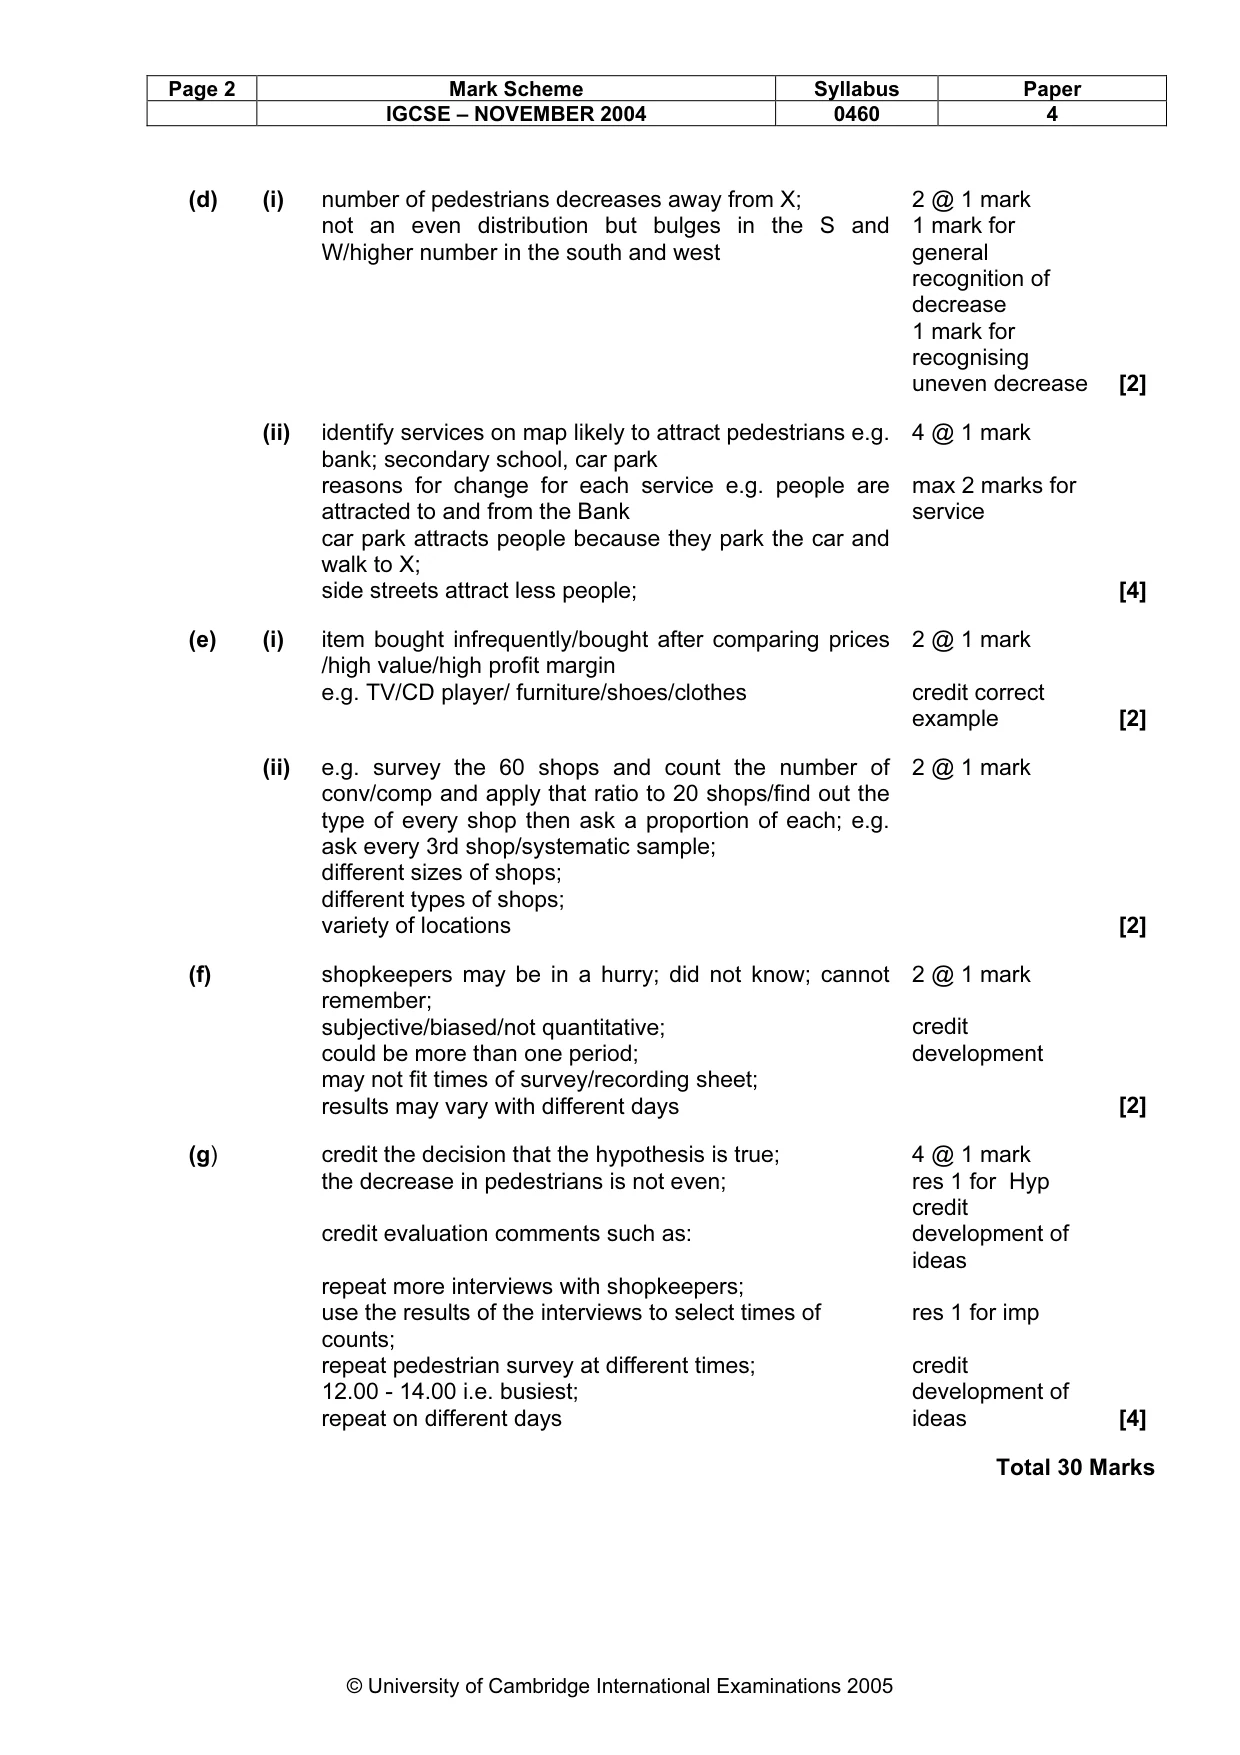
Page 2 Mark Scheme Syllabus Paper IGCSE – NOVEMBER 2004 0460 4 © University of Cambridge International Examinations 2005 (d) (i) number of pedestrians decreases away from X; not an even distribution but bulges in the S and W/higher number in the south and west 2 @ 1 mark 1 mark for general recognition of decrease 1 mark for recognising uneven decrease [2] (ii) identify services on map likely to attract pedestrians e.g. bank; secondary school, car park reasons for change for each service e.g. people are attracted to and from the Bank car park attracts people because they park the car and walk to X; side streets attract less people; 4 @ 1 mark max 2 marks for service [4] (e) (i) item bought infrequently/bought after comparing prices /high value/high profit margin e.g. TV/CD player/ furniture/shoes/clothes 2 @ 1 mark credit correct example [2] (ii) e.g. survey the 60 shops and count the number of conv/comp and apply that ratio to 20 shops/find out the type of every shop then ask a proportion of each; e.g. ask every 3rd shop/systematic sample; different sizes of shops; different types of shops; variety of locations 2 @ 1 mark [2] (f) shopkeepers may be in a hurry; did not know; cannot remember; subjective/biased/not quantitative; could be more than one period; may not fit times of survey/recording sheet; results may vary with different days 2 @ 1 mark credit development [2] (g) credit the decision that the hypothesis is true; the decrease in pedestrians is not even; credit evaluation comments such as: repeat more interviews with shopkeepers; use the results of the interviews to select times of counts; repeat pedestrian survey at different times; 12.00 - 14.00 i.e. busiest; repeat on different days 4 @ 1 mark res 1 for Hyp credit development of ideas res 1 for imp credit development of ideas [4] Total 30 Marks
Mark scheme, page 6
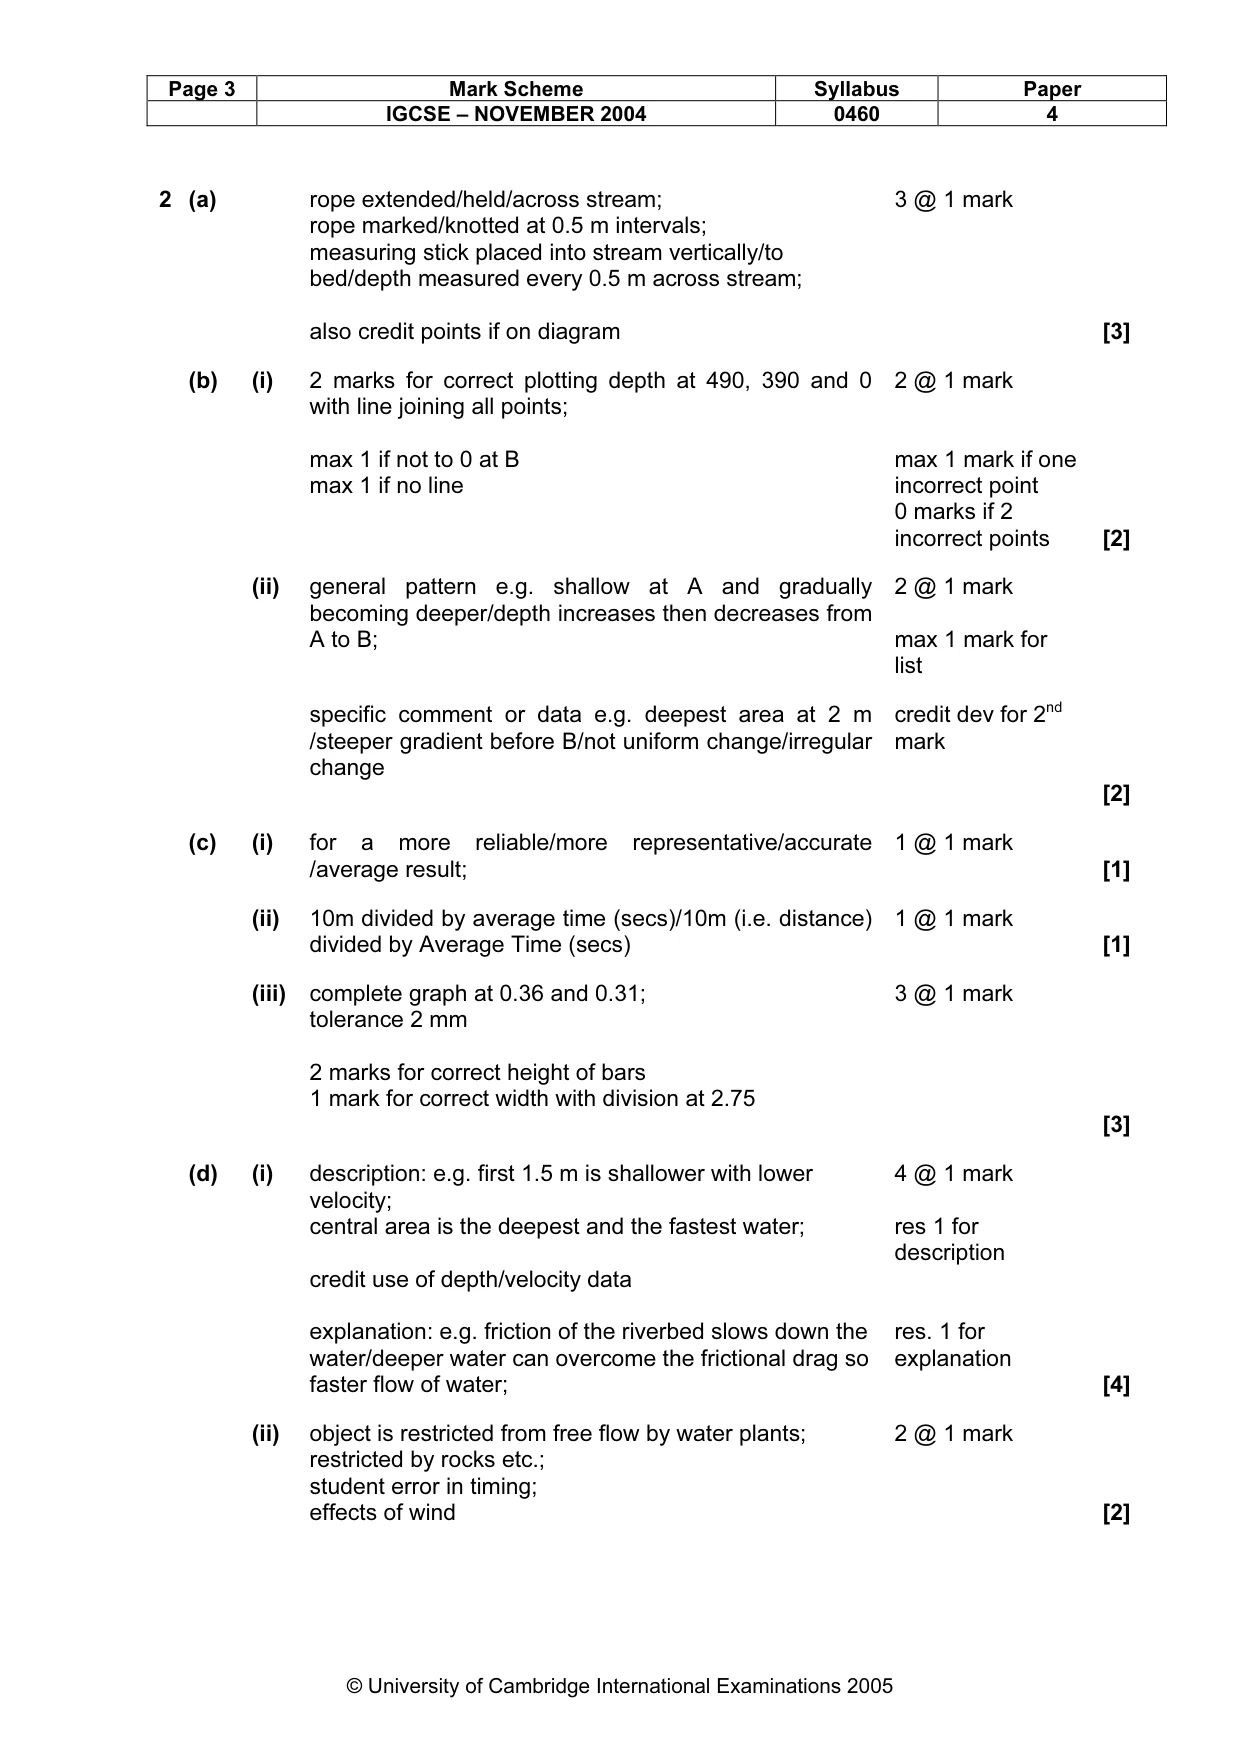
Page 3 Mark Scheme Syllabus Paper IGCSE – NOVEMBER 2004 0460 4 © University of Cambridge International Examinations 2005 2 (a) rope extended/held/across stream; rope marked/knotted at 0.5 m intervals; measuring stick placed into stream vertically/to bed/depth measured every 0.5 m across stream; also credit points if on diagram 3 @ 1 mark [3] (b) (i) 2 marks for correct plotting depth at 490, 390 and 0 with line joining all points; max 1 if not to 0 at B max 1 if no line 2 @ 1 mark max 1 mark if one incorrect point 0 marks if 2 incorrect points [2] (ii) general pattern e.g. shallow at A and gradually becoming deeper/depth increases then decreases from A to B; 2 @ 1 mark max 1 mark for list specific comment or data e.g. deepest area at 2 m /steeper gradient before B/not uniform change/irregular change credit dev for 2nd mark [2] (c) (i) for a more reliable/more representative/accurate /average result; 1 @ 1 mark [1] (ii) 10m divided by average time (secs)/10m (i.e. distance) divided by Average Time (secs) 1 @ 1 mark [1] (iii) complete graph at 0.36 and 0.31; tolerance 2 mm 2 marks for correct height of bars 1 mark for correct width with division at 2.75 3 @ 1 mark [3] (d) (i) description: e.g. first 1.5 m is shallower with lower velocity; central area is the deepest and the fastest water; credit use of depth/velocity data explanation: e.g. friction of the riverbed slows down the water/deeper water can overcome the frictional drag so faster flow of water; 4 @ 1 mark res 1 for description res. 1 for explanation [4] (ii) object is restricted from free flow by water plants; restricted by rocks etc.; student error in timing; effects of wind 2 @ 1 mark [2]
Mark scheme, page 7
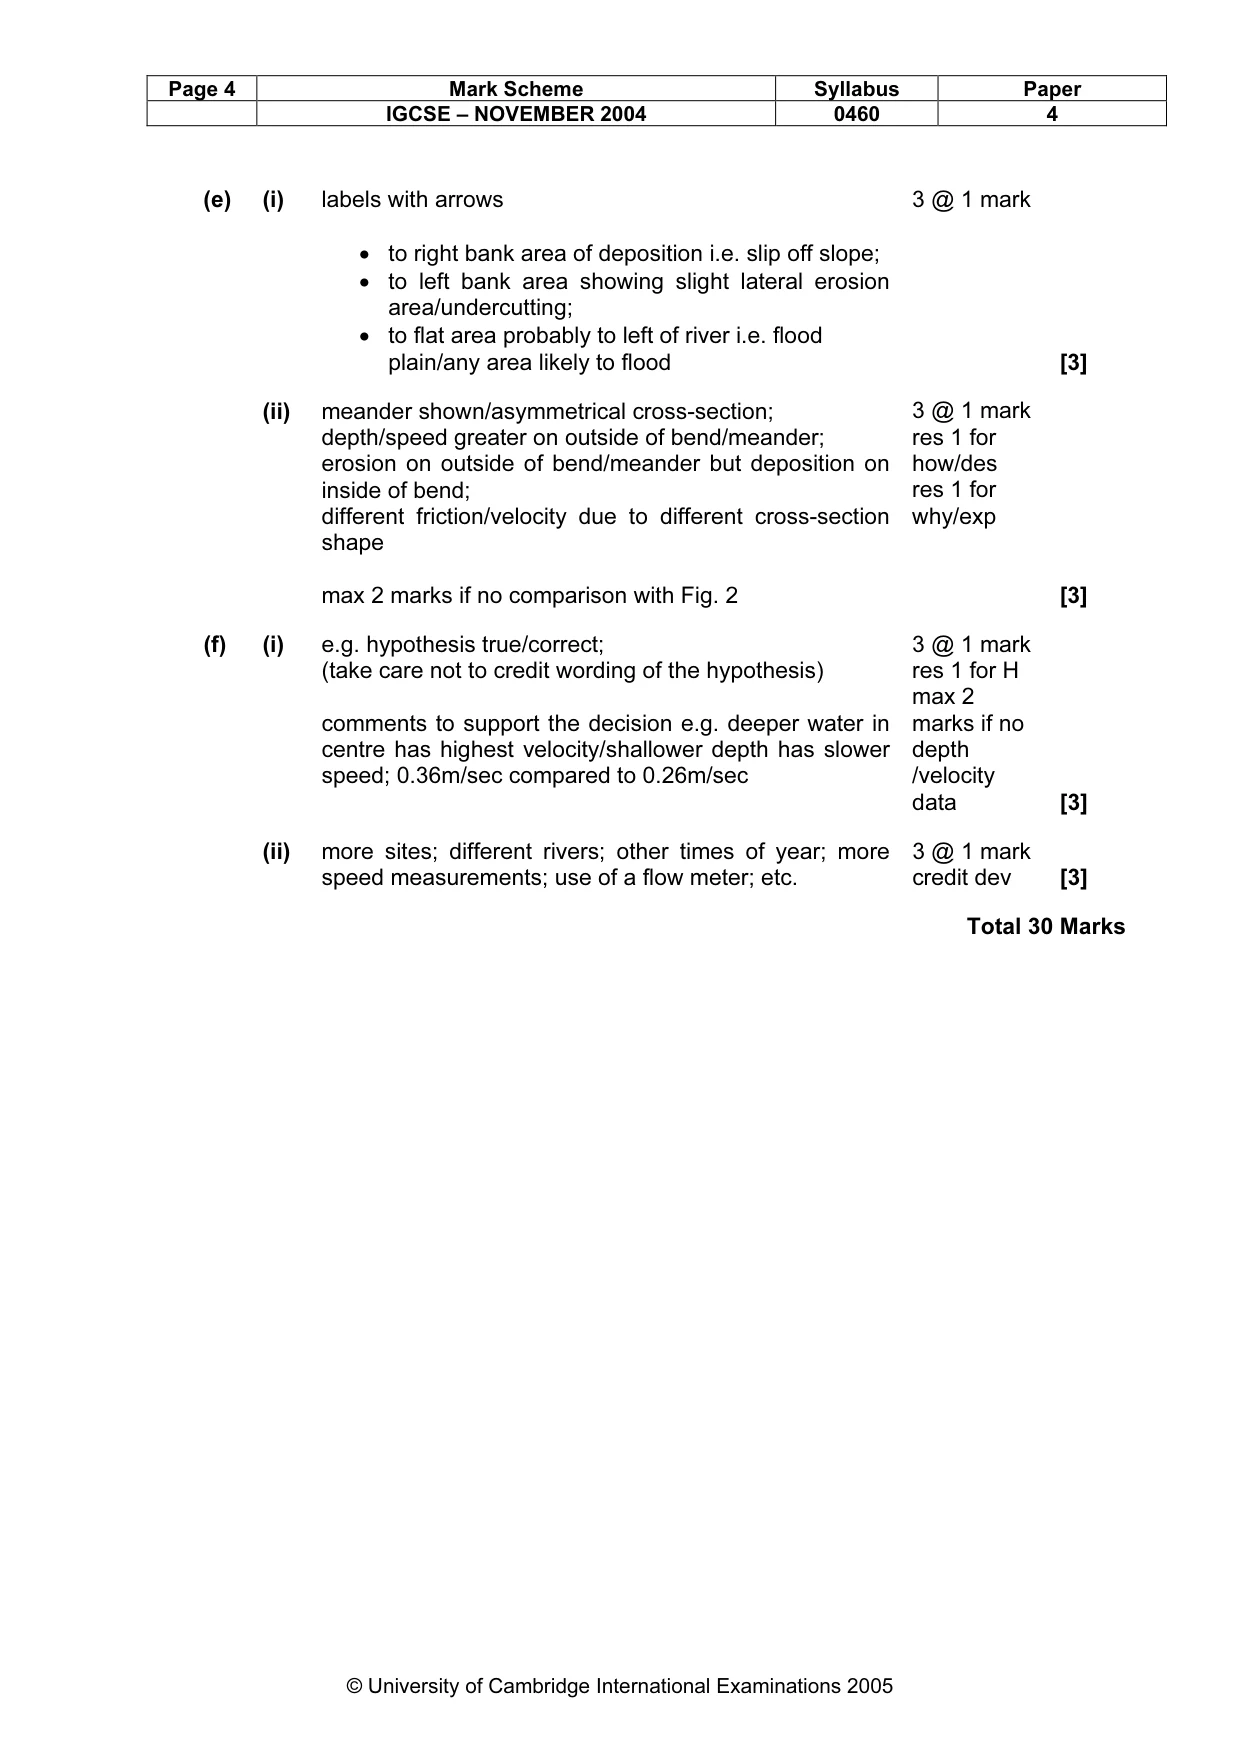
Page 4 Mark Scheme Syllabus Paper IGCSE – NOVEMBER 2004 0460 4 © University of Cambridge International Examinations 2005 (e) (i) labels with arrows • to right bank area of deposition i.e. slip off slope; • to left bank area showing slight lateral erosion area/undercutting; • to flat area probably to left of river i.e. flood plain/any area likely to flood 3 @ 1 mark [3] (ii) meander shown/asymmetrical cross-section; depth/speed greater on outside of bend/meander; erosion on outside of bend/meander but deposition on inside of bend; different friction/velocity due to different cross-section shape max 2 marks if no comparison with Fig. 2 3 @ 1 mark res 1 for how/des res 1 for why/exp [3] (f) (i) e.g. hypothesis true/correct; (take care not to credit wording of the hypothesis) comments to support the decision e.g. deeper water in centre has highest velocity/shallower depth has slower speed; 0.36m/sec compared to 0.26m/sec 3 @ 1 mark res 1 for H max 2 marks if no depth /velocity data [3] (ii) more sites; different rivers; other times of year; more speed measurements; use of a flow meter; etc. 3 @ 1 mark credit dev [3] Total 30 Marks