Cambridge IGCSE Geography 0460 — 2004 May/June Paper 4 · Variant 1
0460/41/M/J/04
The question paper and its mark scheme, free to read here and free to download. This is Cambridge’s own paper, exactly as it was sat.
Question paper4 pages
Mark scheme
No mark scheme is in the library for this paper.
Paper as text
Question paper, page 1
This document consists of 4 printed pages and 1 insert. SP (DR) S59893/2 © UCLES 2004 [Turn over UNIVERSITY OF CAMBRIDGE INTERNATIONAL EXAMINATIONS International General Certificate of Secondary Education GEOGRAPHY 0460/04 Paper 4 Alternative to Coursework May/June 2004 1 hour 45 minutes Additional Materials: Answer Booklet/Paper Ruler Protractor Calculator READ THESE INSTRUCTIONS FIRST If you have been given an Answer Booklet, follow the instructions on the front cover of the Booklet. Write your Centre number, candidate number and name on all the work you hand in. Write in dark blue or black pen on both sides of the paper. You may use a soft pencil for any diagrams, graphs or rough working. Do not use staples, paper clips, highlighters, glue or correction fluid. Answer all questions. At the end of the examination, fasten all your work securely together. The number of marks is given in brackets [ ] at the end of each question or part question. Sketch maps and diagrams should be drawn whenever they serve to illustrate an answer. The insert contains all the Figures and Tables referred to in the Questions. www.XtremePapers.com
Question paper, page 2
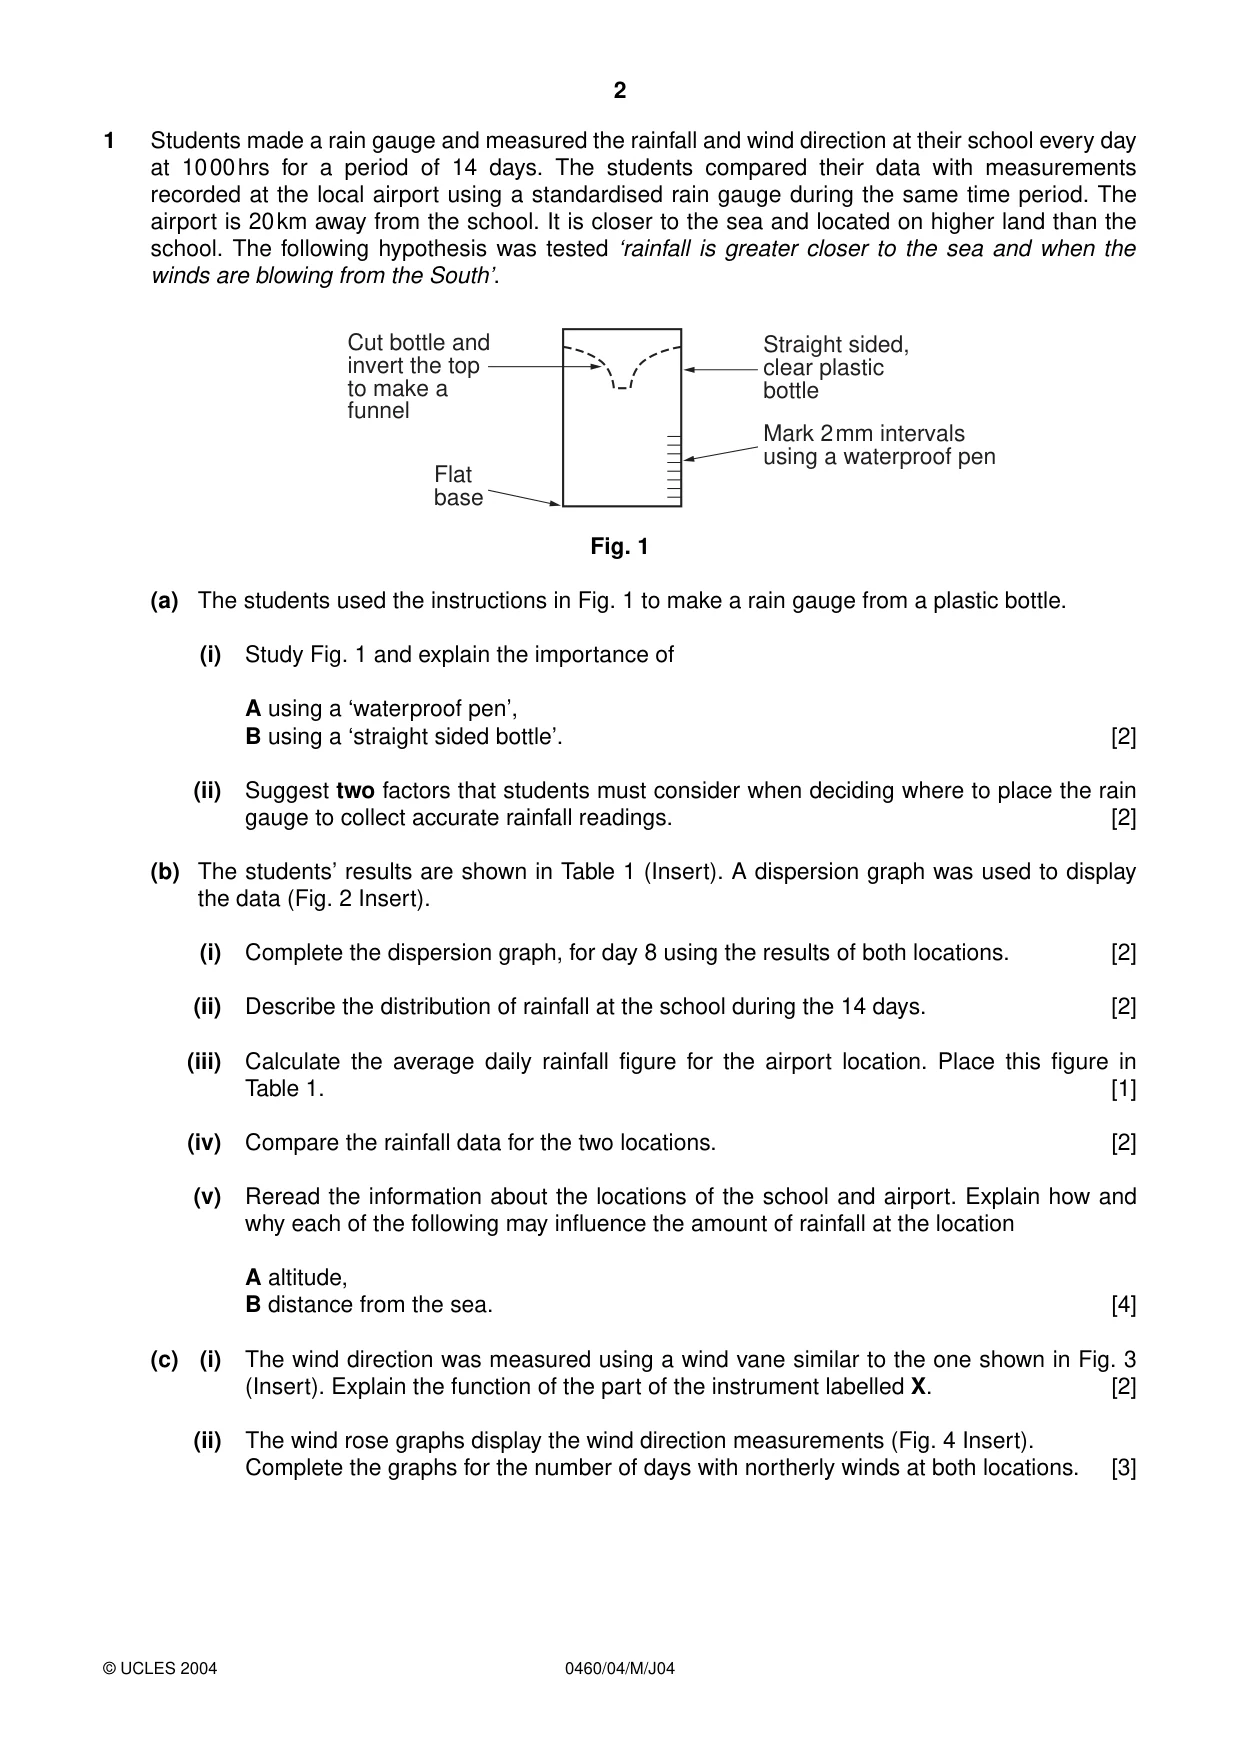
2 0460/04/M/J04 1 Students made a rain gauge and measured the rainfall and wind direction at their school every day at 1000hrs for a period of 14 days. The students compared their data with measurements recorded at the local airport using a standardised rain gauge during the same time period. The airport is 20km away from the school. It is closer to the sea and located on higher land than the school. The following hypothesis was tested ‘rainfall is greater closer to the sea and when the winds are blowing from the South’. Fig. 1 (a) The students used the instructions in Fig. 1 to make a rain gauge from a plastic bottle. (i) Study Fig. 1 and explain the importance of A using a ‘waterproof pen’, B using a ‘straight sided bottle’. [2] (ii) Suggest two factors that students must consider when deciding where to place the rain gauge to collect accurate rainfall readings. [2] (b) The students’ results are shown in Table 1 (Insert). A dispersion graph was used to display the data (Fig. 2 Insert). (i) Complete the dispersion graph, for day 8 using the results of both locations. [2] (ii) Describe the distribution of rainfall at the school during the 14 days. [2] (iii) Calculate the average daily rainfall figure for the airport location. Place this figure in Table 1. [1] (iv) Compare the rainfall data for the two locations. [2] (v) Reread the information about the locations of the school and airport. Explain how and why each of the following may influence the amount of rainfall at the location A altitude, B distance from the sea. [4] (c) (i) The wind direction was measured using a wind vane similar to the one shown in Fig. 3 (Insert). Explain the function of the part of the instrument labelled X. [2] (ii) The wind rose graphs display the wind direction measurements (Fig. 4 Insert). Complete the graphs for the number of days with northerly winds at both locations. [3] Cut bottle and invert the top to make a funnel Flat base Straight sided, clear plastic bottle Mark 2mm intervals using a waterproof pen © UCLES 2004
Question paper, page 3
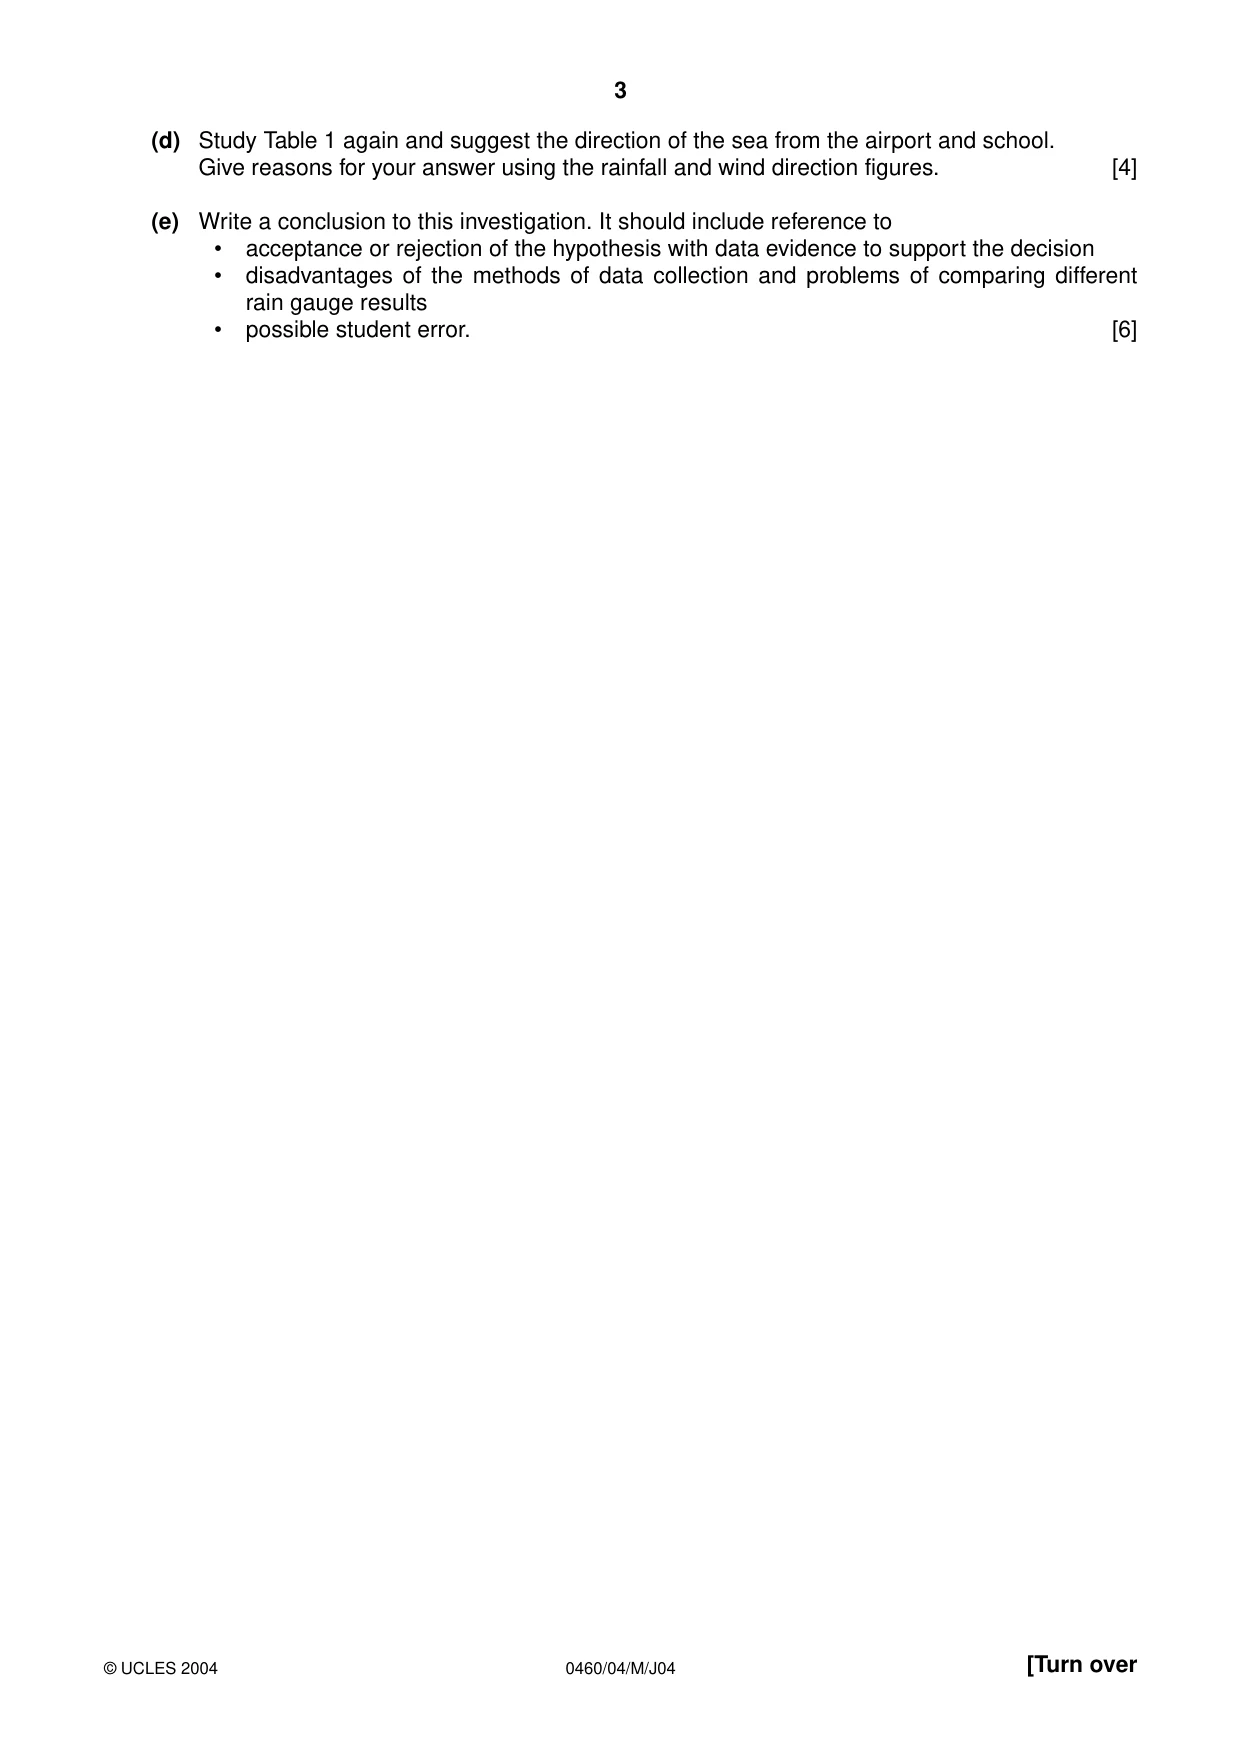
3 0460/04/M/J04 [Turn over (d) Study Table 1 again and suggest the direction of the sea from the airport and school. Give reasons for your answer using the rainfall and wind direction figures. [4] (e) Write a conclusion to this investigation. It should include reference to • acceptance or rejection of the hypothesis with data evidence to support the decision • disadvantages of the methods of data collection and problems of comparing different rain gauge results • possible student error. [6] © UCLES 2004
Question paper, page 4
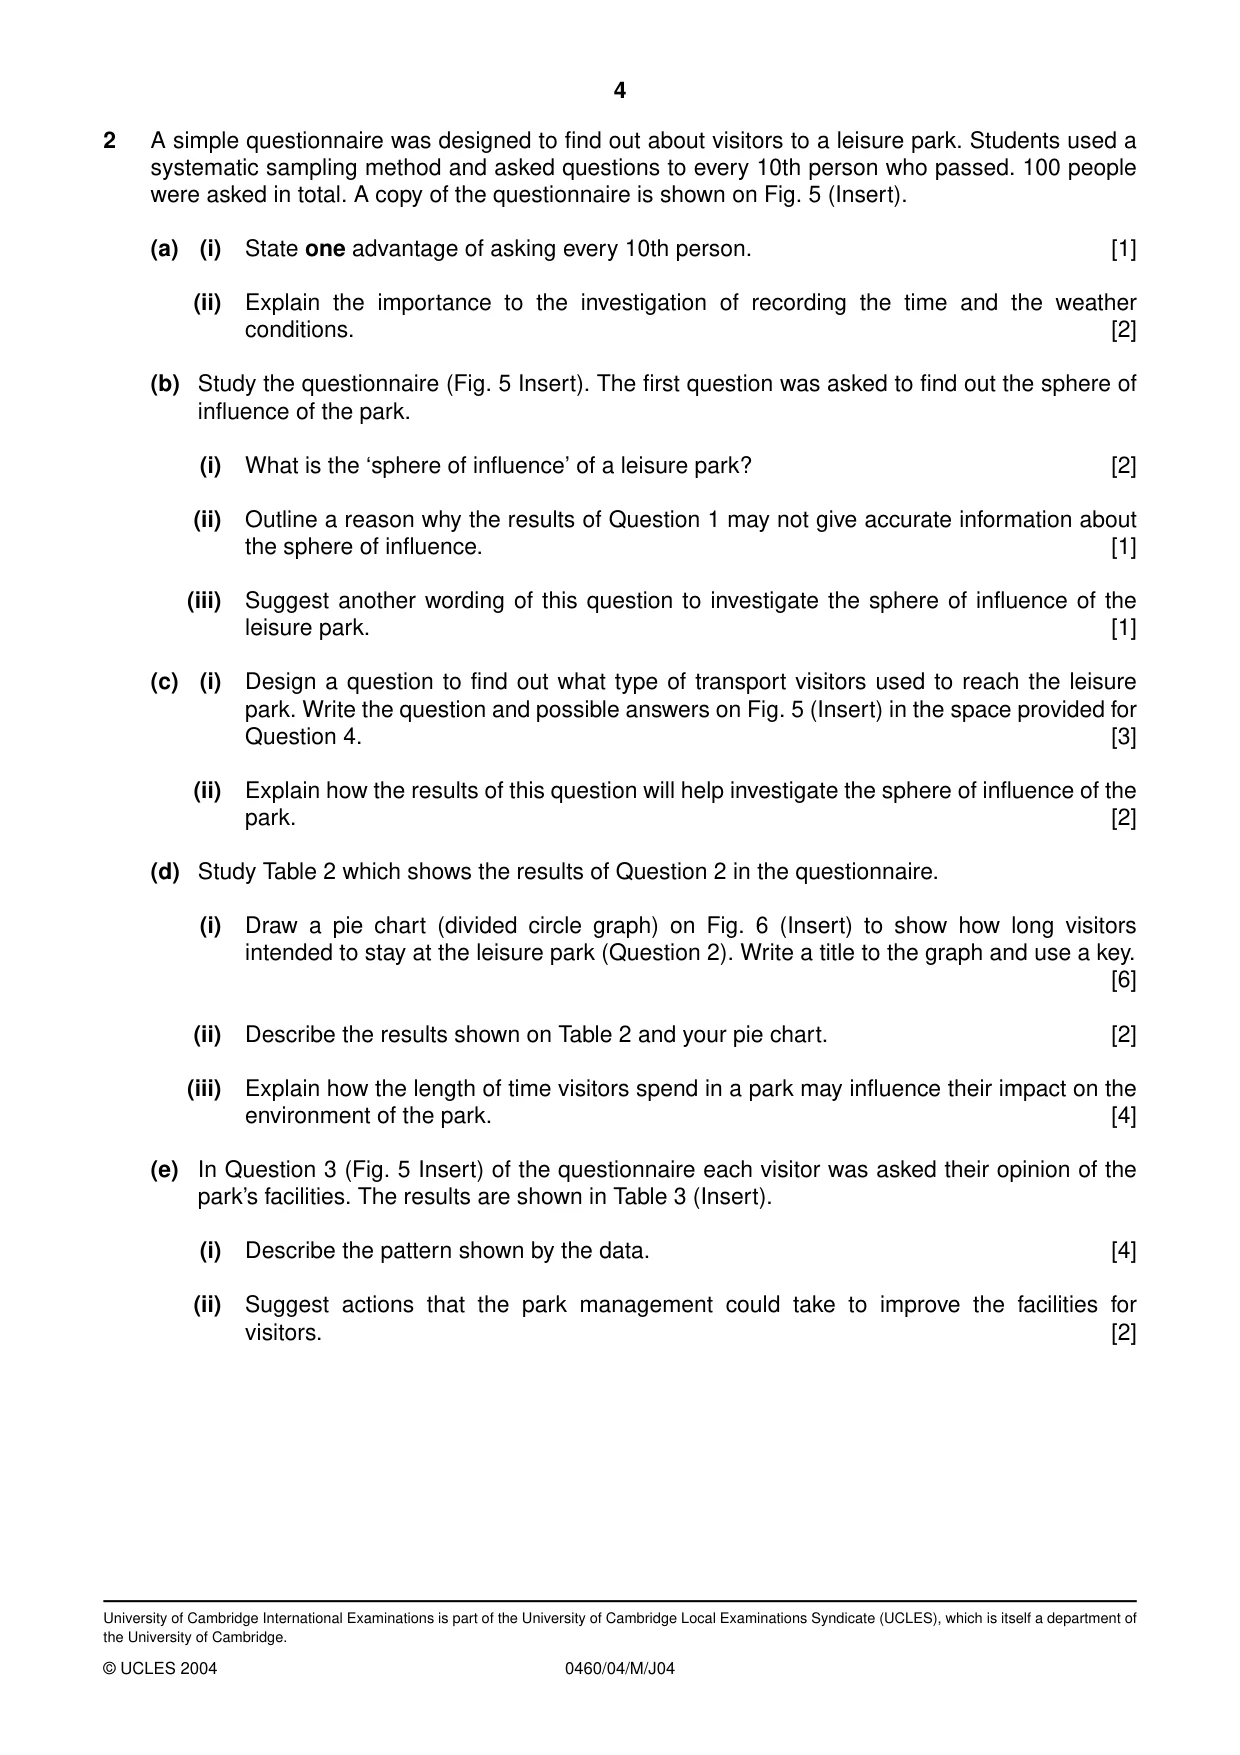
4 0460/04/M/J04 2 A simple questionnaire was designed to find out about visitors to a leisure park. Students used a systematic sampling method and asked questions to every 10th person who passed. 100 people were asked in total. A copy of the questionnaire is shown on Fig. 5 (Insert). (a) (i) State one advantage of asking every 10th person. [1] (ii) Explain the importance to the investigation of recording the time and the weather conditions. [2] (b) Study the questionnaire (Fig. 5 Insert). The first question was asked to find out the sphere of influence of the park. (i) What is the ‘sphere of influence’ of a leisure park? [2] (ii) Outline a reason why the results of Question 1 may not give accurate information about the sphere of influence. [1] (iii) Suggest another wording of this question to investigate the sphere of influence of the leisure park. [1] (c) (i) Design a question to find out what type of transport visitors used to reach the leisure park. Write the question and possible answers on Fig. 5 (Insert) in the space provided for Question 4. [3] (ii) Explain how the results of this question will help investigate the sphere of influence of the park. [2] (d) Study Table 2 which shows the results of Question 2 in the questionnaire. (i) Draw a pie chart (divided circle graph) on Fig. 6 (Insert) to show how long visitors intended to stay at the leisure park (Question 2). Write a title to the graph and use a key. [6] (ii) Describe the results shown on Table 2 and your pie chart. [2] (iii) Explain how the length of time visitors spend in a park may influence their impact on the environment of the park. [4] (e) In Question 3 (Fig. 5 Insert) of the questionnaire each visitor was asked their opinion of the park’s facilities. The results are shown in Table 3 (Insert). (i) Describe the pattern shown by the data. [4] (ii) Suggest actions that the park management could take to improve the facilities for visitors. [2] © UCLES 2004 University of Cambridge International Examinations is part of the University of Cambridge Local Examinations Syndicate (UCLES), which is itself a department of the University of Cambridge.