Cambridge IGCSE Geography 0460 — 2003 Oct/Nov Paper 2 · Variant 1
0460/21/O/N/03
The question paper and its mark scheme, free to read here and free to download. This is Cambridge’s own paper, exactly as it was sat.
Question paper12 pages

Mark scheme
No mark scheme is in the library for this paper.
Paper as text
Question paper, page 1
This document consists of 10 printed pages, 2 blank pages and an insert. MML 3328 5/02 S40495/2 © CIE 2003 [Turn over CAMBRIDGE INTERNATIONAL EXAMINATIONS International General Certificate of Secondary Education GEOGRAPHY 0460/02 Paper 2 October/November 2003 1 hour 45 minutes Additional Materials: Answer Booklet/Paper READ THESE INSTRUCTIONS FIRST If you have been given an Answer Booklet, follow the instructions on the front cover of the Booklet. Write your Centre number, candidate number and name on all the work you hand in. Write in dark blue or black pen on both sides of the paper. You may use a soft pencil for any diagrams, graphs or rough working. Do not use staples, paper clips, highlighters, glue or correction fluid. Answer any three questions. At the end of the examination, fasten all your work securely together. The number of marks is given in brackets [ ] at the end of each question or part question. Sketch maps and diagrams should be drawn whenever they serve to illustrate an answer. The insert contains Photograph A for Question 2 and Fig. 8 for Question 6. UNIVERSITY of CAMBRIDGE Local Examinations Syndicate www.XtremePapers.com
Question paper, page 2
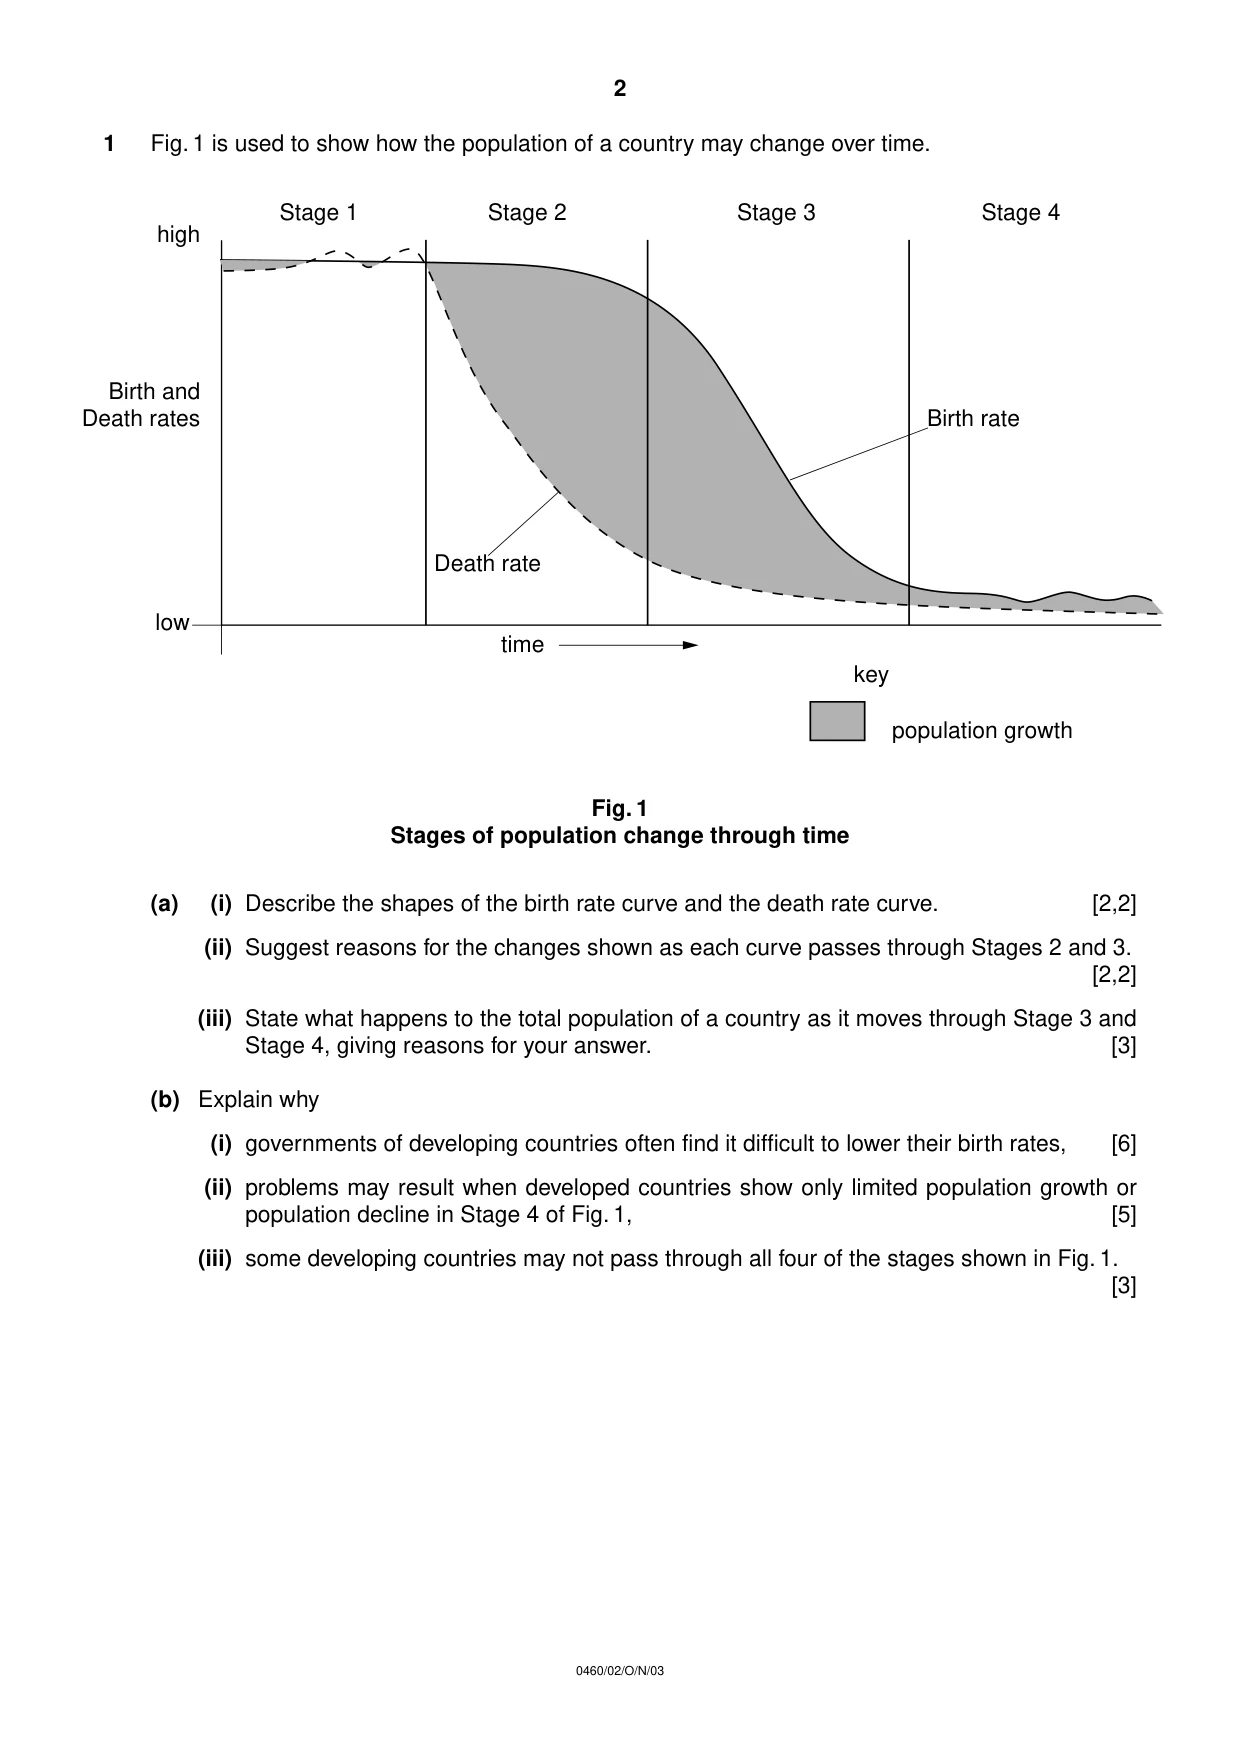
1 Fig. 1 is used to show how the population of a country may change over time. Fig. 1 Stages of population change through time (a) (i) Describe the shapes of the birth rate curve and the death rate curve. [2,2] (ii) Suggest reasons for the changes shown as each curve passes through Stages 2 and 3. [2,2] (iii) State what happens to the total population of a country as it moves through Stage 3 and Stage 4, giving reasons for your answer. [3] (b) Explain why (i) governments of developing countries often find it difficult to lower their birth rates, [6] (ii) problems may result when developed countries show only limited population growth or population decline in Stage 4 of Fig. 1, [5] (iii) some developing countries may not pass through all four of the stages shown in Fig. 1. [3] 2 0460/02/O/N/03 Death rate Birth rate high Birth and Death rates low time Stage 1 Stage 2 Stage 3 Stage 4 key population growth
Question paper, page 3
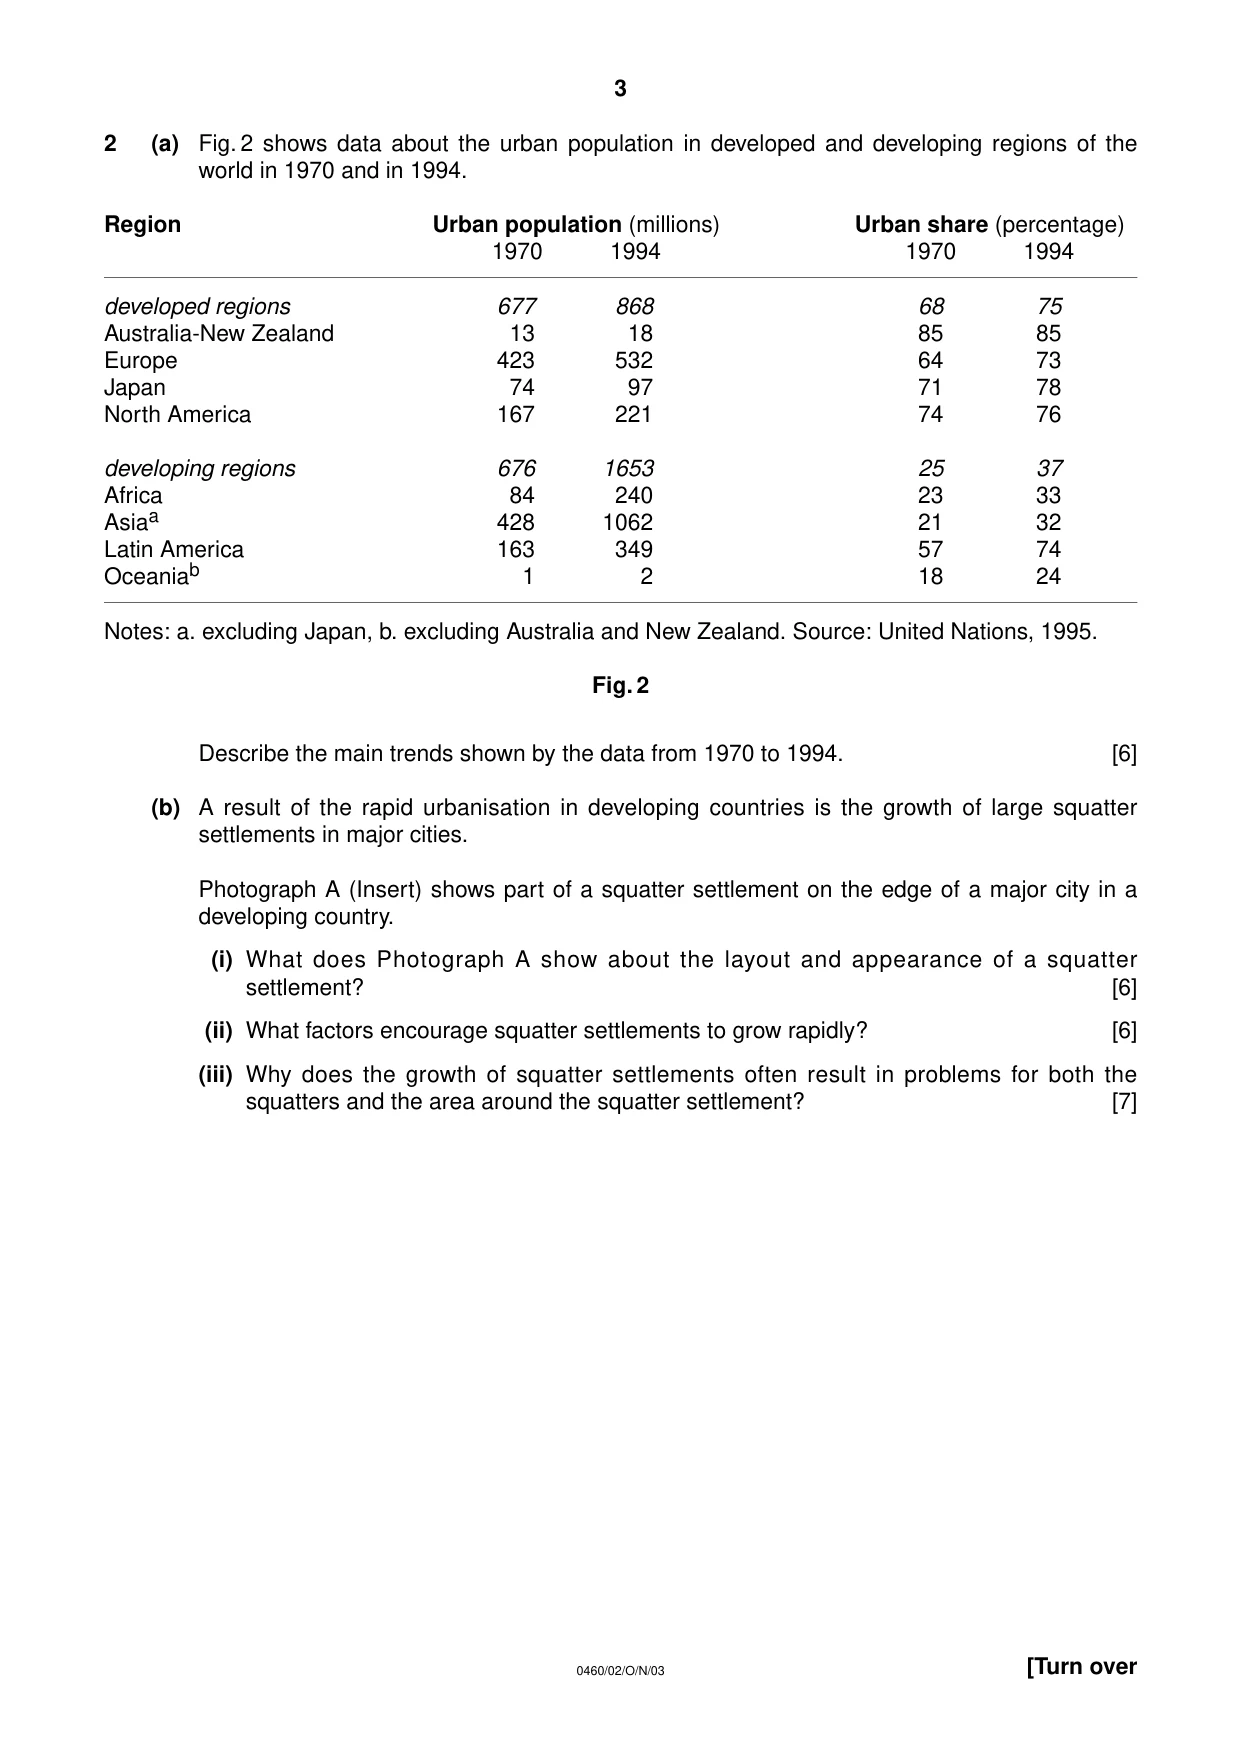
2 (a) Fig. 2 shows data about the urban population in developed and developing regions of the world in 1970 and in 1994. Region Urban population (millions) Urban share (percentage) 1970 1994 1970 1994 developed regions 677 868 68 75 Australia-New Zealand 13 18 85 85 Europe 423 532 64 73 Japan 74 97 71 78 North America 167 221 74 76 developing regions 676 1653 25 37 Africa 84 240 23 33 Asiaa 428 1062 21 32 Latin America 163 349 57 74 Oceaniab 1 2 18 24 Notes: a. excluding Japan, b. excluding Australia and New Zealand. Source: United Nations, 1995. Fig. 2 Describe the main trends shown by the data from 1970 to 1994. [6] (b) A result of the rapid urbanisation in developing countries is the growth of large squatter settlements in major cities. Photograph A (Insert) shows part of a squatter settlement on the edge of a major city in a developing country. (i) What does Photograph A show about the layout and appearance of a squatter settlement? [6] (ii) What factors encourage squatter settlements to grow rapidly? [6] (iii) Why does the growth of squatter settlements often result in problems for both the squatters and the area around the squatter settlement? [7] 3 [Turn over 0460/02/O/N/03
Question paper, page 4
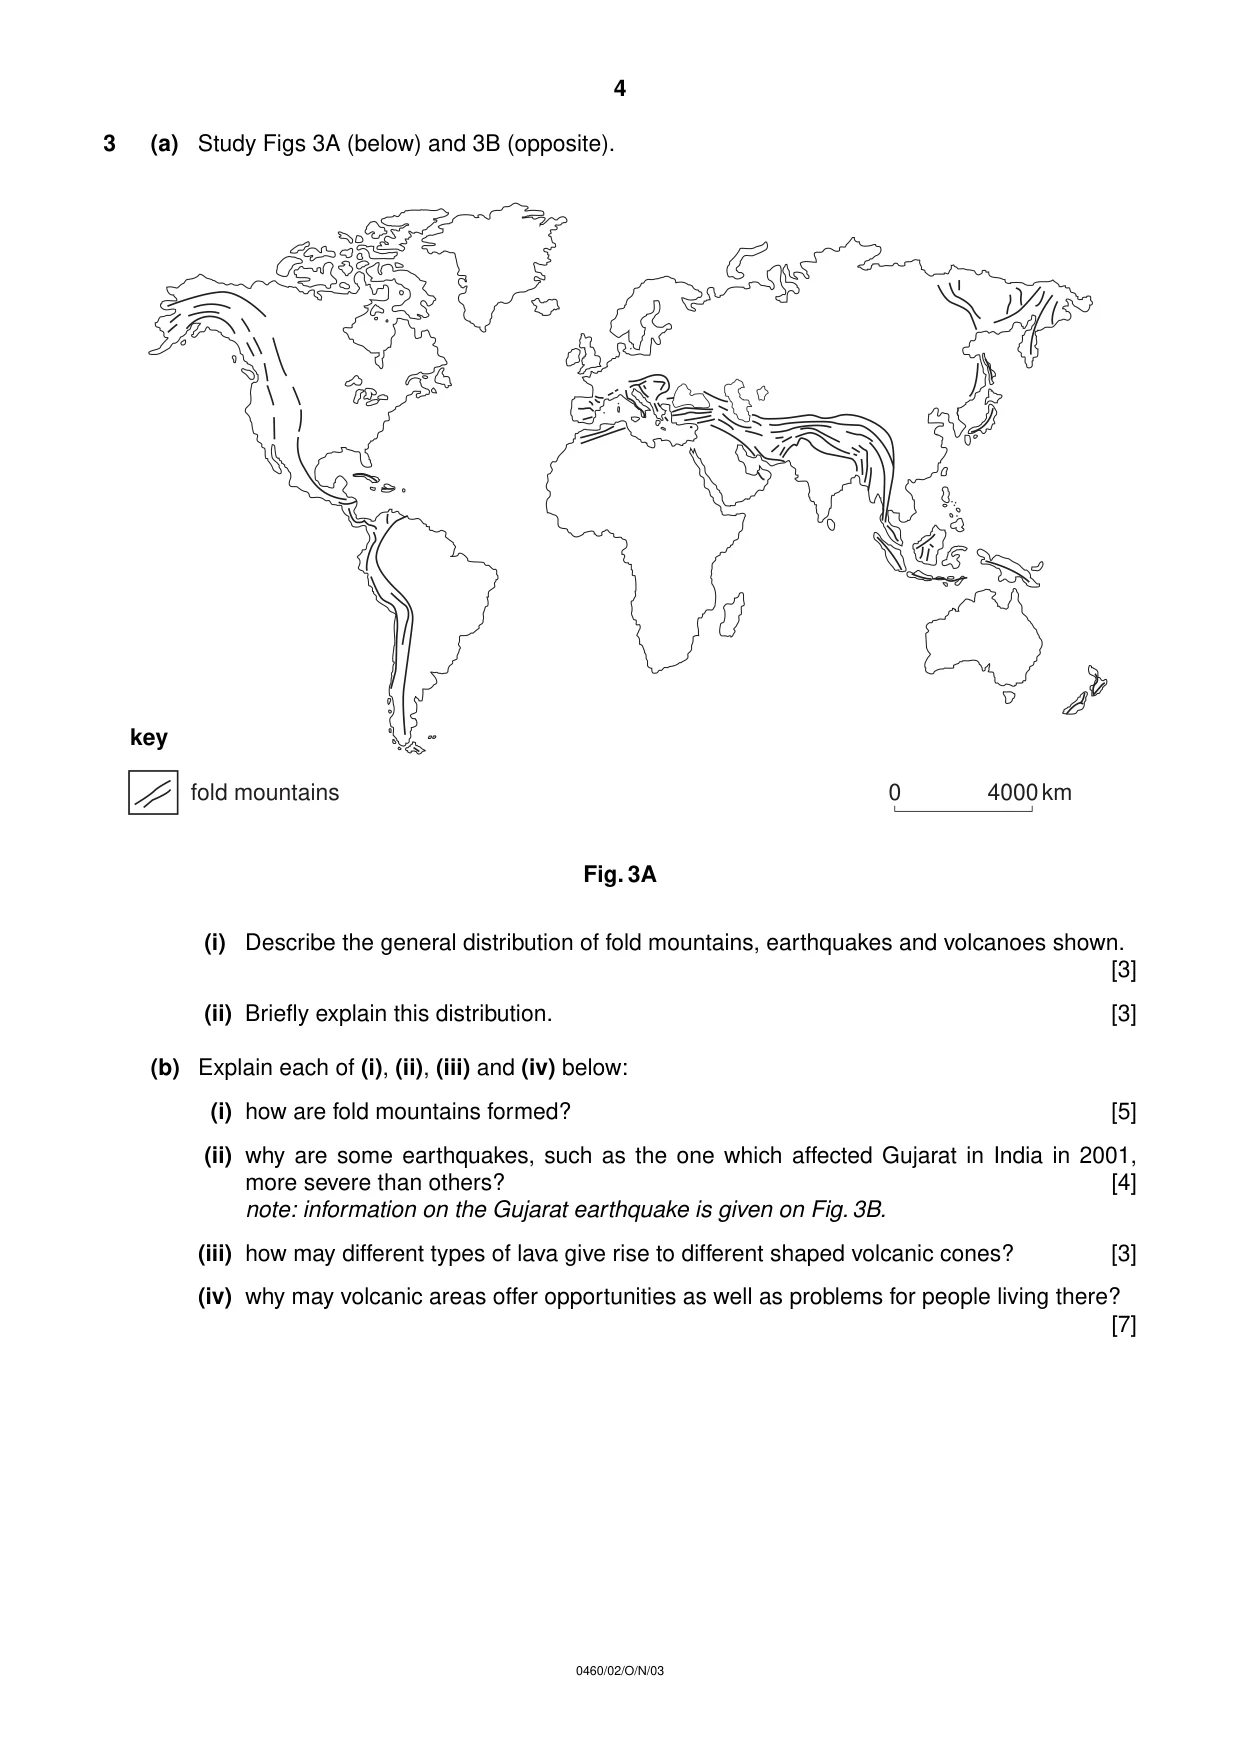
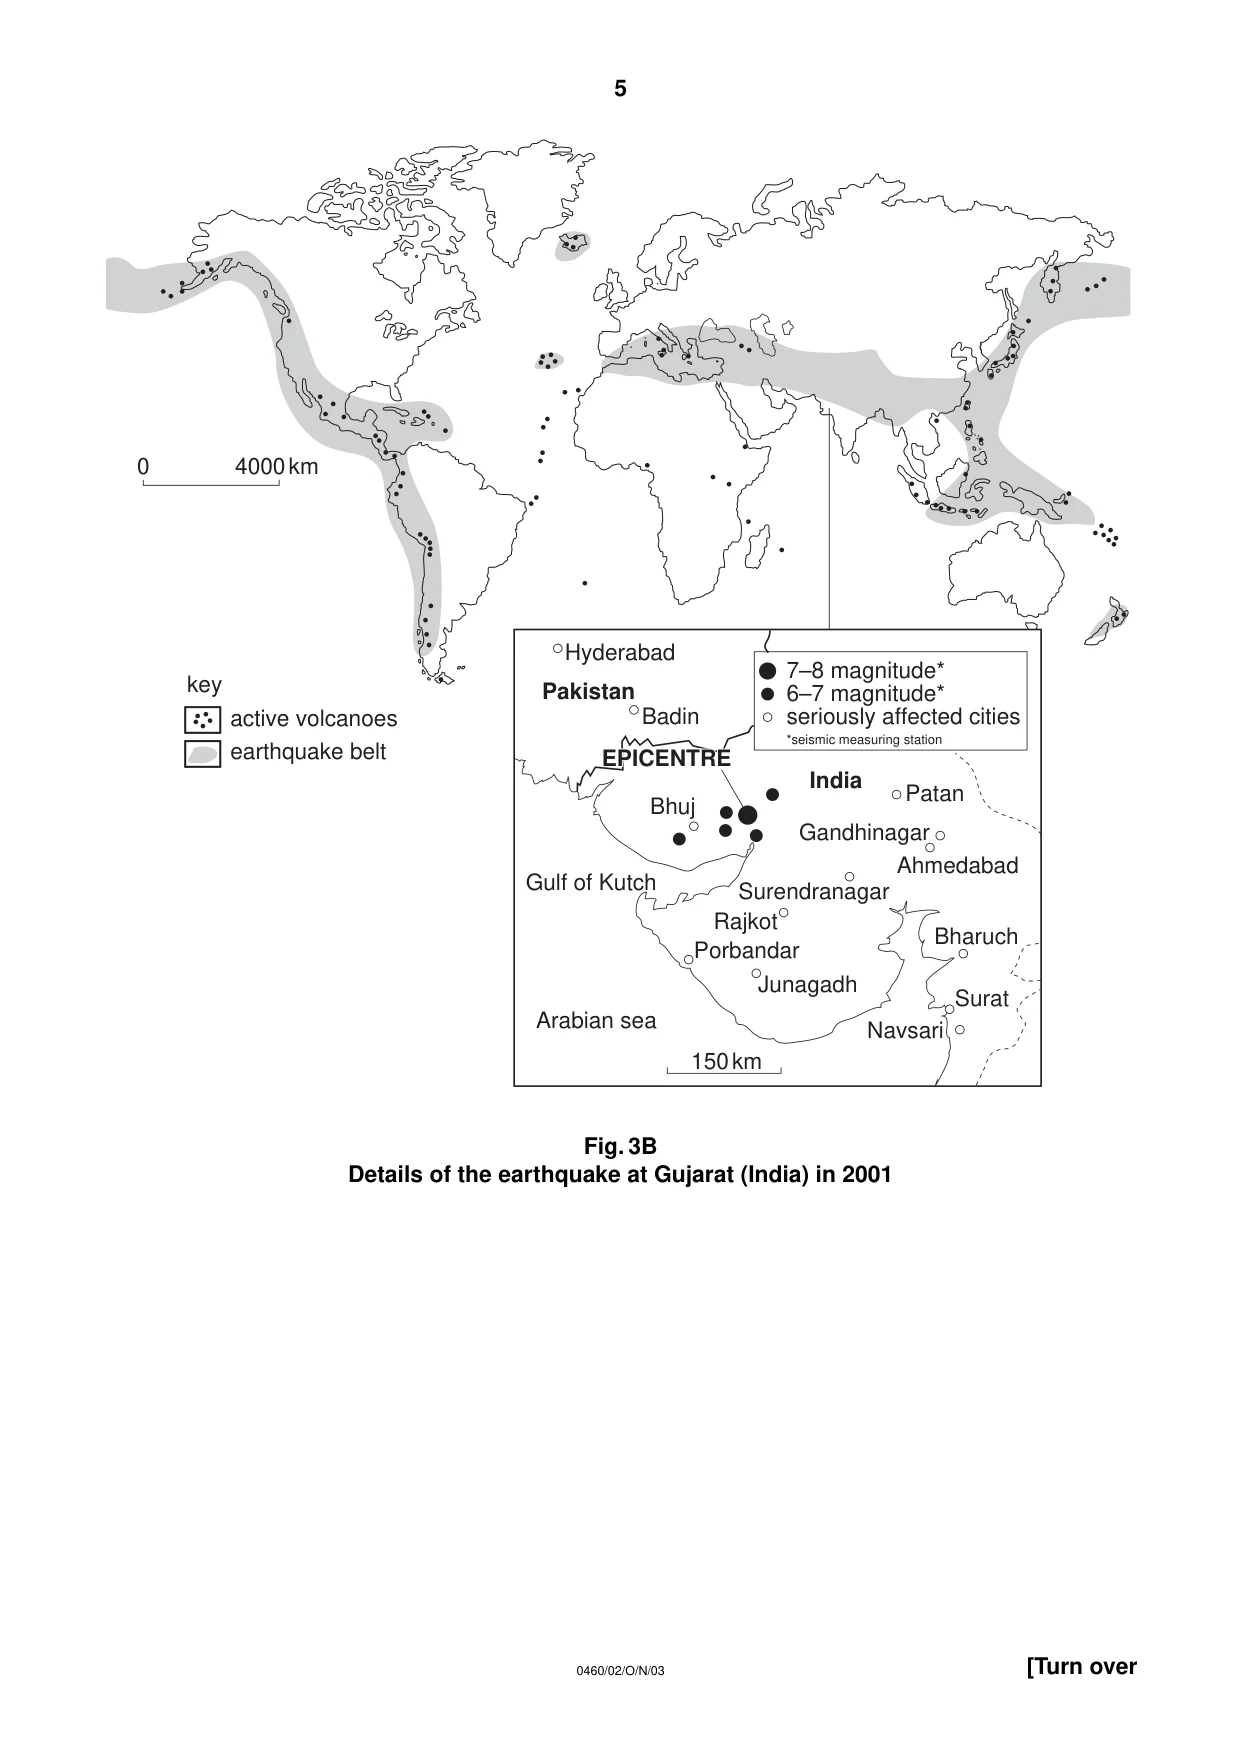
3 (a) Study Figs 3A (below) and 3B (opposite). Fig. 3A (i) Describe the general distribution of fold mountains, earthquakes and volcanoes shown. [3] (ii) Briefly explain this distribution. [3] (b) Explain each of (i), (ii), (iii) and (iv) below: (i) how are fold mountains formed? [5] (ii) why are some earthquakes, such as the one which affected Gujarat in India in 2001, more severe than others? [4] note: information on the Gujarat earthquake is given on Fig. 3B. (iii) how may different types of lava give rise to different shaped volcanic cones? [3] (iv) why may volcanic areas offer opportunities as well as problems for people living there? [7] 0 fold mountains key 4000 km 4 0460/02/O/N/03
Question paper, page 5
Fig. 3B Details of the earthquake at Gujarat (India) in 2001 0 key active volcanoes earthquake belt 4000 km Hyderabad seriously affected cities *seismic measuring station Badin Patan Ahmedabad Rajkot Bharuch Surat Porbandar Gandhinagar Navsari Junagadh Surendranagar Bhuj EPICENTRE EPICENTRE 6–7 magnitude* 7–8 magnitude* Pakistan India Gulf of Kutch Arabian sea 150 km 5 [Turn over 0460/02/O/N/03
Question paper, page 6
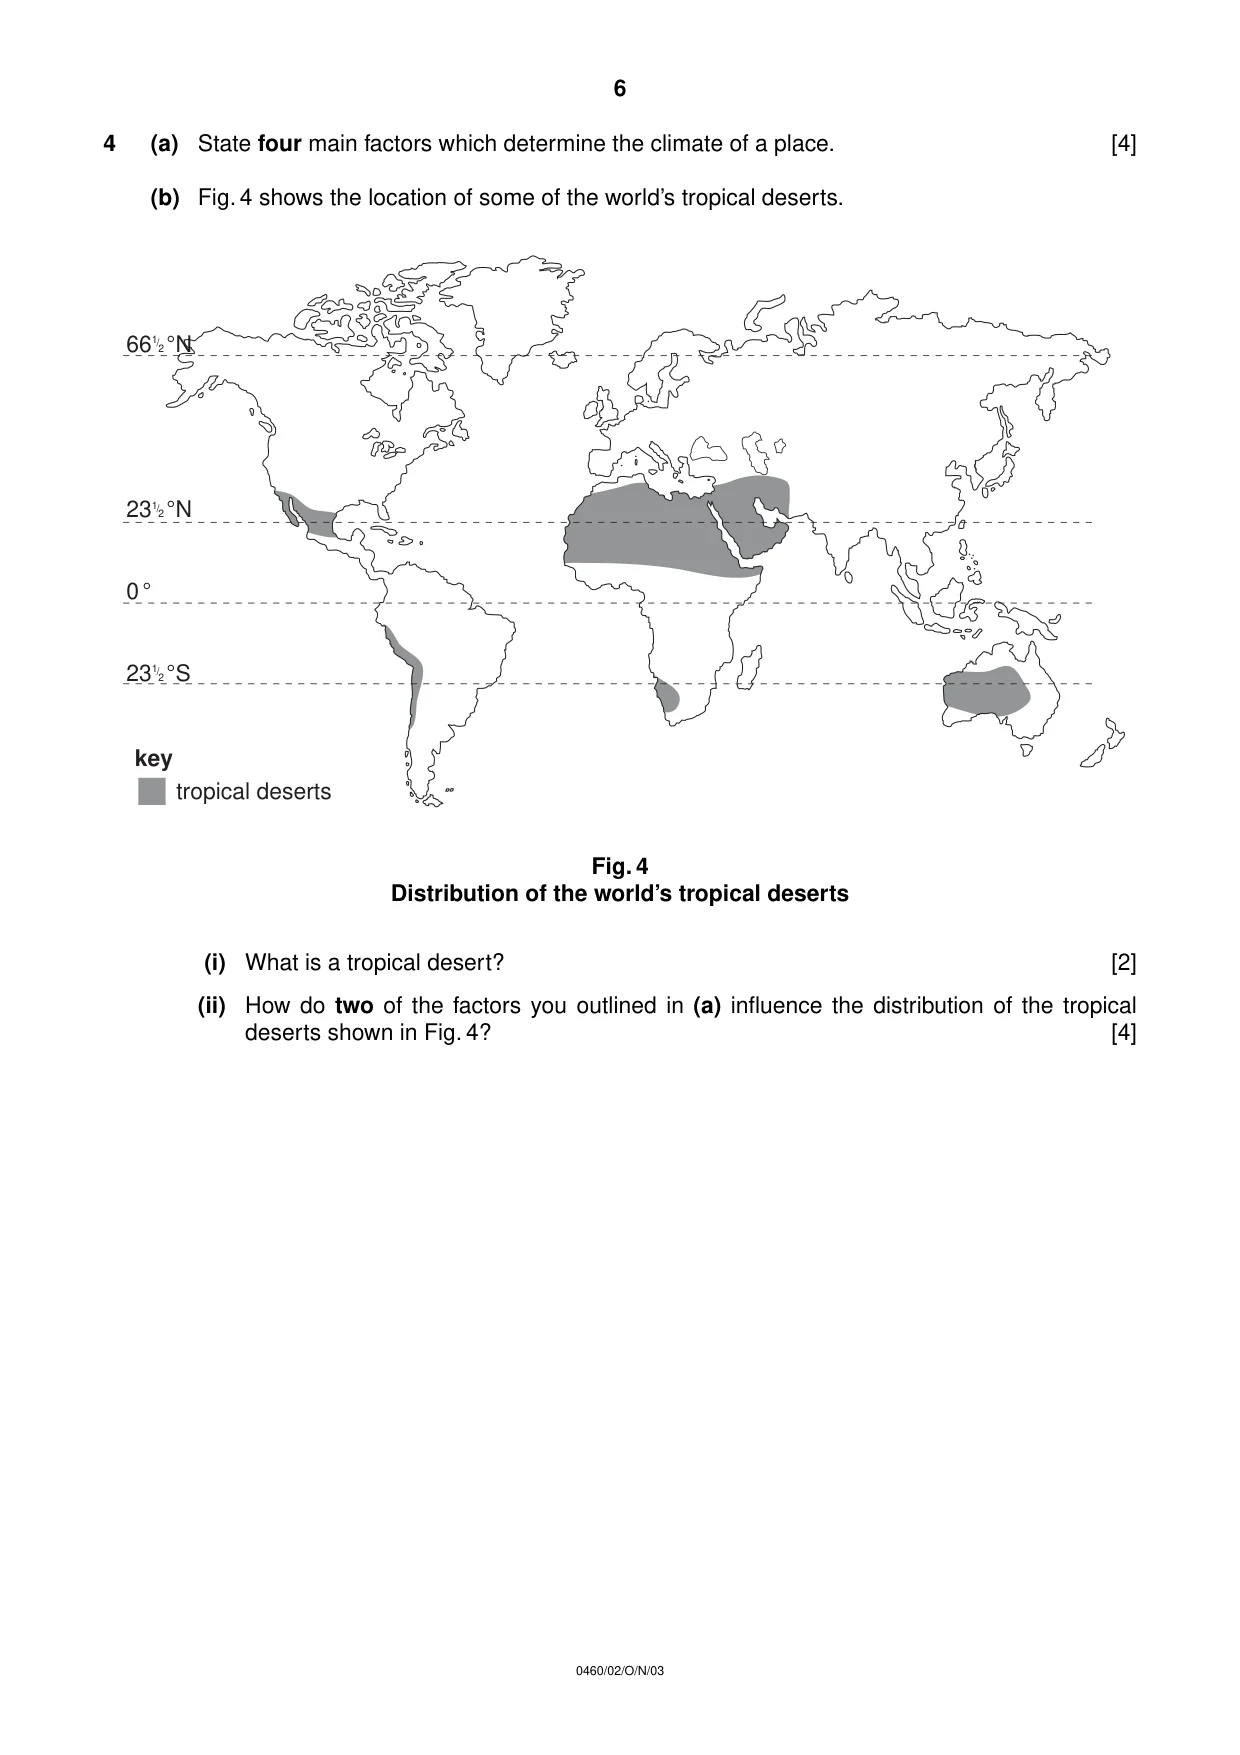
4 (a) State four main factors which determine the climate of a place. [4] (b) Fig. 4 shows the location of some of the world’s tropical deserts. Fig. 4 Distribution of the world’s tropical deserts (i) What is a tropical desert? [2] (ii) How do two of the factors you outlined in (a) influence the distribution of the tropical deserts shown in Fig. 4? [4] 23 1/2 °S 0 ° 231/2 °N 66 1/2 °N tropical deserts key 6 0460/02/O/N/03
Question paper, page 7
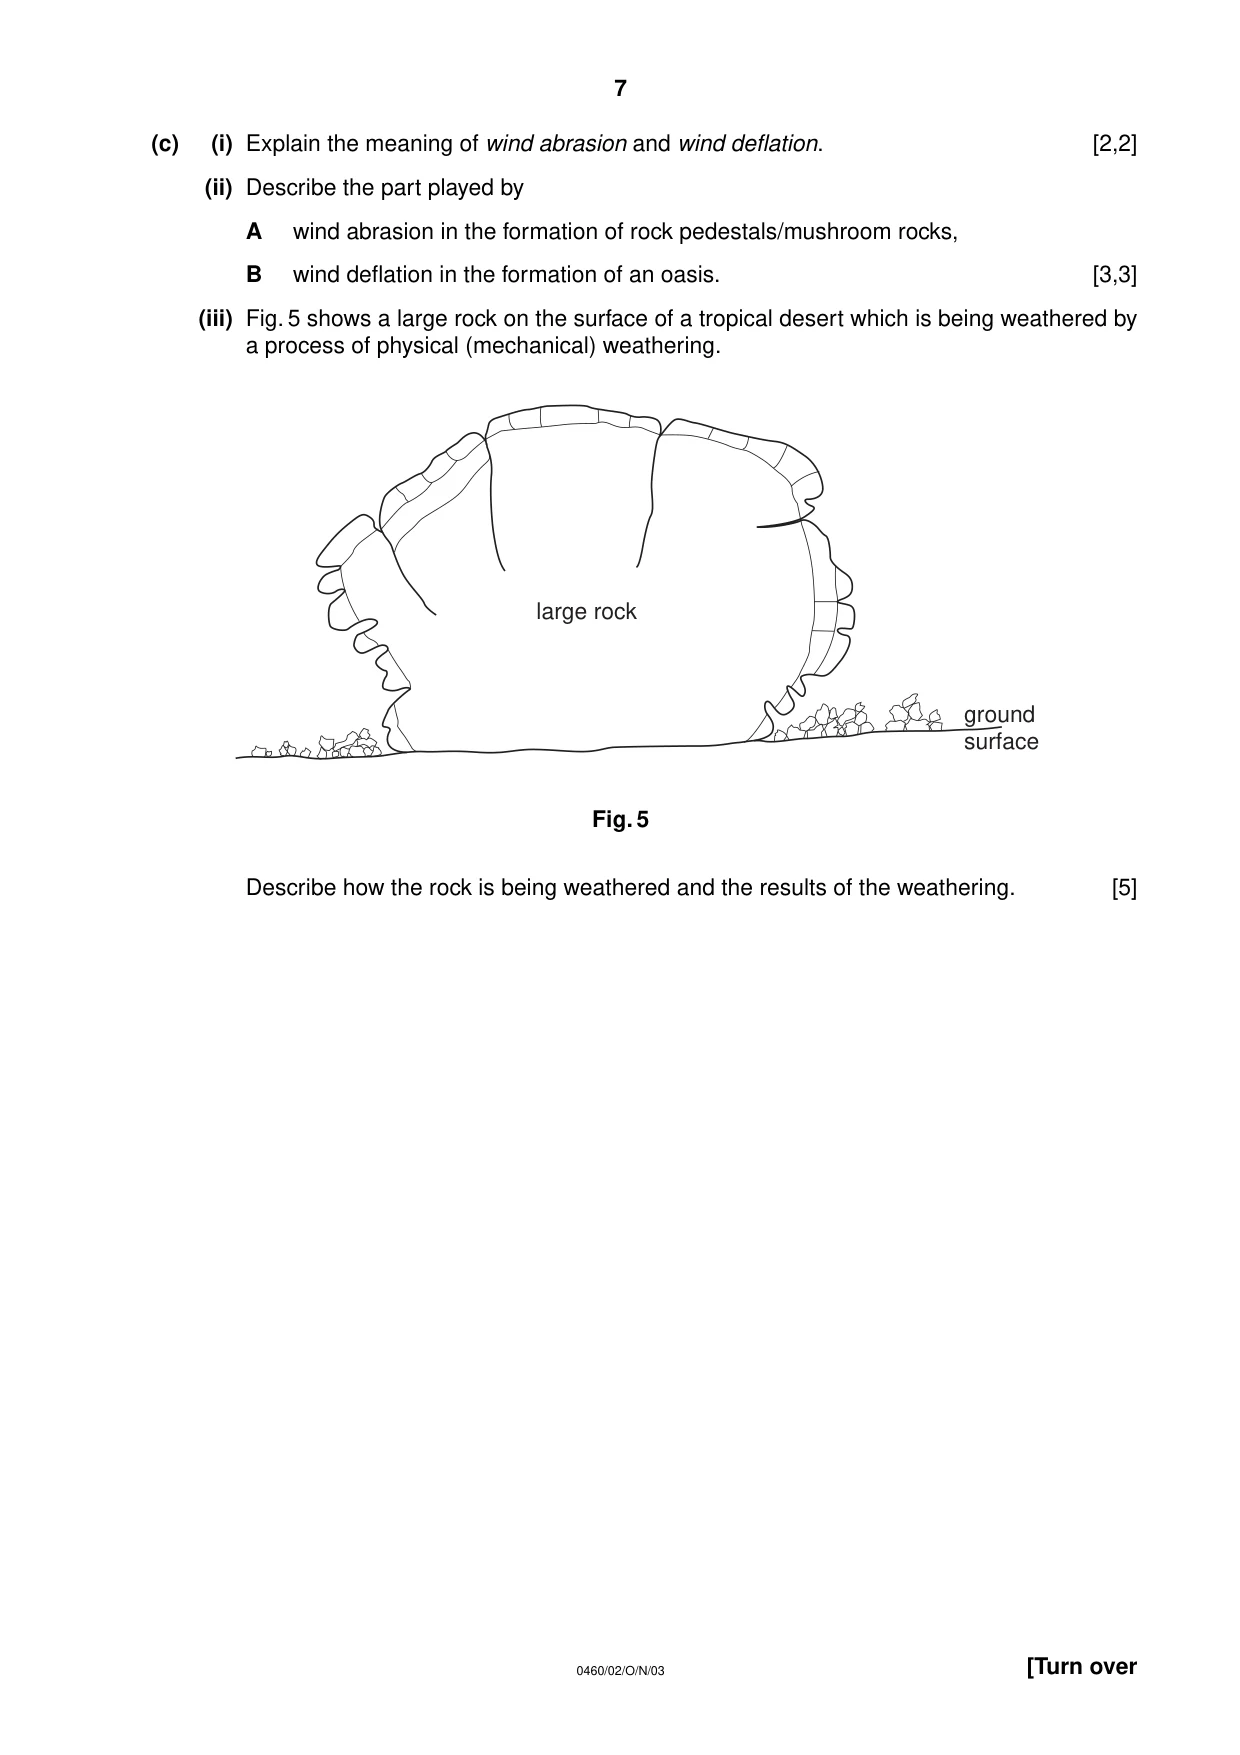
(c) (i) Explain the meaning of wind abrasion and wind deflation. [2,2] (ii) Describe the part played by A wind abrasion in the formation of rock pedestals/mushroom rocks, B wind deflation in the formation of an oasis. [3,3] (iii) Fig. 5 shows a large rock on the surface of a tropical desert which is being weathered by a process of physical (mechanical) weathering. Fig. 5 Describe how the rock is being weathered and the results of the weathering. [5] large rock ground surface 7 [Turn over 0460/02/O/N/03
Question paper, page 8
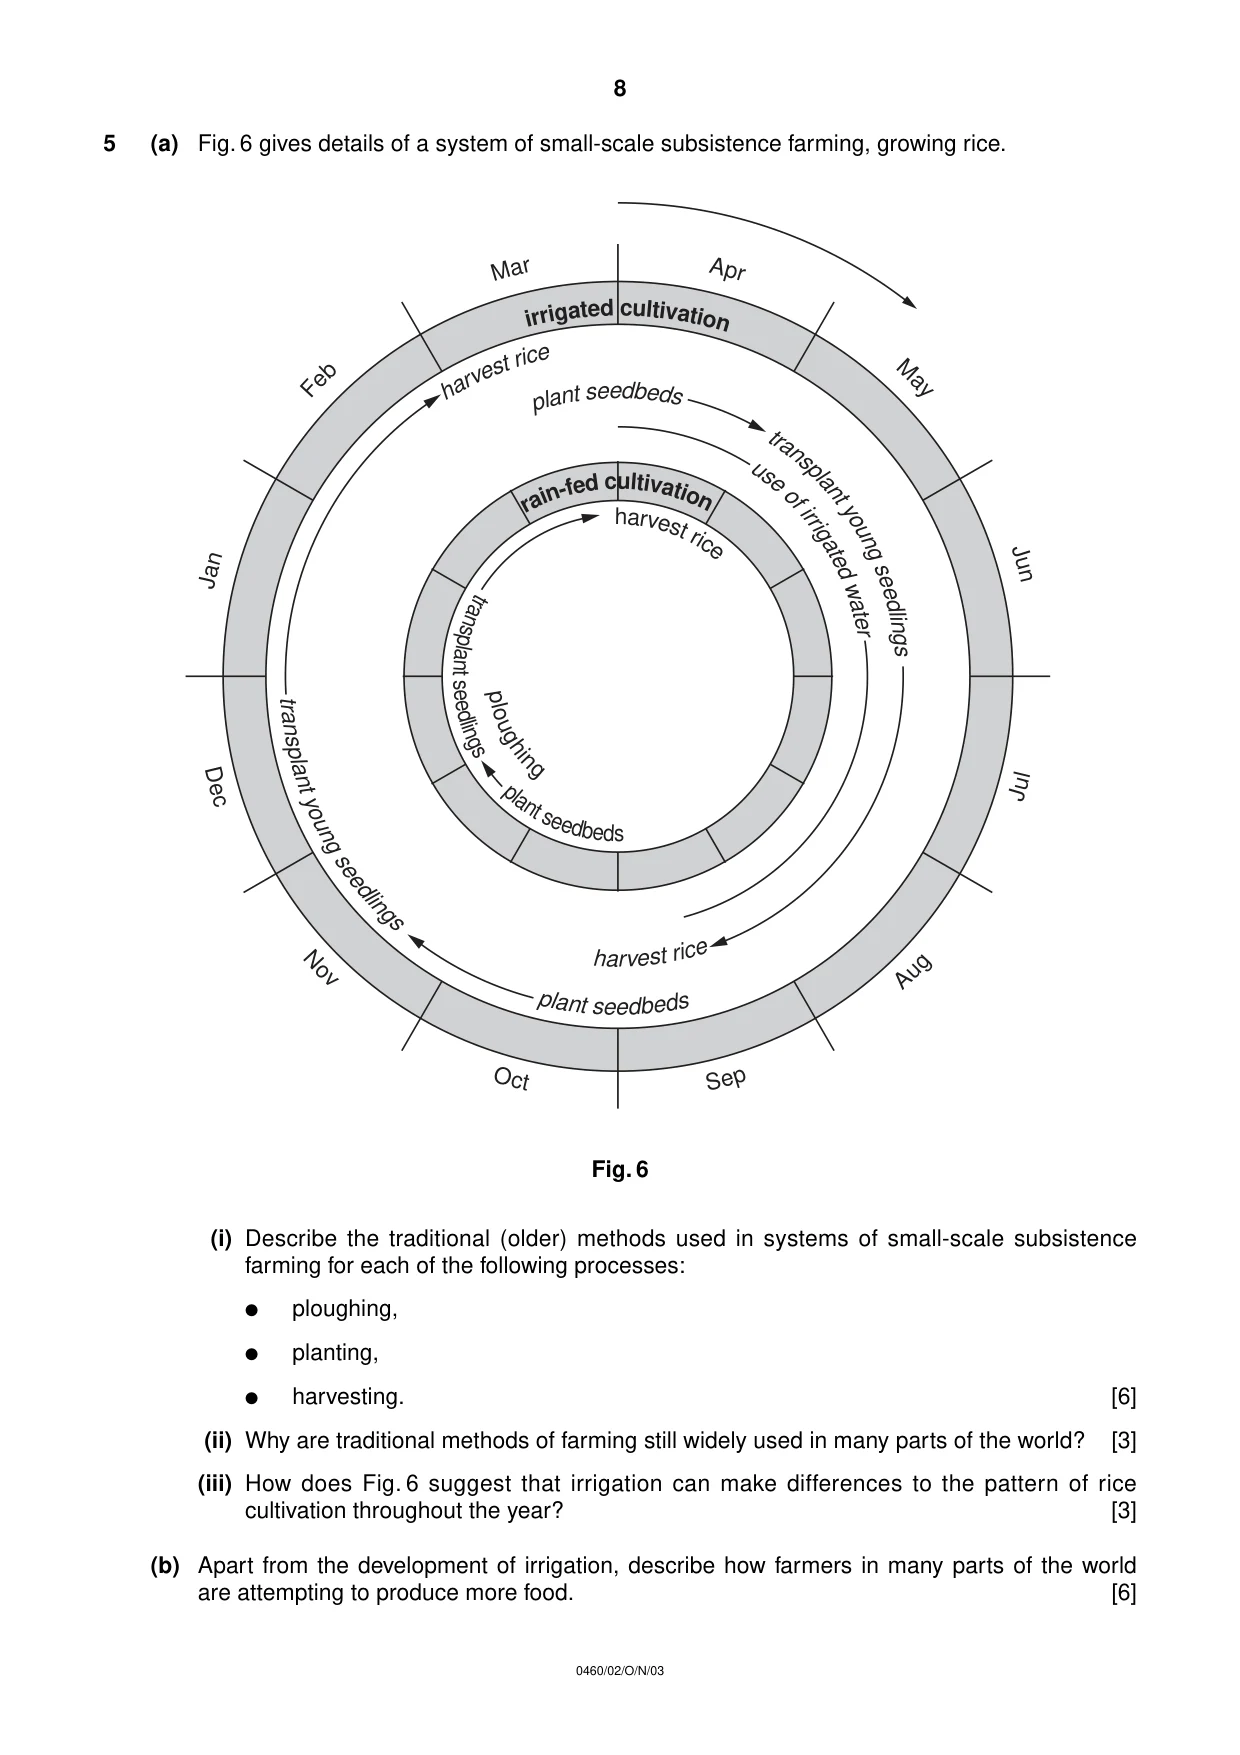
5 (a) Fig. 6 gives details of a system of small-scale subsistence farming, growing rice. Fig. 6 (i) Describe the traditional (older) methods used in systems of small-scale subsistence farming for each of the following processes: ● ploughing, ● planting, ● harvesting. [6] (ii) Why are traditional methods of farming still widely used in many parts of the world? [3] (iii) How does Fig. 6 suggest that irrigation can make differences to the pattern of rice cultivation throughout the year? [3] (b) Apart from the development of irrigation, describe how farmers in many parts of the world are attempting to produce more food. [6] Ja n Ju n Ma y Ap r Ma r Fe b Ju l De c No v Oc t Se p Au g irr ig at ed cu lti va ti on r a i n -f e d c u lt i v a ti o n ha rv es t r ic e pl an t se ed be ds tr an sp la nt yo un g se ed li ng s u s e of ir ri g at e d w at er tr an sp la nt yo un g se ed lin gs pl an t s ee db ed s h a r v e s t ri c e tr a n s p l a n t s e e d li n g s p l a n t s e e d b e d s ha rv es t ri ce p l o u g h i n g 8 0460/02/O/N/03
Question paper, page 9
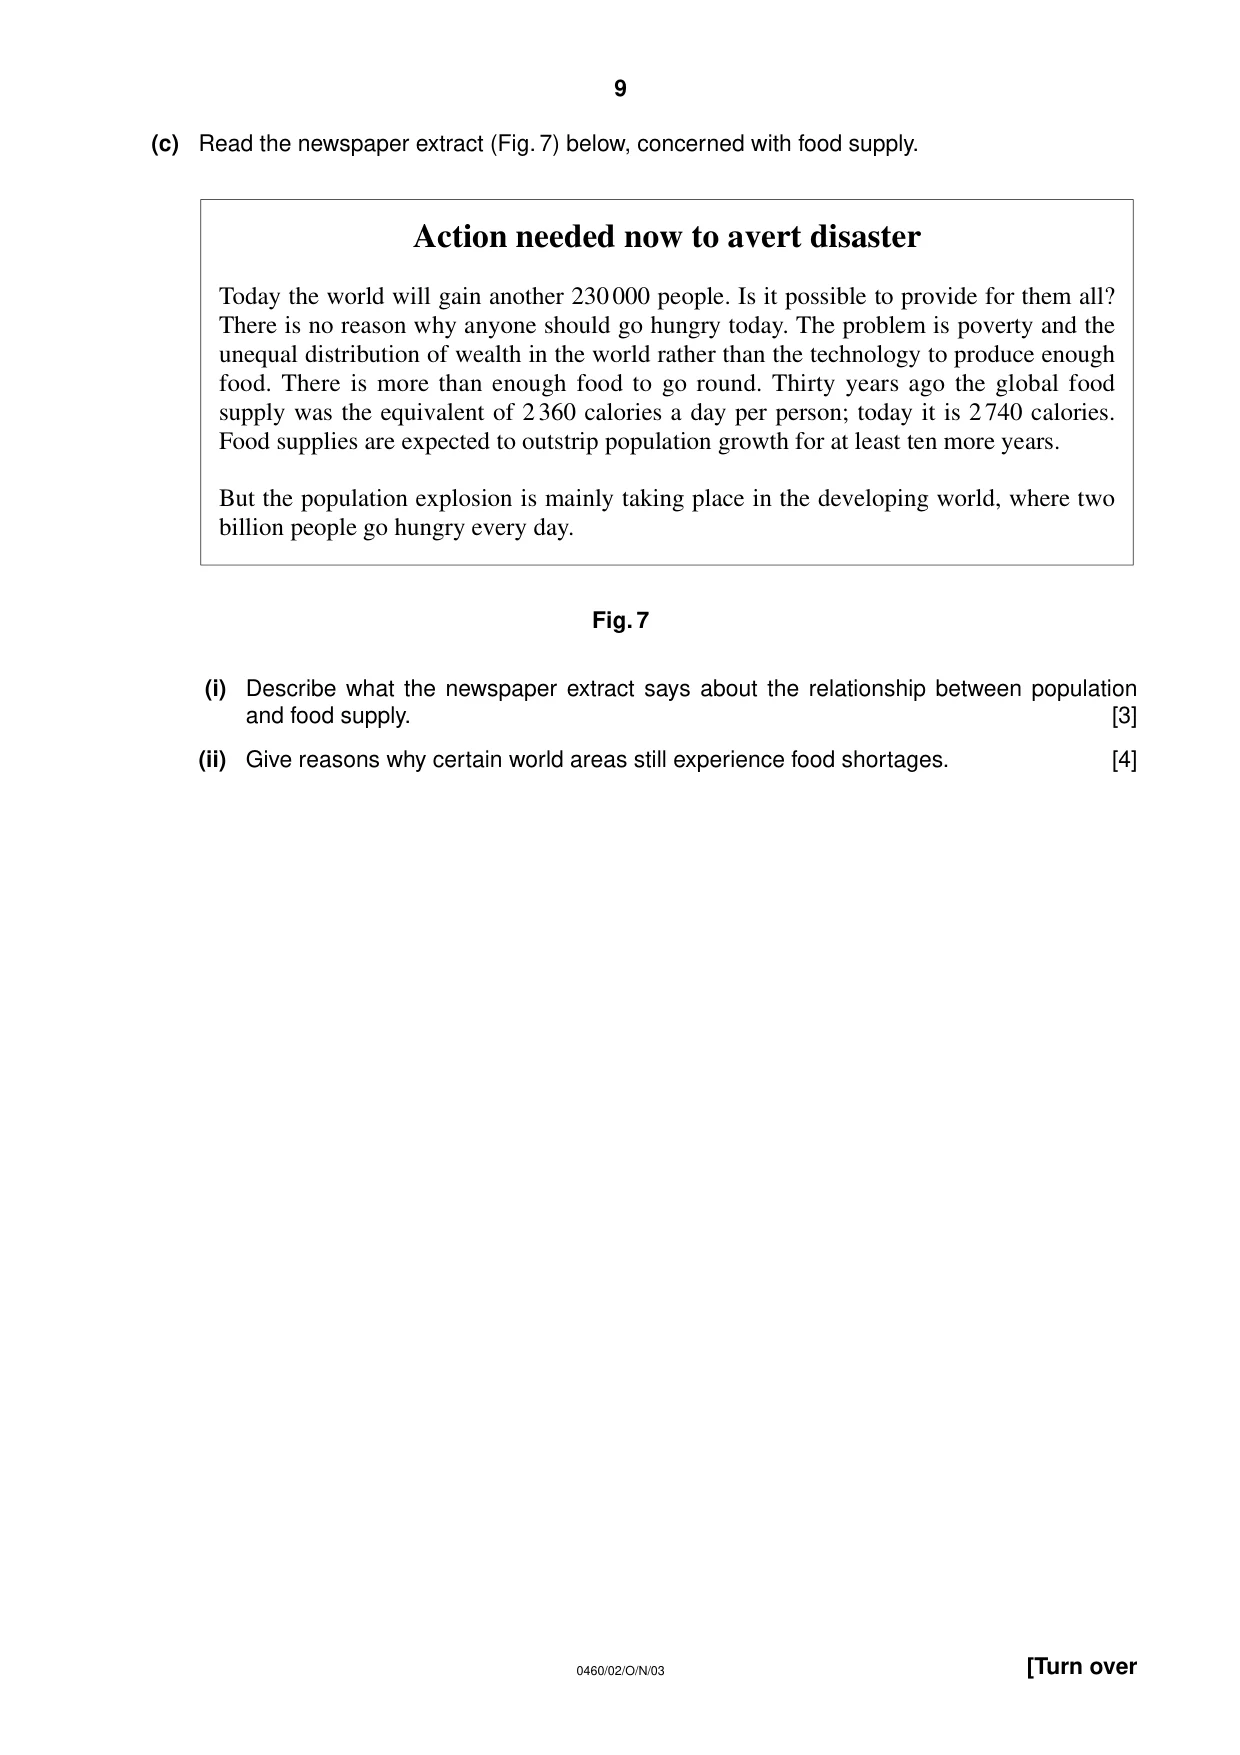
(c) Read the newspaper extract (Fig. 7) below, concerned with food supply. Fig. 7 (i) Describe what the newspaper extract says about the relationship between population and food supply. [3] (ii) Give reasons why certain world areas still experience food shortages. [4] Action needed now to avert disaster Today the world will gain another 230000 people. Is it possible to provide for them all? There is no reason why anyone should go hungry today. The problem is poverty and the unequal distribution of wealth in the world rather than the technology to produce enough food. There is more than enough food to go round. Thirty years ago the global food supply was the equivalent of 2360 calories a day per person; today it is 2740 calories. Food supplies are expected to outstrip population growth for at least ten more years. But the population explosion is mainly taking place in the developing world, where two billion people go hungry every day. 9 [Turn over 0460/02/O/N/03
Question paper, page 10
6 (a) Show how at least two of the following have influenced the development of high technology industries at a named location ● labour, ● transport, ● research and development, ● site factors. [6] (b) Global warming is one of the most serious problems facing the world in the 21st century. (i) With the help of data from Fig. 8 (Insert) and with reference to other information you may know, describe what is meant by global warming and how it is caused. [6] (ii) Why are many people throughout the world worried by the increase in global warming? [6] (iii) A What measures may be taken to reduce global warming? [3] B Why is it difficult to achieve effective results from these measures? [4] 10 0460/02/O/N/03
Question paper, page 12
BLANK PAGE Copyright Acknowledgements: Figure 2 M. Pacione. Geography. Published by The Geographical Association. © United Nations. Photograph A Photograph by R. Howarth. Figure 3b © The Guardian. Figure 7 © The Guardian. Figure 8 © The Guardian. Cambridge International Examinations has made every effort to trace copyright holders, but if we have inadvertently overlooked any we will be pleased to make the necessary arrangements at the first opportunity. 12 0460/02/O/N/03