Cambridge IGCSE Geography 0460 — 2003 May/June Paper 2 · Variant 1
0460/21/M/J/03
The question paper and its mark scheme, free to read here and free to download. This is Cambridge’s own paper, exactly as it was sat.
Question paper12 pages
Mark scheme
No mark scheme is in the library for this paper.
Paper as text
Question paper, page 1
This document consists of 12 printed pages and an insert. SP (SC/KN) S39382/4 © CIE 2003 [Turn over CAMBRIDGE INTERNATIONAL EXAMINATIONS International General Certificate of Secondary Education GEOGRAPHY 0460/02 Paper 2 May/June 2003 1 hour 45 minutes Additional Materials: Answer Booklet/Paper Ruler READ THESE INSTRUCTIONS FIRST If you have been given an Answer Booklet, follow the instructions on the front cover of the Booklet. Write your Centre number, candidate number and name on all the work you hand in. Write in dark blue or black pen on both sides of the paper. You may use a soft pencil for any diagrams, graphs or rough working. Do not use staples, paper clips, highlighters, glue or correction fluid. Answer three questions. At the end of the examination, fasten all your work securely together. The number of marks is given in brackets [ ] at the end of each question or part question. Sketch maps and diagrams should be drawn whenever they serve to illustrate an answer. www.XtremePapers.com
Question paper, page 2
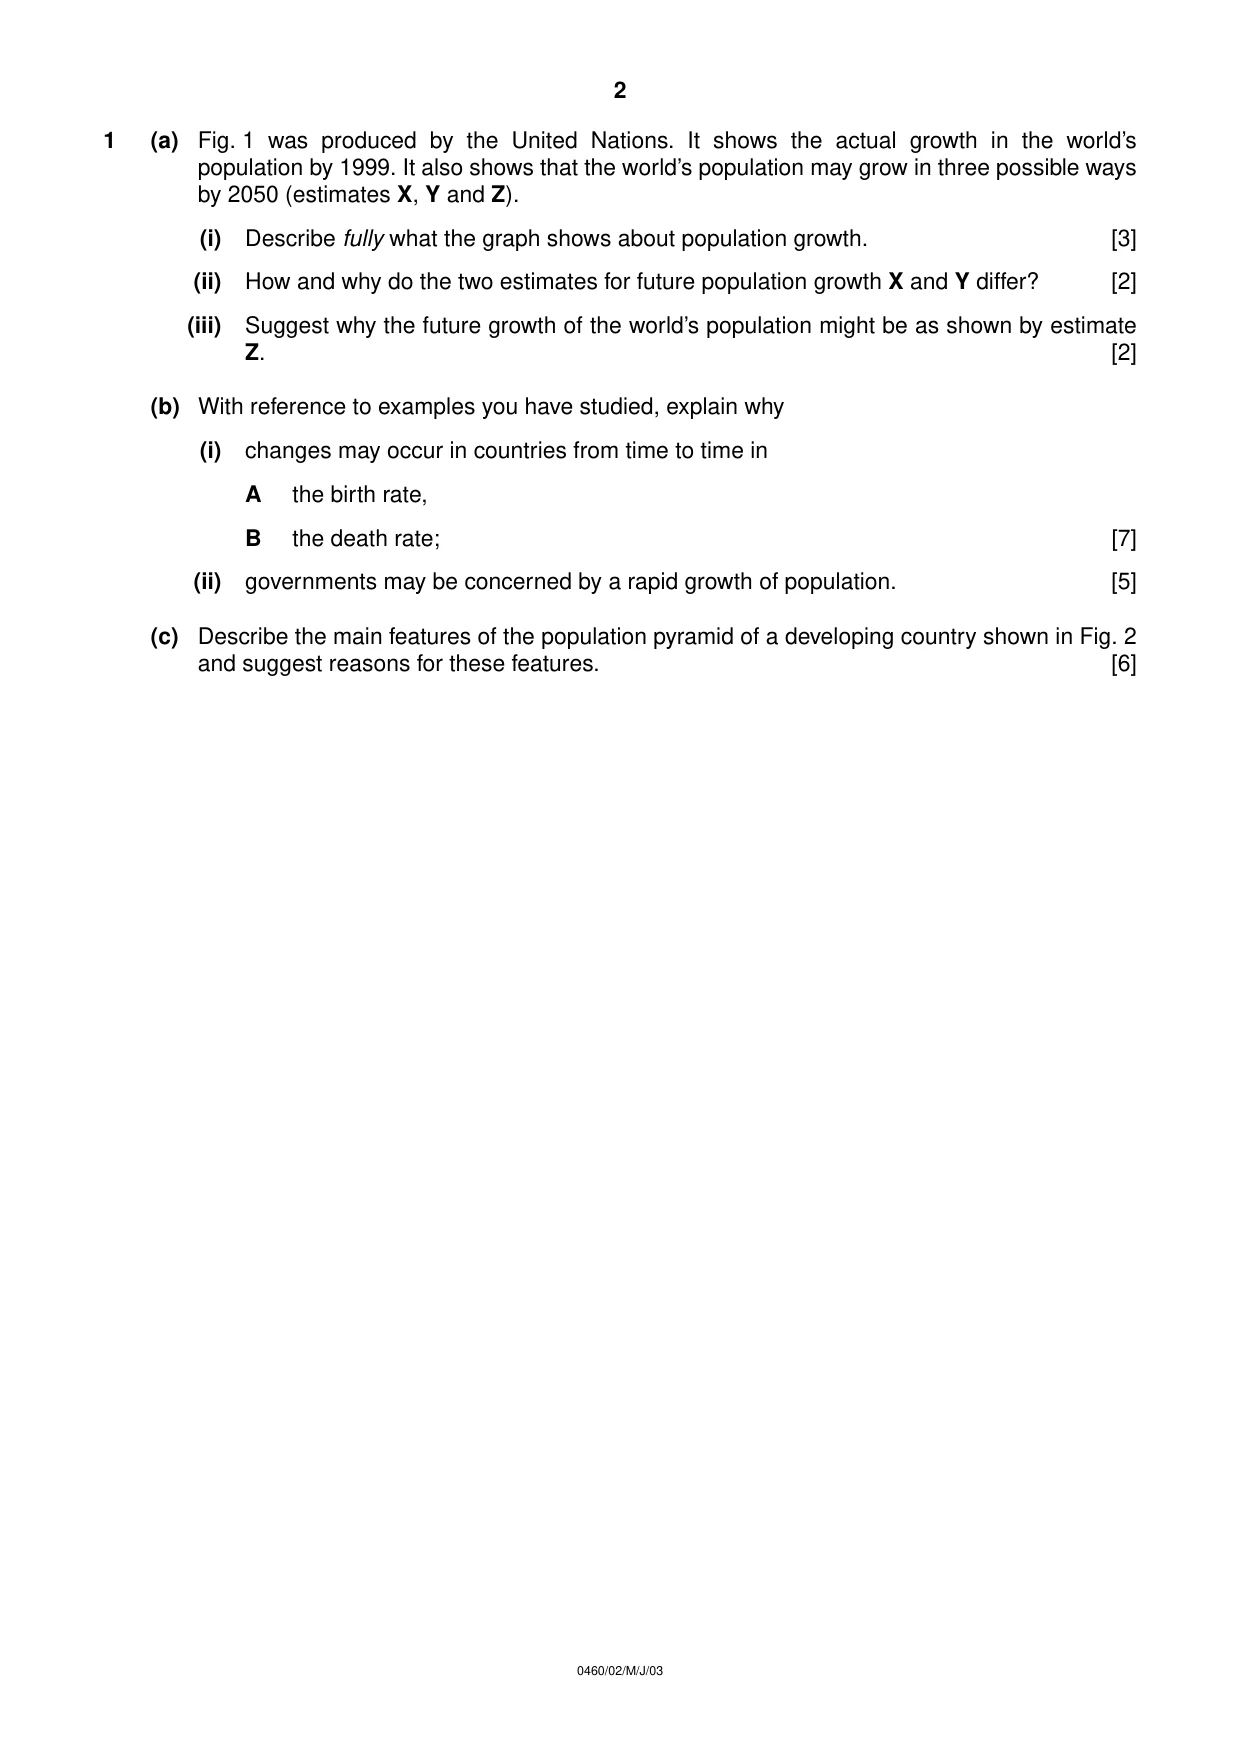
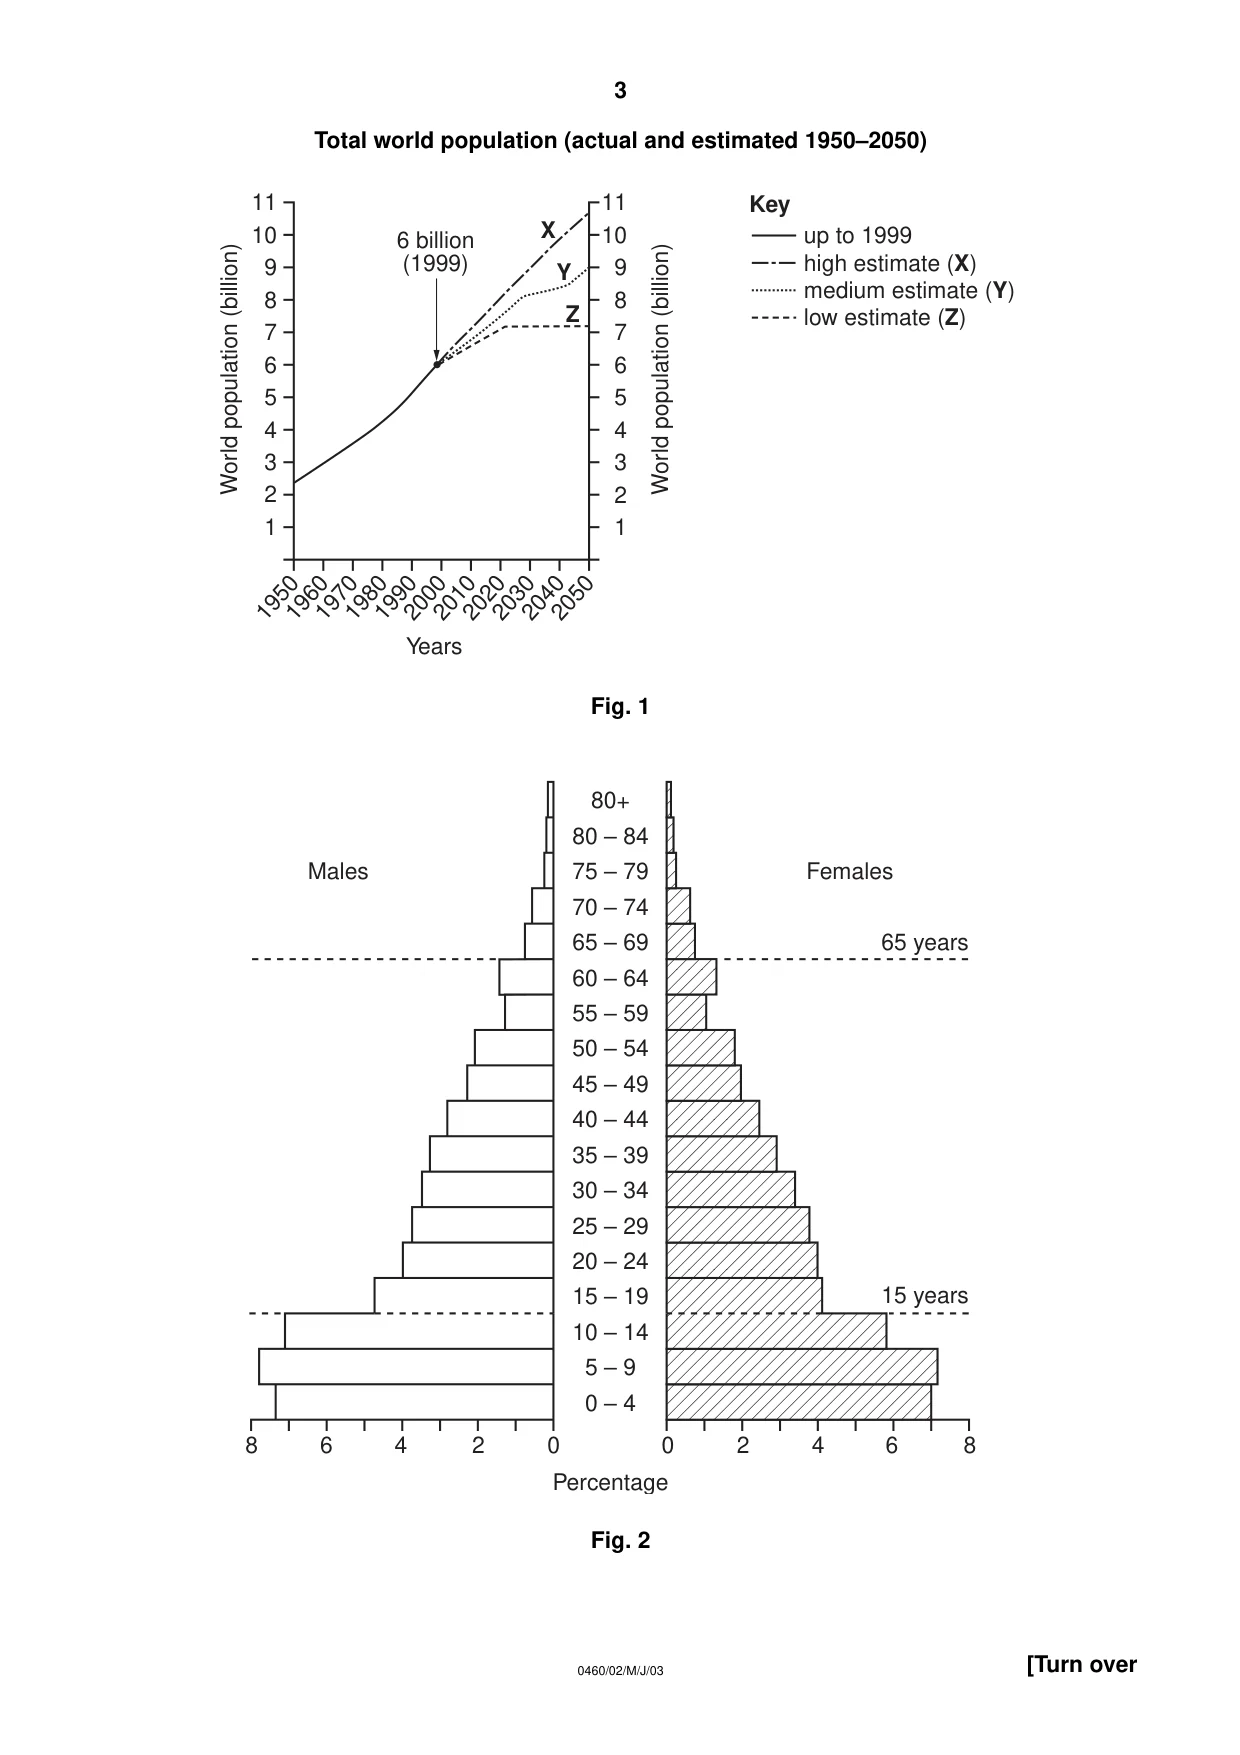
2 0460/02/M/J/03 1 (a) Fig. 1 was produced by the United Nations. It shows the actual growth in the world’s population by 1999. It also shows that the world’s population may grow in three possible ways by 2050 (estimates X, Y and Z). (i) Describe fully what the graph shows about population growth. [3] (ii) How and why do the two estimates for future population growth X and Y differ? [2] (iii) Suggest why the future growth of the world’s population might be as shown by estimate Z. [2] (b) With reference to examples you have studied, explain why (i) changes may occur in countries from time to time in A the birth rate, B the death rate; [7] (ii) governments may be concerned by a rapid growth of population. [5] (c) Describe the main features of the population pyramid of a developing country shown in Fig. 2 and suggest reasons for these features. [6]
Question paper, page 3
3 0460/02/M/J/03 [Turn over Total world population (actual and estimated 1950–2050) Fig. 1 Fig. 2 0 0 2 2 4 4 6 6 8 8 0 – 4 Percentage 5 – 9 10 – 14 15 – 19 20 – 24 25 – 29 30 – 34 35 – 39 40 – 44 45 – 49 50 – 54 55 – 59 60 – 64 65 – 69 70 – 74 75 – 79 80 – 84 80+ Males Females 65 years 15 years 1 2 3 4 5 6 7 8 9 10 11 1 2 3 4 5 6 7 8 9 10 11 World population (billion) World population (billion) 1950 1960 1970 1980 1990 2000 2010 2020 2030 2040 2050 Years up to 1999 high estimate (X) medium estimate (Y) low estimate (Z) 6 billion (1999) X Y Z Key
Question paper, page 4
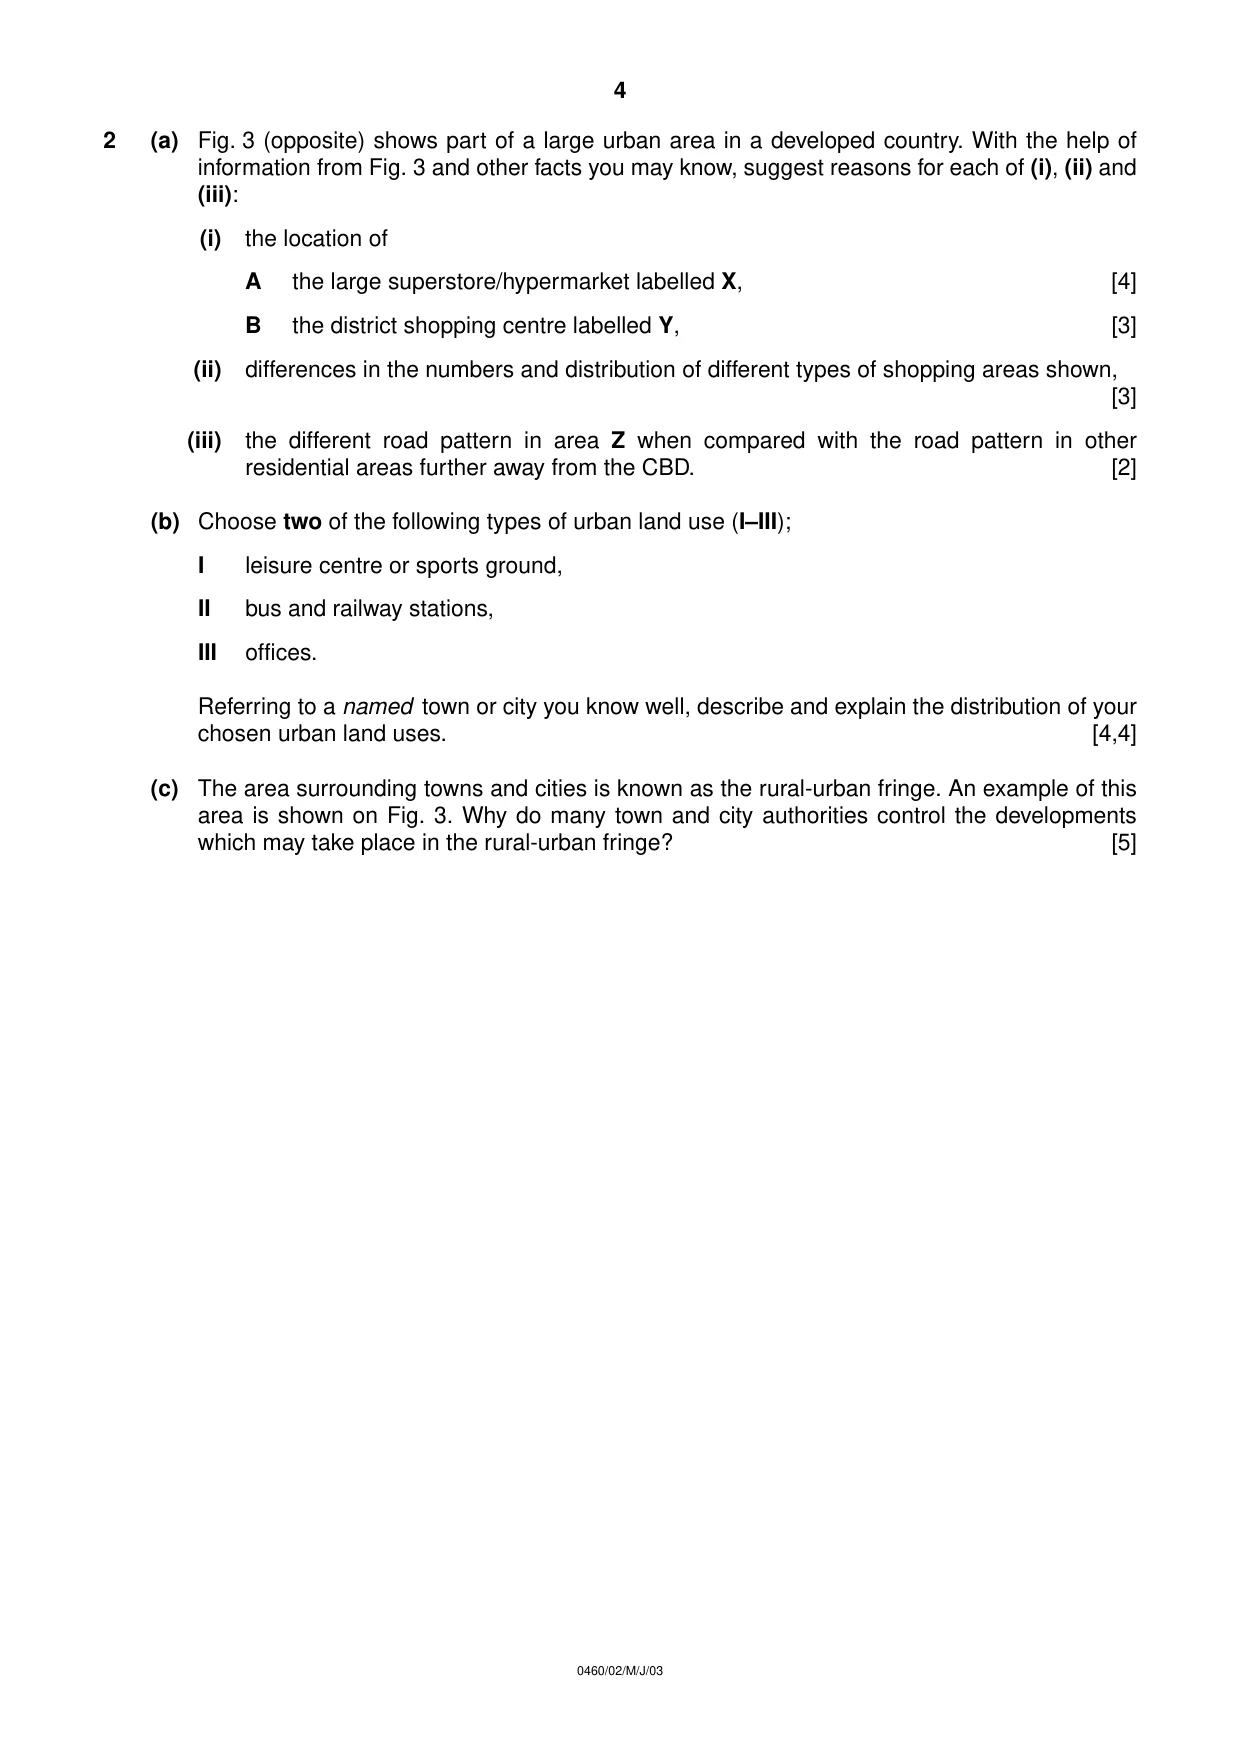
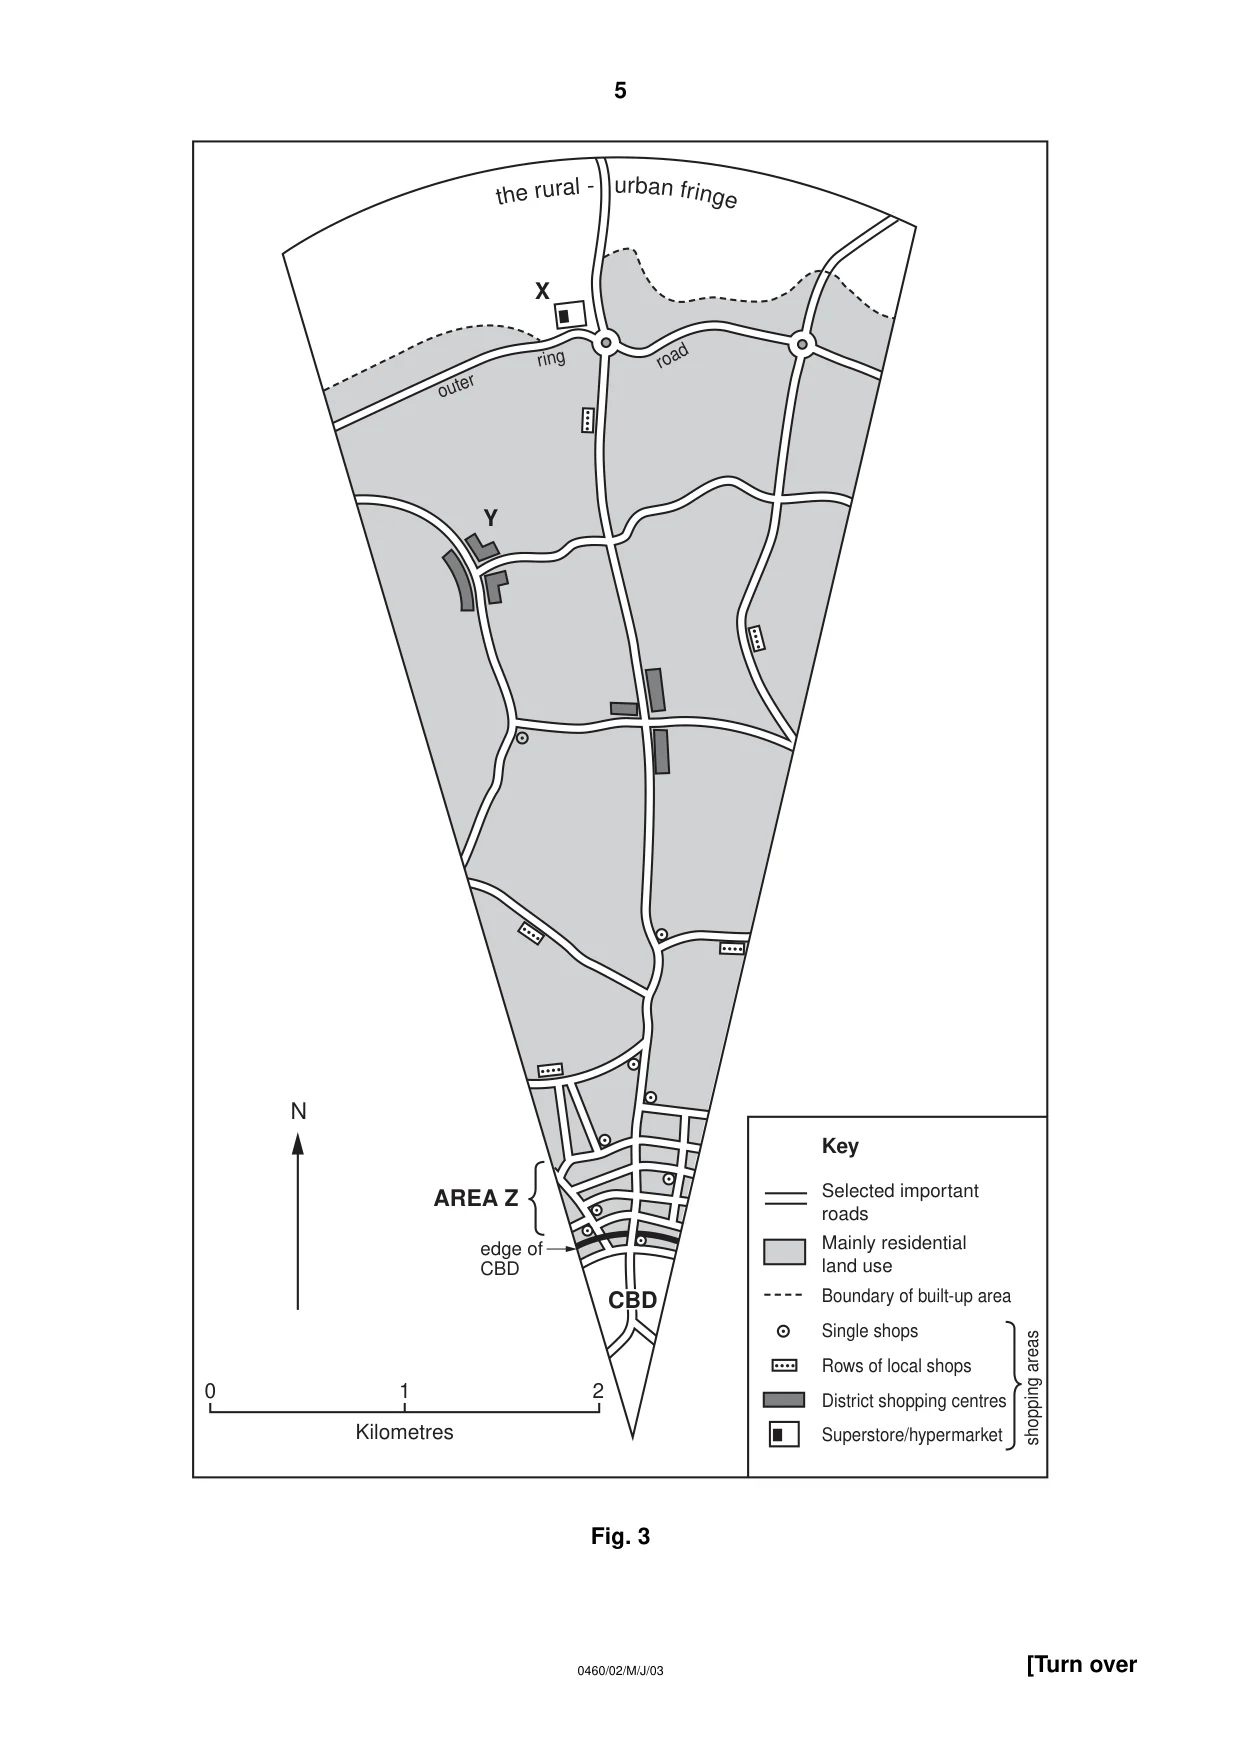
4 0460/02/M/J/03 2 (a) Fig. 3 (opposite) shows part of a large urban area in a developed country. With the help of information from Fig. 3 and other facts you may know, suggest reasons for each of (i), (ii) and (iii): (i) the location of A the large superstore/hypermarket labelled X, [4] B the district shopping centre labelled Y, [3] (ii) differences in the numbers and distribution of different types of shopping areas shown, [3] (iii) the different road pattern in area Z when compared with the road pattern in other residential areas further away from the CBD. [2] (b) Choose two of the following types of urban land use (I–III); I leisure centre or sports ground, II bus and railway stations, III offices. Referring to a named town or city you know well, describe and explain the distribution of your chosen urban land uses. [4,4] (c) The area surrounding towns and cities is known as the rural-urban fringe. An example of this area is shown on Fig. 3. Why do many town and city authorities control the developments which may take place in the rural-urban fringe? [5]
Question paper, page 5
5 0460/02/M/J/03 [Turn over Fig. 3 Key Selected important roads Mainly residential land use Boundary of built-up area Single shops Rows of local shops District shopping centres Superstore/hypermarket shopping areas outer ring road the rur al - urb an fri ng e Y X CBD AREA Z edge of CBD 0 1 Kilometres 2 N
Question paper, page 6
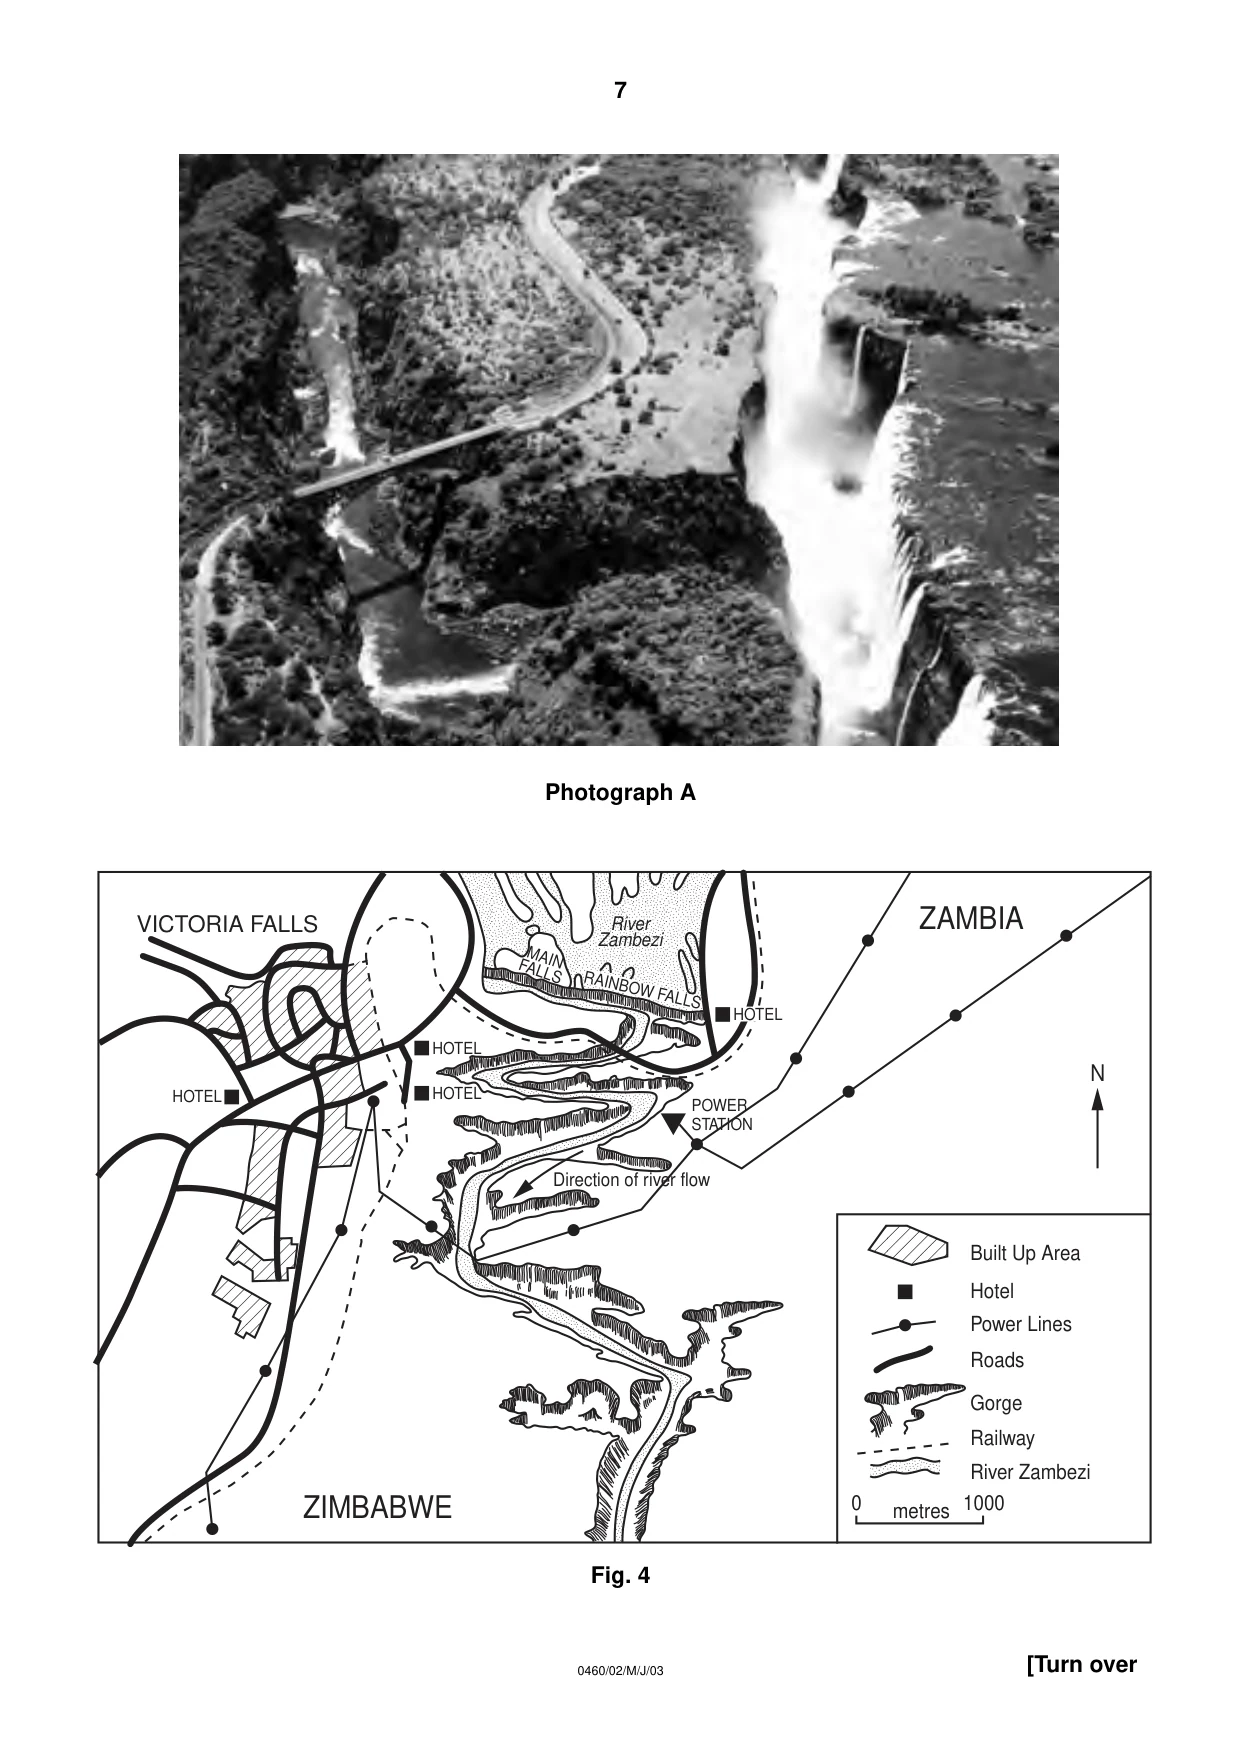
6 0460/02/M/J/03 3 (a) (i) Explain how a river transports its load of large rocks and smaller materials. [4] (ii) What changes in a river cause it to deposit some of the load it is carrying? [4] (b) Photograph A (opposite) shows the Victoria Falls on the River Zambezi in Africa. The location and area surrounding the Victoria Falls are shown on Fig. 4 (opposite). With the help of information from the photograph and map: (i) describe the main features of the Zambezi River and its valley, including the waterfall, [6] (ii) suggest how the river and valley features shown have influenced the lives of people in the area. [5] (c) Explain how the work of a river and rock structure influence the formation of a waterfall and its retreat upstream. [6]
Question paper, page 7
7 0460/02/M/J/03 [Turn over Photograph A Fig. 4 VICTORIA FALLS HOTEL HOTEL HOTEL POWER STATION Direction of river flow MAIN FALLS RAINBOW FALLS River Zambezi HOTEL ZAMBIA ZIMBABWE N Built Up Area Hotel Power Lines Roads Gorge Railway River Zambezi 0 1000 metres
Question paper, page 8
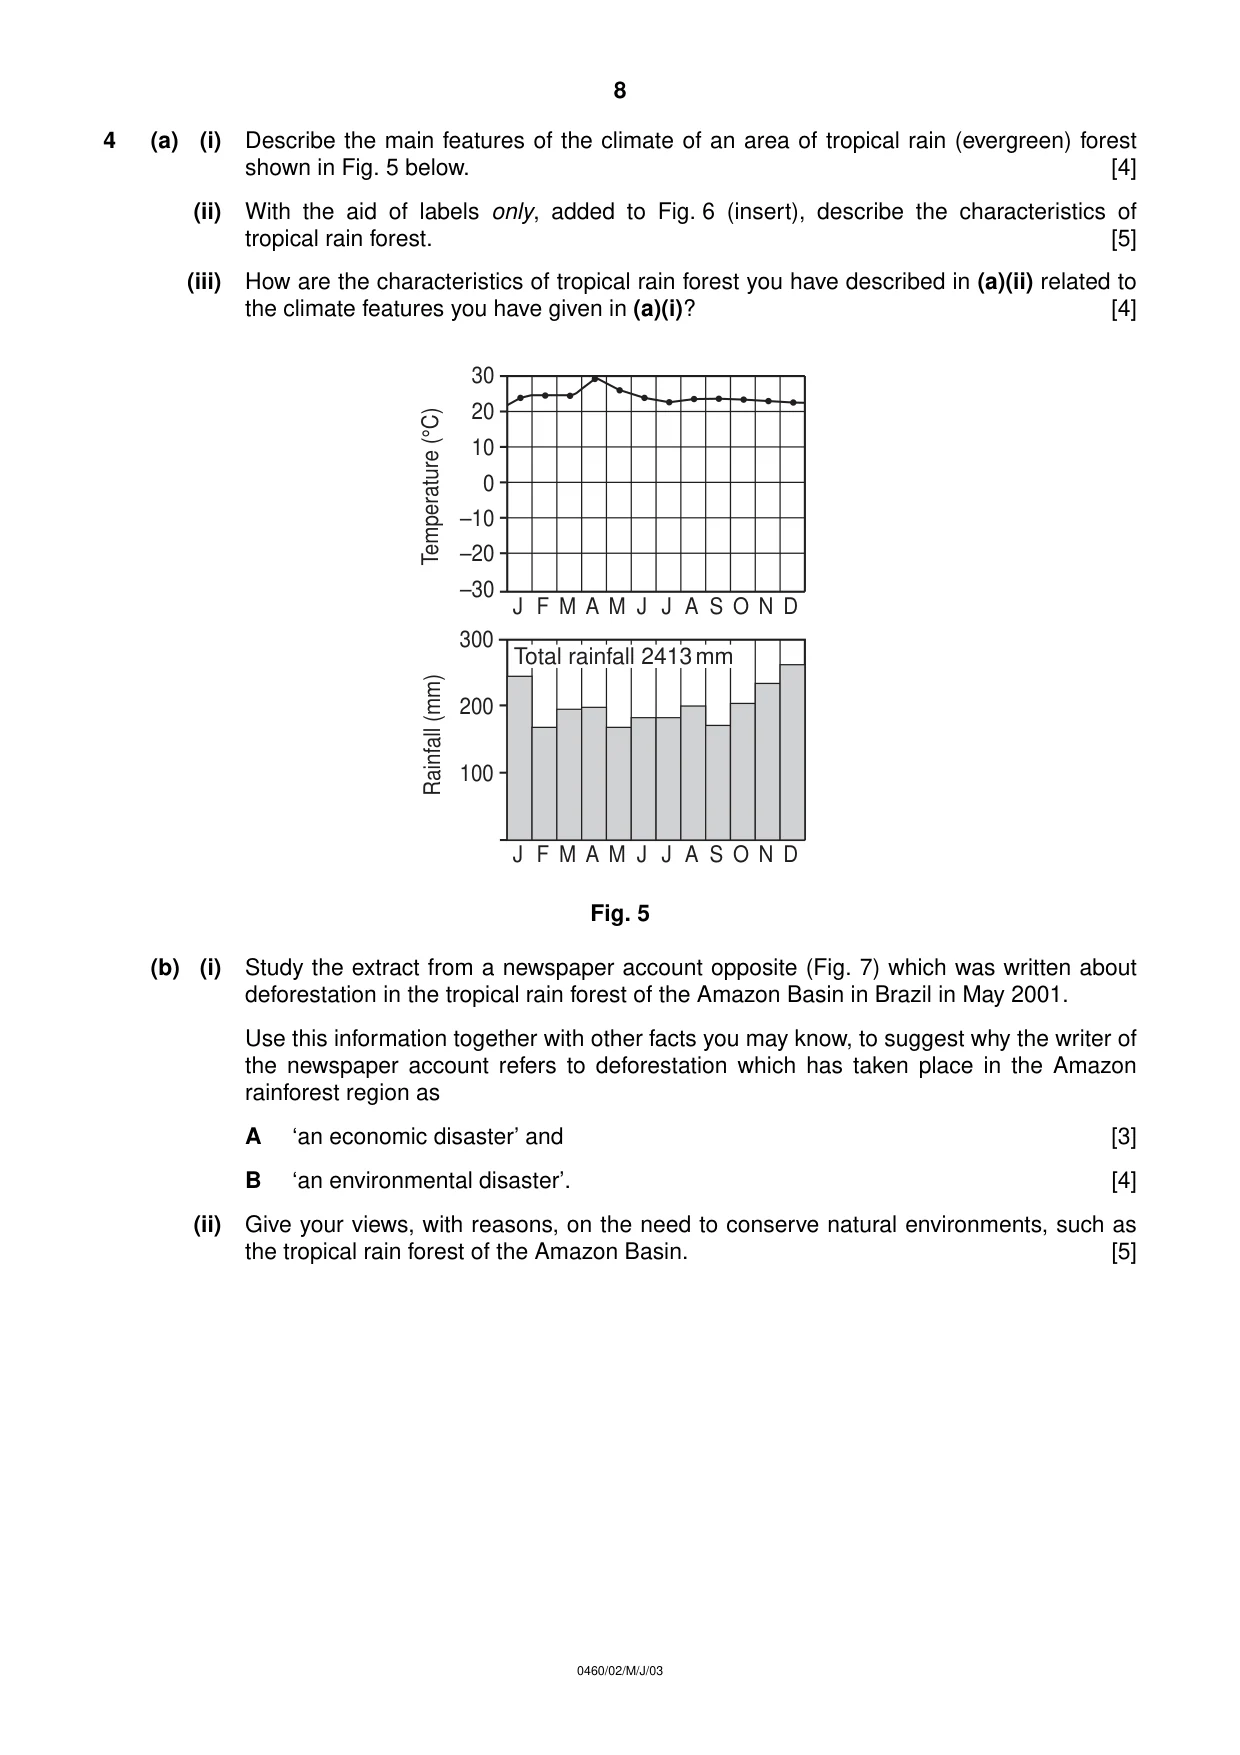
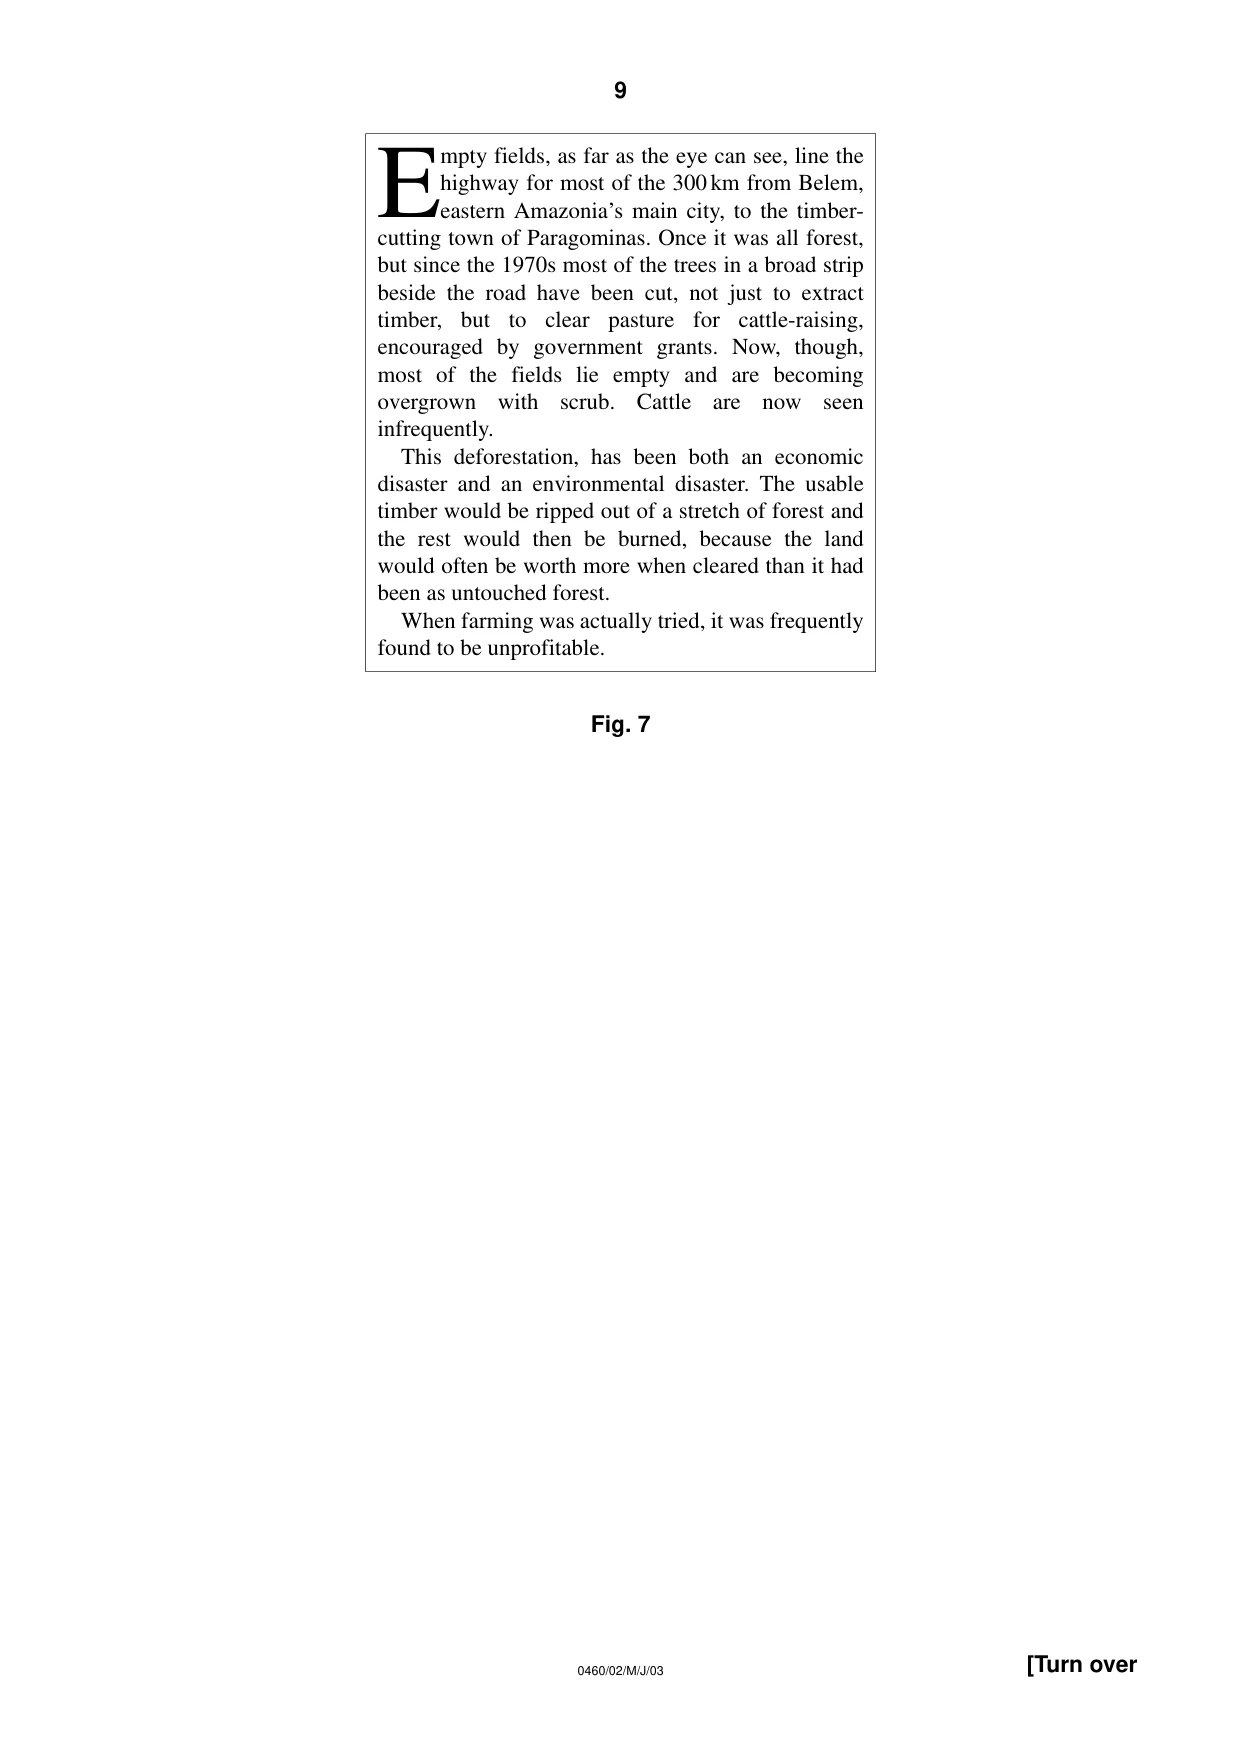
8 0460/02/M/J/03 4 (a) (i) Describe the main features of the climate of an area of tropical rain (evergreen) forest shown in Fig. 5 below. [4] (ii) With the aid of labels only, added to Fig. 6 (insert), describe the characteristics of tropical rain forest. [5] (iii) How are the characteristics of tropical rain forest you have described in (a)(ii) related to the climate features you have given in (a)(i)? [4] Fig. 5 (b) (i) Study the extract from a newspaper account opposite (Fig. 7) which was written about deforestation in the tropical rain forest of the Amazon Basin in Brazil in May 2001. Use this information together with other facts you may know, to suggest why the writer of the newspaper account refers to deforestation which has taken place in the Amazon rainforest region as A ‘an economic disaster’ and [3] B ‘an environmental disaster’. [4] (ii) Give your views, with reasons, on the need to conserve natural environments, such as the tropical rain forest of the Amazon Basin. [5] J F M A M J J A S O N D J F M A M J J A S O N D 30 20 10 0 –10 –20 –30 Temperature (°C) 300 200 100 Rainfall (mm) Total rainfall 2413 mm
Question paper, page 9
9 0460/02/M/J/03 [Turn over Fig. 7 E mpty fields, as far as the eye can see, line the highway for most of the 300km from Belem, eastern Amazonia’s main city, to the timber- cutting town of Paragominas. Once it was all forest, but since the 1970s most of the trees in a broad strip beside the road have been cut, not just to extract timber, but to clear pasture for cattle-raising, encouraged by government grants. Now, though, most of the fields lie empty and are becoming overgrown with scrub. Cattle are now seen infrequently. This deforestation, has been both an economic disaster and an environmental disaster. The usable timber would be ripped out of a stretch of forest and the rest would then be burned, because the land would often be worth more when cleared than it had been as untouched forest. When farming was actually tried, it was frequently found to be unprofitable.
Question paper, page 10
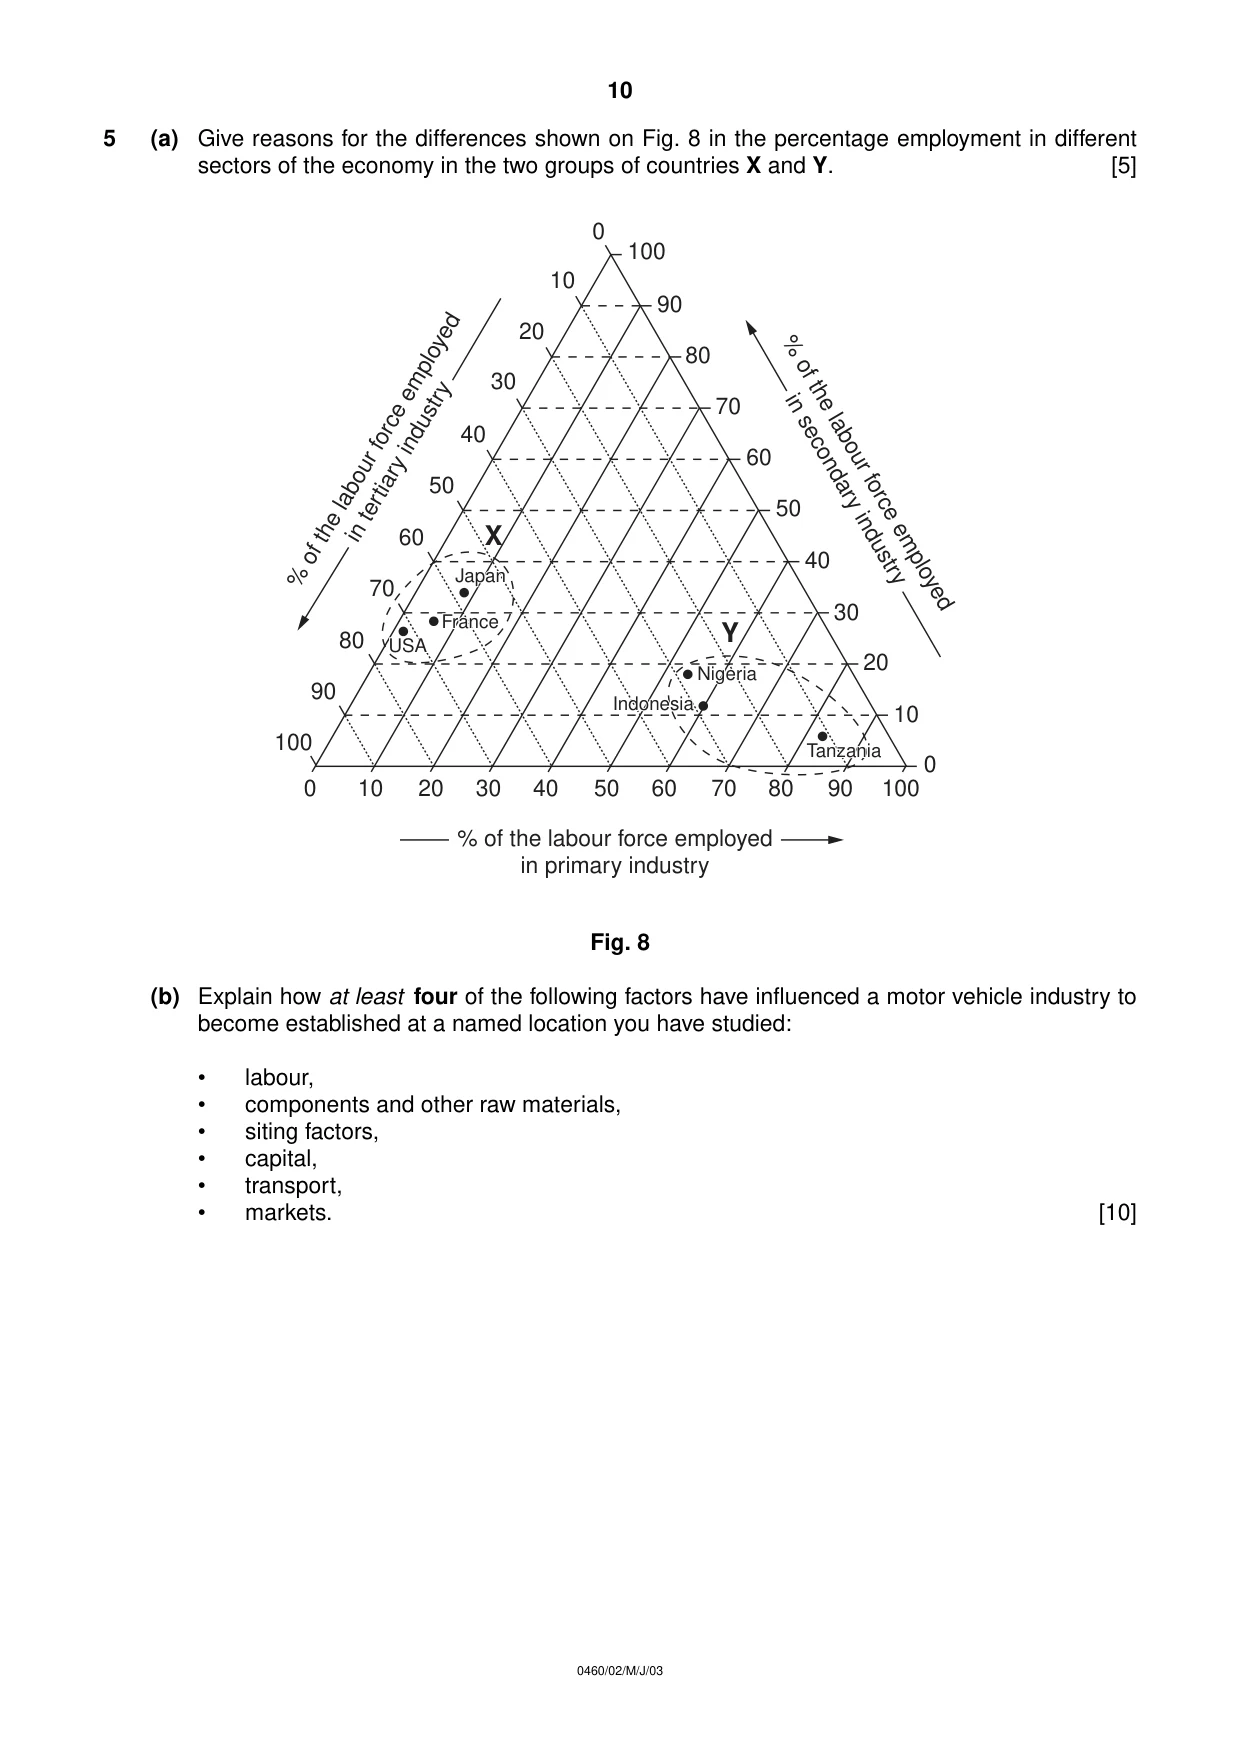
10 0460/02/M/J/03 5 (a) Give reasons for the differences shown on Fig. 8 in the percentage employment in different sectors of the economy in the two groups of countries X and Y. [5] Fig. 8 (b) Explain how at least four of the following factors have influenced a motor vehicle industry to become established at a named location you have studied: • labour, • components and other raw materials, • siting factors, • capital, • transport, • markets. [10] 0 10 20 30 40 50 60 70 80 90 100 0 10 20 30 40 50 70 80 60 90 100 0 10 20 30 40 50 60 70 80 90 100 % of the labour force employed in secondary industry % of the labour force employed in tertiary industry % of the labour force employed in primary industry Japan Japan France France USA USA X Y Nigeria Nigeria Indonesia Indonesia Tanzania Tanzania Nigeria Indonesia Tanzania Japan France USA
Question paper, page 11
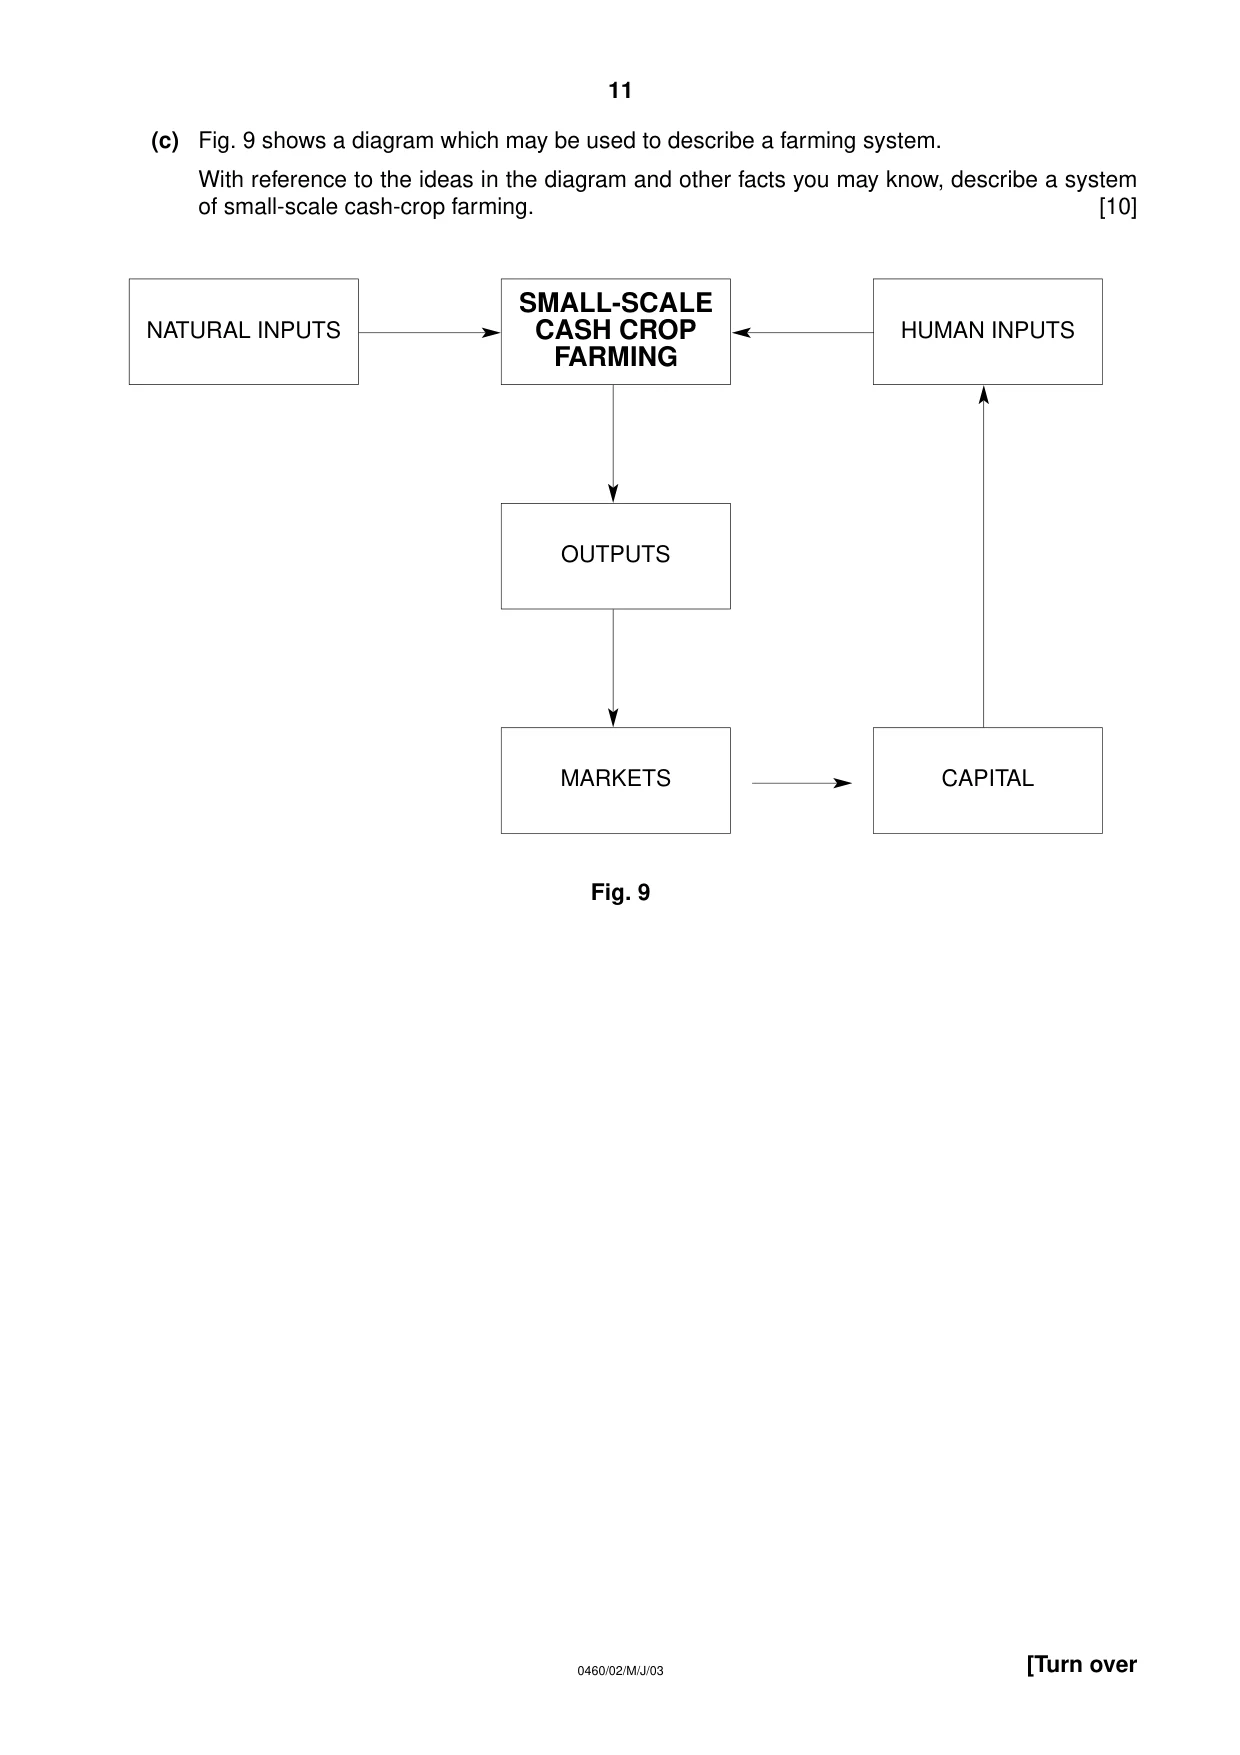
11 0460/02/M/J/03 [Turn over (c) Fig. 9 shows a diagram which may be used to describe a farming system. With reference to the ideas in the diagram and other facts you may know, describe a system of small-scale cash-crop farming. [10] Fig. 9 NATURAL INPUTS SMALL-SCALE CASH CROP FARMING OUTPUTS MARKETS CAPITAL HUMAN INPUTS
Question paper, page 12
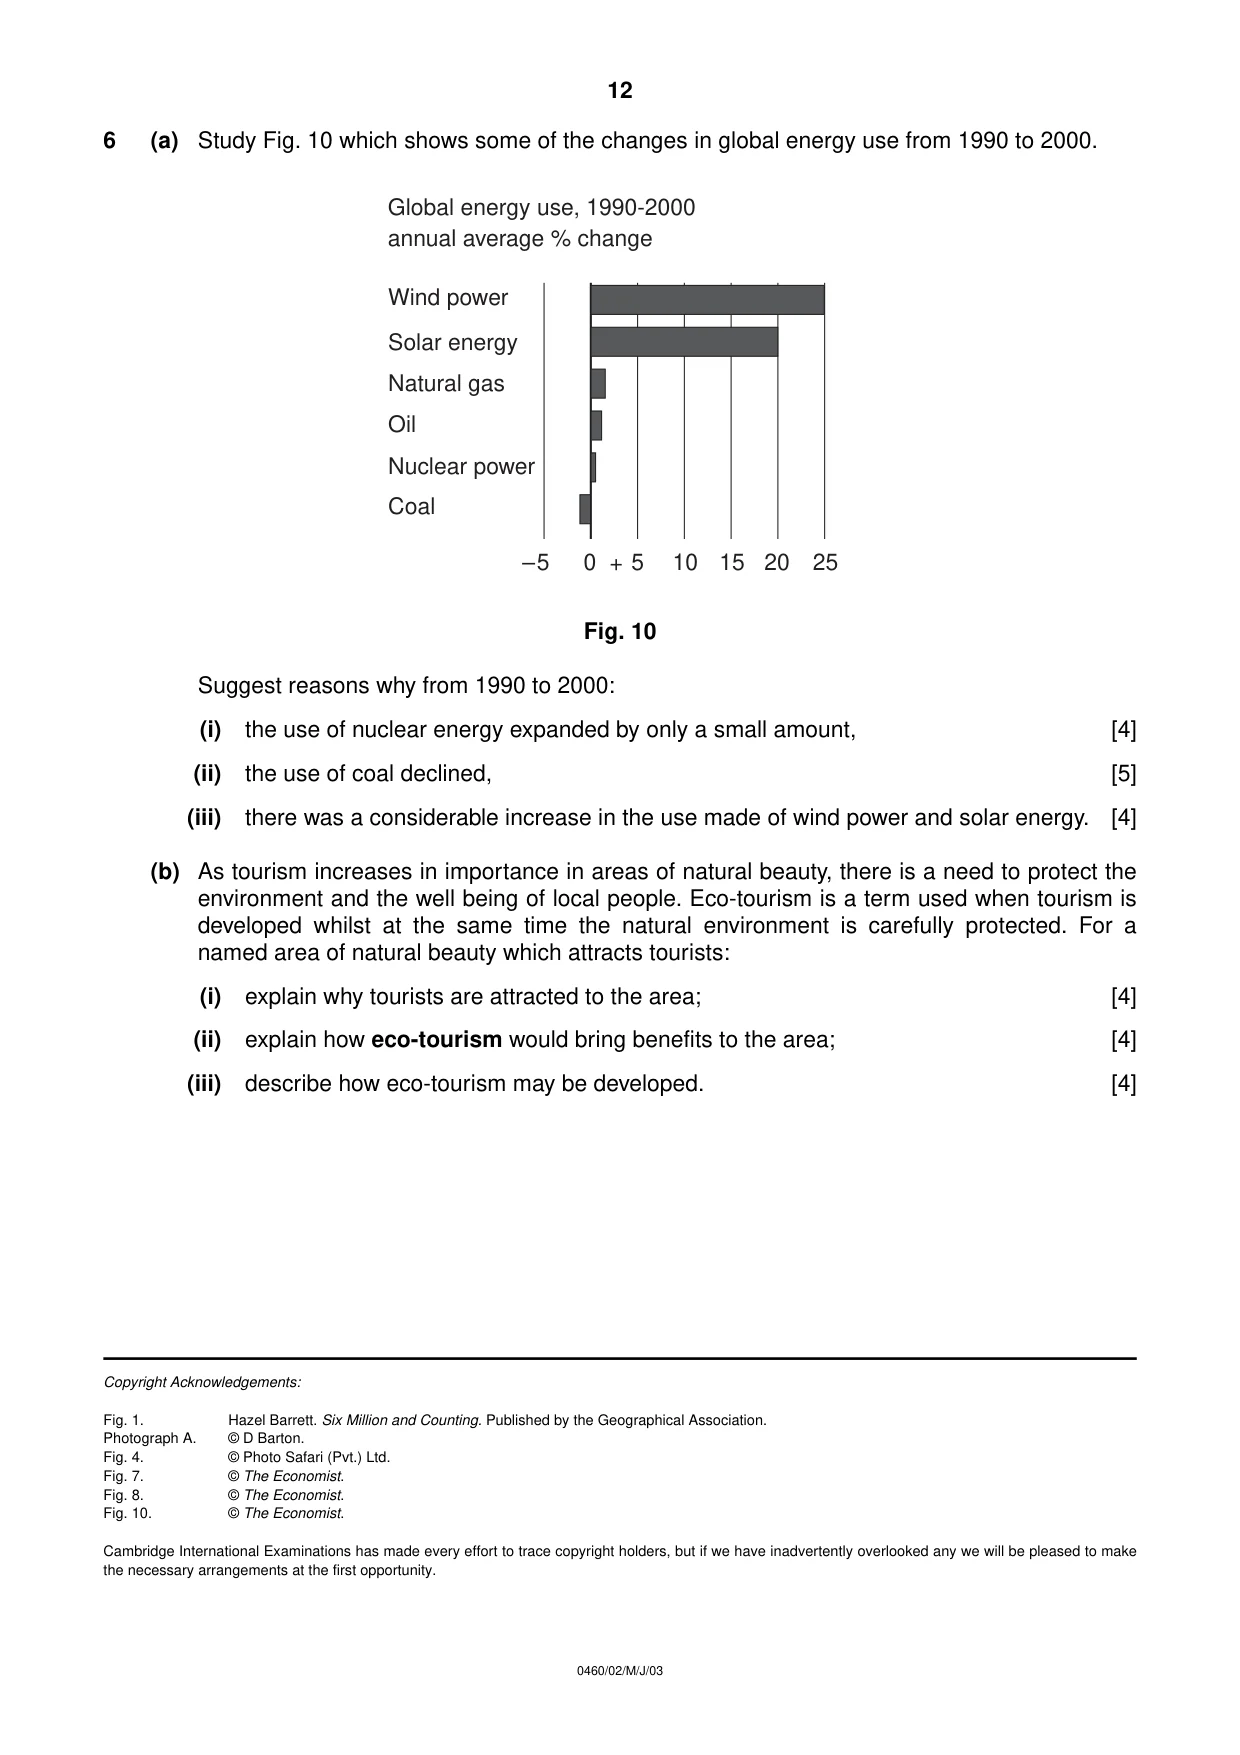
12 0460/02/M/J/03 6 (a) Study Fig. 10 which shows some of the changes in global energy use from 1990 to 2000. Fig. 10 Suggest reasons why from 1990 to 2000: (i) the use of nuclear energy expanded by only a small amount, [4] (ii) the use of coal declined, [5] (iii) there was a considerable increase in the use made of wind power and solar energy. [4] (b) As tourism increases in importance in areas of natural beauty, there is a need to protect the environment and the well being of local people. Eco-tourism is a term used when tourism is developed whilst at the same time the natural environment is carefully protected. For a named area of natural beauty which attracts tourists: (i) explain why tourists are attracted to the area; [4] (ii) explain how eco-tourism would bring benefits to the area; [4] (iii) describe how eco-tourism may be developed. [4] Copyright Acknowledgements: Fig. 1. Hazel Barrett. Six Million and Counting. Published by the Geographical Association. Photograph A. © D Barton. Fig. 4. © Photo Safari (Pvt.) Ltd. Fig. 7. © The Economist. Fig. 8. © The Economist. Fig. 10. © The Economist. Cambridge International Examinations has made every effort to trace copyright holders, but if we have inadvertently overlooked any we will be pleased to make the necessary arrangements at the first opportunity. 5 0 5 10 15 20 25 – + Wind power Solar energy Natural gas Oil Nuclear power Coal Global energy use, 1990-2000 annual average % change