Cambridge IGCSE Geography 0460 — 2002 Oct/Nov Paper 2 · Variant 1
0460/21/O/N/02
The question paper and its mark scheme, free to read here and free to download. This is Cambridge’s own paper, exactly as it was sat.
Question paper16 pages


Mark scheme9 pages
Answers below. Sit the paper first if you are practising.
Paper as text
Question paper, page 1
TIME 1 hour 45 minutes INSTRUCTIONS TO CANDIDATES Write your name, Centre number and candidate number in the spaces provided on the answer paper/ answer booklet. Answer any three questions. Write your answers on the separate answer paper provided. If you use more than one sheet of paper, fasten the sheets together. INFORMATION FOR CANDIDATES The number of marks is given in brackets [ ] at the end of each question or part question. Sketch-maps and diagrams should be drawn whenever they serve to illustrate an answer. Insert 1 contains Fig. 6. Insert 2 contains Photograph A. International General Certificate of Secondary Education CAMBRIDGE INTERNATIONAL EXAMINATIONS GEOGRAPHY 0460/2 PAPER 2 OCTOBER/NOVEMBER SESSION 2002 1 hour 45 minutes Additional materials: Answer paper Ruler This question paper consists of 14 printed pages, 2 blank pages and 2 inserts. SPA (NH/Ox) S19984/3 © CIE 2002 [Turn over www.XtremePapers.com
Question paper, page 2
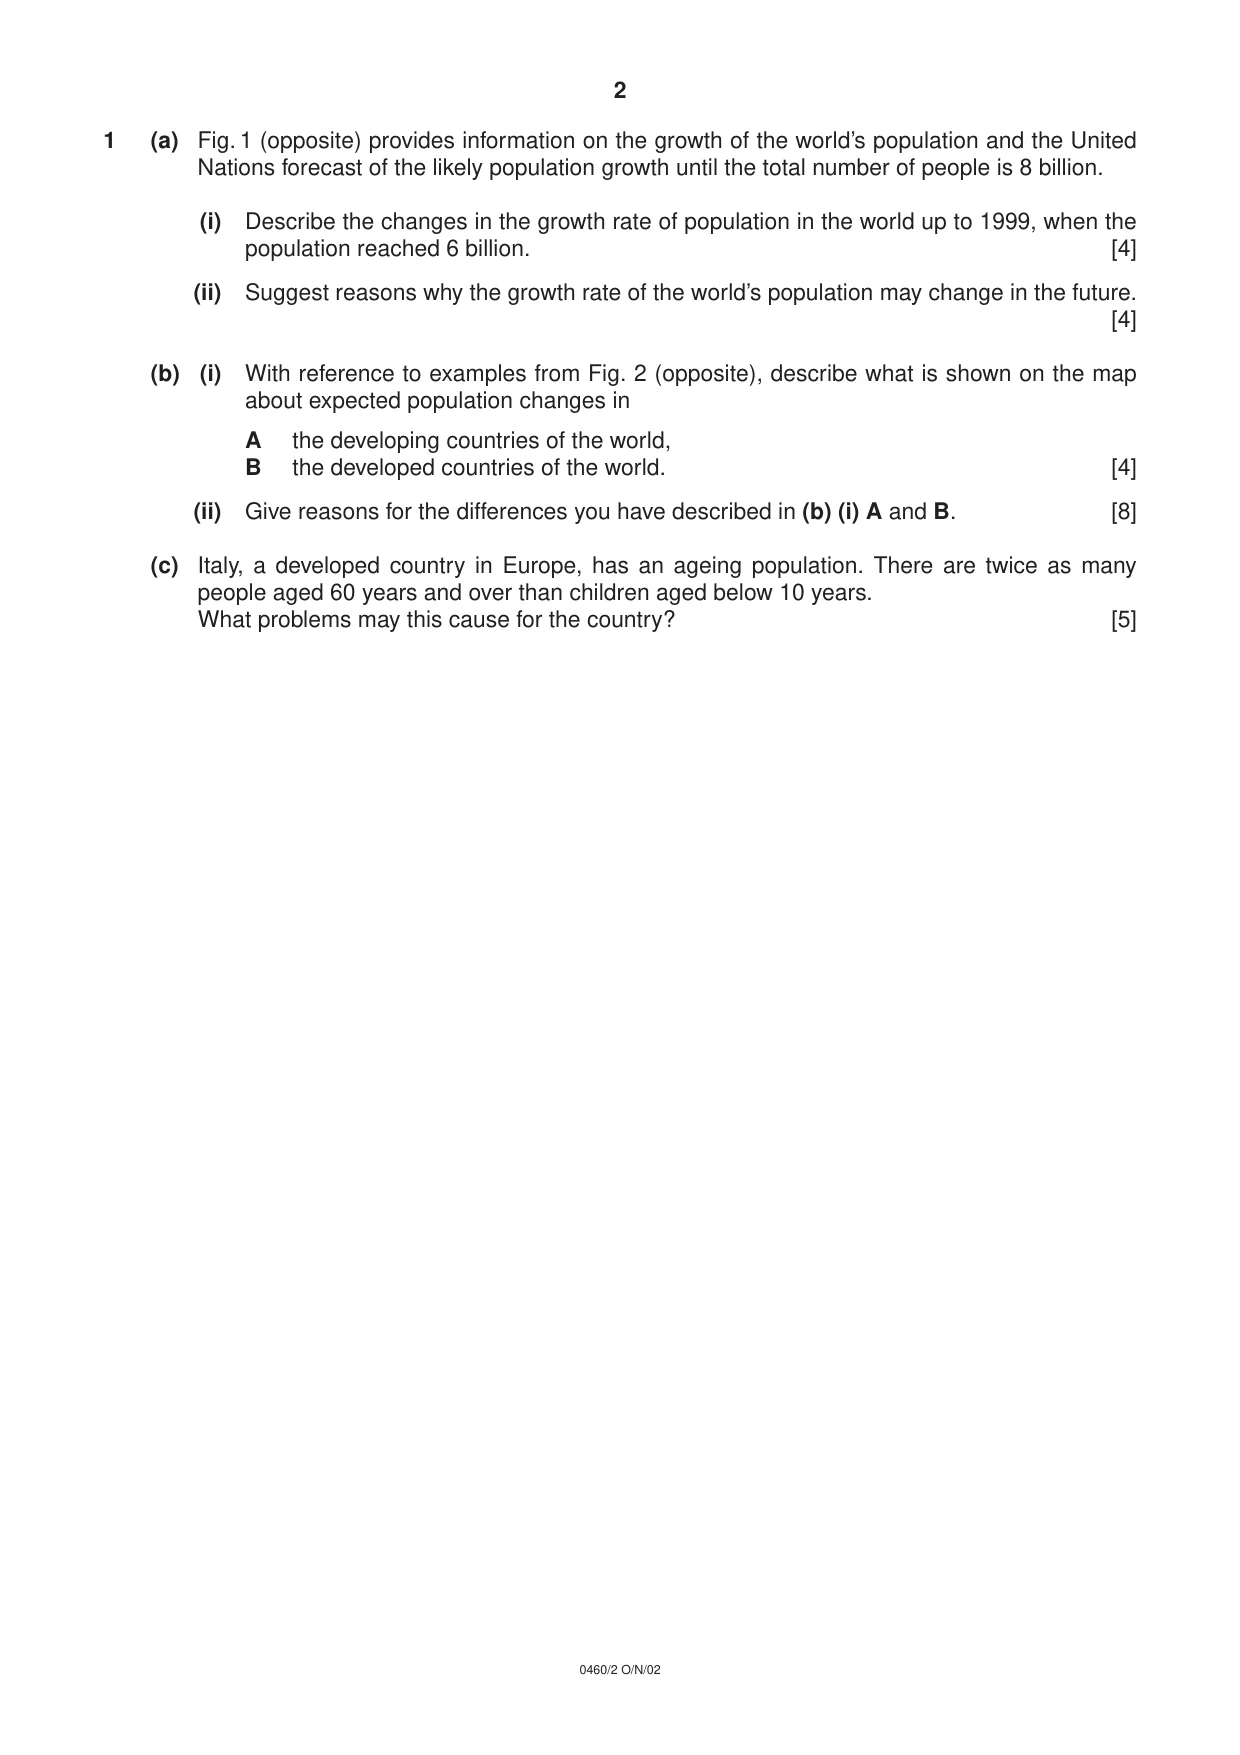
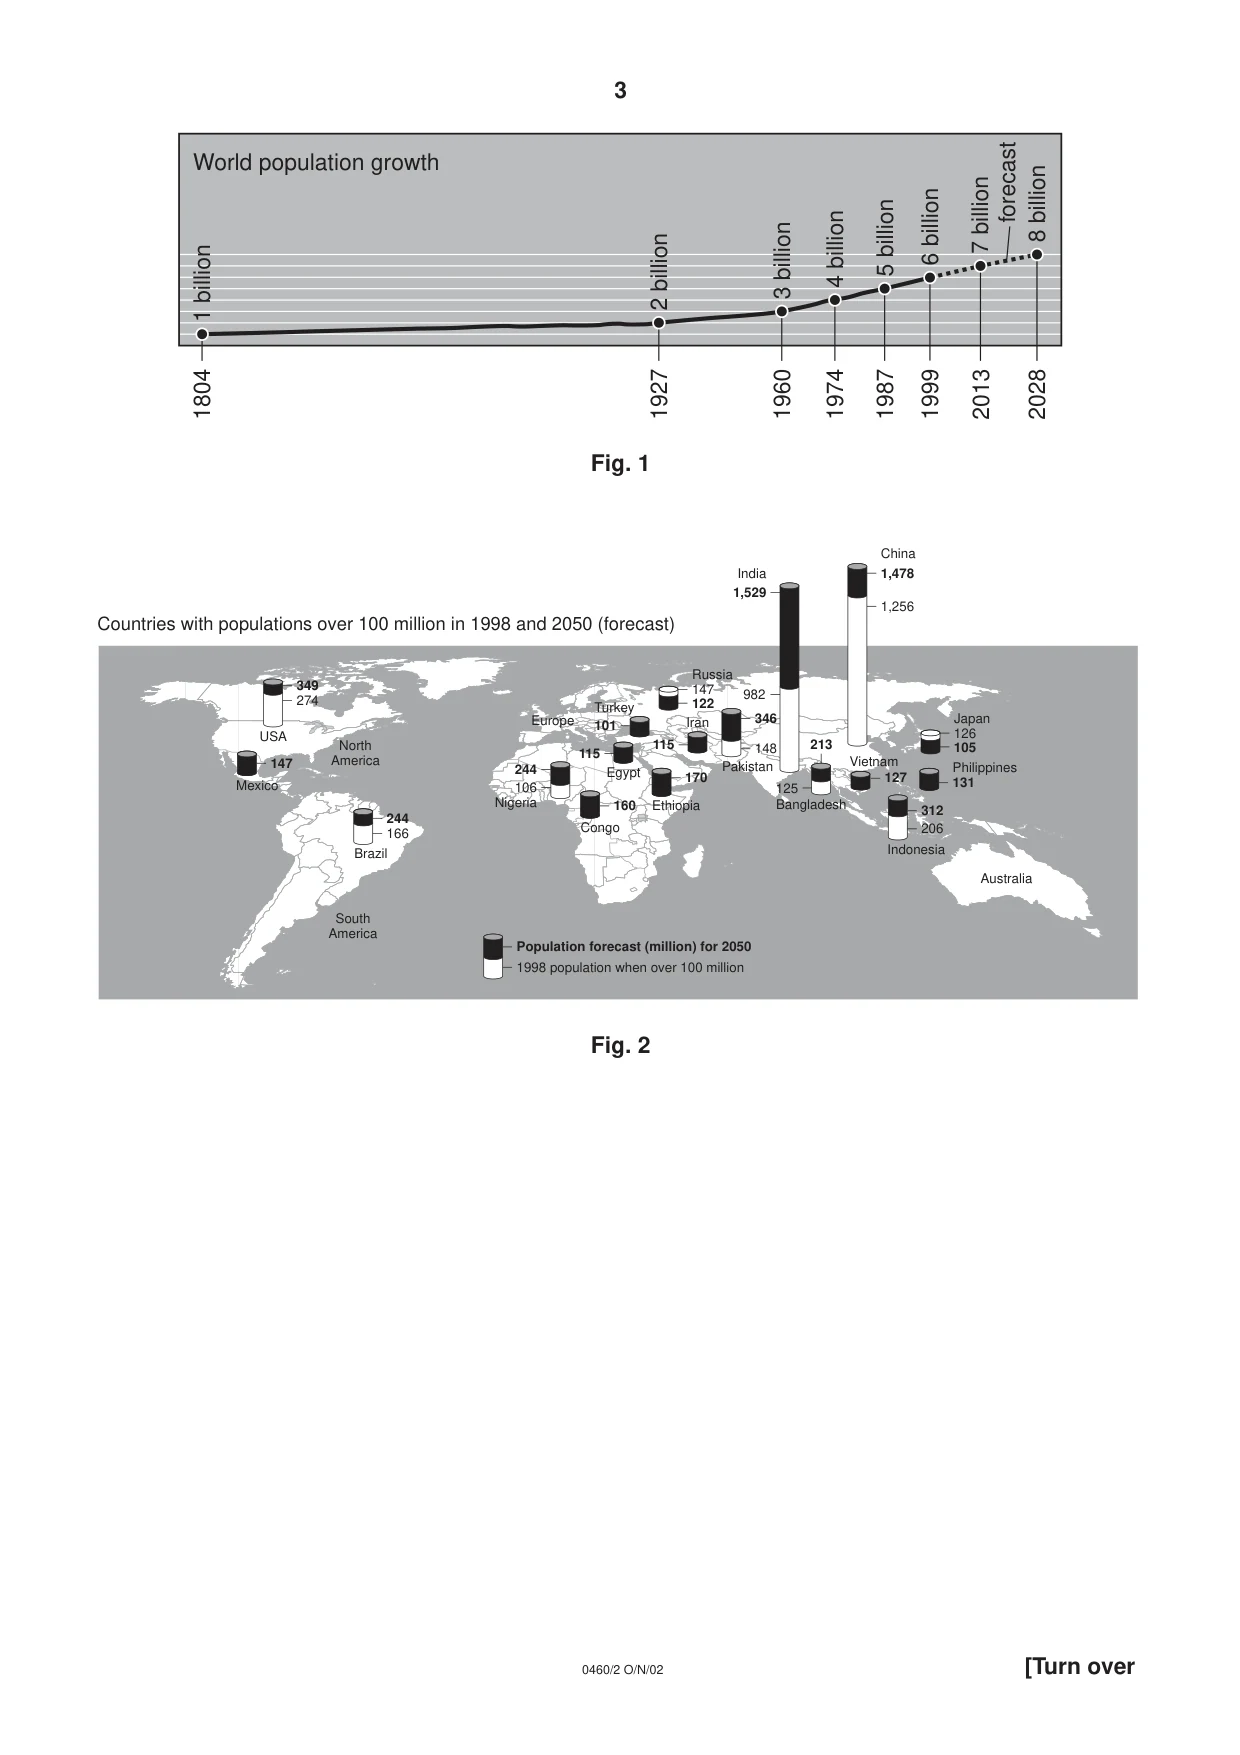
2 0460/2 O/N/02 1 (a) Fig. 1 (opposite) provides information on the growth of the world’s population and the United Nations forecast of the likely population growth until the total number of people is 8 billion. (i) Describe the changes in the growth rate of population in the world up to 1999, when the population reached 6 billion. [4] (ii) Suggest reasons why the growth rate of the world’s population may change in the future. [4] (b) (i) With reference to examples from Fig. 2 (opposite), describe what is shown on the map about expected population changes in A the developing countries of the world, B the developed countries of the world. [4] (ii) Give reasons for the differences you have described in (b) (i) A and B. [8] (c) Italy, a developed country in Europe, has an ageing population. There are twice as many people aged 60 years and over than children aged below 10 years. What problems may this cause for the country? [5]
Question paper, page 3
3 0460/2 O/N/02 [Turn over Fig. 1 Fig. 2 1960 3 billion 1974 4 billion 1987 5 billion 1999 6 billion 2013 7 billion 2028 8 billion 1804 1 billion 1927 2 billion World population growth forecast Population forecast (million) for 2050 1998 population when over 100 million 1,478 1,256 China 1,529 982 India 213 125 Bangladesh 127 Vietnam 312 206 Indonesia 131 Philippines 105 126 Japan 122 147 Russia 346 148 Pakistan 115 Iran 170 Ethiopia 115 Egypt 101 Turkey 160 Congo 244 106 Nigeria 244 166 Brazil 349 274 USA 147 Mexico Countries with populations over 100 million in 1998 and 2050 (forecast) South America North America Europe Australia
Question paper, page 4
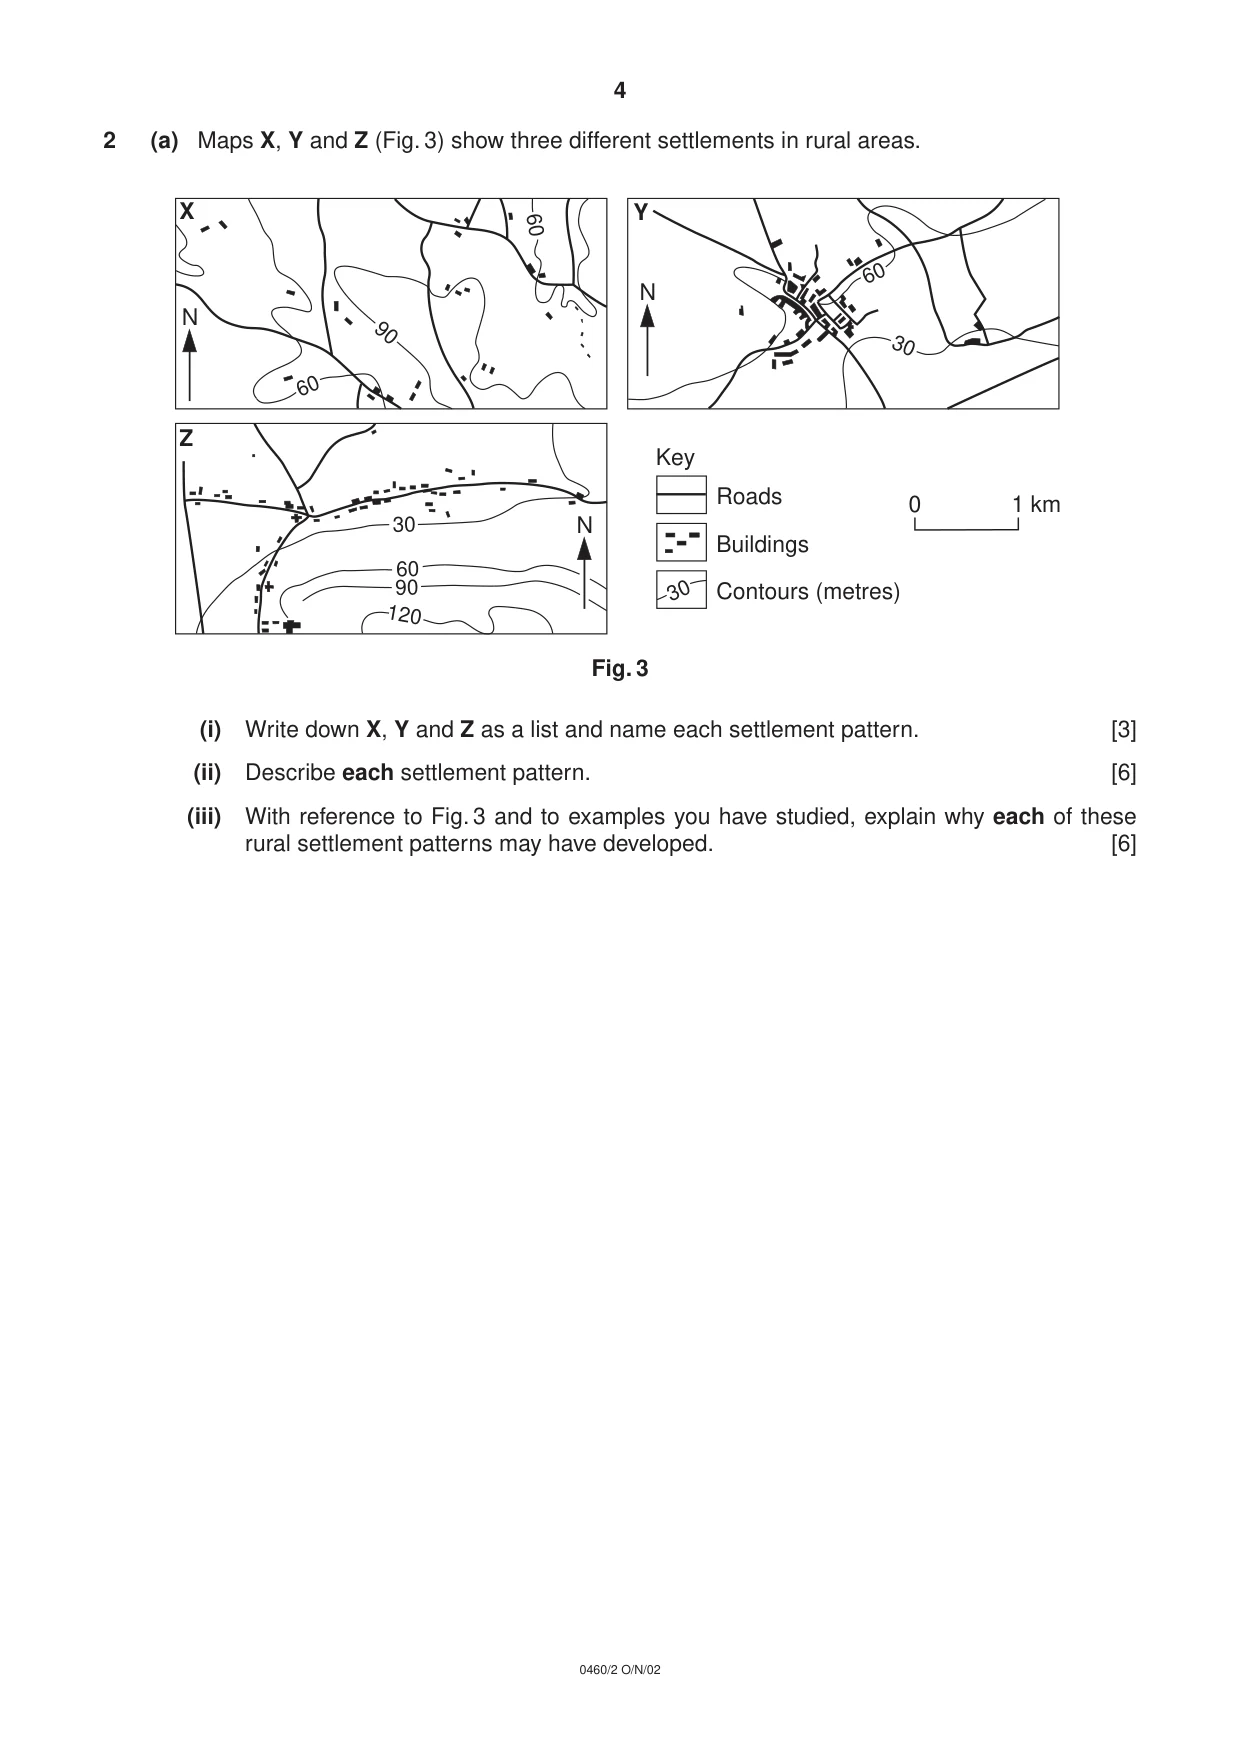
4 0460/2 O/N/02 2 (a) Maps X, Y and Z (Fig. 3) show three different settlements in rural areas. Fig. 3 (i) Write down X, Y and Z as a list and name each settlement pattern. [3] (ii) Describe each settlement pattern. [6] (iii) With reference to Fig. 3 and to examples you have studied, explain why each of these rural settlement patterns may have developed. [6] Roads 0 1 km Key Buildings Contours (metres) 60 90 60 X Z 30 60 90 120 Y 60 30 30 N N N
Question paper, page 5
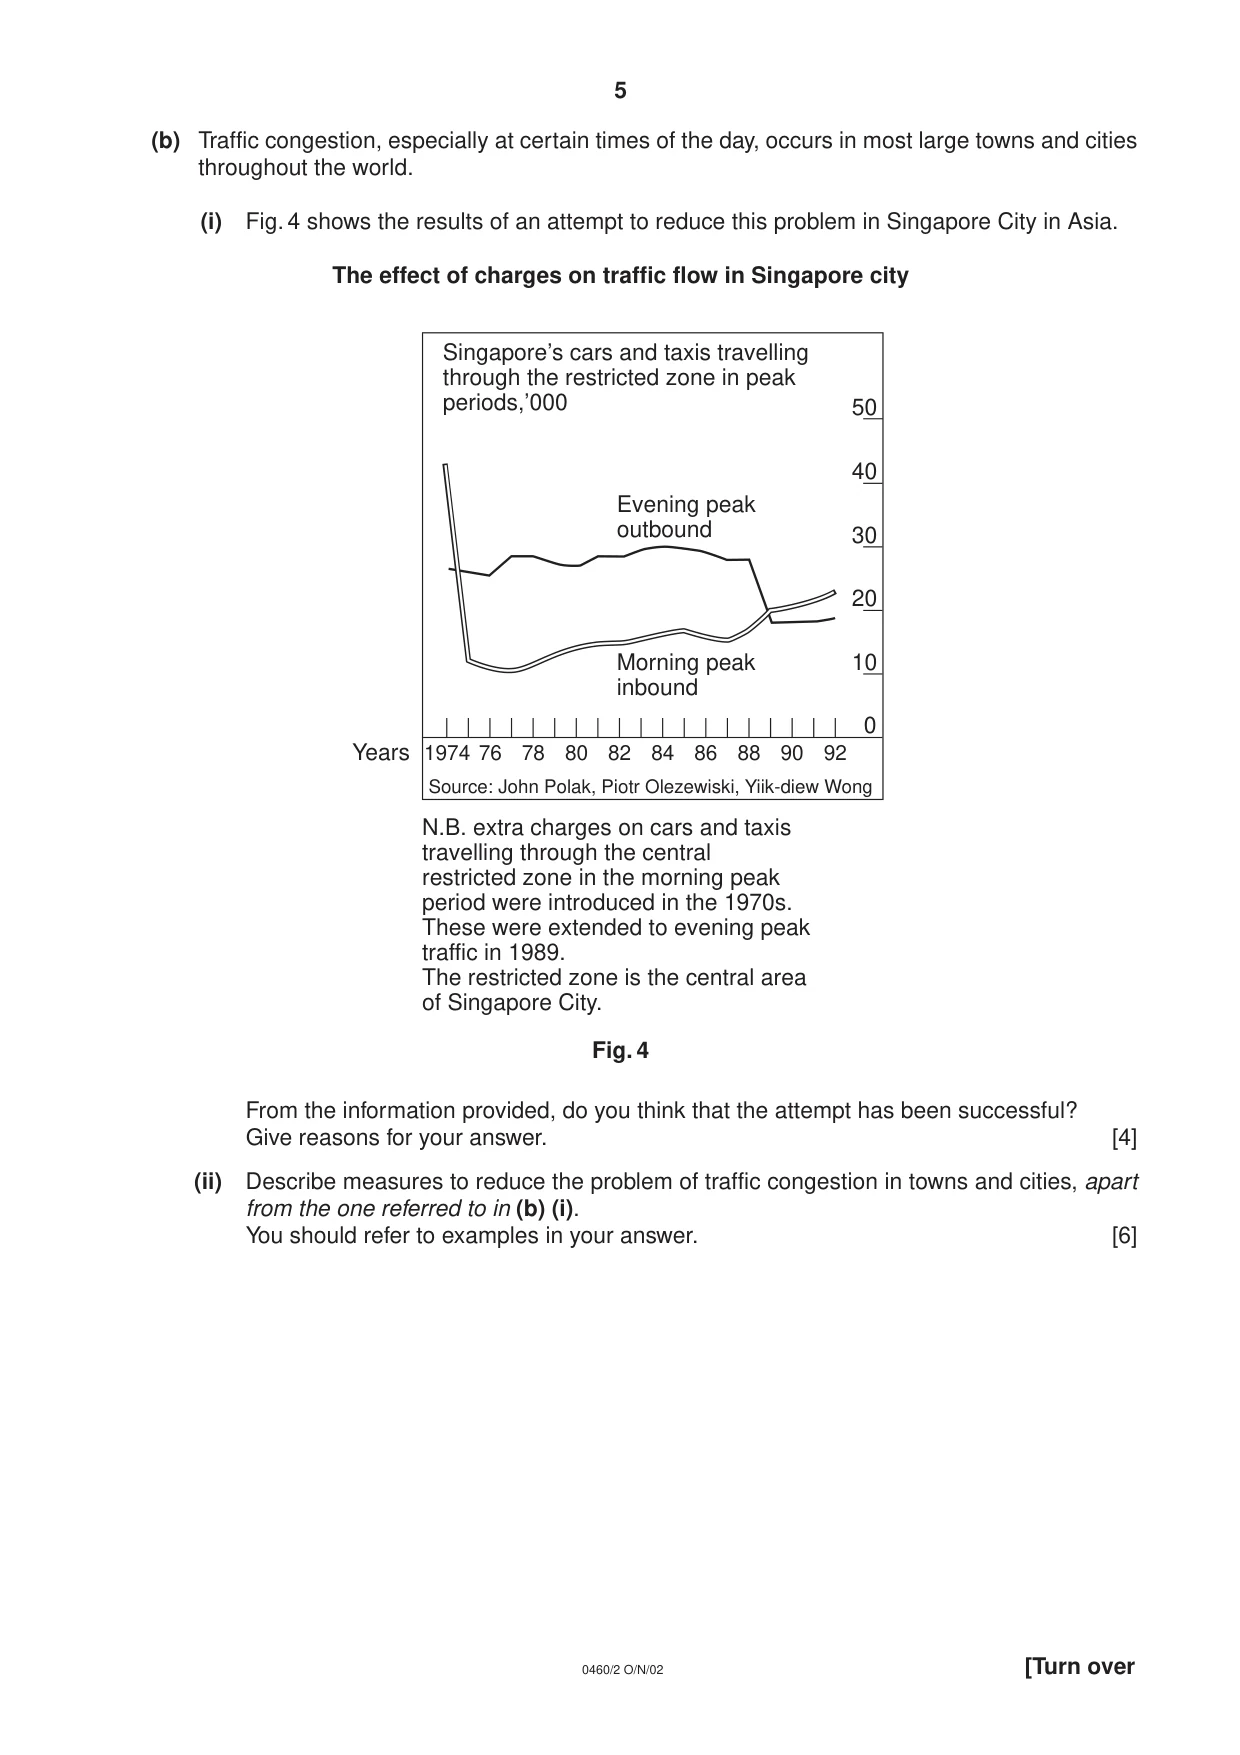
5 0460/2 O/N/02 [Turn over (b) Traffic congestion, especially at certain times of the day, occurs in most large towns and cities throughout the world. (i) Fig. 4 shows the results of an attempt to reduce this problem in Singapore City in Asia. The effect of charges on traffic flow in Singapore city Fig. 4 From the information provided, do you think that the attempt has been successful? Give reasons for your answer. [4] (ii) Describe measures to reduce the problem of traffic congestion in towns and cities, apart from the one referred to in (b) (i). You should refer to examples in your answer. [6] 10 0 Singapore’s cars and taxis travelling through the restricted zone in peak periods,’000 50 40 30 20 1974 76 78 80 82 84 86 88 90 92 Source: John Polak, Piotr Olezewiski, Yiik-diew Wong Evening peak outbound Morning peak inbound Years N.B. extra charges on cars and taxis travelling through the central restricted zone in the morning peak period were introduced in the 1970s. These were extended to evening peak traffic in 1989. The restricted zone is the central area of Singapore City.
Question paper, page 6
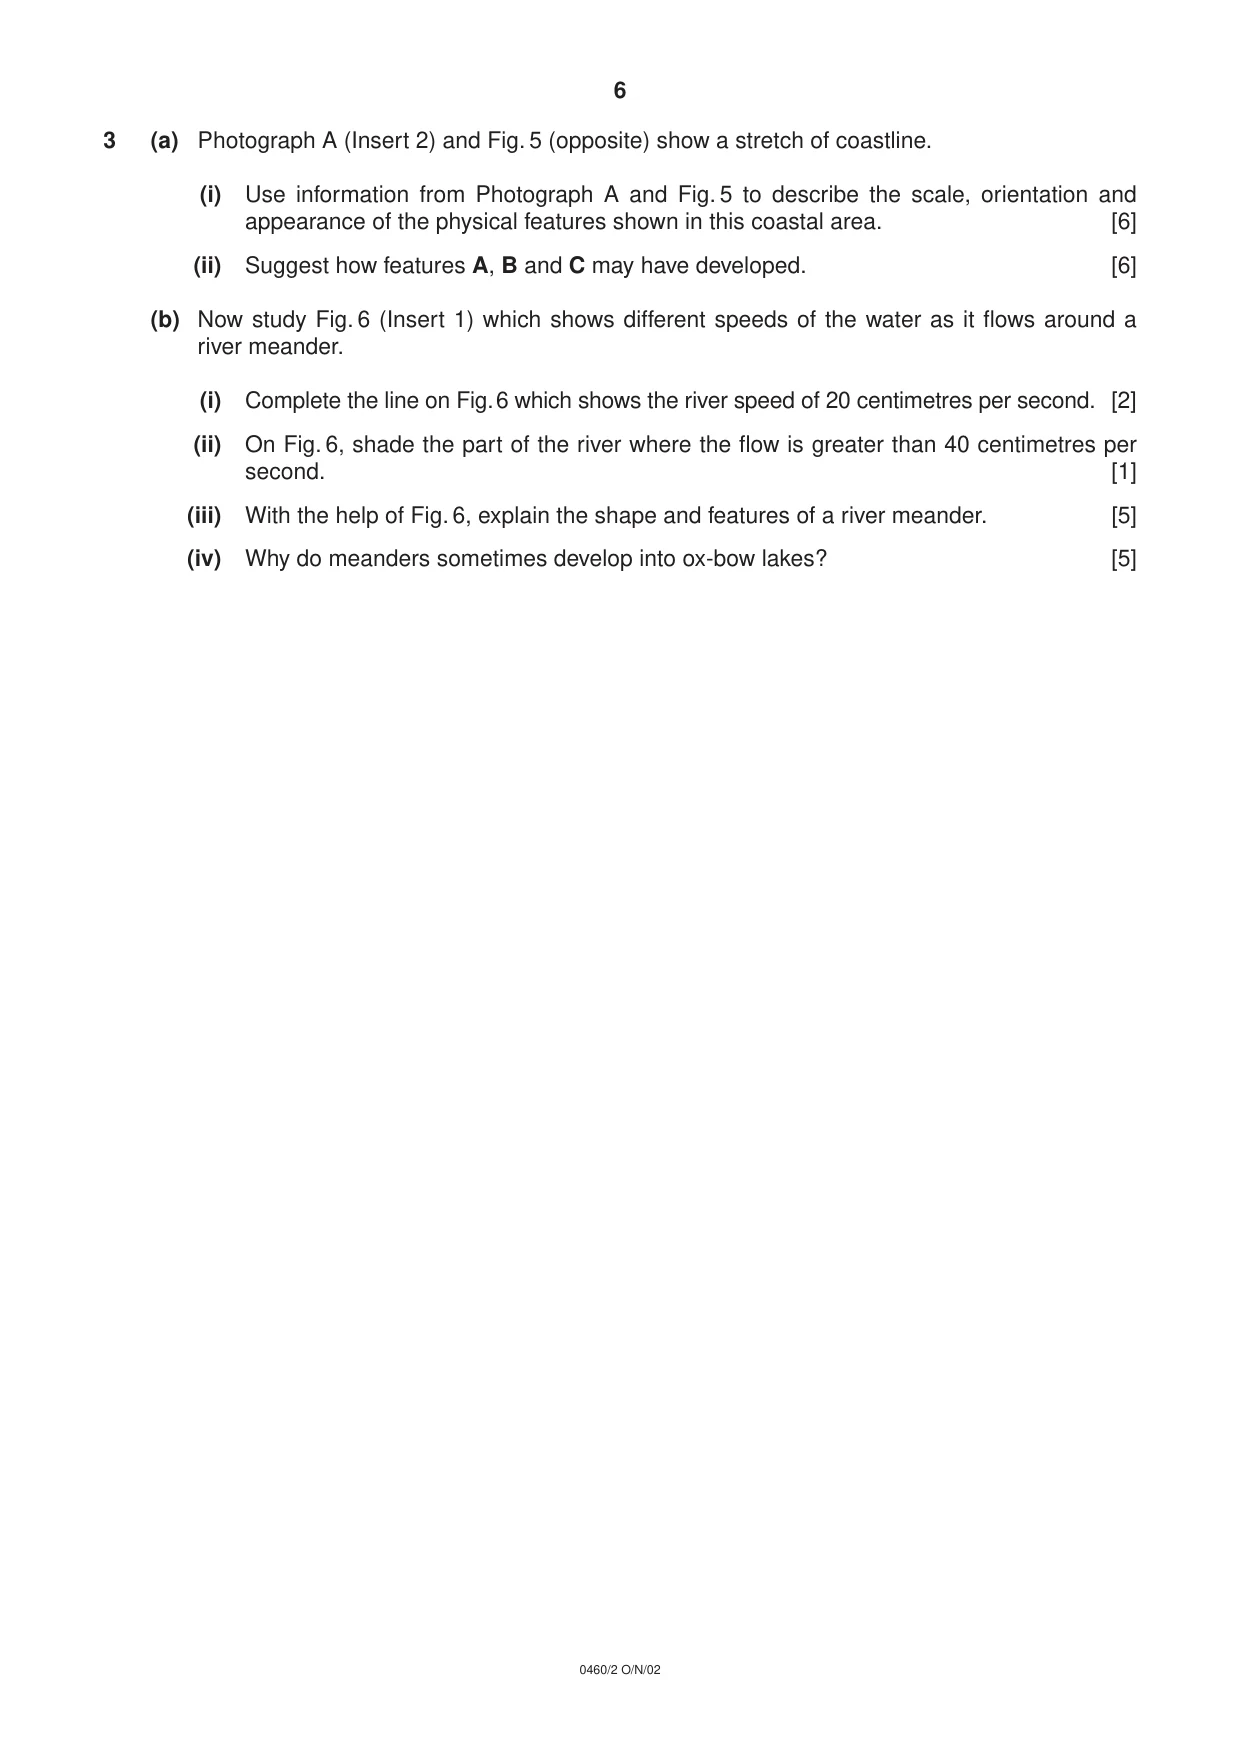
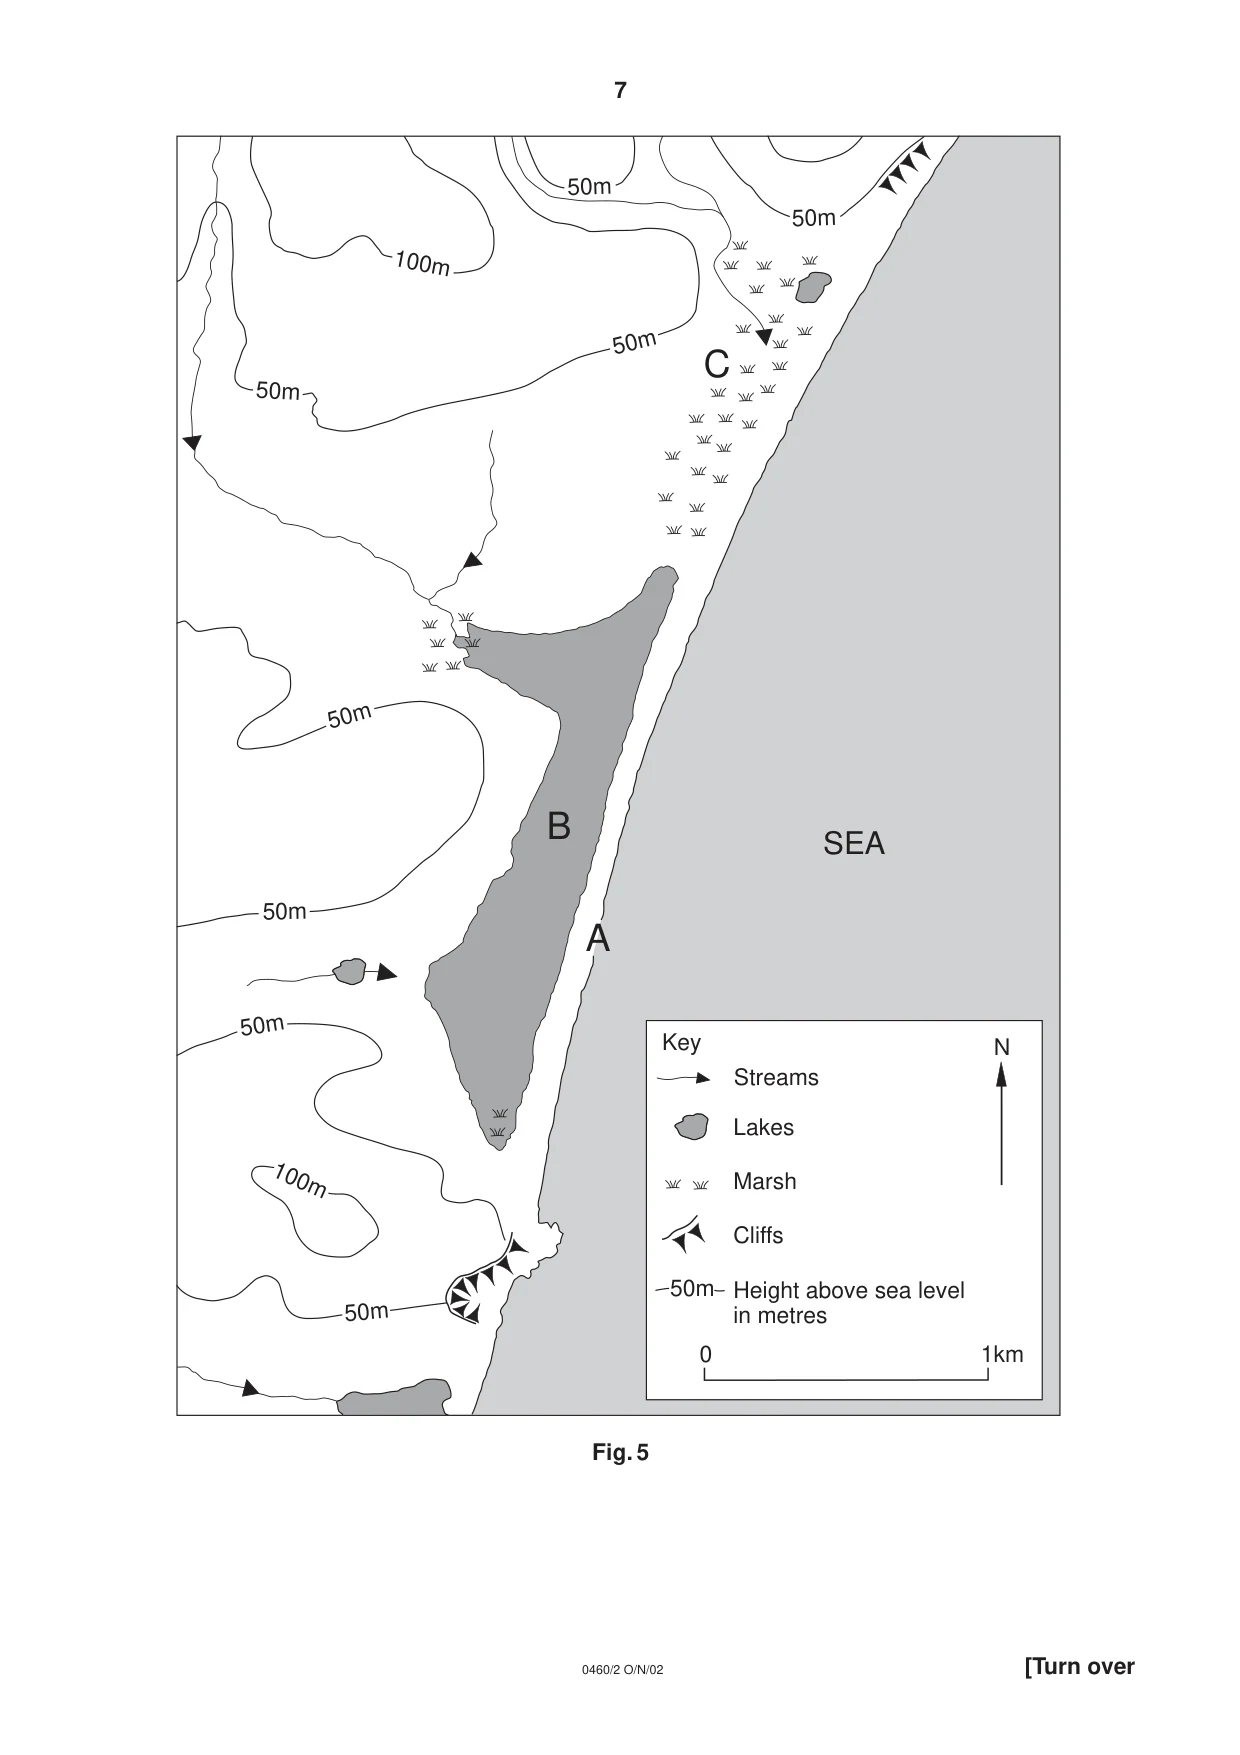
6 0460/2 O/N/02 3 (a) Photograph A (Insert 2) and Fig. 5 (opposite) show a stretch of coastline. (i) Use information from Photograph A and Fig. 5 to describe the scale, orientation and appearance of the physical features shown in this coastal area. [6] (ii) Suggest how features A, B and C may have developed. [6] (b) Now study Fig. 6 (Insert 1) which shows different speeds of the water as it flows around a river meander. (i) Complete the line on Fig.6 which shows the river speed of 20 centimetres per second. [2] (ii) On Fig. 6, shade the part of the river where the flow is greater than 40 centimetres per second. [1] (iii) With the help of Fig. 6, explain the shape and features of a river meander. [5] (iv) Why do meanders sometimes develop into ox-bow lakes? [5]
Question paper, page 7
7 0460/2 O/N/02 [Turn over Fig. 5 50m 50m 50m 50m 100m 50m SEA 100m 50m 50m 50m C B A Streams Lakes Marsh Cliffs Height above sea level in metres 50m Key 0 1km N
Question paper, page 8
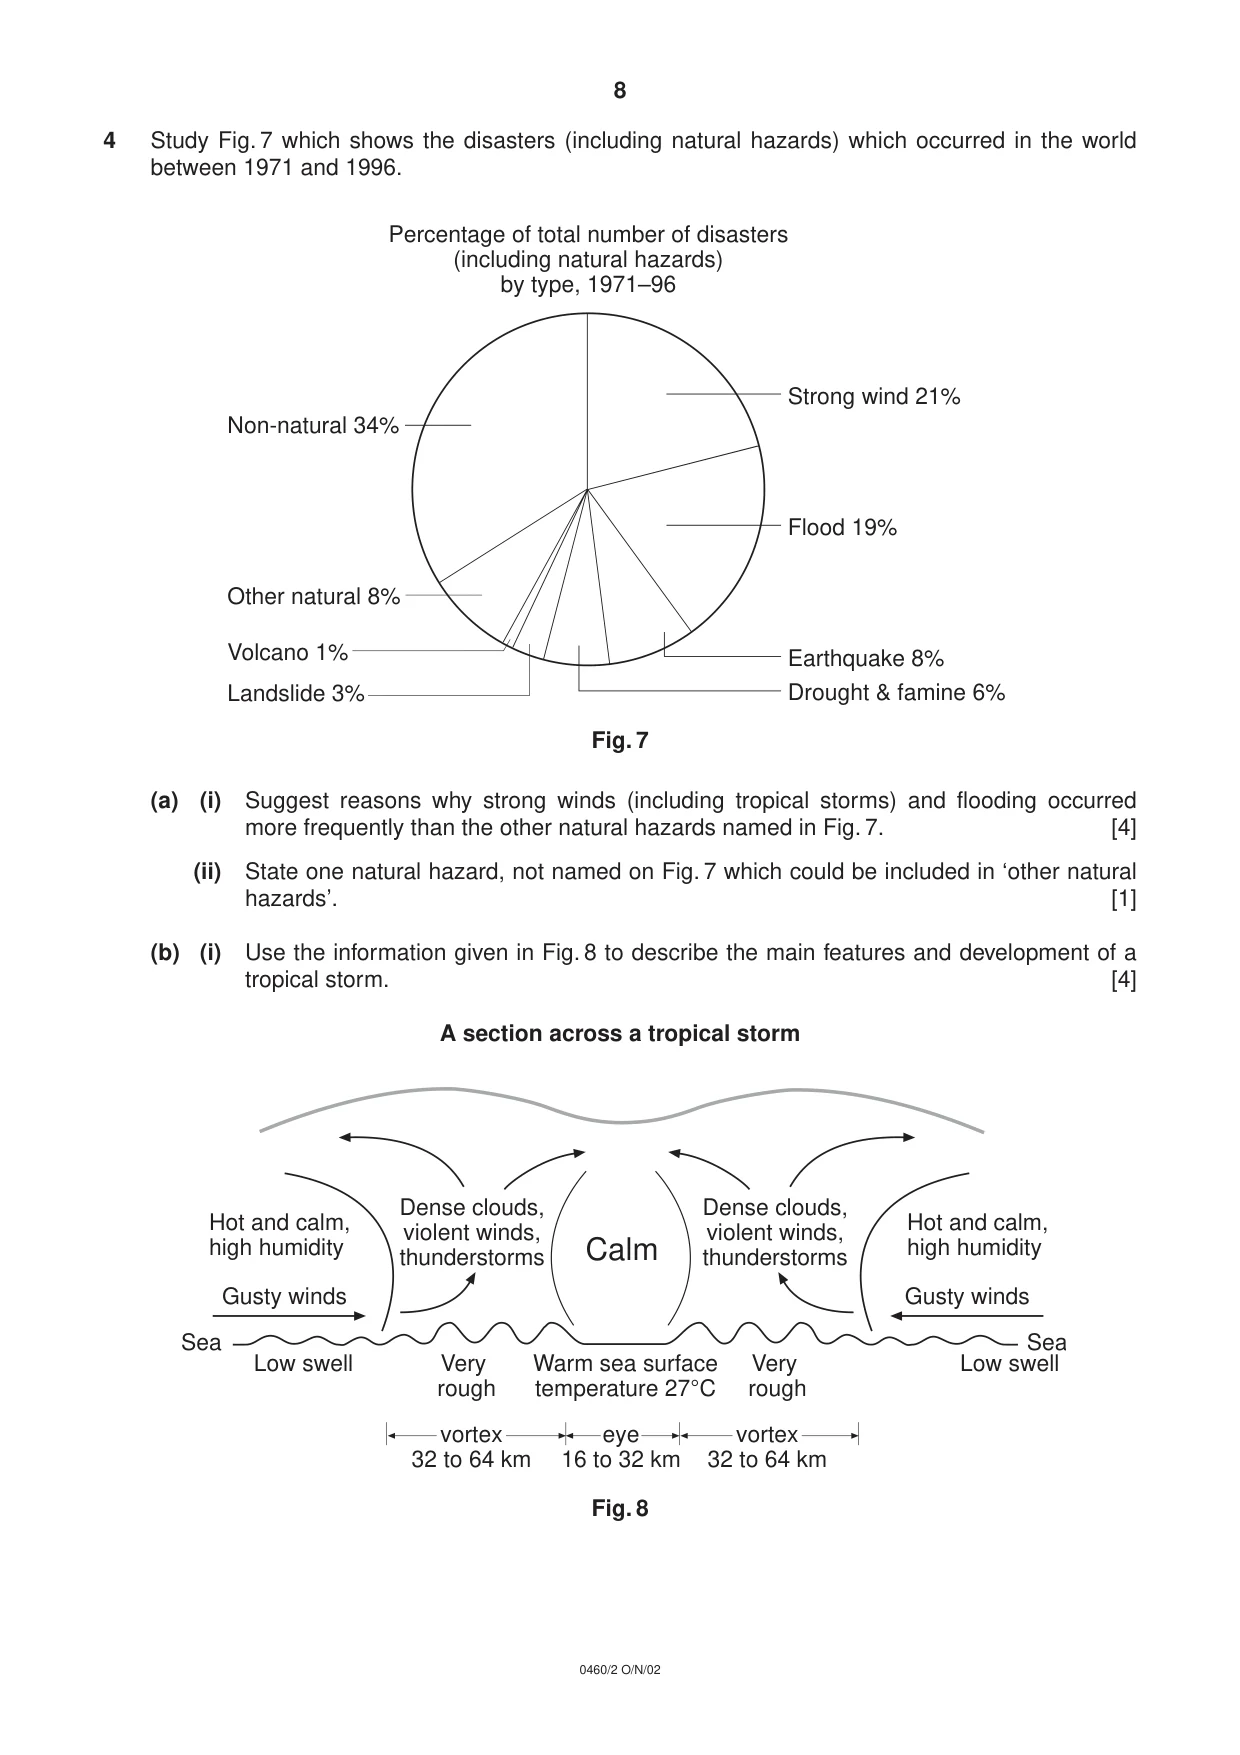
8 0460/2 O/N/02 4 Study Fig. 7 which shows the disasters (including natural hazards) which occurred in the world between 1971 and 1996. Fig. 7 (a) (i) Suggest reasons why strong winds (including tropical storms) and flooding occurred more frequently than the other natural hazards named in Fig. 7. [4] (ii) State one natural hazard, not named on Fig. 7 which could be included in ‘other natural hazards’. [1] (b) (i) Use the information given in Fig. 8 to describe the main features and development of a tropical storm. [4] A section across a tropical storm Fig. 8 Hot and calm, high humidity Gusty winds Sea Low swell Very rough Warm sea surface temperature 27°C Very rough Low swell Sea Dense clouds, violent winds, thunderstorms Dense clouds, violent winds, thunderstorms Hot and calm, high humidity Gusty winds Calm vortex 32 to 64 km eye 16 to 32 km vortex 32 to 64 km Percentage of total number of disasters (including natural hazards) by type, 1971–96 Non-natural 34% Other natural 8% Volcano 1% Landslide 3% Strong wind 21% Flood 19% Earthquake 8% Drought & famine 6%
Question paper, page 9
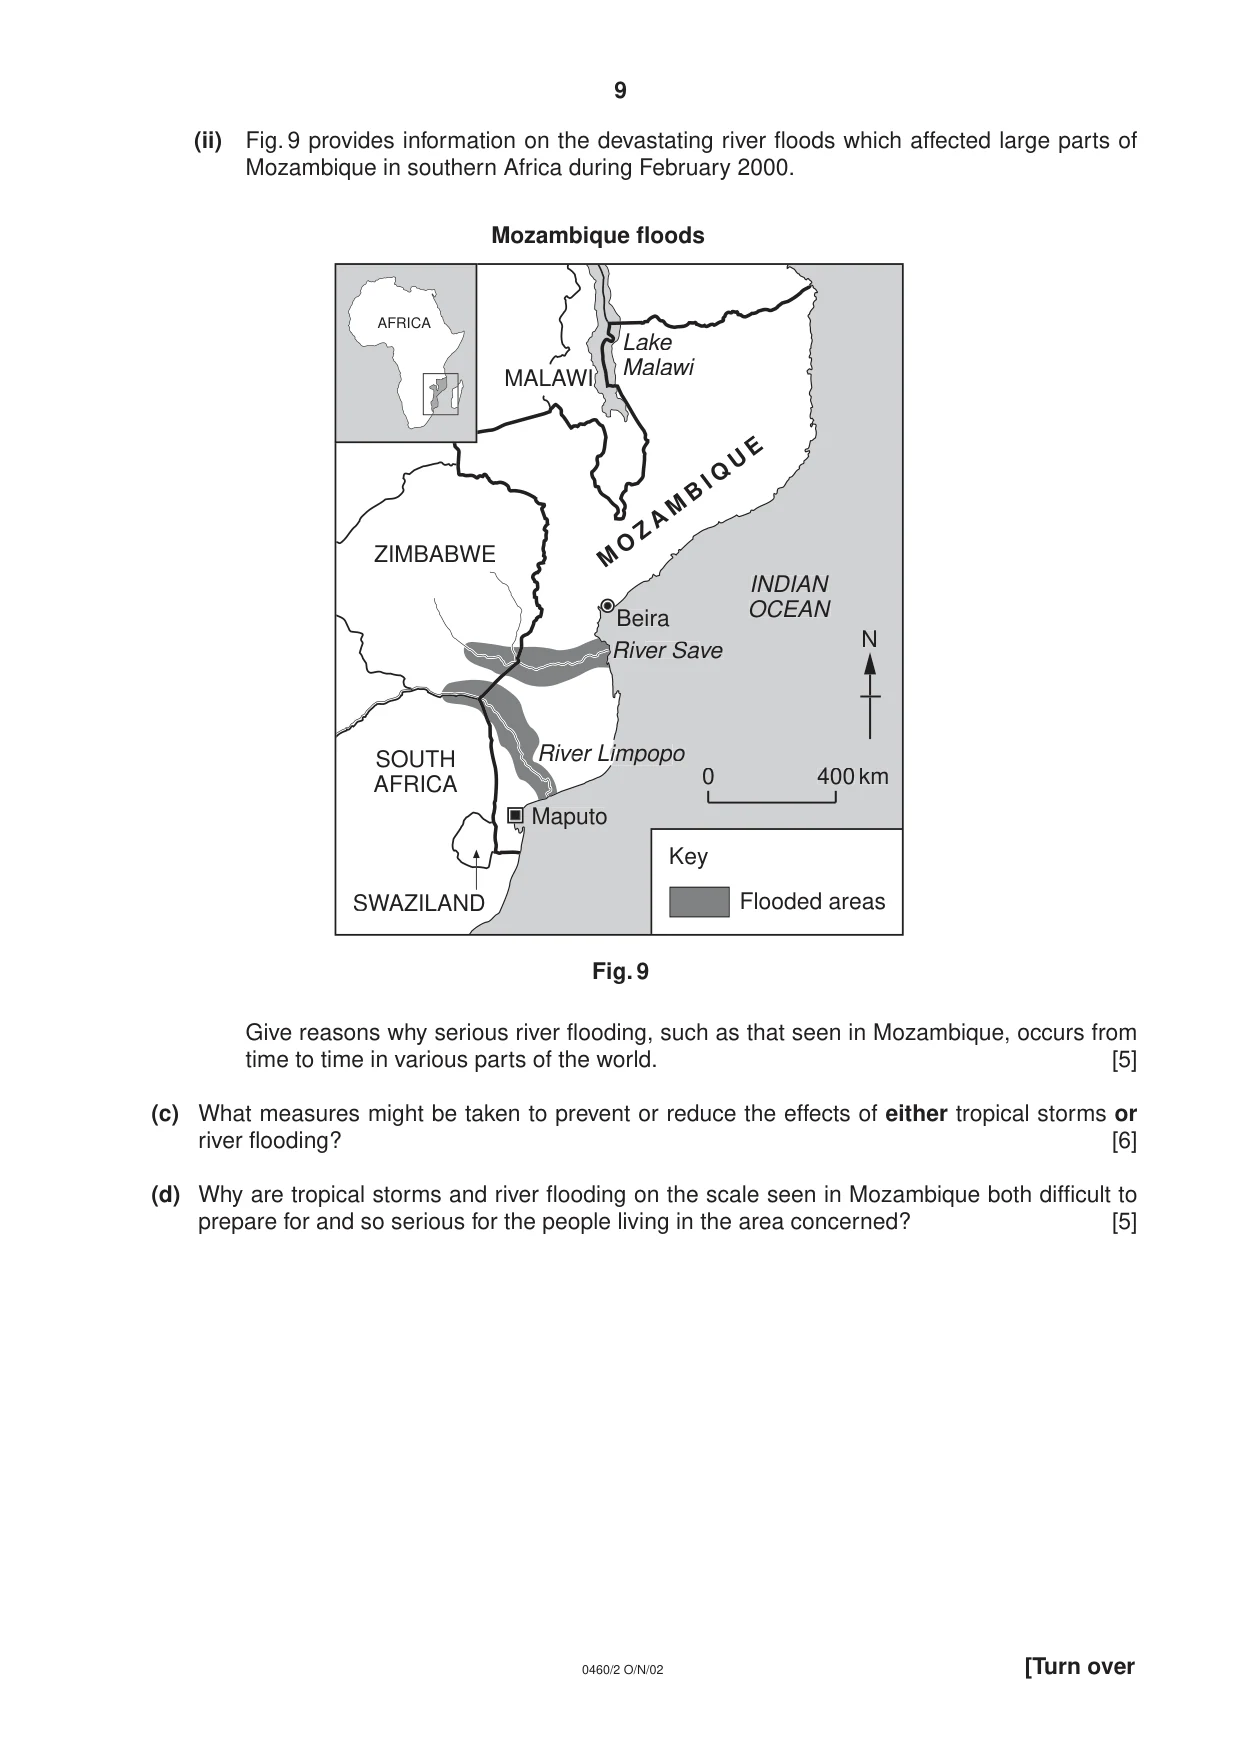
9 0460/2 O/N/02 [Turn over (ii) Fig. 9 provides information on the devastating river floods which affected large parts of Mozambique in southern Africa during February 2000. Fig. 9 Give reasons why serious river flooding, such as that seen in Mozambique, occurs from time to time in various parts of the world. [5] (c) What measures might be taken to prevent or reduce the effects of either tropical storms or river flooding? [6] (d) Why are tropical storms and river flooding on the scale seen in Mozambique both difficult to prepare for and so serious for the people living in the area concerned? [5] Beira Maputo SOUTH AFRICA ZIMBABWE M O Z A M B I Q U E MALAWI River Sa v ve River Lim impop v o INDIAN OCEAN Lake Malawi SWAZILAND W 0 400 km Key Flooded areas Mozambique floods AFRICA N
Question paper, page 10
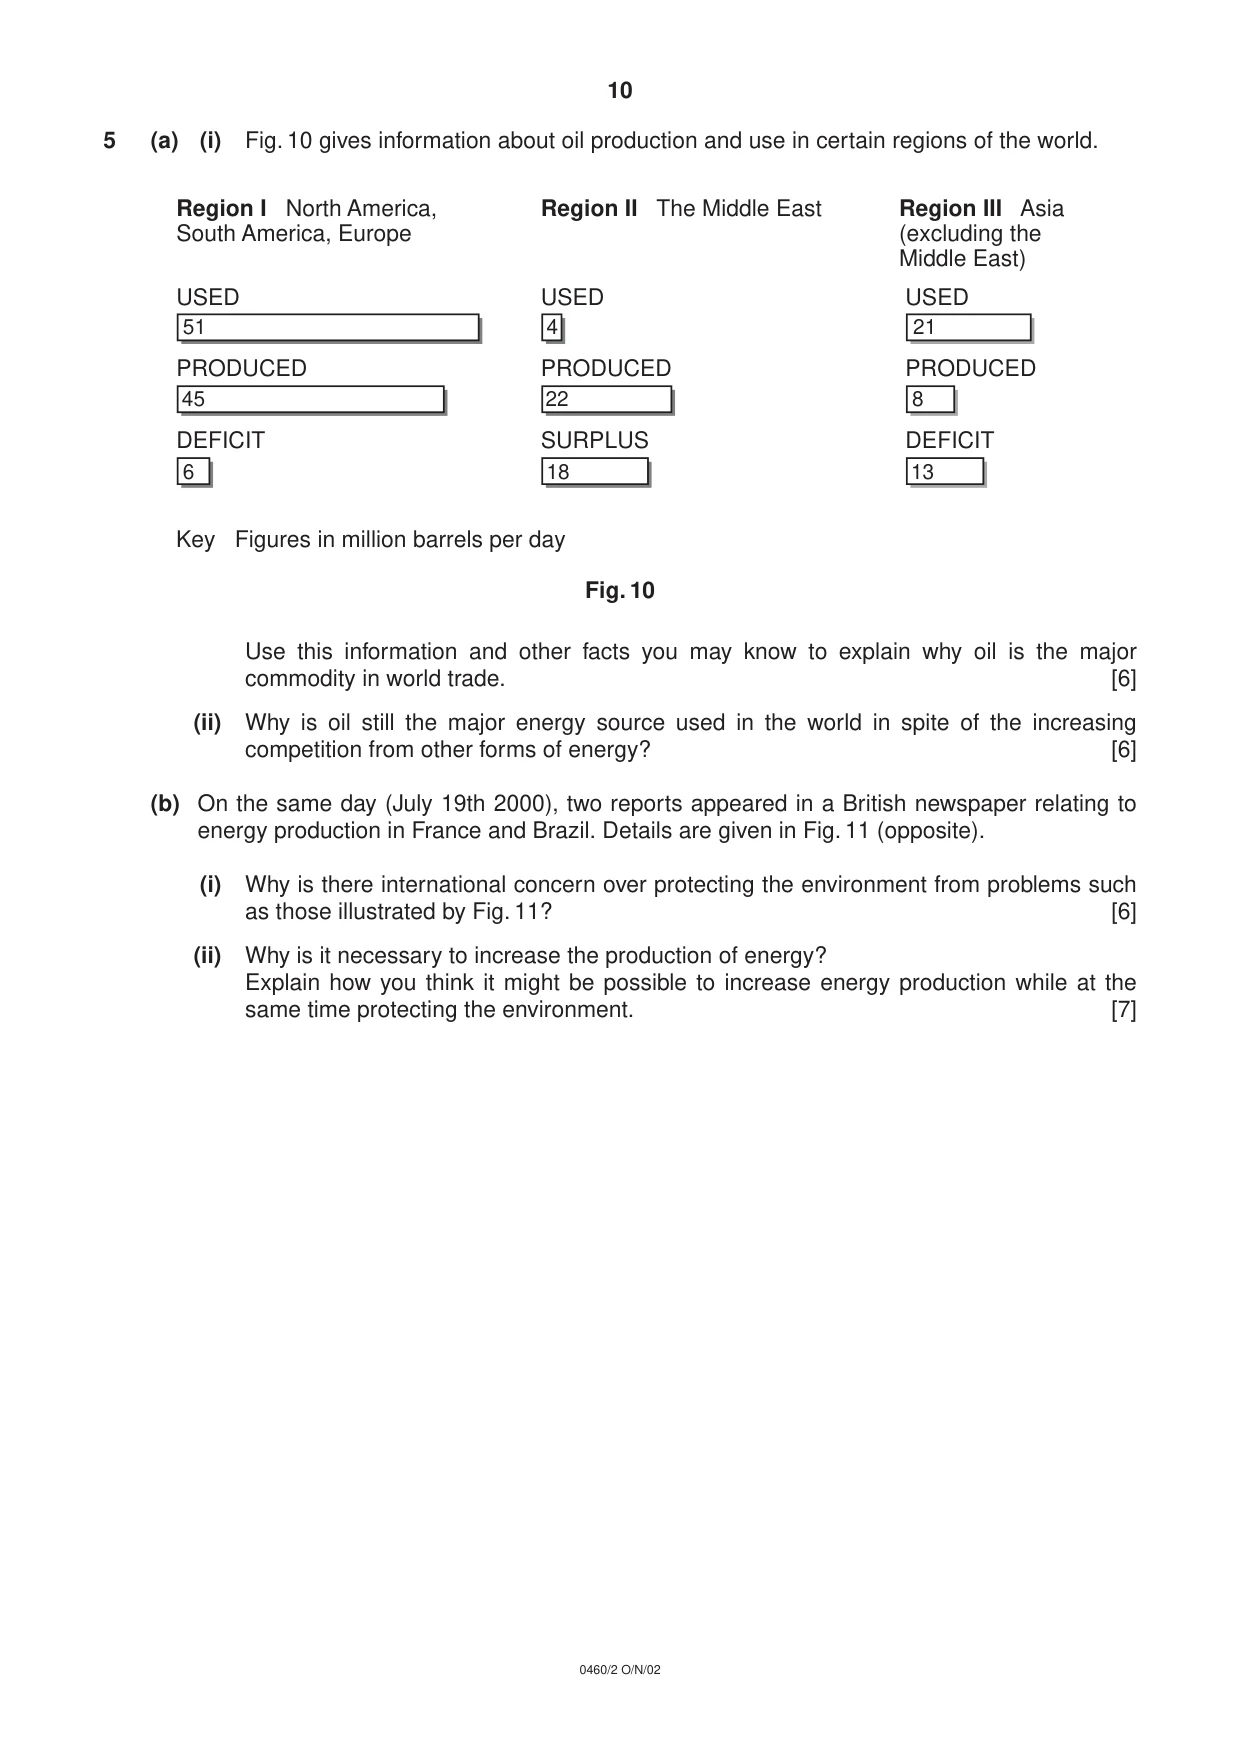
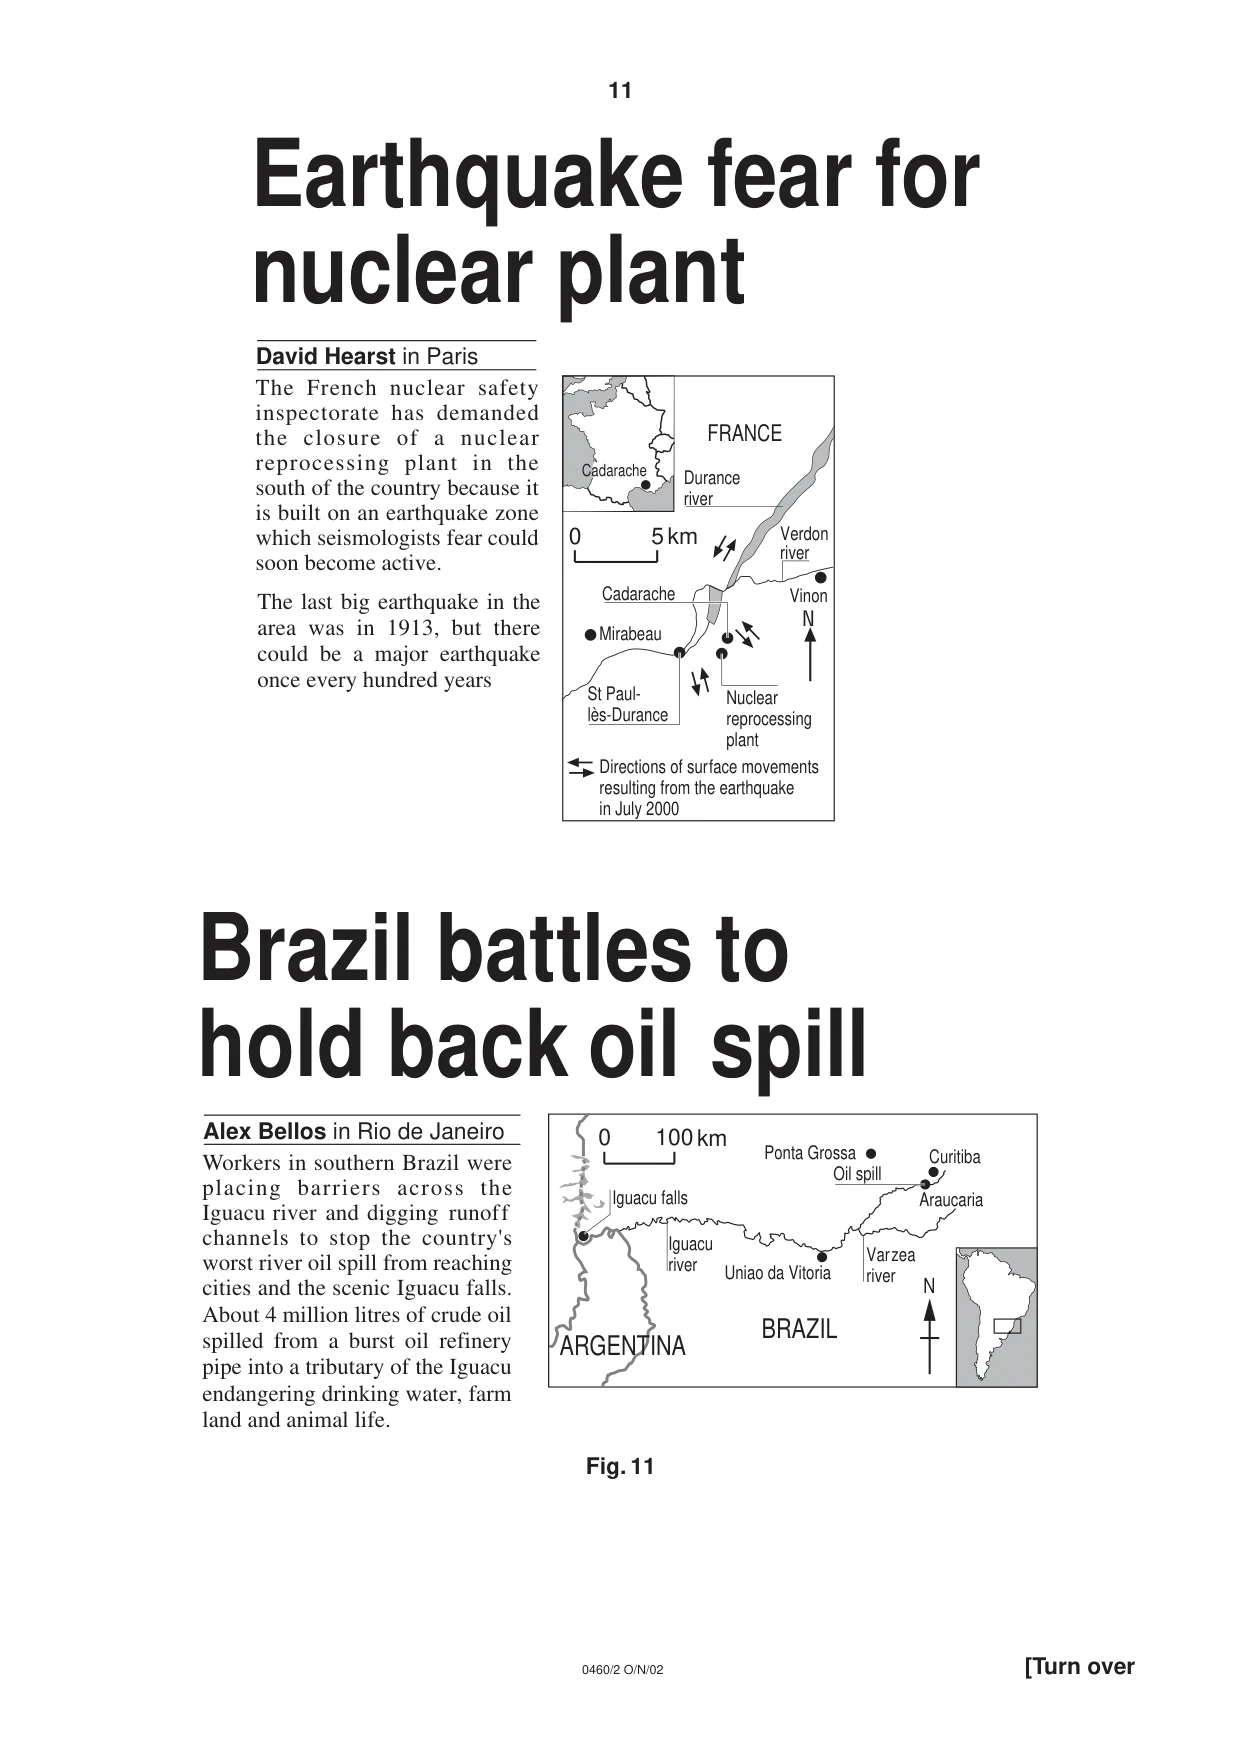
10 0460/2 O/N/02 5 (a) (i) Fig. 10 gives information about oil production and use in certain regions of the world. Fig. 10 Use this information and other facts you may know to explain why oil is the major commodity in world trade. [6] (ii) Why is oil still the major energy source used in the world in spite of the increasing competition from other forms of energy? [6] (b) On the same day (July 19th 2000), two reports appeared in a British newspaper relating to energy production in France and Brazil. Details are given in Fig. 11 (opposite). (i) Why is there international concern over protecting the environment from problems such as those illustrated by Fig. 11? [6] (ii) Why is it necessary to increase the production of energy? Explain how you think it might be possible to increase energy production while at the same time protecting the environment. [7] USED PRODUCED DEFICIT Region I North America, South America, Europe USED PRODUCED SURPLUS Region II The Middle East USED PRODUCED DEFICIT Region III Asia (excluding the Middle East) 51 45 6 4 22 18 21 8 13 Key Figures in million barrels per day
Question paper, page 11
11 0460/2 O/N/02 [Turn over Fig. 11 Ponta Grossa Alex Bellos in Rio de Janeiro Brazil battles to hold back oil spill Workers in southern Brazil were placing barriers across the Iguacu river and digging runoff channels to stop the country's worst river oil spill from reaching cities and the scenic Iguacu falls. Curitiba Araucaria Oil spill Varzea river Uniao da Vitoria BRAZIL Iguacu river Iguacu falls ARGENTINA 0 100km About 4 million litres of crude oil spilled from a burst oil refinery pipe into a tributary of the Iguacu endangering drinking water, farm land and animal life. N 0 5 km David Hearst in Paris Earthquake fear for nuclear plant The French nuclear safety inspectorate has demanded the closure of a nuclear reprocessing plant in the south of the country because it is built on an earthquake zone which seismologists fear could soon become active. Nuclear reprocessing plant Cadarache Mirabeau St Paul- lès-Durance Directions of surface movements resulting from the earthquake in July 2000 Durance river Verdon river Vinon FRANCE Cadarache The last big earthquake in the area was in 1913, but there could be a major earthquake once every hundred years N
Question paper, page 12
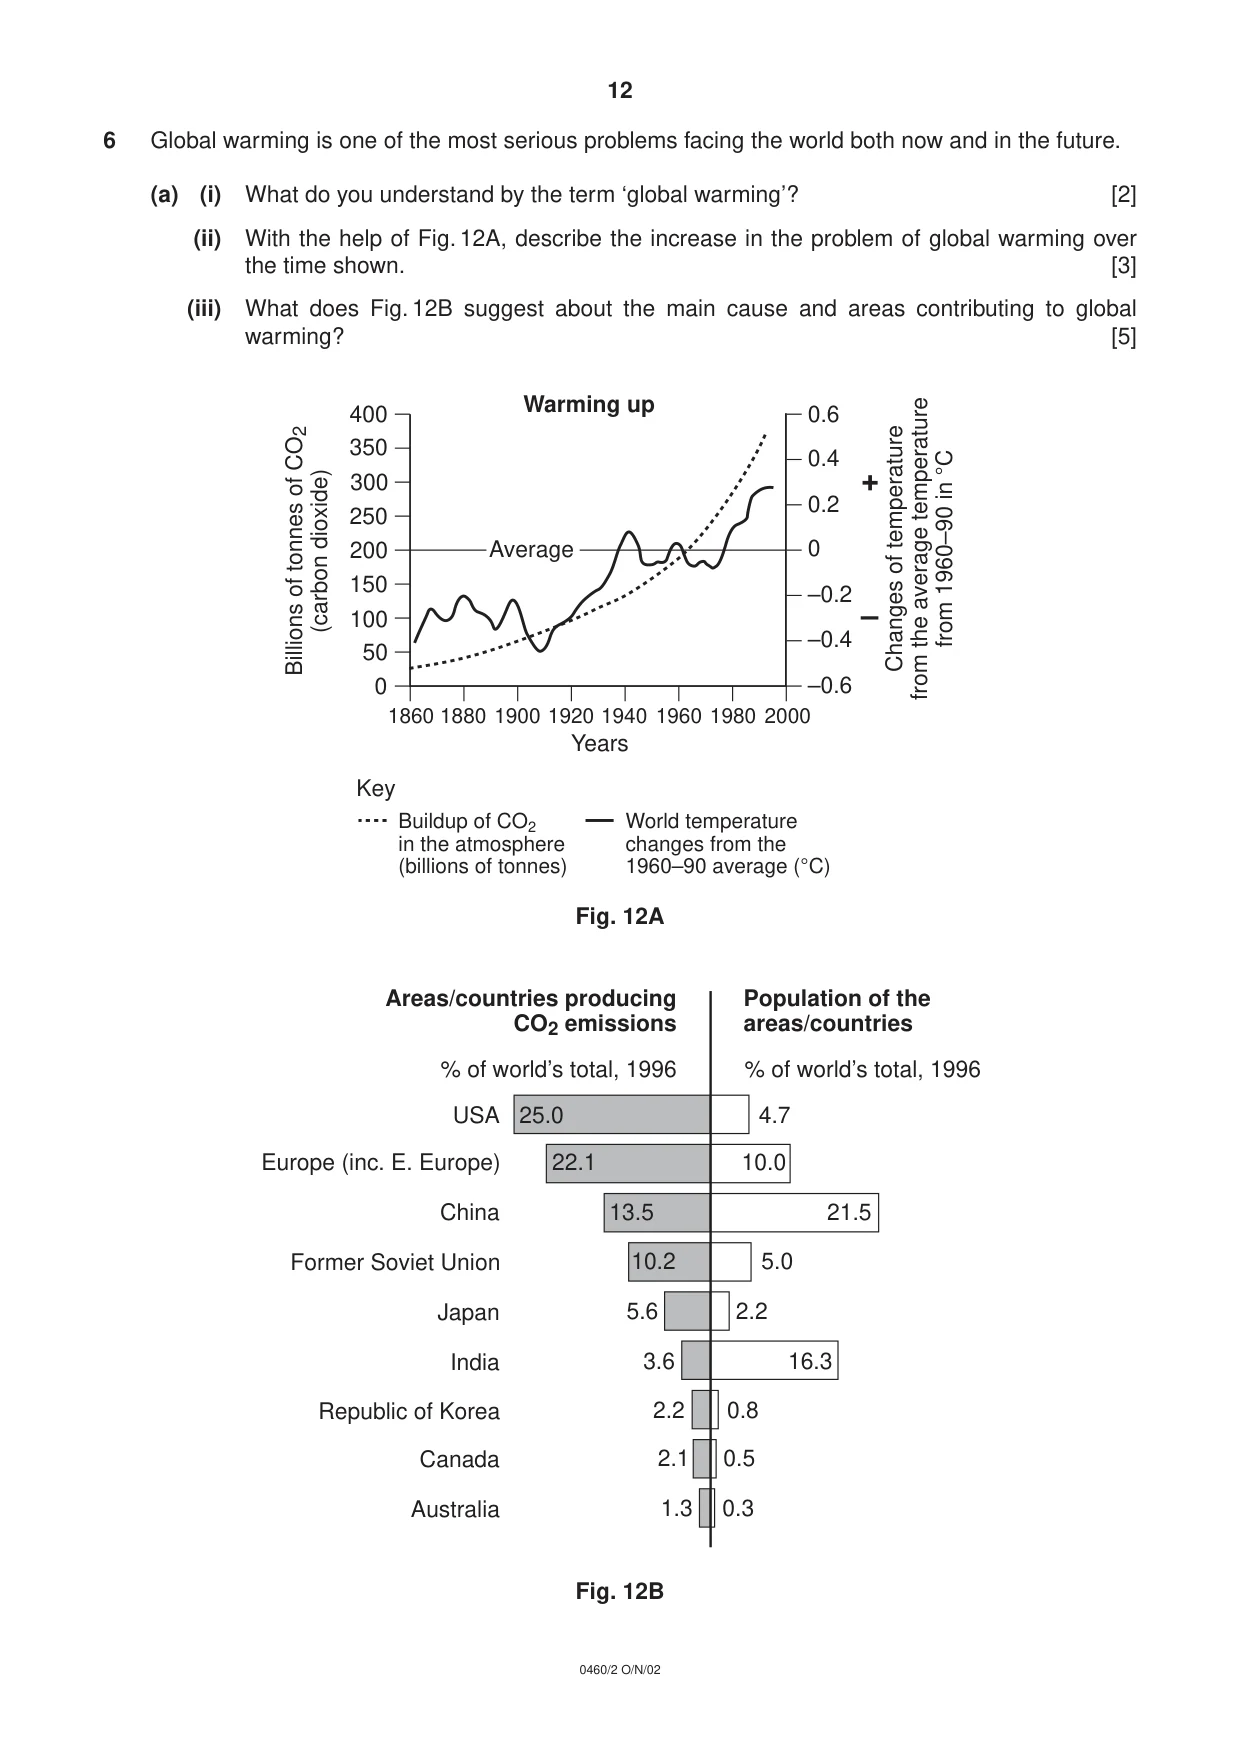
12 0460/2 O/N/02 6 Global warming is one of the most serious problems facing the world both now and in the future. (a) (i) What do you understand by the term ‘global warming’? [2] (ii) With the help of Fig. 12A, describe the increase in the problem of global warming over the time shown. [3] (iii) What does Fig. 12B suggest about the main cause and areas contributing to global warming? [5] Fig. 12A Fig. 12B 25.0 USA 22.1 Europe (inc. E. Europe) 13.5 China 10.2 Former Soviet Union 5.6 Japan 3.6 India 2.2 Republic of Korea 2.1 Canada 1.3 Australia 4.7 10.0 21.5 5.0 2.2 16.3 0.8 0.5 0.3 Areas/countries producing CO2 emissions Population of the areas/countries % of world’s total, 1996 % of world’s total, 1996 0 400 Billions of tonnes of CO2 (carbon dioxide) 1860 Years 2000 1880 1900 1920 1940 1960 1980 0.6 0.4 0.2 0 –0.2 –0.4 –0.6 + – Average 350 300 250 200 150 100 50 Changes of temperature from the average temperature from 1960–90 in °C Warming up Buildup of CO2 in the atmosphere (billions of tonnes) World temperature changes from the 1960–90 average (°C) Key
Question paper, page 13
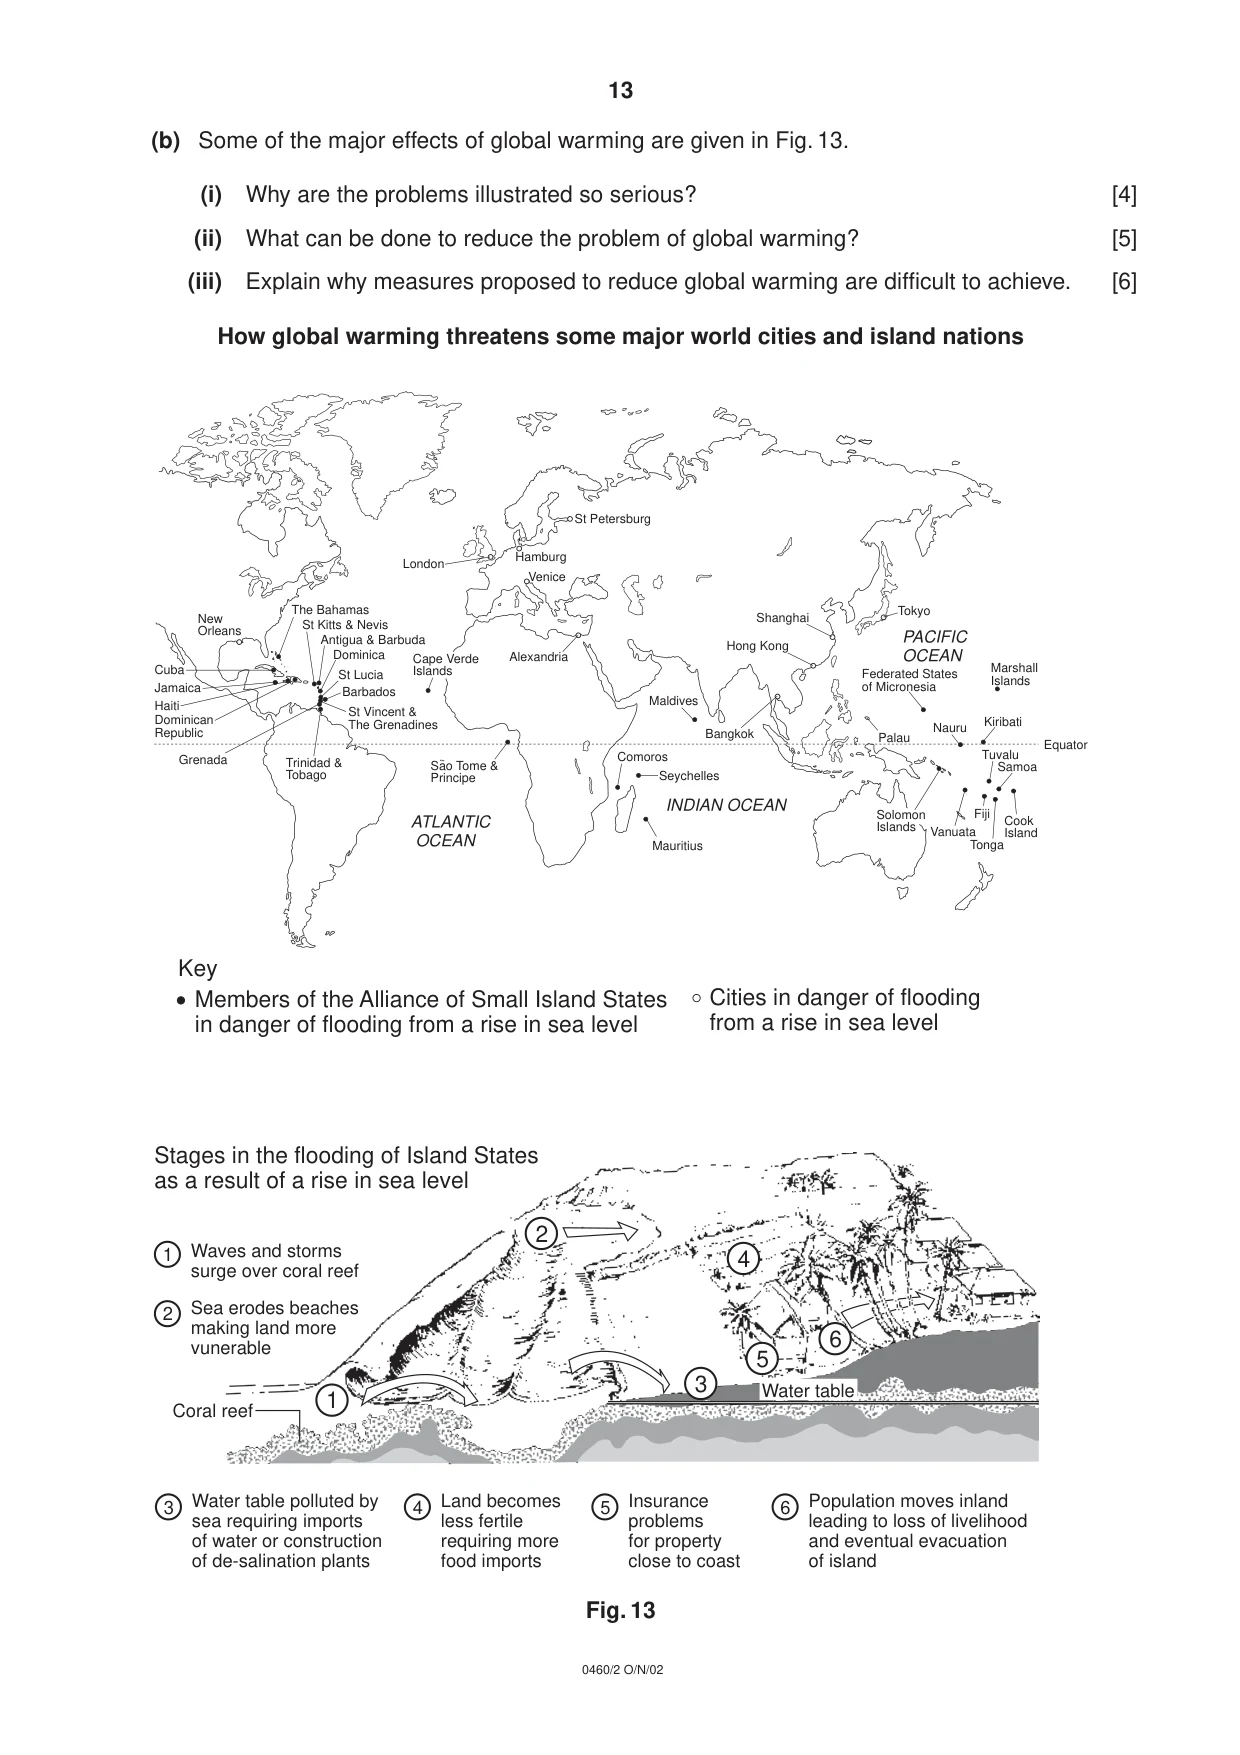
13 0460/2 O/N/02 (b) Some of the major effects of global warming are given in Fig. 13. (i) Why are the problems illustrated so serious? [4] (ii) What can be done to reduce the problem of global warming? [5] (iii) Explain why measures proposed to reduce global warming are difficult to achieve. [6] How global warming threatens some major world cities and island nations Fig. 13 New Orleans Cuba Jamaica Haiti Dominican Republic Trinidad & Tobago The Bahamas St Kitts & Nevis Antigua & Barbuda Dominica St Lucia Barbados St Vincent & The Grenadines Grenada London Alexandria Venice Hamburg St Petersburg Maldives Mauritius Comoros Seychelles ATLANTIC OCEAN INDIAN OCEAN PACIFIC OCEAN Bangkok Hong Kong Shanghai Tokyo Solomon Islands Vanuata Fiji Tonga Samoa Tuvalu Nauru Kiribati Cook Island Palau Marshall Islands Federated States of Micronesia Members of the Alliance of Small Island States in danger of flooding from a rise in sea level Cities in danger of flooding from a rise in sea level Key Equator Stages in the flooding of Island States as a result of a rise in sea level 1 1 Waves and storms surge over coral reef 2 Sea erodes beaches making land more vunerable 3 Water table polluted by sea requiring imports of water or construction of de-salination plants 4 Land becomes less fertile requiring more food imports 5 Insurance problems for property close to coast 6 Population moves inland leading to loss of livelihood and eventual evacuation of island 2 3 5 4 6 Coral reef Water table Cape Verde Islands Sao Tome & Principe ~
Question paper, page 16
16 0460/2 O/N/02 Copyright Acknowledgements: Question 1 World and Country Population Charts, published by The Telegraph Group. Question 2 ‘© The Economist Newspaper Limited, London. 5 September 1998’ Question 4a ‘© The Economist Newspaper Limited, London. 6 September 1997’ Question 4b Fig. 8 Chart by R Bunnett. Physical Geography. Longman Group UK Limited 1973, 1988, reprinted by permission of Pearson Education Limited. Question 5a Three Regional Charts of America. Published by The Observer, 3rd September 2000. Question 5c Earthquake fear for Nuclear Plant by David Hearst. Published by The Guardian, 19th July 2000. Question 6 Charts of Global Warming and CO2 emissions. Published by The Guardiean, 10th October 1997. Cambridge International Examinations has made every effort to trace copyright holders, but if we have inadvertently overlooked any we will be pleased to make the necessary arrangements at the first opportunity.
Mark scheme, page 1
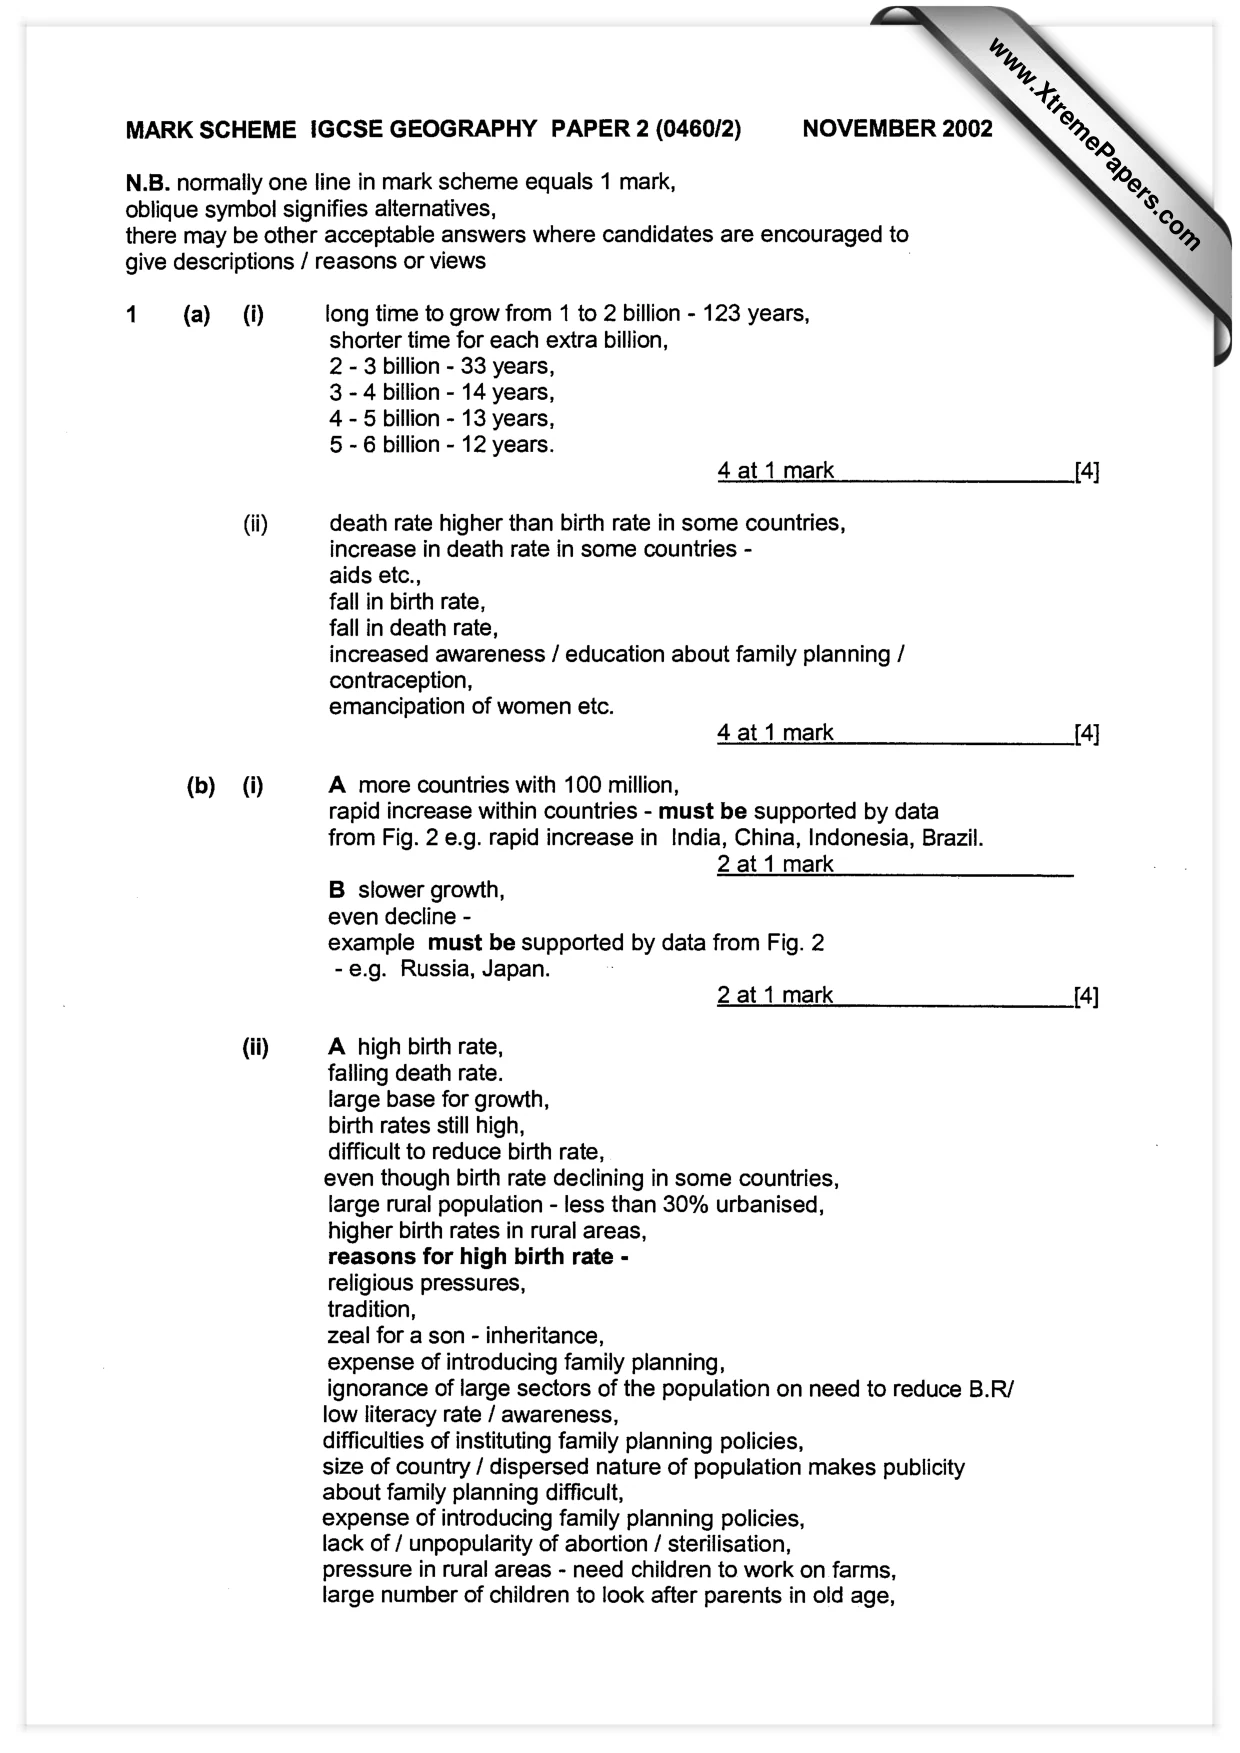
MARK SCHEME IGCSE GEOGRAPHY PAPER 2 (0460/2) NOVEMBER 2002 N.B. normally one line in mark scheme equals 1 mark, oblique symbol signifies alternatives, there may be other acceptable answers where candidates are encouraged to give descriptions / reasons or views 1 (a) (i) long time to grow from 1 to 2 billion - 123 years, shorter time for each extra billion, 2 - 3 billion - 33 years, 3 - 4 billion - 14 years, 4-5 billion - 13 years, 5 -6 billion - 12 years. 4 at 1 mark [4] (ii) death rate higher than birth rate in some countries, increase in death rate in some countries - aids etc., fall in birth rate, fall in death rate, increased awareness / education about family planning / contraception, emancipation of women etc. 4 at 1 mark [4] (b) (i) A more countries with 100 million, rapid increase within countries - must be supported by data from Fig. 2 e.g. rapid increase in India, China, Indonesia, Brazil. 2 at 1 mark B slower growth, even decline - example must be supported by data from Fig. 2 -e.g. Russia, Japan. 2 at 1 mark [4] (ii) A high birth rate, falling death rate. large base for growth, birth rates still high, difficult to reduce birth rate, even though birth rate declining in some countries, large rural population - less than 30% urbanised, higher birth rates in rural areas, reasons for high birth rate - religious pressures, tradition, zeal for a son - inheritance, expense of introducing family planning, ignorance of large sectors of the population on need to reduce B.R/ low literacy rate / awareness, difficulties of instituting family planning policies, size of country / dispersed nature of population makes publicity about family planning difficult, expense of introducing family planning policies, lack of / unpopularity of abortion / sterilisation, pressure in rural areas - need children to work on farms, large number of children to look after parents in old age,
Mark scheme, page 2
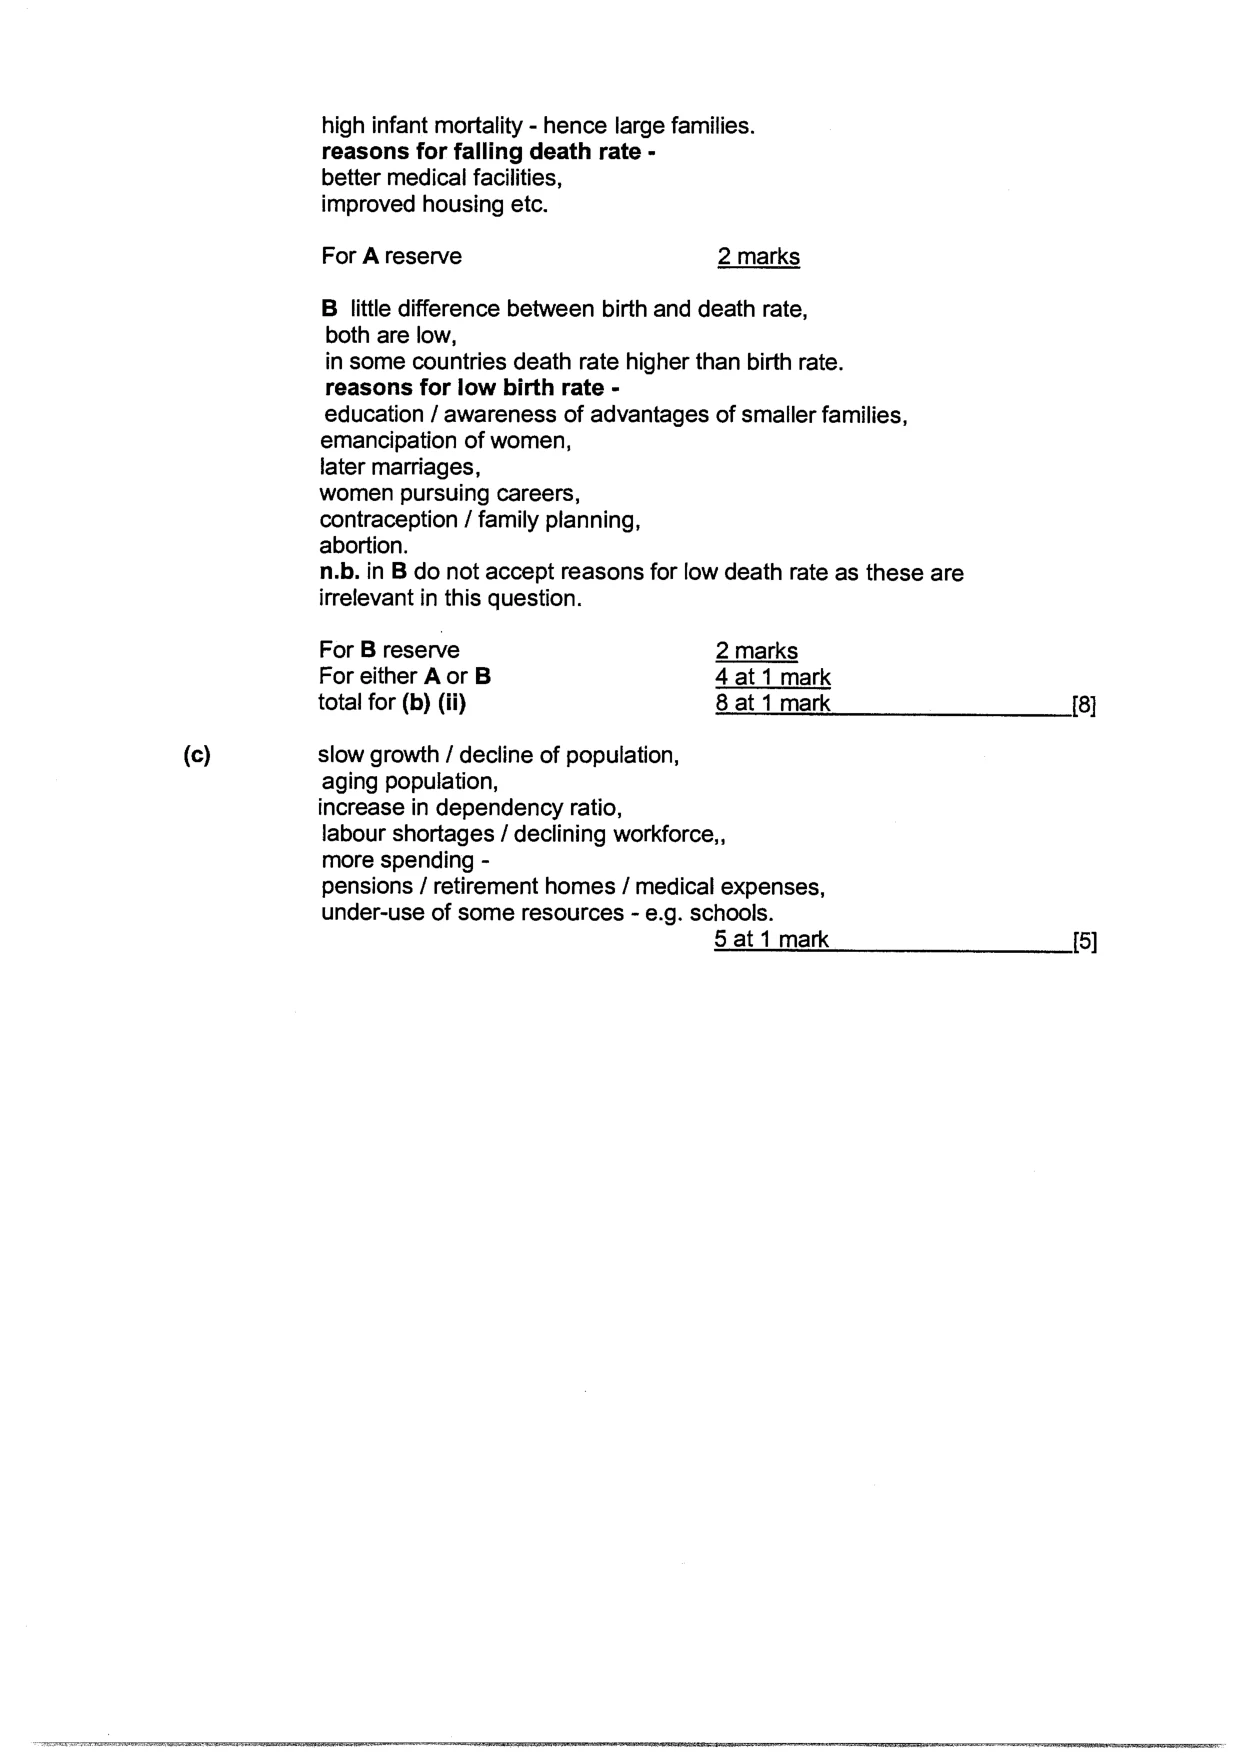
(c) high infant mortality - hence large families. reasons for falling death rate - better medical facilities, improved housing etc. For A reserve 2 marks B little difference between birth and death rate, both are low, in some countries death rate higher than birth rate. reasons for low birth rate - education / awareness of advantages of smaller families, emancipation of women, later marriages, women pursuing careers, contraception / family planning, abortion. n.b. in B do not accept reasons for low death rate as these are irrelevant in this question. For B reserve 2 marks For either A or B 4 at 1 mark total for (b) (ii) 8 at 1 mark [8] slow growth / decline of population, aging population, increase in dependency ratio, labour shortages / declining workforce,, more spending - pensions / retirement homes / medical expenses, under-use of some resources - e.g. schools. 5S at 1 mark [5]
Mark scheme, page 3
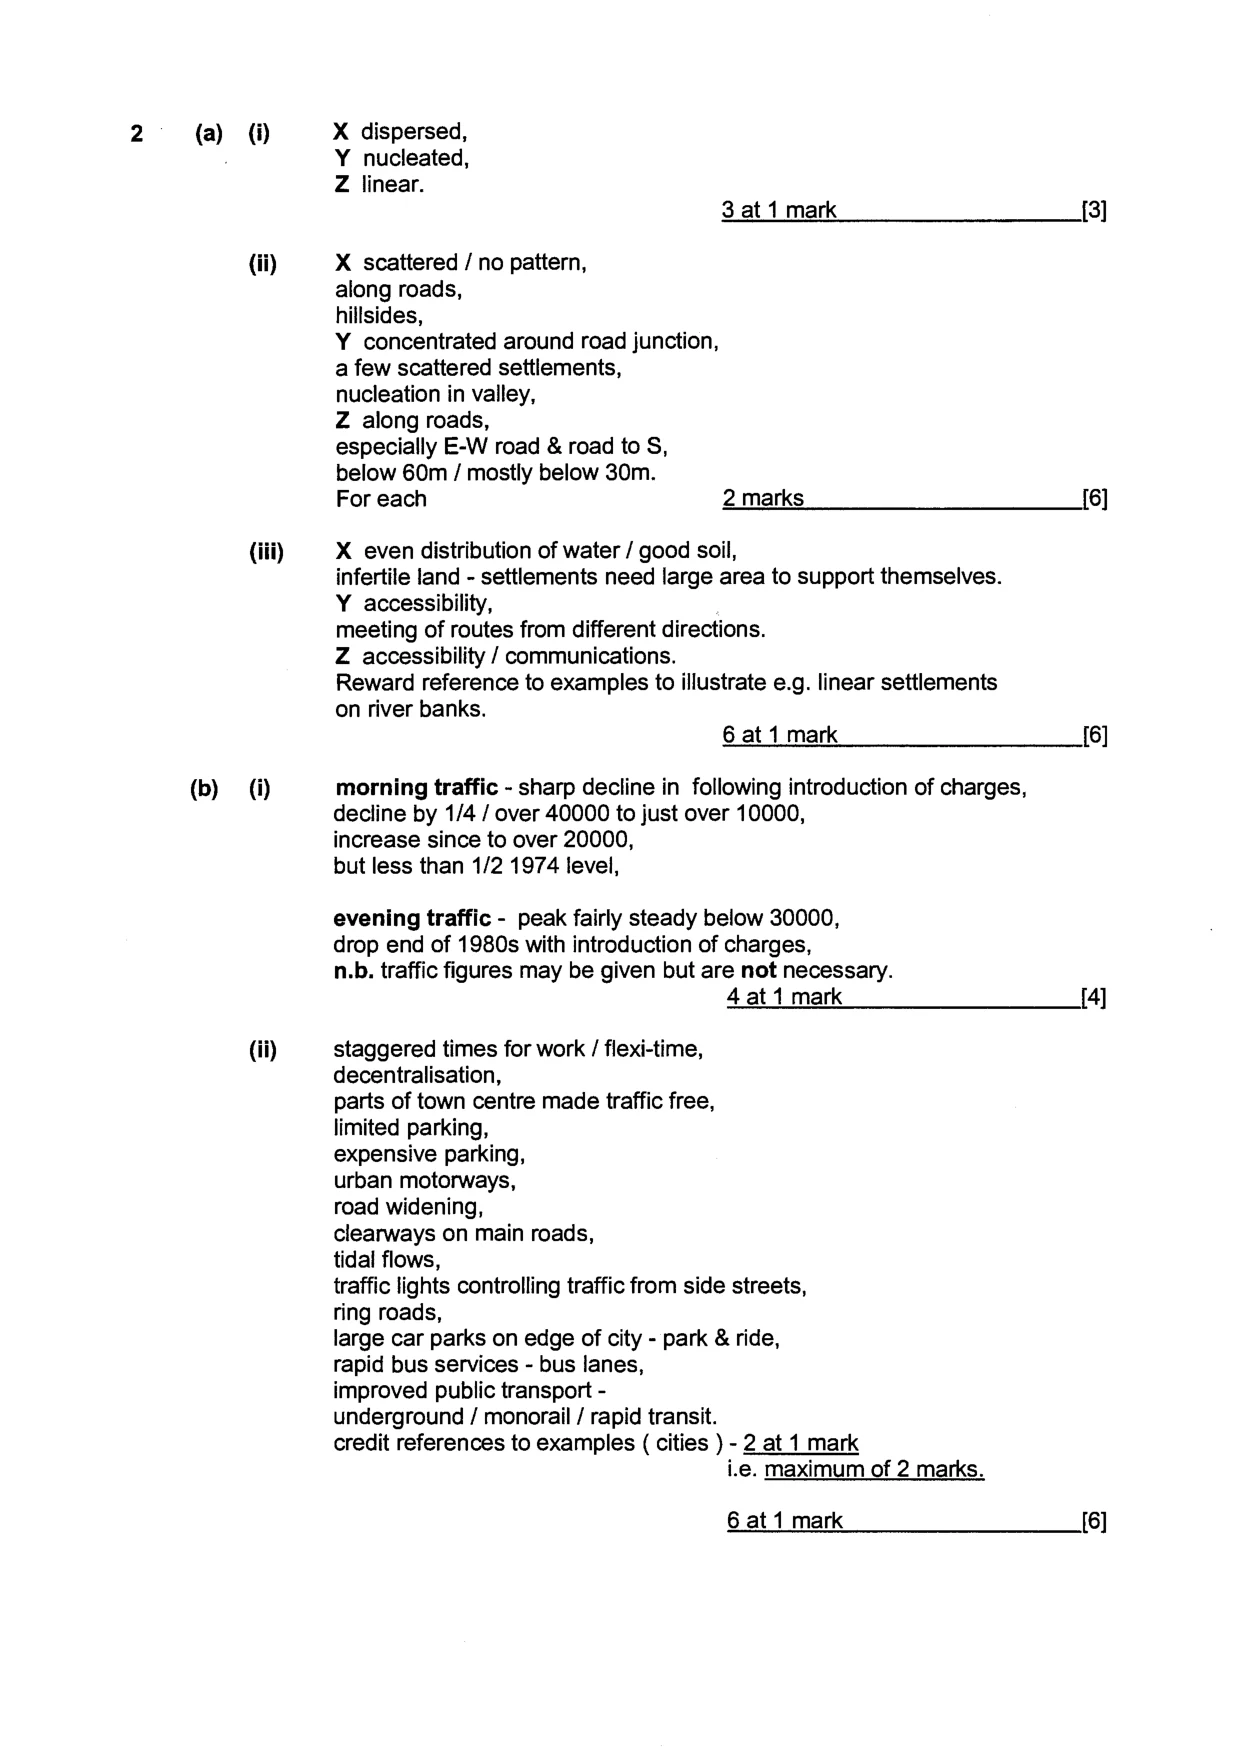
2 (a) @ (b) (ii) (iii) (i) (ii) X dispersed, Y nucleated, Z linear. 3 at 1 mark {3] X scattered / no pattern, along roads, hillsides, Y concentrated around road junction, a few scattered settlements, nucleation in valley, Z along roads, especially E-W road & road to S, below 60m / mostly below 30m. For each 2marks 6] X even distribution of water / good soil, infertile land - settlements need large area to support themselves. Y accessibility, meeting of routes from different directions. Z accessibility / communications. Reward reference to examples to illustrate e.g. linear settlements on river banks. 6 at 1 mark [6] morning traffic - sharp decline in following introduction of charges, decline by 1/4 / over 40000 to just over 10000, increase since to over 20000, but less than 1/2 1974 level, evening traffic - peak fairly steady below 30000, drop end of 1980s with introduction of charges, n.b. traffic figures may be given but are not necessary. 4 at 1 mark [4] staggered times for work / flexi-time, decentralisation, parts of town centre made traffic free, limited parking, expensive parking, urban motorways, road widening, clearways on main roads, tidal flows, traffic lights controlling traffic from side streets, ring roads, large car parks on edge of city - park & ride, rapid bus services - bus lanes, improved public transport - underground / monorail / rapid transit. credit references to examples ( cities ) - 2 at 1 mark ie. maximum of 2 marks. 6 at 1 mark [6]
Mark scheme, page 4
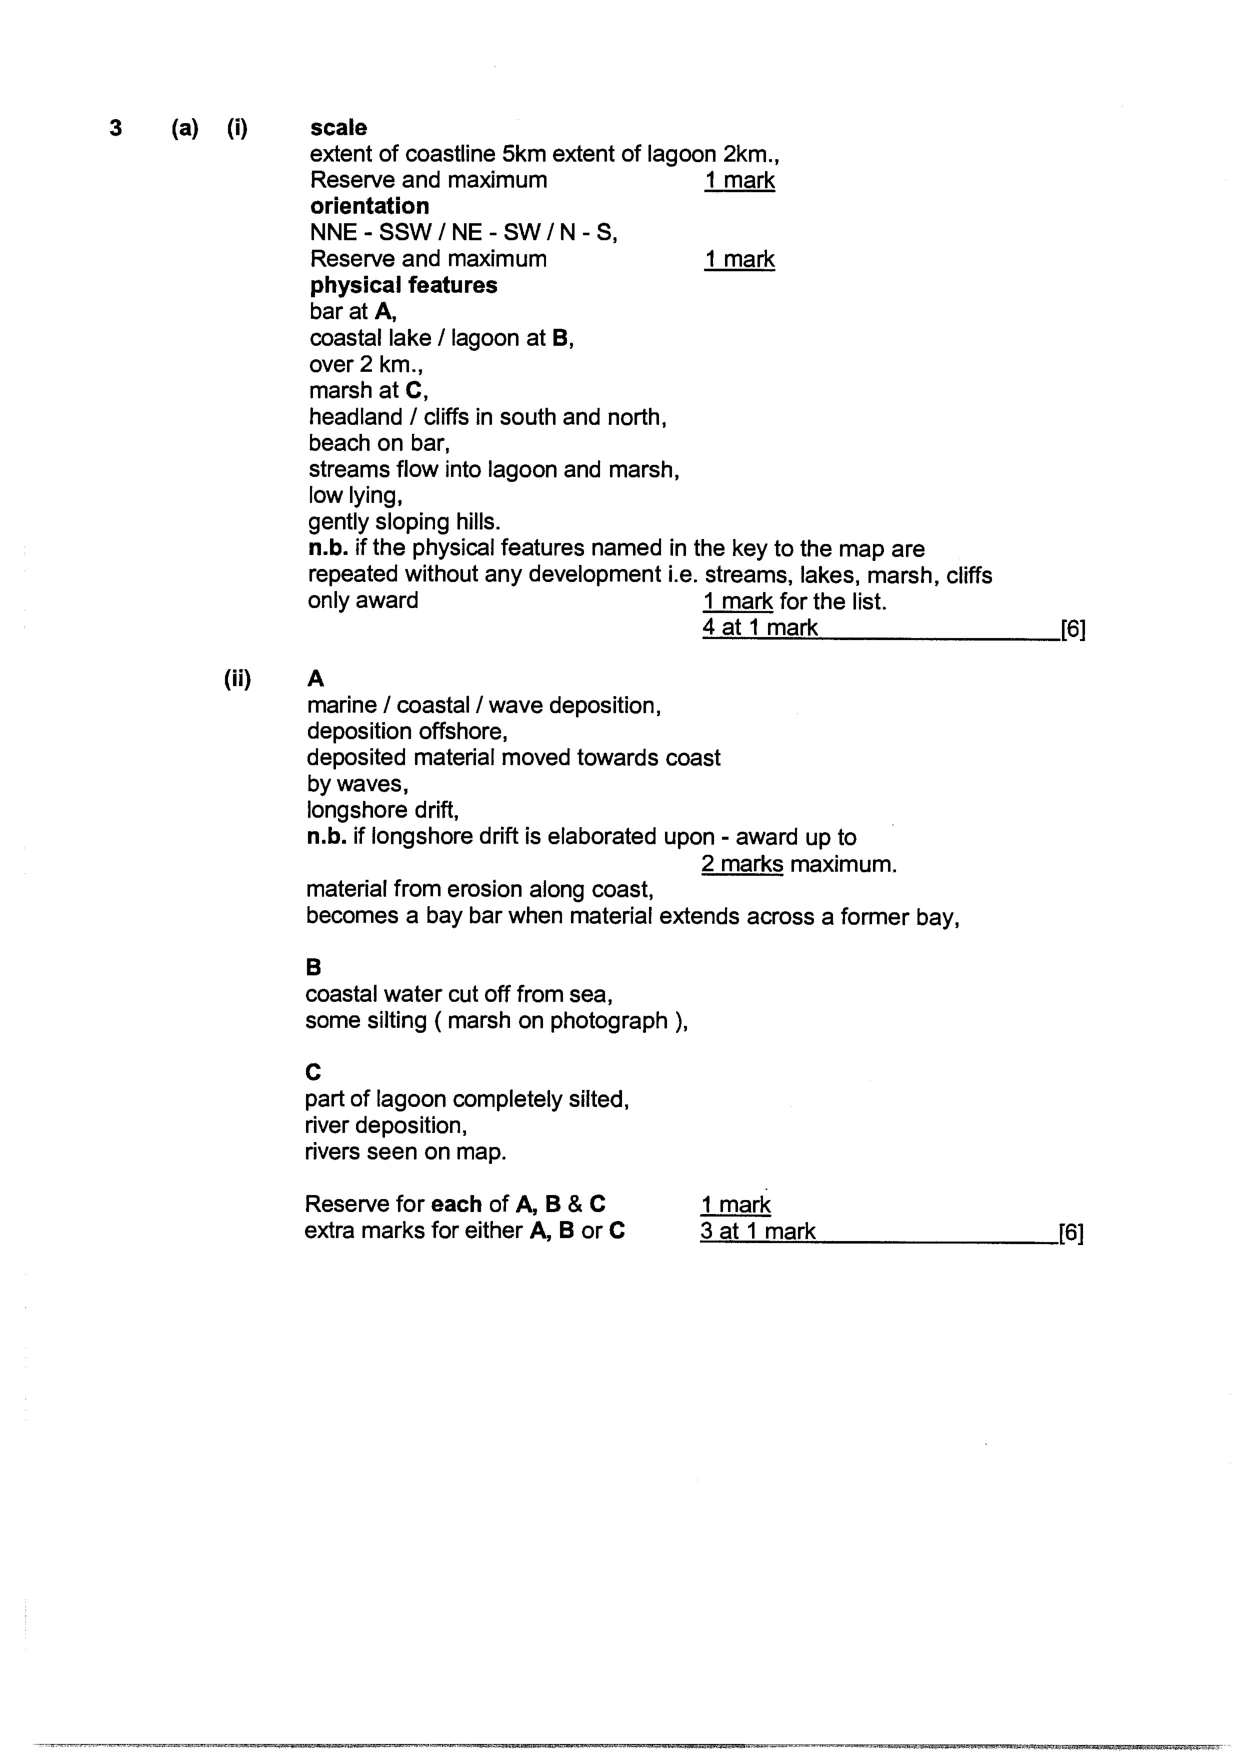
3 (a) () (ii) scale extent of coastline 5km extent of lagoon 2km., Reserve and maximum 41 mark orientation NNE - SSW/NE-SW/N-S, Reserve and maximum 4 mark physical features bar at A, coastal lake / lagoon at B, over 2 km., marsh at C, headland / cliffs in south and north, beach on bar, streams flow into lagoon and marsh, low lying, gently sloping hills. n.b. if the physical features named in the key to the map are repeated without any development i.e. streams, lakes, marsh, cliffs only award 1 mark for the list. 4 at 1 mark [6] A marine / coastal / wave deposition, deposition offshore, deposited material moved towards coast by waves, longshore drift, n.b. if longshore drift is elaborated upon - award up to 2 marks maximum. material from erosion along coast, becomes a bay bar when material extends across a former bay, B coastal water cut off from sea, some silting ( marsh on photograph ), c part of lagoon completely silted, river deposition, rivers seen on map. 3 [ay > Reserve for each of A, B & C extra marks for either A, B or C 3 at 1 mark [6]
Mark scheme, page 5
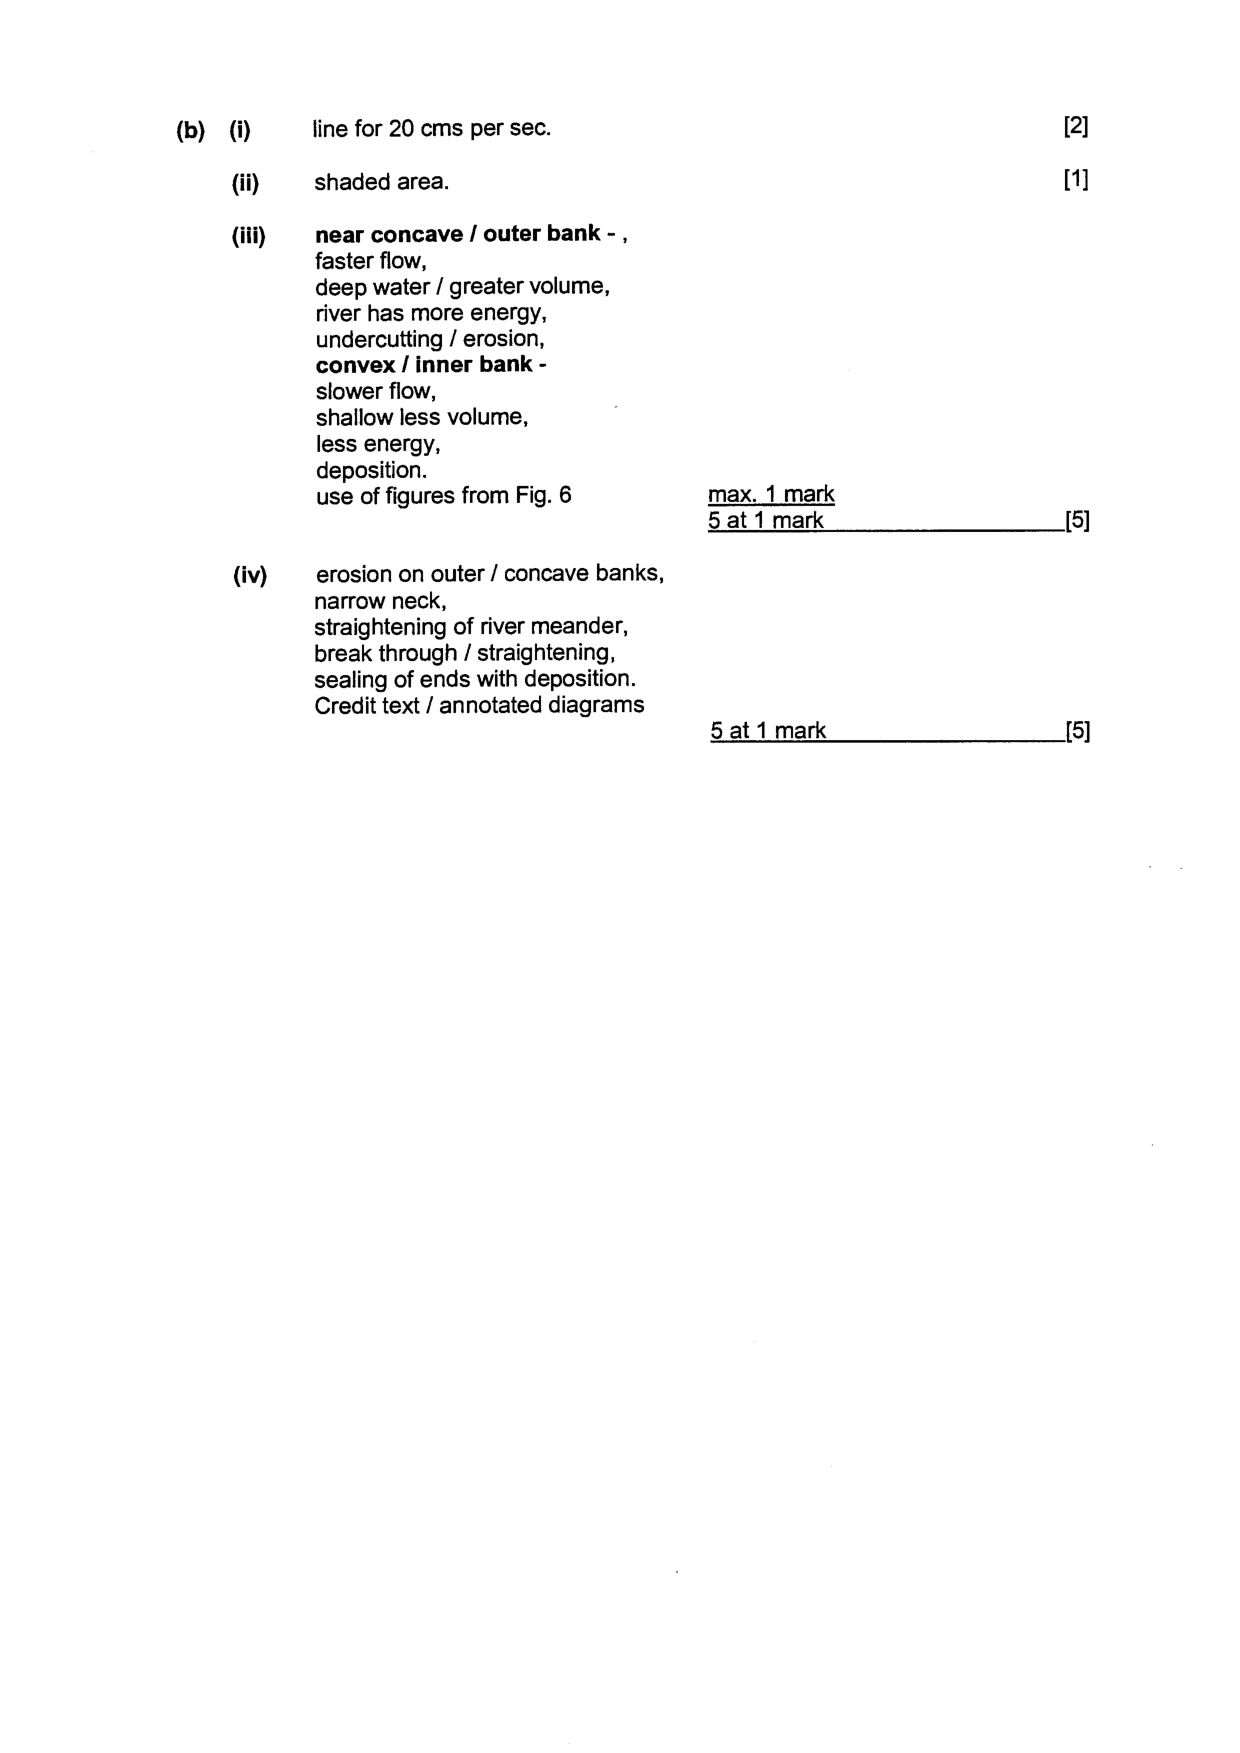
(b) (i) (ii) (ii) (iv) line for 20 cms per sec. shaded area. near concave / outer bank - , faster flow, deep water / greater volume, river has more energy, undercutting / erosion, convex / inner bank - slower flow, shallow less volume, less energy, deposition. use of figures from Fig. 6 erosion on outer / concave banks, narrow neck, straightening of river meander, break through / straightening, sealing of ends with deposition. Credit text / annotated diagrams [2] [1] max. 1 mark Sat 1 mark [5] Sat 1 mark [5]
Mark scheme, page 6
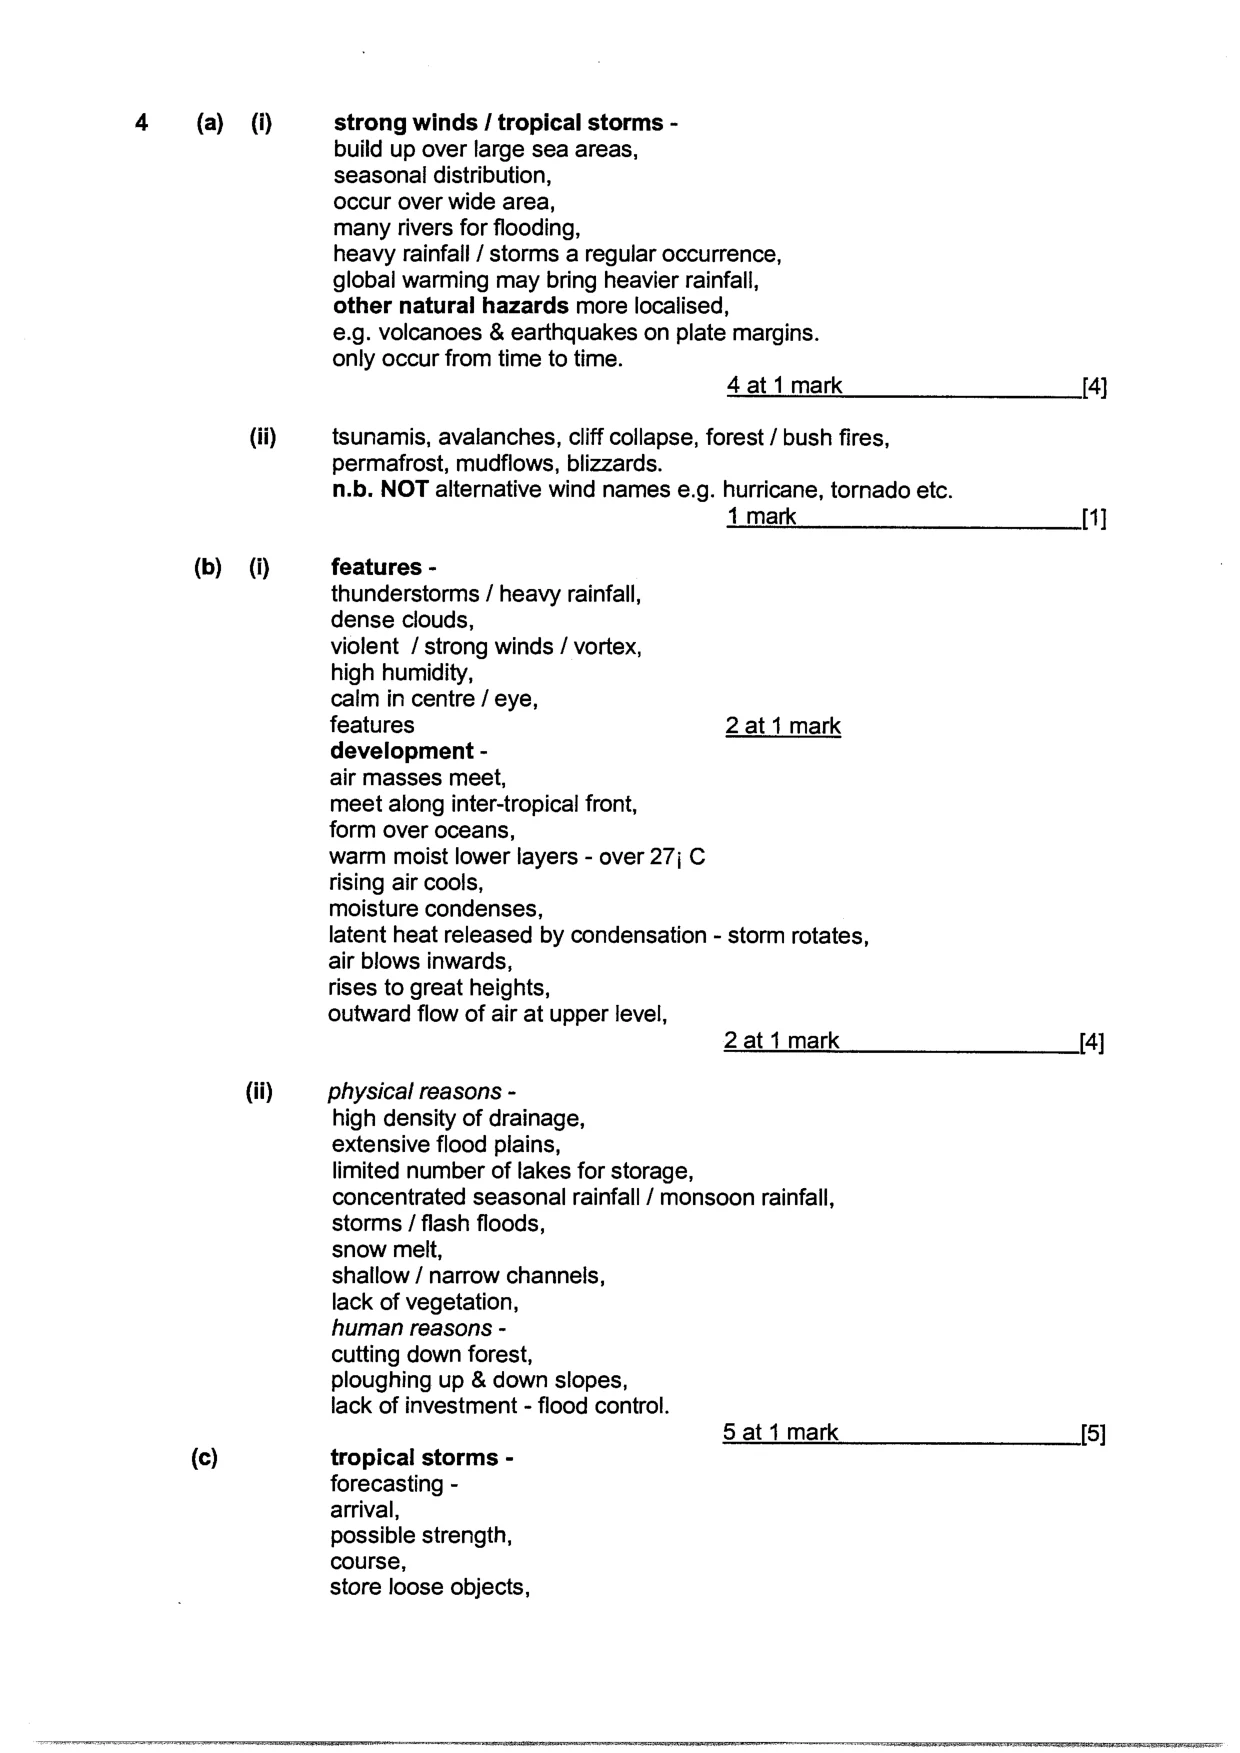
(a) (b) (c) (i) (ii) () (ii) strong winds / tropical storms - build up over large sea areas, seasonal distribution, occur over wide area, many rivers for flooding, heavy rainfall / storms a regular occurrence, global warming may bring heavier rainfall, other natural hazards more localised, e.g. volcanoes & earthquakes on plate margins. only occur from time to time. 4 at 1 mark [4} tsunamis, avalanches, cliff collapse, forest / bush fires, permafrost, mudflows, blizzards. n.b, NOT alternative wind names e.g. hurricane, tornado etc. 4 mark [1] features - thunderstorms / heavy rainfall, dense clouds, violent / strong winds / vortex, high humidity, calm in centre / eye, features 2 at 1 mark development - air masses meet, meet along inter-tropical front, form over oceans, warm moist lower layers - over 27; C rising air cools, moisture condenses, latent heat released by condensation - storm rotates, air blows inwards, rises to great heights, outward flow of air at upper level, 2 at 1 mark __[4] physical reasons - high density of drainage, extensive flood plains, limited number of lakes for storage, concentrated seasonal rainfall / monsoon rainfall, storms / flash floods, snow melt, shallow / narrow channels, lack of vegetation, human reasons - cutting down forest, ploughing up & down slopes, lack of investment - flood control. 5 at 1 mark [5] tropical storms - forecasting - arrival, possible strength, course, store loose objects,
Mark scheme, page 7
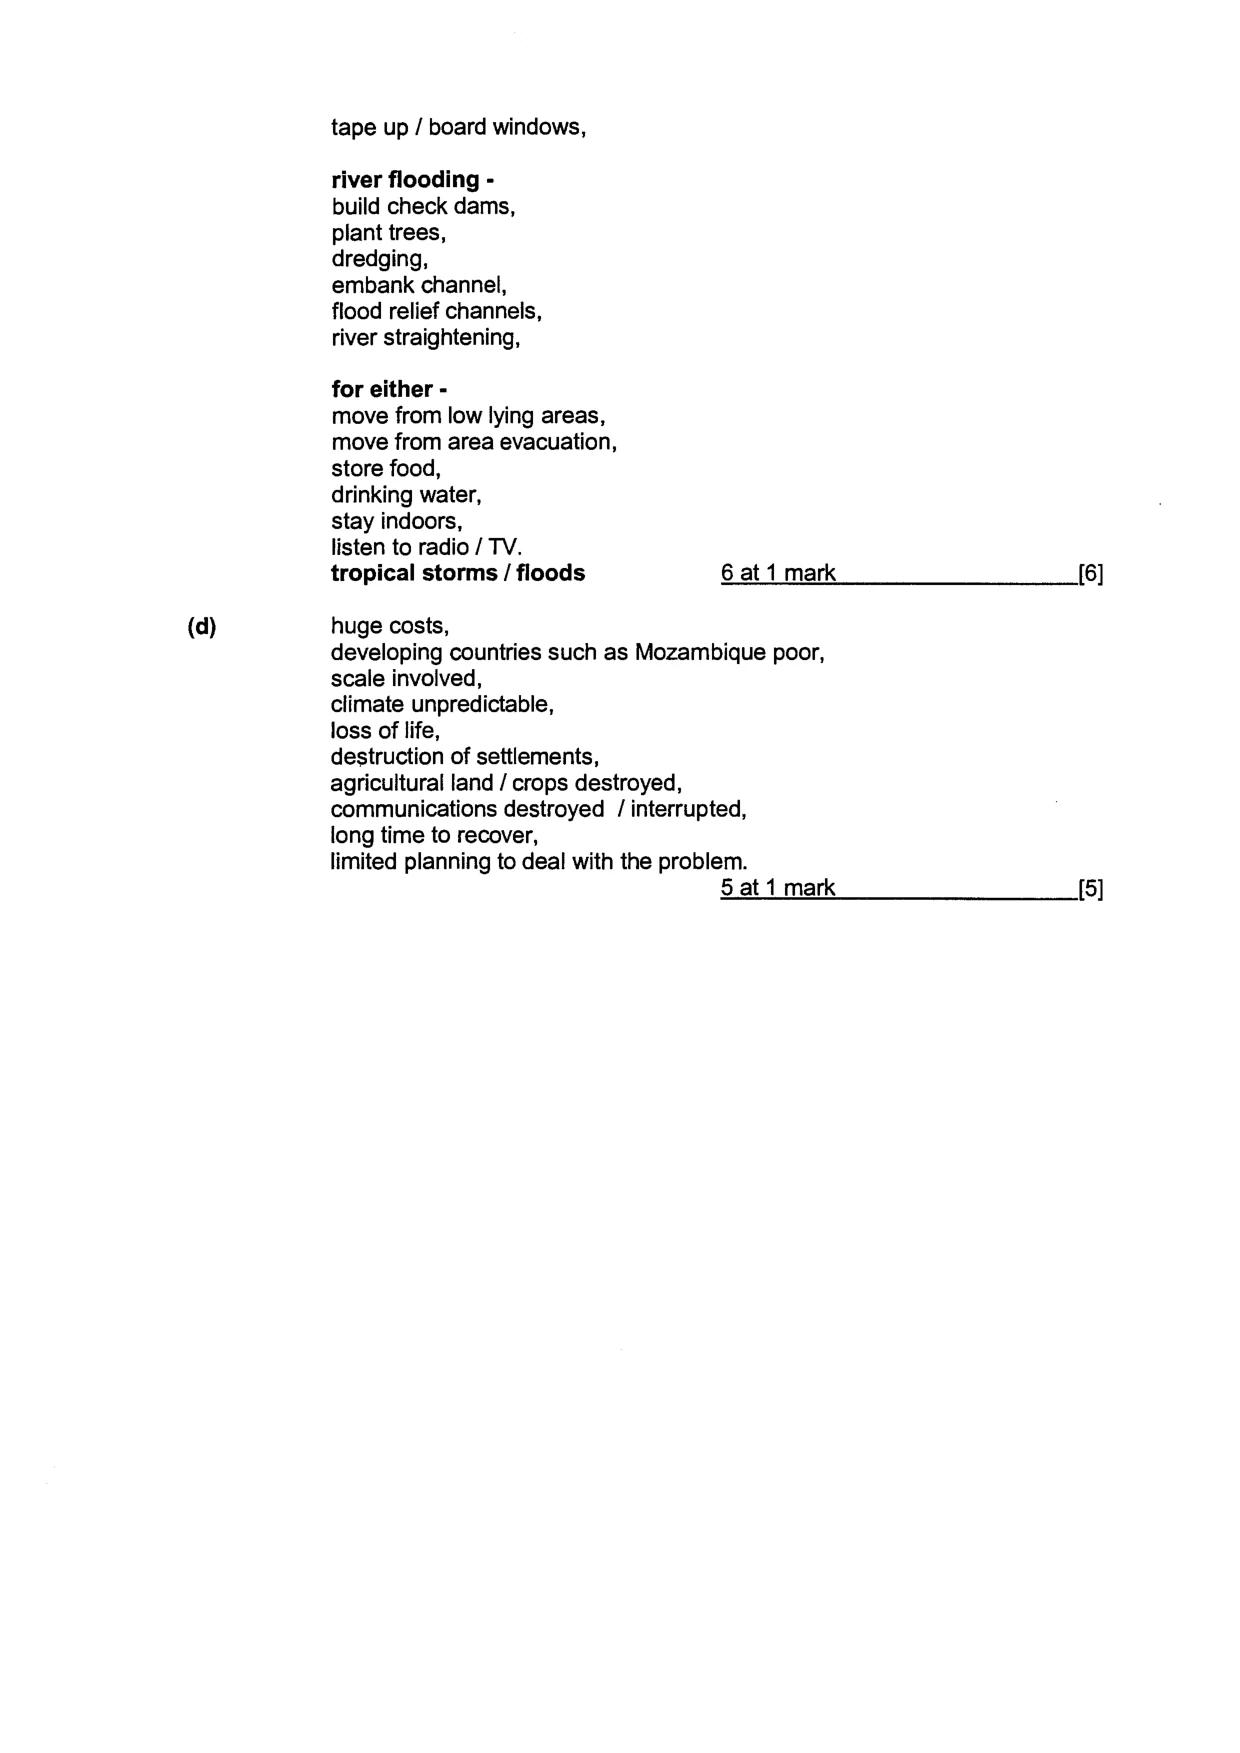
(d) tape up / board windows, river flooding - build check dams, plant trees, dredging, embank channel, flood relief channels, river straightening, for either - move from low lying areas, move from area evacuation, store food, drinking water, stay indoors, listen to radio / TV. tropical storms / floods 6 at 1 mark huge costs, developing countries such as Mozambique poor, scale involved, climate unpredictable, loss of life, destruction of settlements, agricultural land / crops destroyed, communications destroyed / interrupted, long time to recover, limited planning to deal with the problem. 5 at 1 mark (6] 5]
Mark scheme, page 8
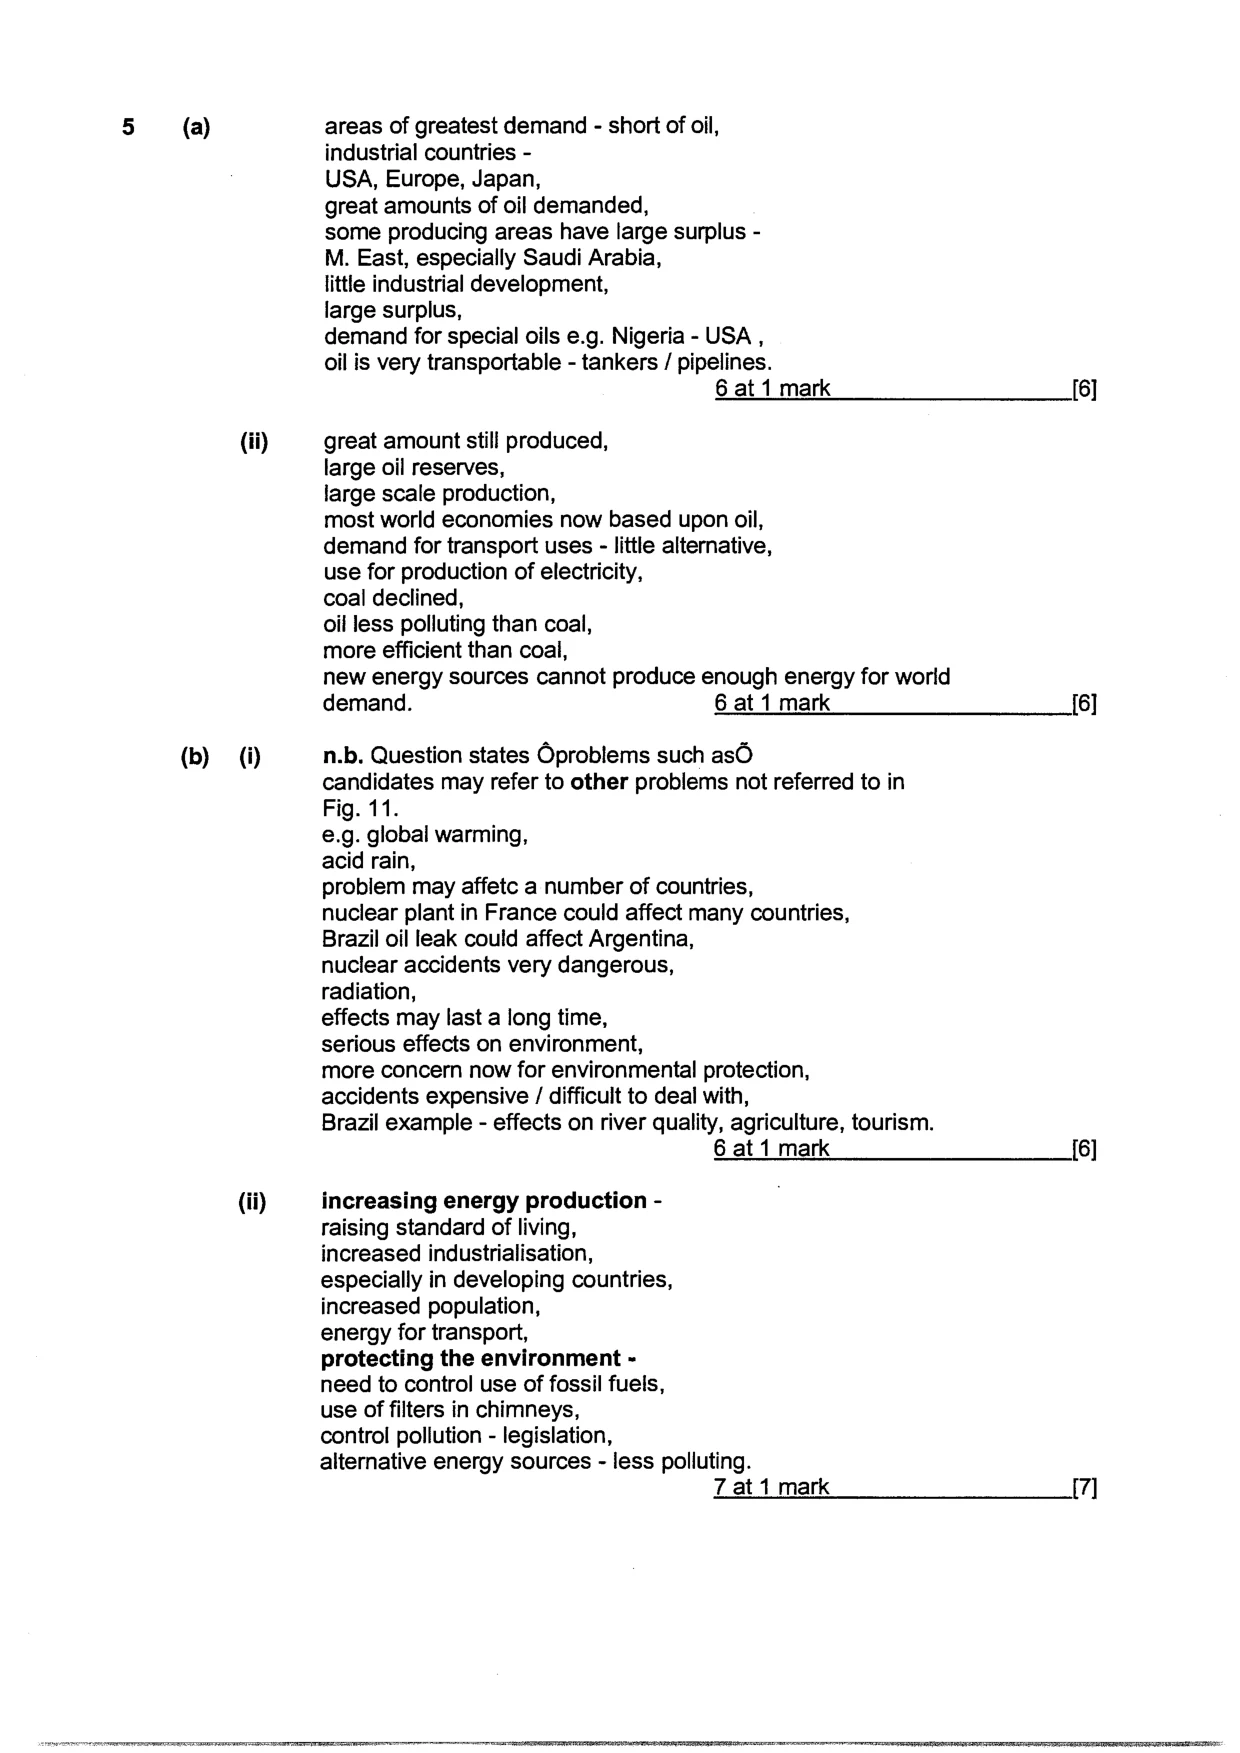
(a) (b) (ii) (i) (ii) areas of greatest demand - short of oil, industrial countries - USA, Europe, Japan, great amounts of oil demanded, some producing areas have large surplus - M. East, especially Saudi Arabia, little industrial development, large surplus, demand for special oils e.g. Nigeria- USA , oil is very transportable - tankers / pipelines. 6 at 1 mark [6] great amount still produced, large oil reserves, large scale production, most world economies now based upon oil, demand for transport uses - little alternative, use for production of electricity, coal declined, oil less polluting than coal, more efficient than coal, new energy sources cannot produce enough energy for world demand. 6 at 1 mark [6] n.b. Question states Oproblems such asO candidates may refer to other problems not referred to in Fig. 11. e.g. global warming, acid rain, problem may affetc a number of countries, nuclear plant in France could affect many countries, Brazil oil leak could affect Argentina, nuclear accidents very dangerous, radiation, effects may last a long time, serious effects on environment, more concern now for environmental protection, accidents expensive / difficult to deal with, Brazil example - effects on river quality, agriculture, tourism. 6 at 1 mark [6] increasing energy production - raising standard of living, increased industrialisation, especially in developing countries, increased population, energy for transport, protecting the environment - need to control use of fossil fuels, use of filters in chimneys, control pollution - legislation, alternative energy sources - less polluting. Zat 1 mark [7]
Mark scheme, page 9
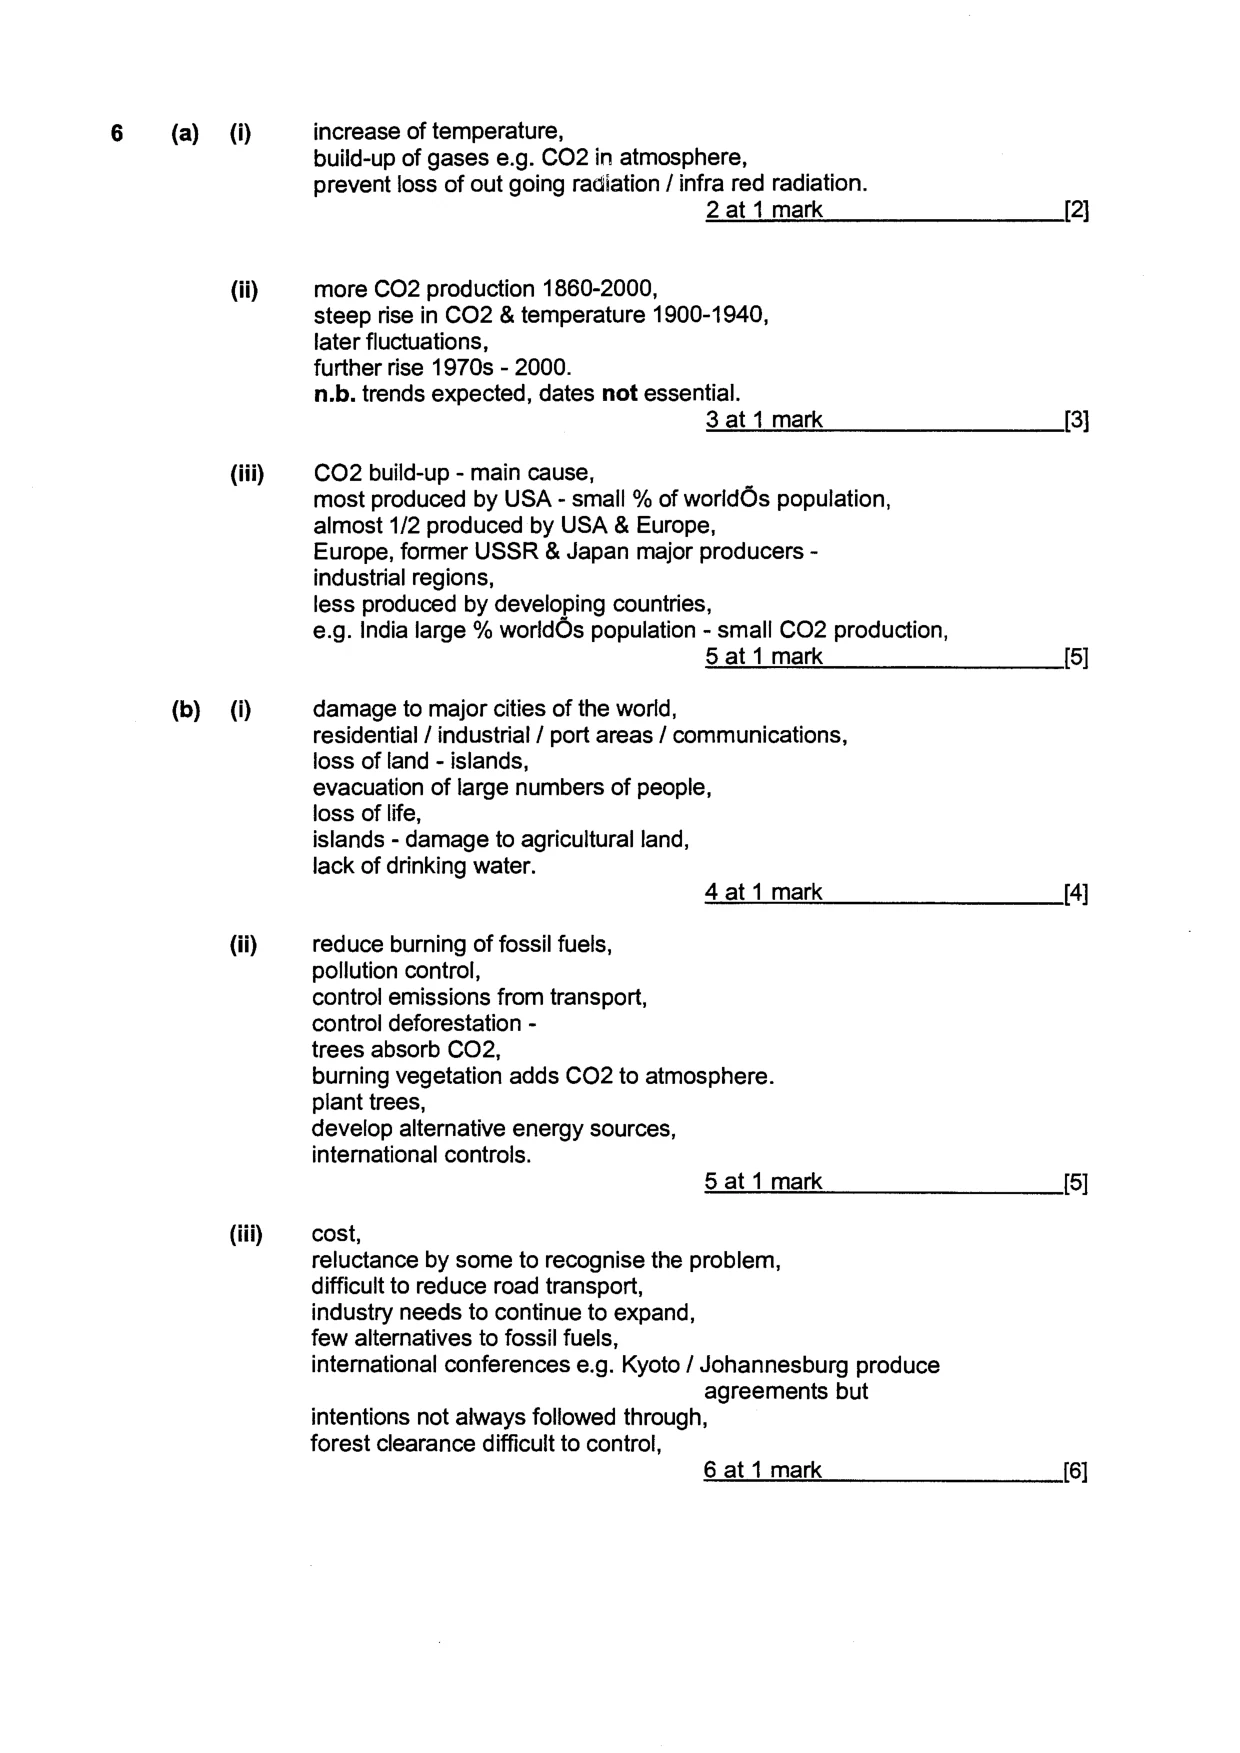
(a) (b) (i) (ii) (iii) (i) (ii) (iii) increase of temperature, build-up of gases e.g. CO2 in atmosphere, prevent loss of out going radiation / infra red radiation. 2 at 1 mark __[2] more CO2 production 1860-2000, steep rise in CO2 & temperature 1900-1940, later fluctuations, further rise 1970s - 2000. n.b. trends expected, dates not essential. Satimark SC] CO2 build-up - main cause, most produced by USA - small % of worldOs population, almost 1/2 produced by USA & Europe, Europe, former USSR & Japan major producers - industrial regions, less produced by developing countries, e.g. India large % worldOs population - small CO2 production, 5 at 1 mark [5] damage to major cities of the world, residential / industrial / port areas / communications, loss of land - islands, evacuation of large numbers of people, loss of life, islands - damage to agricultural land, lack of drinking water. 4 at 1 mark [4] reduce burning of fossil fuels, pollution control, control emissions from transport, control deforestation - trees absorb CO2, burning vegetation adds CO2 to atmosphere. plant trees, develop alternative energy sources, international controls. 5 at 1 mark [5] cost, reluctance by some to recognise the problem, difficult to reduce road transport, industry needs to continue to expand, few alternatives to fossil fuels, international conferences e.g. Kyoto / Johannesburg produce agreements but intentions not always followed through, forest clearance difficult to control, 6 at 1 mark [6]