Cambridge IGCSE Environmental Management 0680 — 2023 Oct/Nov Paper 2 · Variant 1
0680/21/O/N/23 · 4 questions · 80 marks · ≈90 min
The question paper and its mark scheme, free to read here and free to download. This is Cambridge’s own paper, exactly as it was sat.
Question paper24 pages
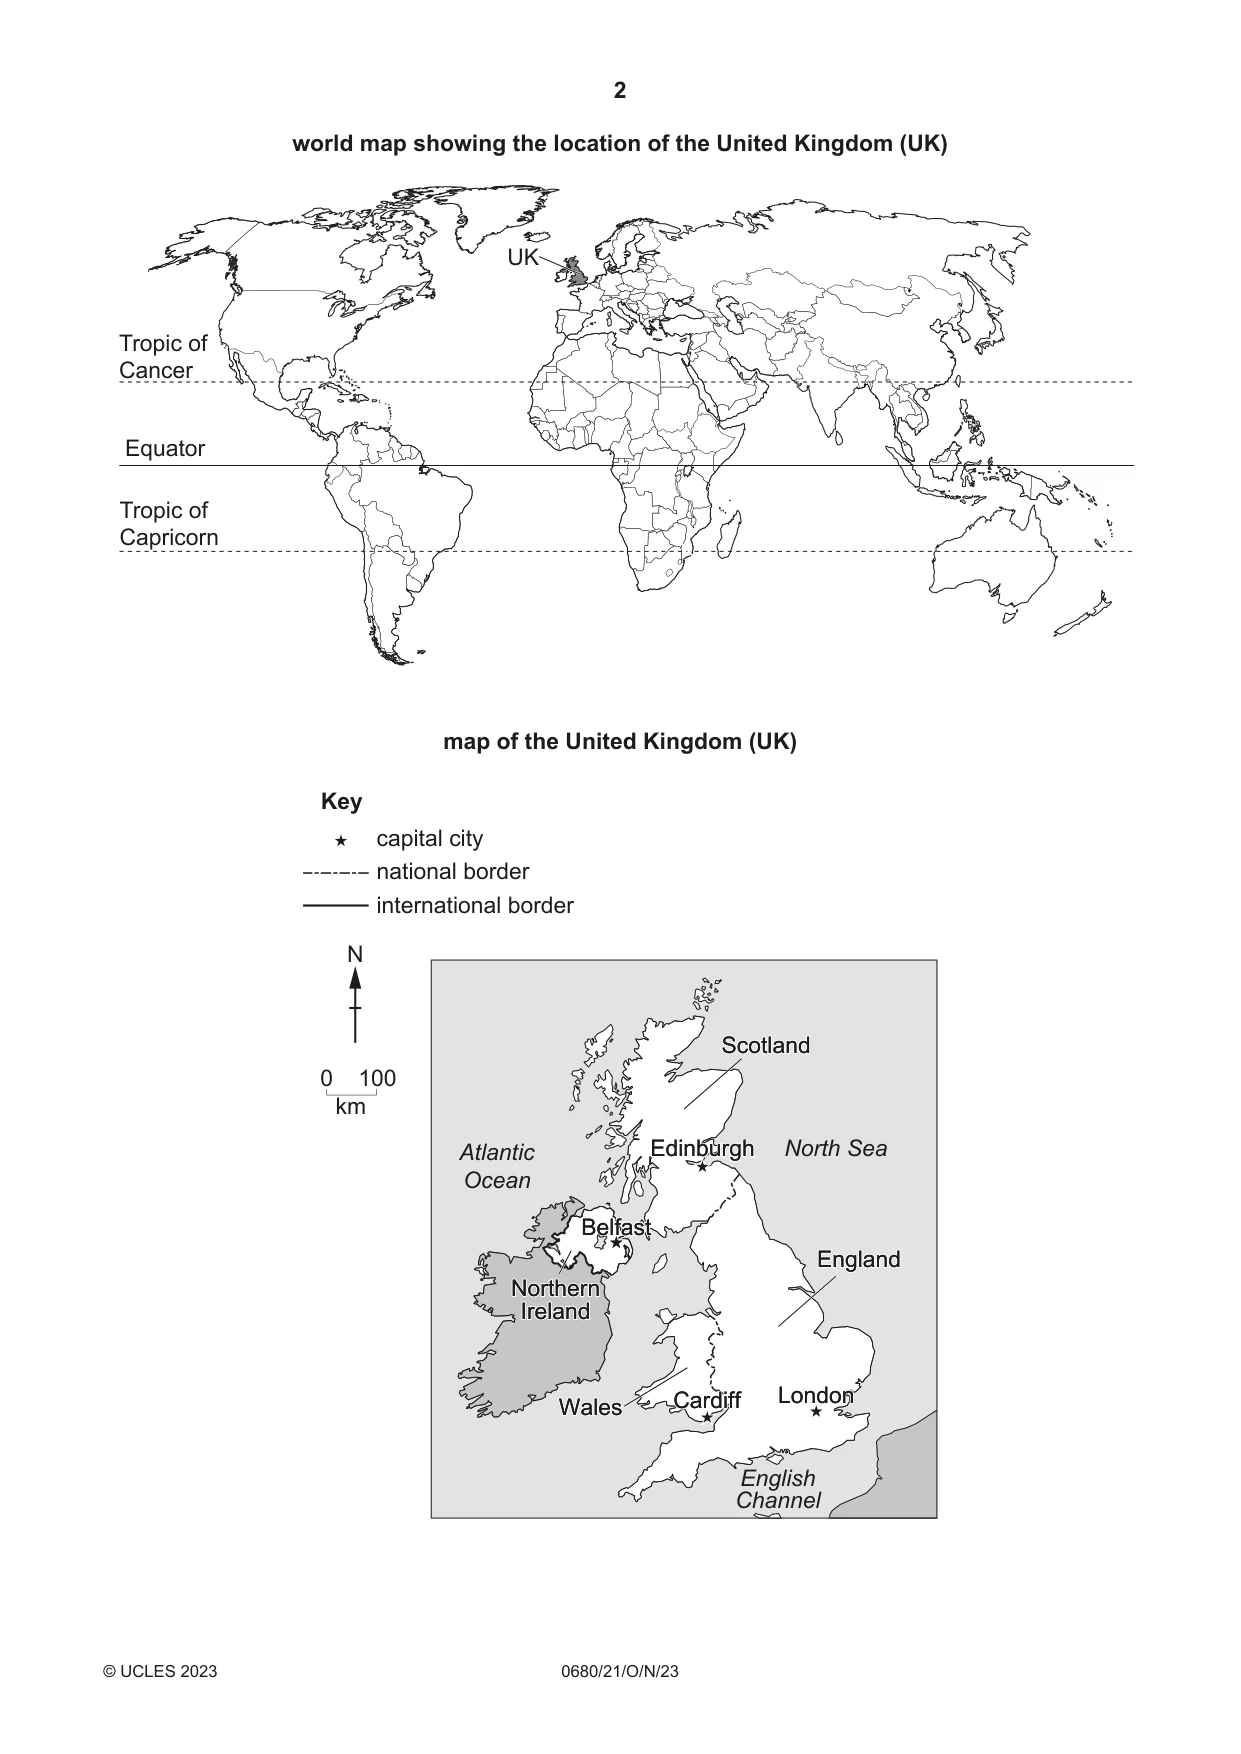
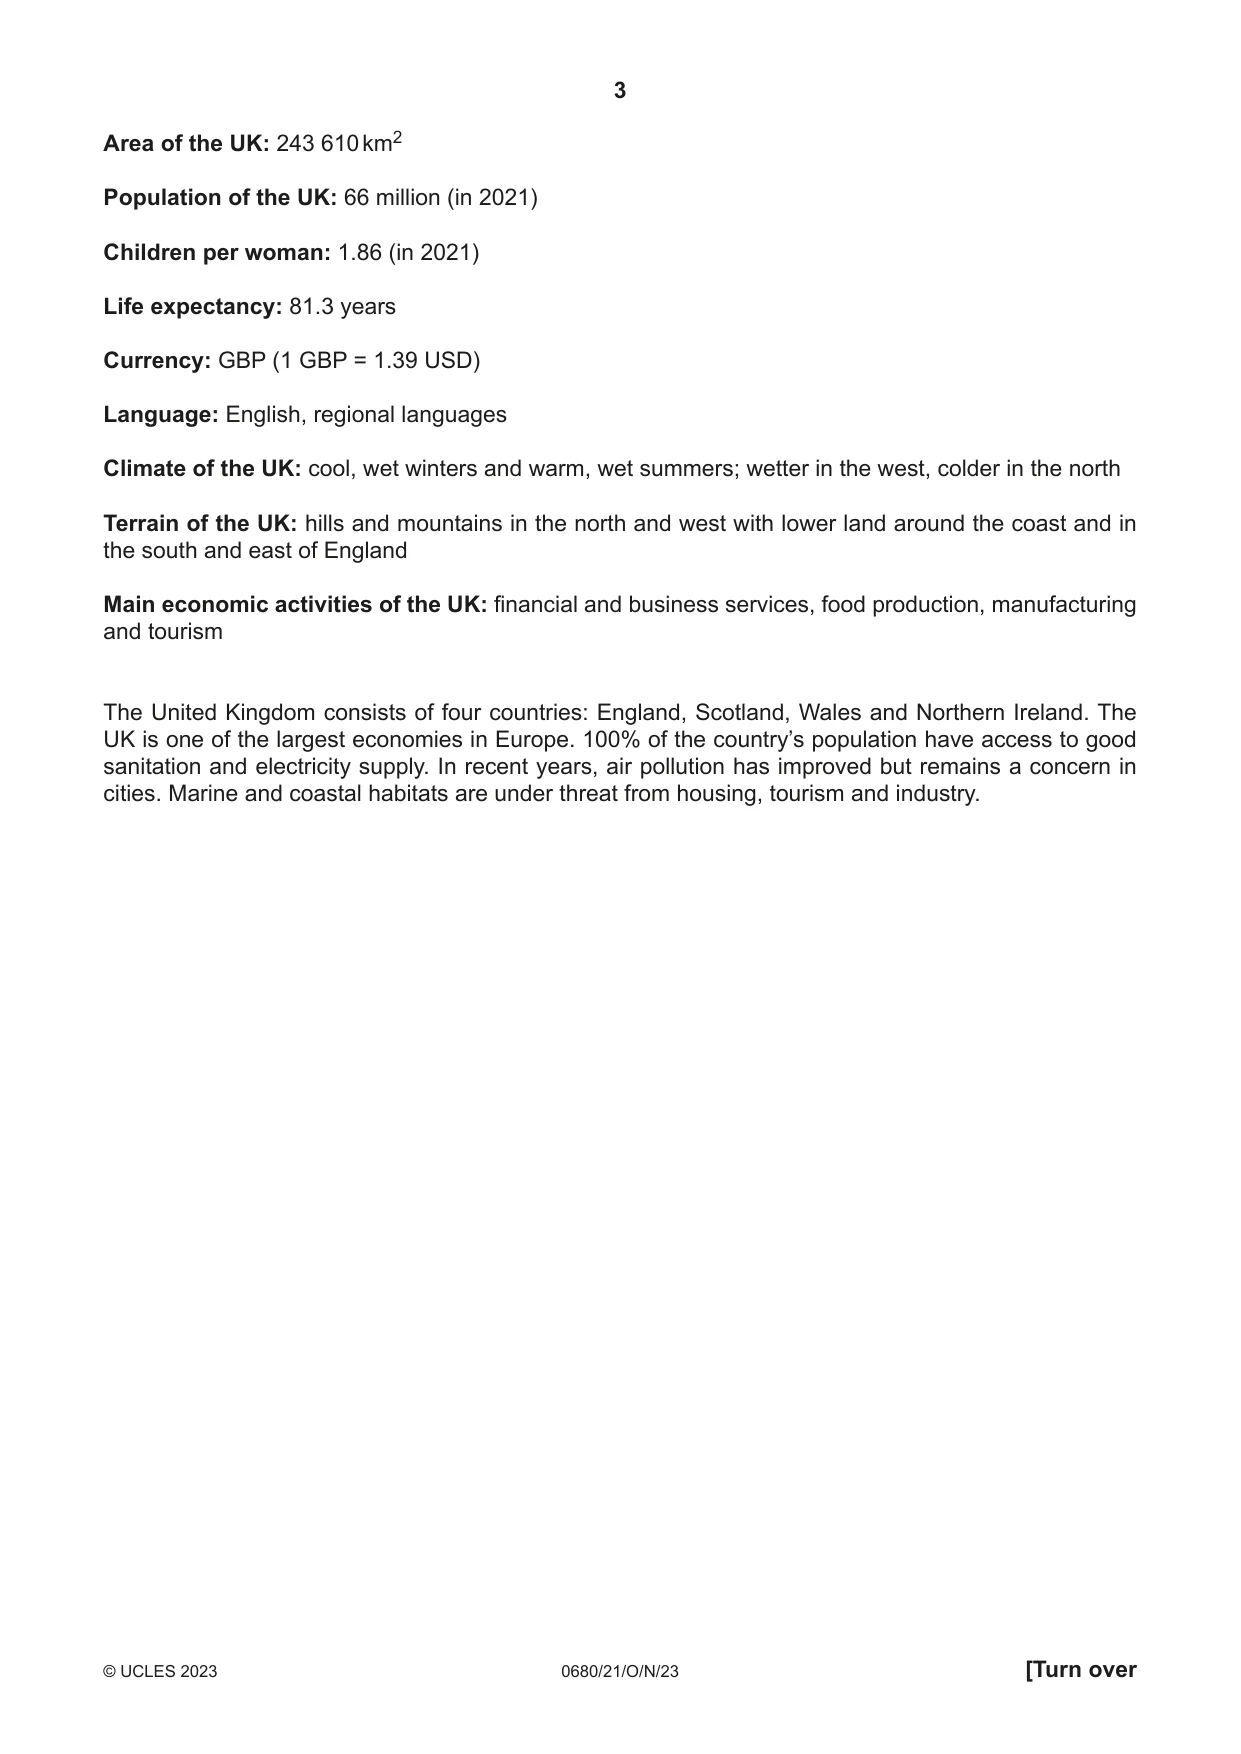




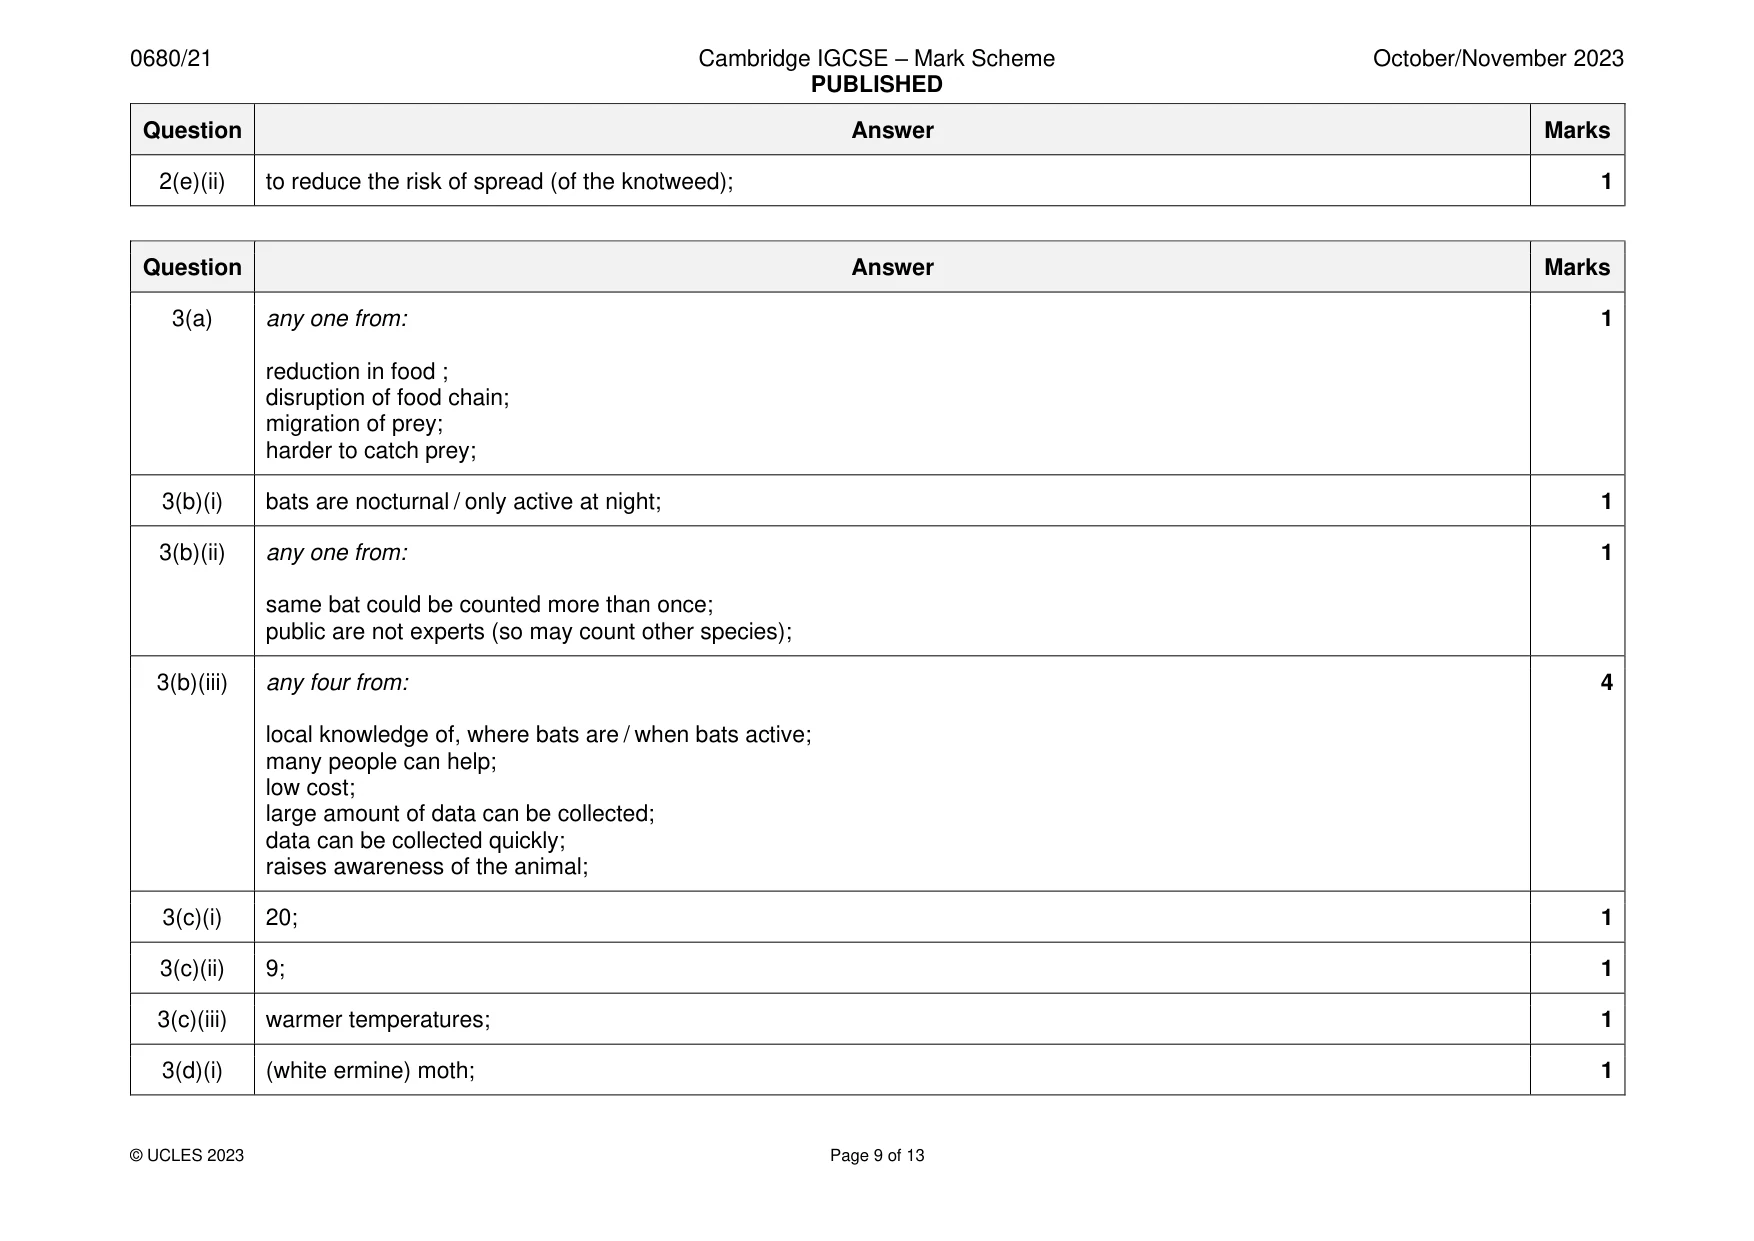
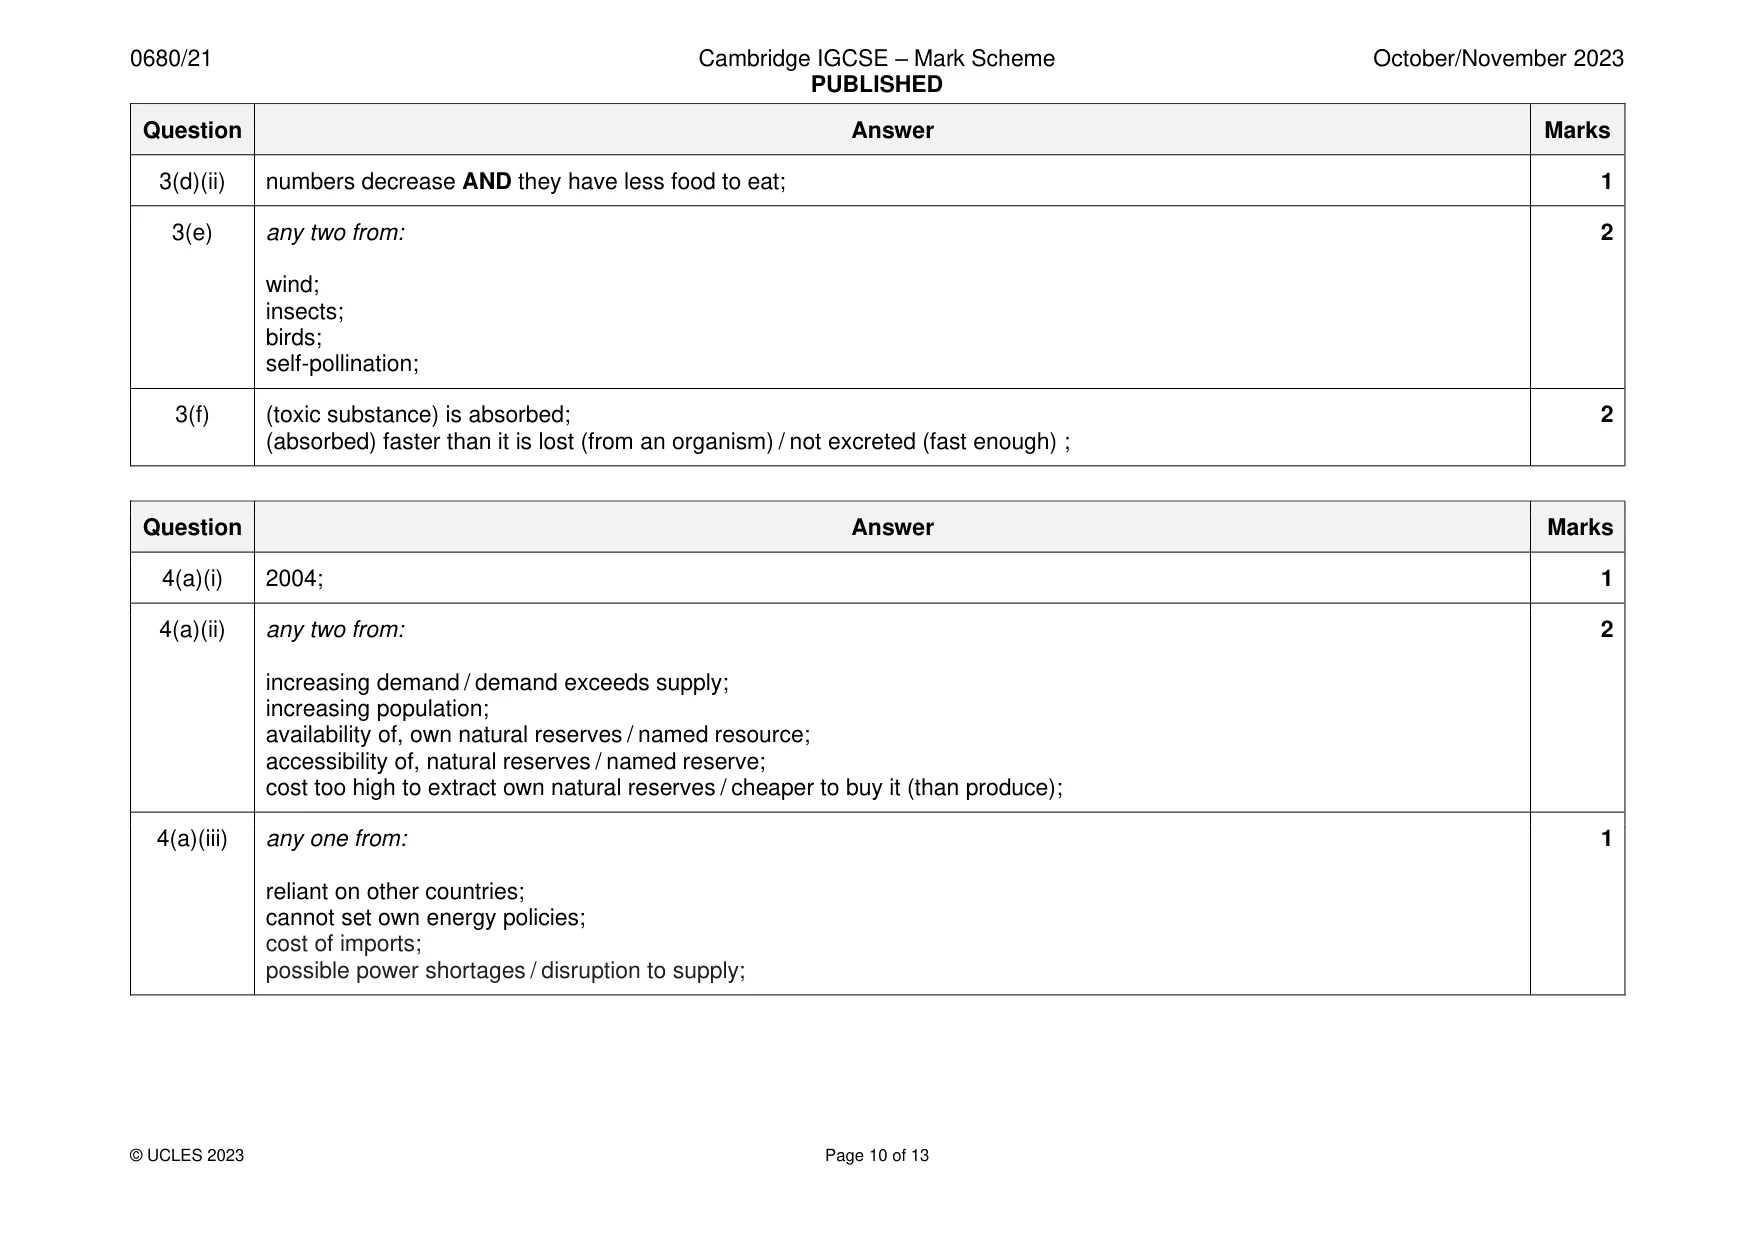
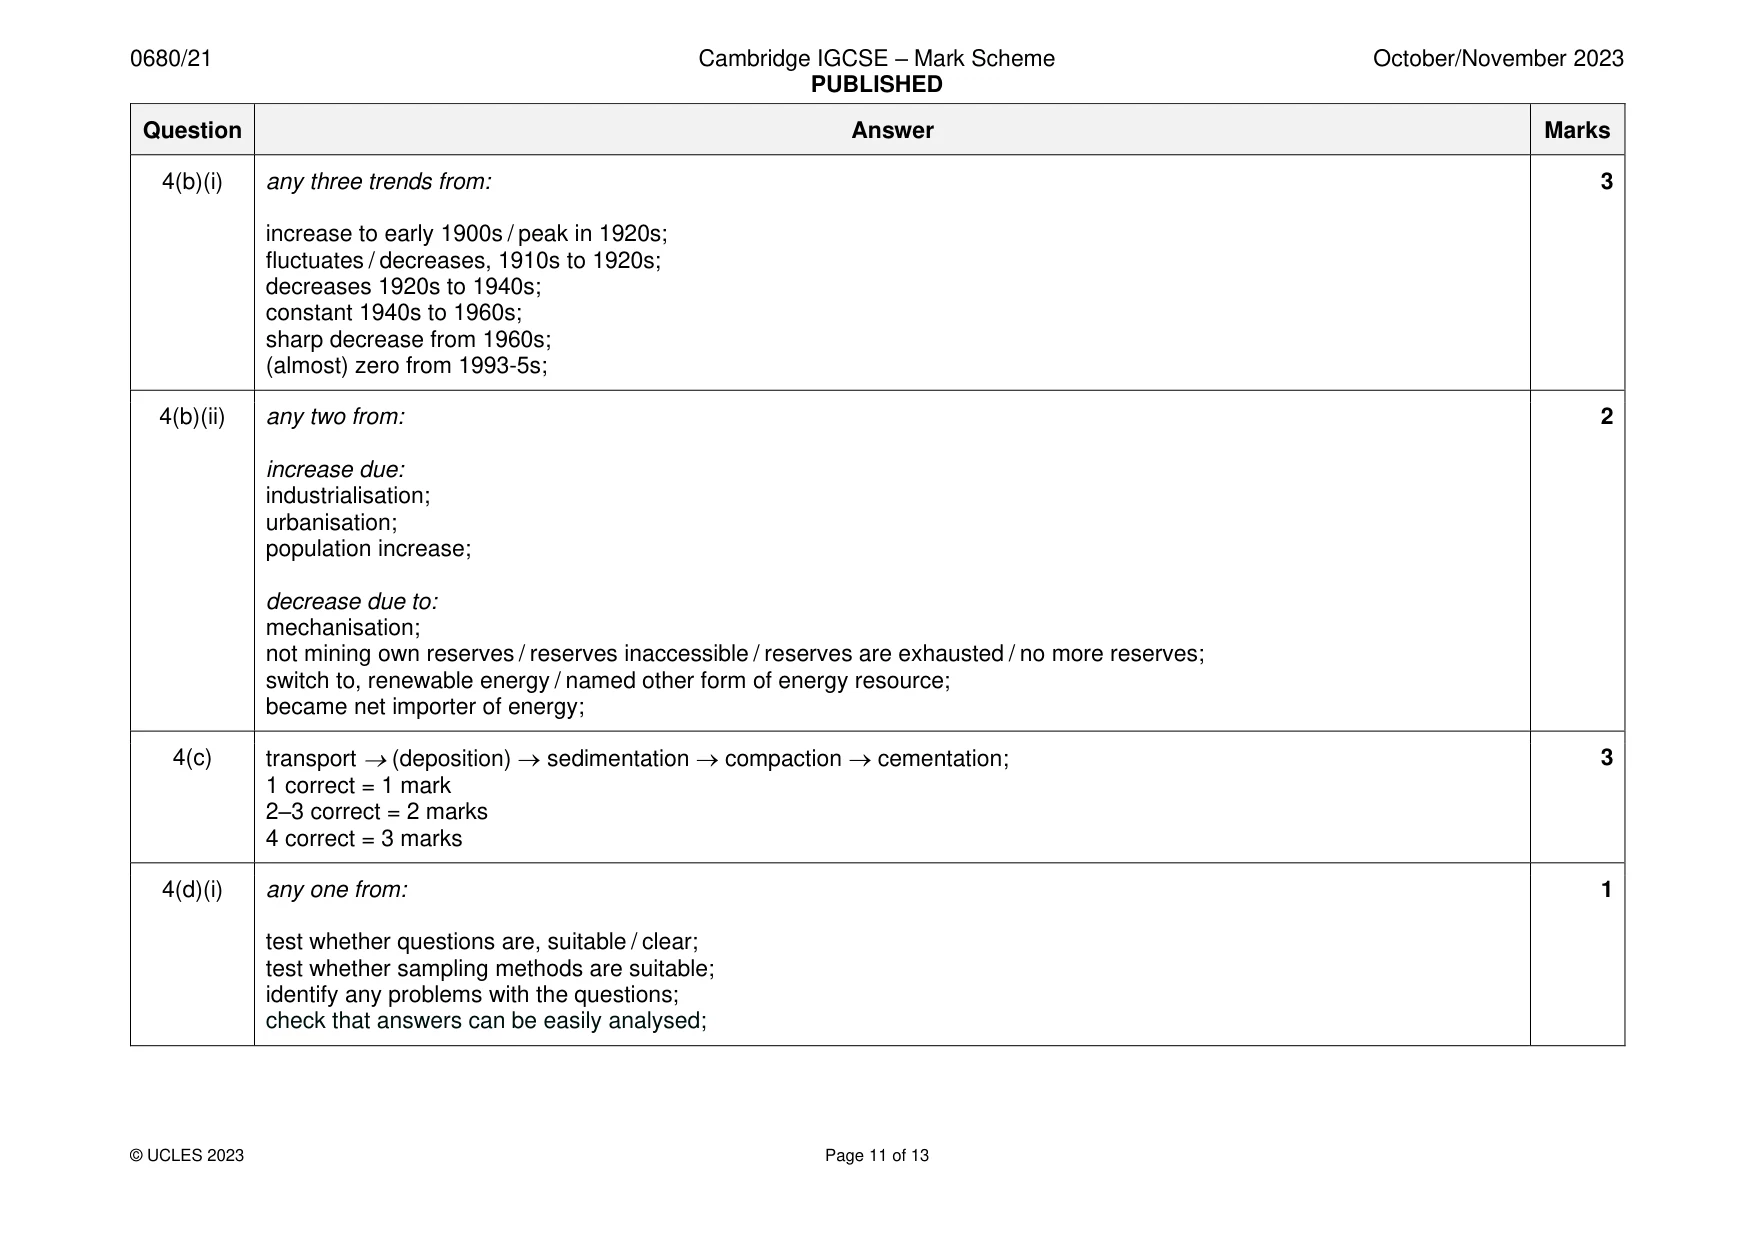
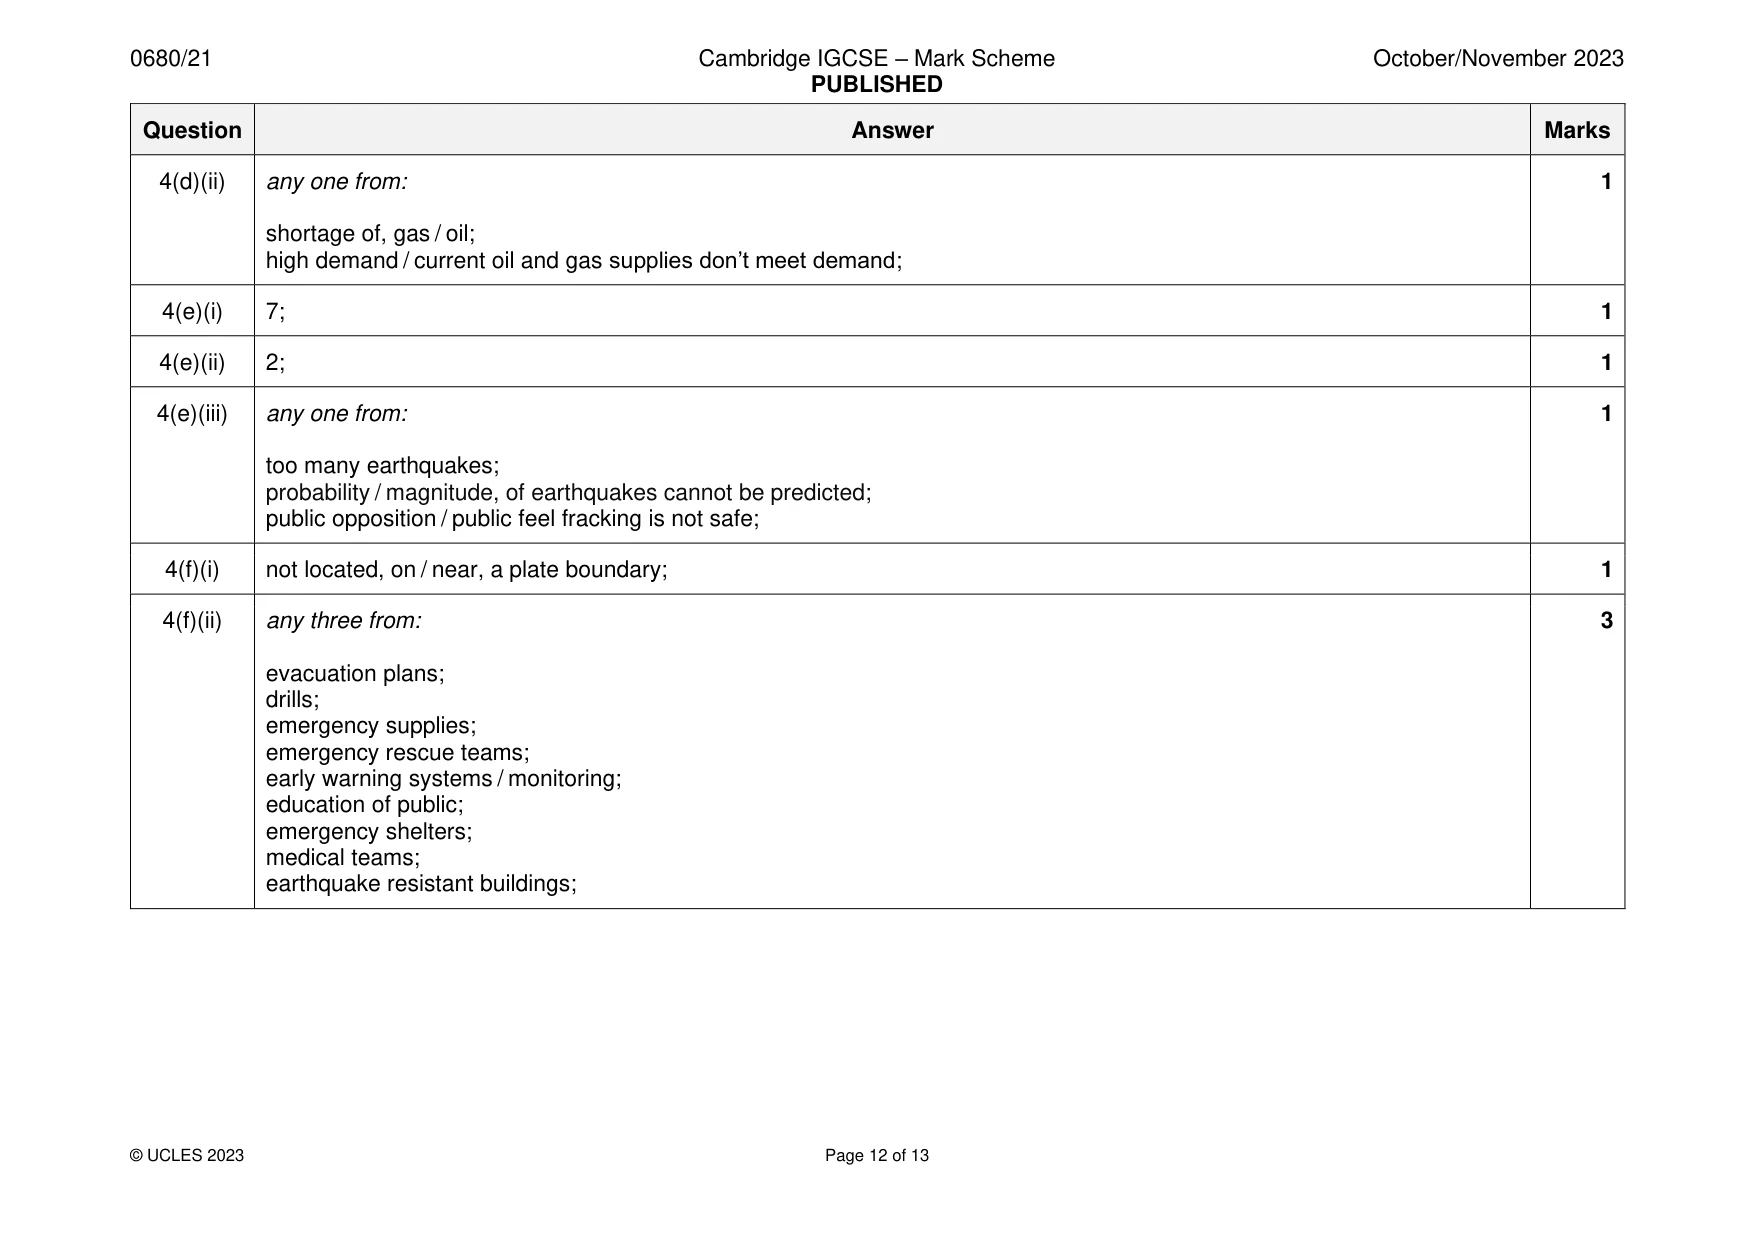
Mark scheme13 pages
Answers below. Sit the paper first if you are practising.
Questions as text
Q1 · The table shows the percentage of total land area for different types of land use in the…
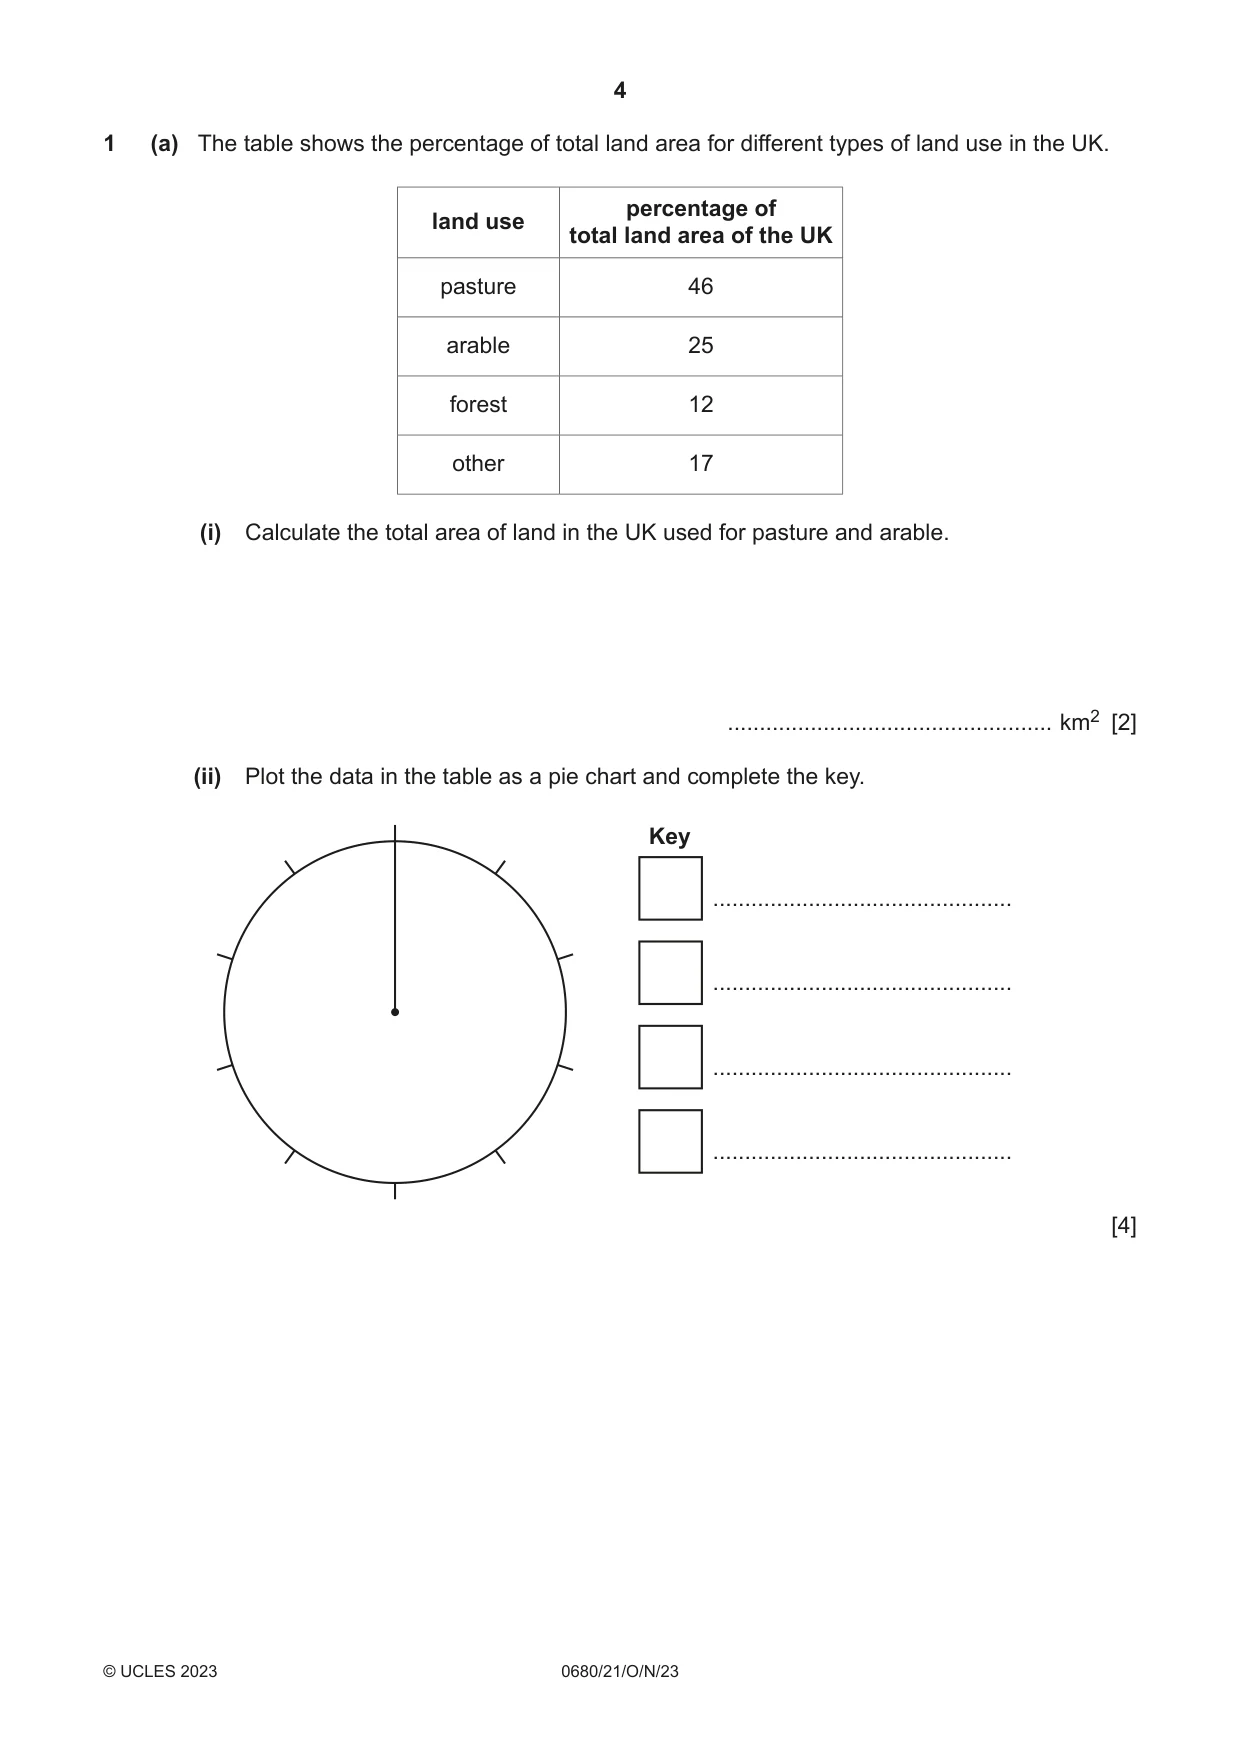
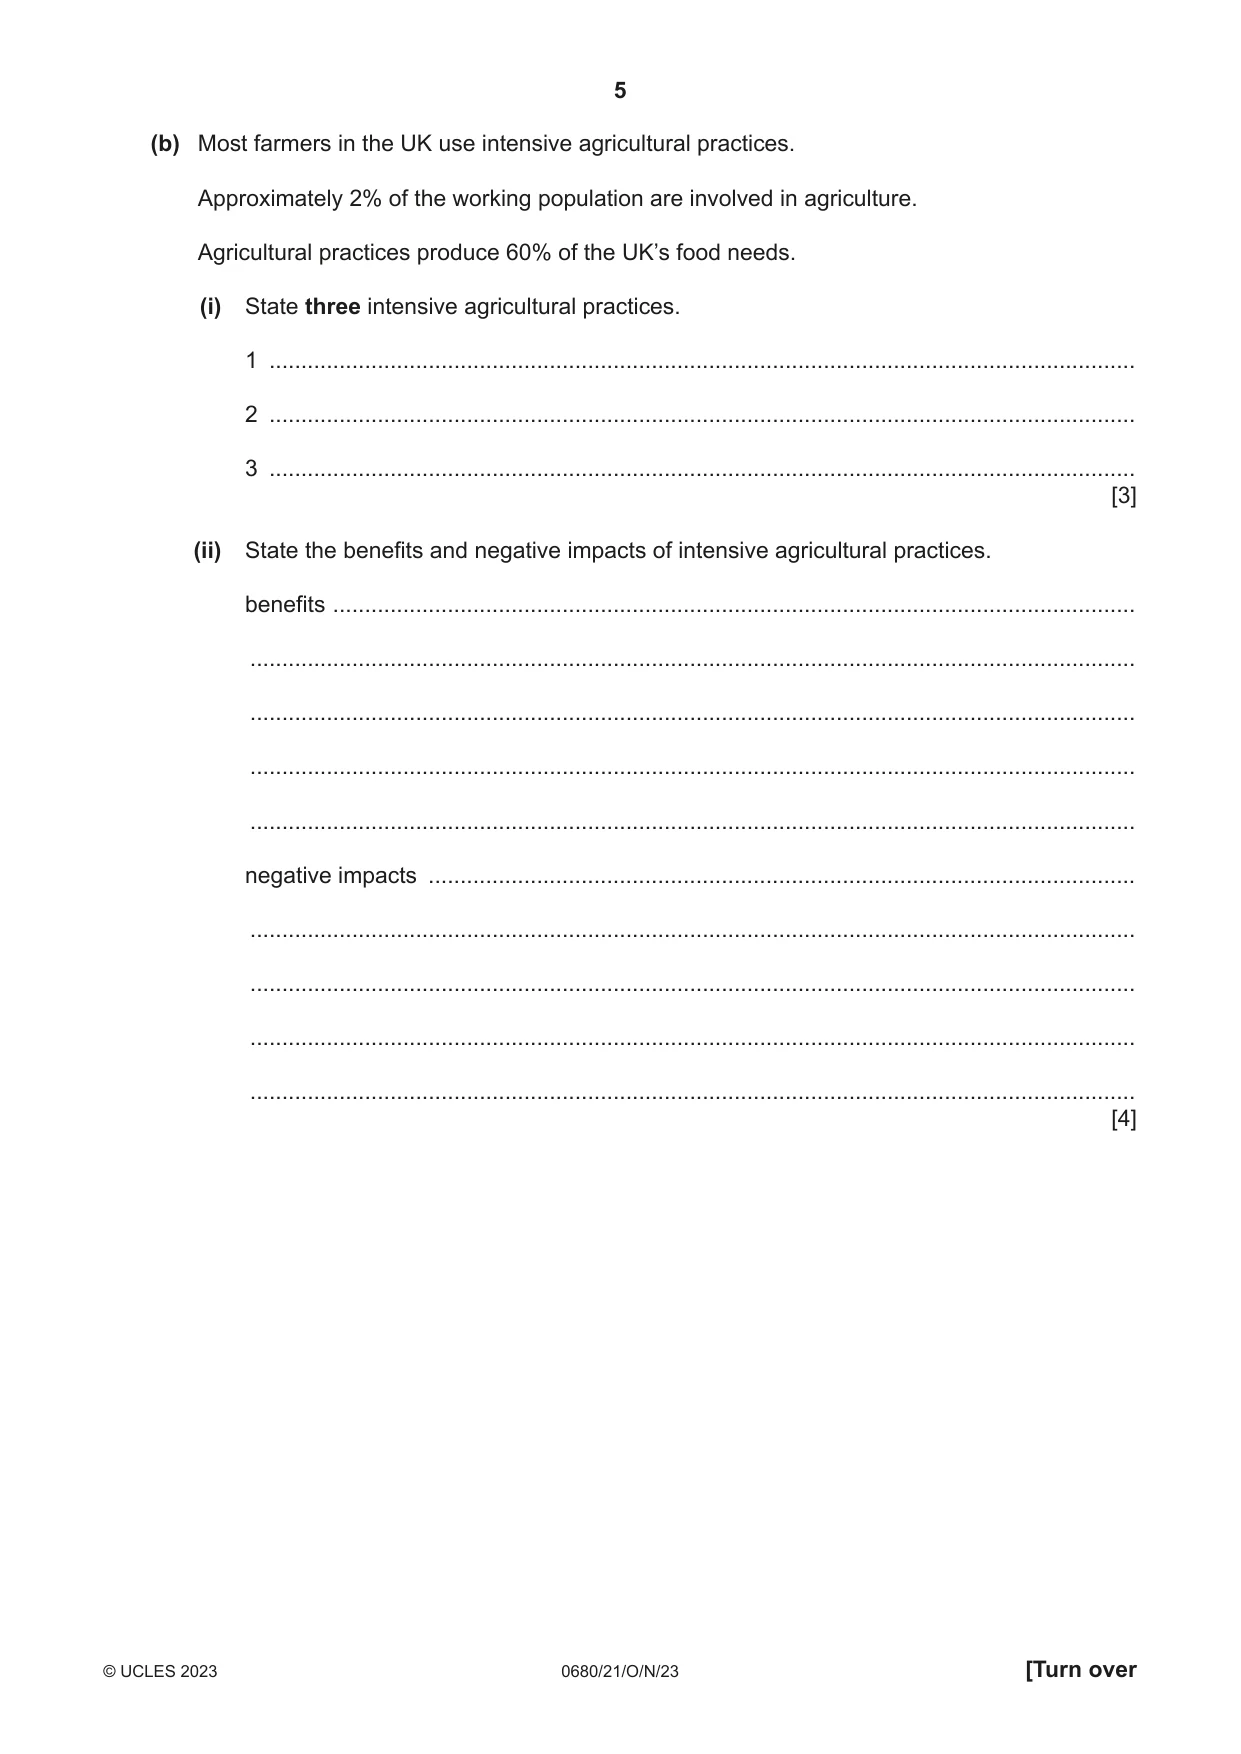
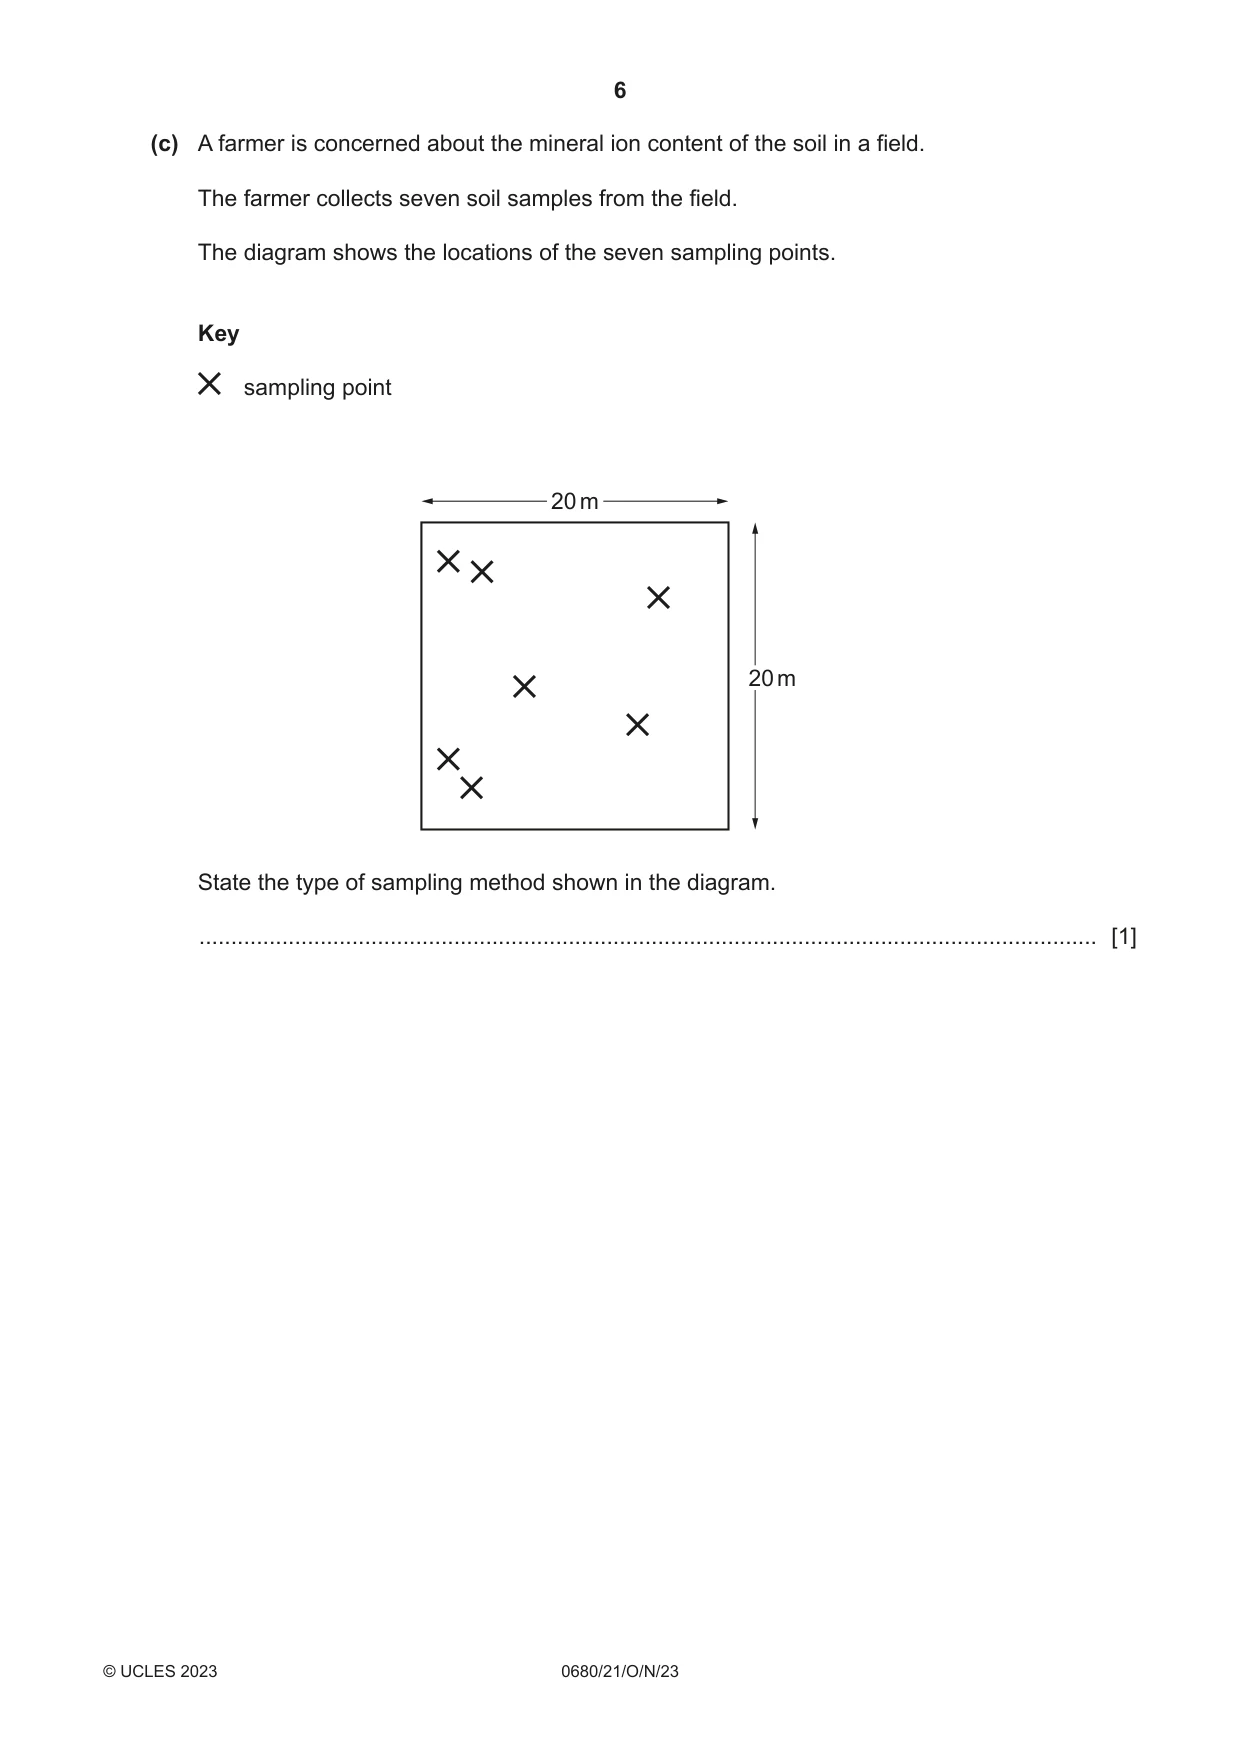
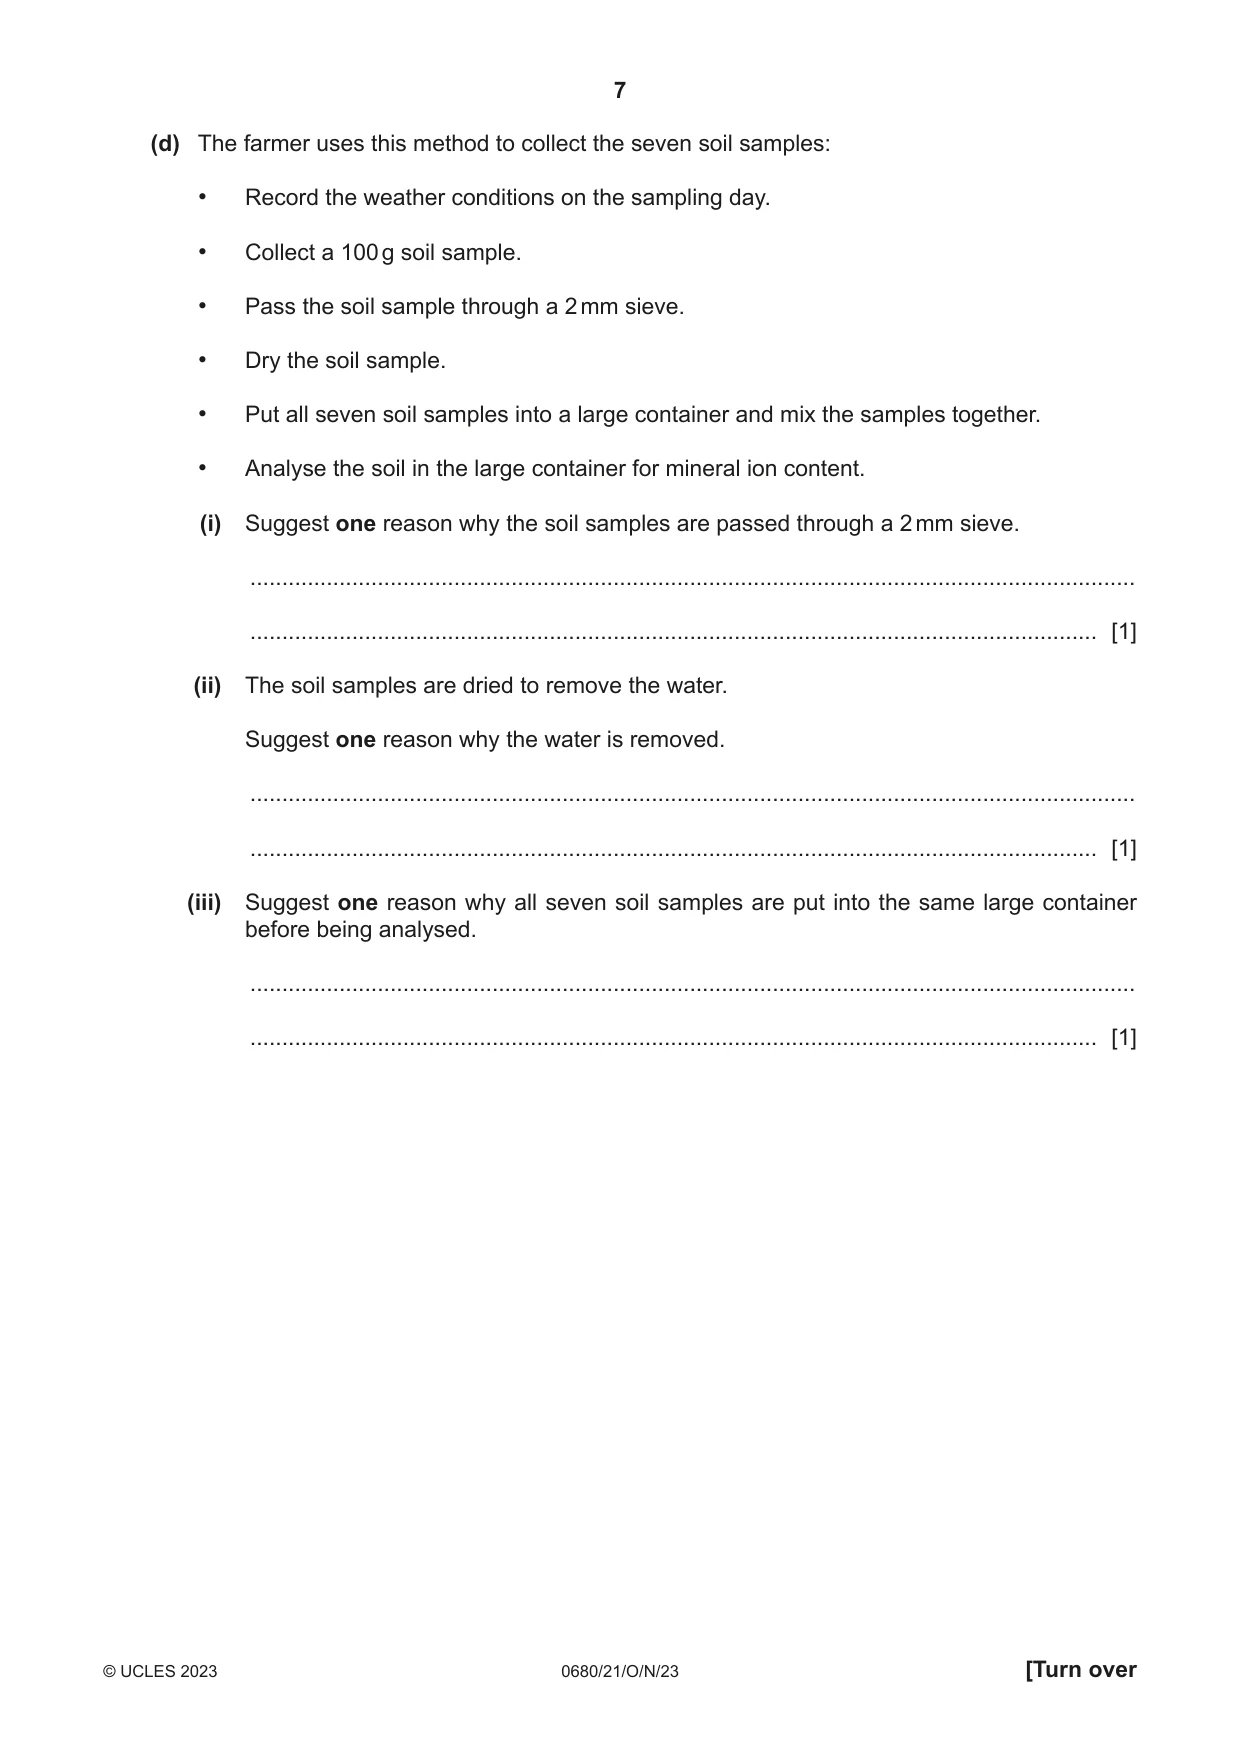
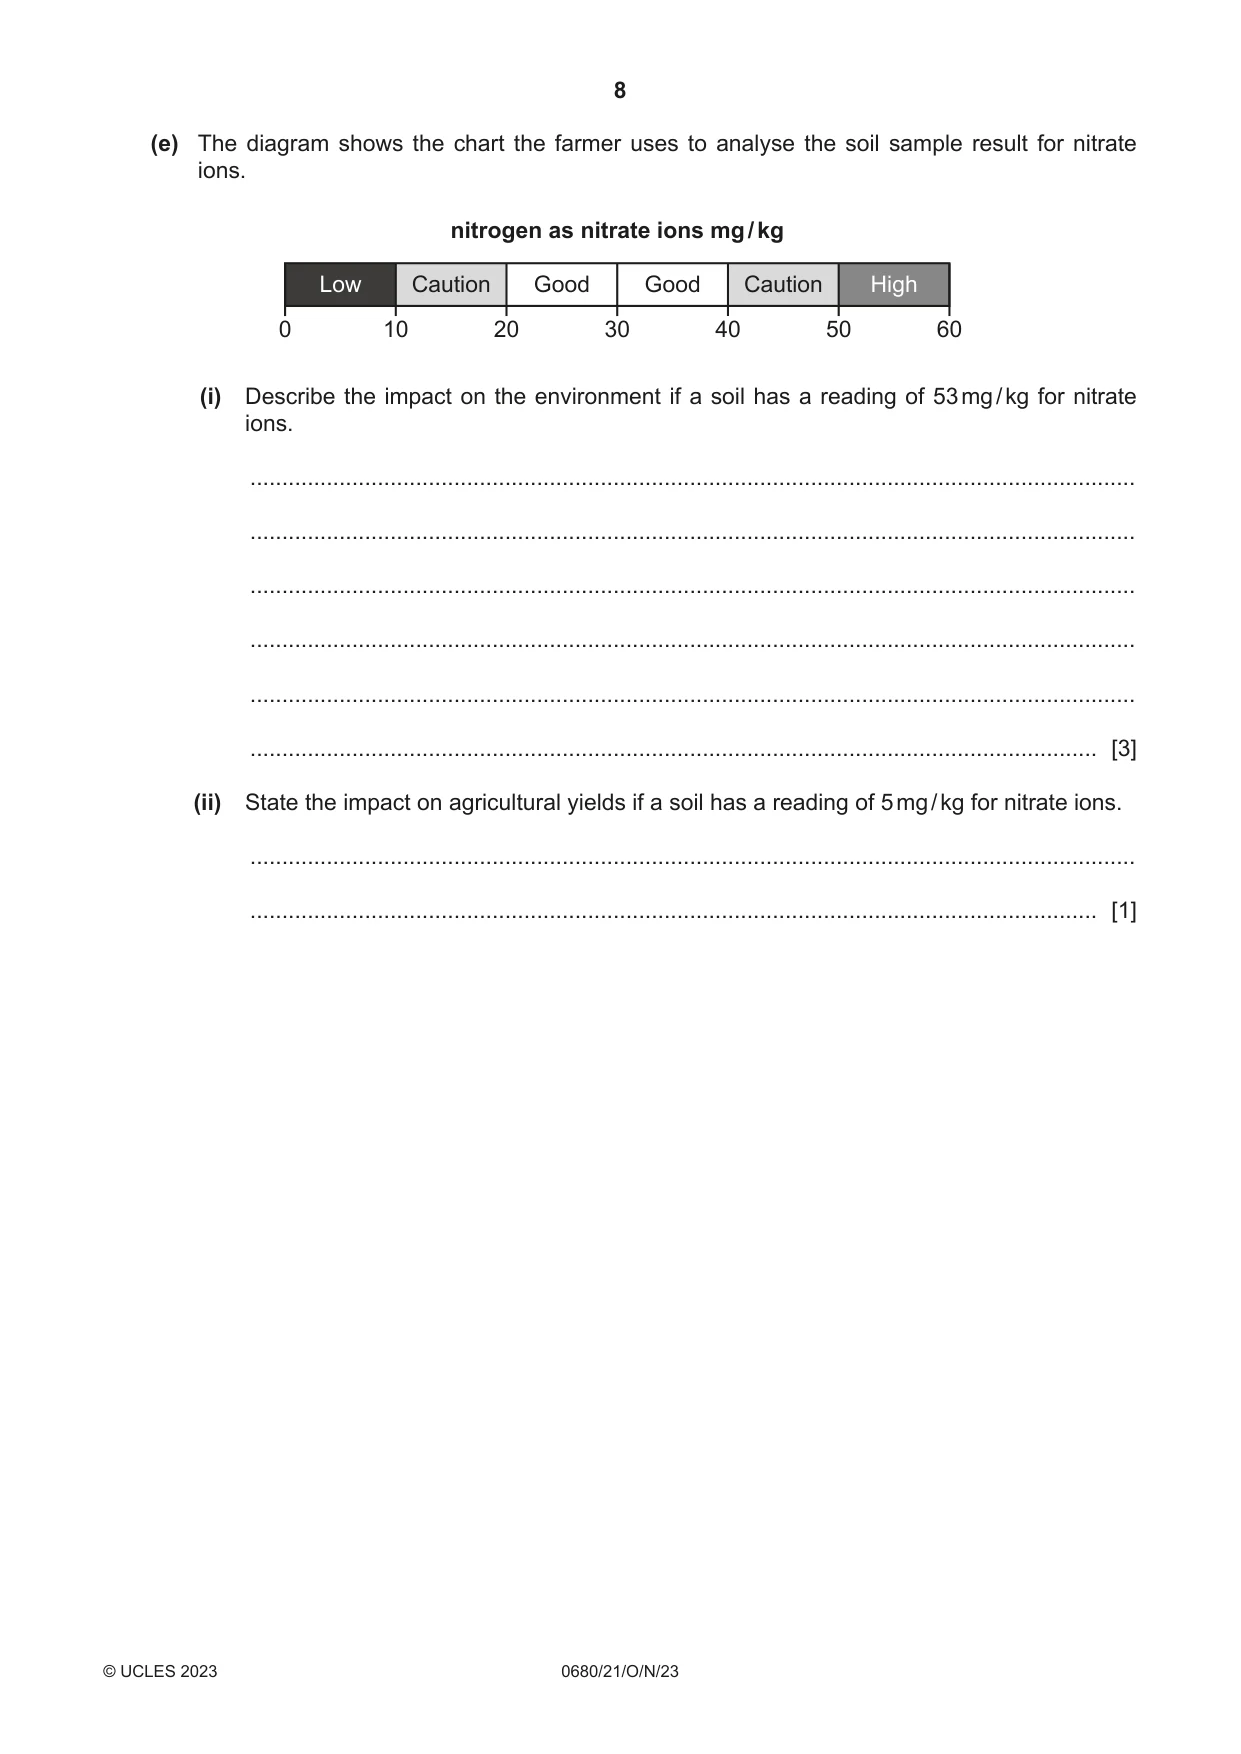
1 (a) The table shows the percentage of total land area for different types of land use in the UK. percentage of land use total land area of the UK pasture 46 arable 25 forest 12 other 17 (i) Calculate the total area of land in the UK used for pasture and arable. ................................................... km2 [2] (ii) Plot the data in the table as a pie chart and complete the key. Key ............................................... ............................................... ............................................... ............................................... [4] (b) Most farmers in the UK use intensive agricultural practices. Approximately 2% of the working population are involved in agriculture. Agricultural practices produce 60% of the UK’s food needs. (i) State three intensive agricultural practices. 1 ........................................................................................................................................ 2 ........................................................................................................................................ 3 ........................................................................................................................................ [3] (ii) State the benefits and negative impacts of intensive agricultural practices. benefits .............................................................................................................................. ........................................................................................................................................... ........................................................................................................................................... ........................................................................................................................................... ........................................................................................................................................... negative impacts ............................................................................................................... ........................................................................................................................................... ........................................................................................................................................... ........................................................................................................................................... ........................................................................................................................................... [4] (c) A farmer is concerned about the mineral ion content of the soil in a field. The farmer collects seven soil samples from the field. The diagram shows the locations of the seven sampling points. Key sampling point 20 m 20 m State the type of sampling method shown in the diagram. ............................................................................................................................................. [1] (d) The farmer uses this method to collect the seven soil samples: • Record the weather conditions on the sampling day. • Collect a 100 g soil sample. • Pass the soil sample through a 2 mm sieve. • Dry the soil sample. • Put all seven soil samples into a large container and mix the samples together. • Analyse the soil in the large container for mineral ion content. (i) Suggest one reason why the soil samples are passed through a 2 mm sieve. ........................................................................................................................................... ..................................................................................................................................... [1] (ii) The soil samples are dried to remove the water. Suggest one reason why the water is removed. ........................................................................................................................................... ..................................................................................................................................... [1] (iii) Suggest one reason why all seven soil samples are put into the same large container before being analysed. ........................................................................................................................................... ..................................................................................................................................... [1] (e) The diagram shows the chart the farmer uses to analyse the soil sample result for nitrate ions. nitrogen as nitrate ions mg / kg Low Caution Good Good Caution High 0 10 20 30 40 50 60 (i) Describe the impact on the environment if a soil has a reading of 53 mg / kg for nitrate ions. ........................................................................................................................................... ........................................................................................................................................... ........................................................................................................................................... ........................................................................................................................................... ........................................................................................................................................... ..................................................................................................................................... [3] (ii) State the impact on agricultural yields if a soil has a reading of 5 mg / kg for nitrate ions. ........................................................................................................................................... ..................................................................................................................................... [1] (f) The farmer writes a list of some of the components of soil. Add three other components of soil to the list. • mineral particles • mineral ions • ...................................................................................... • ...................................................................................... • ...................................................................................... [3] [Total: 24]
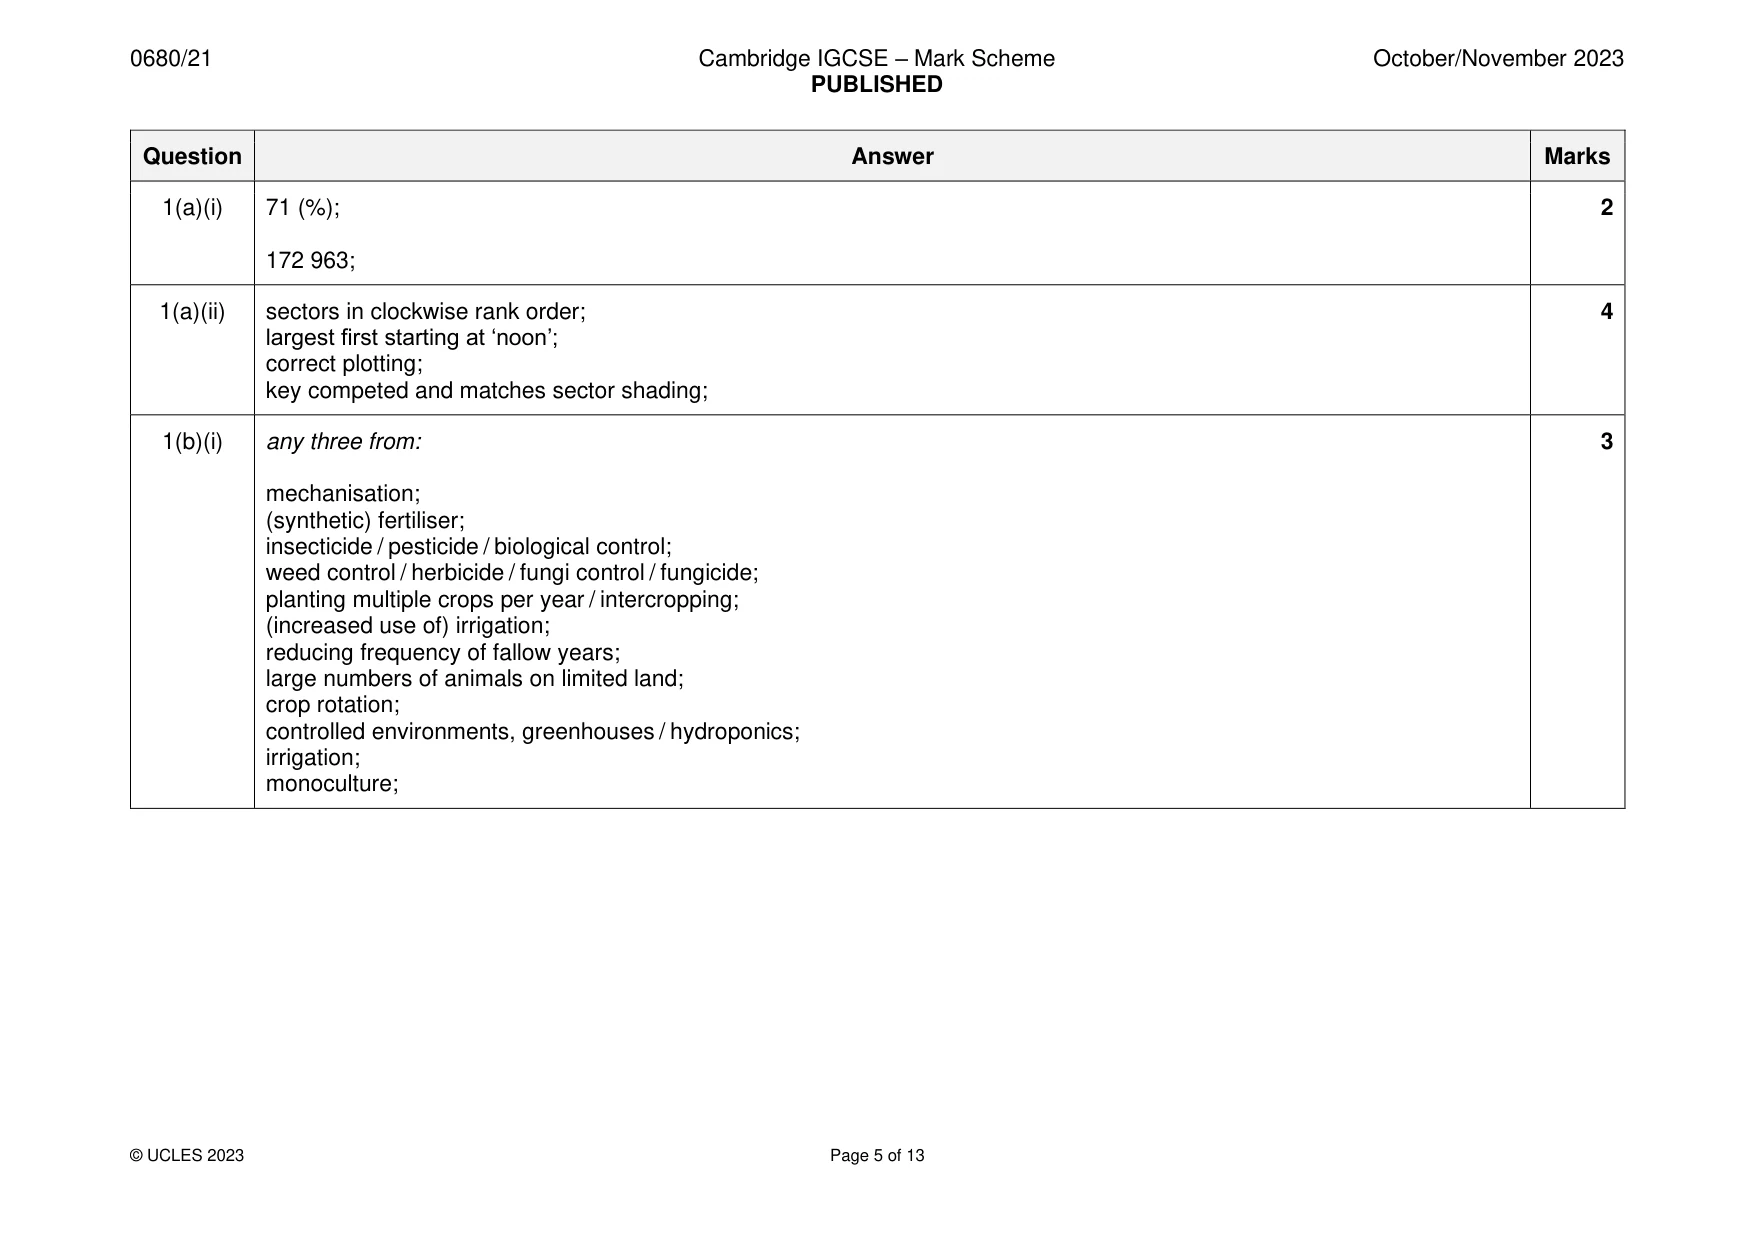
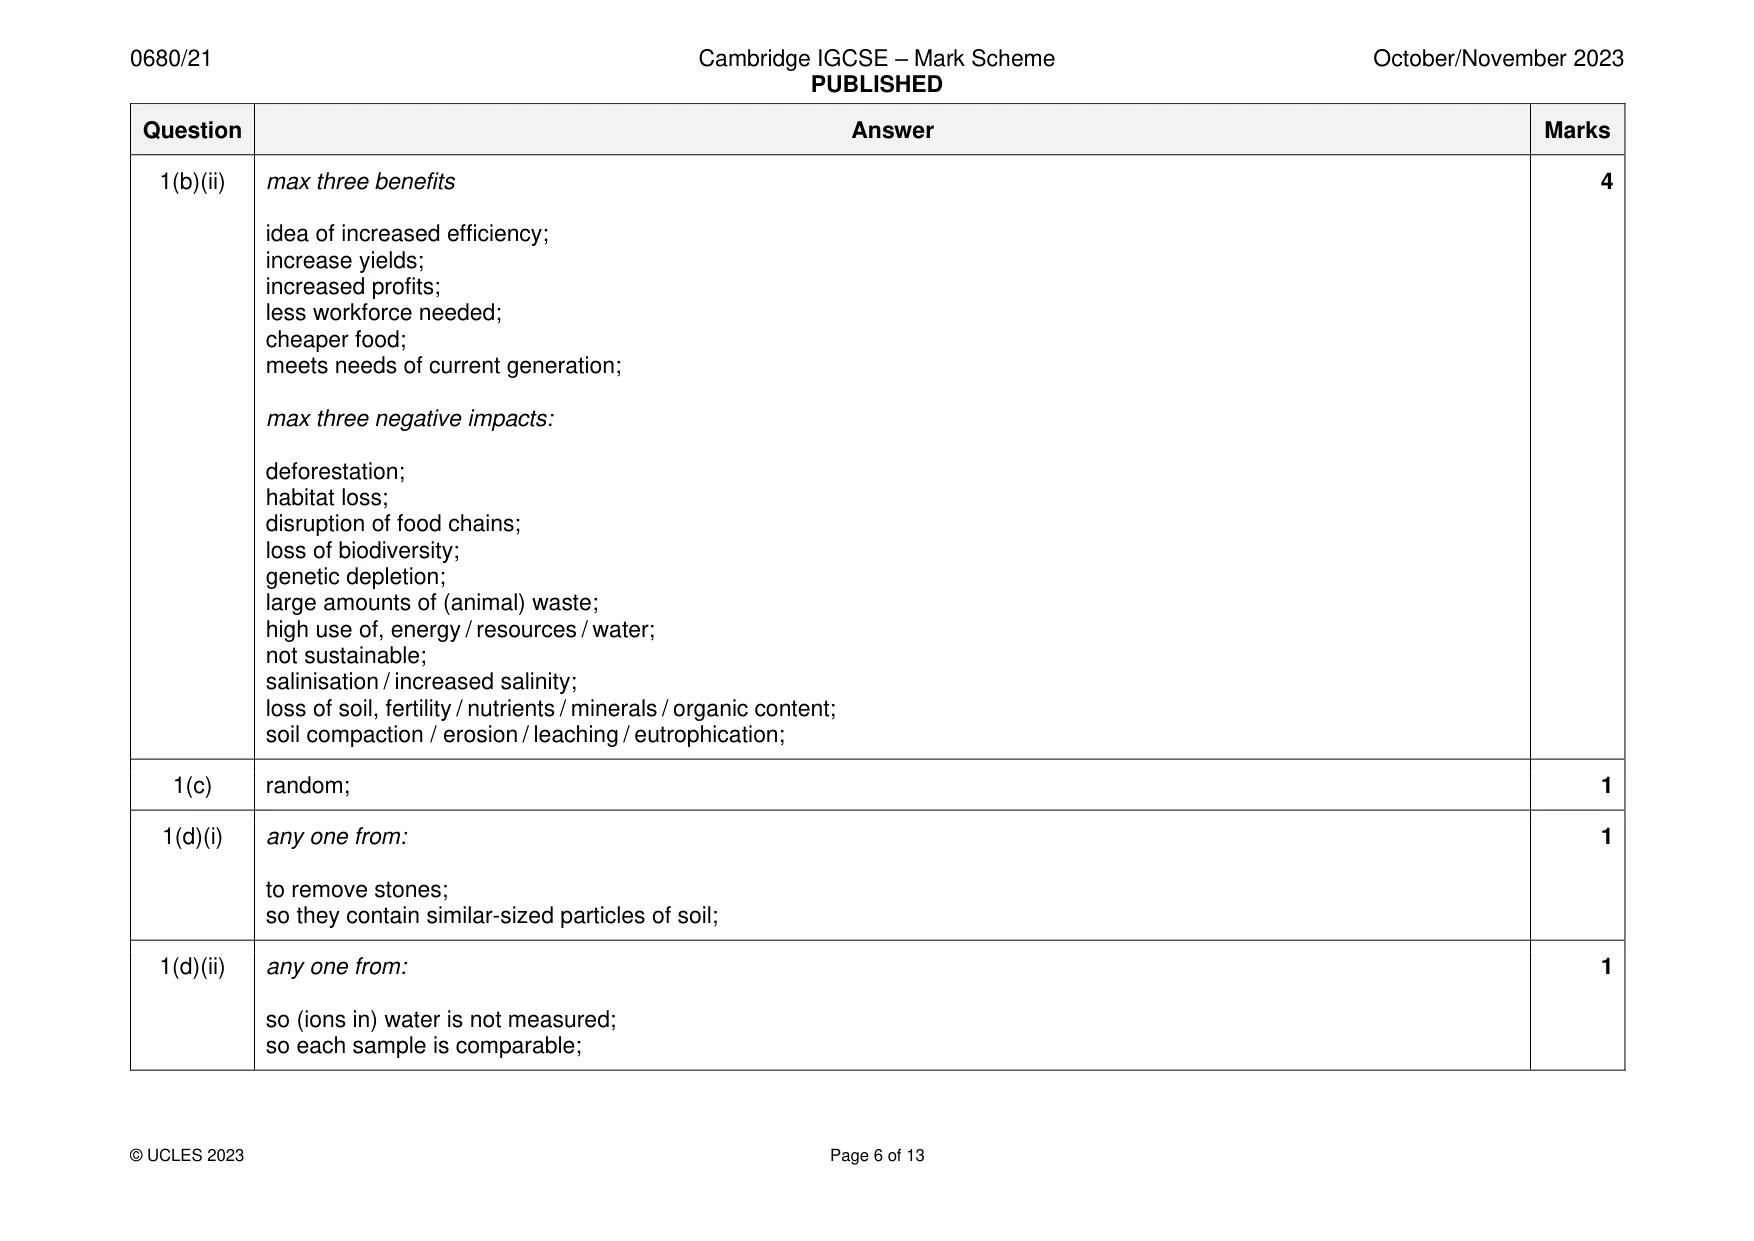
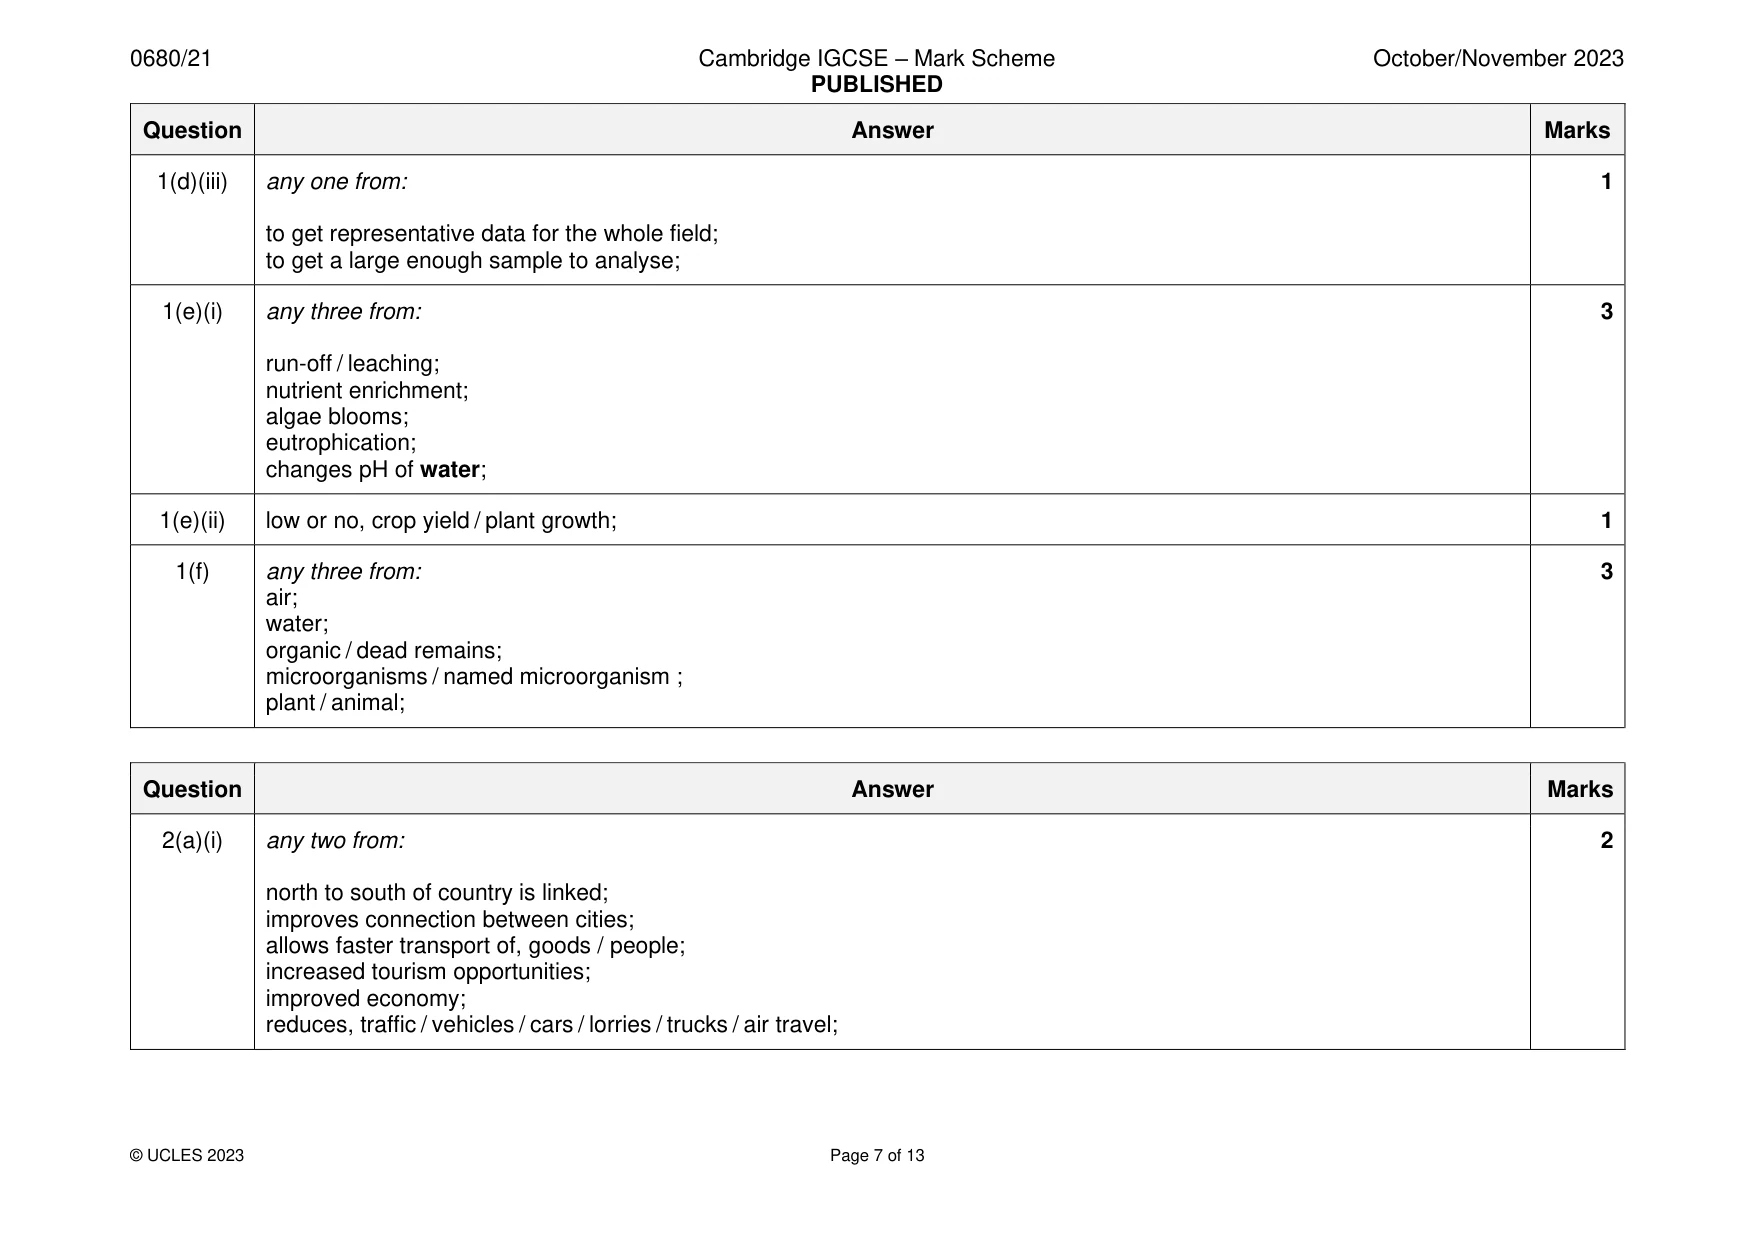
Mark scheme: Question Answer Marks 1(a)(i) 71 (%); 2 172 963; 1(a)(ii) sectors in clockwise rank order; 4 largest first starting at ‘noon’; correct plotting; key competed and matches sector shading; 1(b)(i) any three from: 3 mechanisation; (synthetic) fertiliser; insecticide / pesticide / biological control; weed control / herbicide / fungi control / fungicide; planting multiple crops per year / intercropping; (increased use of) irrigation; reducing frequency of fallow years; large numbers of animals on limited land; crop rotation; controlled environments, greenhouses / hydroponics; irrigation; monoculture; 1(b)(ii) max three benefits 4 idea of increased efficiency; increase yields; increased profits; less workforce needed; cheaper food; meets needs of current generation; max three negative impacts: deforestation; habitat loss; disruption of food chains; loss of biodiversity; genetic depletion; large amounts of (animal) waste; high use of, energy / resources / water; not sustainable; salinisation / increased salinity; loss of soil, fertility / nutrients / minerals / organic content; soil compaction / erosion / leaching / eutrophication; 1(c) random; 1 1(d)(i) any one from: 1 to remove stones; so they contain similar-sized particles of soil; 1(d)(ii) any one from: 1 so (ions in) water is not measured; so each sample is comparable; 1(d)(iii) any one from: 1 to get representative data for the whole field; to get a large enough sample to analyse; 1(e)(i) any three from: 3 run-off / leaching; nutrient enrichment; algae blooms; eutrophication; changes pH of water; 1(e)(ii) low or no, crop yield / plant growth; 1 1(f) any three from: 3 air; water; organic / dead remains; microorganisms / named microorganism ; plant / animal;
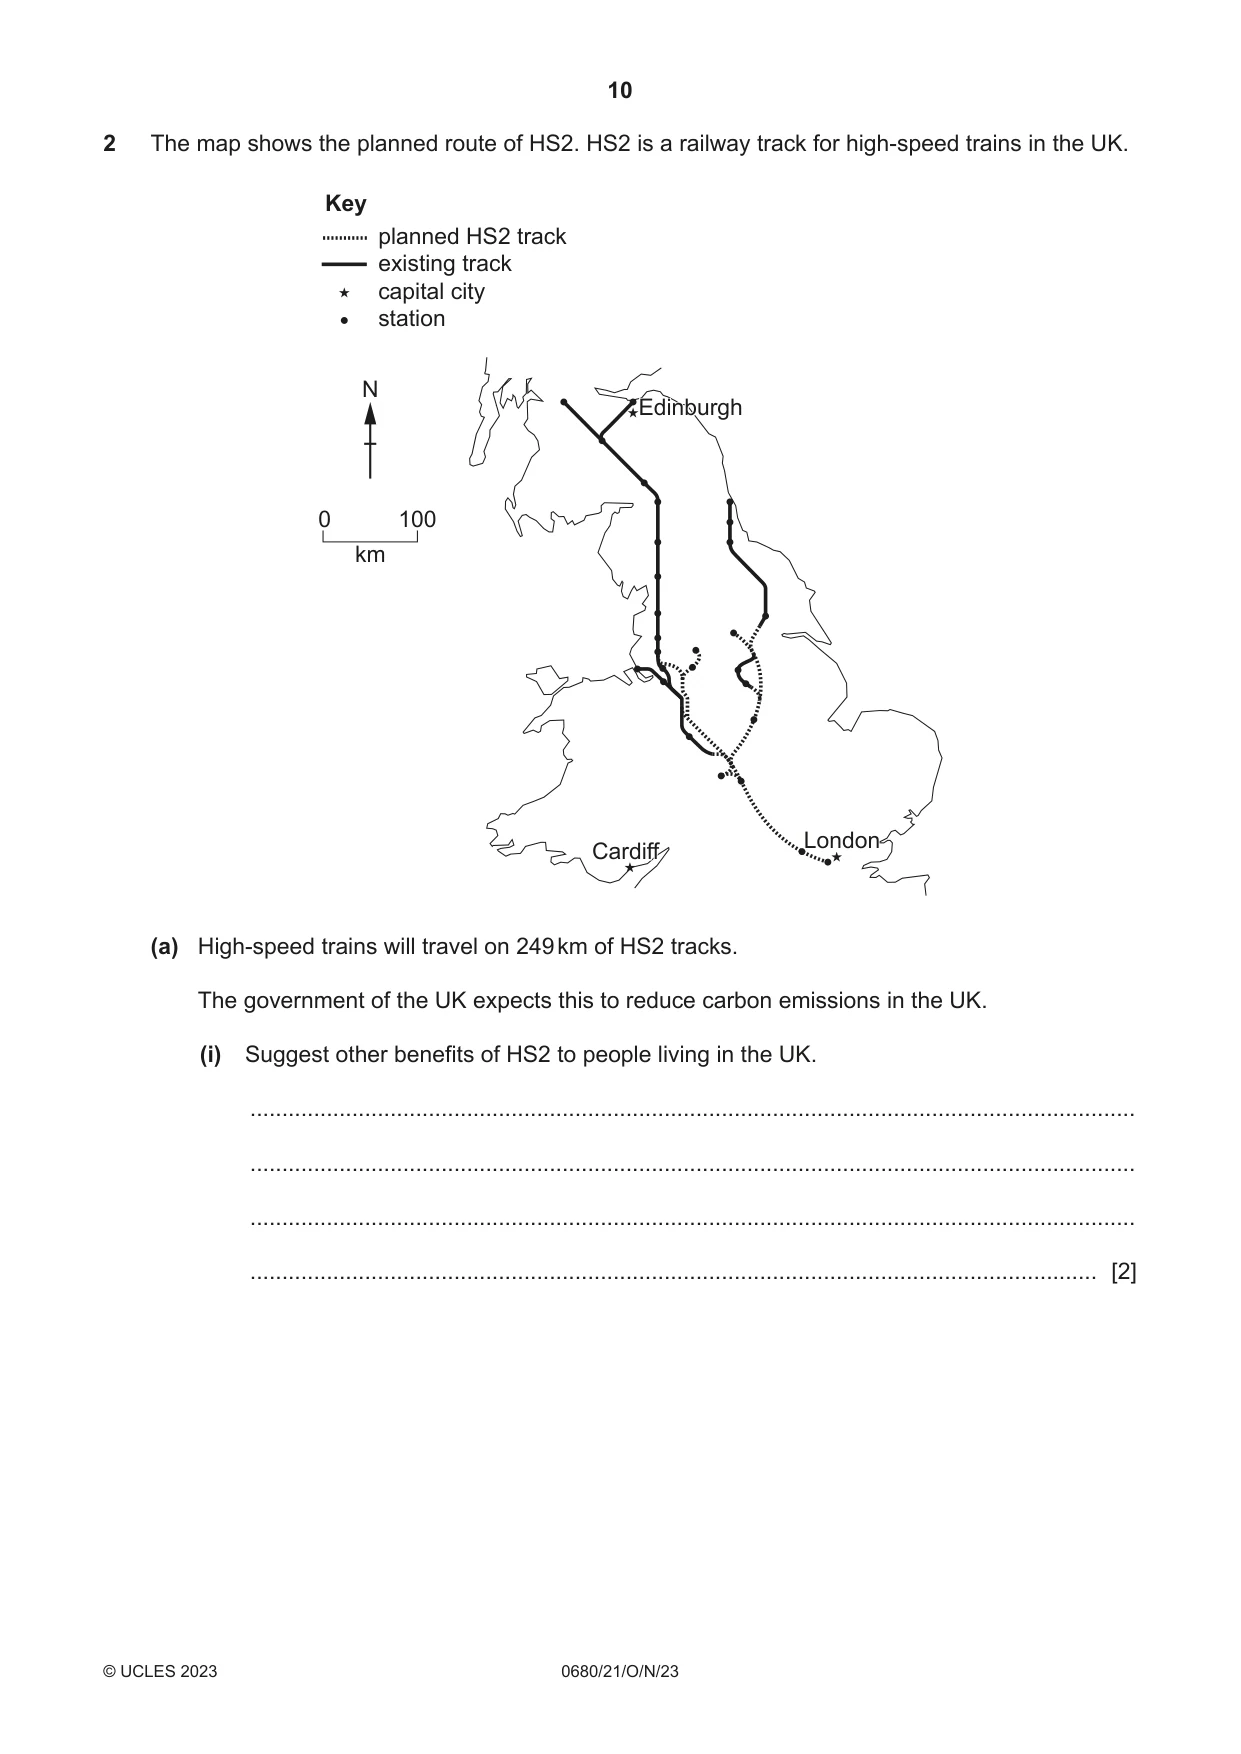
Q2 · The map shows the planned route of HS2
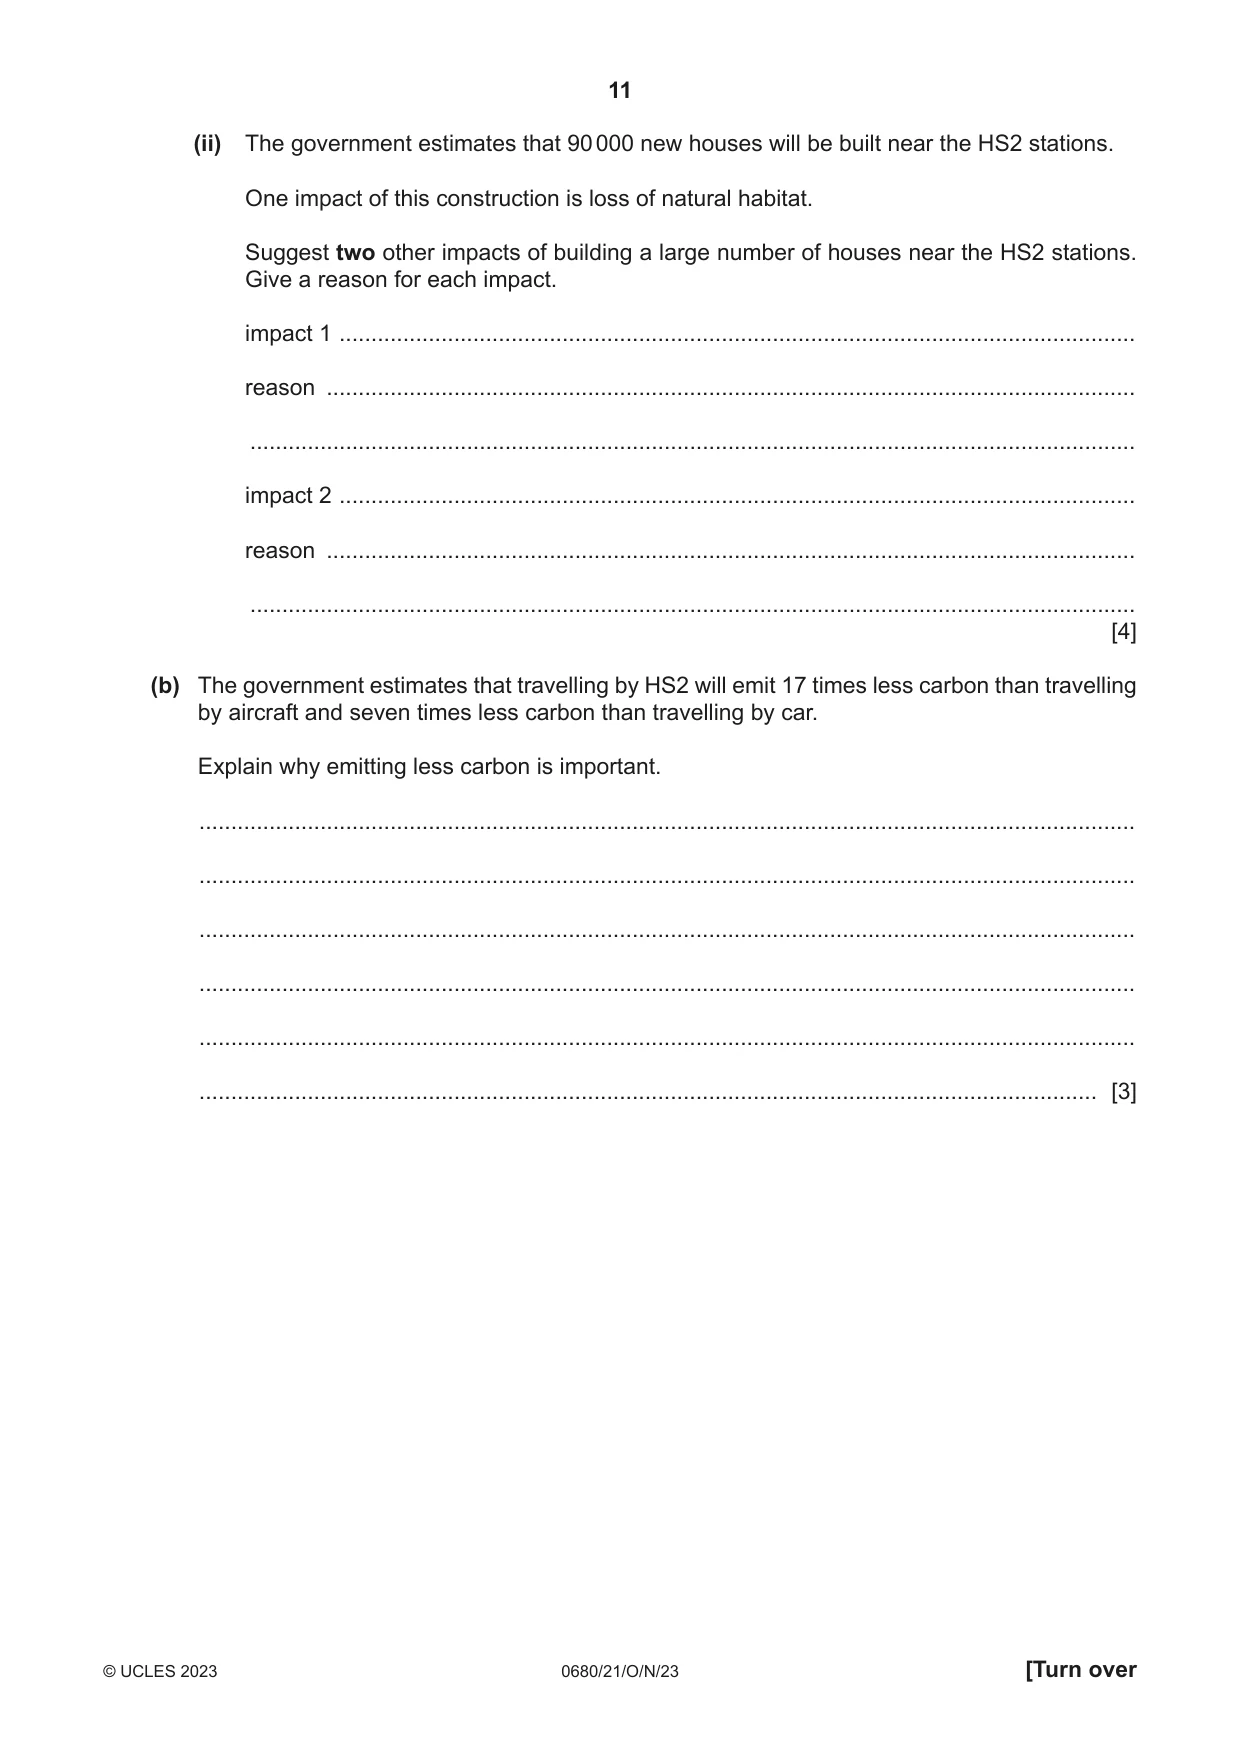
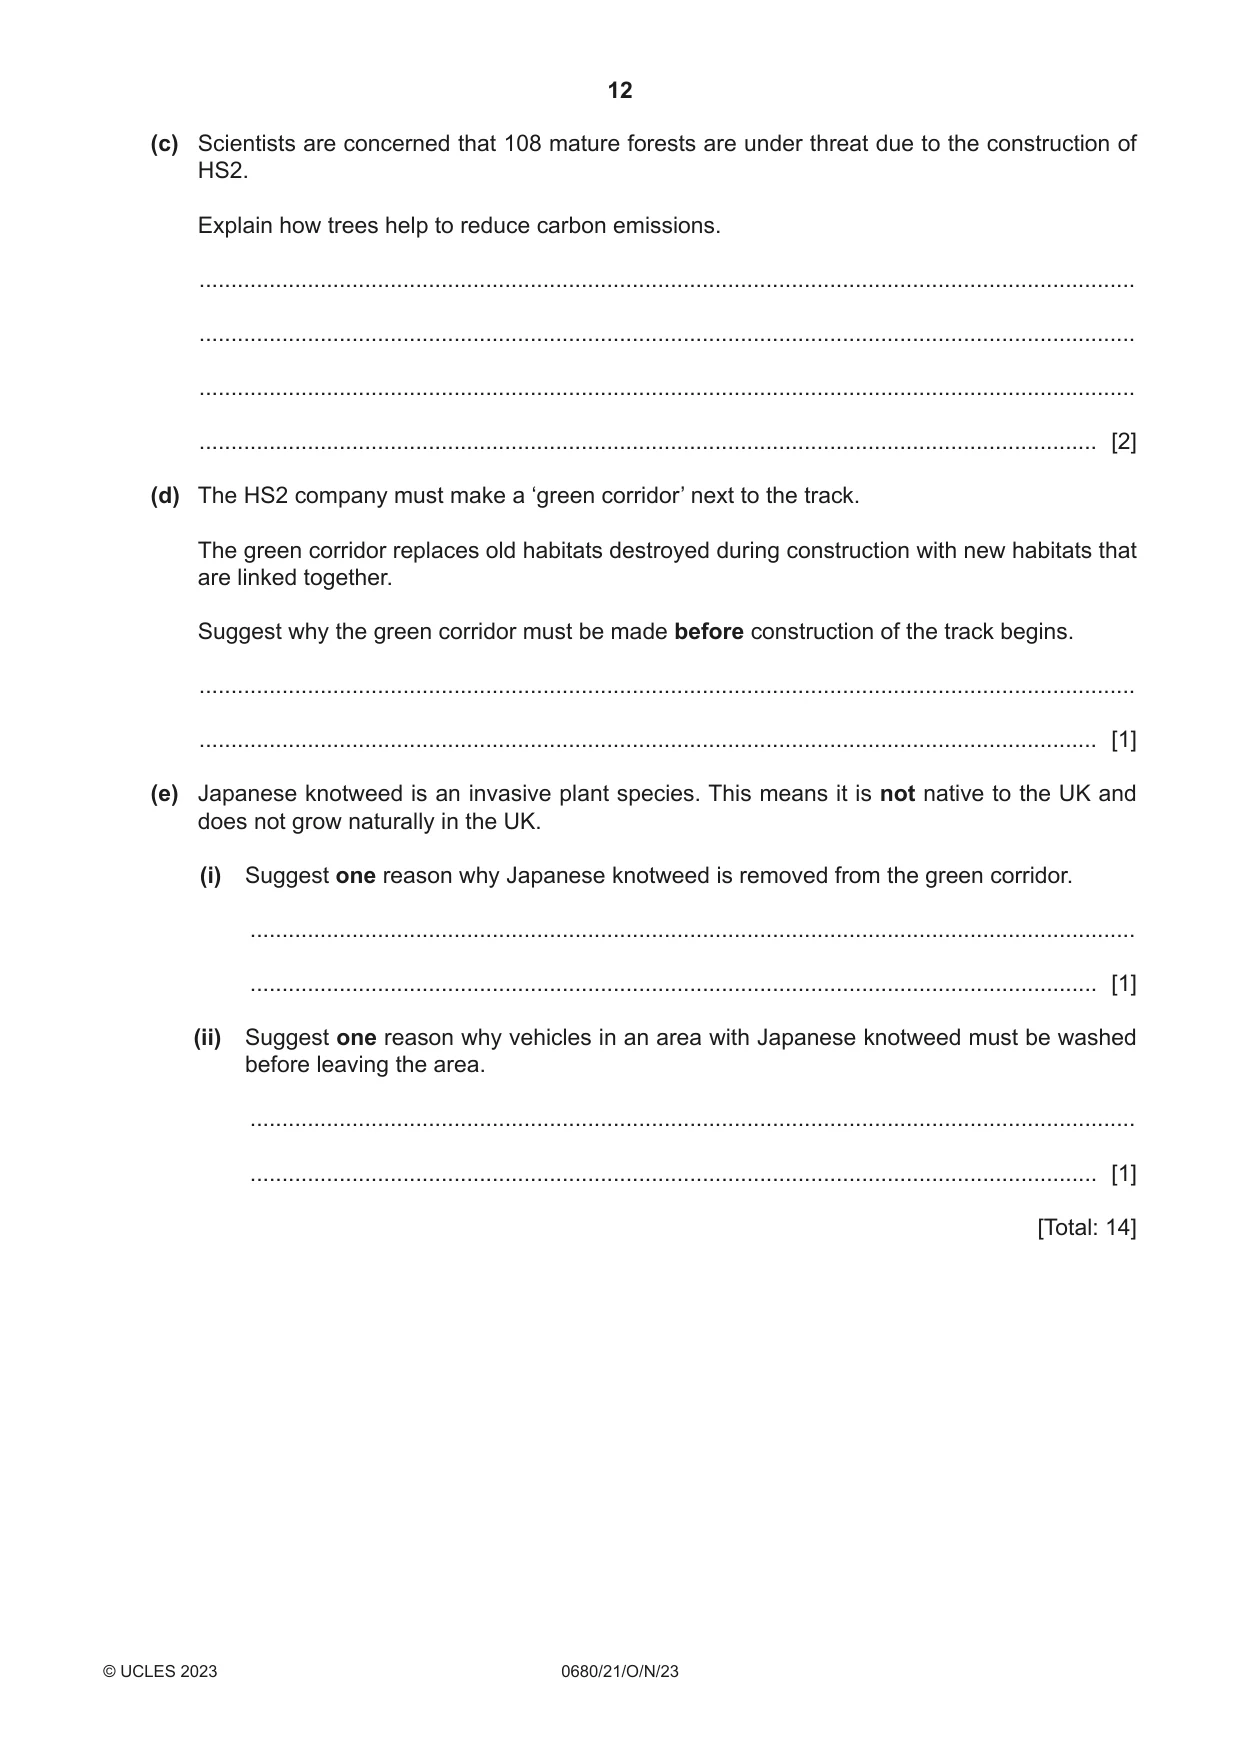
2 The map shows the planned route of HS2. HS2 is a railway track for high-speed trains in the UK. Key planned HS2 track existing track capital city station N EdinburghEdinburgh 0 100 km LondonLondon CardiffCardiff (a) High-speed trains will travel on 249 km of HS2 tracks. The government of the UK expects this to reduce carbon emissions in the UK. (i) Suggest other benefits of HS2 to people living in the UK. ........................................................................................................................................... ........................................................................................................................................... ........................................................................................................................................... ..................................................................................................................................... [2] (ii) The government estimates that 90 000 new houses will be built near the HS2 stations. One impact of this construction is loss of natural habitat. Suggest two other impacts of building a large number of houses near the HS2 stations. Give a reason for each impact. impact 1 ............................................................................................................................. reason ............................................................................................................................... ........................................................................................................................................... impact 2 ............................................................................................................................. reason ............................................................................................................................... ........................................................................................................................................... [4] (b) The government estimates that travelling by HS2 will emit 17 times less carbon than travelling by aircraft and seven times less carbon than travelling by car. Explain why emitting less carbon is important. ................................................................................................................................................... ................................................................................................................................................... ................................................................................................................................................... ................................................................................................................................................... ................................................................................................................................................... ............................................................................................................................................. [3] (c) Scientists are concerned that 108 mature forests are under threat due to the construction of HS2. Explain how trees help to reduce carbon emissions. ................................................................................................................................................... ................................................................................................................................................... ................................................................................................................................................... ............................................................................................................................................. [2] (d) The HS2 company must make a ‘green corridor’ next to the track. The green corridor replaces old habitats destroyed during construction with new habitats that are linked together. Suggest why the green corridor must be made before construction of the track begins. ................................................................................................................................................... ............................................................................................................................................. [1] (e) Japanese knotweed is an invasive plant species. This means it is not native to the UK and does not grow naturally in the UK. (i) Suggest one reason why Japanese knotweed is removed from the green corridor. ........................................................................................................................................... ..................................................................................................................................... [1] (ii) Suggest one reason why vehicles in an area with Japanese knotweed must be washed before leaving the area. ........................................................................................................................................... ..................................................................................................................................... [1] [Total: 14]
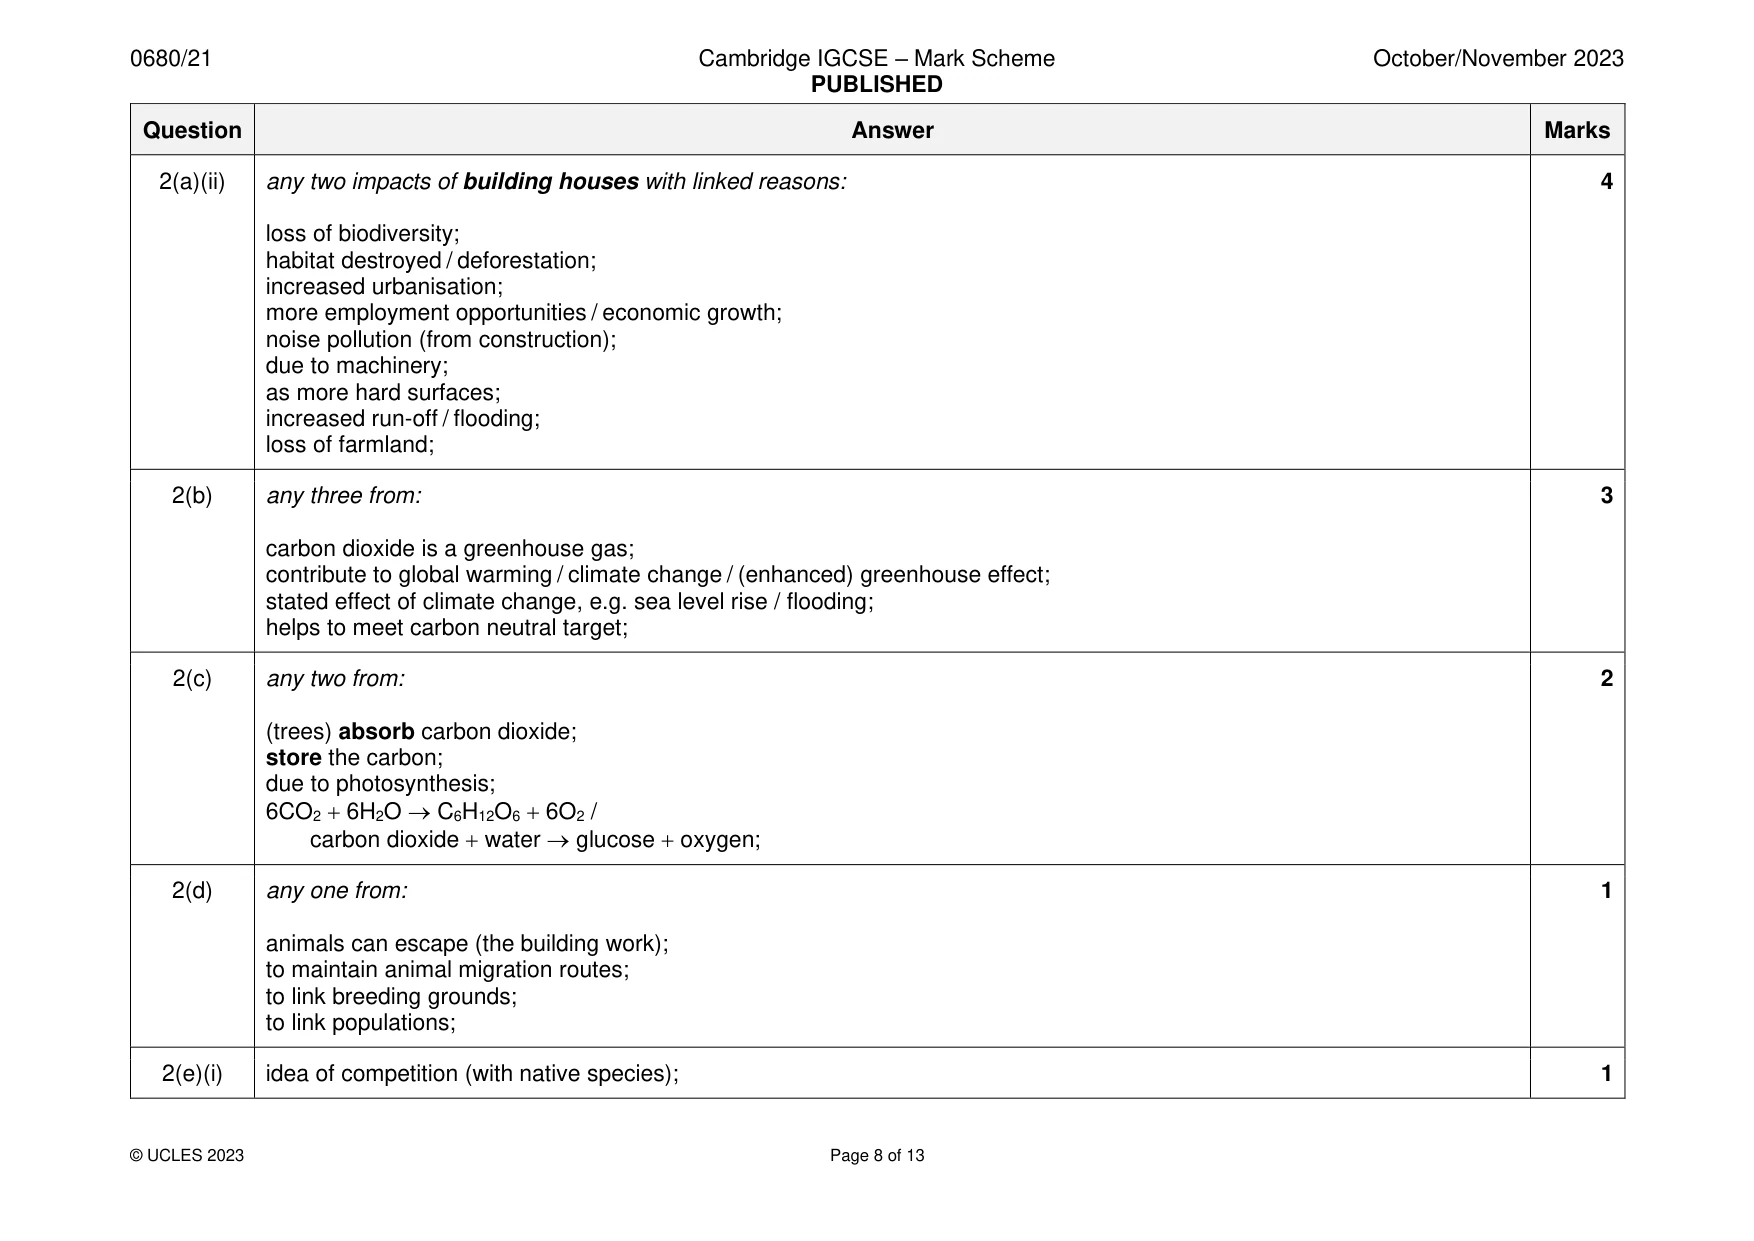
Mark scheme: 2(a)(i) any two from: 2 north to south of country is linked; improves connection between cities; allows faster transport of, goods / people; increased tourism opportunities; improved economy; reduces, traffic / vehicles / cars / lorries / trucks / air travel; 2(a)(ii) any two impacts of building houses with linked reasons: 4 loss of biodiversity; habitat destroyed / deforestation; increased urbanisation; more employment opportunities / economic growth; noise pollution (from construction); due to machinery; as more hard surfaces; increased run-off / flooding; loss of farmland; 2(b) any three from: 3 carbon dioxide is a greenhouse gas; contribute to global warming / climate change / (enhanced) greenhouse effect; stated effect of climate change, e.g. sea level rise / flooding; helps to meet carbon neutral target; 2(c) any two from: 2 (trees) absorb carbon dioxide; store the carbon; due to photosynthesis; 6CO2 + 6H2O → C6H12O6 + 6O2 / carbon dioxide + water → glucose + oxygen; 2(d) any one from: 1 animals can escape (the building work); to maintain animal migration routes; to link breeding grounds; to link populations; 2(e)(i) idea of competition (with native species); 1 2(e)(ii) to reduce the risk of spread (of the knotweed); 1
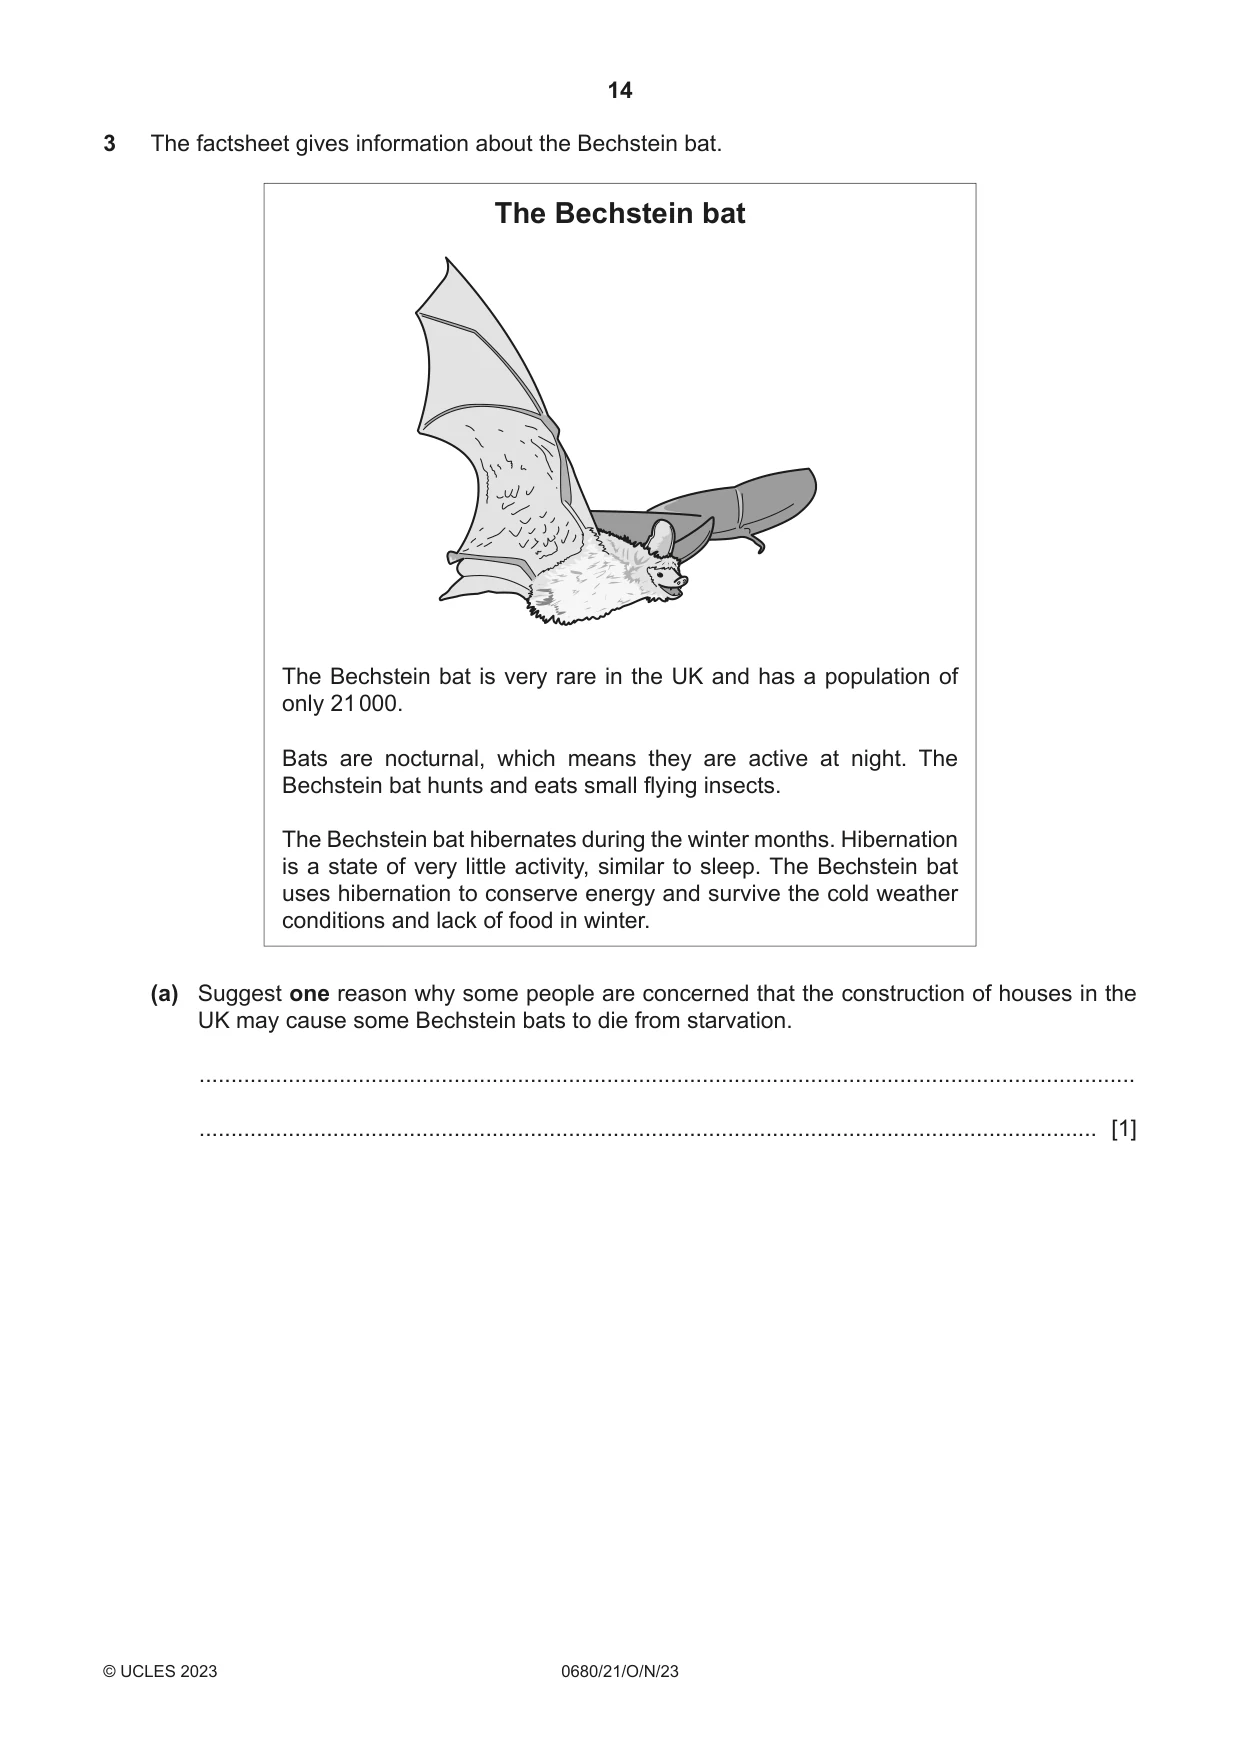
Q3 · The factsheet gives information about the Bechstein bat
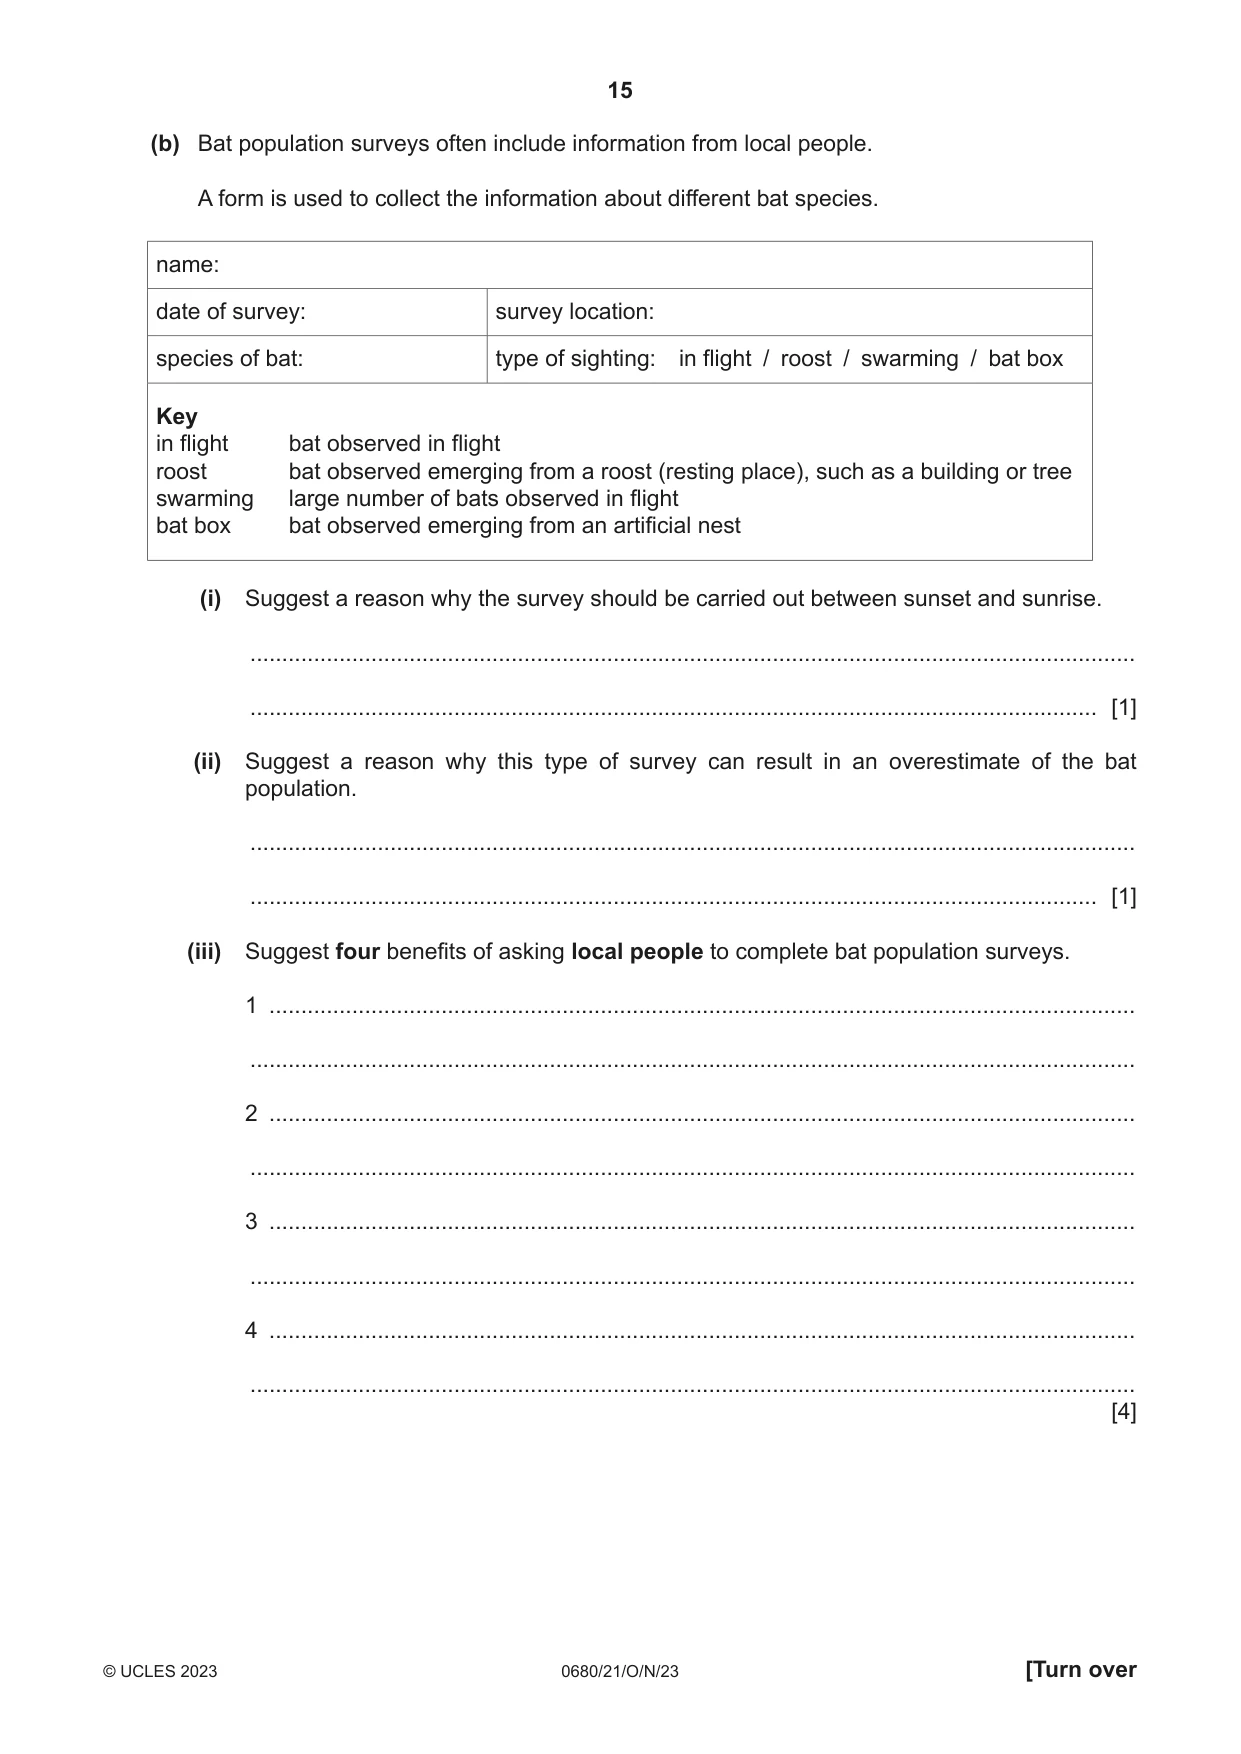
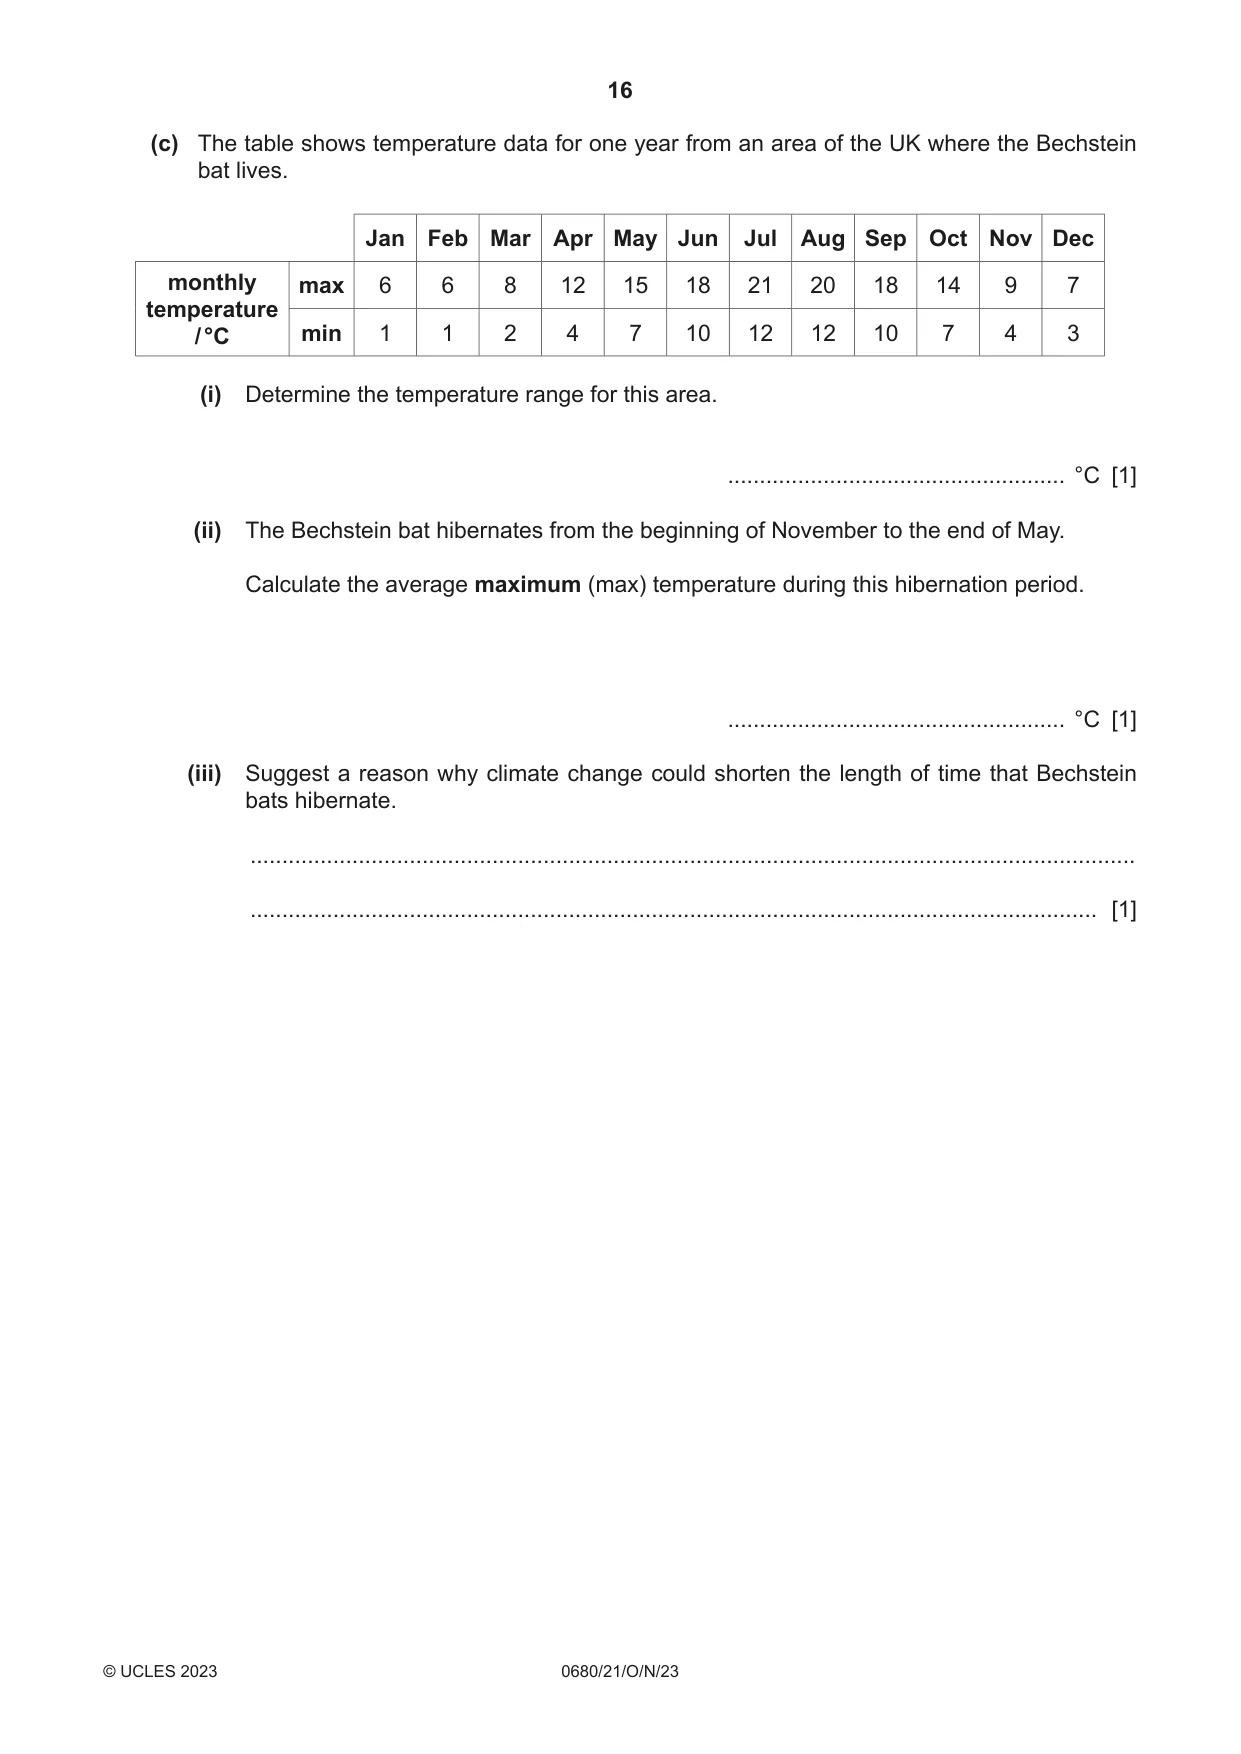
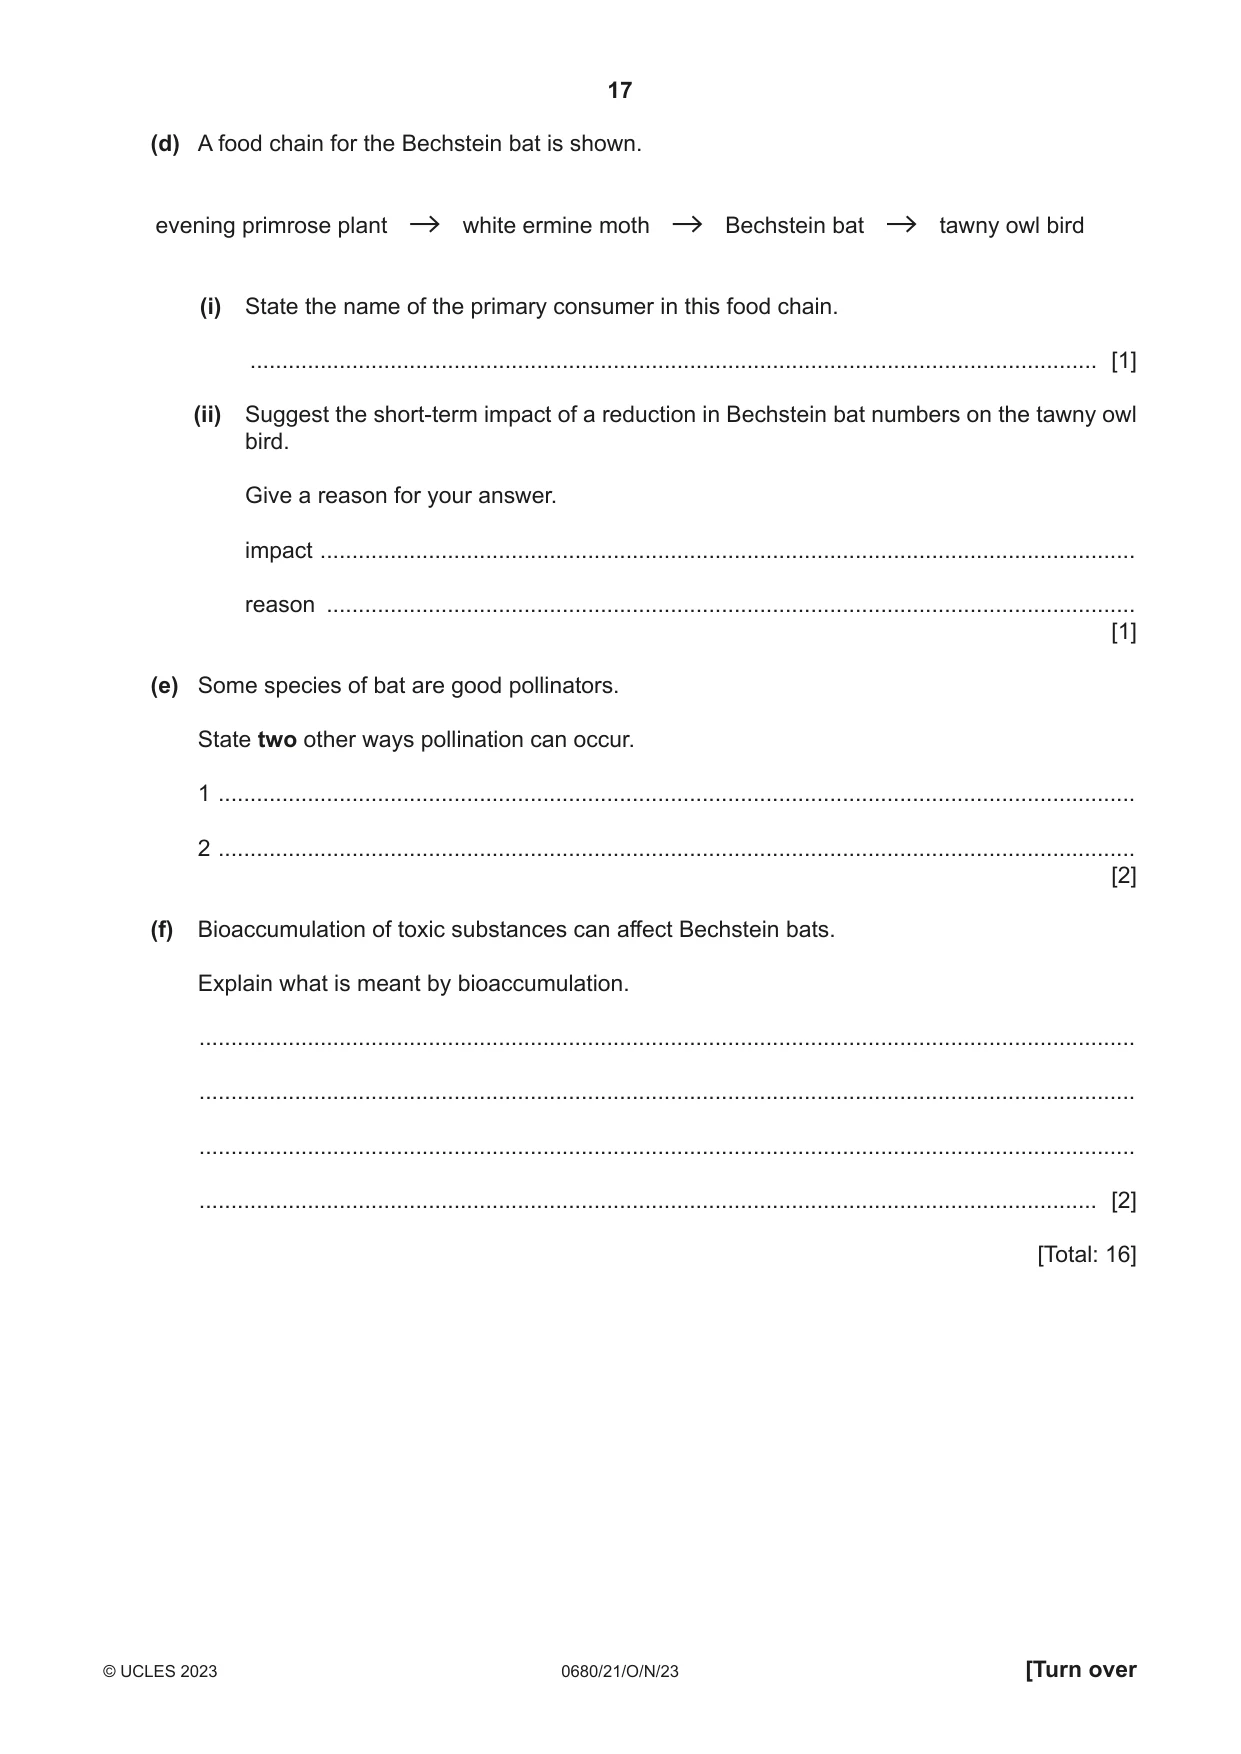
3 The factsheet gives information about the Bechstein bat. The Bechstein bat The Bechstein bat is very rare in the UK and has a population of only 21 000. Bats are nocturnal, which means they are active at night. The Bechstein bat hunts and eats small flying insects. The Bechstein bat hibernates during the winter months. Hibernation is a state of very little activity, similar to sleep. The Bechstein bat uses hibernation to conserve energy and survive the cold weather conditions and lack of food in winter. (a) Suggest one reason why some people are concerned that the construction of houses in the UK may cause some Bechstein bats to die from starvation. ................................................................................................................................................... ............................................................................................................................................. [1] (b) Bat population surveys often include information from local people. A form is used to collect the information about different bat species. name: date of survey: survey location: species of bat: type of sighting: in flight / roost / swarming / bat box Key in flight bat observed in flight roost bat observed emerging from a roost (resting place), such as a building or tree swarming large number of bats observed in flight bat box bat observed emerging from an artificial nest (i) Suggest a reason why the survey should be carried out between sunset and sunrise. ........................................................................................................................................... ..................................................................................................................................... [1] (ii) Suggest a reason why this type of survey can result in an overestimate of the bat population. ........................................................................................................................................... ..................................................................................................................................... [1] (iii) Suggest four benefits of asking local people to complete bat population surveys. 1 ........................................................................................................................................ ........................................................................................................................................... 2 ........................................................................................................................................ ........................................................................................................................................... 3 ........................................................................................................................................ ........................................................................................................................................... 4 ........................................................................................................................................ ........................................................................................................................................... [4] (c) The table shows temperature data for one year from an area of the UK where the Bechstein bat lives. Jan Feb Mar Apr May Jun Jul Aug Sep Oct Nov Dec monthly max 6 6 8 12 15 18 21 20 18 14 9 7 temperature / °C min 1 1 2 4 7 10 12 12 10 7 4 3 (i) Determine the temperature range for this area. ..................................................... °C [1] (ii) The Bechstein bat hibernates from the beginning of November to the end of May. Calculate the average maximum (max) temperature during this hibernation period. ..................................................... °C [1] (iii) Suggest a reason why climate change could shorten the length of time that Bechstein bats hibernate. ........................................................................................................................................... ..................................................................................................................................... [1] (d) A food chain for the Bechstein bat is shown. evening primrose plant white ermine moth Bechstein bat tawny owl bird (i) State the name of the primary consumer in this food chain. ..................................................................................................................................... [1] (ii) Suggest the short-term impact of a reduction in Bechstein bat numbers on the tawny owl bird. Give a reason for your answer. impact ................................................................................................................................ reason ............................................................................................................................... [1] (e) Some species of bat are good pollinators. State two other ways pollination can occur. 1 ................................................................................................................................................ 2 ................................................................................................................................................ [2] (f) Bioaccumulation of toxic substances can affect Bechstein bats. Explain what is meant by bioaccumulation. ................................................................................................................................................... ................................................................................................................................................... ................................................................................................................................................... ............................................................................................................................................. [2] [Total: 16]
Mark scheme: 3(a) any one from: 1 reduction in food ; disruption of food chain; migration of prey; harder to catch prey; 3(b)(i) bats are nocturnal / only active at night; 1 3(b)(ii) any one from: 1 same bat could be counted more than once; public are not experts (so may count other species); 3(b)(iii) any four from: 4 local knowledge of, where bats are / when bats active; many people can help; low cost; large amount of data can be collected; data can be collected quickly; raises awareness of the animal; 3(c)(i) 20; 1 3(c)(ii) 9; 1 3(c)(iii) warmer temperatures; 1 3(d)(i) (white ermine) moth; 1 3(d)(ii) numbers decrease AND they have less food to eat; 1 3(e) any two from: 2 wind; insects; birds; self-pollination; 3(f) (toxic substance) is absorbed; 2 (absorbed) faster than it is lost (from an organism) / not excreted (fast enough) ;
Q4 · The graph shows the net percentage of energy supply that was imported and exported from…
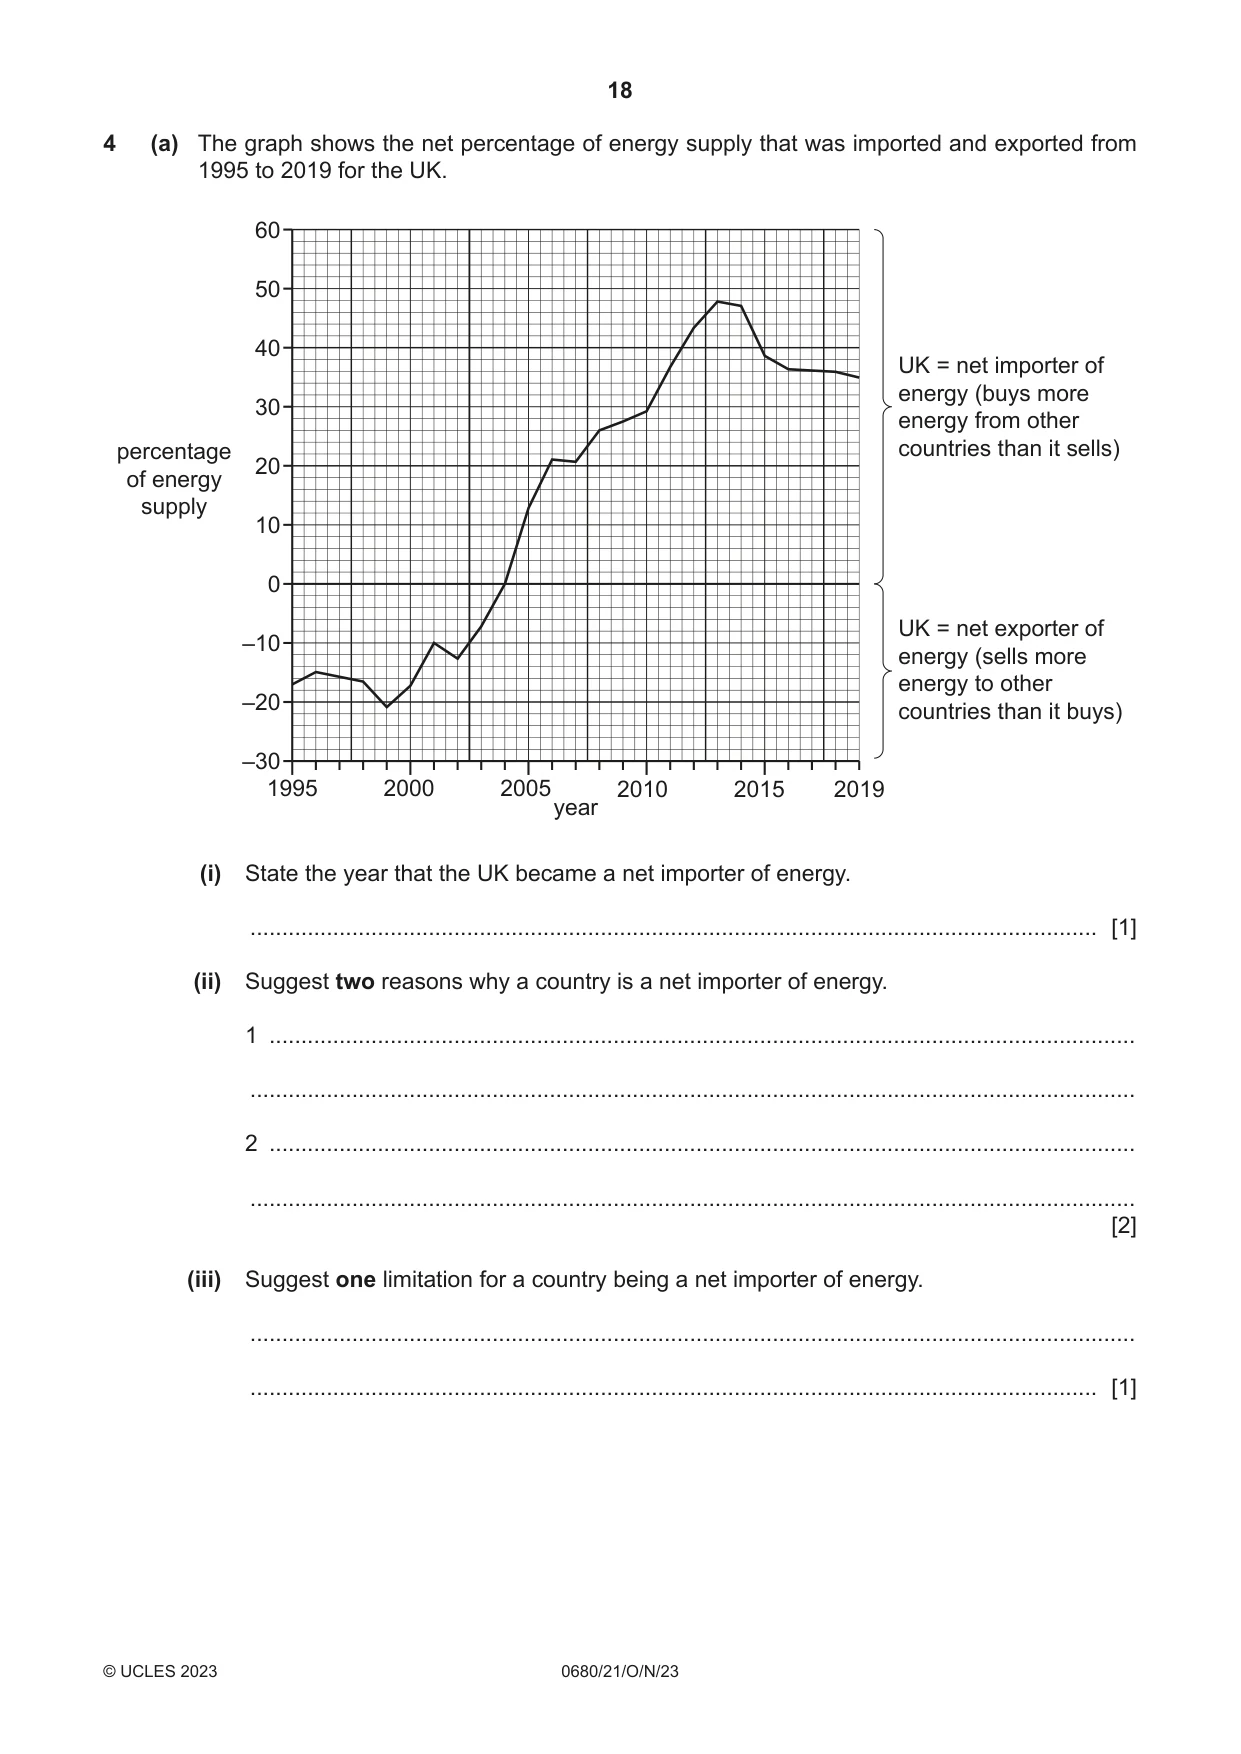
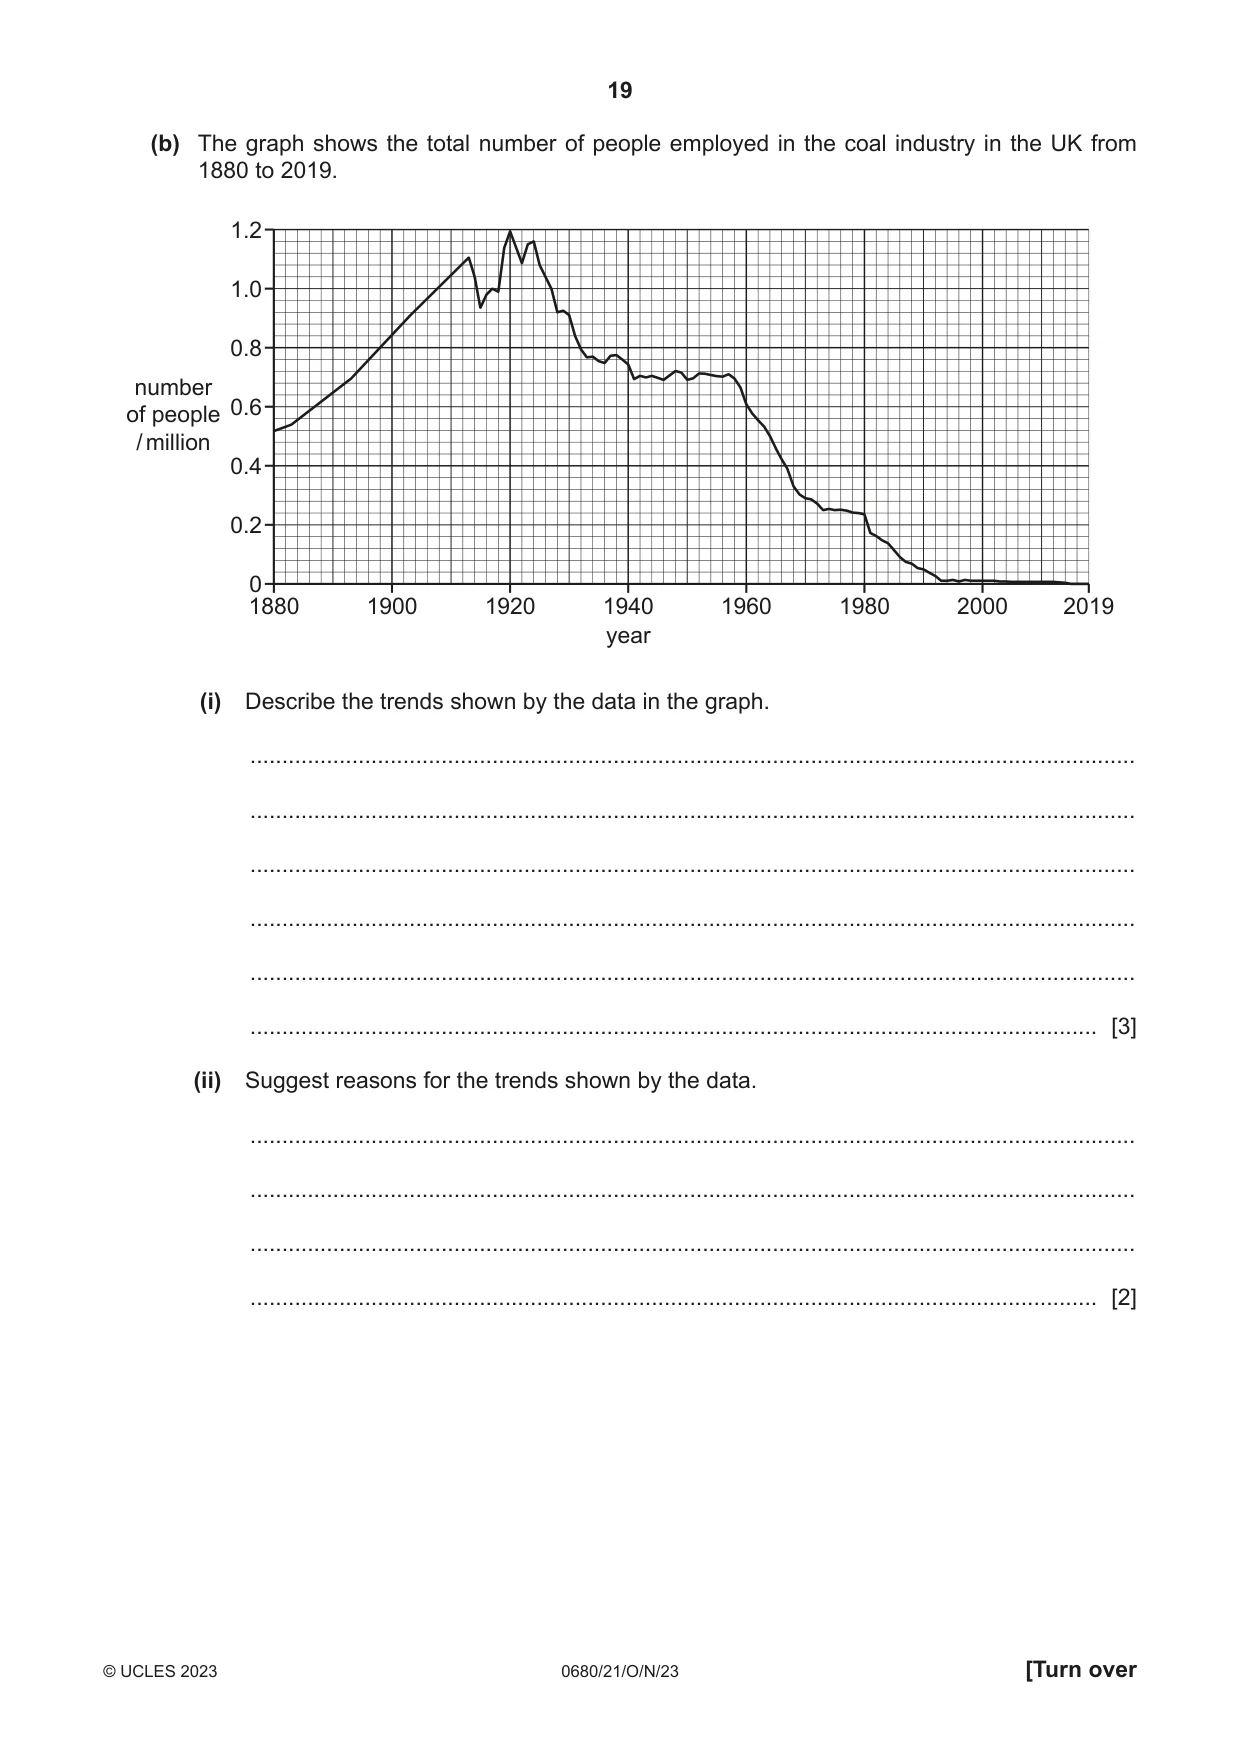
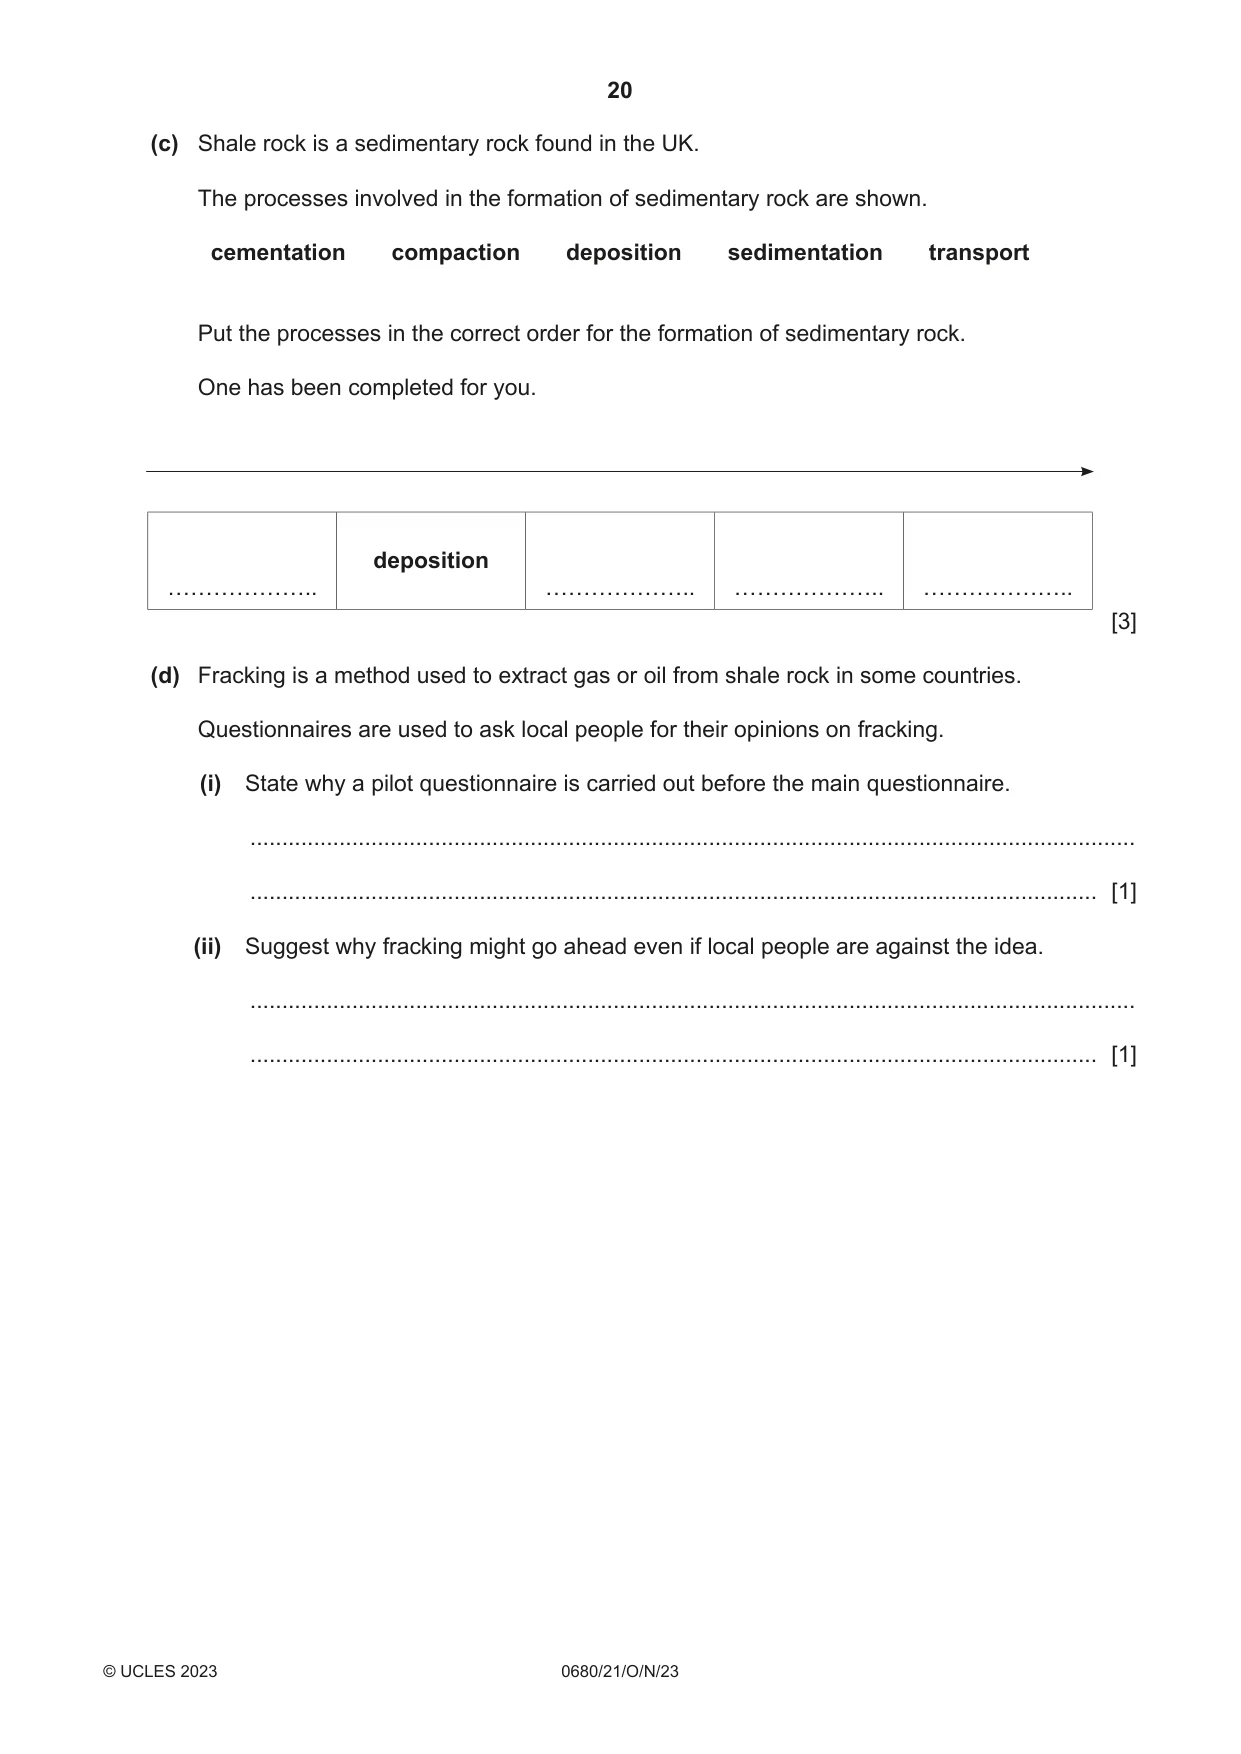
4 (a) The graph shows the net percentage of energy supply that was imported and exported from 1995 to 2019 for the UK. 60 50 40 UK = net importer of energy (buys more 30 energy from other percentage countries than it sells) 20 of energy supply 10 0 UK = net exporter of –10 energy (sells more energy to other –20 countries than it buys) –30 1995 2000 2005 2010 2015 2019 year (i) State the year that the UK became a net importer of energy. ..................................................................................................................................... [1] (ii) Suggest two reasons why a country is a net importer of energy. 1 ........................................................................................................................................ ........................................................................................................................................... 2 ........................................................................................................................................ ........................................................................................................................................... [2] (iii) Suggest one limitation for a country being a net importer of energy. ........................................................................................................................................... ..................................................................................................................................... [1] (b) The graph shows the total number of people employed in the coal industry in the UK from 1880 to 2019. 1.2 1.0 0.8 number 0.6of people / million 0.4 0.2 0 1880 1900 1920 1940 1960 1980 2000 2019 year (i) Describe the trends shown by the data in the graph. ........................................................................................................................................... ........................................................................................................................................... ........................................................................................................................................... ........................................................................................................................................... ........................................................................................................................................... ..................................................................................................................................... [3] (ii) Suggest reasons for the trends shown by the data. ........................................................................................................................................... ........................................................................................................................................... ........................................................................................................................................... ..................................................................................................................................... [2] (c) Shale rock is a sedimentary rock found in the UK. The processes involved in the formation of sedimentary rock are shown. cementation compaction deposition sedimentation transport Put the processes in the correct order for the formation of sedimentary rock. One has been completed for you. deposition [3] (d) Fracking is a method used to extract gas or oil from shale rock in some countries. Questionnaires are used to ask local people for their opinions on fracking. (i) State why a pilot questionnaire is carried out before the main questionnaire. ........................................................................................................................................... ..................................................................................................................................... [1] (ii) Suggest why fracking might go ahead even if local people are against the idea. ........................................................................................................................................... ..................................................................................................................................... [1]
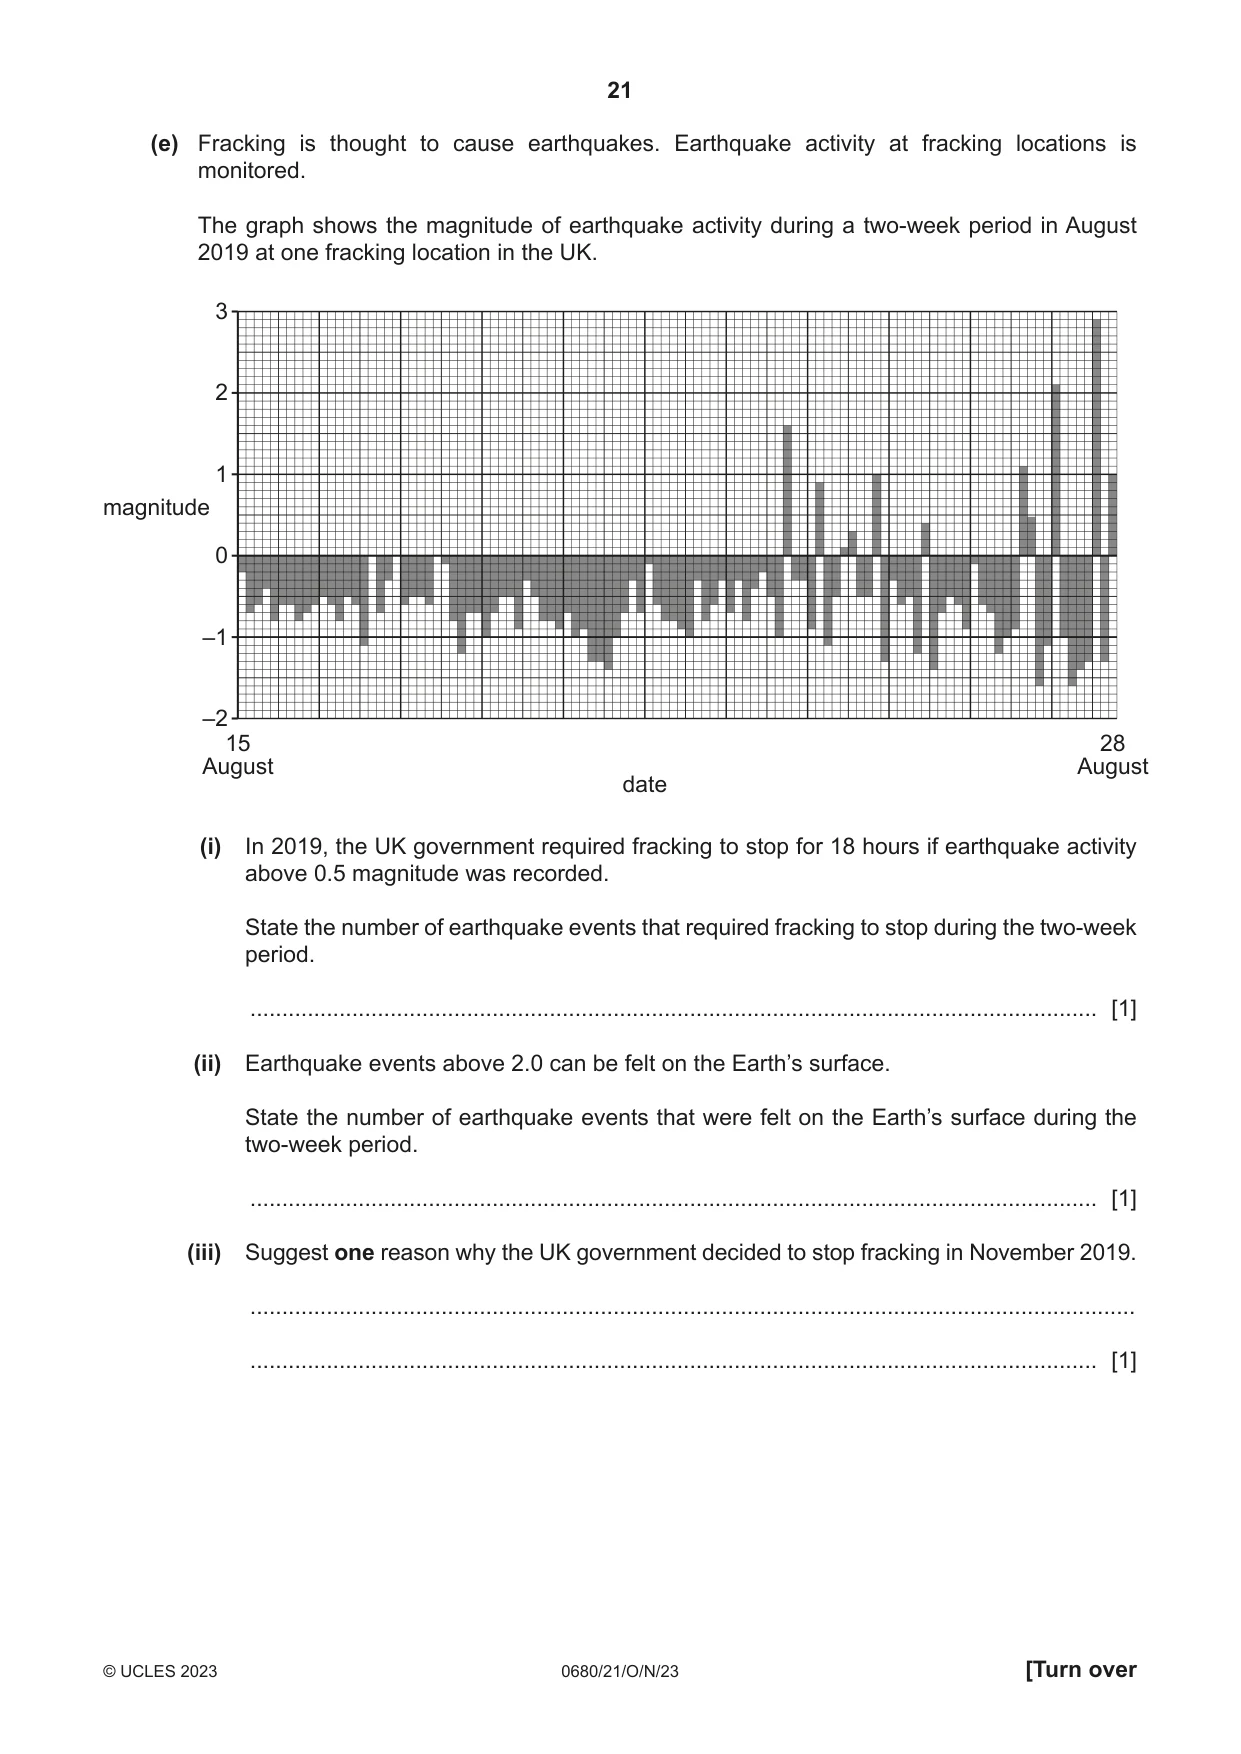
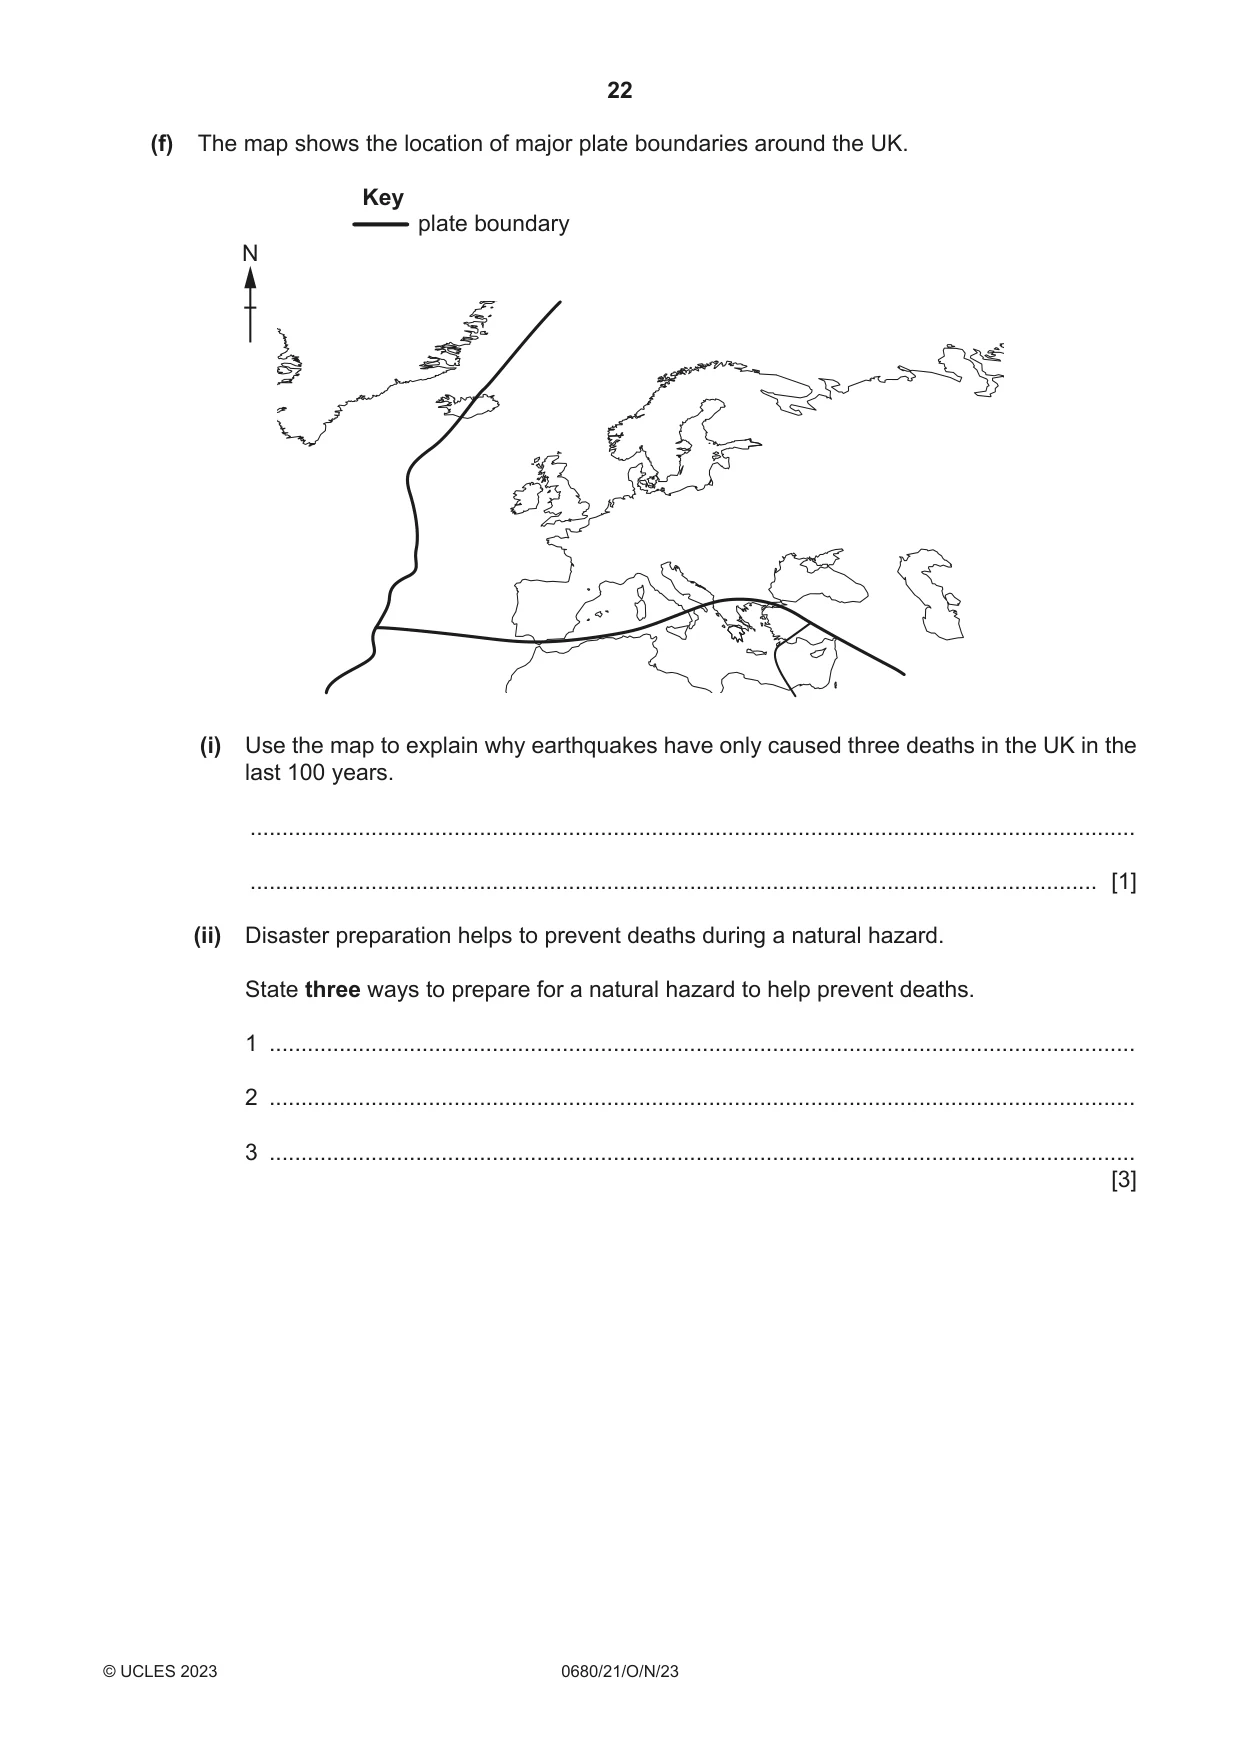
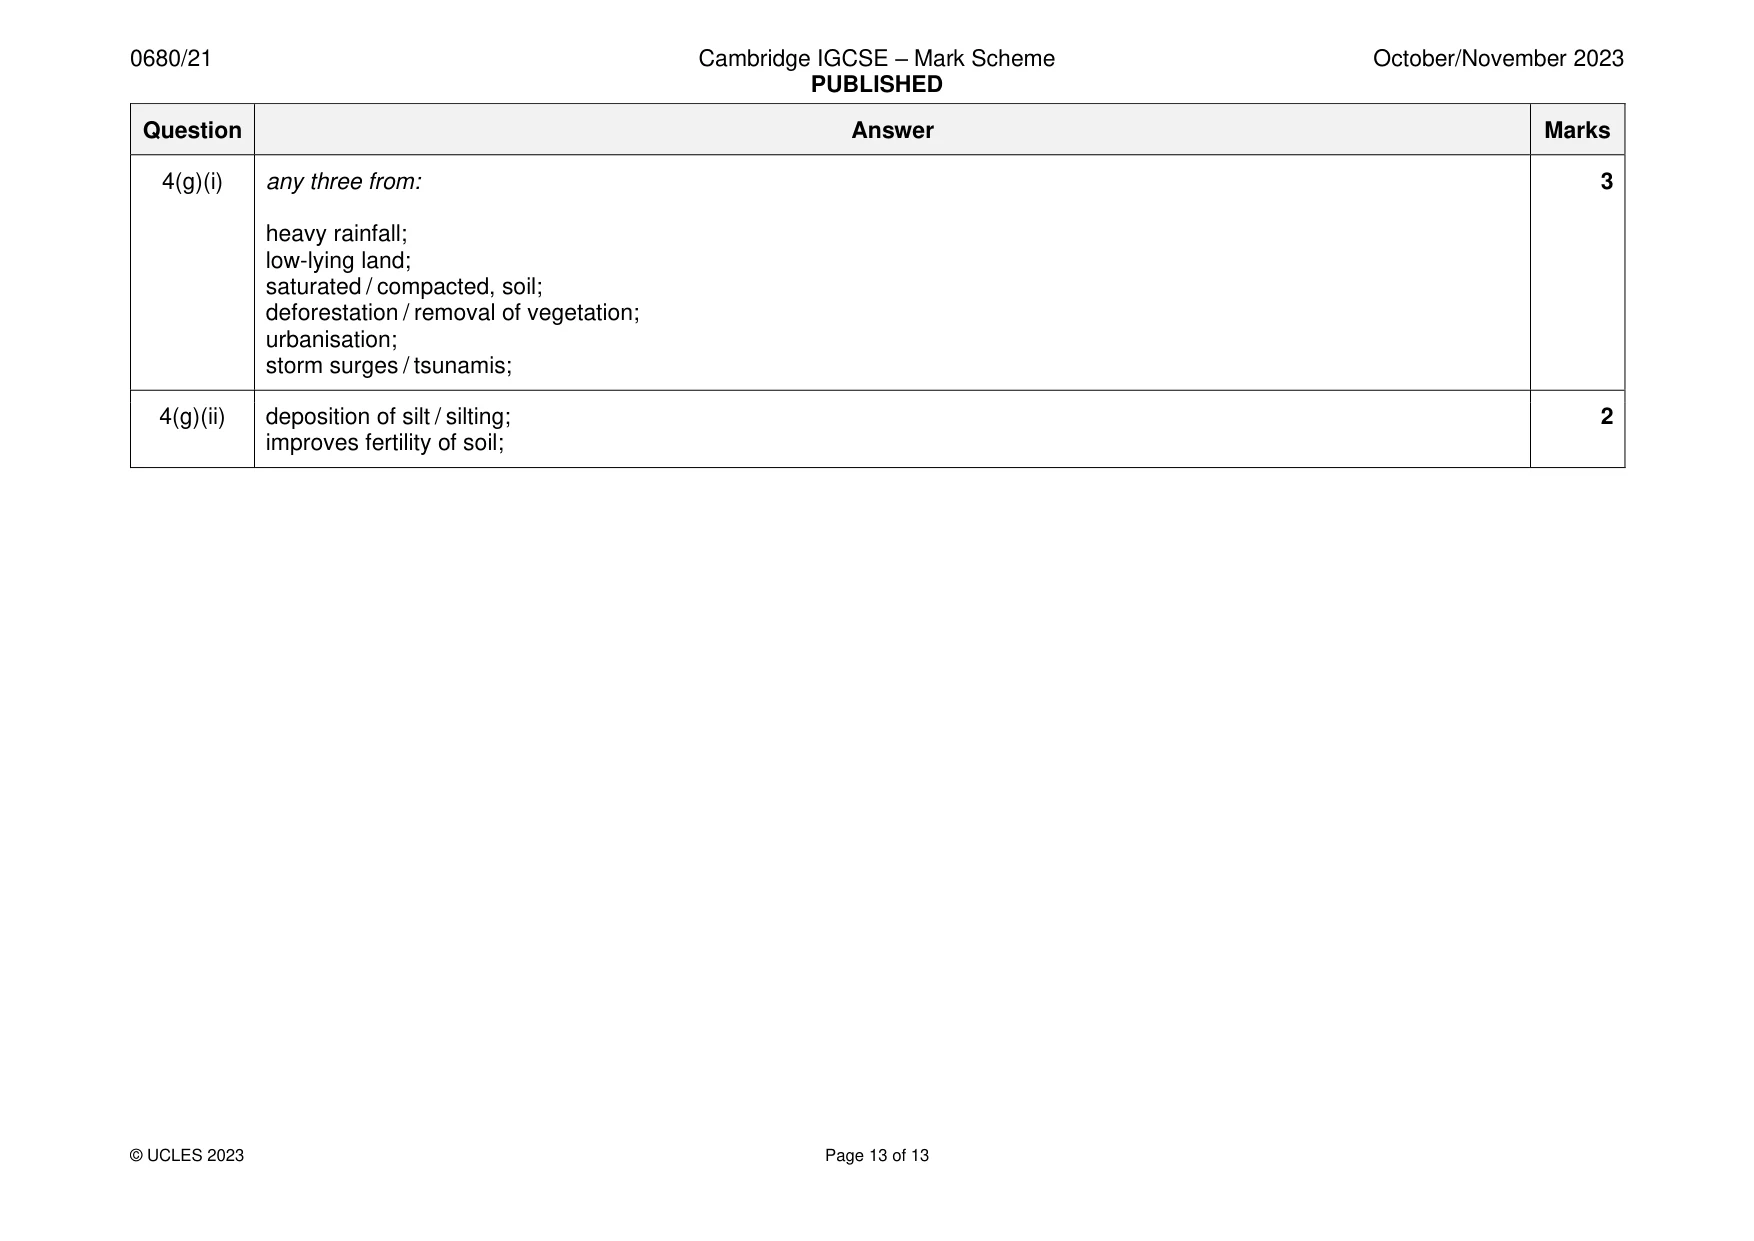
Mark scheme: 4(a)(i) 2004; 1 4(a)(ii) any two from: 2 increasing demand / demand exceeds supply; increasing population; availability of, own natural reserves / named resource; accessibility of, natural reserves / named reserve; cost too high to extract own natural reserves / cheaper to buy it (than produce); 4(a)(iii) any one from: 1 reliant on other countries; cannot set own energy policies; cost of imports; possible power shortages / disruption to supply; 4(b)(i) any three trends from: 3 increase to early 1900s / peak in 1920s; fluctuates / decreases, 1910s to 1920s; decreases 1920s to 1940s; constant 1940s to 1960s; sharp decrease from 1960s; (almost) zero from 1993-5s; 4(b)(ii) any two from: 2 increase due: industrialisation; urbanisation; population increase; decrease due to: mechanisation; not mining own reserves / reserves inaccessible / reserves are exhausted / no more reserves; switch to, renewable energy / named other form of energy resource; became net importer of energy; 4(c) transport →(deposition) → sedimentation → compaction → cementation; 3 1 correct = 1 mark 2–3 correct = 2 marks 4 correct = 3 marks 4(d)(i) any one from: 1 test whether questions are, suitable / clear; test whether sampling methods are suitable; identify any problems with the questions; check that answers can be easily analysed; 4(d)(ii) any one from: 1 shortage of, gas / oil; high demand / current oil and gas supplies don’t meet demand; 4(e)(i) 7; 1 4(e)(ii) 2; 1 4(e)(iii) any one from: 1 too many earthquakes; probability / magnitude, of earthquakes cannot be predicted; public opposition / public feel fracking is not safe; 4(f)(i) not located, on / near, a plate boundary; 1 4(f)(ii) any three from: 3 evacuation plans; drills; emergency supplies; emergency rescue teams; early warning systems / monitoring; education of public; emergency shelters; medical teams; earthquake resistant buildings; 4(g)(i) any three from: 3 heavy rainfall; low-lying land; saturated / compacted, soil; deforestation / removal of vegetation; urbanisation; storm surges / tsunamis; 4(g)(ii) deposition of silt / silting; 2 improves fertility of soil;
What was in this paper
The subtopics covered by these 4 questions, and how many questions each got. Open one in a new tab to see every Cambridge question on it.
What you needed in this session
Cambridge’s own grade thresholds for 2023 Oct/Nov, Paper 2 · Variant 1. A higher threshold means an easier paper — the bar moves with how the cohort did.