Cambridge IGCSE Environmental Management 0680 — 2017 Feb/March Paper 2 · Variant 2
0680/22/F/M/17 · 2 questions · 80 marks · ≈90 min
The question paper and its mark scheme, free to read here and free to download. This is Cambridge’s own paper, exactly as it was sat.
Question paper16 pages


Mark scheme9 pages
Answers below. Sit the paper first if you are practising.
Questions as text
Q1 · The divided bar graphs show the sources of three greenhouse gases
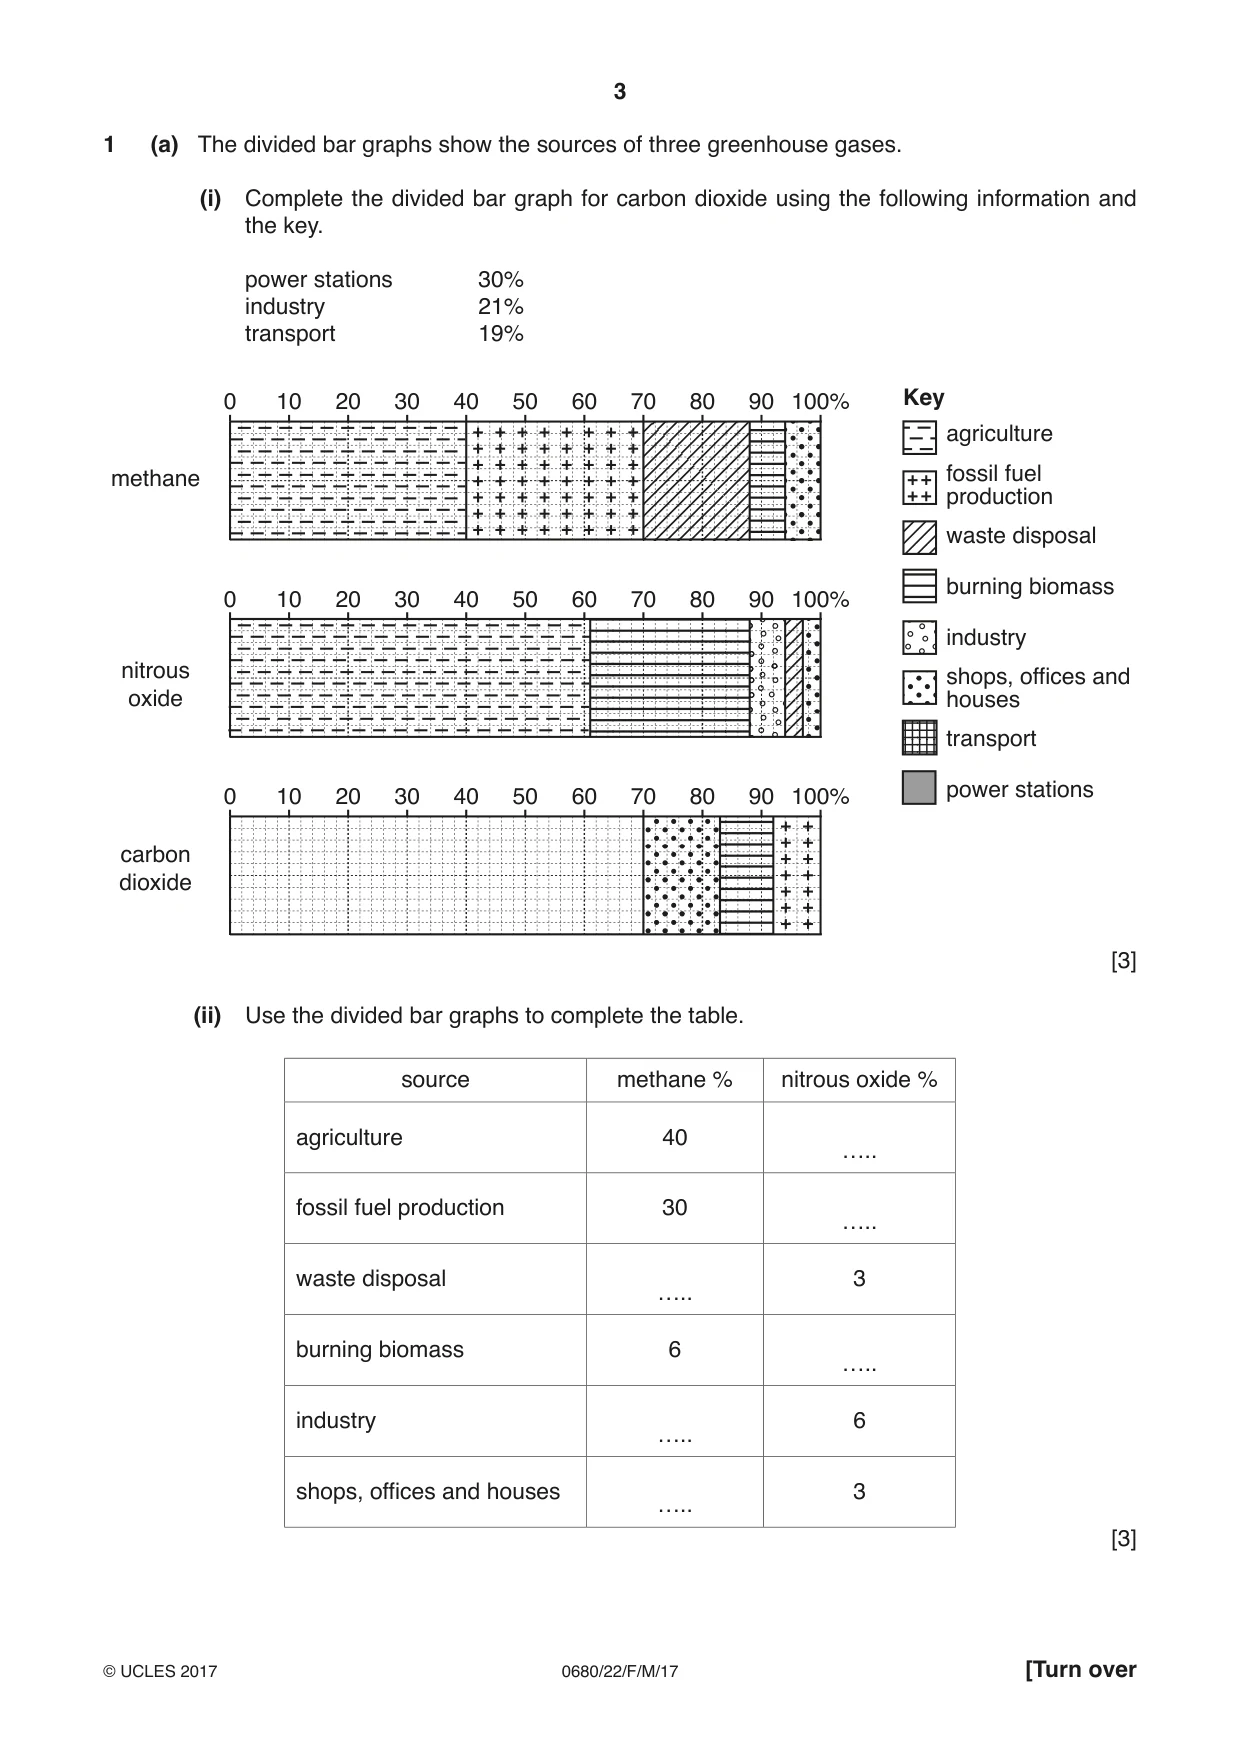
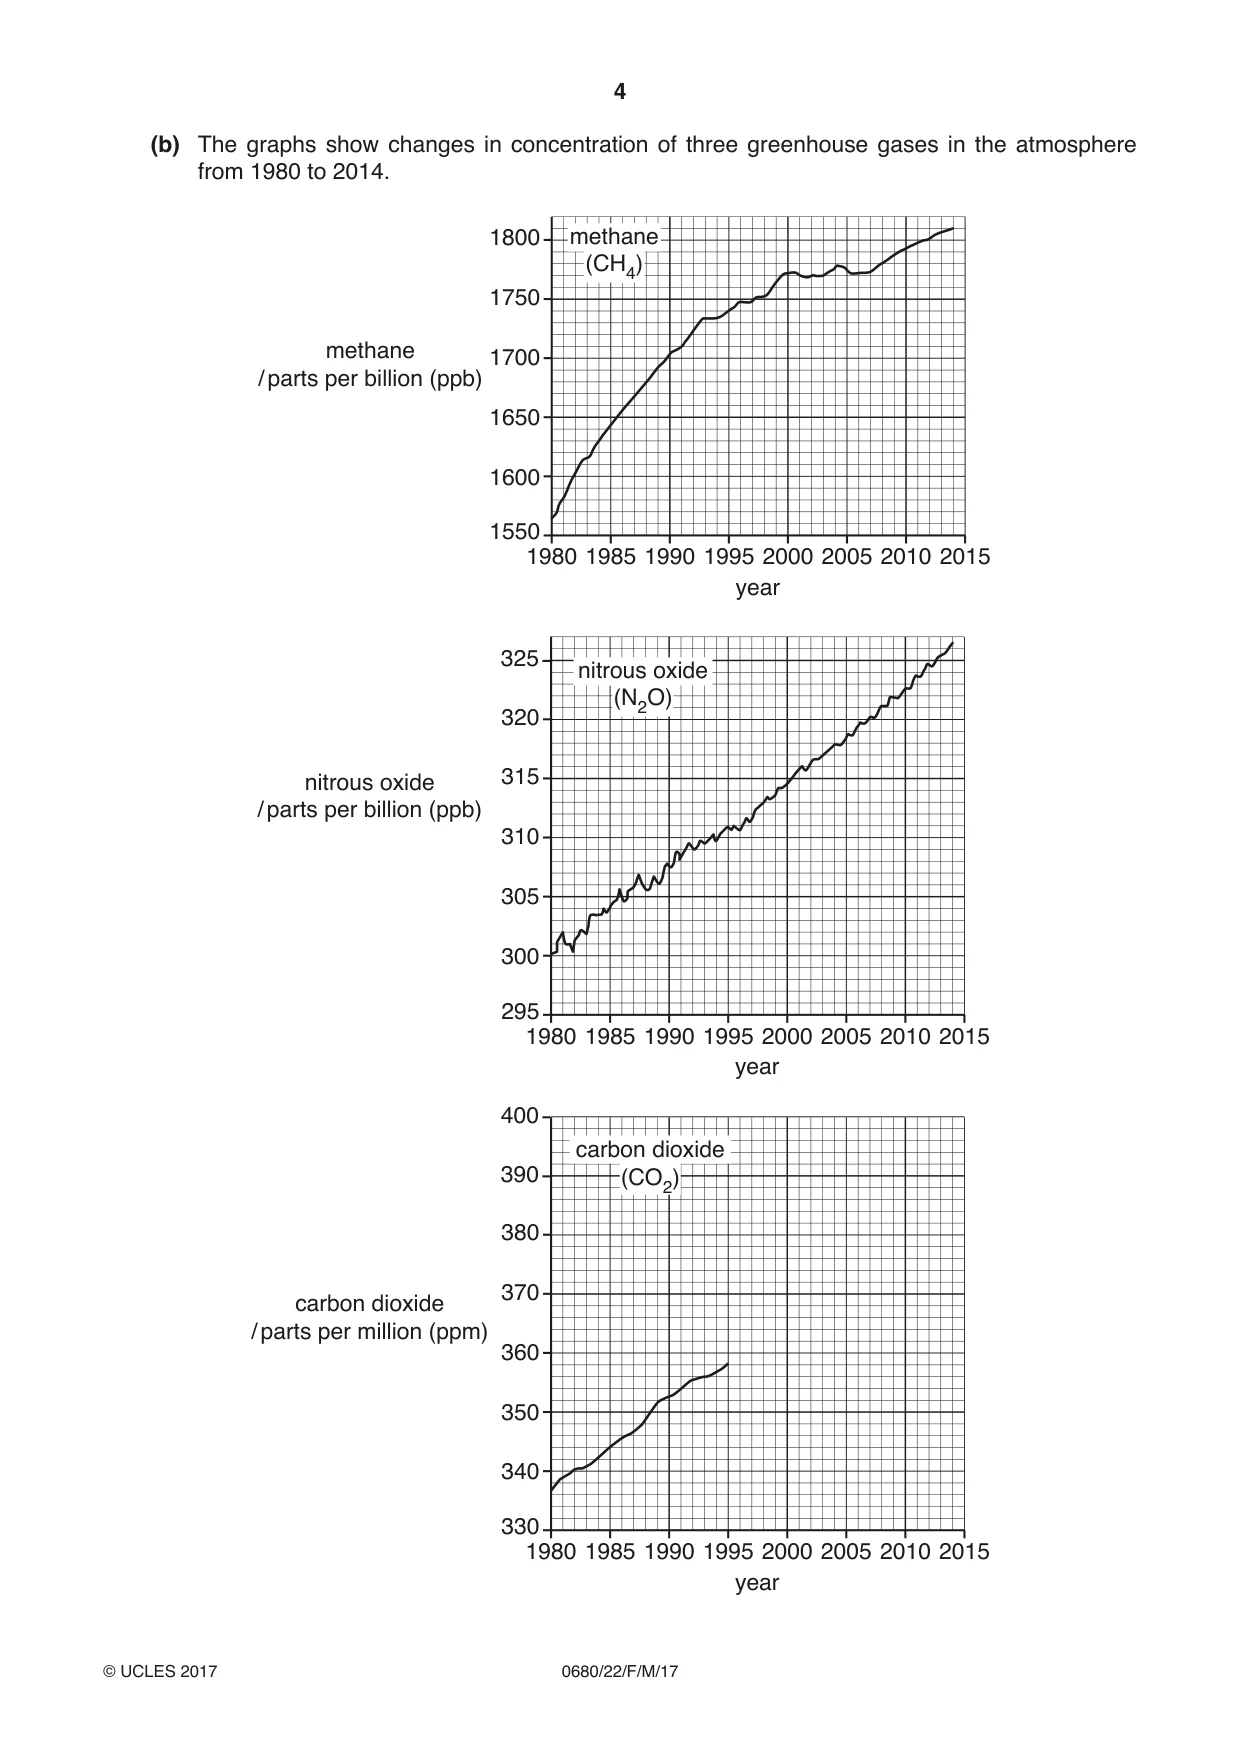
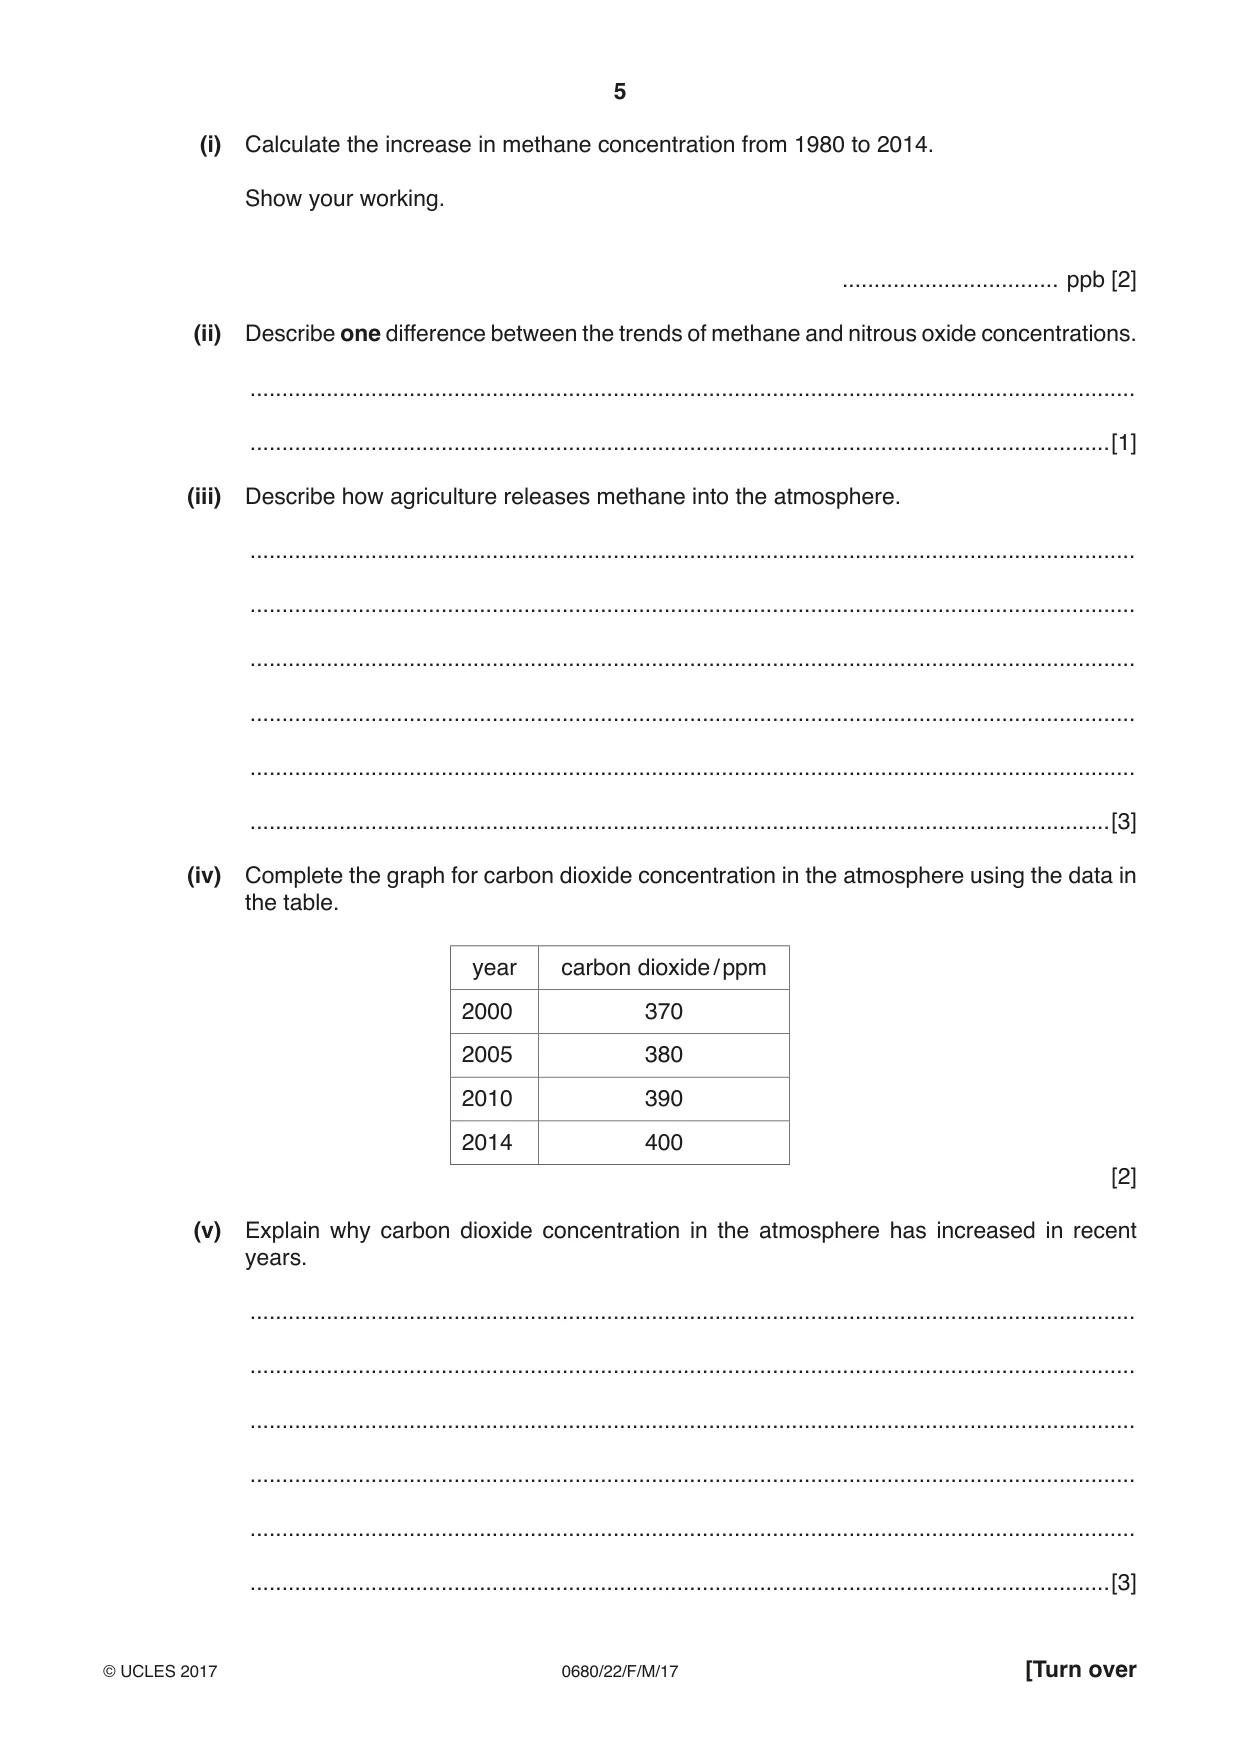
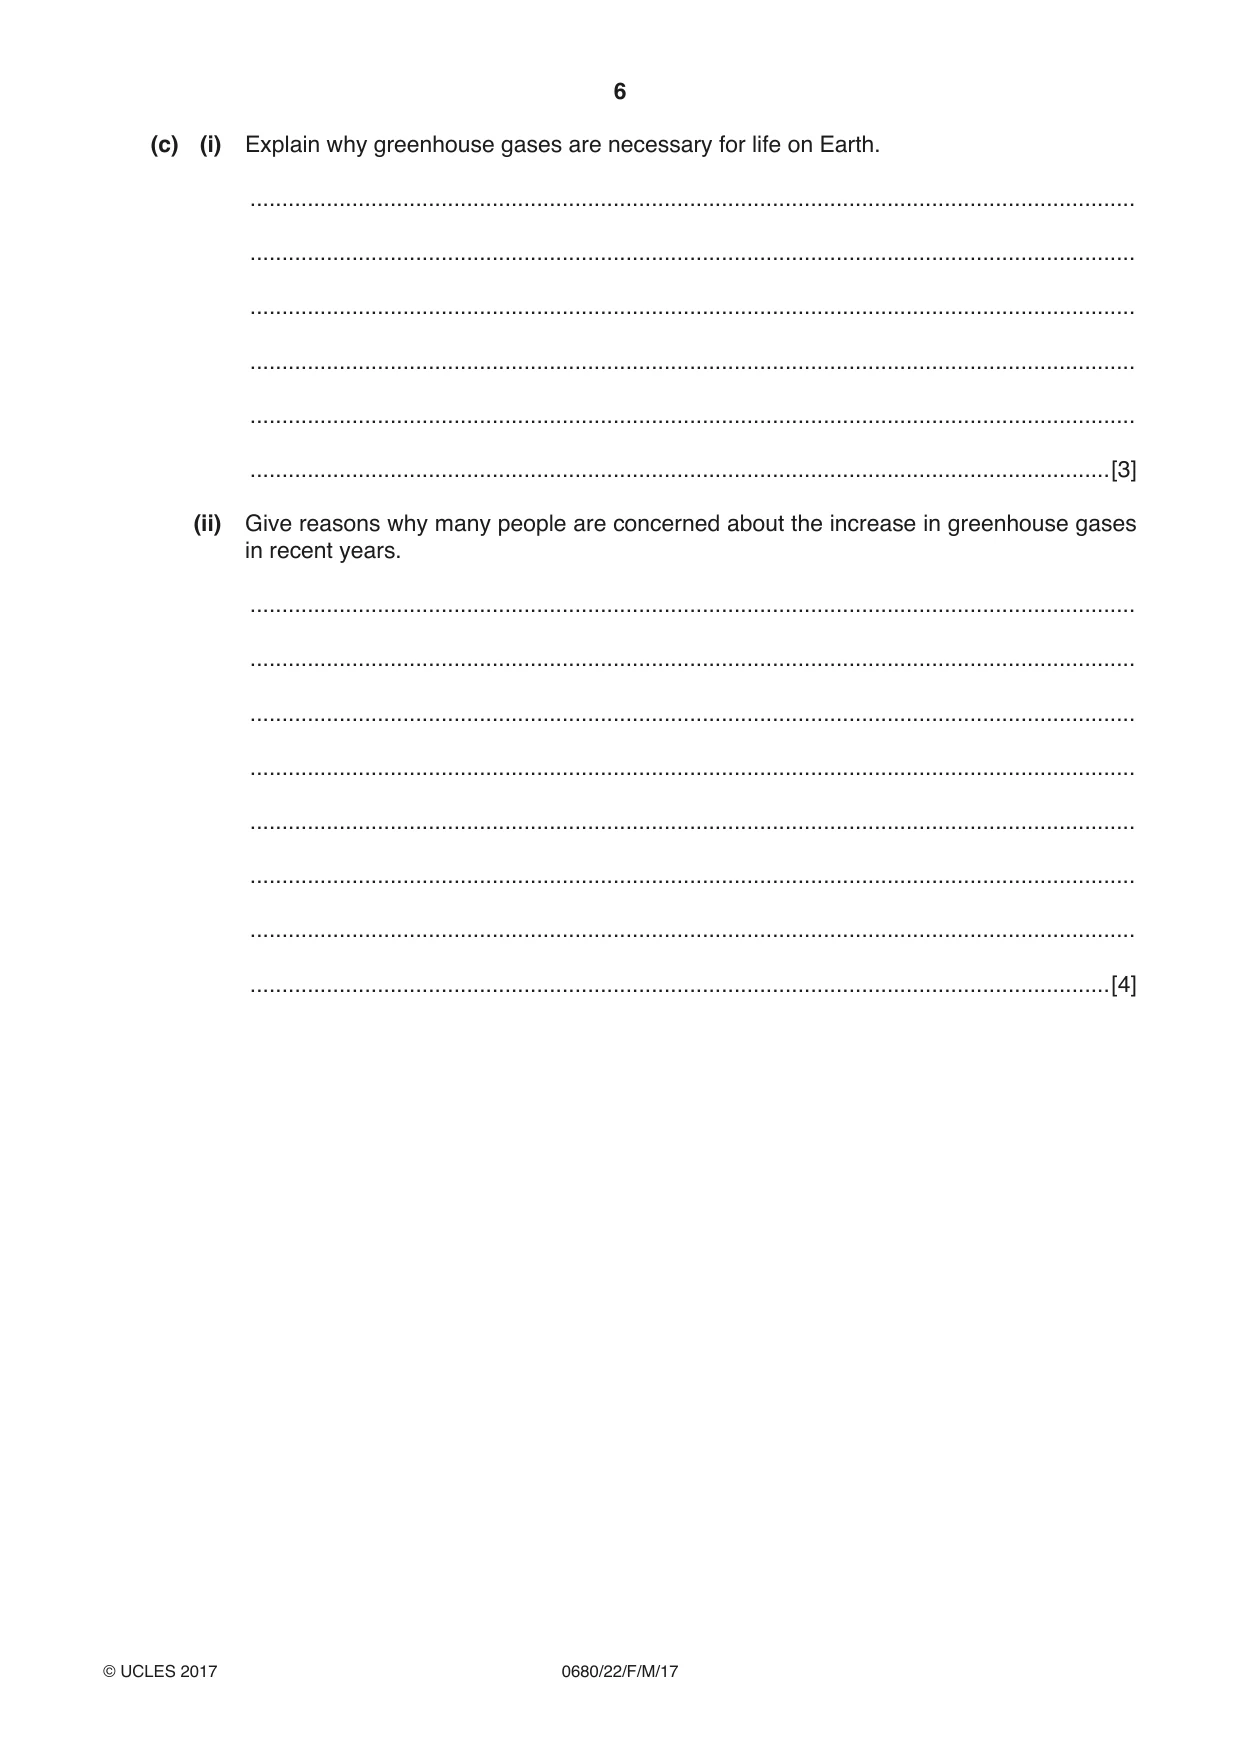
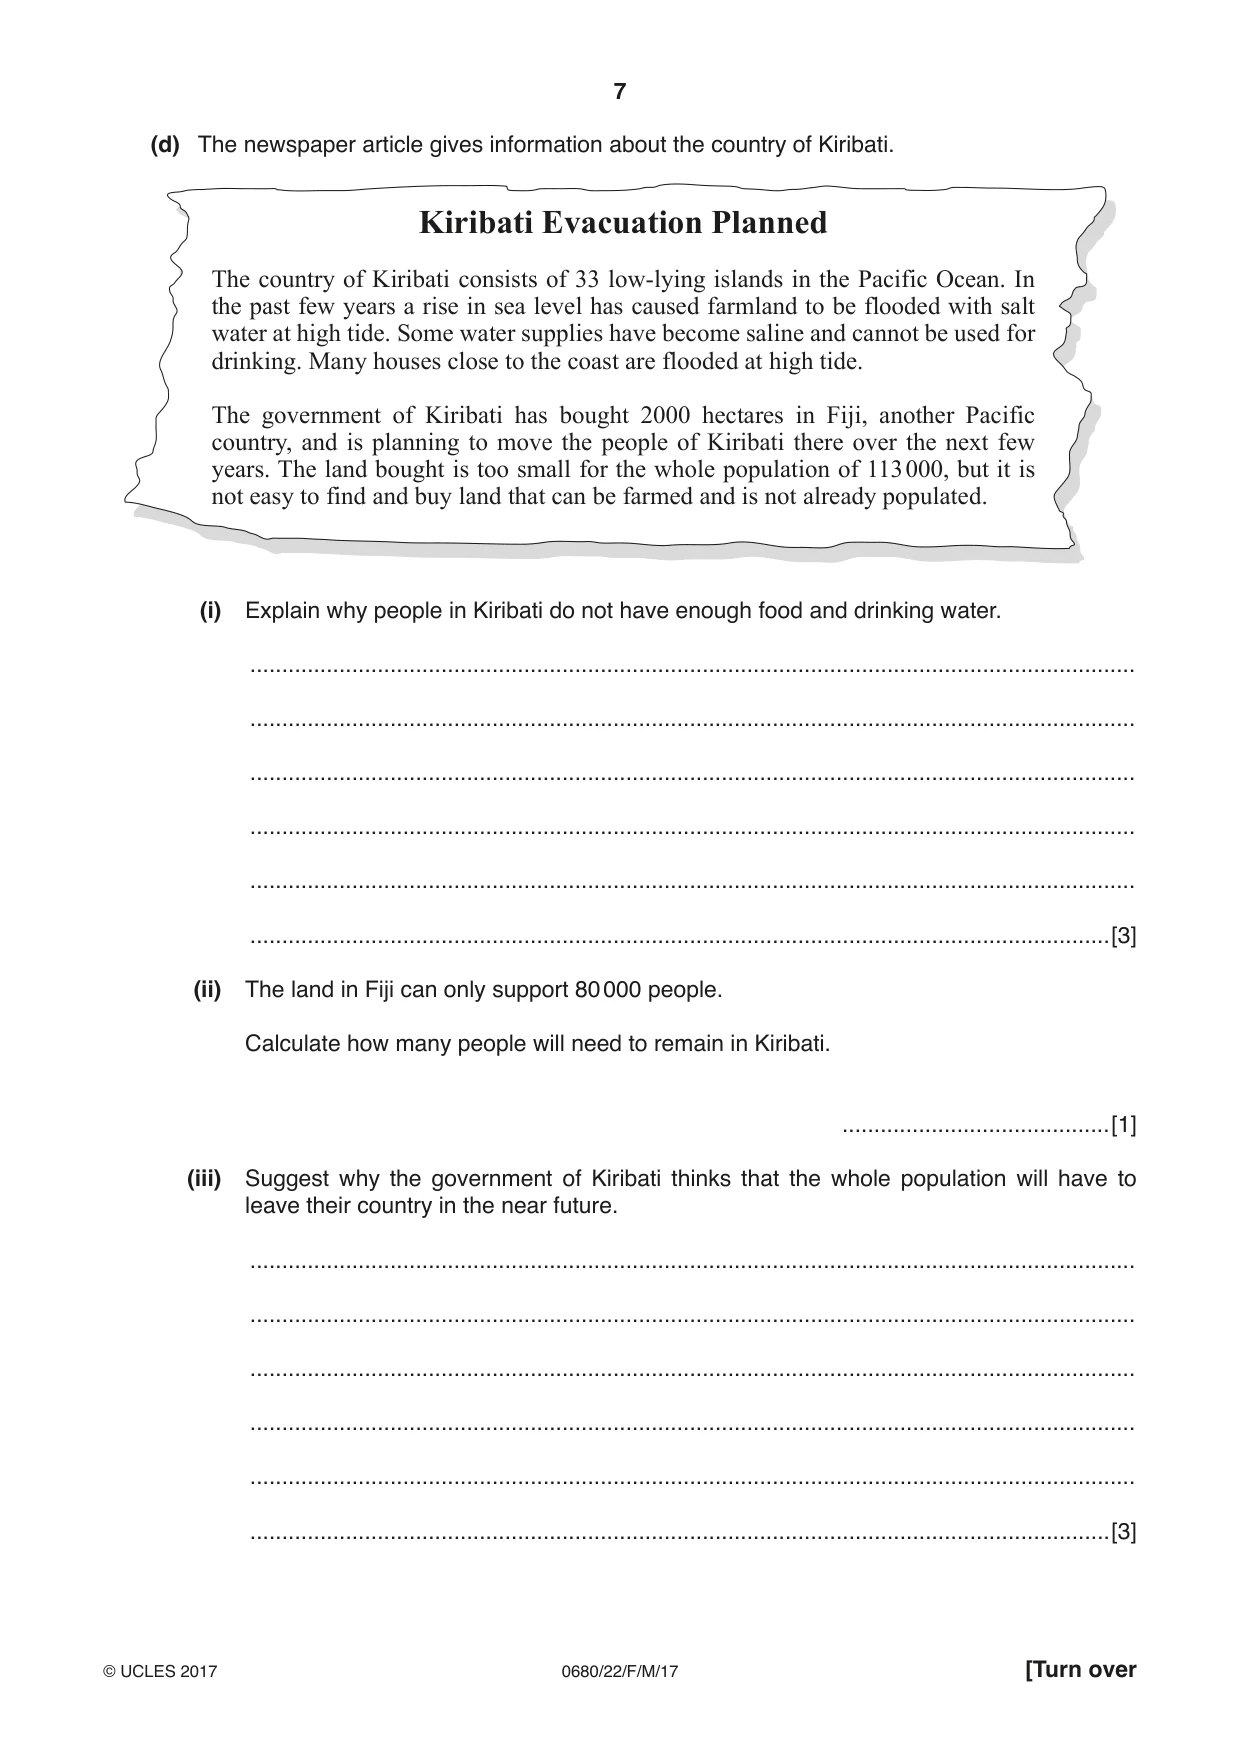
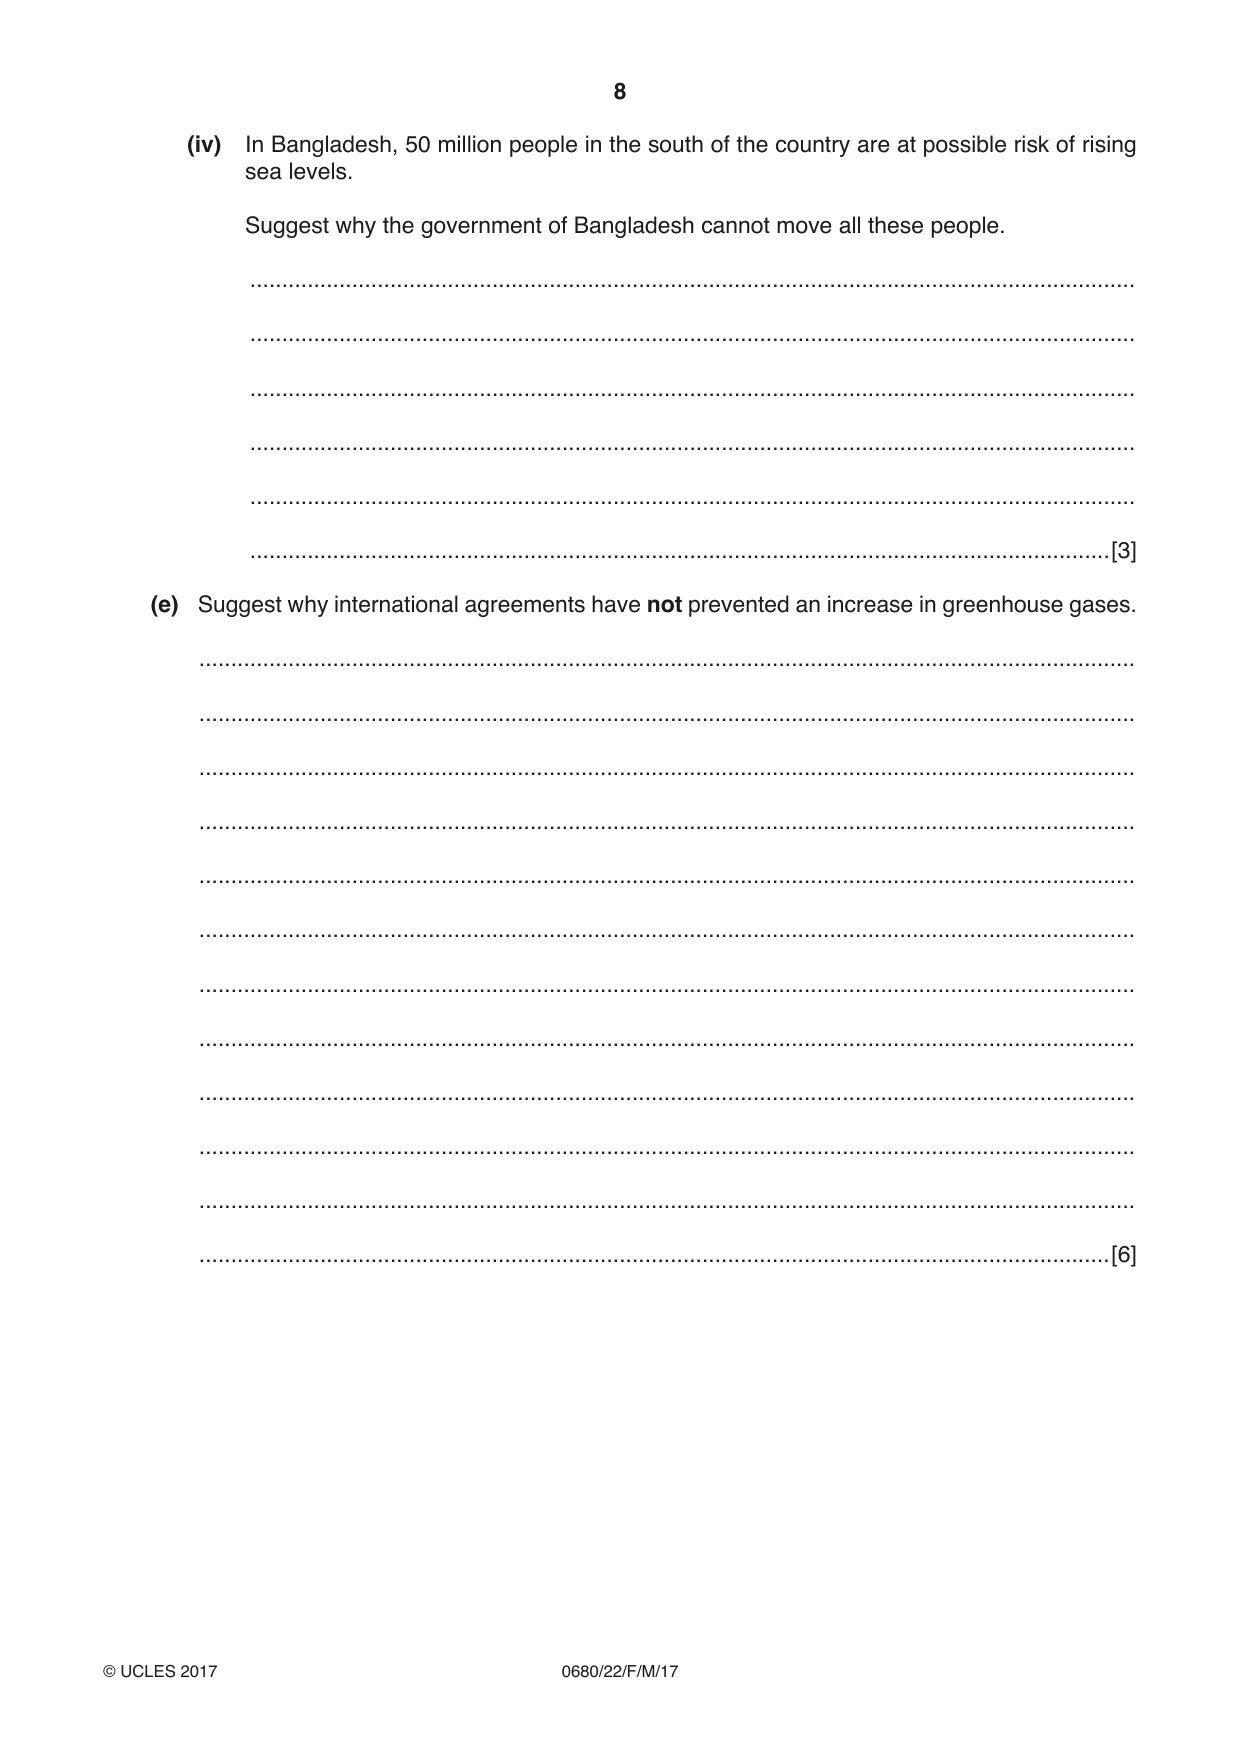
1 (a) The divided bar graphs show the sources of three greenhouse gases. (i) Complete the divided bar graph for carbon dioxide using the following information and the key. power stations 30% industry 21% transport 19% 0 10 20 30 40 50 60 70 80 90 100% Key agriculture methane fossil fuel production waste disposal burning biomass 0 10 20 30 40 50 60 70 80 90 100% industry nitrous shops, offices and oxide houses transport power stations 0 10 20 30 40 50 60 70 80 90 100% carbon dioxide [3] (ii) Use the divided bar graphs to complete the table. source methane % nitrous oxide % agriculture 40 ….. fossil fuel production 30 ….. waste disposal 3 ….. burning biomass 6 ….. industry 6 ….. shops, offices and houses 3 ….. [3] (b) The graphs show changes in concentration of three greenhouse gases in the atmosphere from 1980 to 2014. 1800 methane (CH4) 1750 methane 1700 / parts per billion (ppb) 1650 1600 1550 1980 1985 1990 1995 2000 2005 2010 2015 year 325 nitrous oxide (N2O) 320 nitrous oxide 315 / parts per billion (ppb) 310 305 300 295 1980 1985 1990 1995 2000 2005 2010 2015 year 400 carbon dioxide 390 (CO2) 380 370 carbon dioxide / parts per million (ppm) 360 350 340 330 1980 1985 1990 1995 2000 2005 2010 2015 year (i) Calculate the increase in methane concentration from 1980 to 2014. Show your working. .................................. ppb [2] (ii) Describe one difference between the trends of methane and nitrous oxide concentrations. ........................................................................................................................................... .......................................................................................................................................[1] (iii) Describe how agriculture releases methane into the atmosphere. ........................................................................................................................................... ........................................................................................................................................... ........................................................................................................................................... ........................................................................................................................................... ........................................................................................................................................... .......................................................................................................................................[3] (iv) Complete the graph for carbon dioxide concentration in the atmosphere using the data in the table. year carbon dioxide / ppm 2000 370 2005 380 2010 390 2014 400 [2] (v) Explain why carbon dioxide concentration in the atmosphere has increased in recent years. ........................................................................................................................................... ........................................................................................................................................... ........................................................................................................................................... ........................................................................................................................................... ........................................................................................................................................... .......................................................................................................................................[3] (c) (i) Explain why greenhouse gases are necessary for life on Earth. ........................................................................................................................................... ........................................................................................................................................... ........................................................................................................................................... ........................................................................................................................................... ........................................................................................................................................... .......................................................................................................................................[3] (ii) Give reasons why many people are concerned about the increase in greenhouse gases in recent years. ........................................................................................................................................... ........................................................................................................................................... ........................................................................................................................................... ........................................................................................................................................... ........................................................................................................................................... ........................................................................................................................................... ........................................................................................................................................... .......................................................................................................................................[4] (d) The newspaper article gives information about the country of Kiribati. Kiribati Evacuation Planned The country of Kiribati consists of 33 low-lying islands in the Pacific Ocean. In the past few years a rise in sea level has caused farmland to be flooded with salt water at high tide. Some water supplies have become saline and cannot be used for drinking. Many houses close to the coast are flooded at high tide. The government of Kiribati has bought 2000 hectares in Fiji, another Pacific country, and is planning to move the people of Kiribati there over the next few years. The land bought is too small for the whole population of 113 000, but it is not easy to find and buy land that can be farmed and is not already populated. (i) Explain why people in Kiribati do not have enough food and drinking water. ........................................................................................................................................... ........................................................................................................................................... ........................................................................................................................................... ........................................................................................................................................... ........................................................................................................................................... .......................................................................................................................................[3] (ii) The land in Fiji can only support 80 000 people. Calculate how many people will need to remain in Kiribati. ..........................................[1] (iii) Suggest why the government of Kiribati thinks that the whole population will have to leave their country in the near future. ........................................................................................................................................... ........................................................................................................................................... ........................................................................................................................................... ........................................................................................................................................... ........................................................................................................................................... .......................................................................................................................................[3] (iv) In Bangladesh, 50 million people in the south of the country are at possible risk of rising sea levels. Suggest why the government of Bangladesh cannot move all these people. ........................................................................................................................................... ........................................................................................................................................... ........................................................................................................................................... ........................................................................................................................................... ........................................................................................................................................... .......................................................................................................................................[3] (e) Suggest why international agreements have not prevented an increase in greenhouse gases. ................................................................................................................................................... ................................................................................................................................................... ................................................................................................................................................... ................................................................................................................................................... ................................................................................................................................................... ................................................................................................................................................... ................................................................................................................................................... ................................................................................................................................................... ................................................................................................................................................... ................................................................................................................................................... ................................................................................................................................................... ...............................................................................................................................................[6]
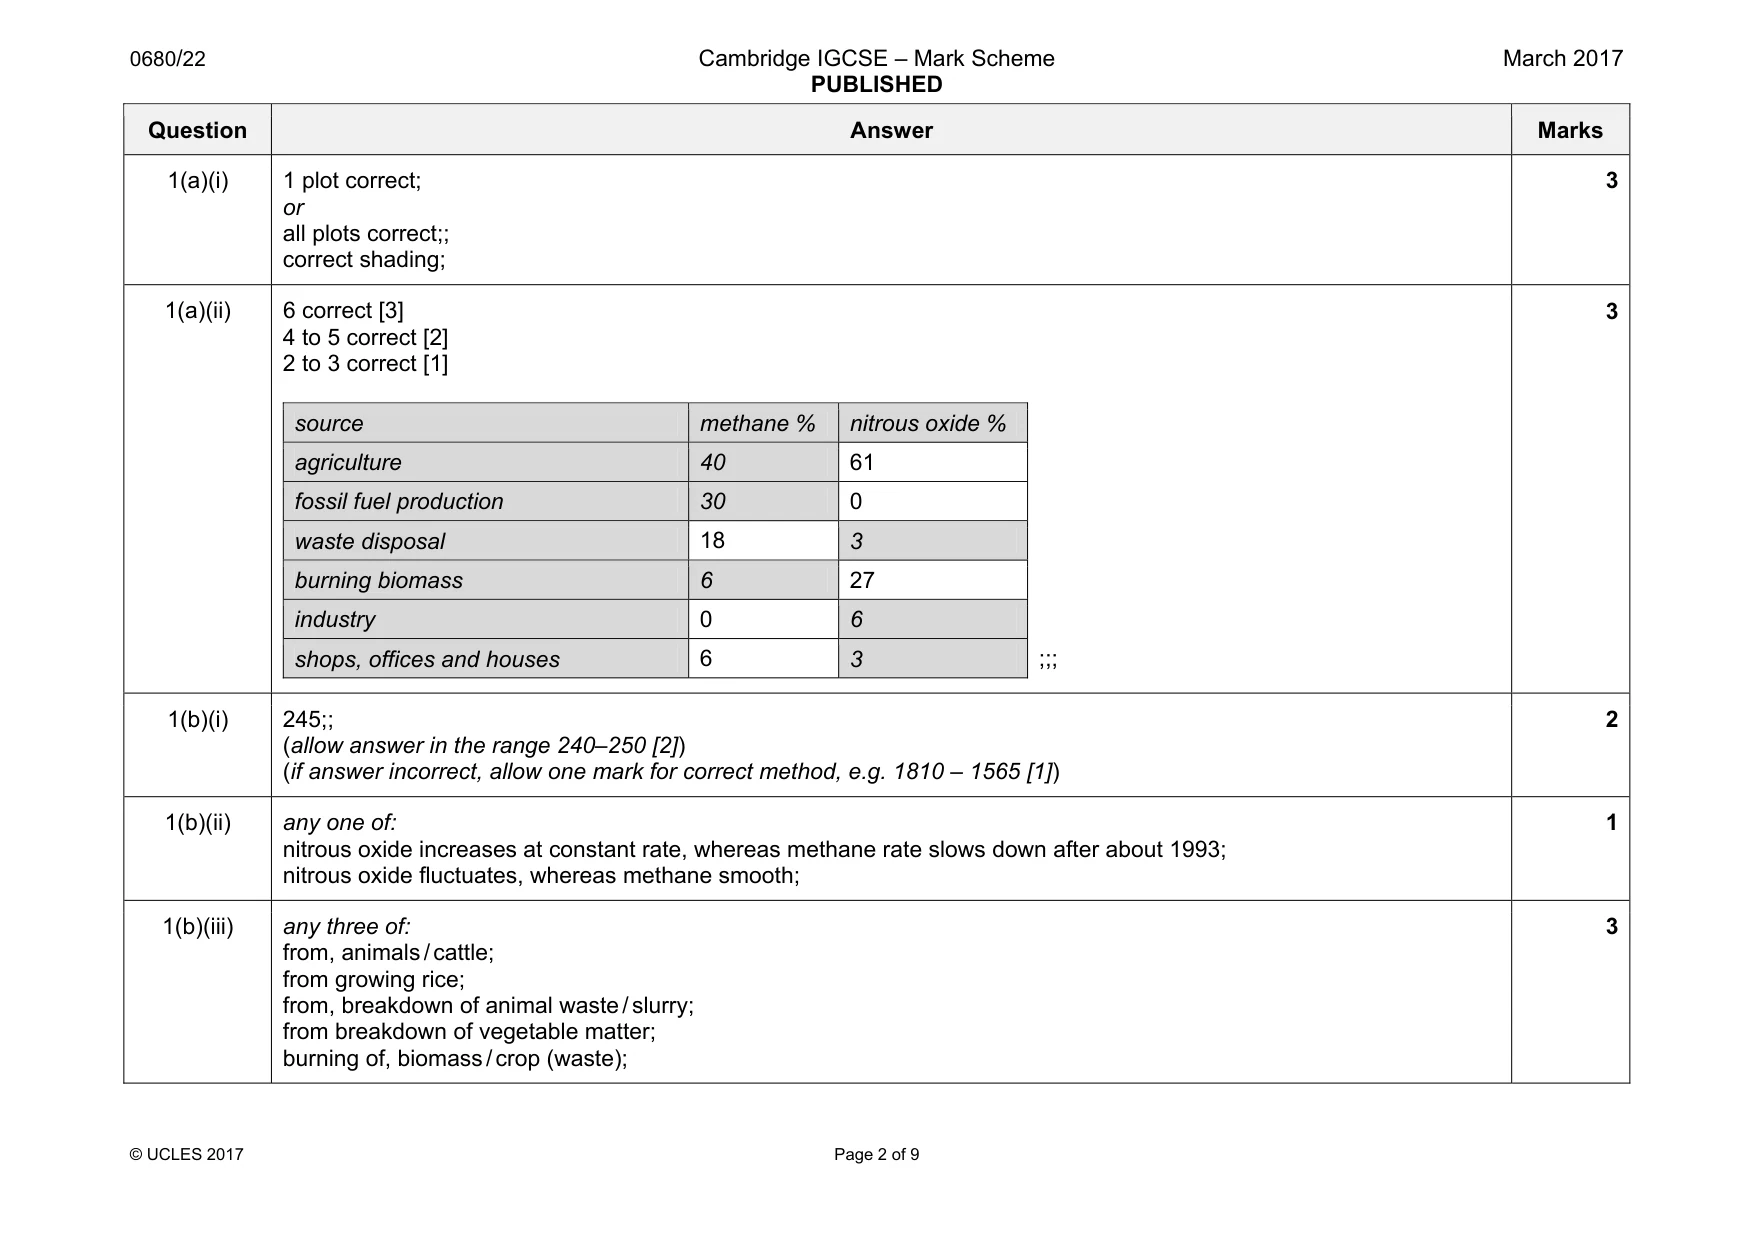
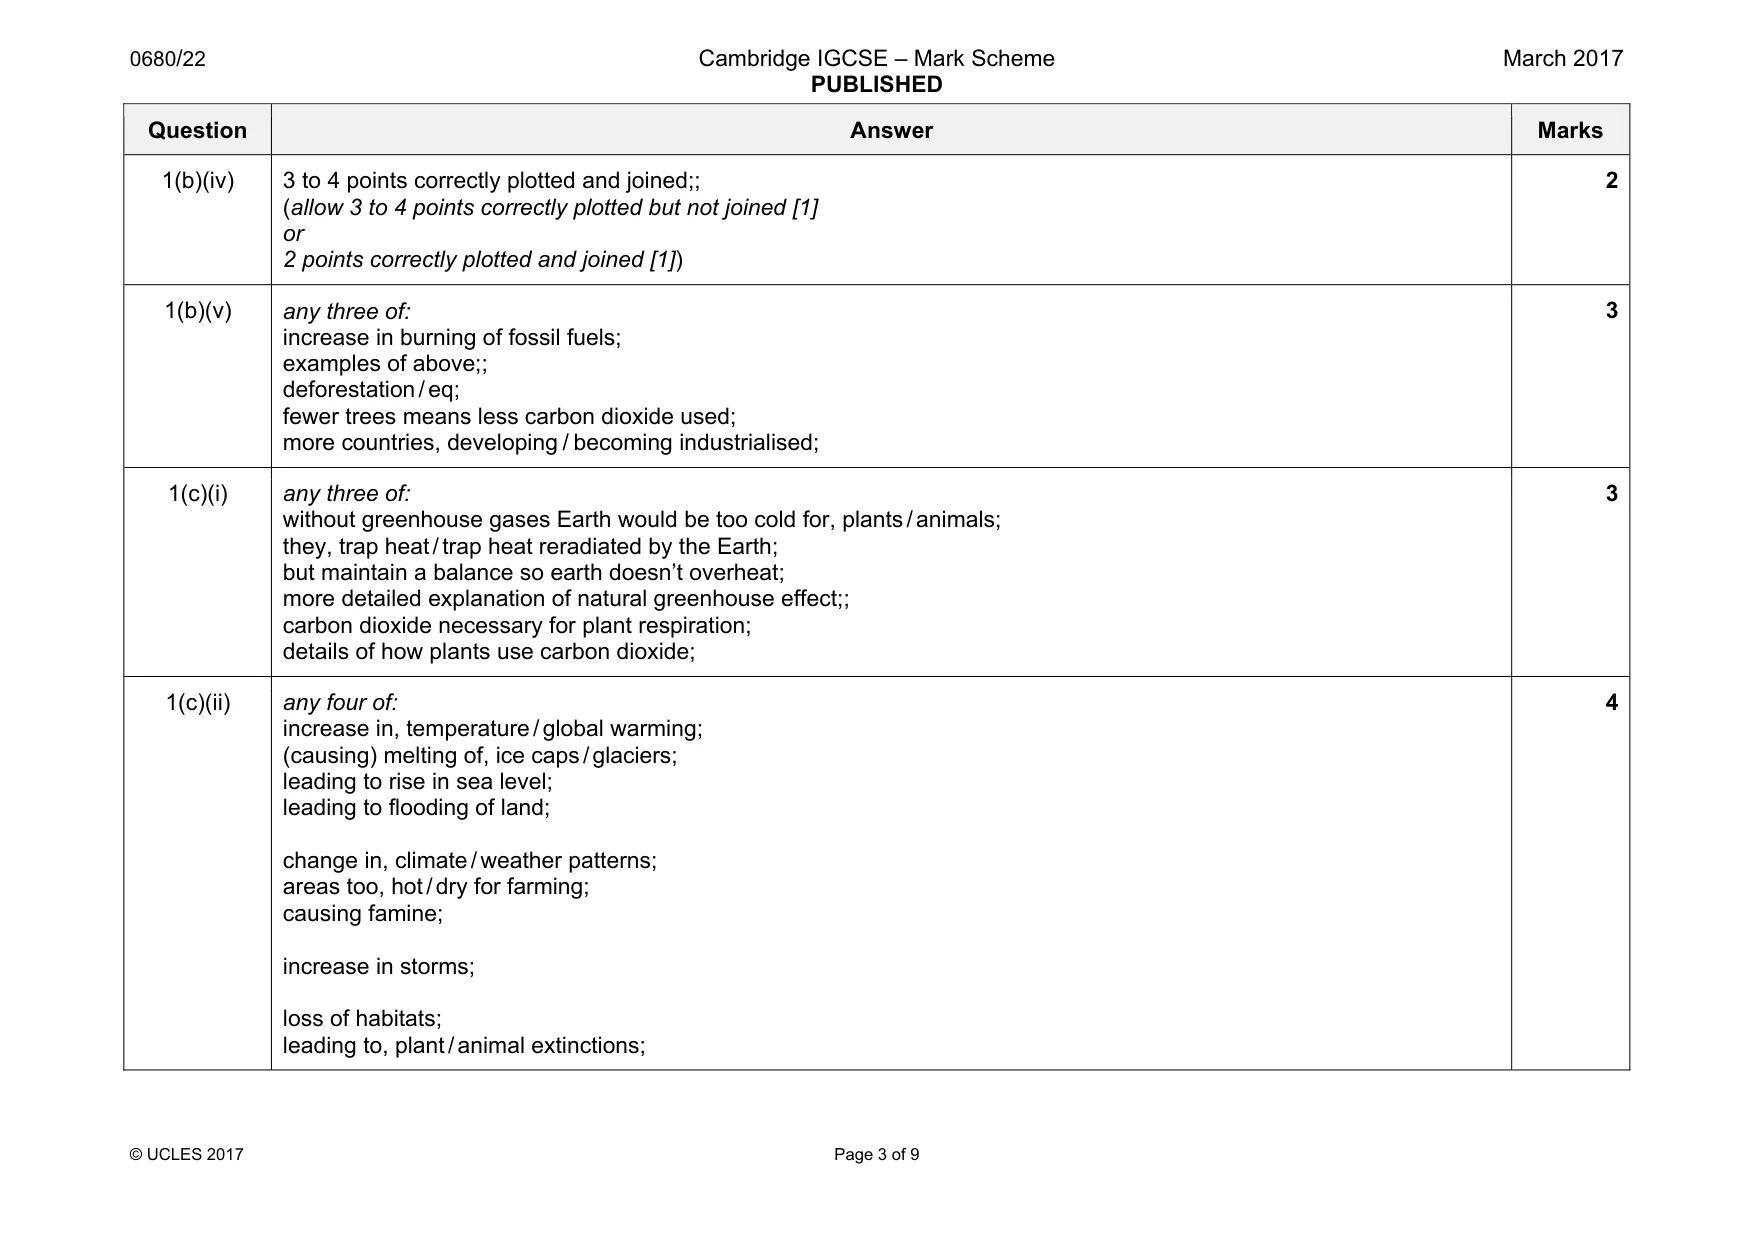
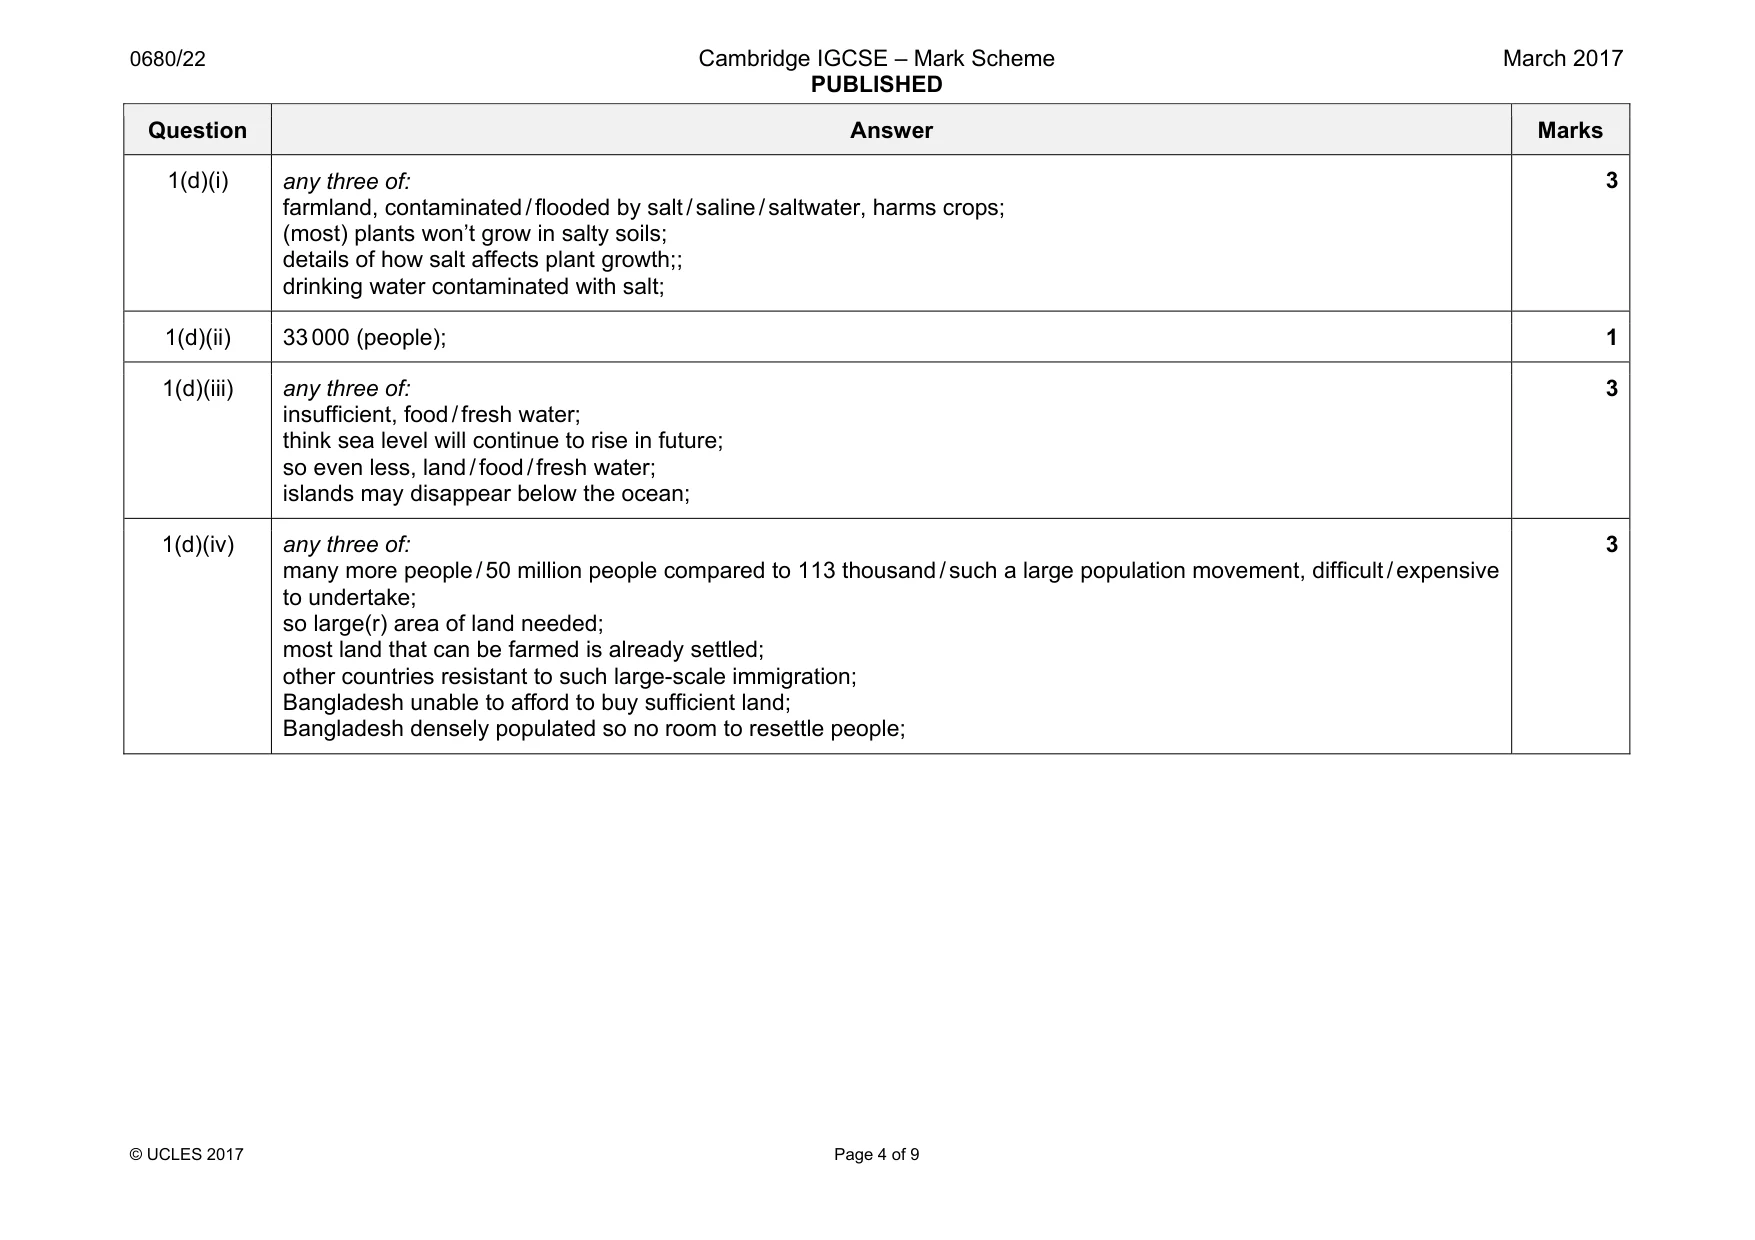
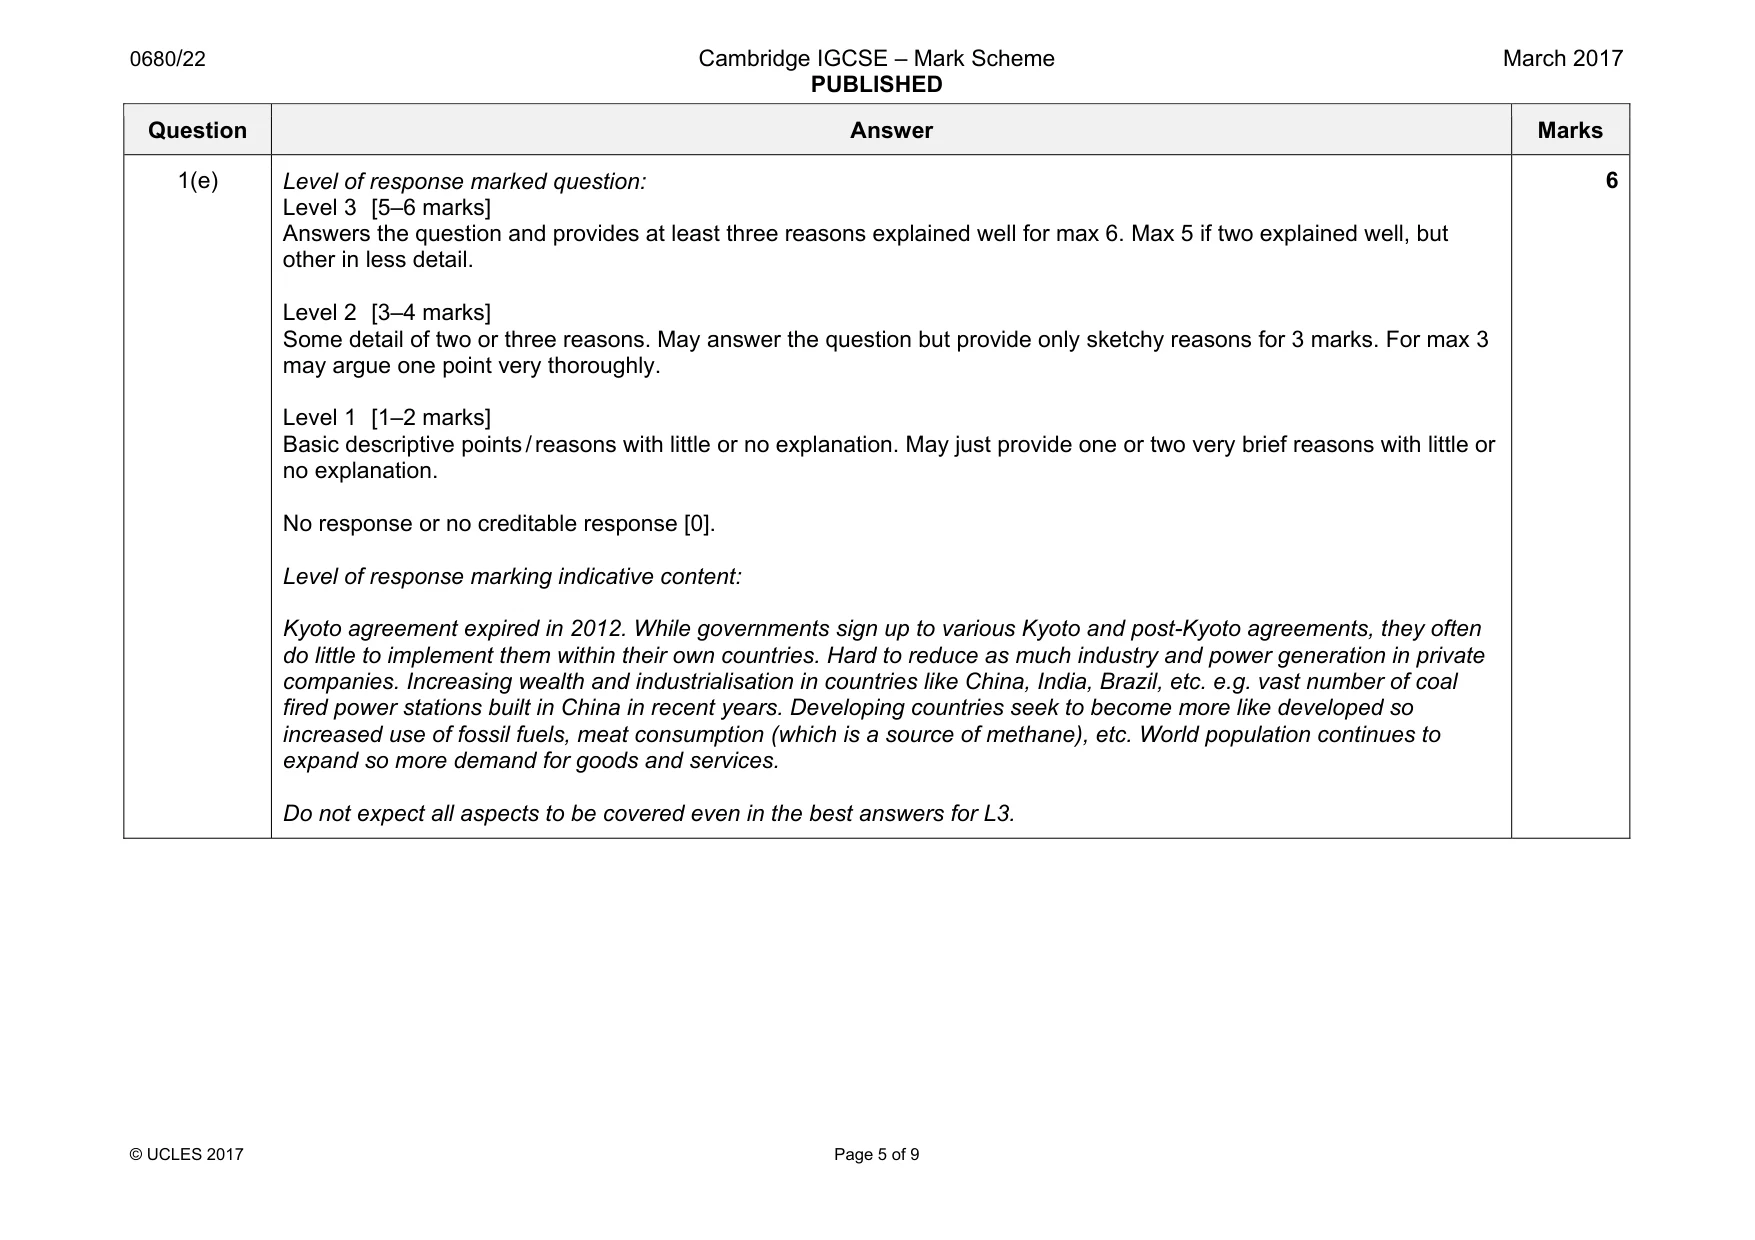
Mark scheme: 1(a)(i) 1 plot correct; or all plots correct;; correct shading; 3 1(a)(ii) 6 correct [3] 4 to 5 correct [2] 2 to 3 correct [1] source methane % nitrous oxide % agriculture 40 61 fossil fuel production 30 0 waste disposal 18 3 burning biomass 6 27 industry 0 6 shops, offices and houses 6 3 ;;; 3 1(b)(i) 245;; (allow answer in the range 240–250 [2]) (if answer incorrect, allow one mark for correct method, e.g. 1810 – 1565 [1]) 2 1(b)(ii) any one of: nitrous oxide increases at constant rate, whereas methane rate slows down after about 1993; nitrous oxide fluctuates, whereas methane smooth; 1 1(b)(iii) any three of: from, animals / cattle; from growing rice; from, breakdown of animal waste / slurry; from breakdown of vegetable matter; burning of, biomass / crop (waste); 3 Question Answer Marks 1(b)(iv) 3 to 4 points correctly plotted and joined;; (allow 3 to 4 points correctly plotted but not joined [1] or 2 points correctly plotted and joined [1]) 2 1(b)(v) any three of: increase in burning of fossil fuels; examples of above;; deforestation / eq; fewer trees means less carbon dioxide used; more countries, developing / becoming industrialised; 3 1(c)(i) any three of: without greenhouse gases Earth would be too cold for, plants / animals; they, trap heat / trap heat reradiated by the Earth; but maintain a balance so earth doesn’t overheat; more detailed explanation of natural greenhouse effect;; carbon dioxide necessary for plant respiration; details of how plants use carbon dioxide; 3 1(c)(ii) any four of: increase in, temperature / global warming; (causing) melting of, ice caps / glaciers; leading to rise in sea level; leading to flooding of land; change in, climate / weather patterns; areas too, hot / dry for farming; causing famine; increase in storms; loss of habitats; leading to, plant / animal extinctions; 4 Question Answer Marks 1(d)(i) any three of: farmland, contaminated / flooded by salt / saline / saltwater, harms crops; (most) plants won’t grow in salty soils; details of how salt affects plant growth;; drinking water contaminated with salt; 3 1(d)(ii) 33 000 (people); 1 1(d)(iii) any three of: insufficient, food / fresh water; think sea level will continue to rise in future; so even less, land / food / fresh water; islands may disappear below the ocean; 3 1(d)(iv) any three of: many more people / 50 million people compared to 113 thousand / such a large population movement, difficult / expensive to undertake; so large(r) area of land needed; most land that can be farmed is already settled; other countries resistant to such large-scale immigration; Bangladesh unable to afford to buy sufficient land; Bangladesh densely populated so no room to resettle people; 3 Question Answer Marks 1(e) Level of response marked question: Level 3 [5–6 marks] Answers the question and provides at least three reasons explained well for max 6. Max 5 if two explained well, but other in less detail. Level 2 [3–4 marks] Some detail of two or three reasons. May answer the question but provide only sketchy reasons for 3 marks. For max 3 may argue one point very thoroughly. Level 1 [1–2 marks] Basic descriptive points / reasons with little or no explanation. May just provide one or two very brief reasons with little or no explanation. No response or no creditable response [0]. Level of response marking indicative content: Kyoto agreement expired in 2012. While governments sign up to various Kyoto and post-Kyoto agreements, they often do little to implement them within their own countries. Hard to reduce as much industry and power generation in private companies. Increasing wealth and industrialisation in countries like China, India, Brazil, etc. e.g. vast number of coal fired power stations built in China in recent years. Developing countries seek to become more like developed so increased use of fossil fuels, meat consumption (which is a source of methane), etc. World population continues to expand so more demand for goods and services. Do not expect all aspects to be covered even in the best answers for L3. 6
Q2 · The table shows information about the world population at the end of 2013
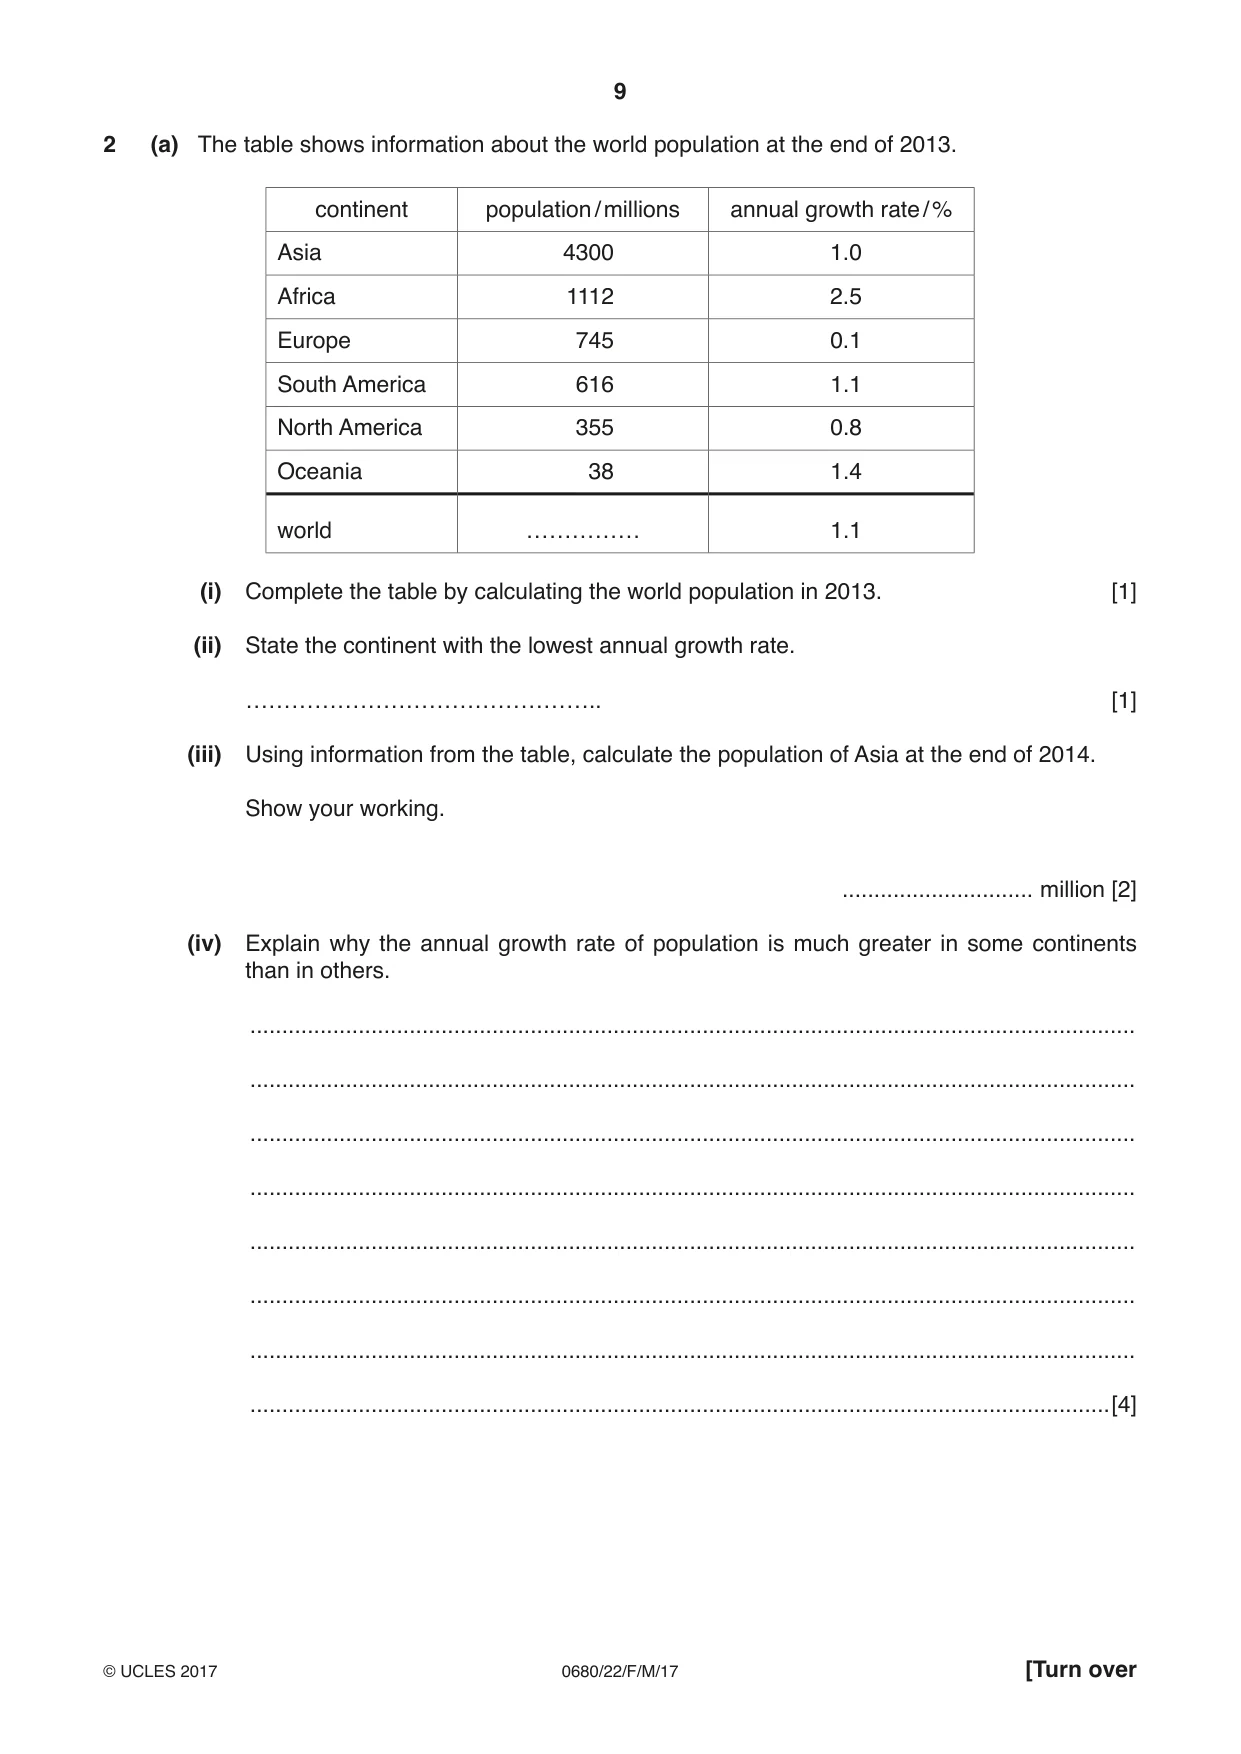
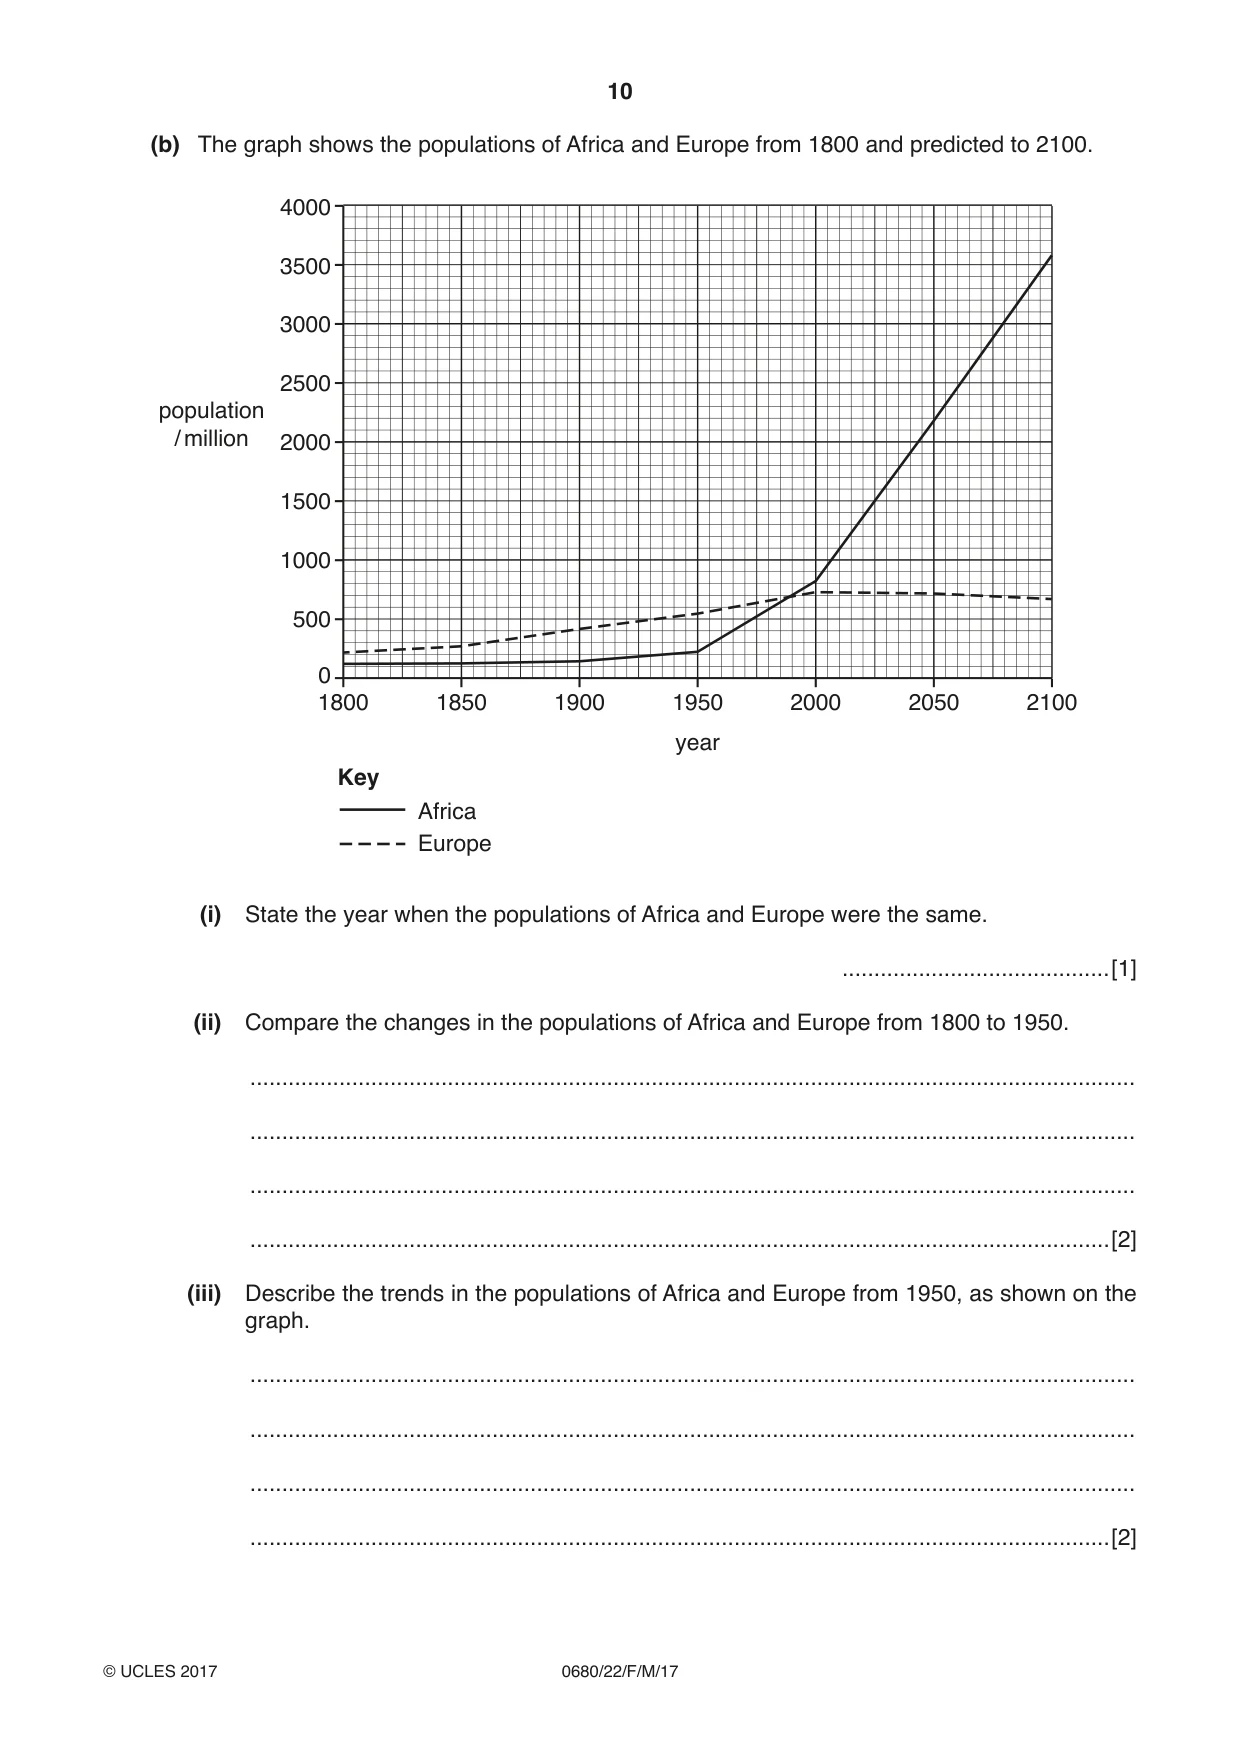
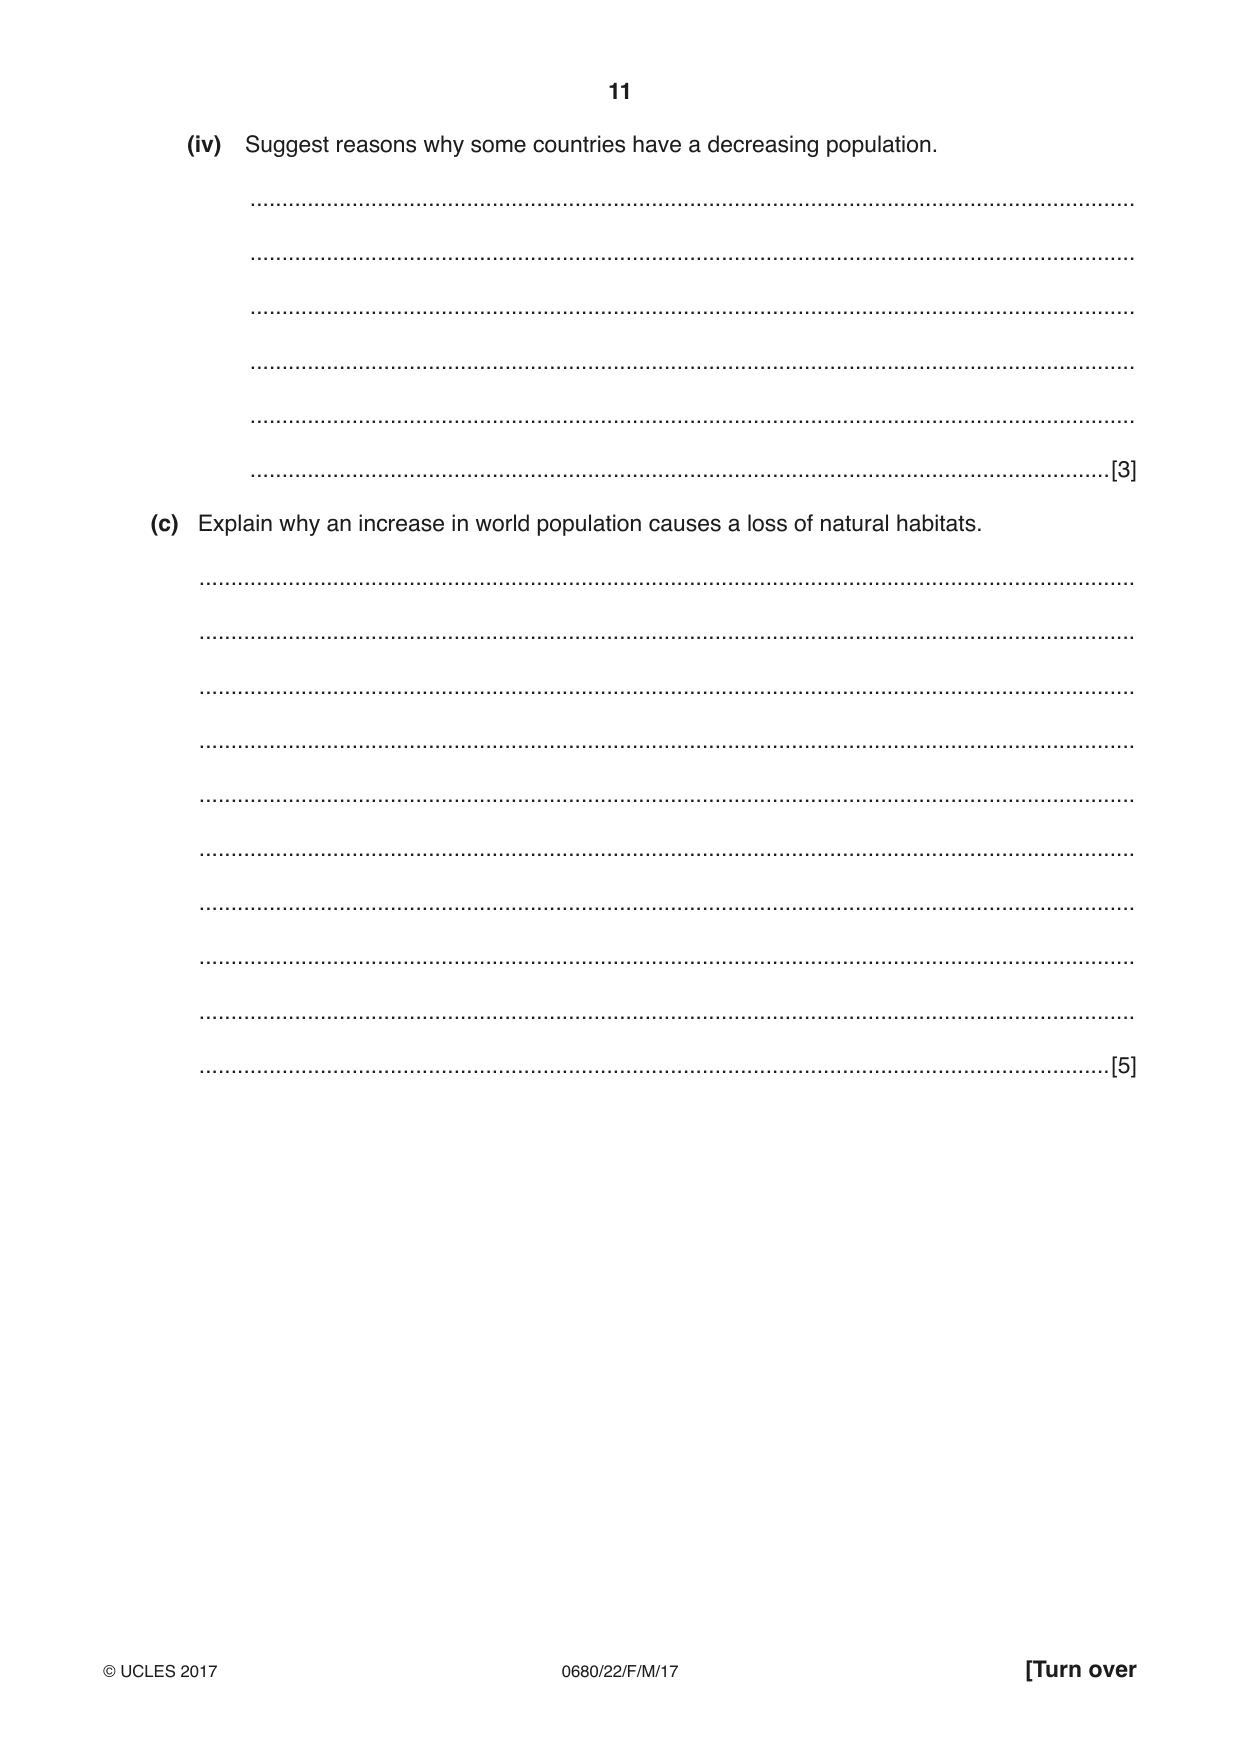
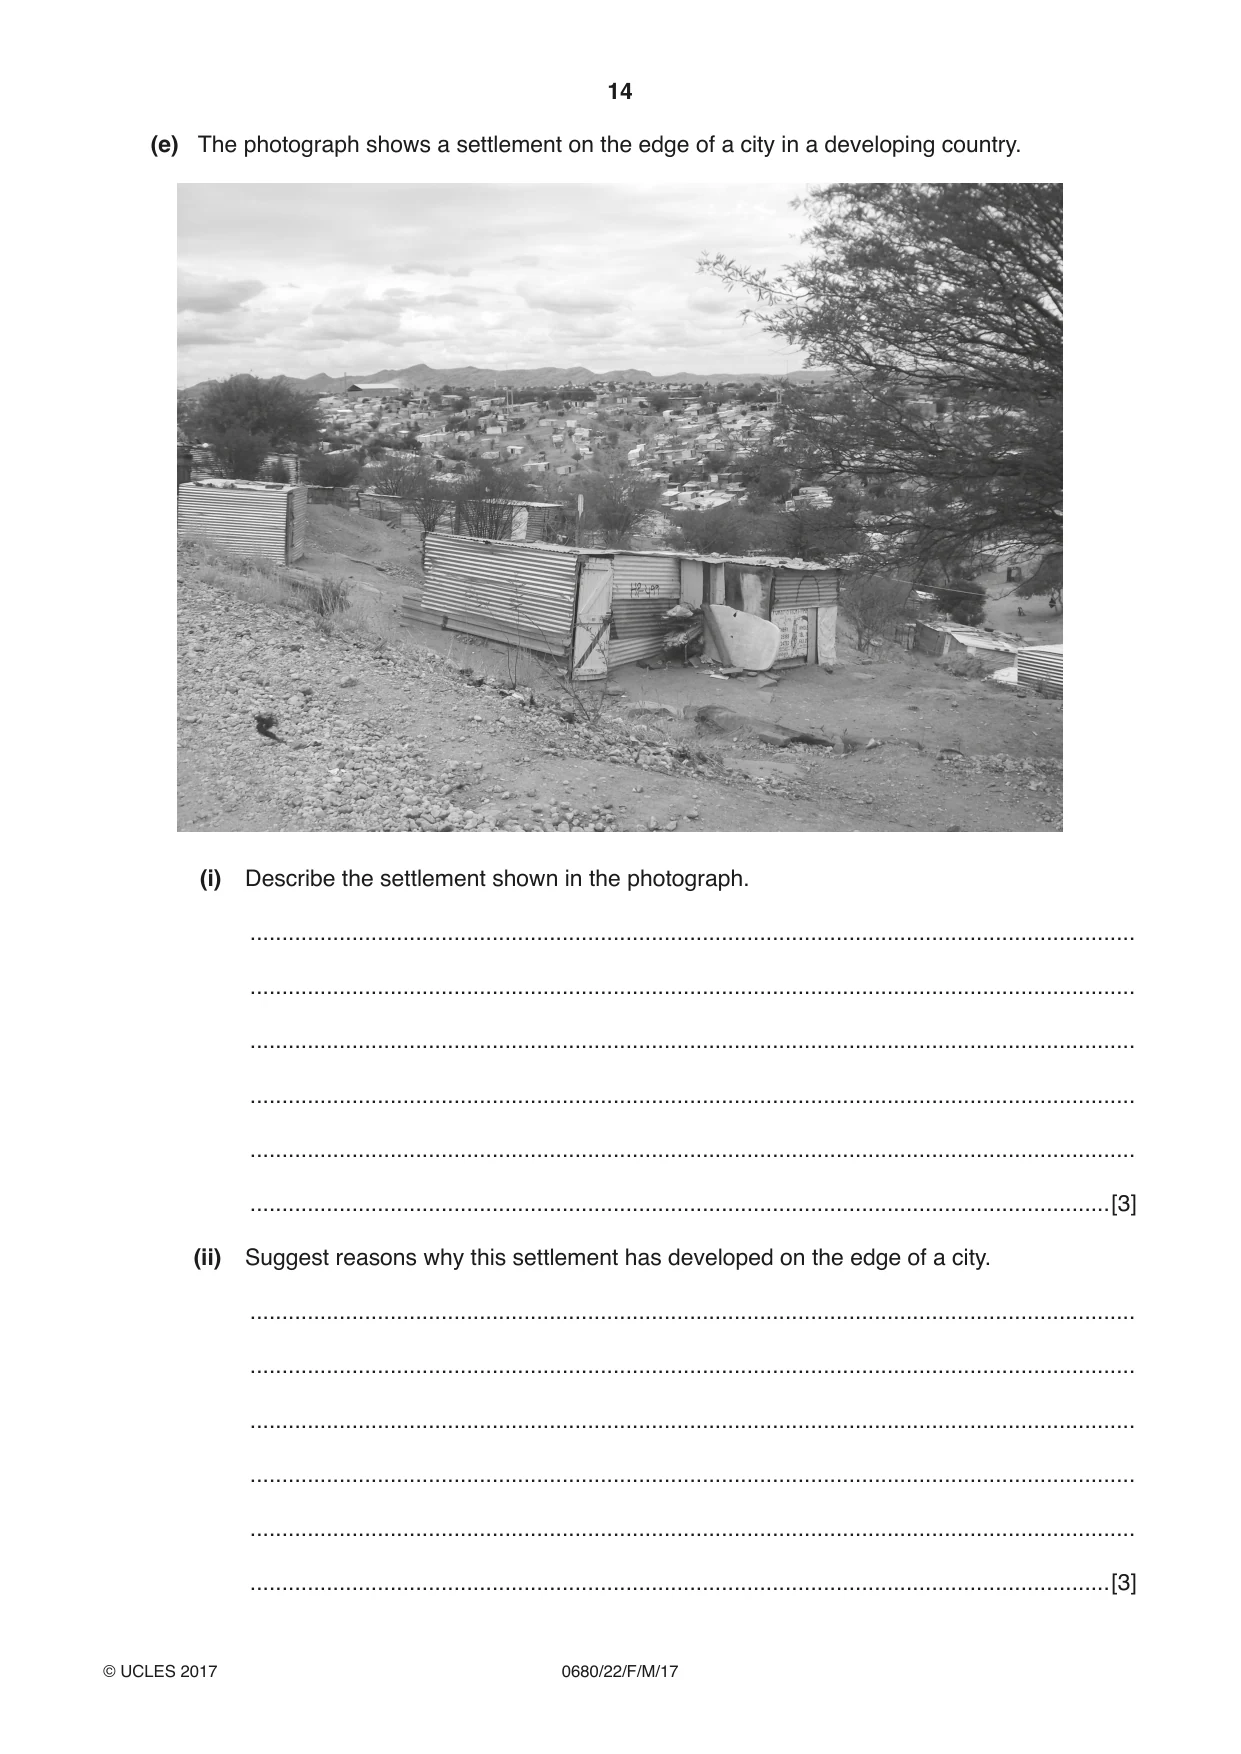
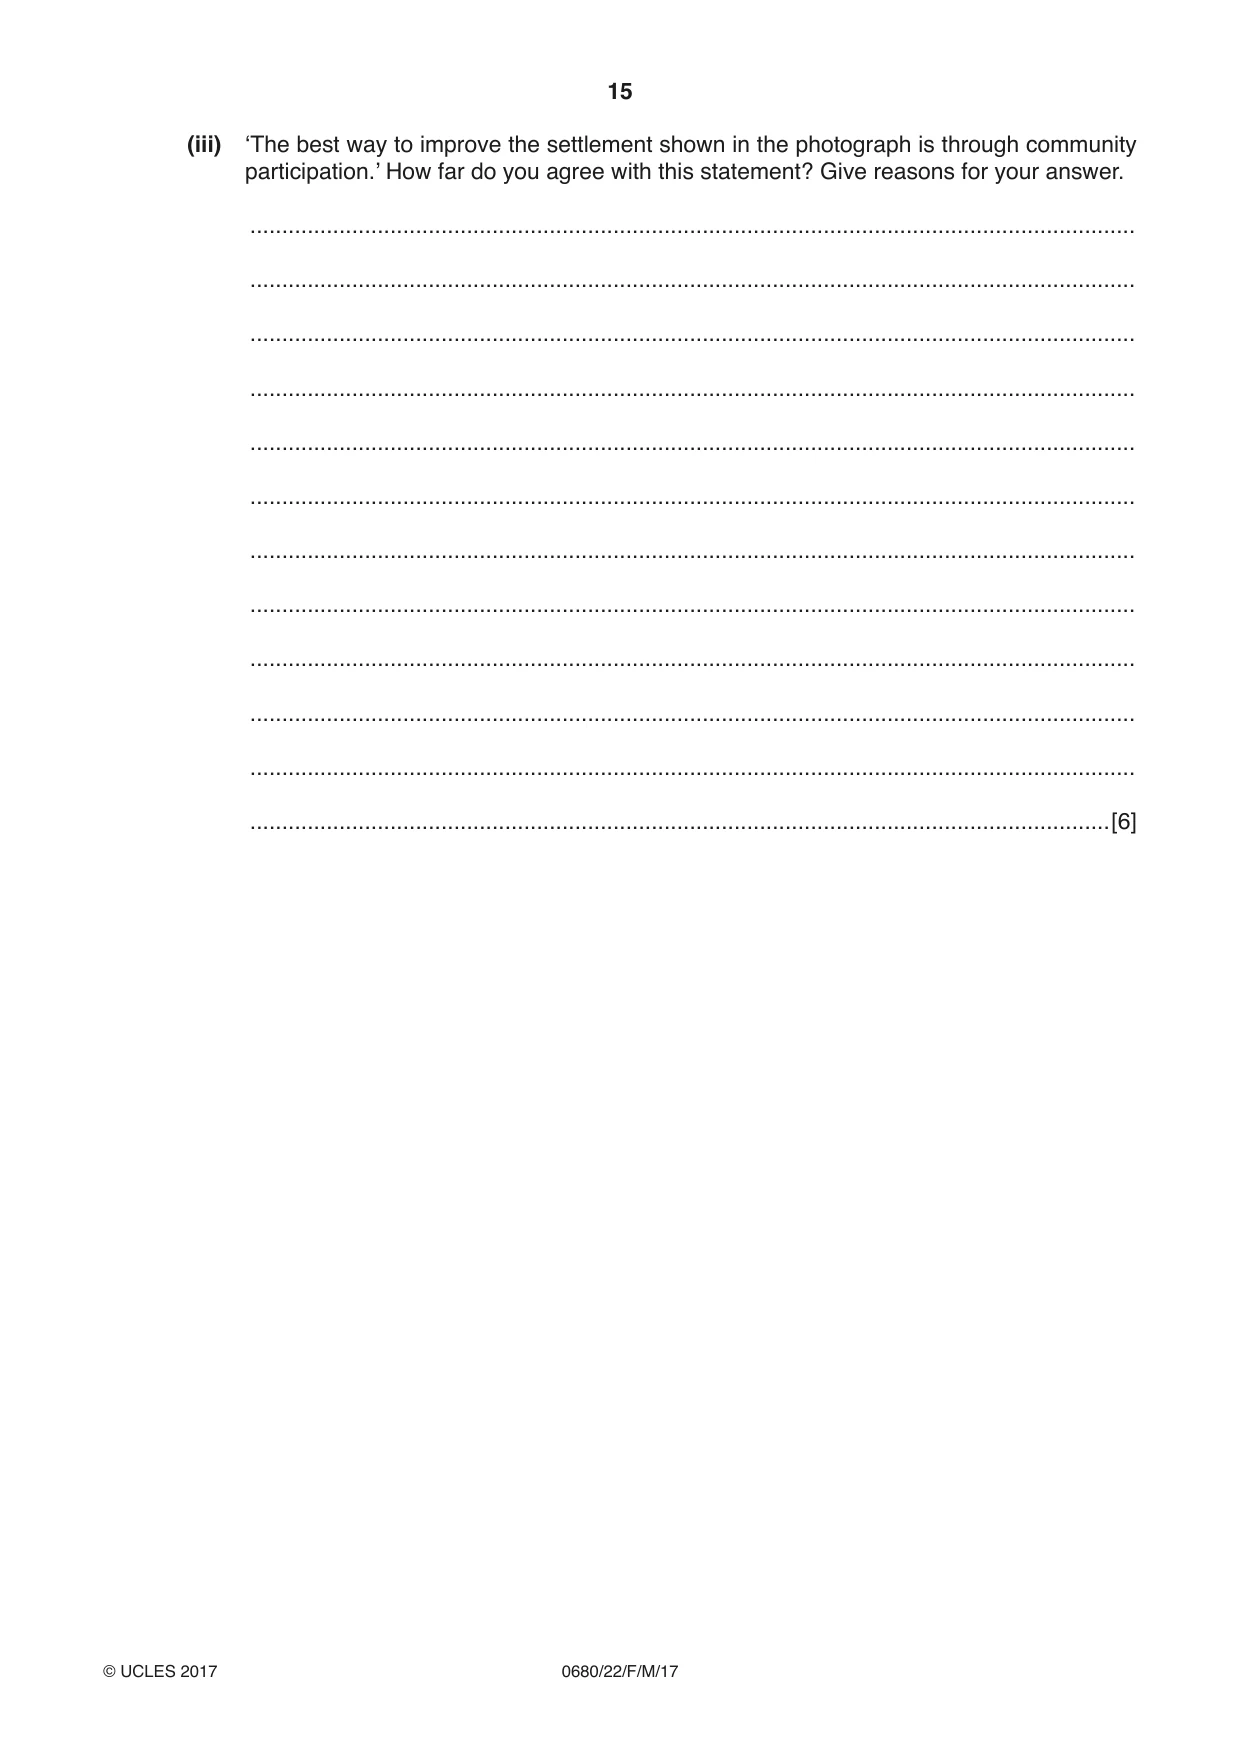
2 (a) The table shows information about the world population at the end of 2013. continent population / millions annual growth rate / % Asia 4300 1.0 Africa 1112 2.5 Europe 745 0.1 South America 616 1.1 North America 355 0.8 Oceania 38 1.4 world …………… 1.1 (i) Complete the table by calculating the world population in 2013. [1] (ii) State the continent with the lowest annual growth rate. [1] (iii) Using information from the table, calculate the population of Asia at the end of 2014. Show your working. .............................. million [2] (iv) Explain why the annual growth rate of population is much greater in some continents than in others. ........................................................................................................................................... ........................................................................................................................................... ........................................................................................................................................... ........................................................................................................................................... ........................................................................................................................................... ........................................................................................................................................... ........................................................................................................................................... .......................................................................................................................................[4] (b) The graph shows the populations of Africa and Europe from 1800 and predicted to 2100. 4000 3500 3000 2500 population / million 2000 1500 1000 500 0 1800 1850 1900 1950 2000 2050 2100 year Key Africa Europe (i) State the year when the populations of Africa and Europe were the same. ..........................................[1] (ii) Compare the changes in the populations of Africa and Europe from 1800 to 1950. ........................................................................................................................................... ........................................................................................................................................... ........................................................................................................................................... .......................................................................................................................................[2] (iii) Describe the trends in the populations of Africa and Europe from 1950, as shown on the graph. ........................................................................................................................................... ........................................................................................................................................... ........................................................................................................................................... .......................................................................................................................................[2] (iv) Suggest reasons why some countries have a decreasing population. ........................................................................................................................................... ........................................................................................................................................... ........................................................................................................................................... ........................................................................................................................................... ........................................................................................................................................... .......................................................................................................................................[3] (c) Explain why an increase in world population causes a loss of natural habitats. ................................................................................................................................................... ................................................................................................................................................... ................................................................................................................................................... ................................................................................................................................................... ................................................................................................................................................... ................................................................................................................................................... ................................................................................................................................................... ................................................................................................................................................... ................................................................................................................................................... ...............................................................................................................................................[5]
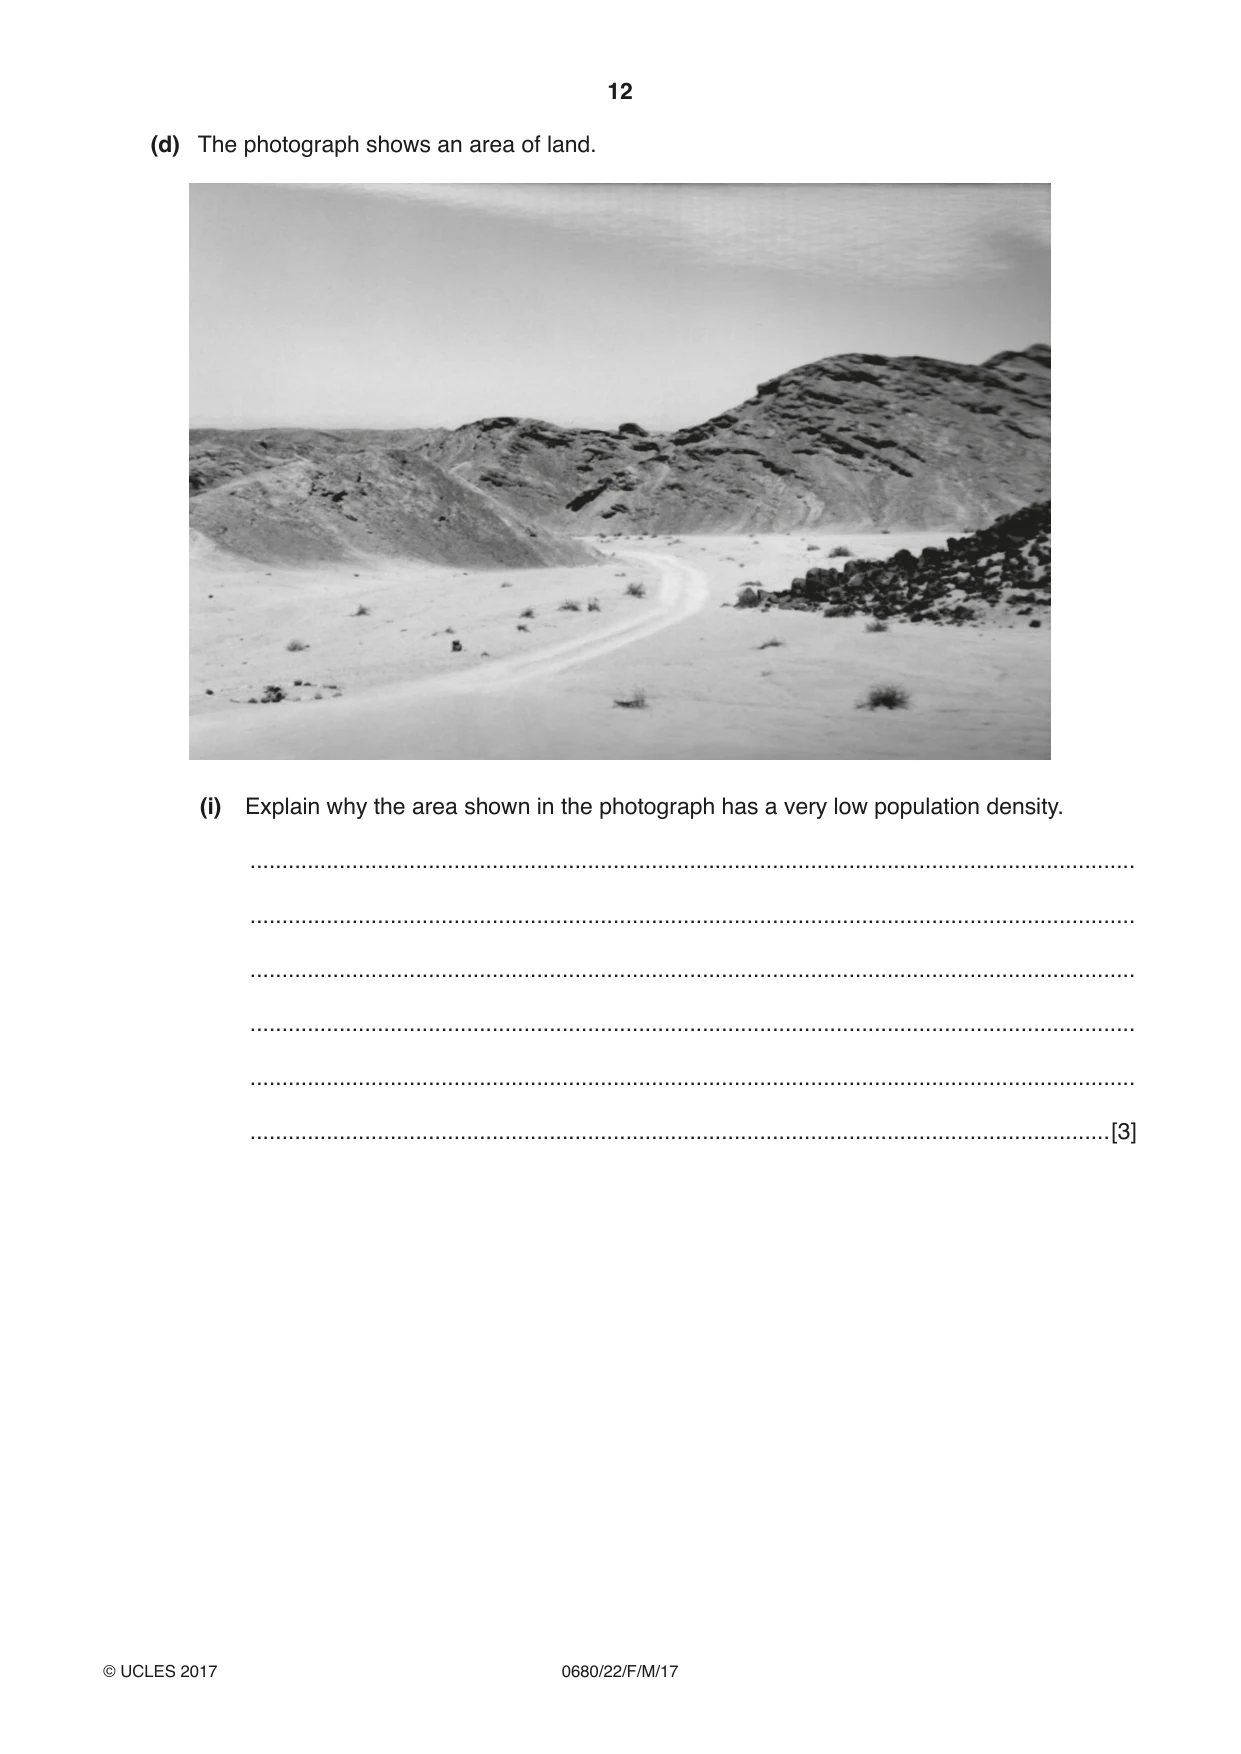
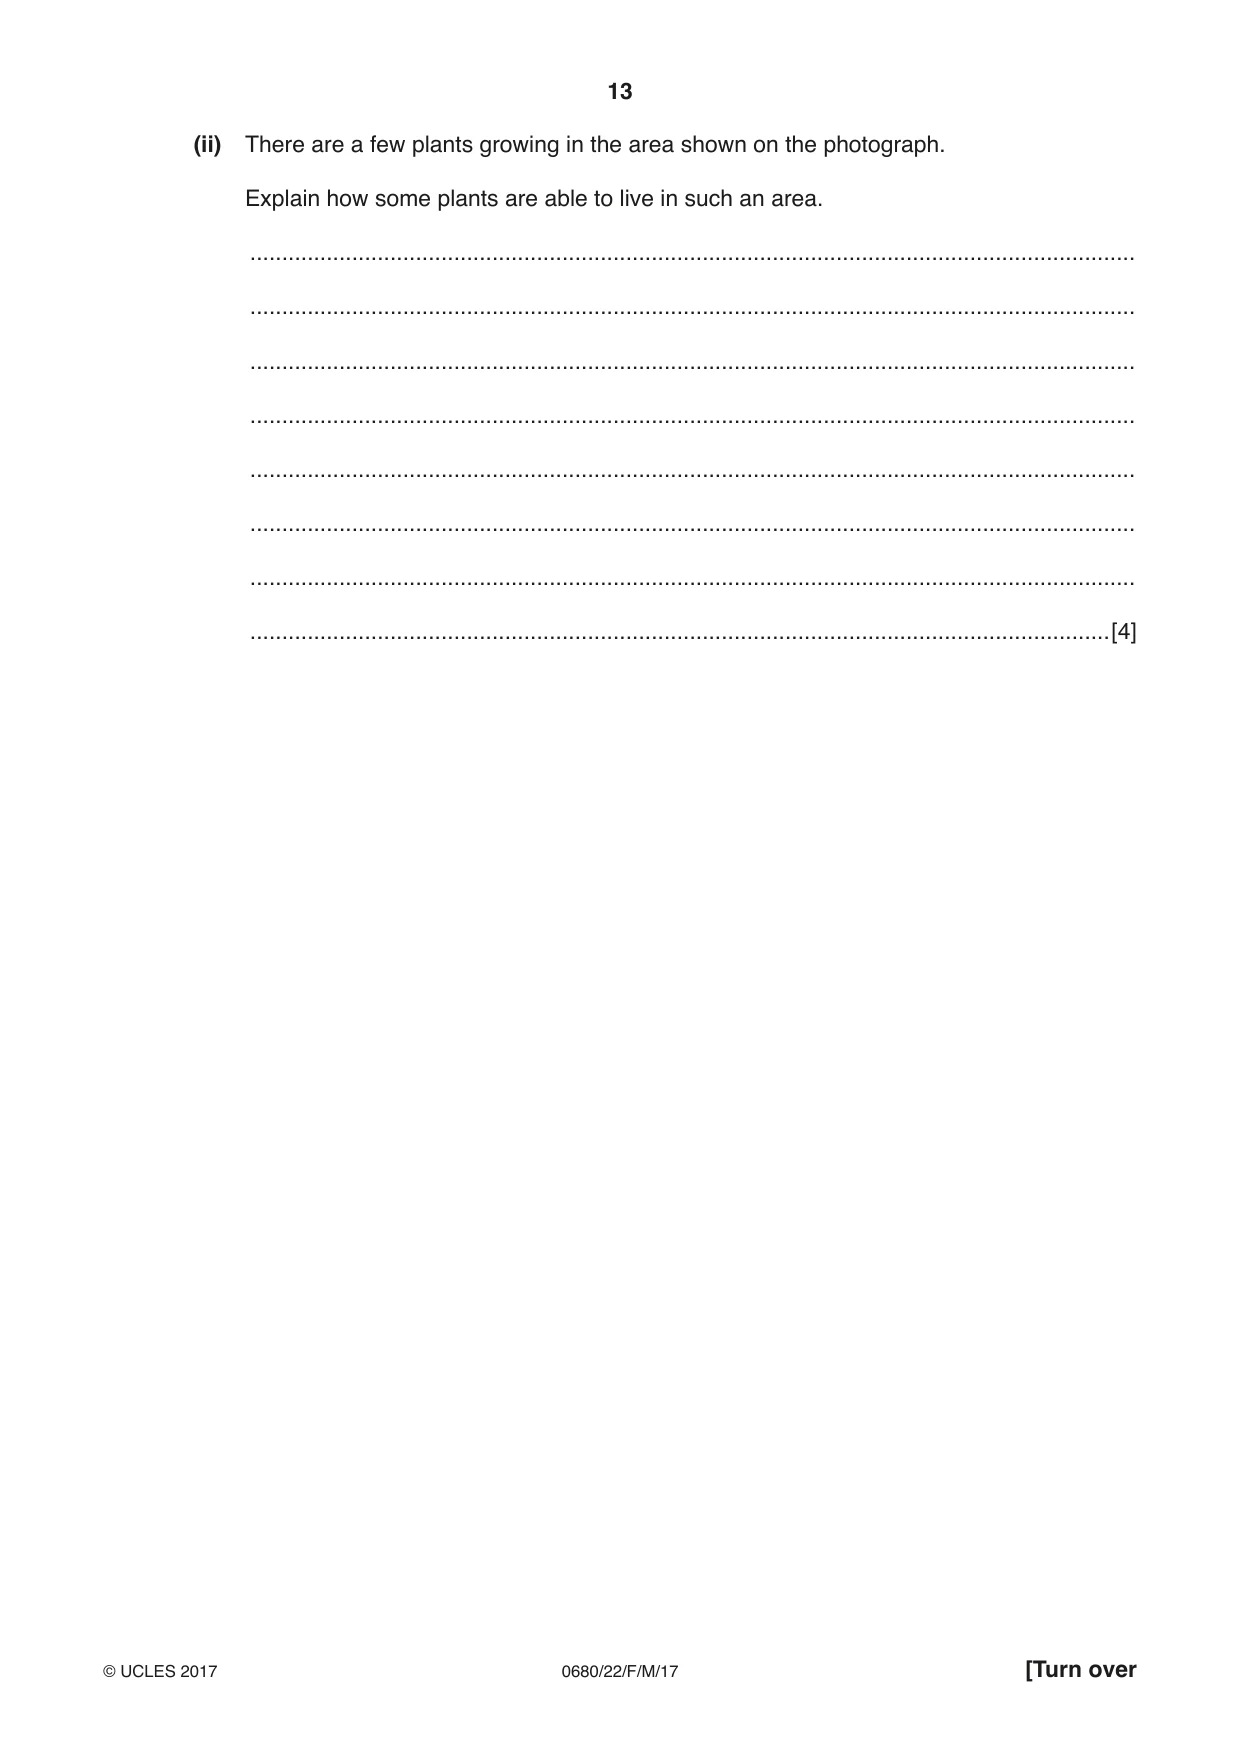
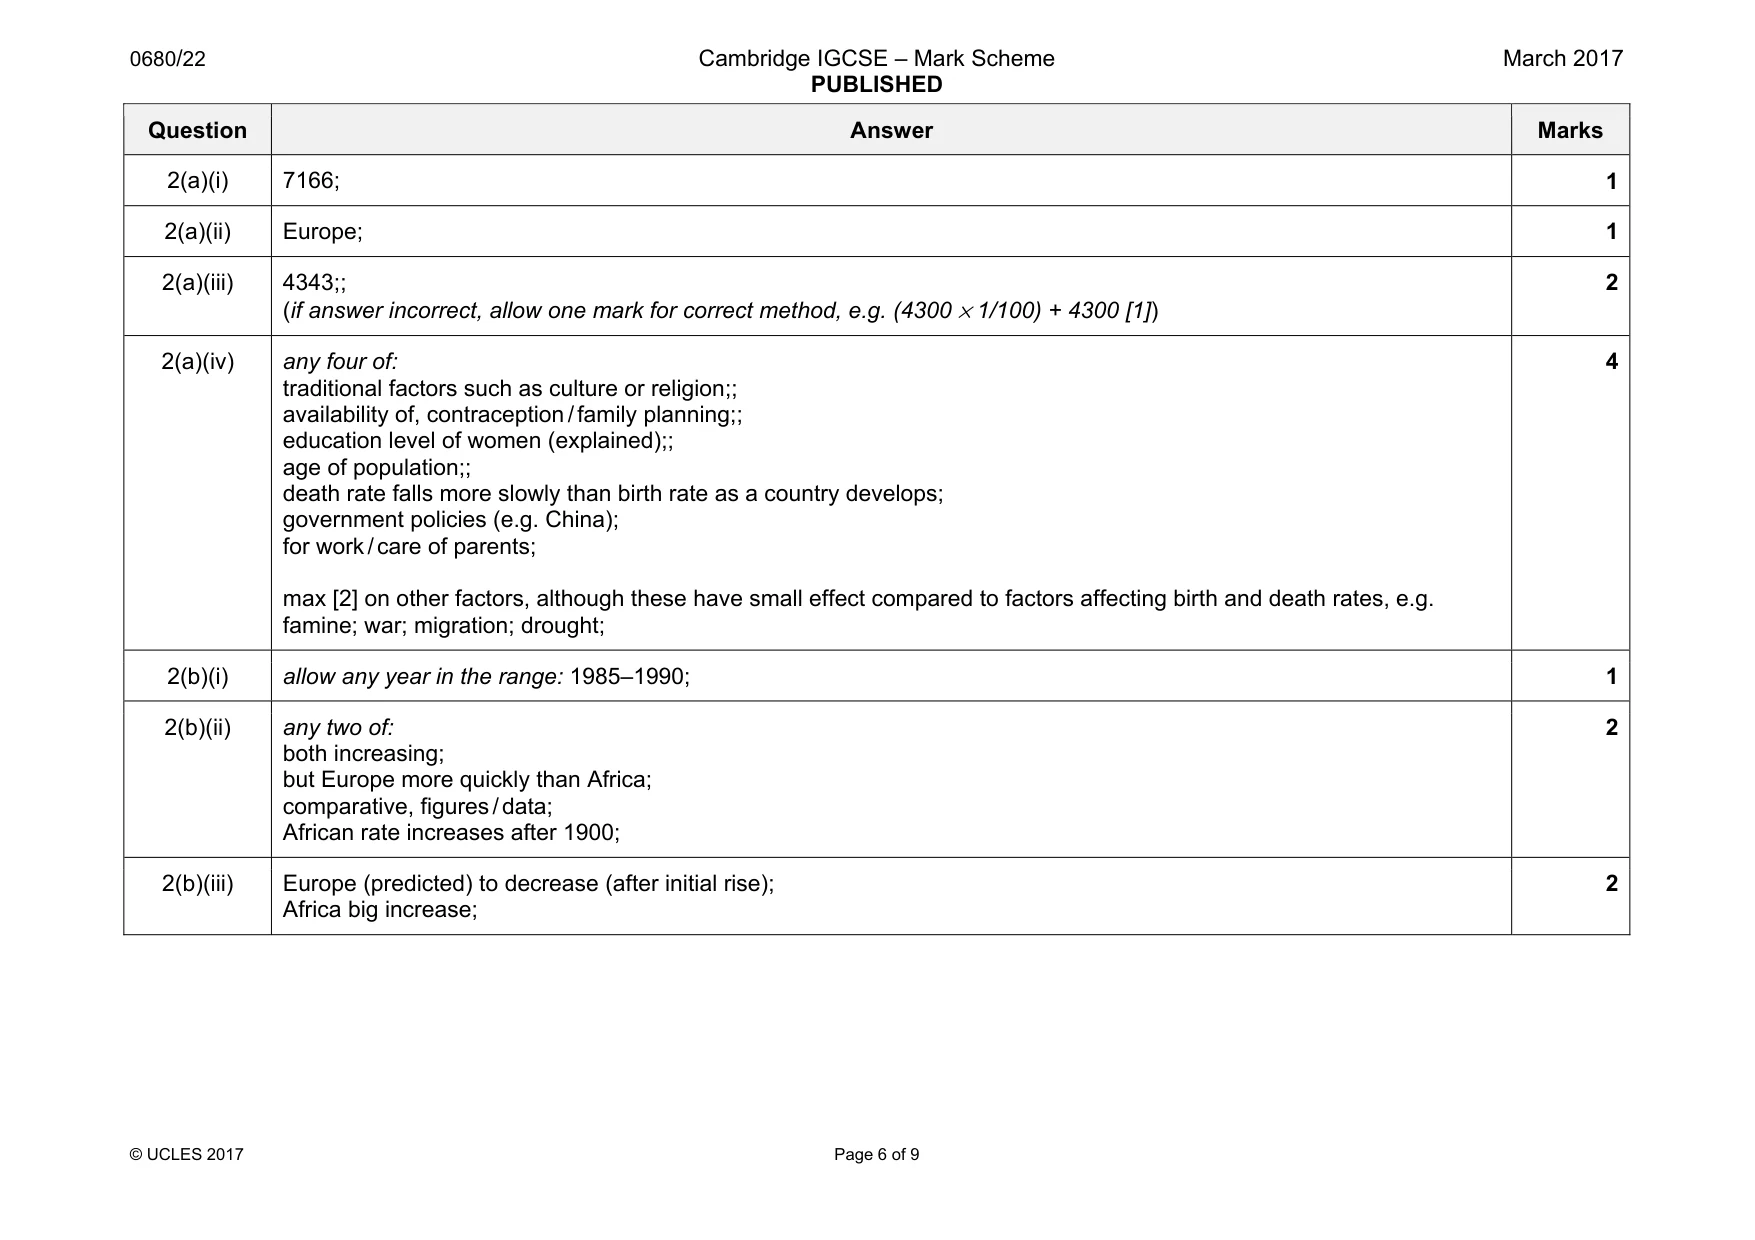
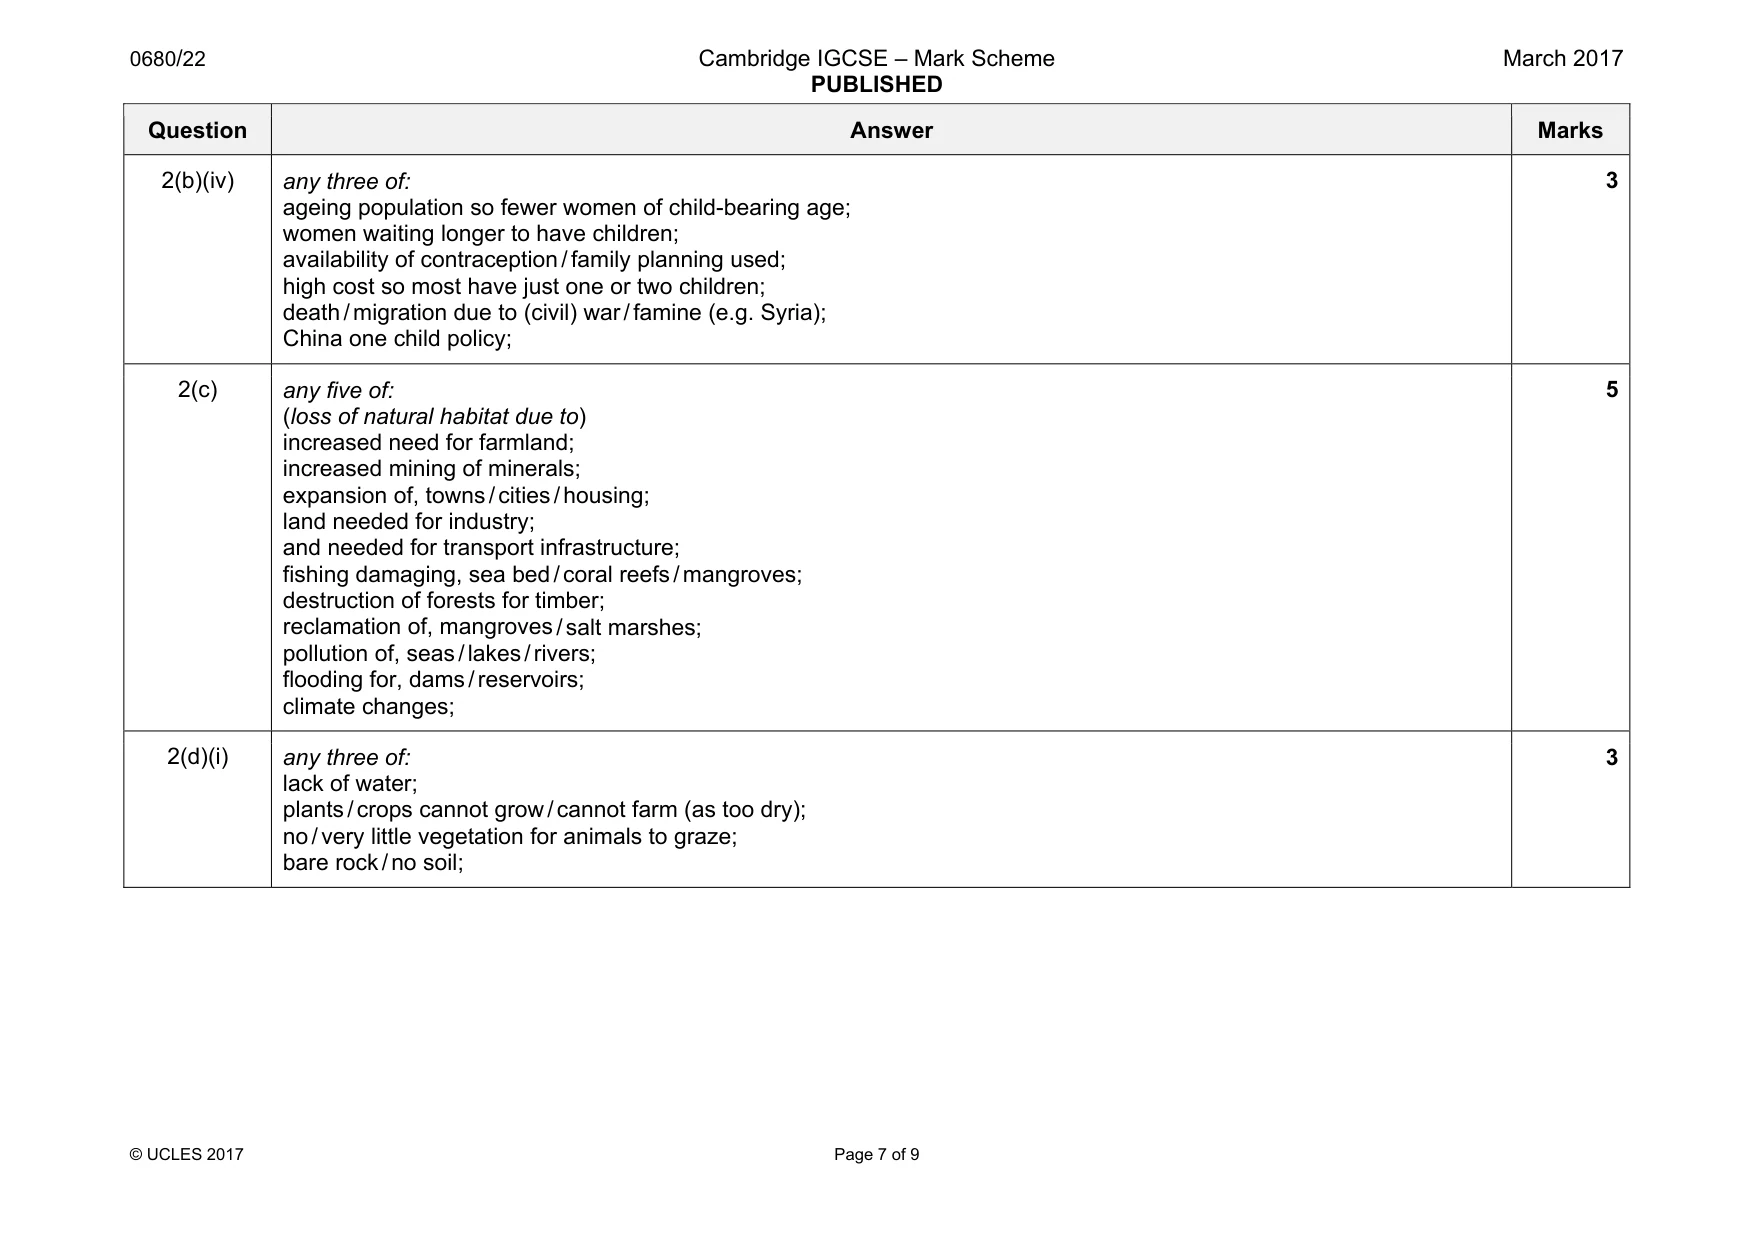
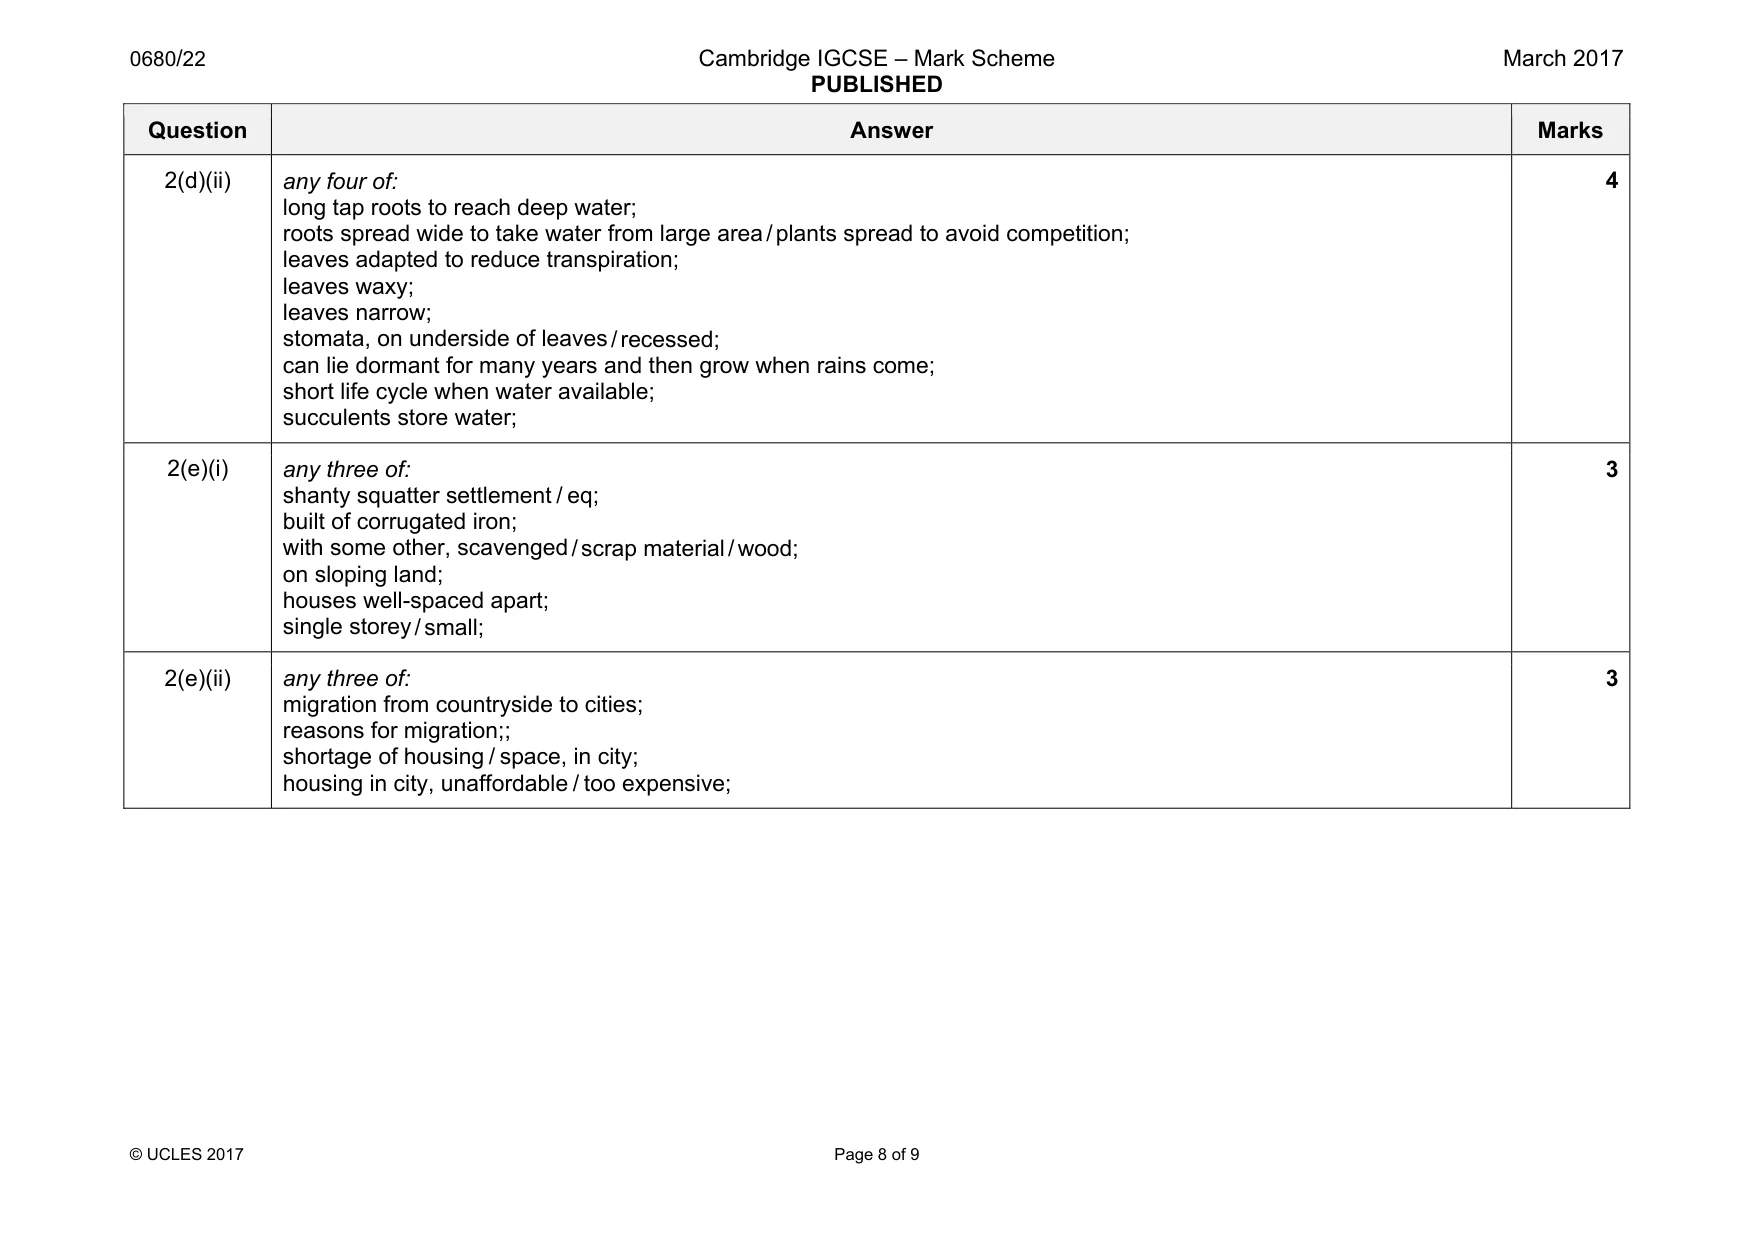
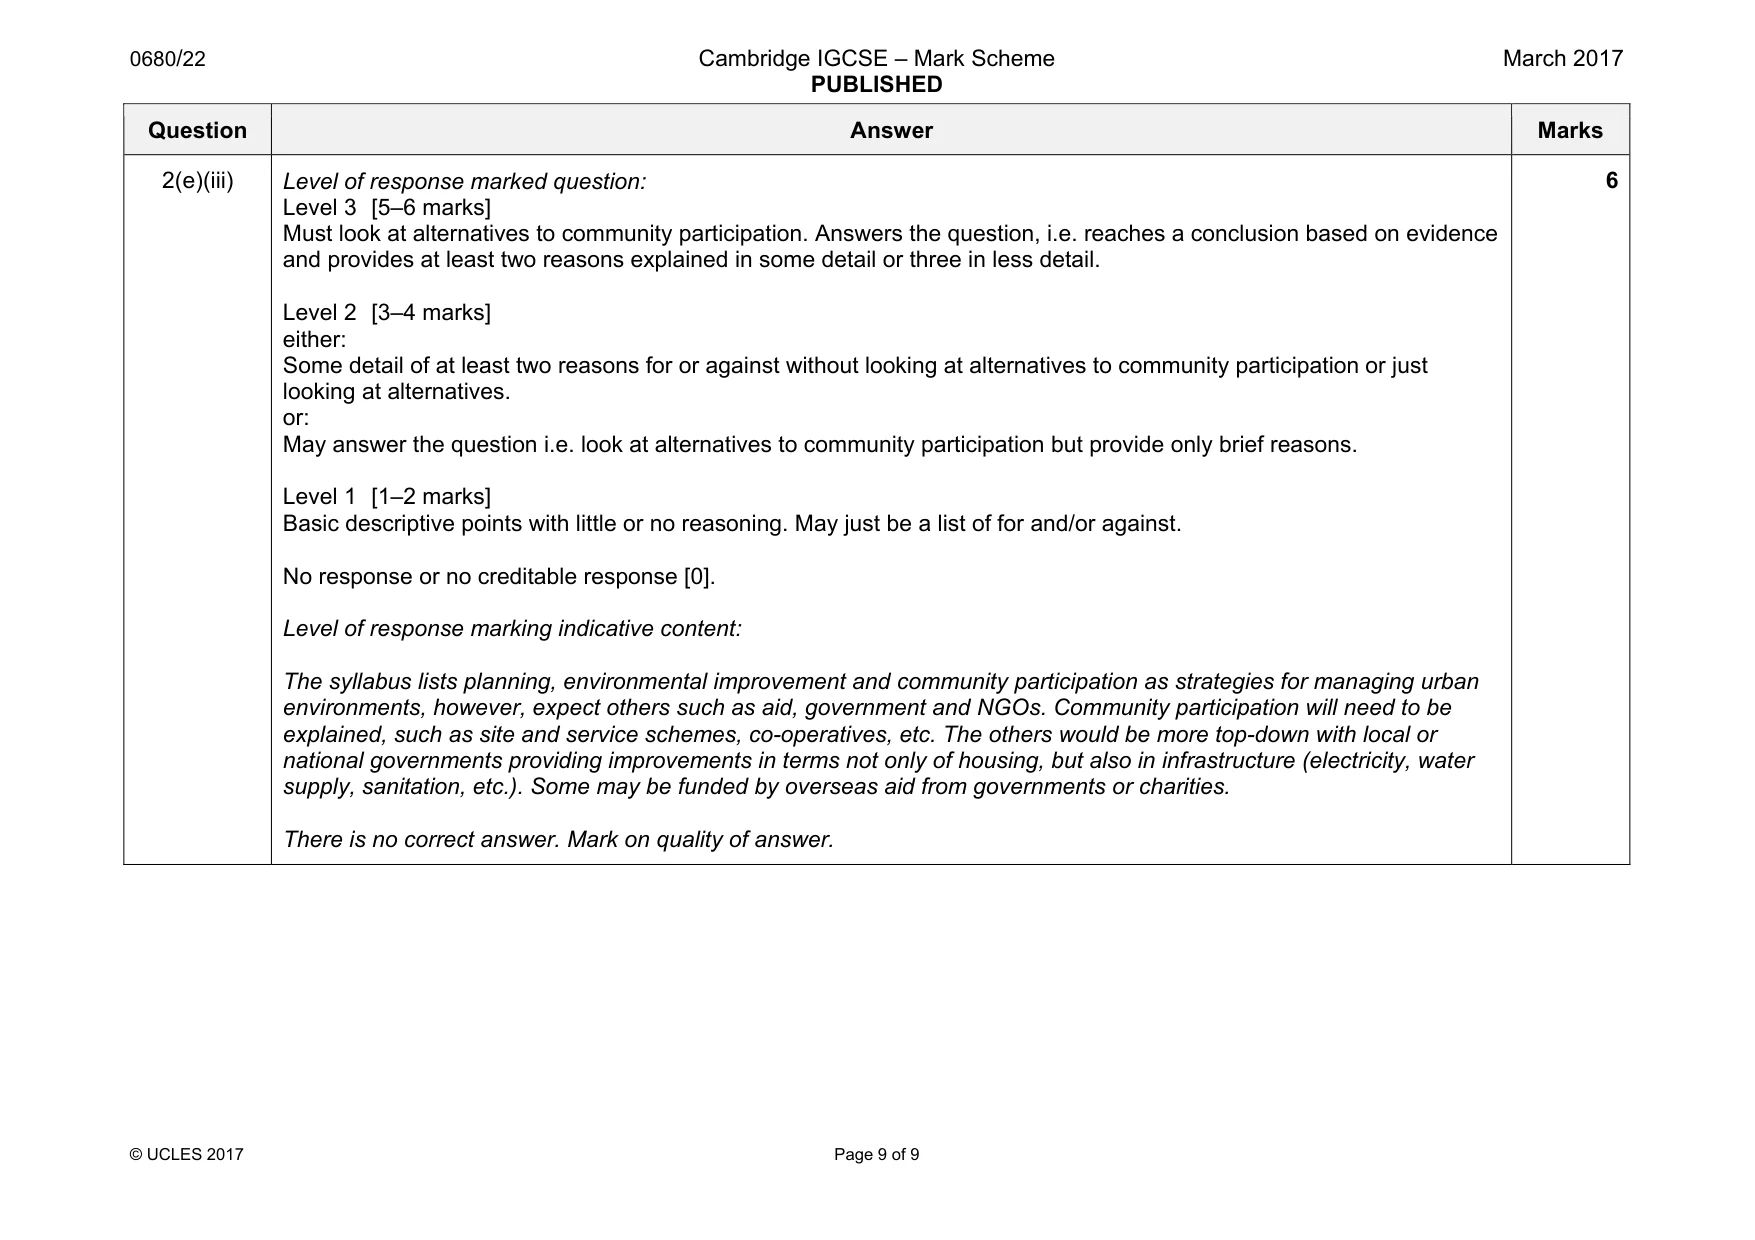
Mark scheme: 2(a)(i) 7166; 1 2(a)(ii) Europe; 1 2(a)(iii) 4343;; (if answer incorrect, allow one mark for correct method, e.g. (4300 × 1/100) + 4300 [1]) 2 2(a)(iv) any four of: traditional factors such as culture or religion;; availability of, contraception / family planning;; education level of women (explained);; age of population;; death rate falls more slowly than birth rate as a country develops; government policies (e.g. China); for work / care of parents; max [2] on other factors, although these have small effect compared to factors affecting birth and death rates, e.g. famine; war; migration; drought; 4 2(b)(i) allow any year in the range: 1985–1990; 1 2(b)(ii) any two of: both increasing; but Europe more quickly than Africa; comparative, figures / data; African rate increases after 1900; 2 2(b)(iii) Europe (predicted) to decrease (after initial rise); Africa big increase; 2 Question Answer Marks 2(b)(iv) any three of: ageing population so fewer women of child-bearing age; women waiting longer to have children; availability of contraception / family planning used; high cost so most have just one or two children; death / migration due to (civil) war / famine (e.g. Syria); China one child policy; 3 2(c) any five of: (loss of natural habitat due to) increased need for farmland; increased mining of minerals; expansion of, towns / cities / housing; land needed for industry; and needed for transport infrastructure; fishing damaging, sea bed / coral reefs / mangroves; destruction of forests for timber; reclamation of, mangroves / salt marshes; pollution of, seas / lakes / rivers; flooding for, dams / reservoirs; climate changes; 5 2(d)(i) any three of: lack of water; plants / crops cannot grow / cannot farm (as too dry); no / very little vegetation for animals to graze; bare rock / no soil; 3 Question Answer Marks 2(d)(ii) any four of: long tap roots to reach deep water; roots spread wide to take water from large area / plants spread to avoid competition; leaves adapted to reduce transpiration; leaves waxy; leaves narrow; stomata, on underside of leaves / recessed; can lie dormant for many years and then grow when rains come; short life cycle when water available; succulents store water; 4 2(e)(i) any three of: shanty squatter settlement / eq; built of corrugated iron; with some other, scavenged / scrap material / wood; on sloping land; houses well-spaced apart; single storey / small; 3 2(e)(ii) any three of: migration from countryside to cities; reasons for migration;; shortage of housing / space, in city; housing in city, unaffordable / too expensive; 3 Question Answer Marks 2(e)(iii) Level of response marked question: Level 3 [5–6 marks] Must look at alternatives to community participation. Answers the question, i.e. reaches a conclusion based on evidence and provides at least two reasons explained in some detail or three in less detail. Level 2 [3–4 marks] either: Some detail of at least two reasons for or against without looking at alternatives to community participation or just looking at alternatives. or: May answer the question i.e. look at alternatives to community participation but provide only brief reasons. Level 1 [1–2 marks] Basic descriptive points with little or no reasoning. May just be a list of for and/or against. No response or no creditable response [0]. Level of response marking indicative content: The syllabus lists planning, environmental improvement and community participation as strategies for managing urban environments, however, expect others such as aid, government and NGOs. Community participation will need to be explained, such as site and service schemes, co-operatives, etc. The others would be more top-down with local or national governments providing improvements in terms not only of housing, but also in infrastructure (electricity, water supply, sanitation, etc.). Some may be funded by overseas aid from governments or charities. There is no correct answer. Mark on quality of answer. 6
What was in this paper
The subtopics covered by these 2 questions, and how many questions each got. Open one in a new tab to see every Cambridge question on it.
What you needed in this session
Cambridge’s own grade thresholds for 2017 Feb/March, Paper 2 · Variant 2. A higher threshold means an easier paper — the bar moves with how the cohort did.