Cambridge IGCSE Environmental Management 0680 — 2016 Oct/Nov Paper 2 · Variant 3
0680/23/O/N/16 · 80 marks · ≈90 min
The question paper and its mark scheme, free to read here and free to download. This is Cambridge’s own paper, exactly as it was sat.
Question paper16 pages
Mark scheme7 pages
Answers below. Sit the paper first if you are practising.
Paper as text
Question paper, page 1
This document consists of 16 printed pages. DC (LK/SG) 114936/3 © UCLES 2016 [Turn over Cambridge International Examinations Cambridge International General Certificate of Secondary Education * 1 3 0 5 3 0 3 6 6 0 * ENVIRONMENTAL MANAGEMENT 0680/23 Paper 2 October/November 2016 1 hour 45 minutes Candidates answer on the Question Paper. No Additional Materials are required. READ THESE INSTRUCTIONS FIRST Write your Centre number, candidate number and name on all the work you hand in. Write in dark blue or black pen. You may use an HB pencil for any diagrams or graphs. Do not use staples, paper clips, glue or correction fluid. DO NOT WRITE IN ANY BARCODES. Answer both questions. Electronic calculators may be used. You may lose marks if you do not show your working or if you do not use appropriate units. At the end of the examination, fasten all your work securely together. The number of marks is given in brackets [ ] at the end of each question or part question.
Question paper, page 2
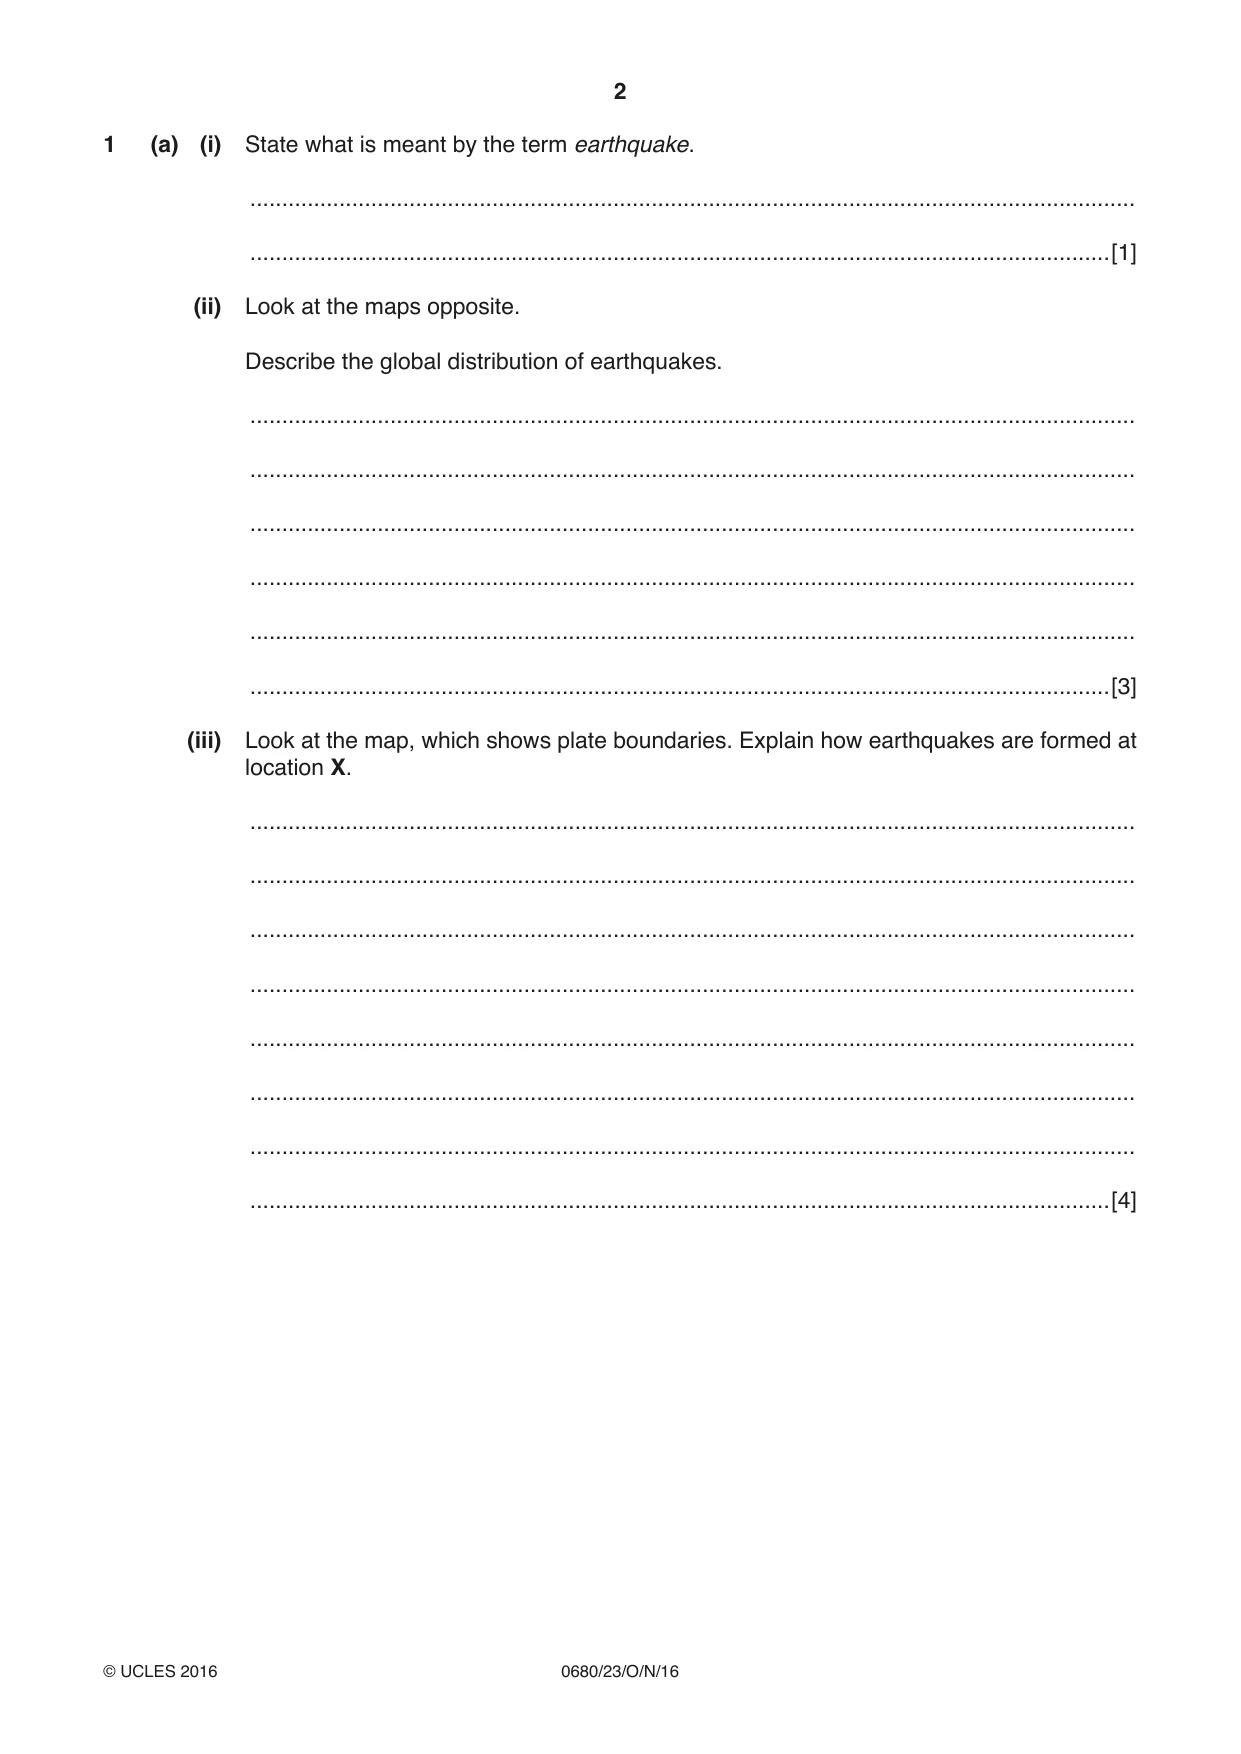
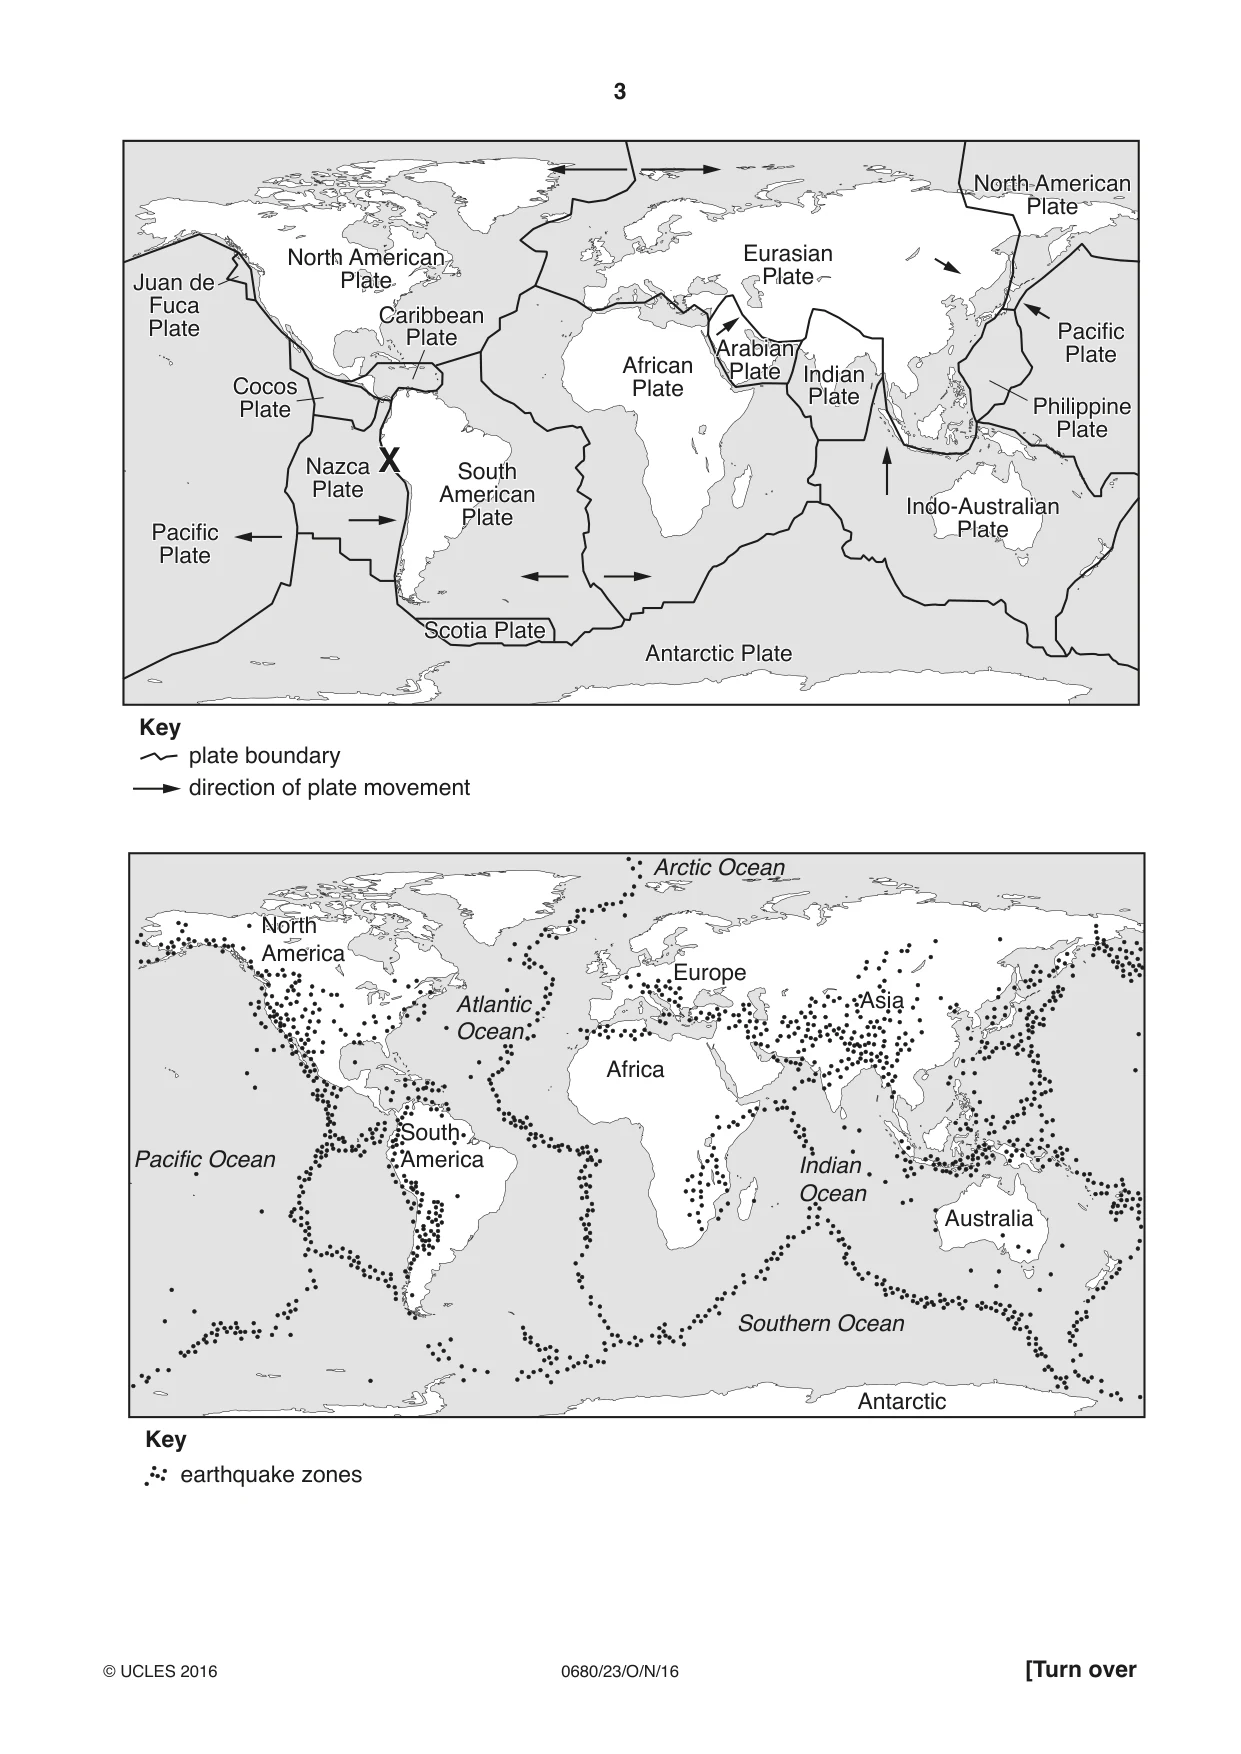
2 0680/23/O/N/16 © UCLES 2016 1 (a) (i) State what is meant by the term earthquake. … …[1] (ii) Look at the maps opposite. Describe the global distribution of earthquakes. … … … … … …[3] (iii) Look at the map, which shows plate boundaries. Explain how earthquakes are formed at location X. … … … … … … … …[4]
Question paper, page 3
3 0680/23/O/N/16 © UCLES 2016 [Turn over North American Plate Arabian Plate Indian Plate Philippine Plate Eurasian Plate Pacific Plate Pacific Plate Indo-Australian Plate Antarctic Plate North American Plate South American Plate Caribbean Plate African Plate Scotia Plate Juan de Fuca Plate Cocos Plate Nazca Plate plate boundary direction of plate movement Key X earthquake zones Key Arctic Ocean Pacific Ocean Southern Ocean Atlantic Ocean Indian Ocean Europe Africa Asia Australia Antarctic North America North America South America
Question paper, page 4
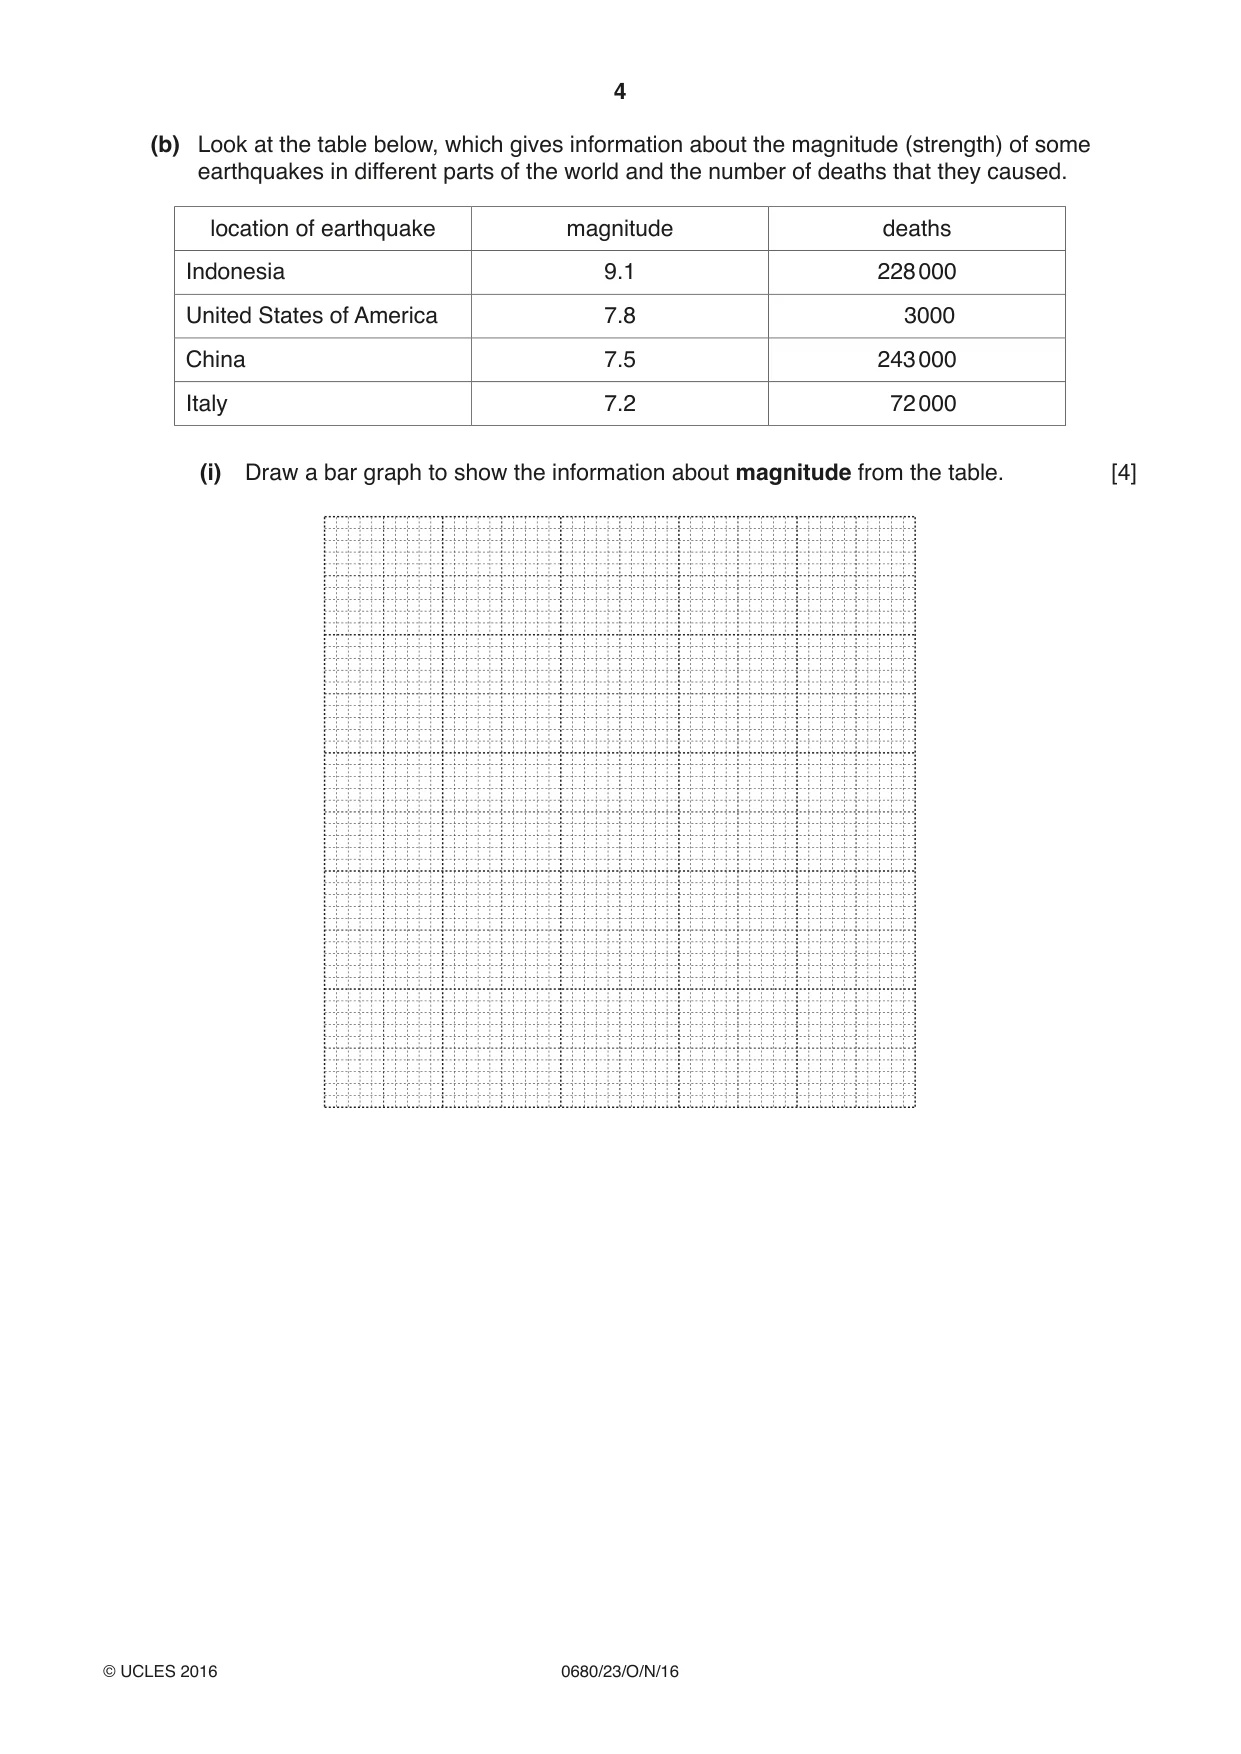
4 0680/23/O/N/16 © UCLES 2016 (b) Look at the table below, which gives information about the magnitude (strength) of some earthquakes in different parts of the world and the number of deaths that they caused. location of earthquake magnitude deaths Indonesia 9.1 228 000 United States of America 7.8 3000 China 7.5 243 000 Italy 7.2 72 000 (i) Draw a bar graph to show the information about magnitude from the table. [4]
Question paper, page 5
5 0680/23/O/N/16 © UCLES 2016 [Turn over (ii) Rewrite the locations of the earthquakes in rank order for the number of deaths in the space provided below. [2] highest 1 … 2 … 3 … 4 … lowest (iii) Look again at the table. State what is unusual about the information for the United States of America. … …[1] (iv) Describe strategies that countries can use to manage the impacts of earthquakes. … … … … … … … …[4]
Question paper, page 6
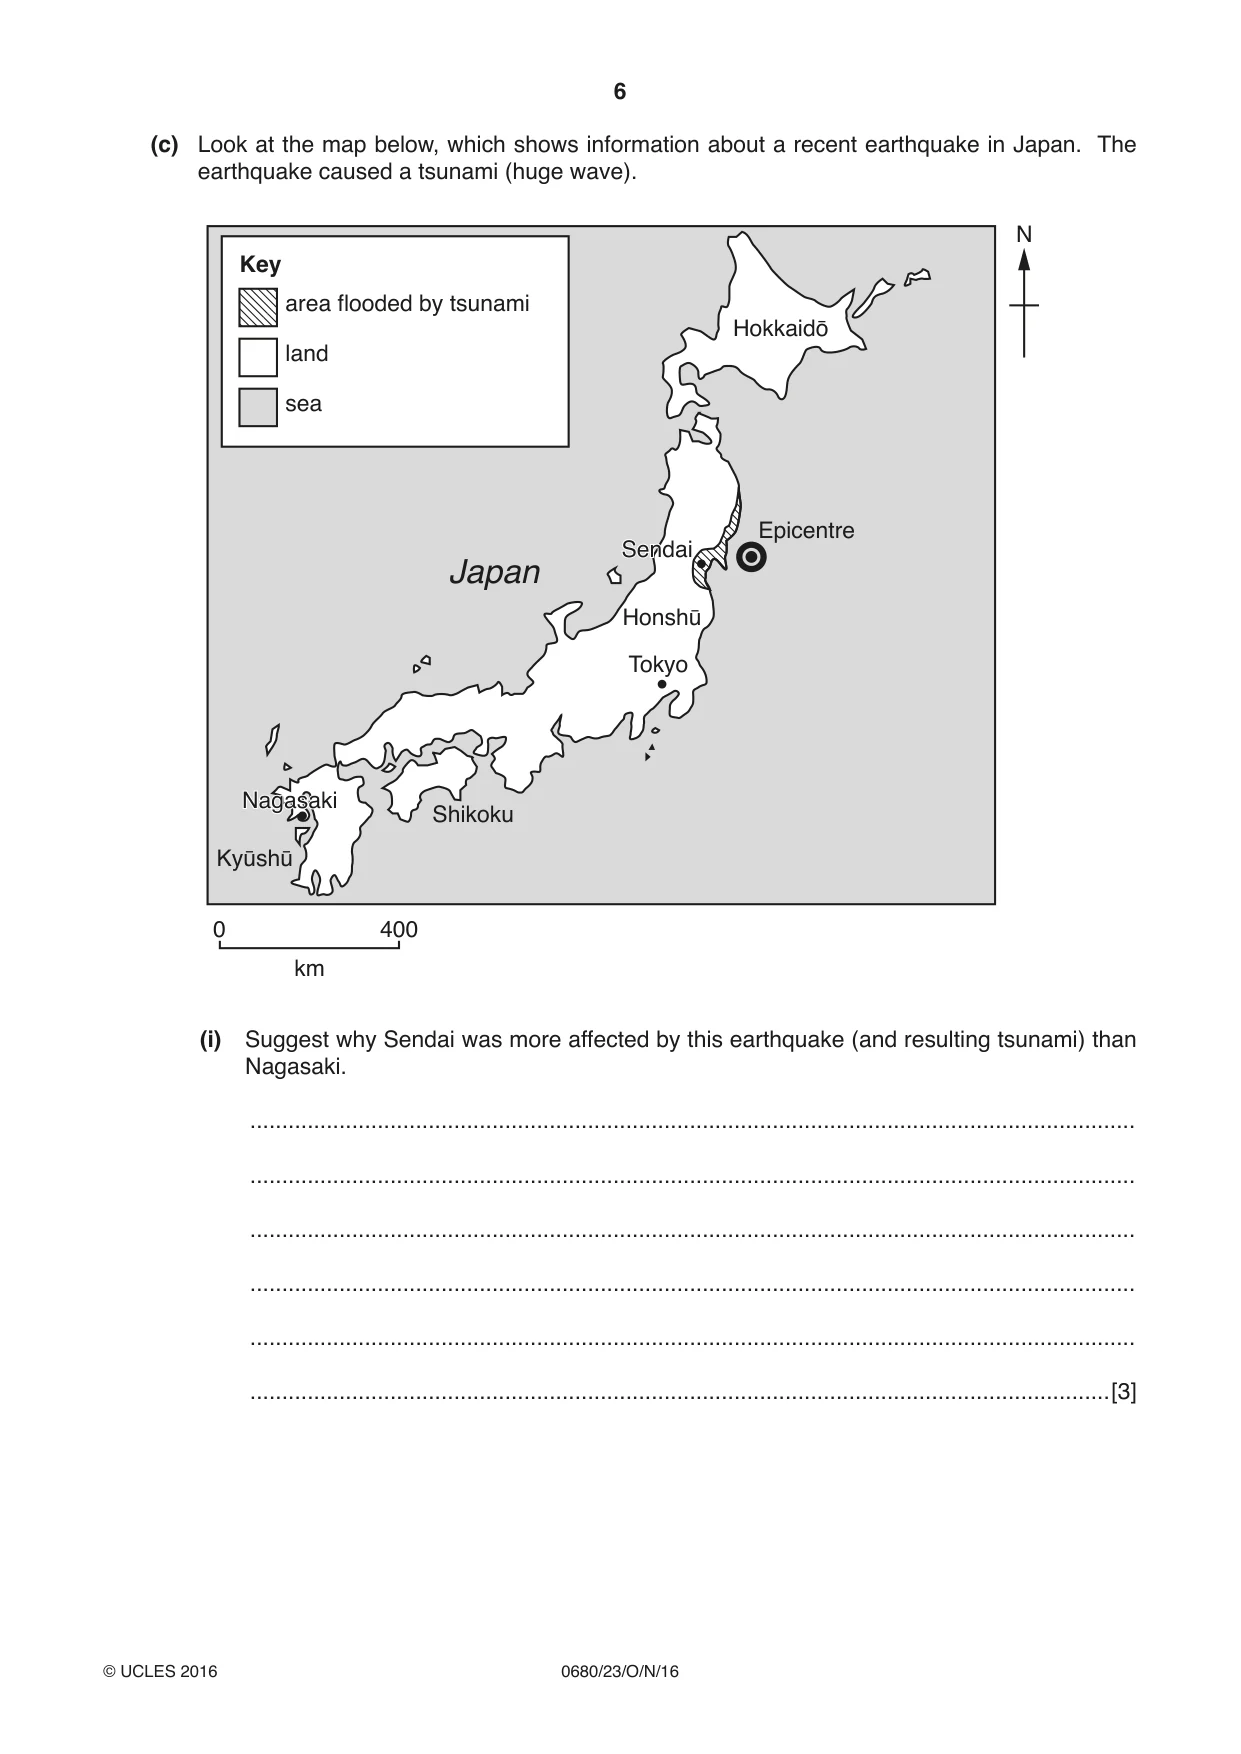
6 0680/23/O/N/16 © UCLES 2016 (c) Look at the map below, which shows information about a recent earthquake in Japan. The earthquake caused a tsunami (huge wave). 0 400 km N Epicentre Sendai Sendai Tokyo Nagasaki Nagasaki Japan Hokkaidō Honshū Shikoku Kyūshū Key area flooded by tsunami land sea (i) Suggest why Sendai was more affected by this earthquake (and resulting tsunami) than Nagasaki. … … … … … …[3]
Question paper, page 7
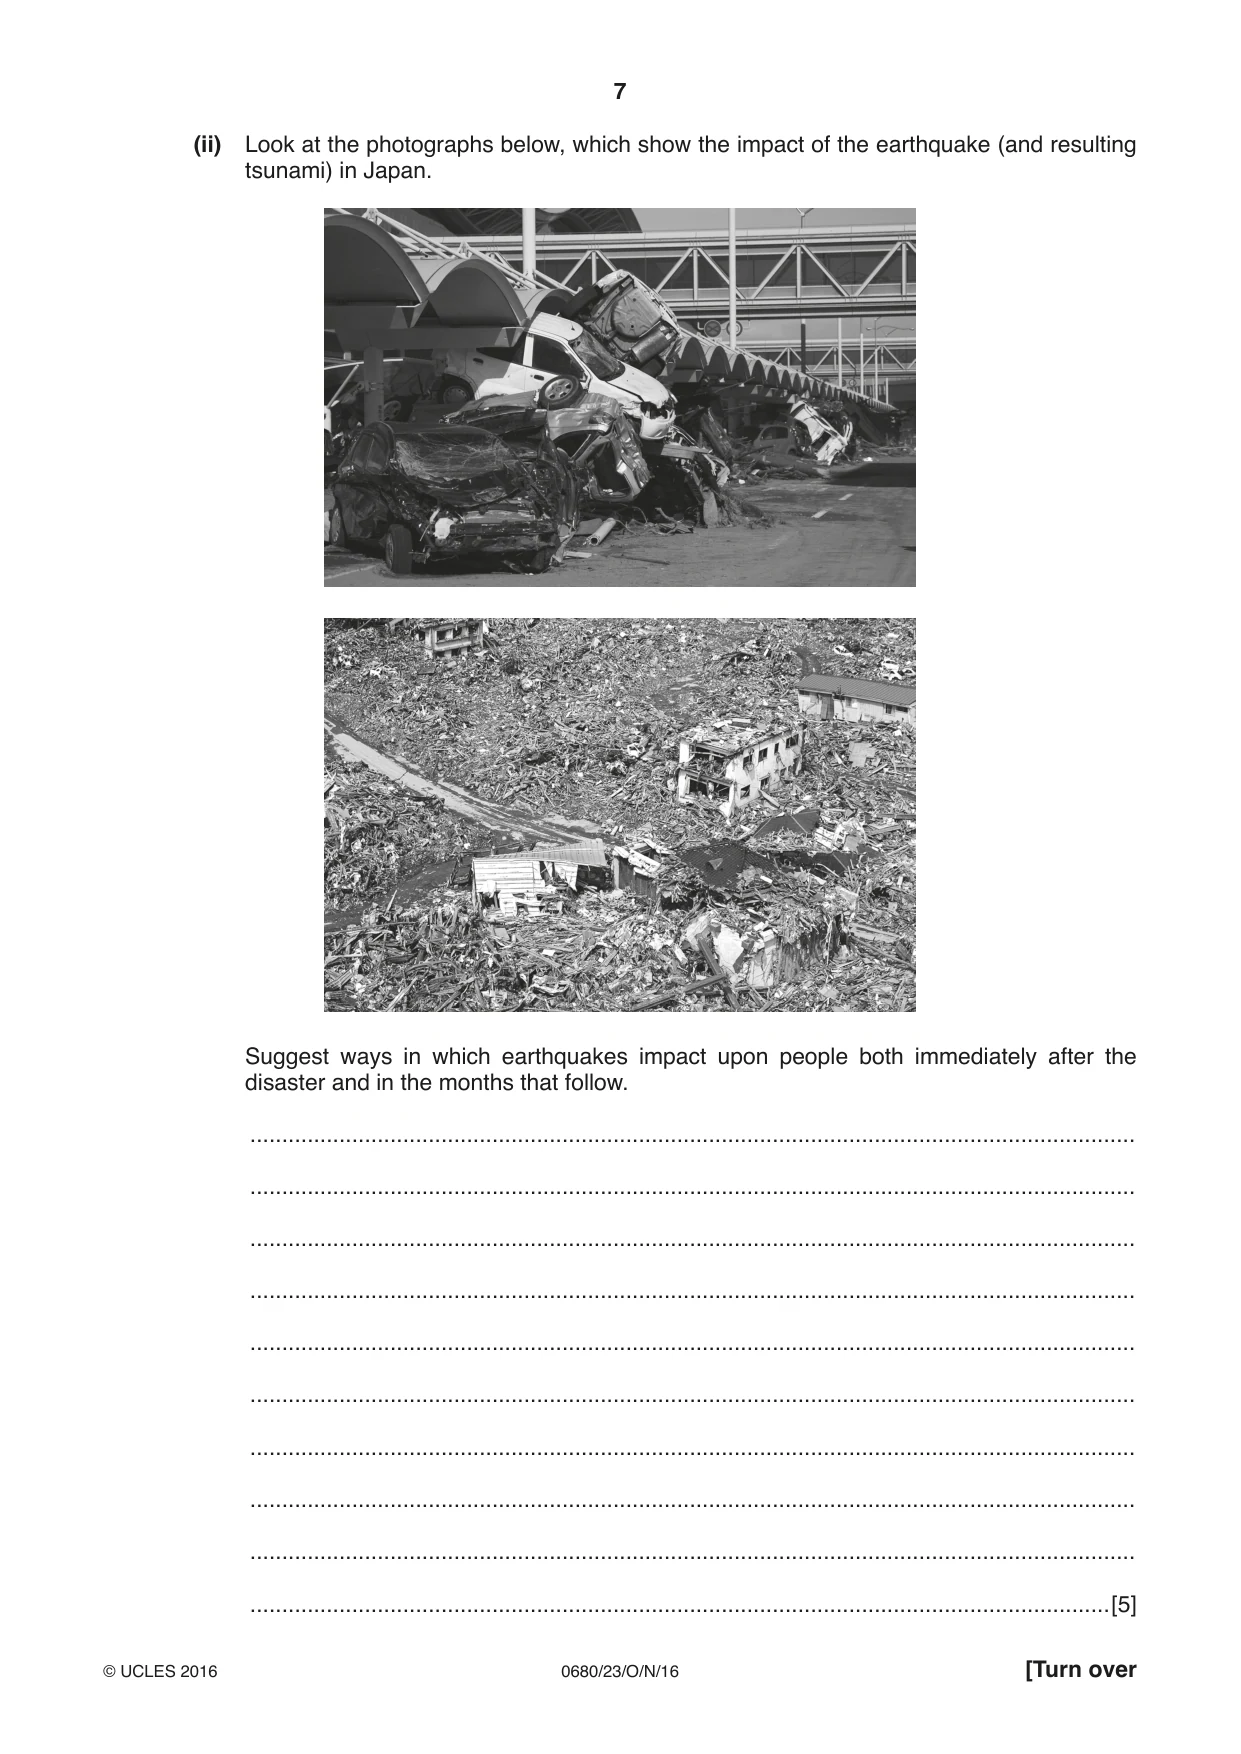
7 0680/23/O/N/16 © UCLES 2016 [Turn over (ii) Look at the photographs below, which show the impact of the earthquake (and resulting tsunami) in Japan. Suggest ways in which earthquakes impact upon people both immediately after the disaster and in the months that follow. … … … … … … … … … …[5]
Question paper, page 8
8 0680/23/O/N/16 © UCLES 2016 (d) (i) Read the information below about river flooding in the United States of America. In April and May 2011 the Mississippi River flooded. This was caused by storms with very heavy rainfall in the area around the Mississippi River. The heavy rainfall came at the same time as the spring snow-melt. Thousands of homes had to be evacuated. A large channel was opened allowing water to flow from the river onto the surrounding land, flooding 12 000 square kilometres. This strategy meant that cities close to the Mississippi River were saved from the worst of the flooding. Complete the table below with one example of each. [3] river Mississippi cause of flooding … impact … how managed … date April and May 2011 country United States of America (ii) Explain how deforestation can increase the risk of river flooding. … … … … … … … …[4]
Question paper, page 9
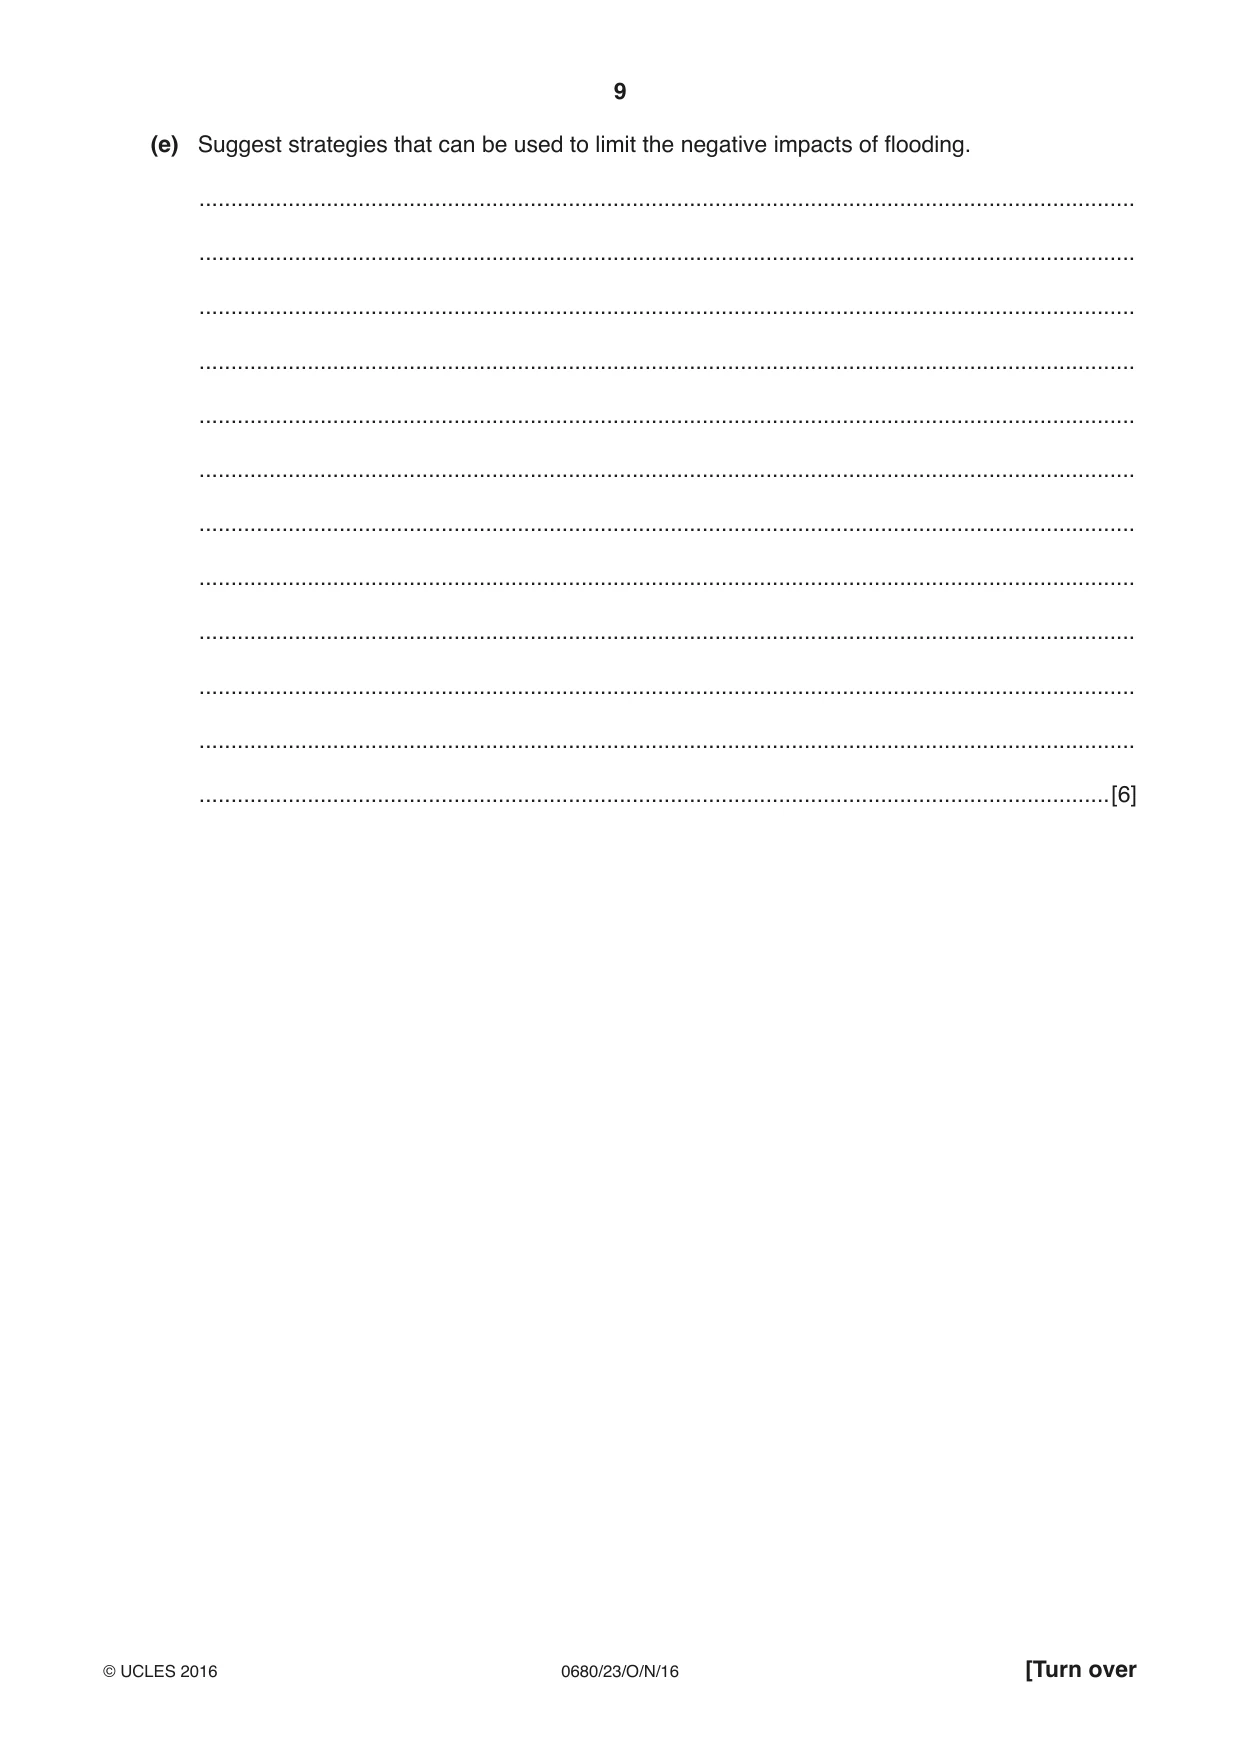
9 0680/23/O/N/16 © UCLES 2016 [Turn over (e) Suggest strategies that can be used to limit the negative impacts of flooding. … … … … … … … … … … … …[6]
Question paper, page 10
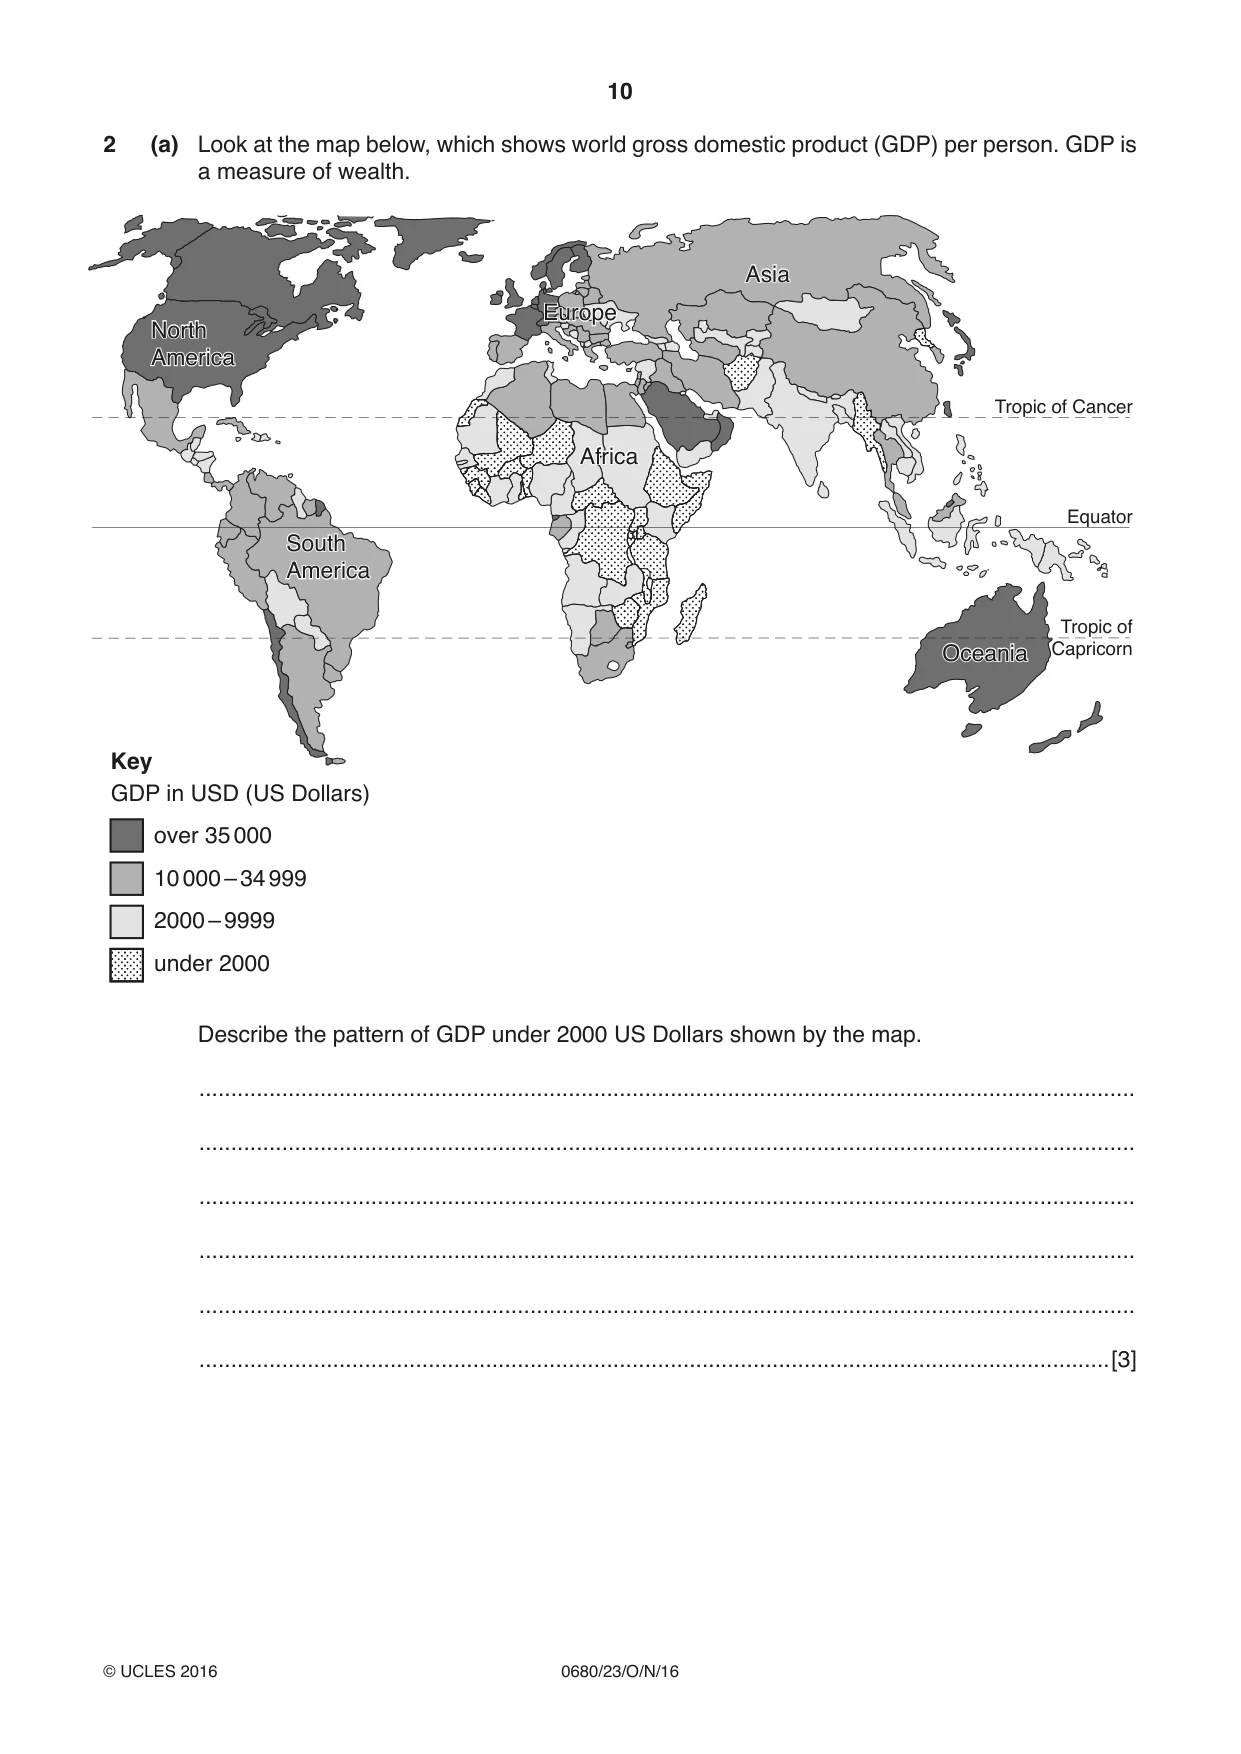
10 0680/23/O/N/16 © UCLES 2016 2 (a) Look at the map below, which shows world gross domestic product (GDP) per person. GDP is a measure of wealth. Oceania Oceania Asia Asia Africa Africa Europe Europe North America North America South America South America Tropic of Cancer Equator Tropic of Capricorn Key over 35 000 GDP in USD (US Dollars) 10 000 – 34 999 2000 – 9999 under 2000 Describe the pattern of GDP under 2000 US Dollars shown by the map. … … … … … …[3]
Question paper, page 11
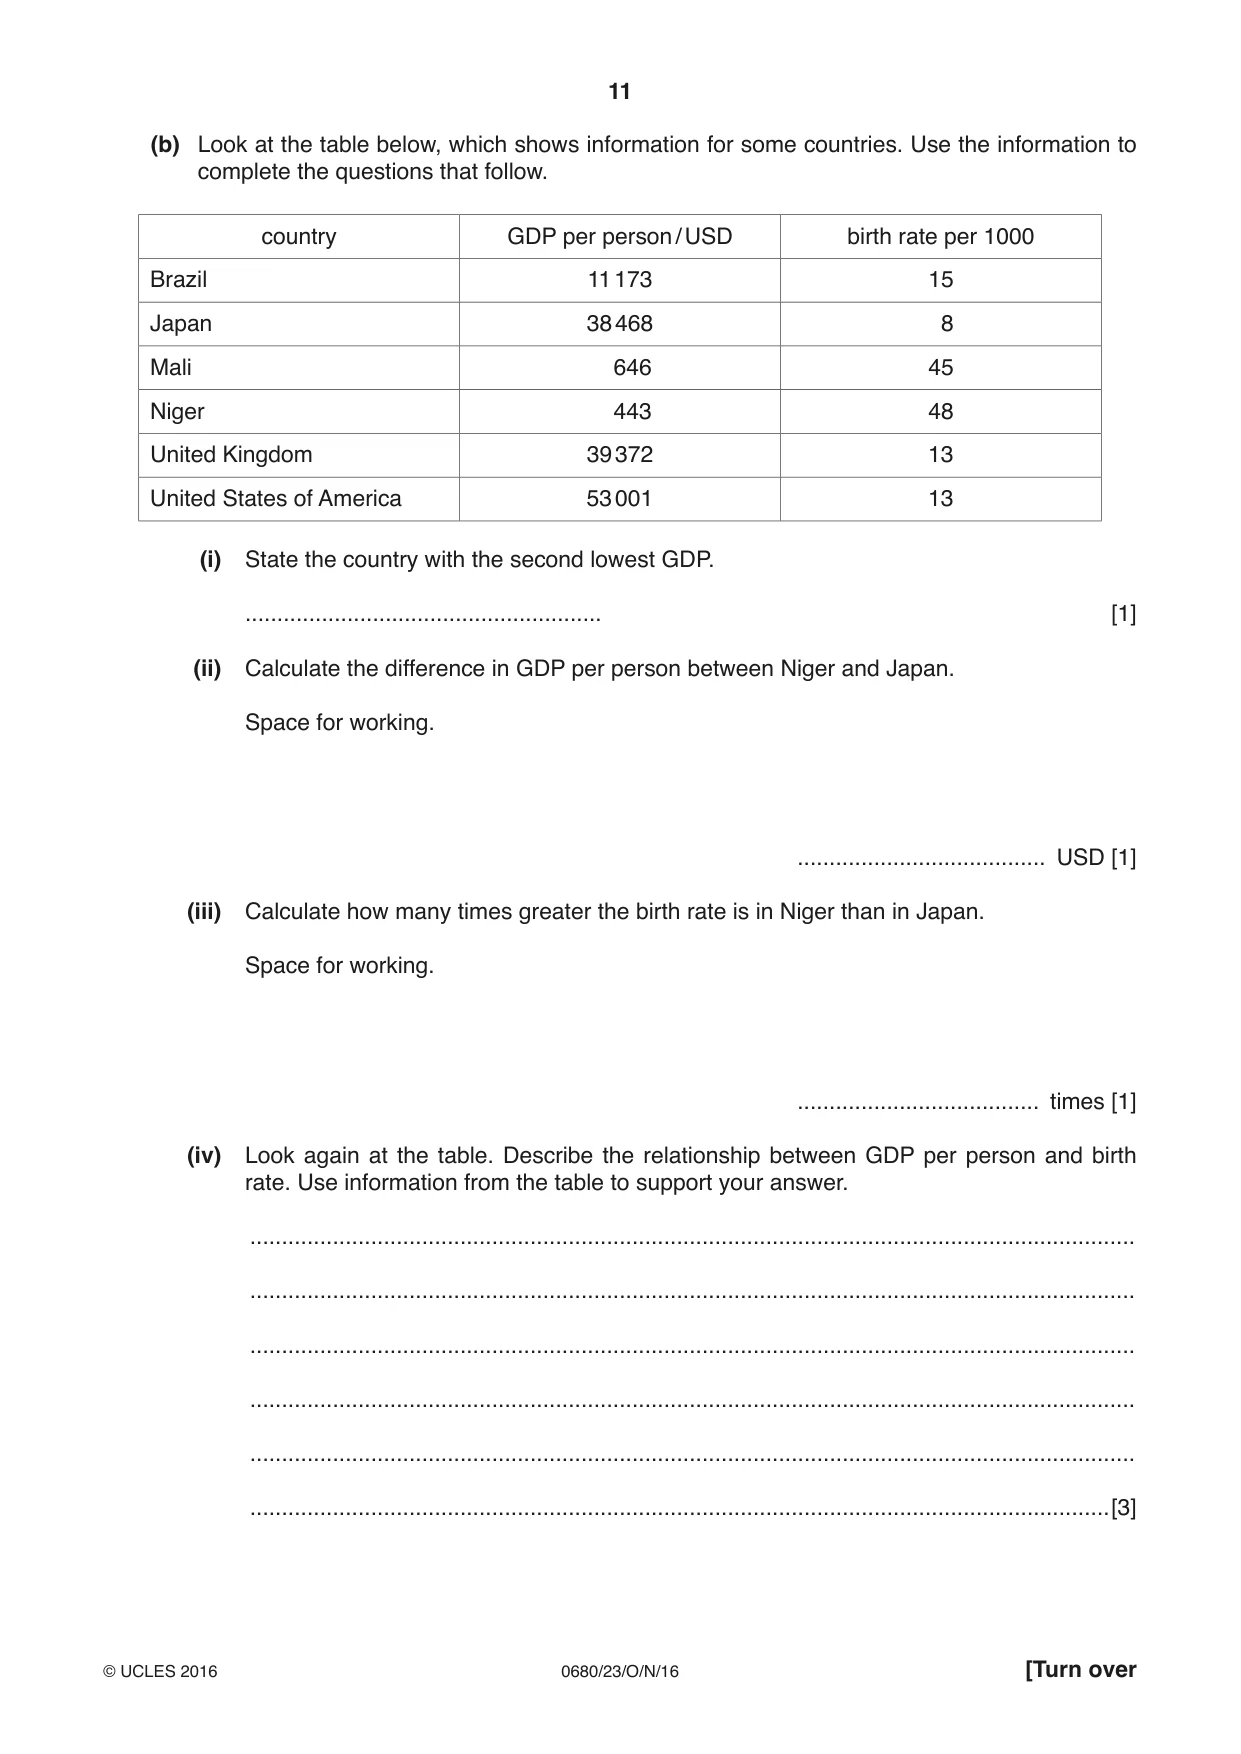
11 0680/23/O/N/16 © UCLES 2016 [Turn over (b) Look at the table below, which shows information for some countries. Use the information to complete the questions that follow. country GDP per person / USD birth rate per 1000 Brazil 11 173 15 Japan 38 468 8 Mali 646 45 Niger 443 48 United Kingdom 39 372 13 United States of America 53 001 13 (i) State the country with the second lowest GDP. … [1] (ii) Calculate the difference in GDP per person between Niger and Japan. Space for working. … USD [1] (iii) Calculate how many times greater the birth rate is in Niger than in Japan. Space for working. … times [1] (iv) Look again at the table. Describe the relationship between GDP per person and birth rate. Use information from the table to support your answer. … … … … … …[3]
Question paper, page 12
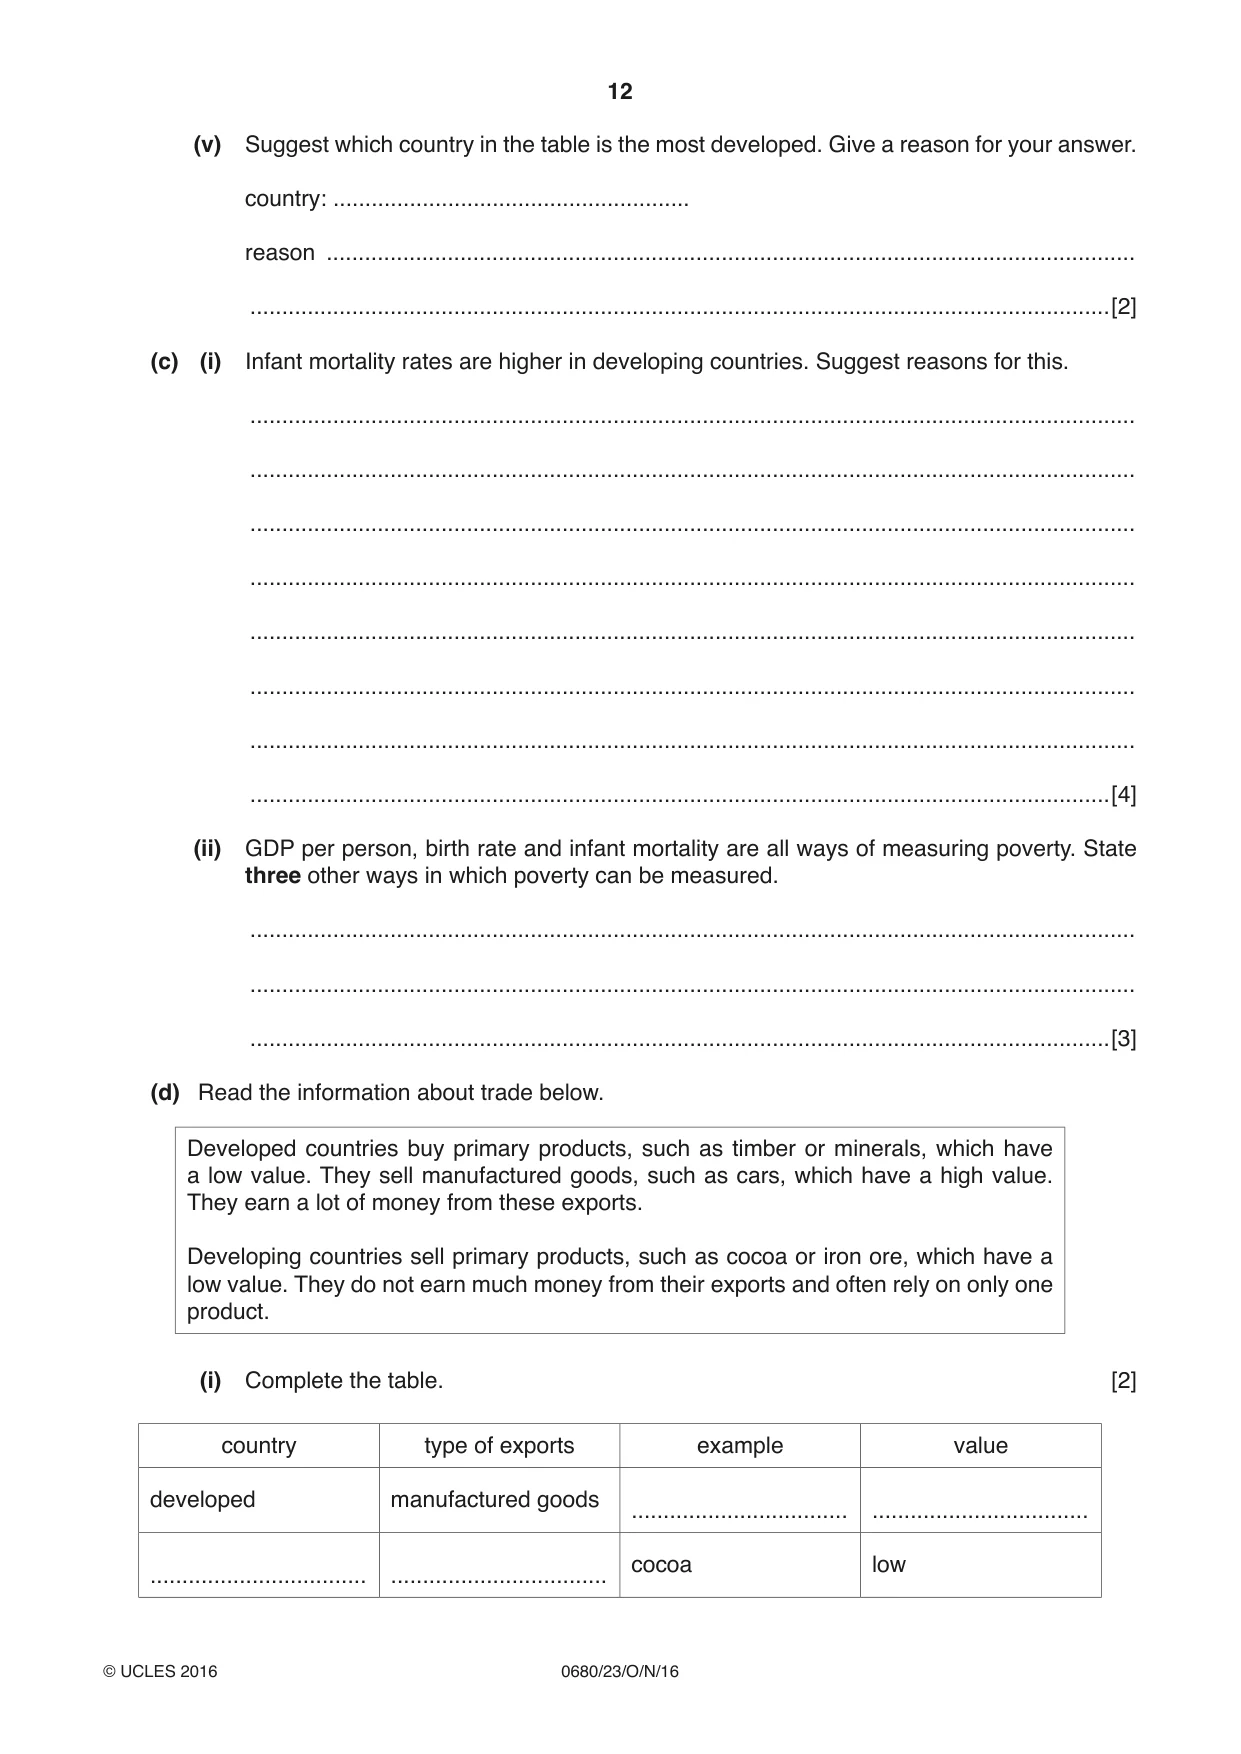
12 0680/23/O/N/16 © UCLES 2016 (v) Suggest which country in the table is the most developed. Give a reason for your answer. country: … reason … …[2] (c) (i) Infant mortality rates are higher in developing countries. Suggest reasons for this. … … … … … … … …[4] (ii) GDP per person, birth rate and infant mortality are all ways of measuring poverty. State three other ways in which poverty can be measured. … … …[3] (d) Read the information about trade below. Developed countries buy primary products, such as timber or minerals, which have a low value. They sell manufactured goods, such as cars, which have a high value. They earn a lot of money from these exports. Developing countries sell primary products, such as cocoa or iron ore, which have a low value. They do not earn much money from their exports and often rely on only one product. (i) Complete the table. [2] country type of exports example value developed manufactured goods … … … … cocoa low
Question paper, page 13
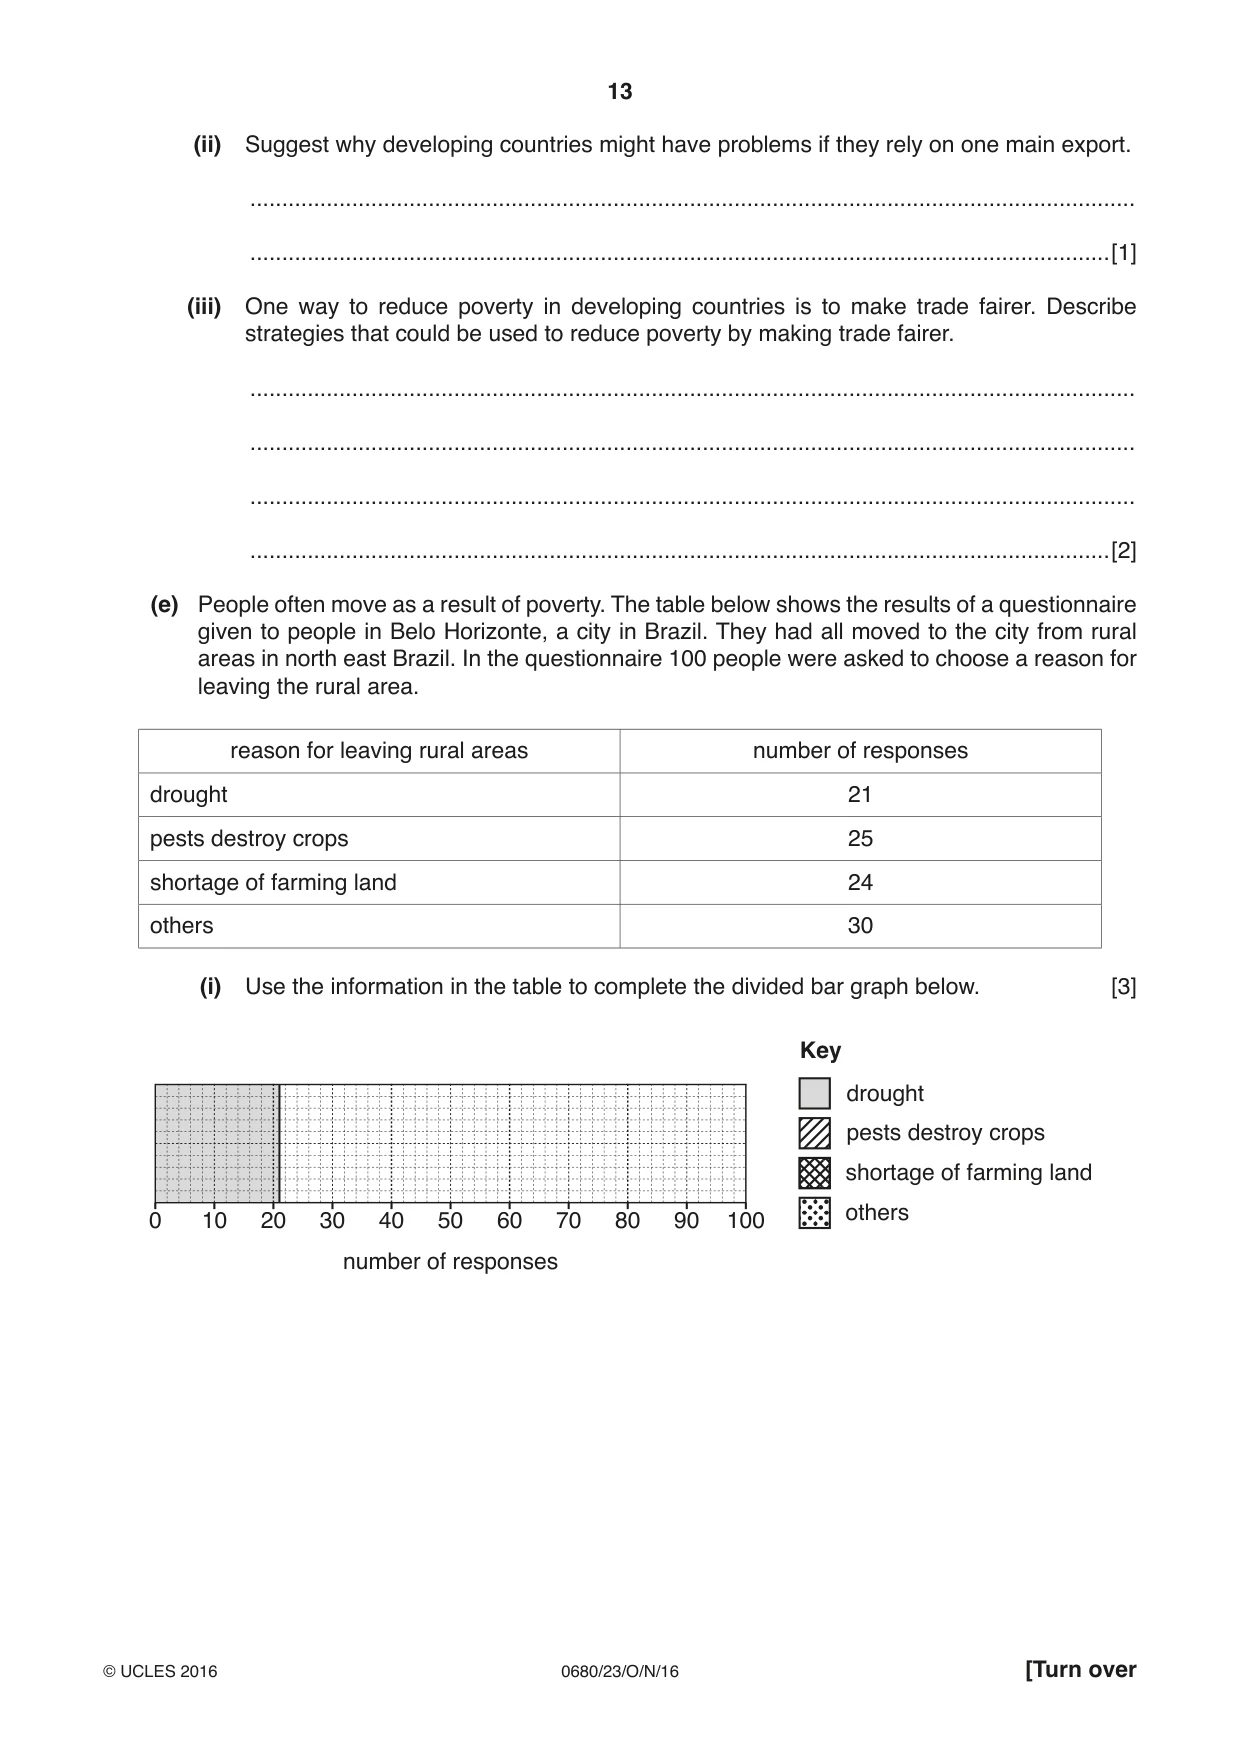
13 0680/23/O/N/16 © UCLES 2016 [Turn over (ii) Suggest why developing countries might have problems if they rely on one main export. … …[1] (iii) One way to reduce poverty in developing countries is to make trade fairer. Describe strategies that could be used to reduce poverty by making trade fairer. … … … …[2] (e) People often move as a result of poverty. The table below shows the results of a questionnaire given to people in Belo Horizonte, a city in Brazil. They had all moved to the city from rural areas in north east Brazil. In the questionnaire 100 people were asked to choose a reason for leaving the rural area. reason for leaving rural areas number of responses drought 21 pests destroy crops 25 shortage of farming land 24 others 30 (i) Use the information in the table to complete the divided bar graph below. [3] Key drought pests destroy crops shortage of farming land others 0 10 20 30 40 50 60 70 80 90 100 number of responses
Question paper, page 14
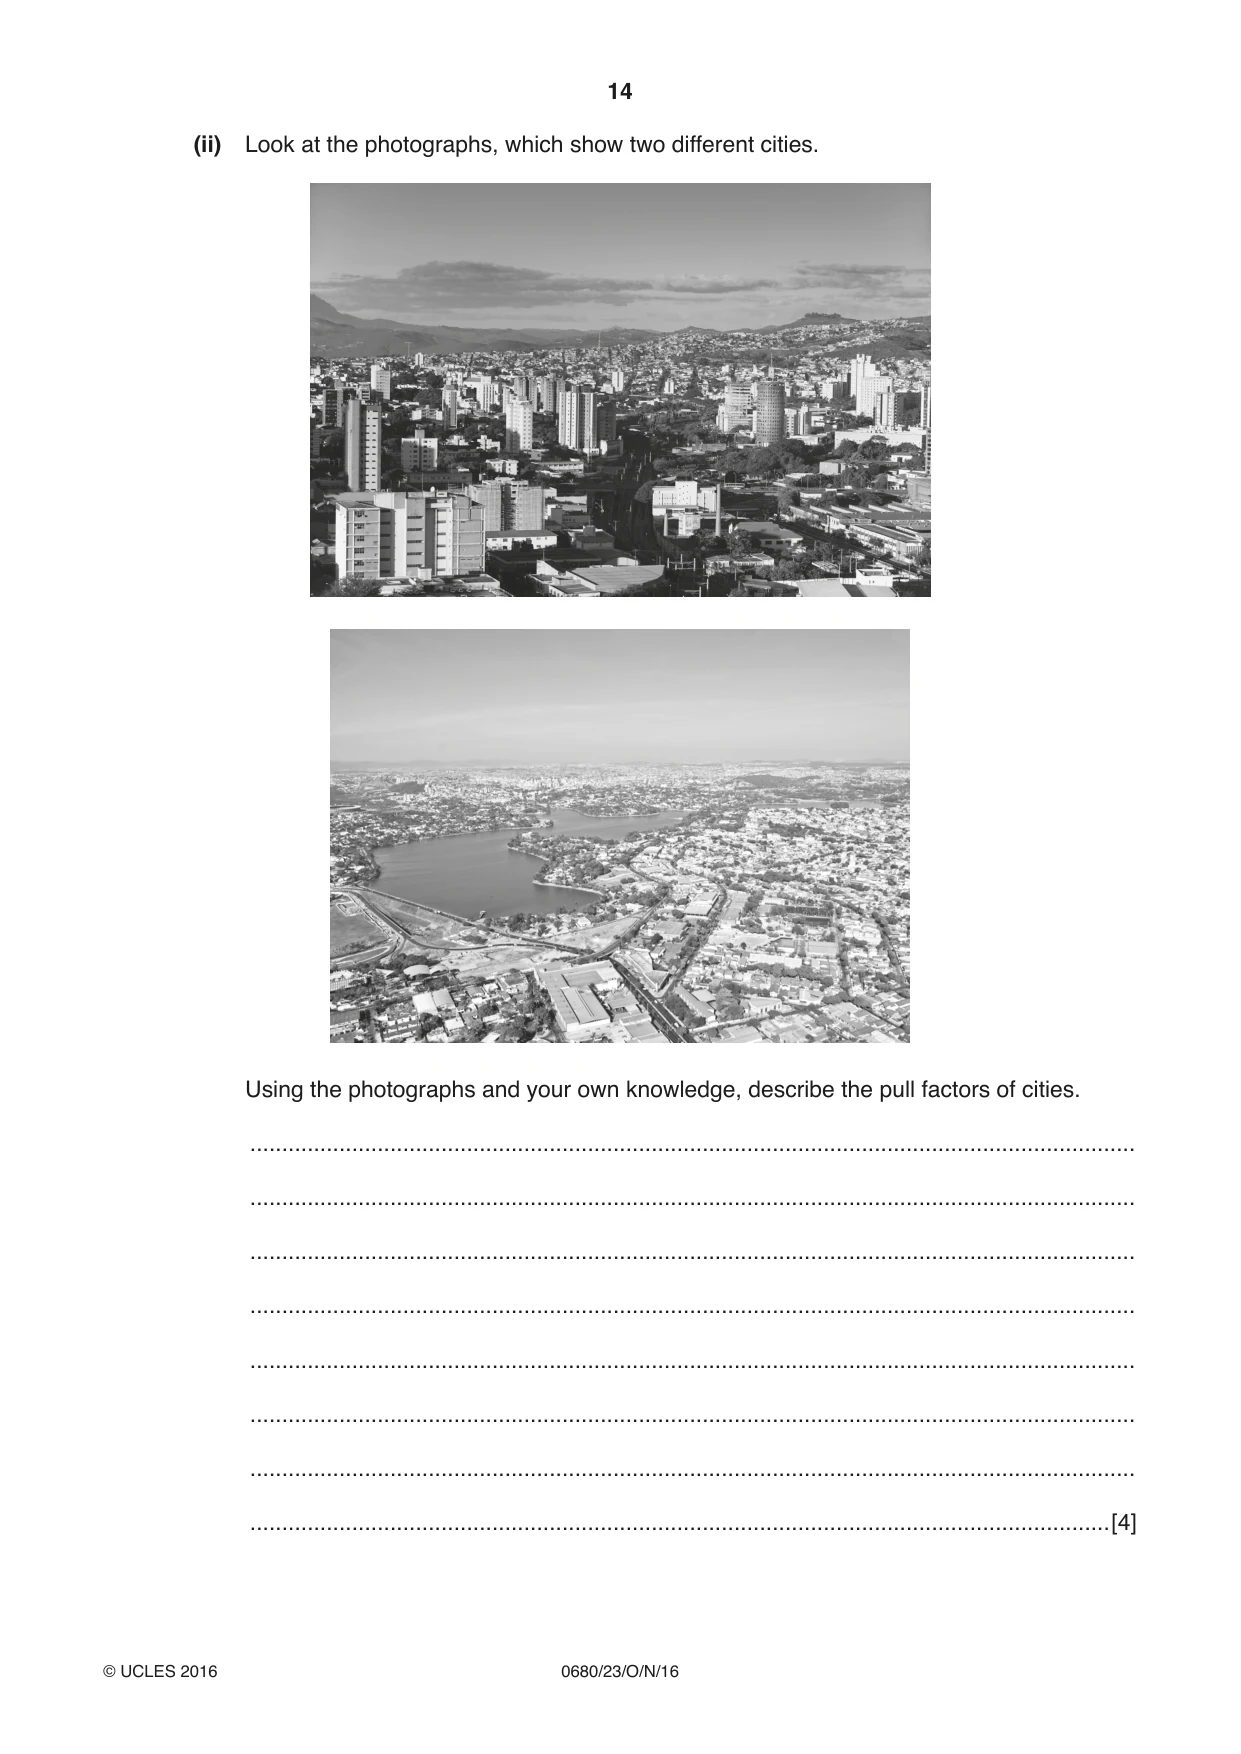
14 0680/23/O/N/16 © UCLES 2016 (ii) Look at the photographs, which show two different cities. Using the photographs and your own knowledge, describe the pull factors of cities. … … … … … … … …[4]
Question paper, page 15
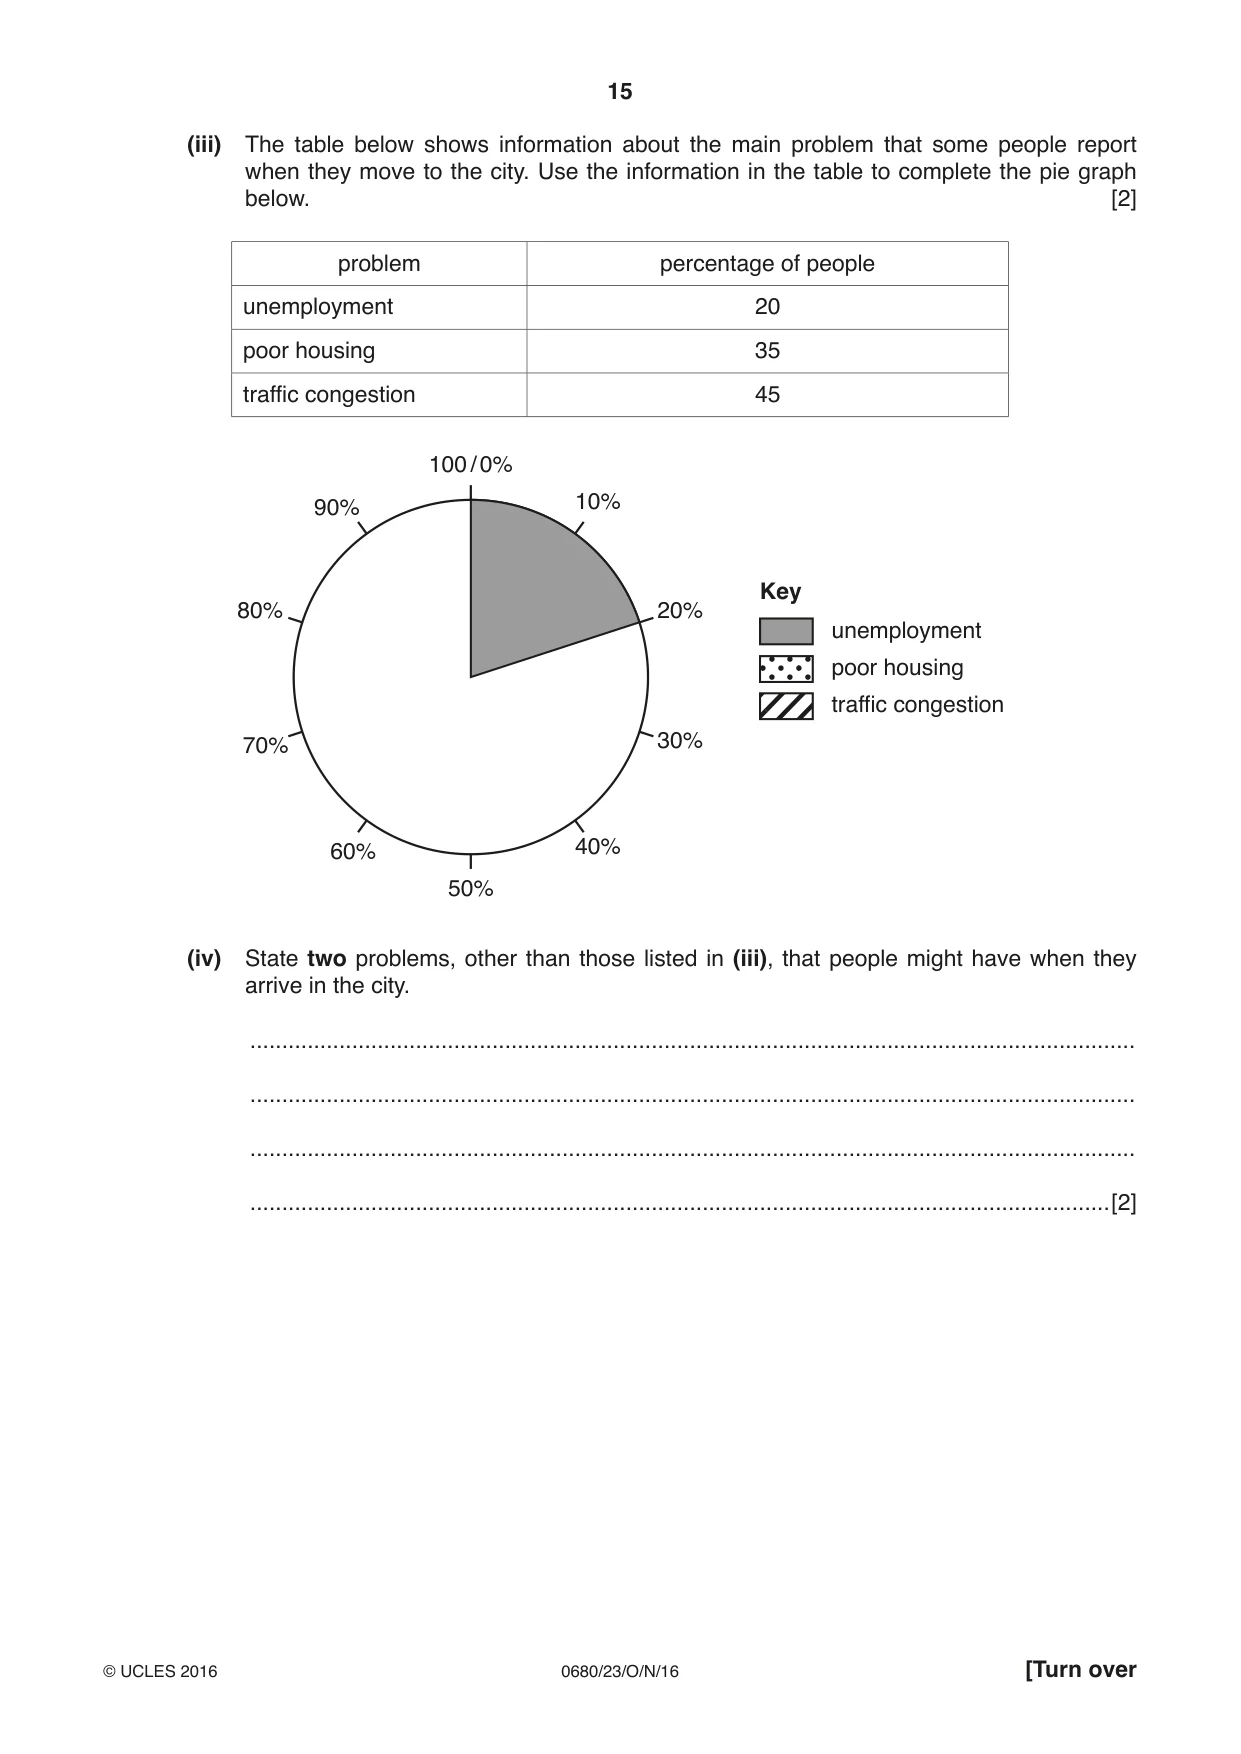
15 0680/23/O/N/16 © UCLES 2016 [Turn over (iii) The table below shows information about the main problem that some people report when they move to the city. Use the information in the table to complete the pie graph below. [2] problem percentage of people unemployment 20 poor housing 35 traffic congestion 45 100 / 0% 10% 20% 30% 40% 50% 60% 70% 80% 90% Key unemployment poor housing traffic congestion (iv) State two problems, other than those listed in (iii), that people might have when they arrive in the city. … … … …[2]
Question paper, page 16
16 0680/23/O/N/16 © UCLES 2016 (f) ‘Food supply should be increased to reduce poverty even though this puts the environment at risk.’ Explain why some people will agree with this statement but others will disagree. … … … … … … … … … … … …[6] Permission to reproduce items where third-party owned material protected by copyright is included has been sought and cleared where possible. Every reasonable effort has been made by the publisher (UCLES) to trace copyright holders, but if any items requiring clearance have unwittingly been included, the publisher will be pleased to make amends at the earliest possible opportunity. To avoid the issue of disclosure of answer-related information to candidates, all copyright acknowledgements are reproduced online in the Cambridge International Examinations Copyright Acknowledgements Booklet. This is produced for each series of examinations and is freely available to download at www.cie.org.uk after the live examination series. Cambridge International Examinations is part of the Cambridge Assessment Group. Cambridge Assessment is the brand name of University of Cambridge Local Examinations Syndicate (UCLES), which is itself a department of the University of Cambridge.
Mark scheme, page 1
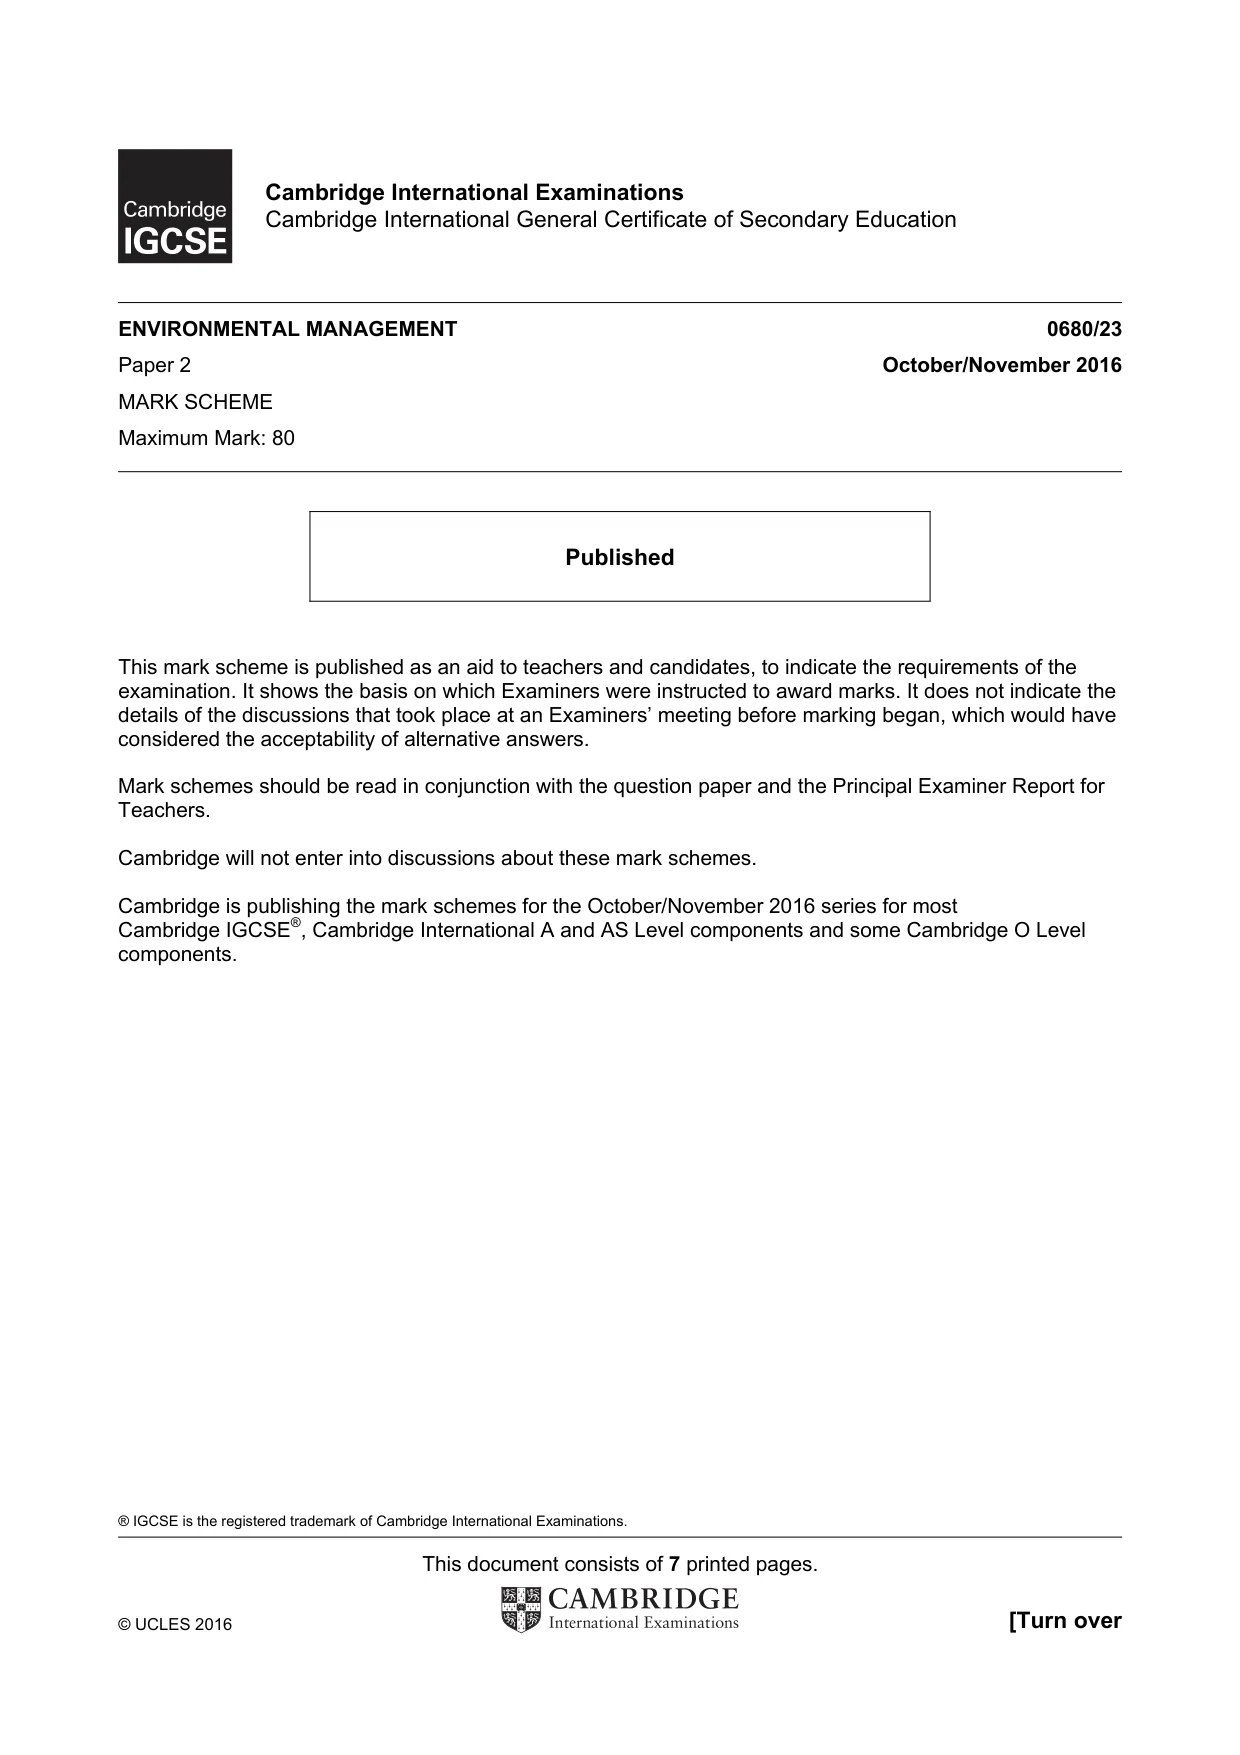
® IGCSE is the registered trademark of Cambridge International Examinations. This document consists of 7 printed pages. © UCLES 2016 [Turn over Cambridge International Examinations Cambridge International General Certificate of Secondary Education ENVIRONMENTAL MANAGEMENT 0680/23 Paper 2 October/November 2016 MARK SCHEME Maximum Mark: 80 Published This mark scheme is published as an aid to teachers and candidates, to indicate the requirements of the examination. It shows the basis on which Examiners were instructed to award marks. It does not indicate the details of the discussions that took place at an Examiners’ meeting before marking began, which would have considered the acceptability of alternative answers. Mark schemes should be read in conjunction with the question paper and the Principal Examiner Report for Teachers. Cambridge will not enter into discussions about these mark schemes. Cambridge is publishing the mark schemes for the October/November 2016 series for most Cambridge IGCSE®, Cambridge International A and AS Level components and some Cambridge O Level components.
Mark scheme, page 2
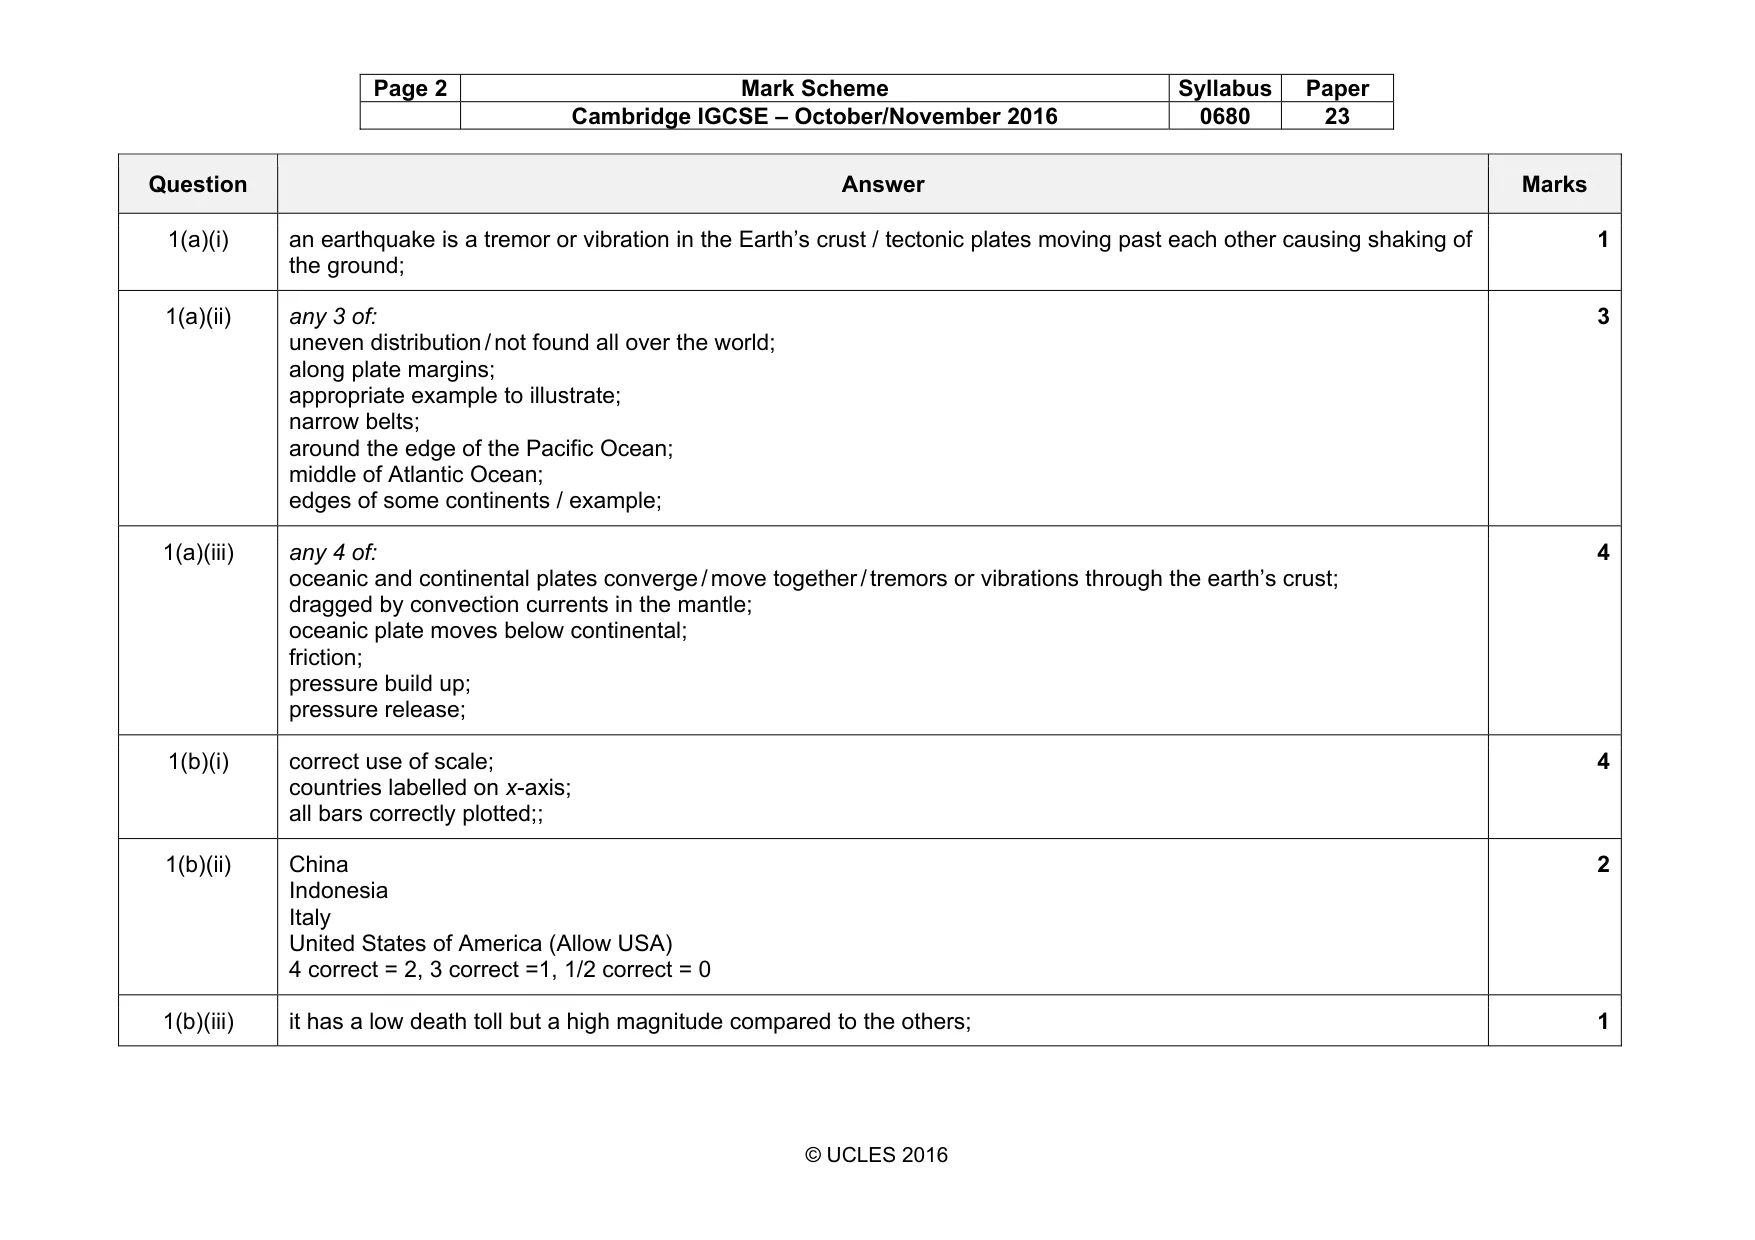
Page 2 Mark Scheme Syllabus Paper Cambridge IGCSE – October/November 2016 0680 23 © UCLES 2016 Question Answer Marks 1(a)(i) an earthquake is a tremor or vibration in the Earth’s crust / tectonic plates moving past each other causing shaking of the ground; 1 1(a)(ii) any 3 of: uneven distribution / not found all over the world; along plate margins; appropriate example to illustrate; narrow belts; around the edge of the Pacific Ocean; middle of Atlantic Ocean; edges of some continents / example; 3 1(a)(iii) any 4 of: oceanic and continental plates converge / move together / tremors or vibrations through the earth’s crust; dragged by convection currents in the mantle; oceanic plate moves below continental; friction; pressure build up; pressure release; 4 1(b)(i) correct use of scale; countries labelled on x-axis; all bars correctly plotted;; 4 1(b)(ii) China Indonesia Italy United States of America (Allow USA) 4 correct = 2, 3 correct =1, 1/2 correct = 0 2 1(b)(iii) it has a low death toll but a high magnitude compared to the others; 1
Mark scheme, page 3
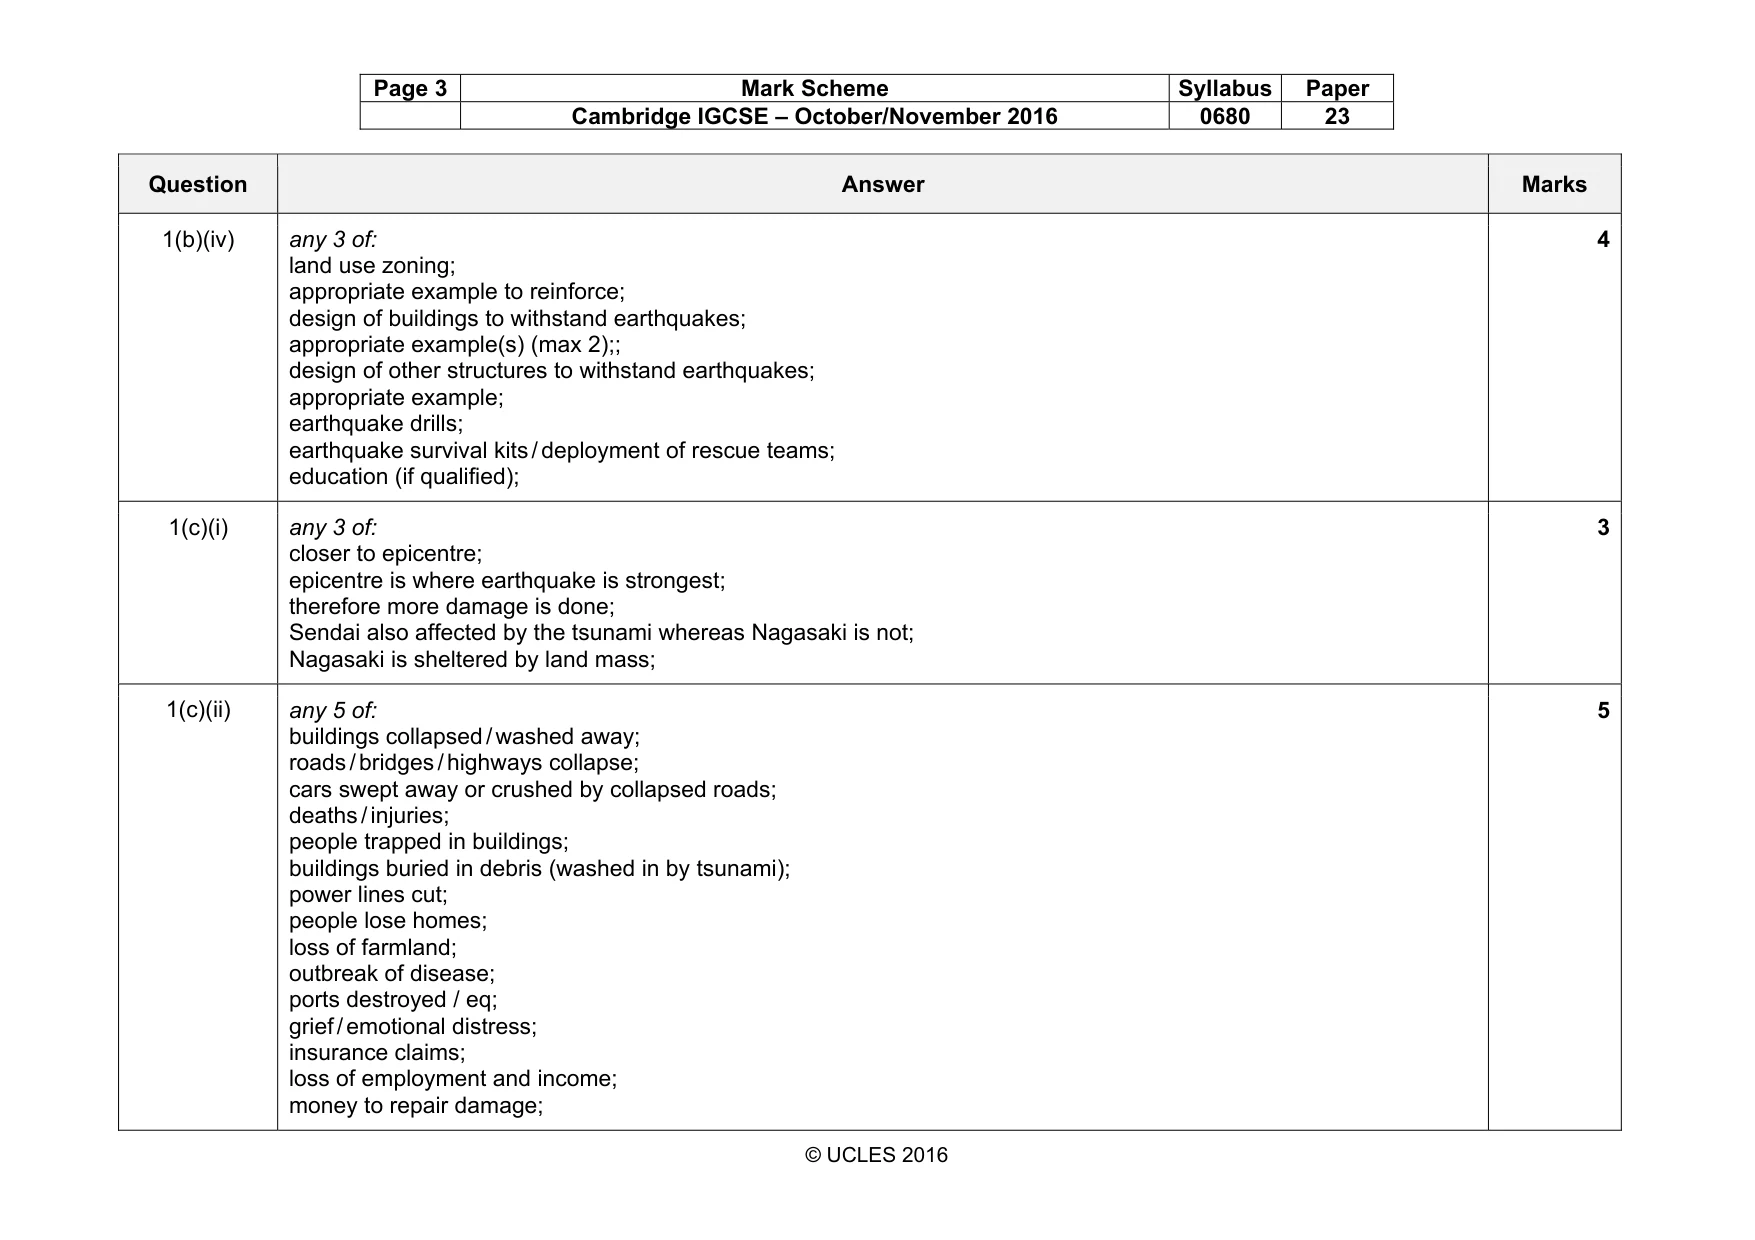
Page 3 Mark Scheme Syllabus Paper Cambridge IGCSE – October/November 2016 0680 23 © UCLES 2016 Question Answer Marks 1(b)(iv) any 3 of: land use zoning; appropriate example to reinforce; design of buildings to withstand earthquakes; appropriate example(s) (max 2);; design of other structures to withstand earthquakes; appropriate example; earthquake drills; earthquake survival kits / deployment of rescue teams; education (if qualified); 4 1(c)(i) any 3 of: closer to epicentre; epicentre is where earthquake is strongest; therefore more damage is done; Sendai also affected by the tsunami whereas Nagasaki is not; Nagasaki is sheltered by land mass; 3 1(c)(ii) any 5 of: buildings collapsed / washed away; roads / bridges / highways collapse; cars swept away or crushed by collapsed roads; deaths / injuries; people trapped in buildings; buildings buried in debris (washed in by tsunami); power lines cut; people lose homes; loss of farmland; outbreak of disease; ports destroyed / eq; grief / emotional distress; insurance claims; loss of employment and income; money to repair damage; 5
Mark scheme, page 4
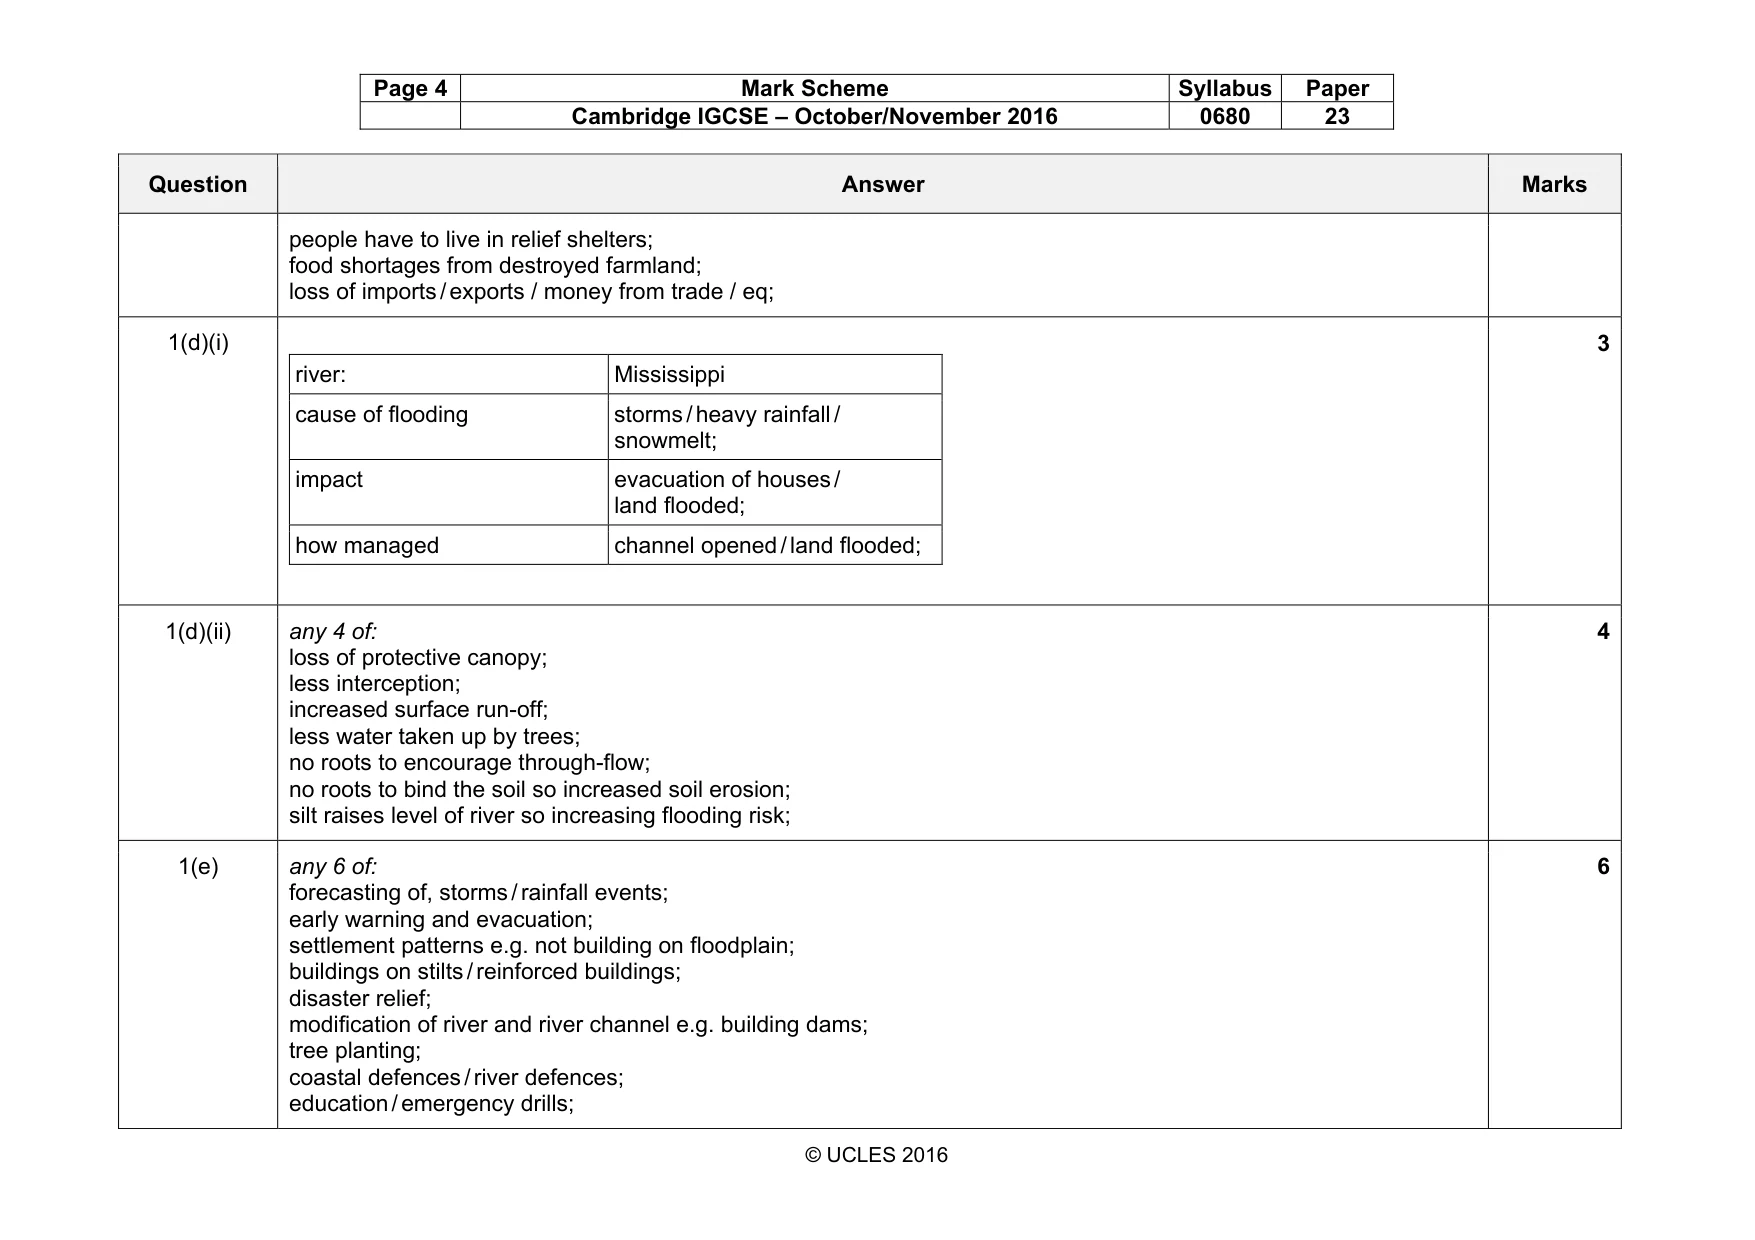
Page 4 Mark Scheme Syllabus Paper Cambridge IGCSE – October/November 2016 0680 23 © UCLES 2016 Question Answer Marks people have to live in relief shelters; food shortages from destroyed farmland; loss of imports / exports / money from trade / eq; 1(d)(i) river: Mississippi cause of flooding storms / heavy rainfall / snowmelt; impact evacuation of houses / land flooded; how managed channel opened / land flooded; 3 1(d)(ii) any 4 of: loss of protective canopy; less interception; increased surface run-off; less water taken up by trees; no roots to encourage through-flow; no roots to bind the soil so increased soil erosion; silt raises level of river so increasing flooding risk; 4 1(e) any 6 of: forecasting of, storms / rainfall events; early warning and evacuation; settlement patterns e.g. not building on floodplain; buildings on stilts / reinforced buildings; disaster relief; modification of river and river channel e.g. building dams; tree planting; coastal defences / river defences; education / emergency drills; 6
Mark scheme, page 5
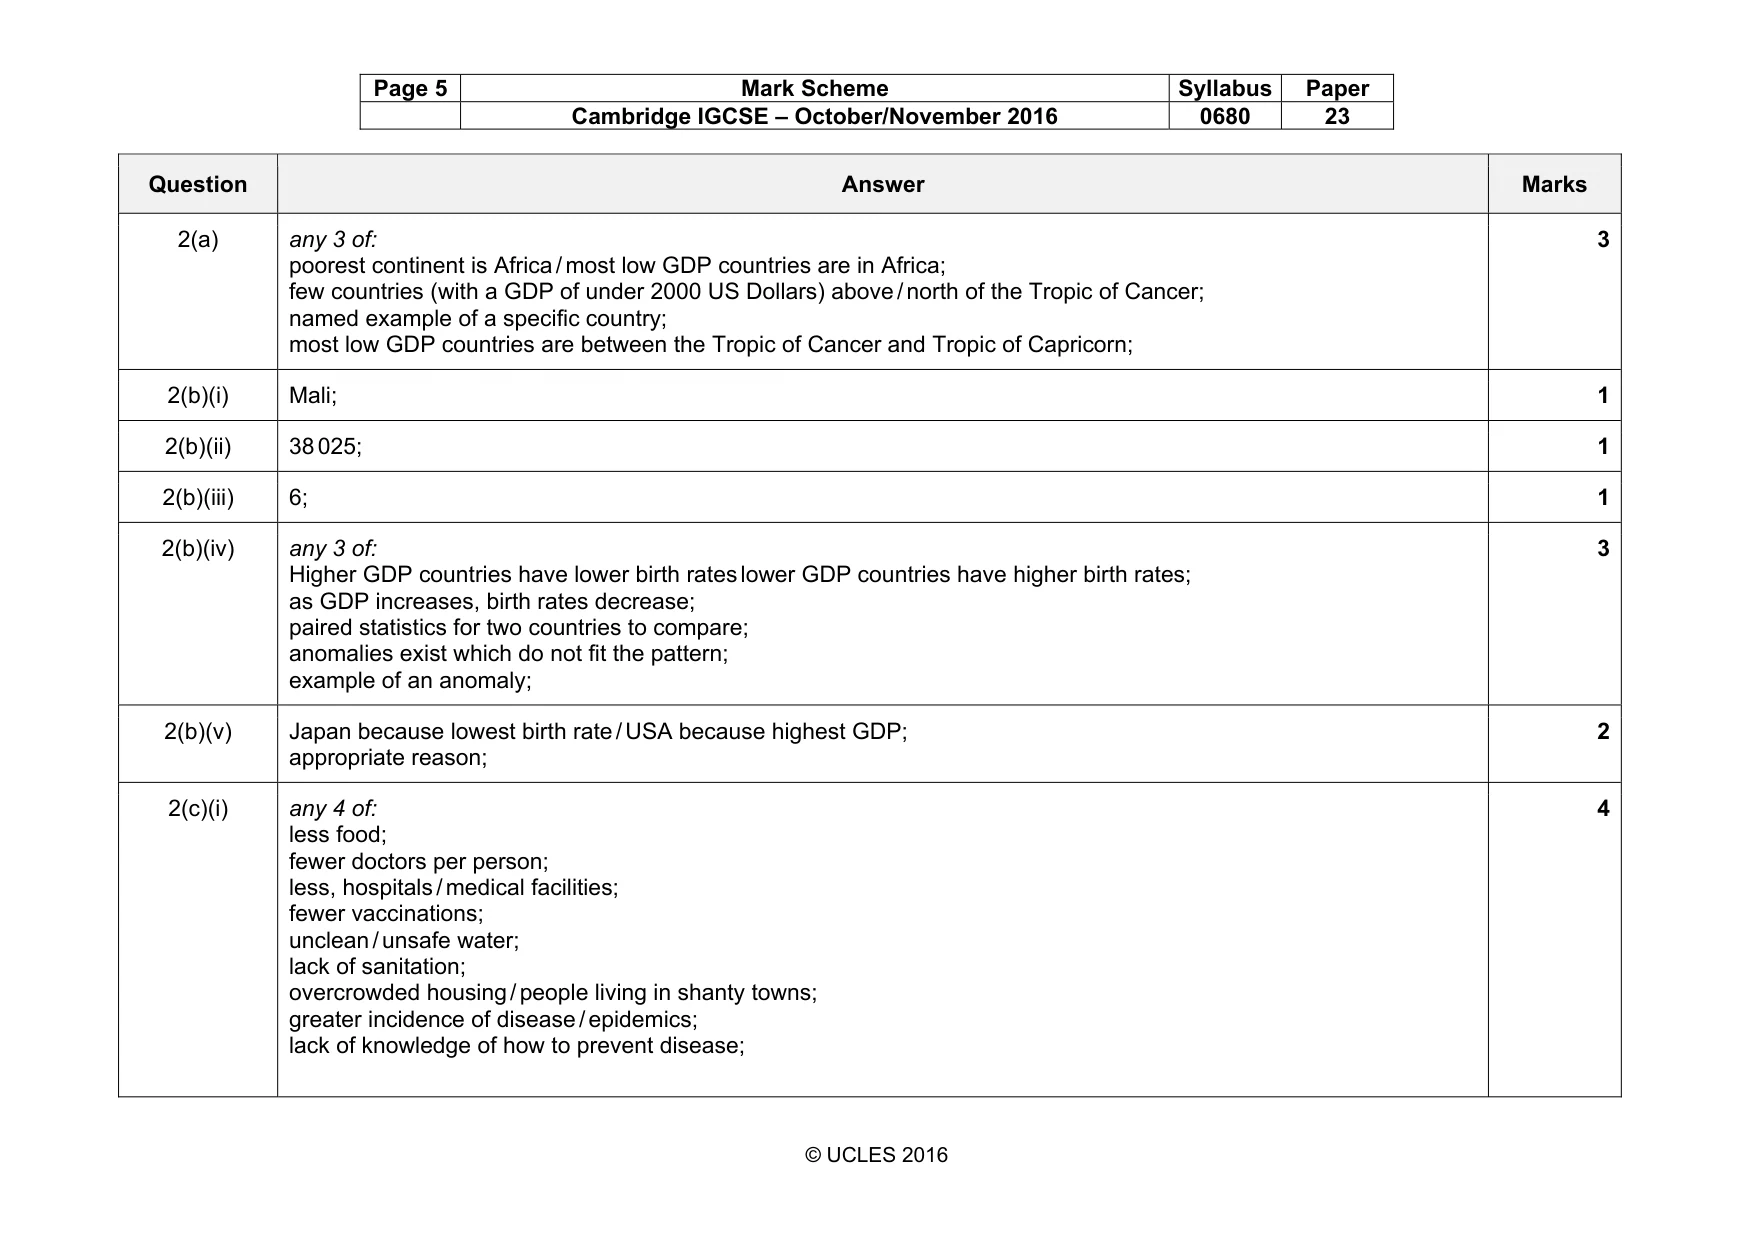
Page 5 Mark Scheme Syllabus Paper Cambridge IGCSE – October/November 2016 0680 23 © UCLES 2016 Question Answer Marks 2(a) any 3 of: poorest continent is Africa / most low GDP countries are in Africa; few countries (with a GDP of under 2000 US Dollars) above / north of the Tropic of Cancer; named example of a specific country; most low GDP countries are between the Tropic of Cancer and Tropic of Capricorn; 3 2(b)(i) Mali; 1 2(b)(ii) 38 025; 1 2(b)(iii) 6; 1 2(b)(iv) any 3 of: Higher GDP countries have lower birth rates lower GDP countries have higher birth rates; as GDP increases, birth rates decrease; paired statistics for two countries to compare; anomalies exist which do not fit the pattern; example of an anomaly; 3 2(b)(v) Japan because lowest birth rate / USA because highest GDP; appropriate reason; 2 2(c)(i) any 4 of: less food; fewer doctors per person; less, hospitals / medical facilities; fewer vaccinations; unclean / unsafe water; lack of sanitation; overcrowded housing / people living in shanty towns; greater incidence of disease / epidemics; lack of knowledge of how to prevent disease; 4
Mark scheme, page 6
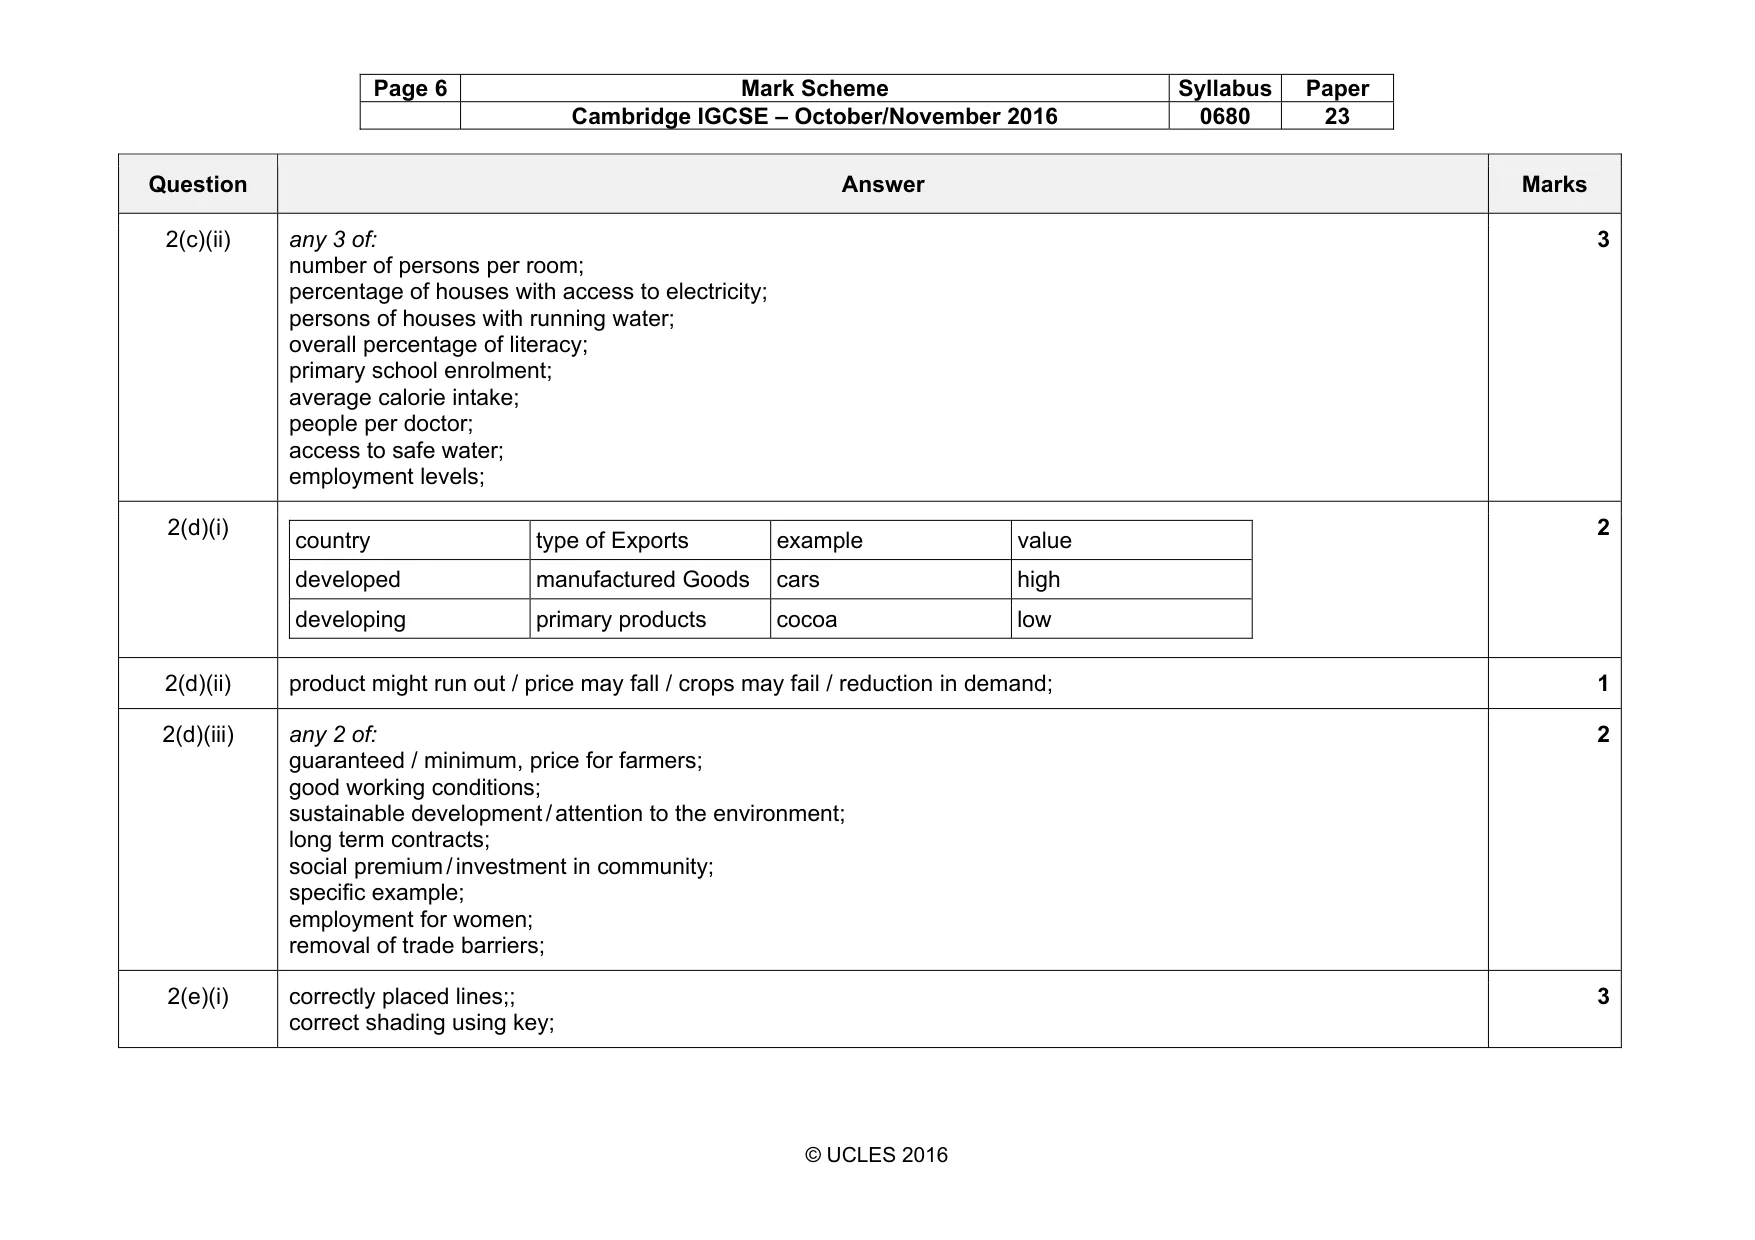
Page 6 Mark Scheme Syllabus Paper Cambridge IGCSE – October/November 2016 0680 23 © UCLES 2016 Question Answer Marks 2(c)(ii) any 3 of: number of persons per room; percentage of houses with access to electricity; persons of houses with running water; overall percentage of literacy; primary school enrolment; average calorie intake; people per doctor; access to safe water; employment levels; 3 2(d)(i) country type of Exports example value developed manufactured Goods cars high developing primary products cocoa low 2 2(d)(ii) product might run out / price may fall / crops may fail / reduction in demand; 1 2(d)(iii) any 2 of: guaranteed / minimum, price for farmers; good working conditions; sustainable development / attention to the environment; long term contracts; social premium / investment in community; specific example; employment for women; removal of trade barriers; 2 2(e)(i) correctly placed lines;; correct shading using key; 3
Mark scheme, page 7
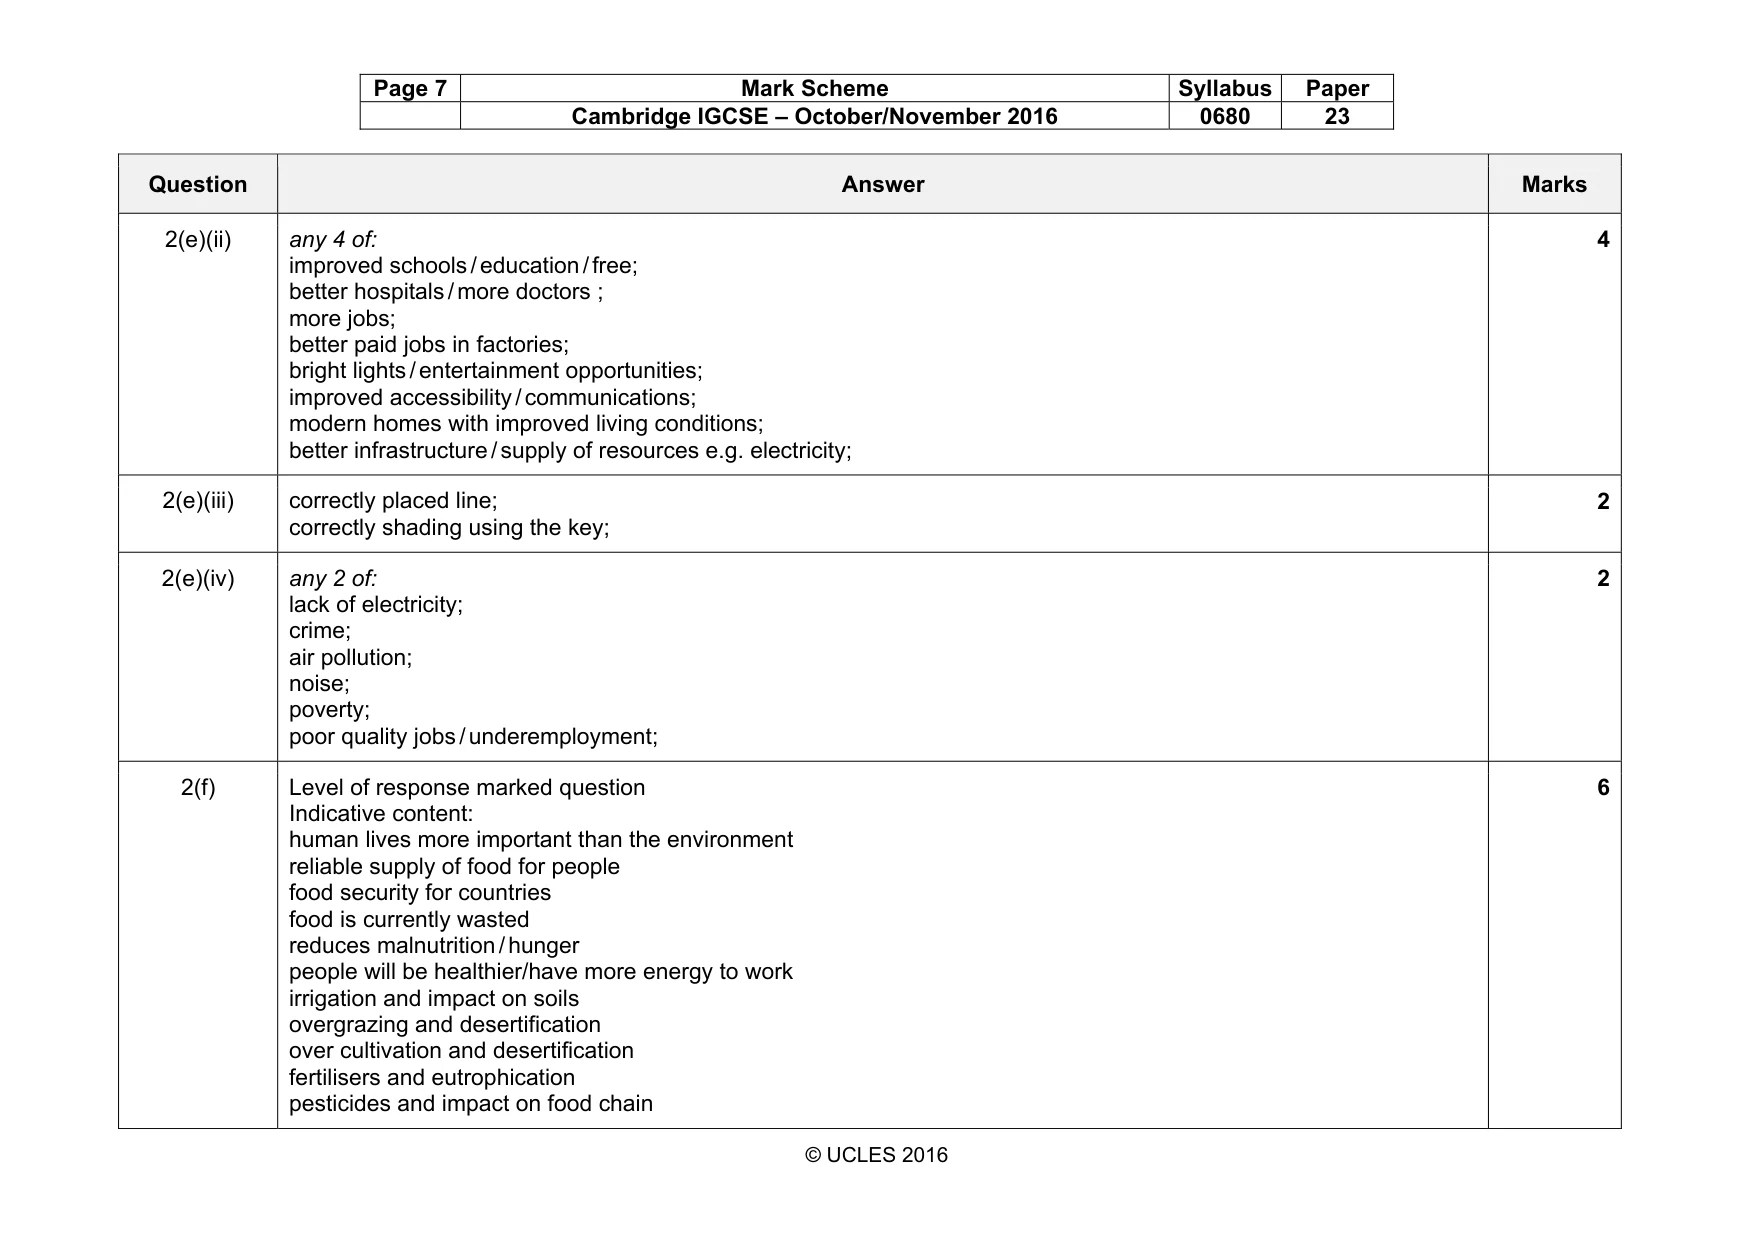
Page 7 Mark Scheme Syllabus Paper Cambridge IGCSE – October/November 2016 0680 23 © UCLES 2016 Question Answer Marks 2(e)(ii) any 4 of: improved schools / education / free; better hospitals / more doctors ; more jobs; better paid jobs in factories; bright lights / entertainment opportunities; improved accessibility / communications; modern homes with improved living conditions; better infrastructure / supply of resources e.g. electricity; 4 2(e)(iii) correctly placed line; correctly shading using the key; 2 2(e)(iv) any 2 of: lack of electricity; crime; air pollution; noise; poverty; poor quality jobs / underemployment; 2 2(f) Level of response marked question Indicative content: human lives more important than the environment reliable supply of food for people food security for countries food is currently wasted reduces malnutrition / hunger people will be healthier/have more energy to work irrigation and impact on soils overgrazing and desertification over cultivation and desertification fertilisers and eutrophication pesticides and impact on food chain 6
What you needed in this session
Cambridge’s own grade thresholds for 2016 Oct/Nov, Paper 2 · Variant 3. A higher threshold means an easier paper — the bar moves with how the cohort did.