Cambridge IGCSE Environmental Management 0680 — 2016 May/June Paper 2 · Variant 1
0680/21/M/J/16 · 80 marks · ≈90 min
The question paper and its mark scheme, free to read here and free to download. This is Cambridge’s own paper, exactly as it was sat.
Question paper16 pages

Mark scheme9 pages
Answers below. Sit the paper first if you are practising.
Paper as text
Question paper, page 1
This document consists of 14 printed pages and 2 blank pages. DC (LK/SW) 112797/5 © UCLES 2016 [Turn over Cambridge International Examinations Cambridge International General Certificate of Secondary Education * 2 0 7 4 0 8 4 5 8 9 * ENVIRONMENTAL MANAGEMENT 0680/21 Paper 2 May/June 2016 1 hour 45 minutes Candidates answer on the Question Paper. No Additional Materials are required. READ THESE INSTRUCTIONS FIRST Write your Centre number, candidate number and name on all the work you hand in. Write in dark blue or black pen. You may use an HB pencil for any diagrams or graphs. Do not use staples, paper clips, glue or correction fluid. DO NOT WRITE IN ANY BARCODES. Answer both questions. Electronic calculators may be used. You may lose marks if you do not show your working or if you do not use appropriate units. At the end of the examination, fasten all your work securely together. The number of marks is given in brackets [ ] at the end of each question or part question.
Question paper, page 2
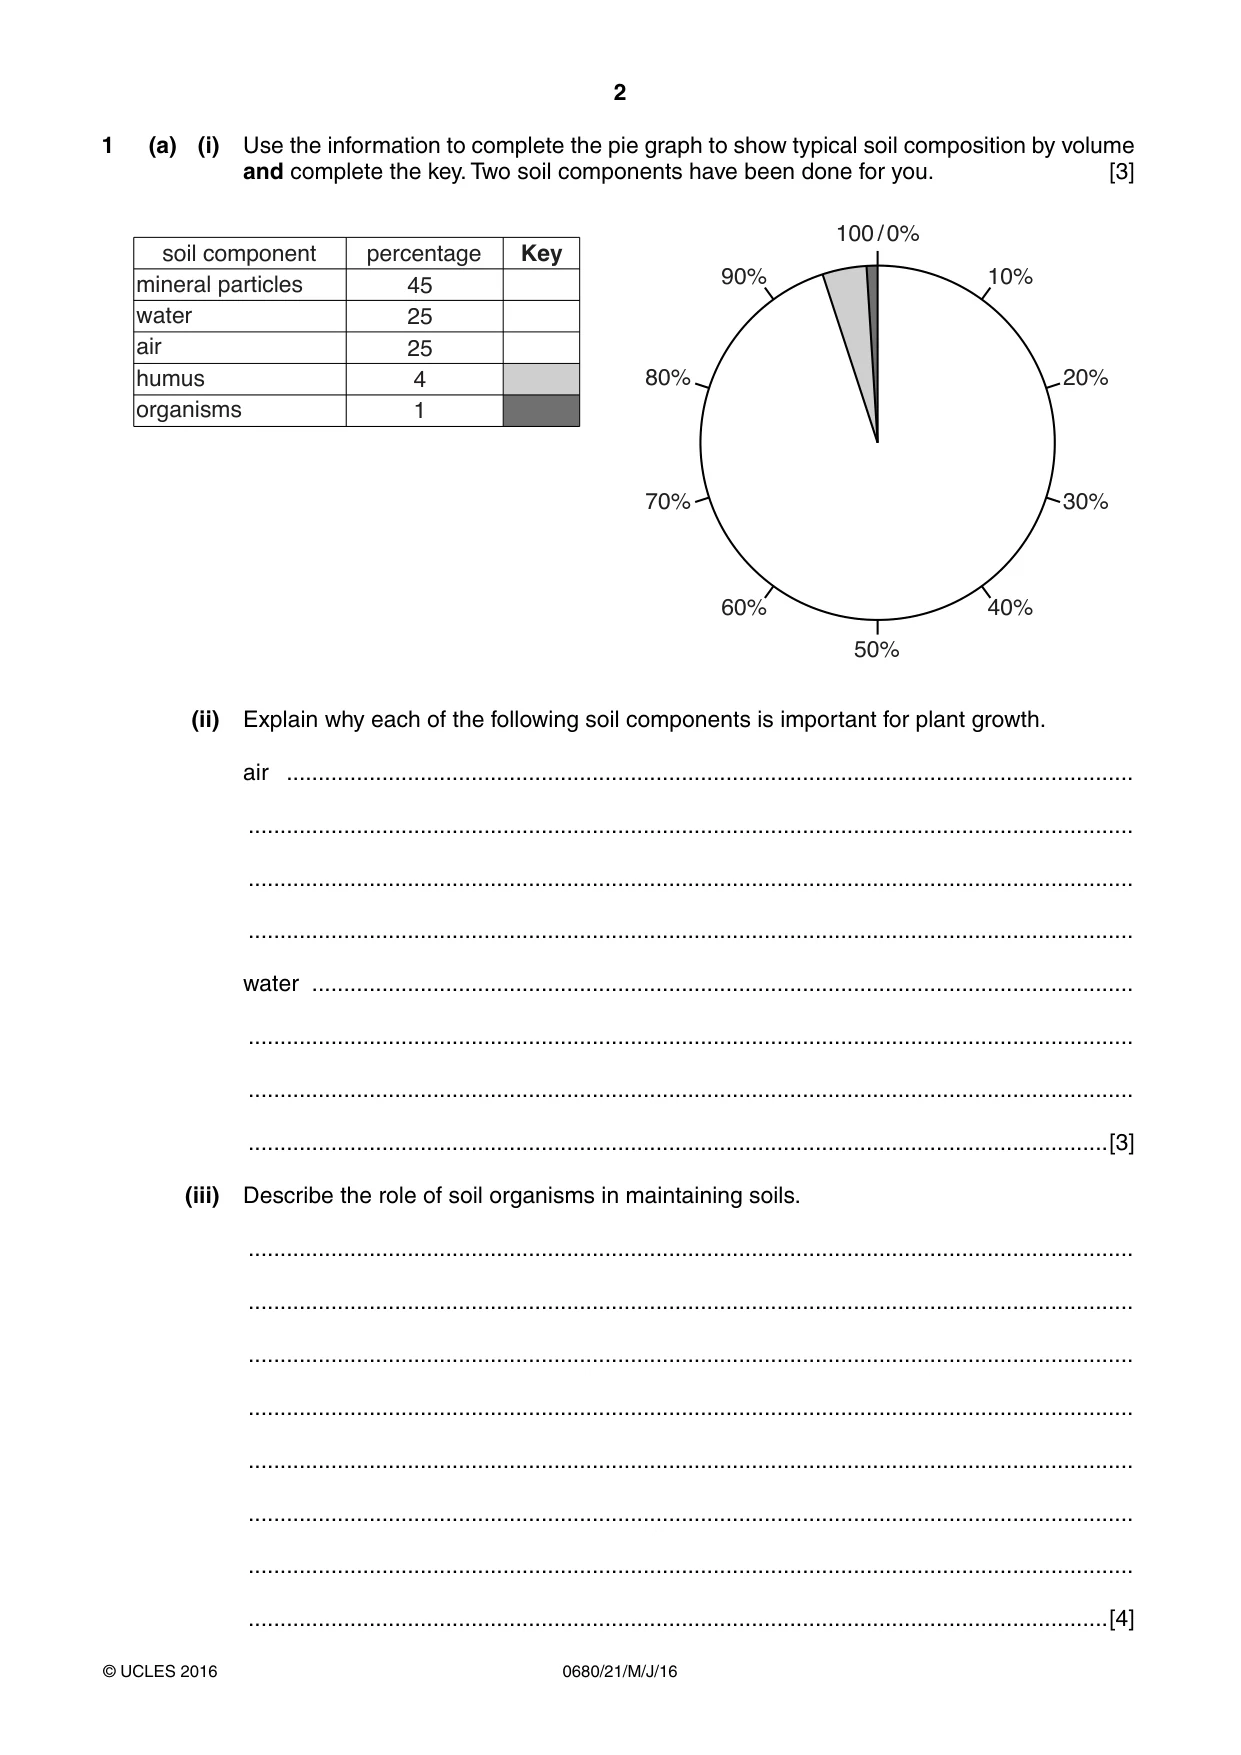
2 0680/21/M/J/16 © UCLES 2016 1 (a) (i) Use the information to complete the pie graph to show typical soil composition by volume and complete the key. Two soil components have been done for you. [3] 100 / 0% 50% 10% 40% 90% 60% 20% 30% 80% 70% soil component mineral particles water air humus organisms percentage 45 25 25 4 1 Key (ii) Explain why each of the following soil components is important for plant growth. air … … … … water … … … …[3] (iii) Describe the role of soil organisms in maintaining soils. … … … … … … … …[4]
Question paper, page 3
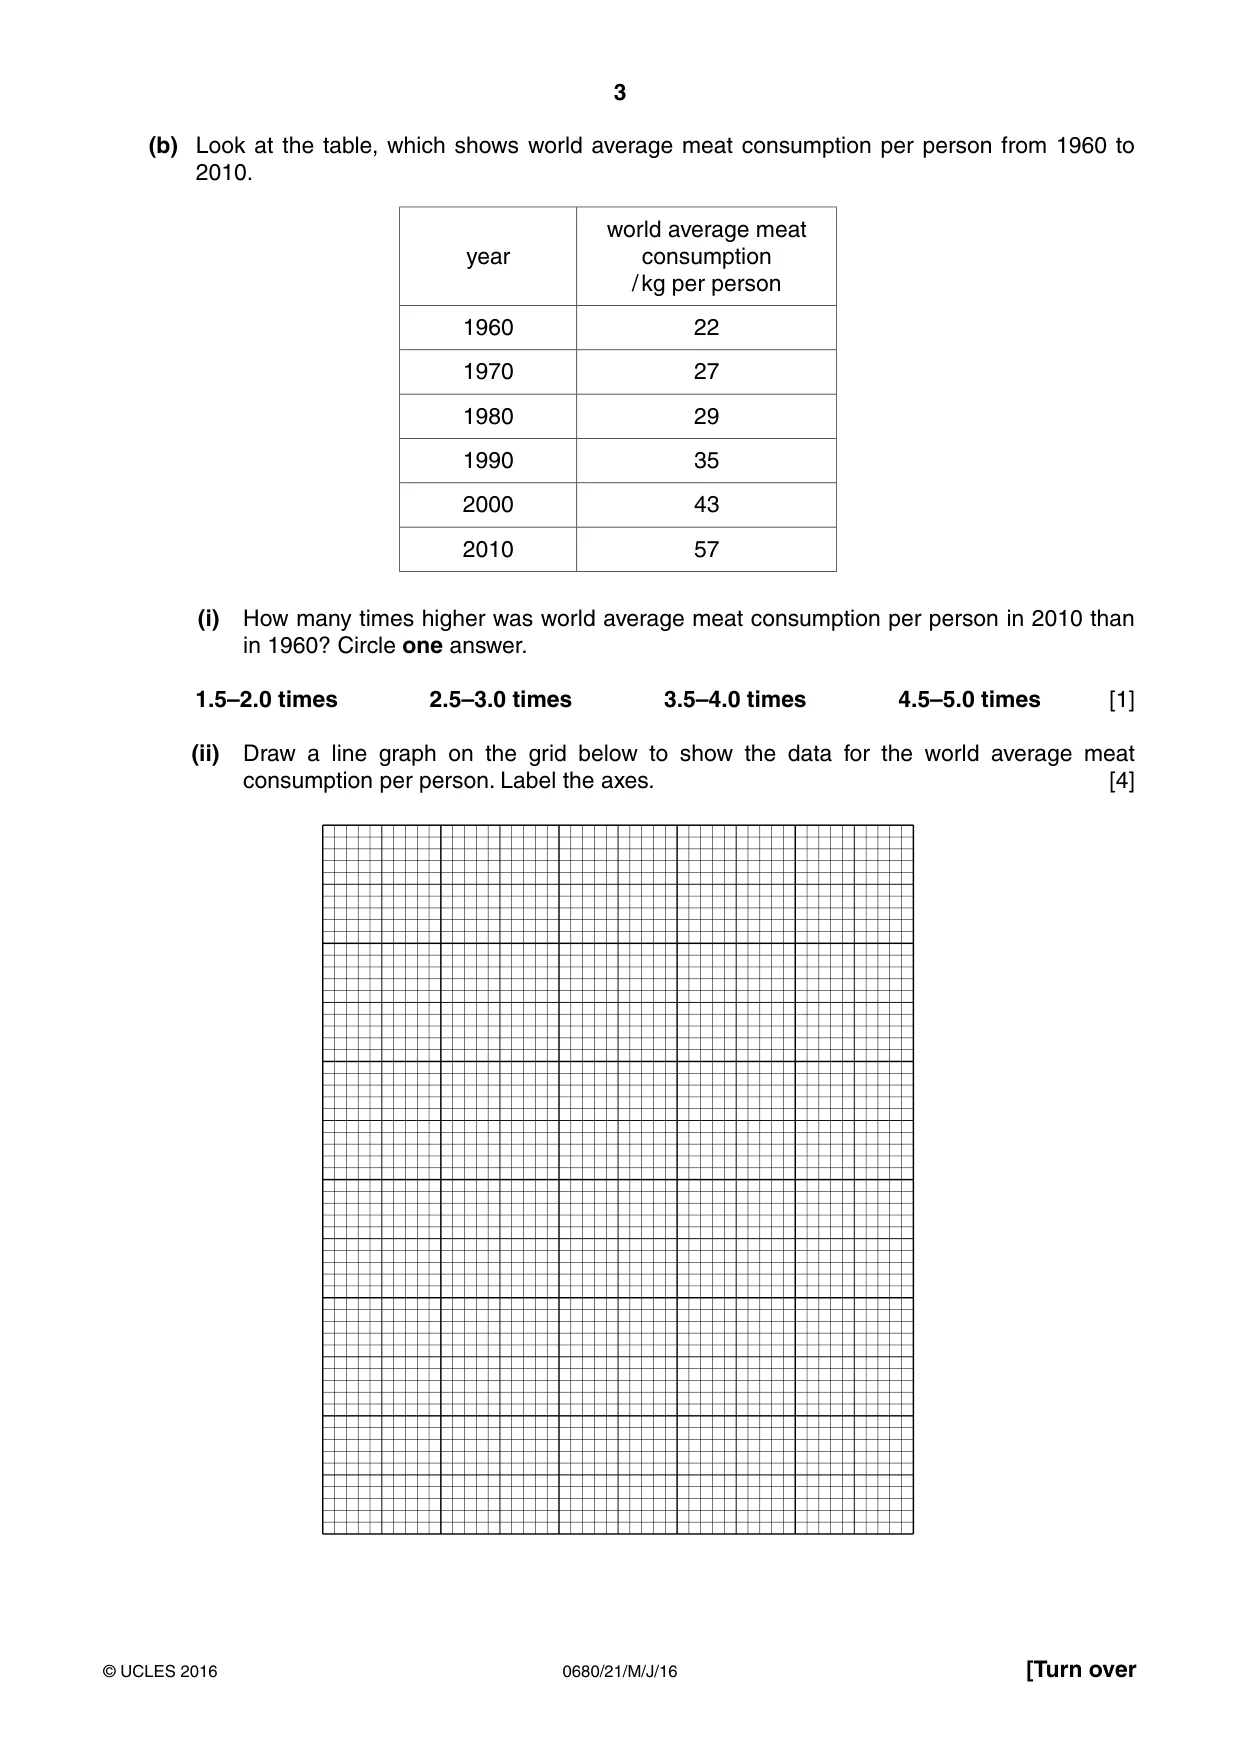
3 0680/21/M/J/16 © UCLES 2016 [Turn over (b) Look at the table, which shows world average meat consumption per person from 1960 to 2010. year world average meat consumption / kg per person 1960 22 1970 27 1980 29 1990 35 2000 43 2010 57 (i) How many times higher was world average meat consumption per person in 2010 than in 1960? Circle one answer. 1.5–2.0 times 2.5–3.0 times 3.5–4.0 times 4.5–5.0 times [1] (ii) Draw a line graph on the grid below to show the data for the world average meat consumption per person. Label the axes. [4]
Question paper, page 4
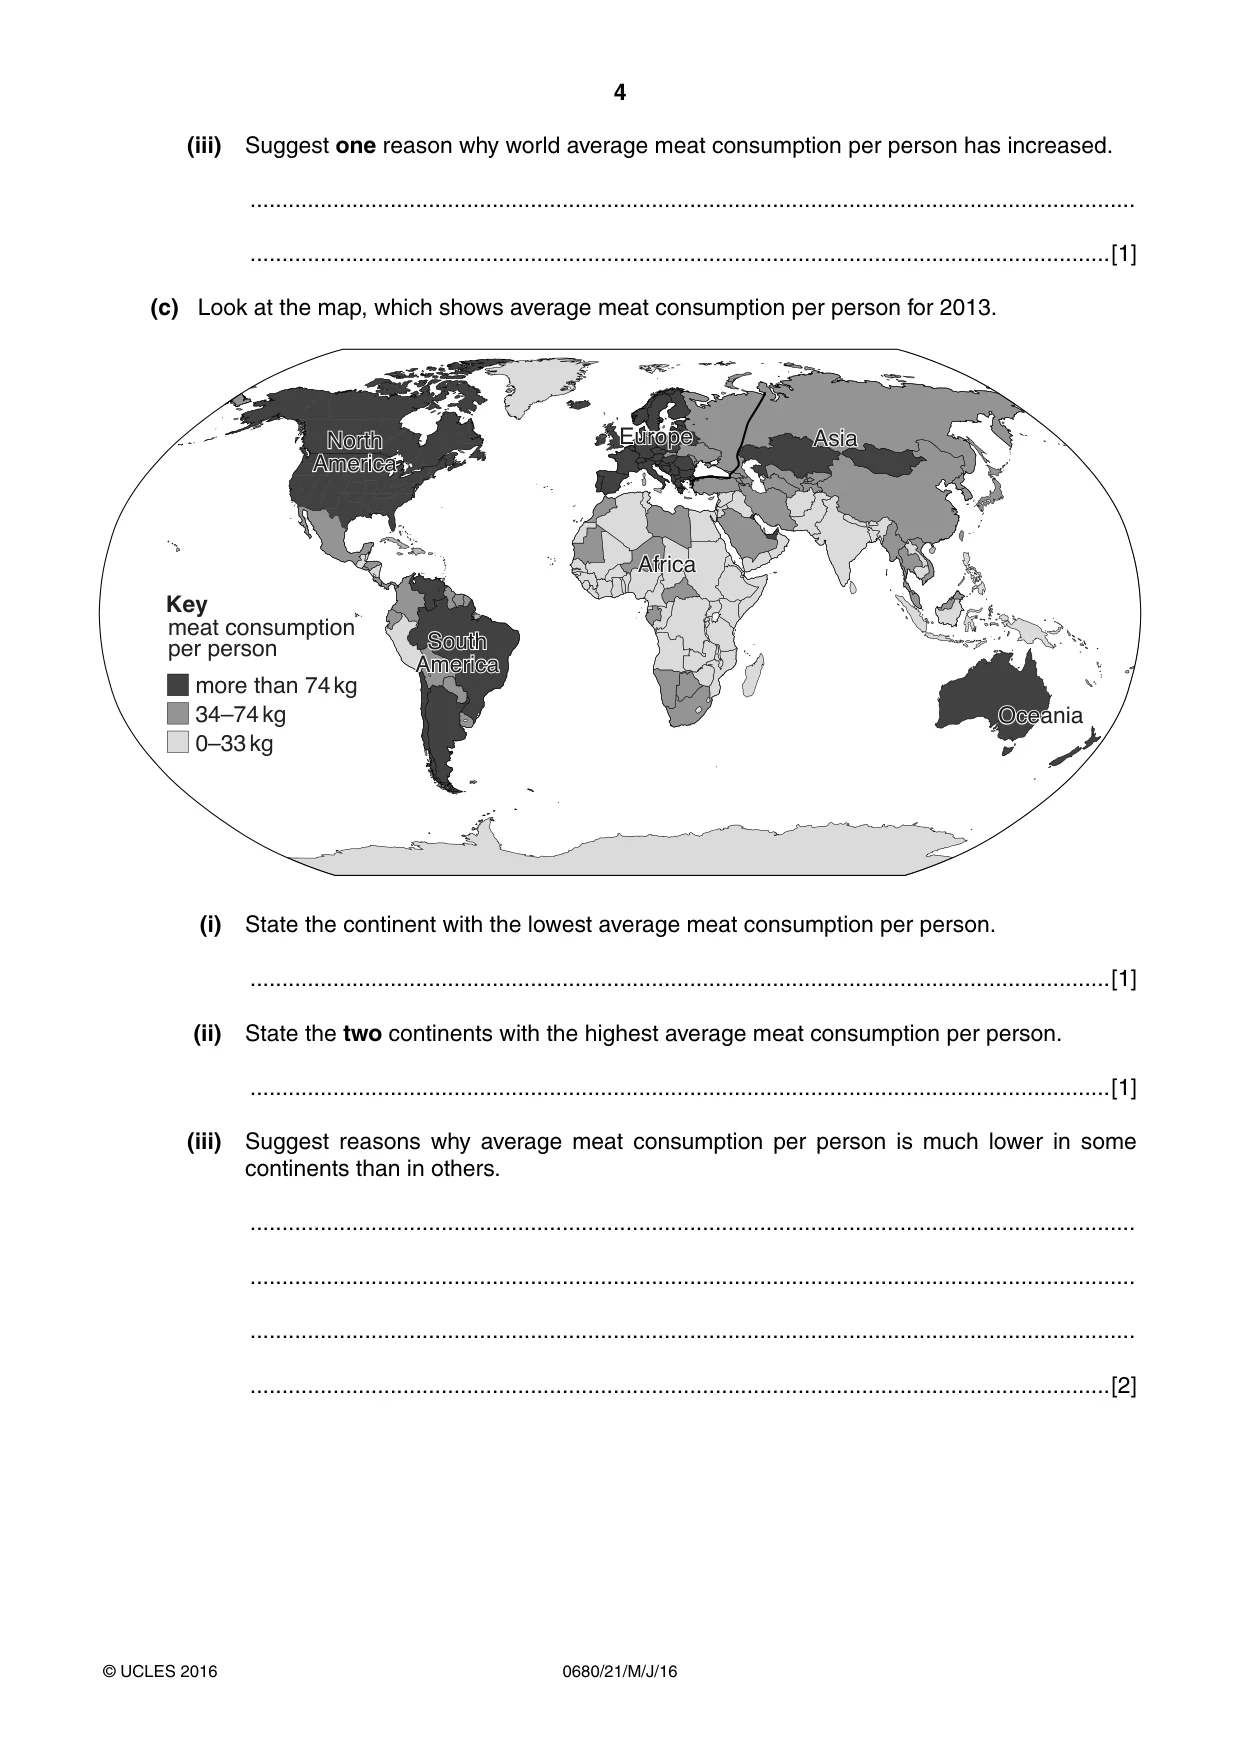
4 0680/21/M/J/16 © UCLES 2016 (iii) Suggest one reason why world average meat consumption per person has increased. … …[1] (c) Look at the map, which shows average meat consumption per person for 2013. North America South America Africa Europe Asia Oceania more than 74 kg 34–74 kg 0–33 kg meat consumption per person Key (i) State the continent with the lowest average meat consumption per person. …[1] (ii) State the two continents with the highest average meat consumption per person. …[1] (iii) Suggest reasons why average meat consumption per person is much lower in some continents than in others. … … … …[2]
Question paper, page 5
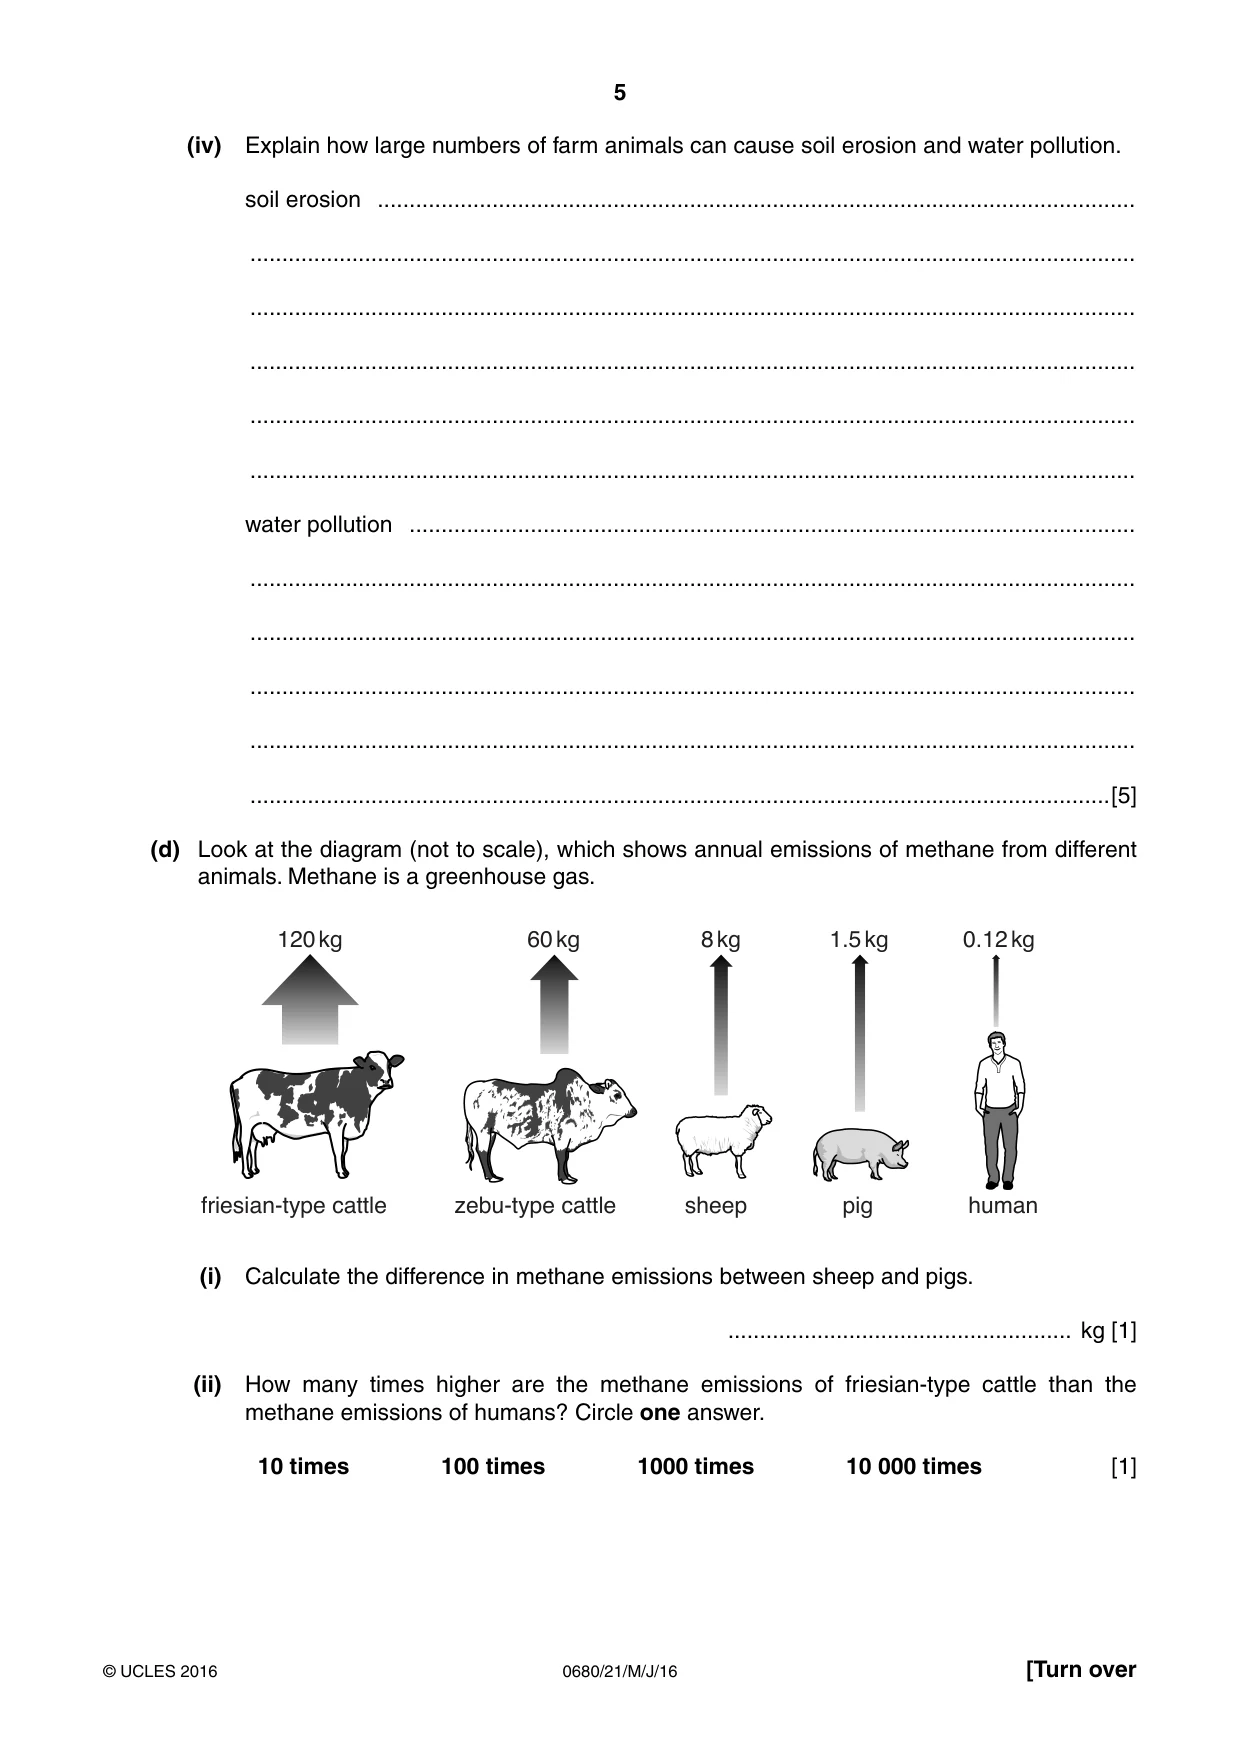
5 0680/21/M/J/16 © UCLES 2016 [Turn over (iv) Explain how large numbers of farm animals can cause soil erosion and water pollution. soil erosion … … … … … … water pollution … … … … … …[5] (d) Look at the diagram (not to scale), which shows annual emissions of methane from different animals. Methane is a greenhouse gas. friesian-type cattle zebu-type cattle sheep pig human 120 kg 60 kg 8 kg 1.5 kg 0.12 kg (i) Calculate the difference in methane emissions between sheep and pigs. … kg [1] (ii) How many times higher are the methane emissions of friesian-type cattle than the methane emissions of humans? Circle one answer. 10 times 100 times 1000 times 10 000 times [1]
Question paper, page 6
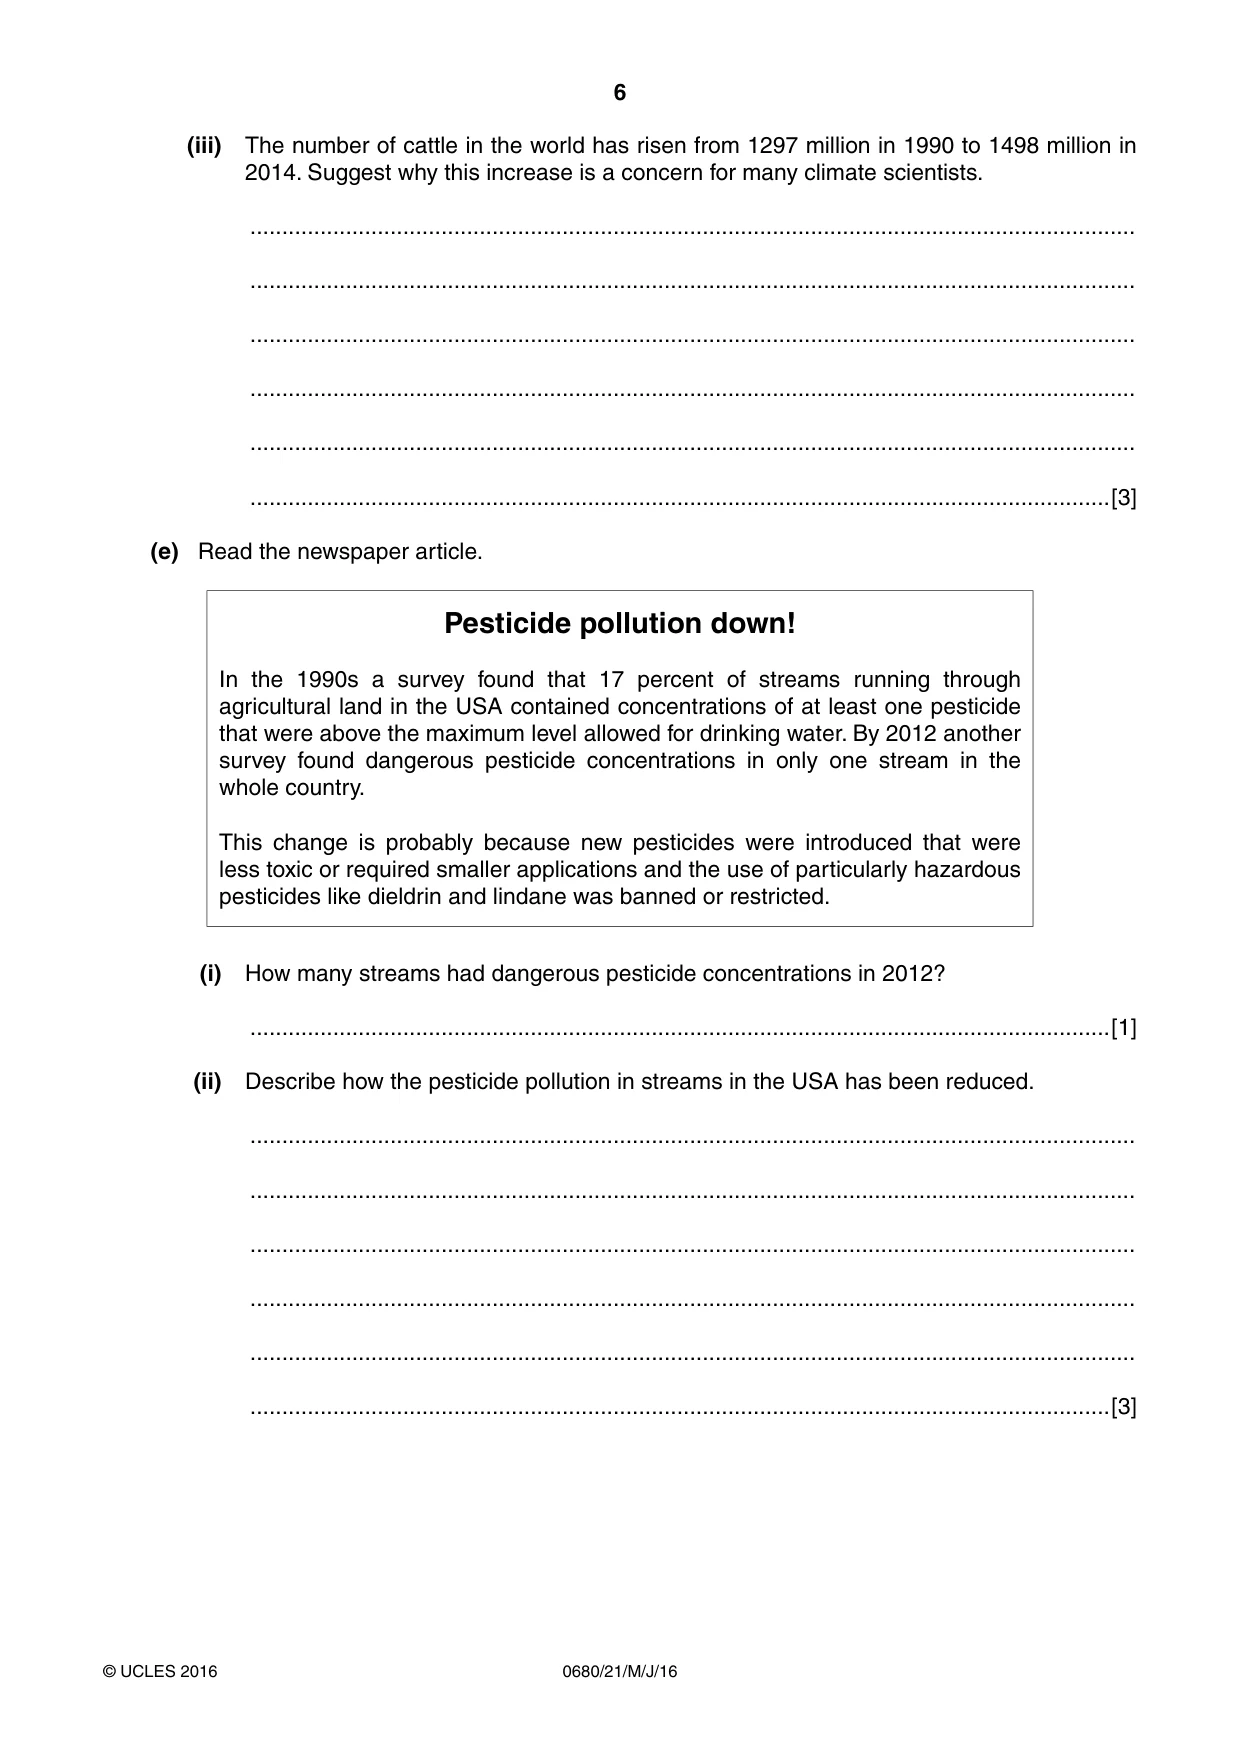
6 0680/21/M/J/16 © UCLES 2016 (iii) The number of cattle in the world has risen from 1297 million in 1990 to 1498 million in 2014. Suggest why this increase is a concern for many climate scientists. … … … … … …[3] (e) Read the newspaper article. Pesticide pollution down! In the 1990s a survey found that 17 percent of streams running through agricultural land in the USA contained concentrations of at least one pesticide that were above the maximum level allowed for drinking water. By 2012 another survey found dangerous pesticide concentrations in only one stream in the whole country. This change is probably because new pesticides were introduced that were less toxic or required smaller applications and the use of particularly hazardous pesticides like dieldrin and lindane was banned or restricted. (i) How many streams had dangerous pesticide concentrations in 2012? …[1] (ii) Describe how the pesticide pollution in streams in the USA has been reduced. … … … … … …[3]
Question paper, page 7
7 0680/21/M/J/16 © UCLES 2016 [Turn over (f) Explain how fertilisers may damage the environment and suggest how their environmental impacts can be reduced. … … … … … … … … … … … …[6]
Question paper, page 8
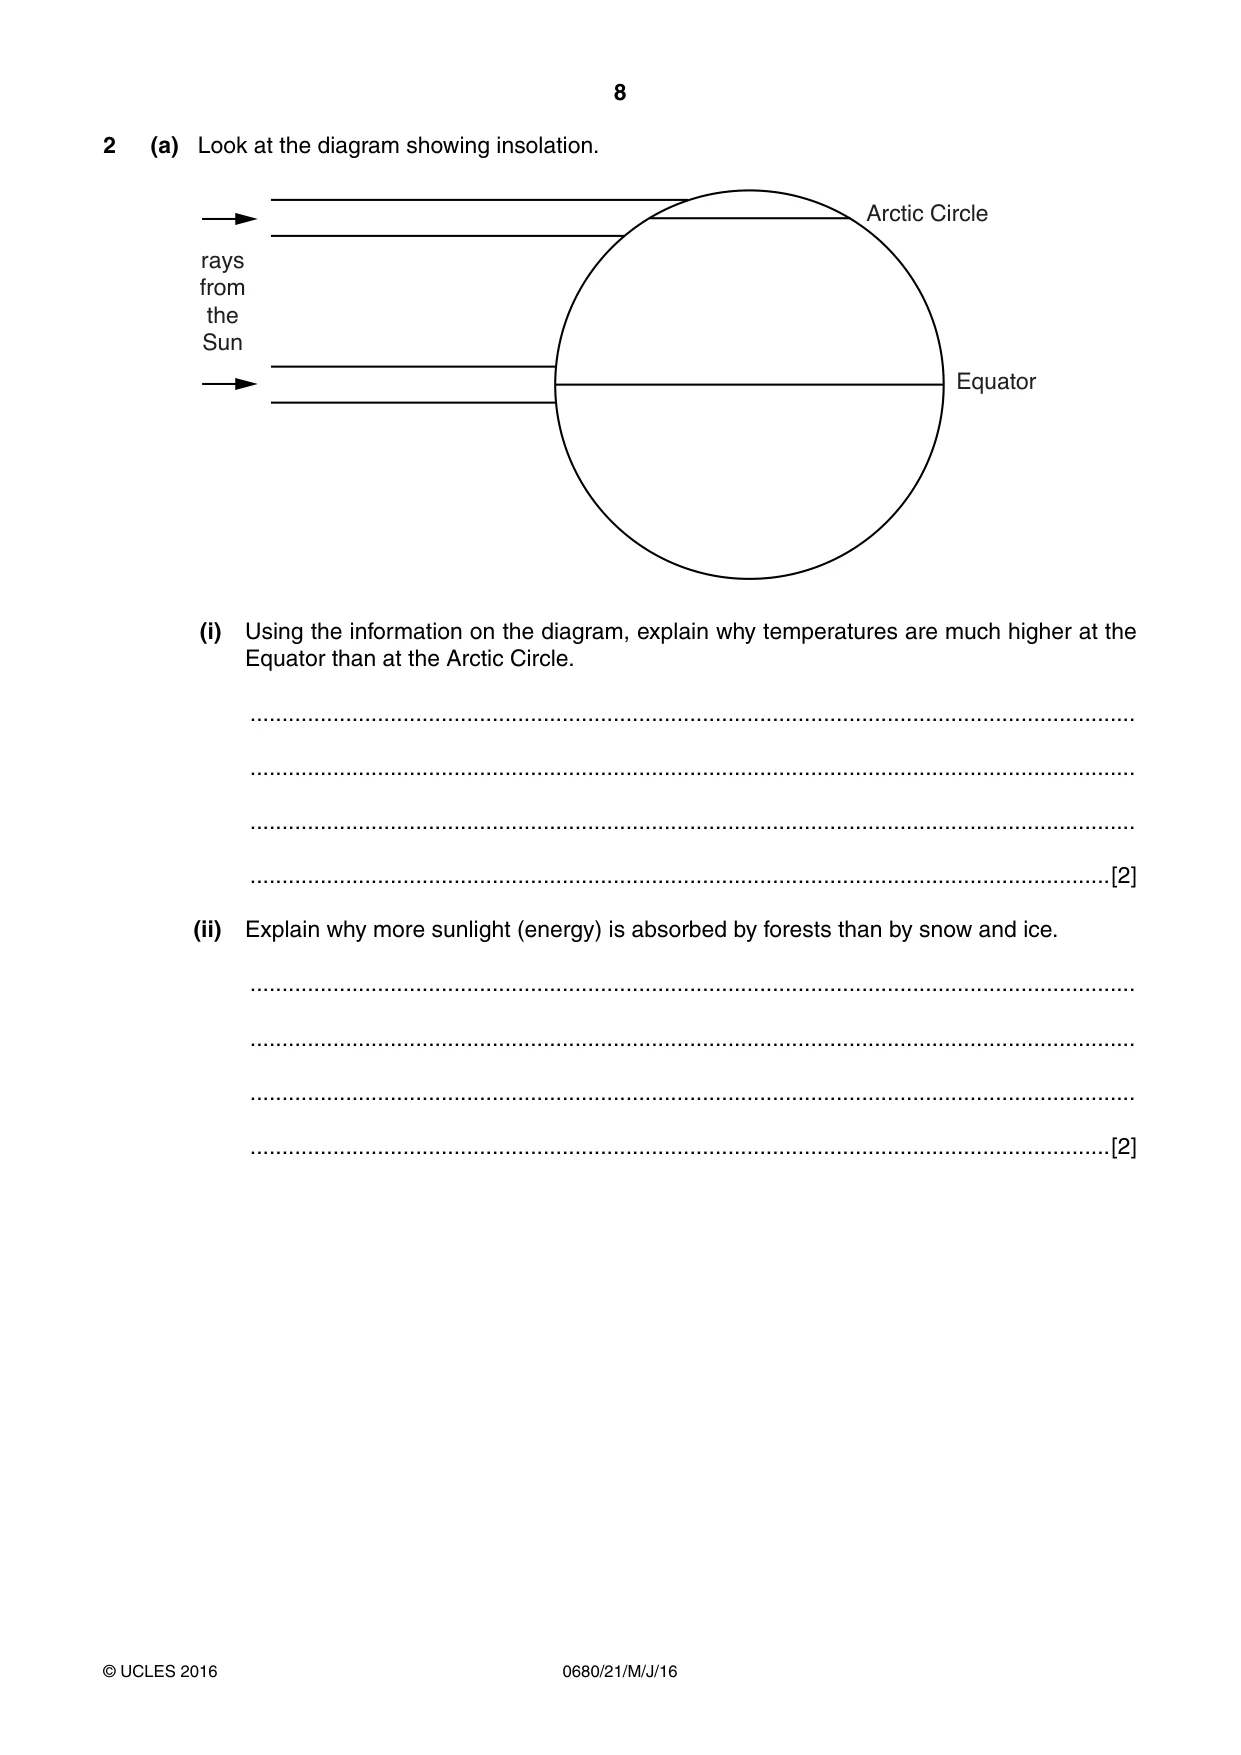
8 0680/21/M/J/16 © UCLES 2016 2 (a) Look at the diagram showing insolation. Arctic Circle rays from the Sun Equator (i) Using the information on the diagram, explain why temperatures are much higher at the Equator than at the Arctic Circle. … … … …[2] (ii) Explain why more sunlight (energy) is absorbed by forests than by snow and ice. … … … …[2]
Question paper, page 9
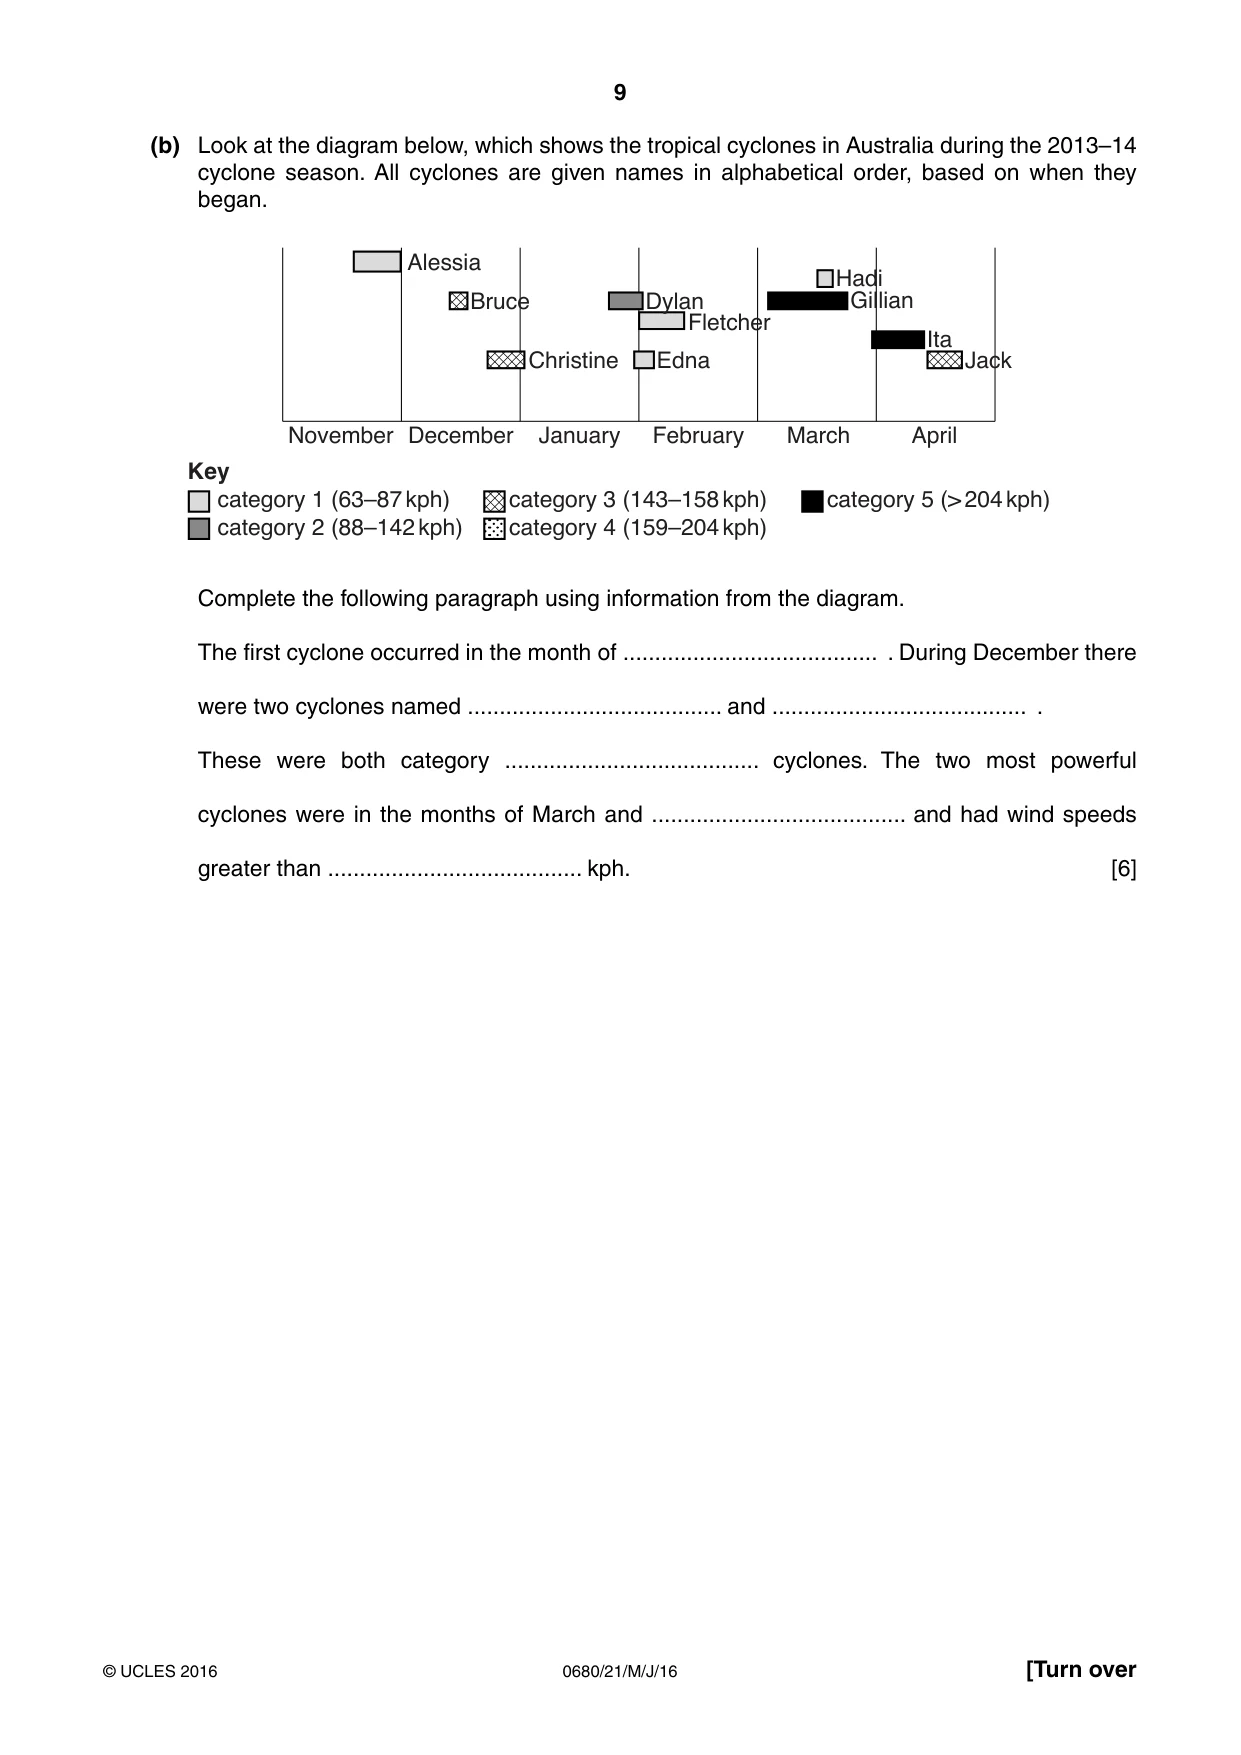
9 0680/21/M/J/16 © UCLES 2016 [Turn over (b) Look at the diagram below, which shows the tropical cyclones in Australia during the 2013–14 cyclone season. All cyclones are given names in alphabetical order, based on when they began. November December January February March April Alessia Bruce Christine Edna Fletcher Dylan Hadi Gillian Ita Jack category 1 (63–87 kph) category 2 (88–142 kph) Key category 3 (143–158 kph) category 4 (159–204 kph) category 5 (> 204 kph) Complete the following paragraph using information from the diagram. The first cyclone occurred in the month of … . During December there were two cyclones named … and … . These were both category … cyclones. The two most powerful cyclones were in the months of March and … and had wind speeds greater than … kph. [6]
Question paper, page 10
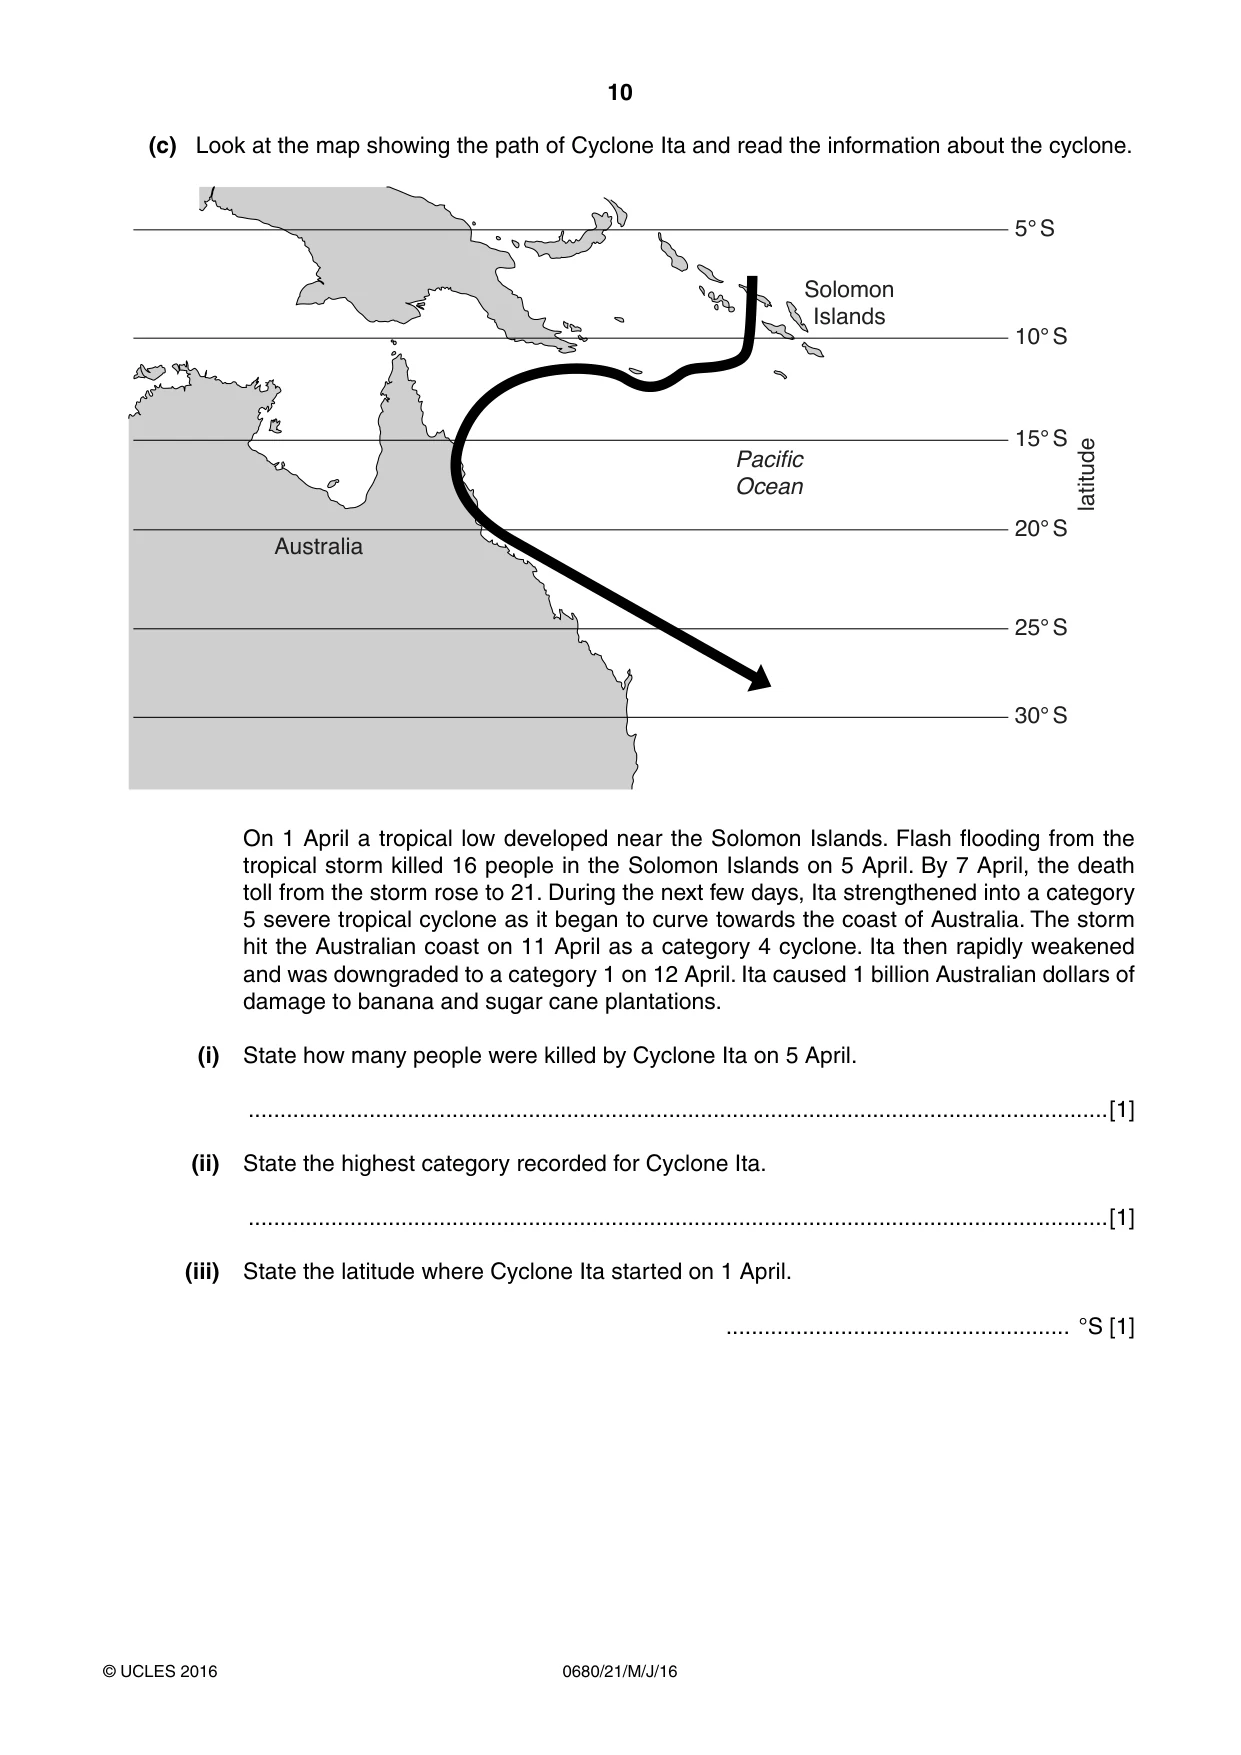
10 0680/21/M/J/16 © UCLES 2016 (c) Look at the map showing the path of Cyclone Ita and read the information about the cyclone. 5° S 10° S 15° S latitude 20° S 25° S 30° S Solomon Islands Australia Pacific Ocean On 1 April a tropical low developed near the Solomon Islands. Flash flooding from the tropical storm killed 16 people in the Solomon Islands on 5 April. By 7 April, the death toll from the storm rose to 21. During the next few days, Ita strengthened into a category 5 severe tropical cyclone as it began to curve towards the coast of Australia. The storm hit the Australian coast on 11 April as a category 4 cyclone. Ita then rapidly weakened and was downgraded to a category 1 on 12 April. Ita caused 1 billion Australian dollars of damage to banana and sugar cane plantations. (i) State how many people were killed by Cyclone Ita on 5 April. …[1] (ii) State the highest category recorded for Cyclone Ita. …[1] (iii) State the latitude where Cyclone Ita started on 1 April. … °S [1]
Question paper, page 11
11 0680/21/M/J/16 © UCLES 2016 [Turn over (iv) Explain why Cyclone Ita weakened as it moved onto the land and south, out of the tropics. onto the land … … … … south, out of the tropics … … … …[3] (v) Explain why damage from cyclones is greatest in low-lying coastal areas. … … … … … … … …[4] (vi) Suggest why more people are killed by cyclones in developing countries, such as the Solomon Islands, than in developed countries, such as Australia. … … … … … …[3]
Question paper, page 12
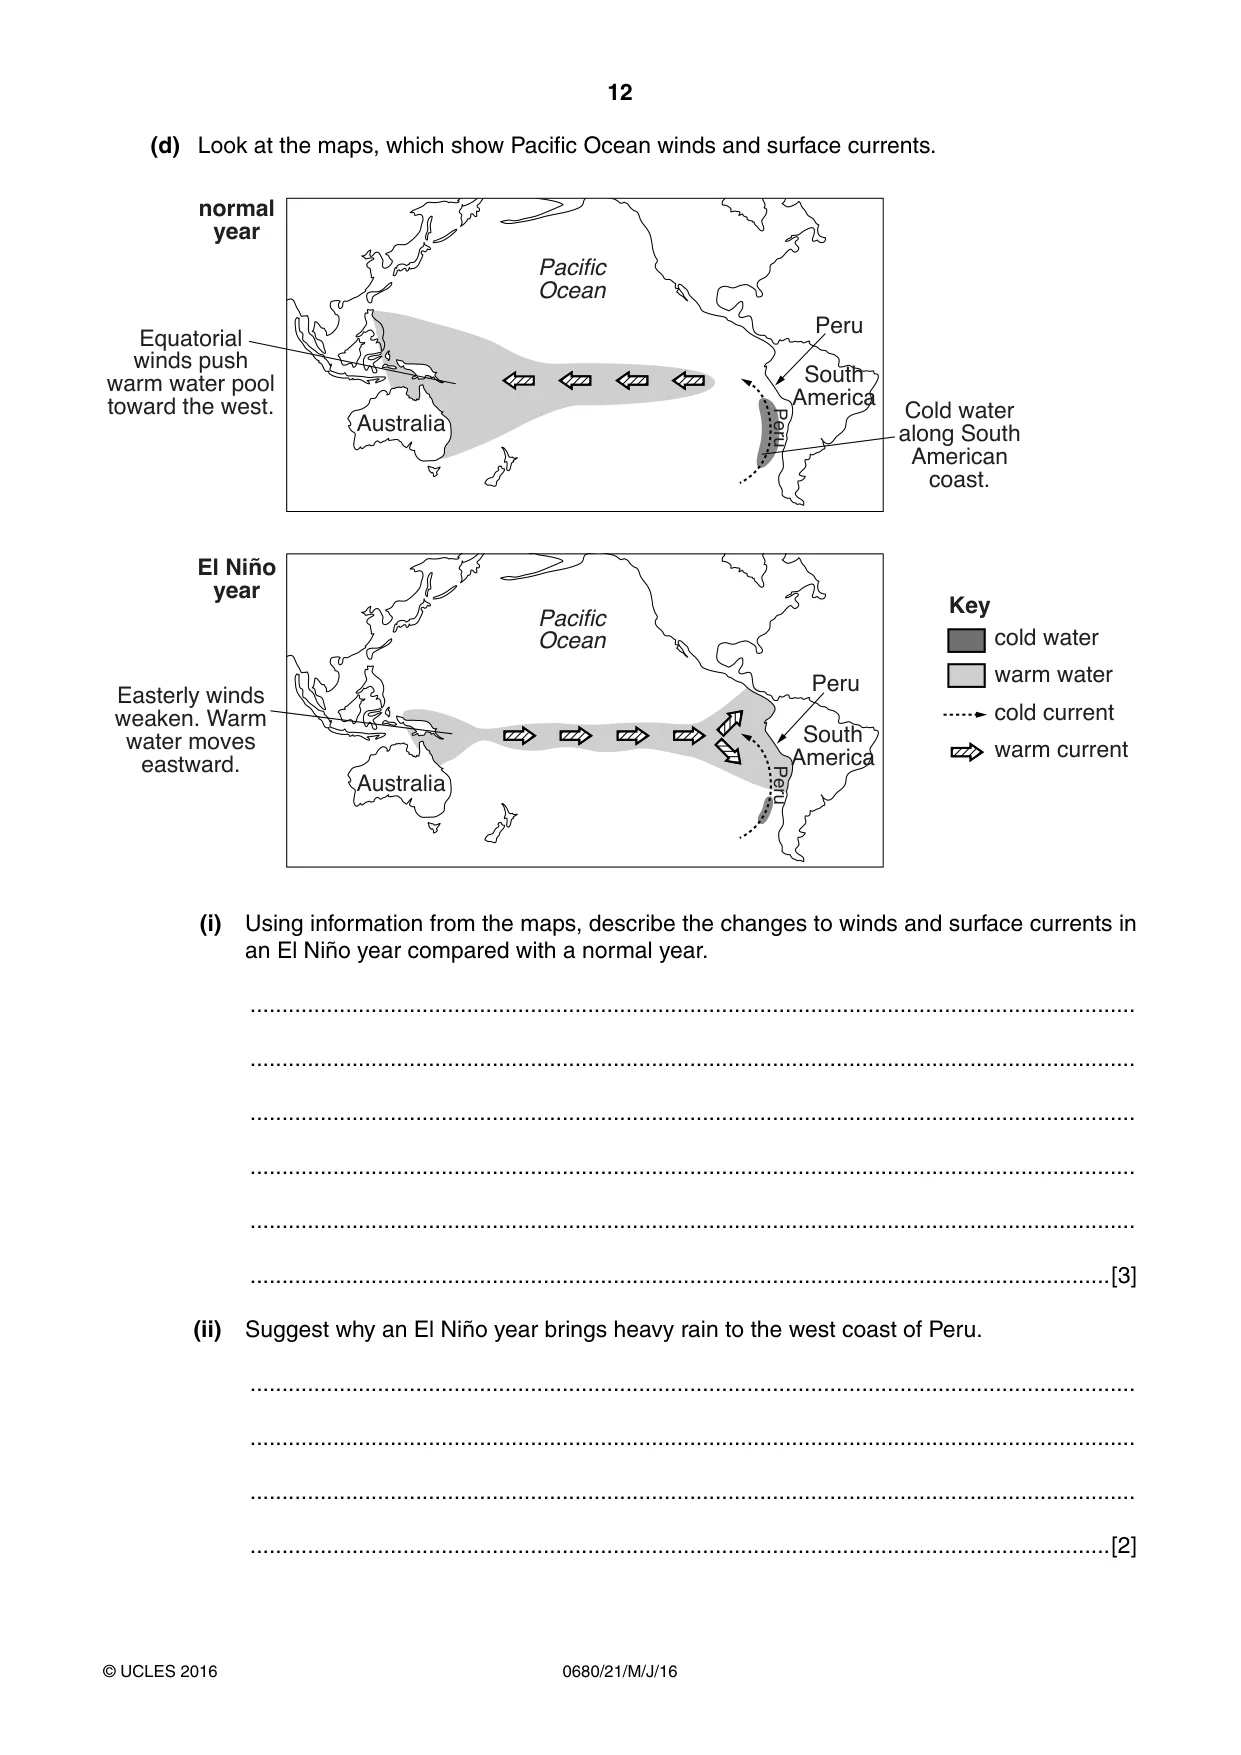
12 0680/21/M/J/16 © UCLES 2016 (d) Look at the maps, which show Pacific Ocean winds and surface currents. cold water warm water cold current warm current Key Australia South America Australia South America Pacific Ocean Pacific Ocean Peru Peru Peru Peru normal year El Niño year Equatorial winds push warm water pool toward the west. Cold water along South American coast. Easterly winds weaken. Warm water moves eastward. (i) Using information from the maps, describe the changes to winds and surface currents in an El Niño year compared with a normal year. … … … … … …[3] (ii) Suggest why an El Niño year brings heavy rain to the west coast of Peru. … … … …[2]
Question paper, page 13
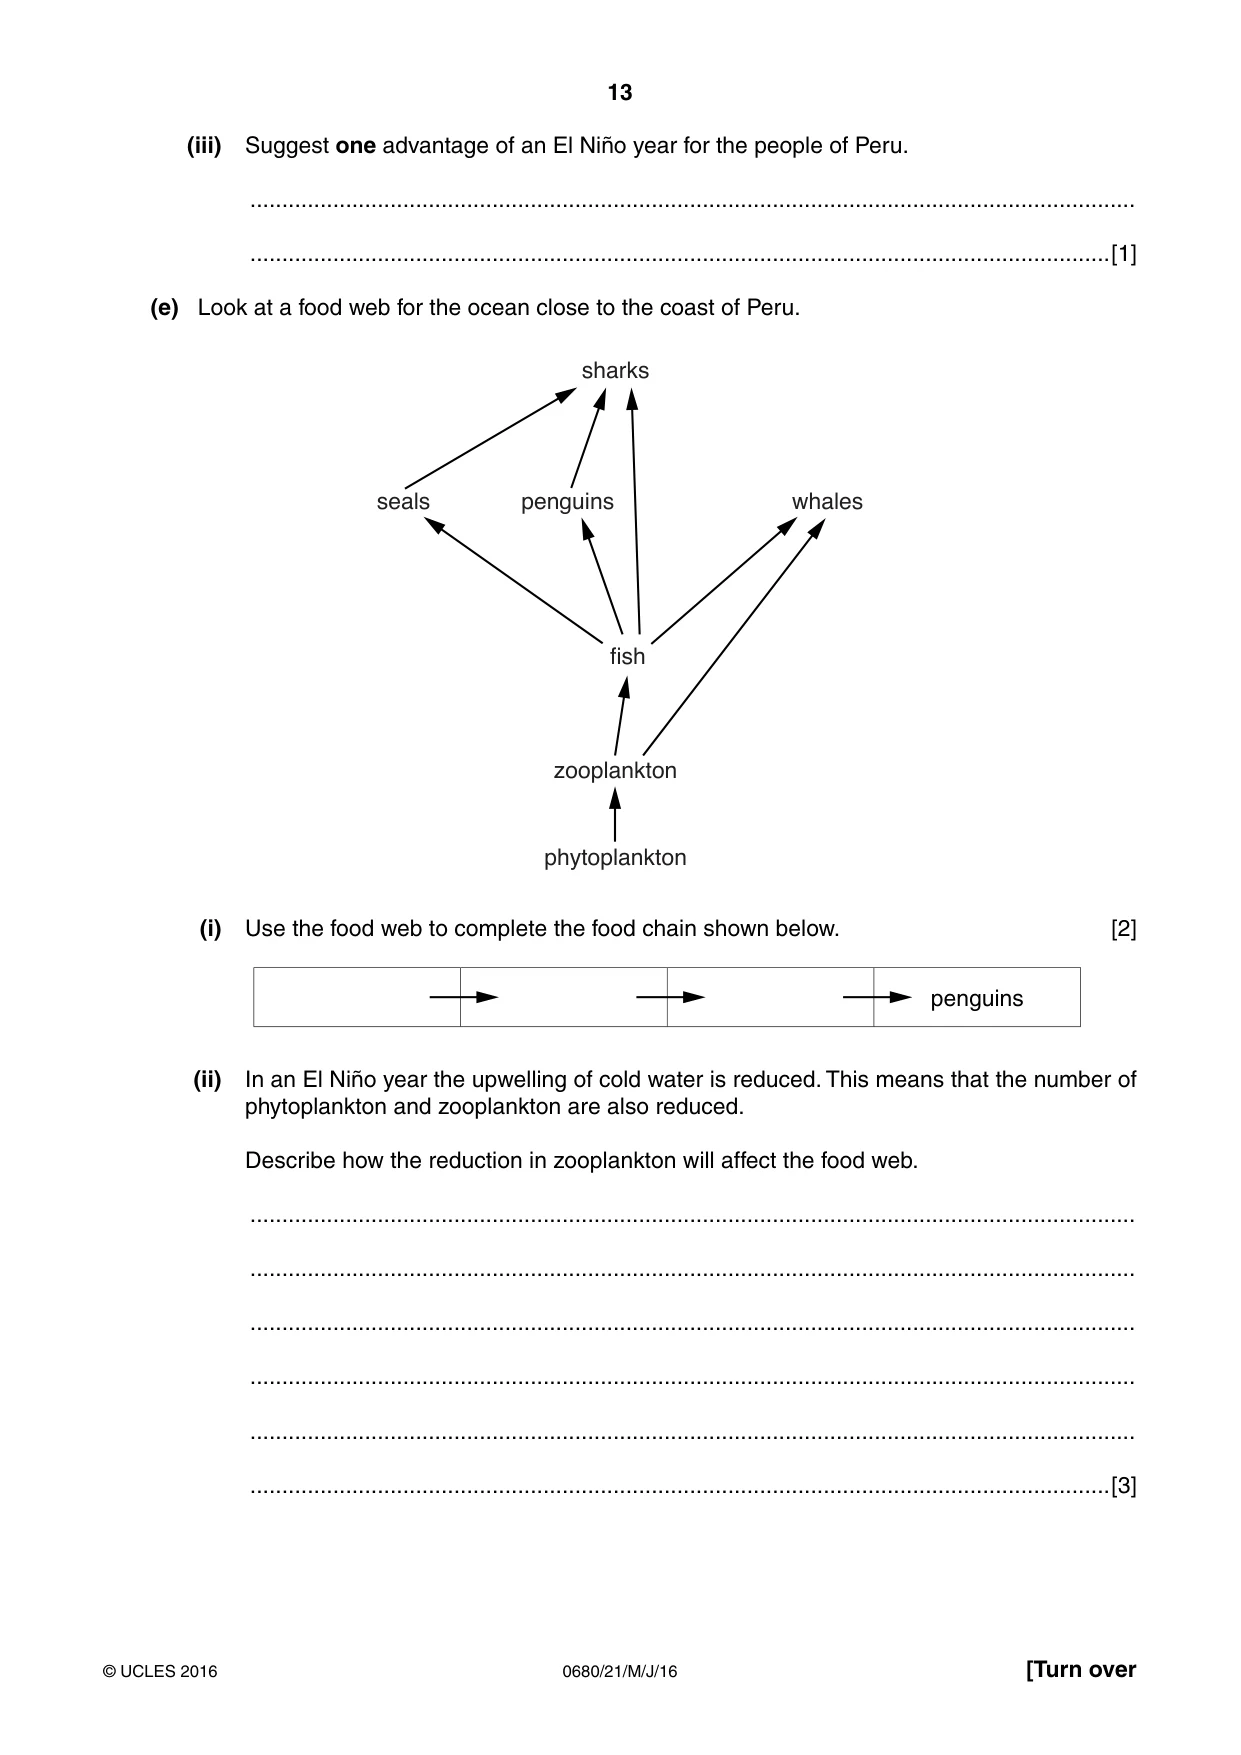
13 0680/21/M/J/16 © UCLES 2016 [Turn over (iii) Suggest one advantage of an El Niño year for the people of Peru. … …[1] (e) Look at a food web for the ocean close to the coast of Peru. sharks fish zooplankton phytoplankton seals penguins whales (i) Use the food web to complete the food chain shown below. [2] penguins (ii) In an El Niño year the upwelling of cold water is reduced. This means that the number of phytoplankton and zooplankton are also reduced. Describe how the reduction in zooplankton will affect the food web. … … … … … …[3]
Question paper, page 14
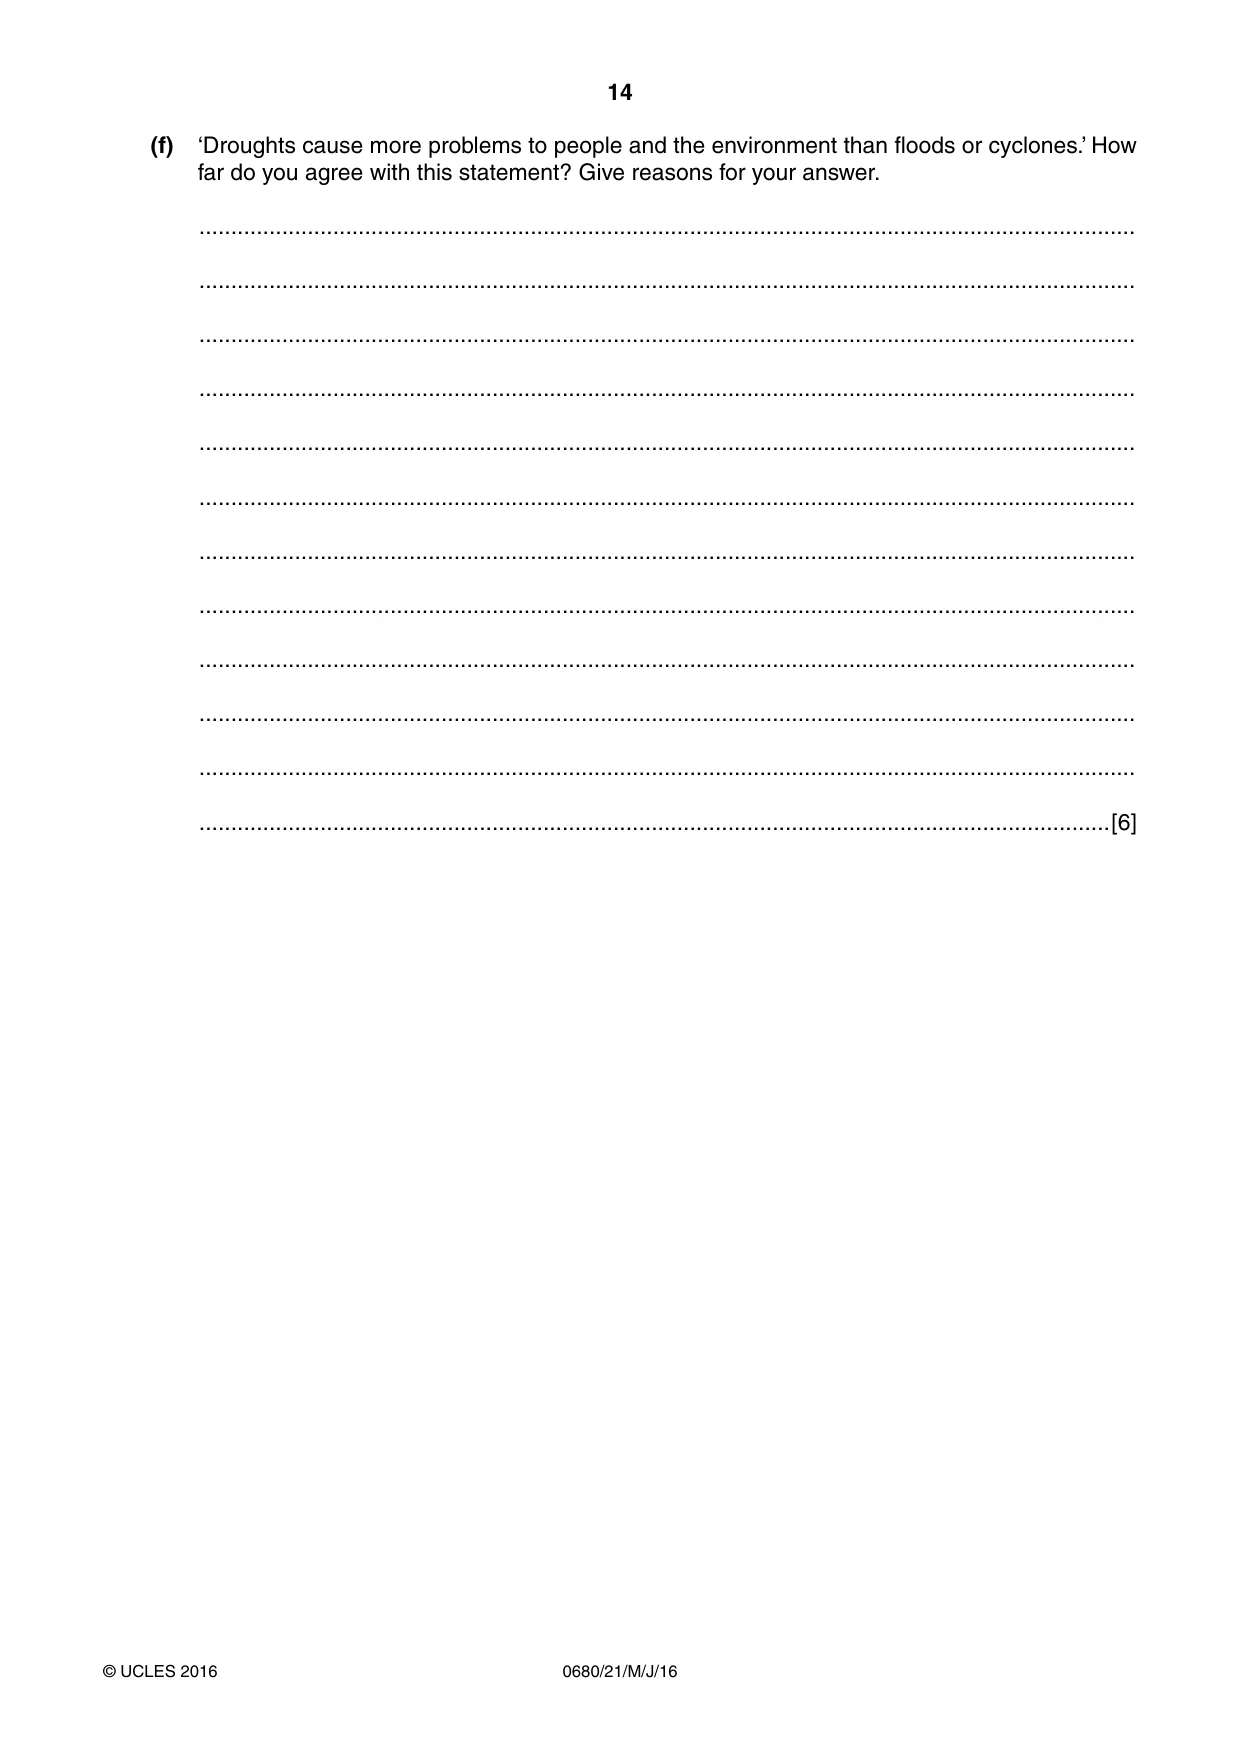
14 0680/21/M/J/16 © UCLES 2016 (f) ‘Droughts cause more problems to people and the environment than floods or cyclones.’ How far do you agree with this statement? Give reasons for your answer. … … … … … … … … … … … …[6]
Question paper, page 15
15 0680/21/M/J/16 © UCLES 2016 BLANK PAGE
Question paper, page 16
16 0680/21/M/J/16 © UCLES 2016 Permission to reproduce items where third-party owned material protected by copyright is included has been sought and cleared where possible. Every reasonable effort has been made by the publisher (UCLES) to trace copyright holders, but if any items requiring clearance have unwittingly been included, the publisher will be pleased to make amends at the earliest possible opportunity. To avoid the issue of disclosure of answer-related information to candidates, all copyright acknowledgements are reproduced online in the Cambridge International Examinations Copyright Acknowledgements Booklet. This is produced for each series of examinations and is freely available to download at www.cie.org.uk after the live examination series. Cambridge International Examinations is part of the Cambridge Assessment Group. Cambridge Assessment is the brand name of University of Cambridge Local Examinations Syndicate (UCLES), which is itself a department of the University of Cambridge. BLANK PAGE
Mark scheme, page 1
® IGCSE is the registered trademark of Cambridge International Examinations. This document consists of 9 printed pages. © UCLES 2016 [Turn over Cambridge International Examinations Cambridge International General Certificate of Secondary Education ENVIRONMENTAL MANAGEMENT 0680/21 Paper 2 May/June 2016 MARK SCHEME Maximum Mark: 80 Published This mark scheme is published as an aid to teachers and candidates, to indicate the requirements of the examination. It shows the basis on which Examiners were instructed to award marks. It does not indicate the details of the discussions that took place at an Examiners’ meeting before marking began, which would have considered the acceptability of alternative answers. Mark schemes should be read in conjunction with the question paper and the Principal Examiner Report for Teachers. Cambridge will not enter into discussions about these mark schemes. Cambridge is publishing the mark schemes for the May/June 2016 series for most Cambridge IGCSE®, Cambridge International A and AS Level components and some Cambridge O Level components.
Mark scheme, page 2
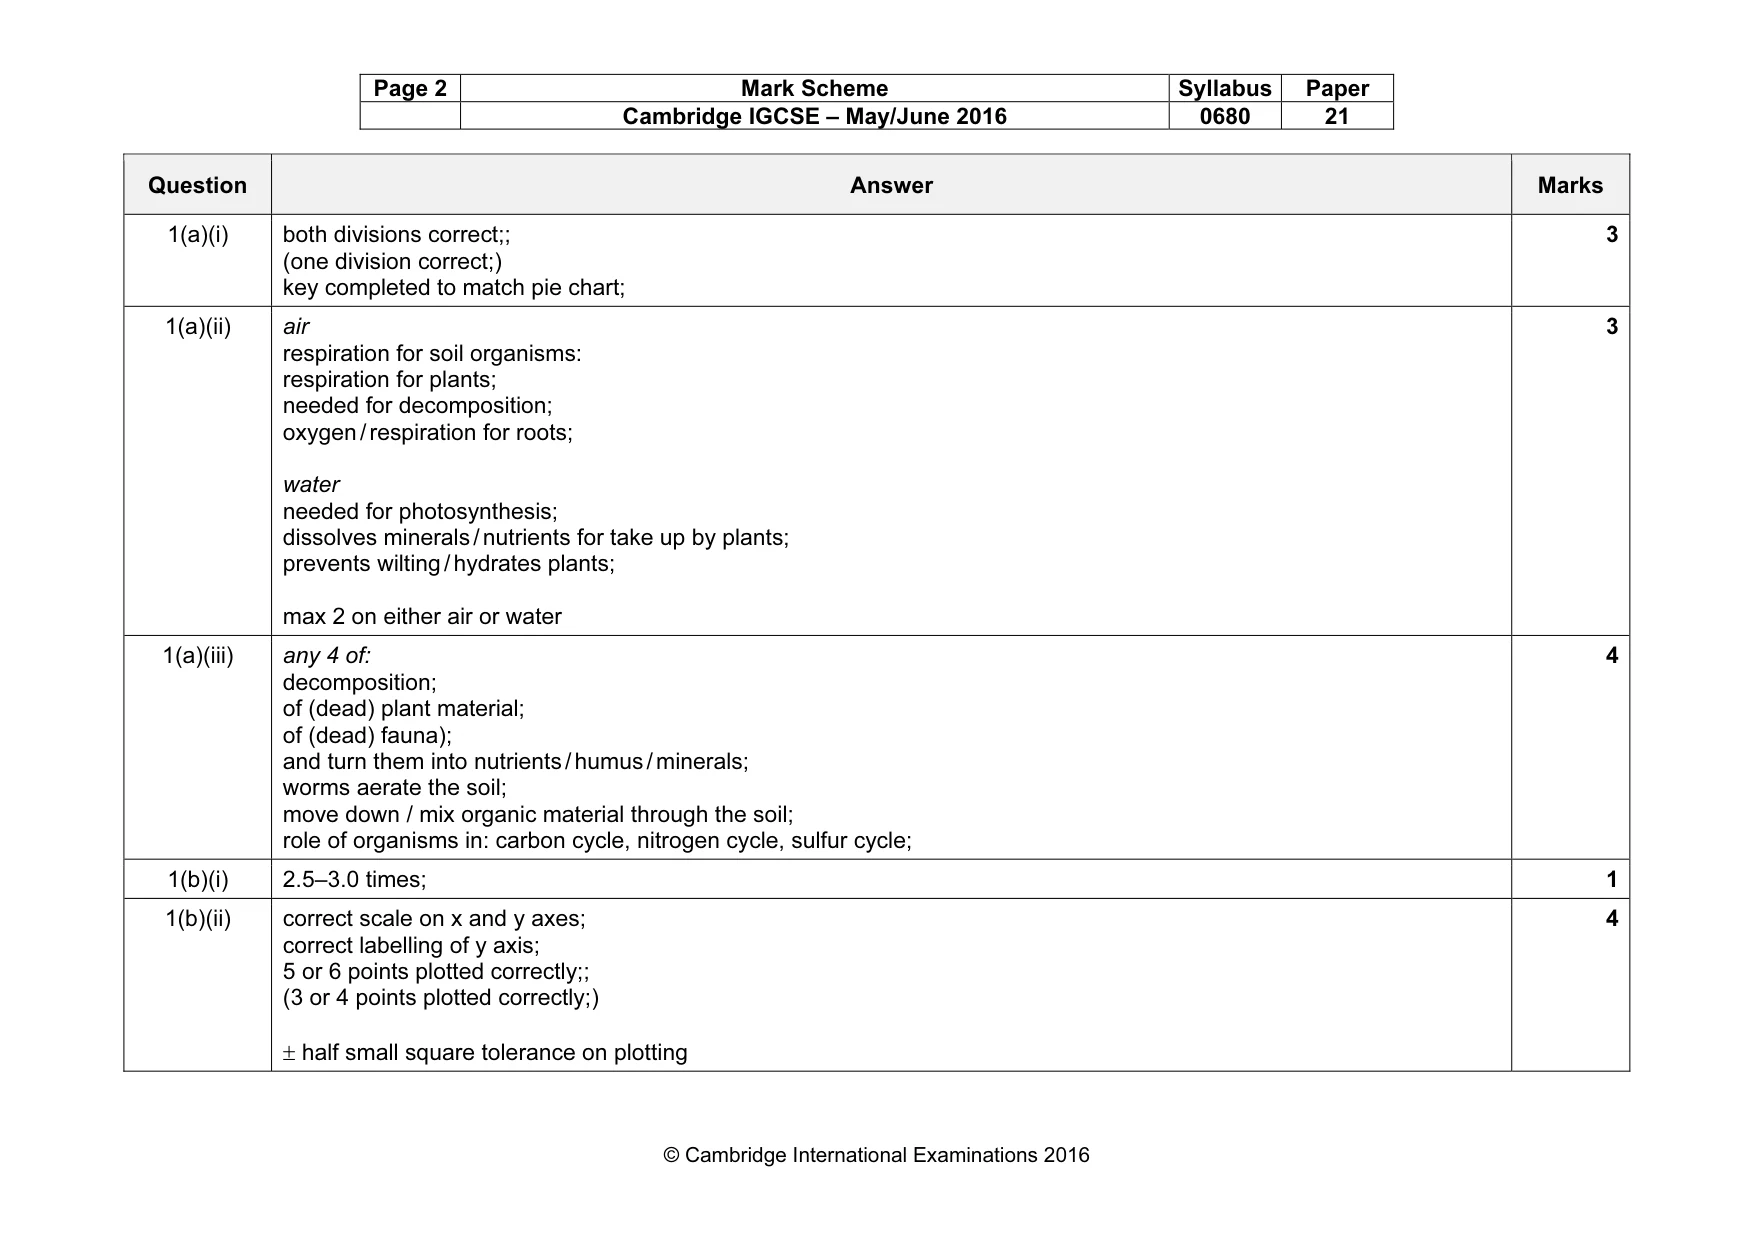
Page 2 Mark Scheme Syllabus Paper Cambridge IGCSE – May/June 2016 0680 21 © Cambridge International Examinations 2016 Question Answer Marks 1(a)(i) both divisions correct;; (one division correct;) key completed to match pie chart; 3 1(a)(ii) air respiration for soil organisms: respiration for plants; needed for decomposition; oxygen / respiration for roots; water needed for photosynthesis; dissolves minerals / nutrients for take up by plants; prevents wilting / hydrates plants; max 2 on either air or water 3 1(a)(iii) any 4 of: decomposition; of (dead) plant material; of (dead) fauna); and turn them into nutrients / humus / minerals; worms aerate the soil; move down / mix organic material through the soil; role of organisms in: carbon cycle, nitrogen cycle, sulfur cycle; 4 1(b)(i) 2.5–3.0 times; 1 1(b)(ii) correct scale on x and y axes; correct labelling of y axis; 5 or 6 points plotted correctly;; (3 or 4 points plotted correctly;) ± half small square tolerance on plotting 4
Mark scheme, page 3
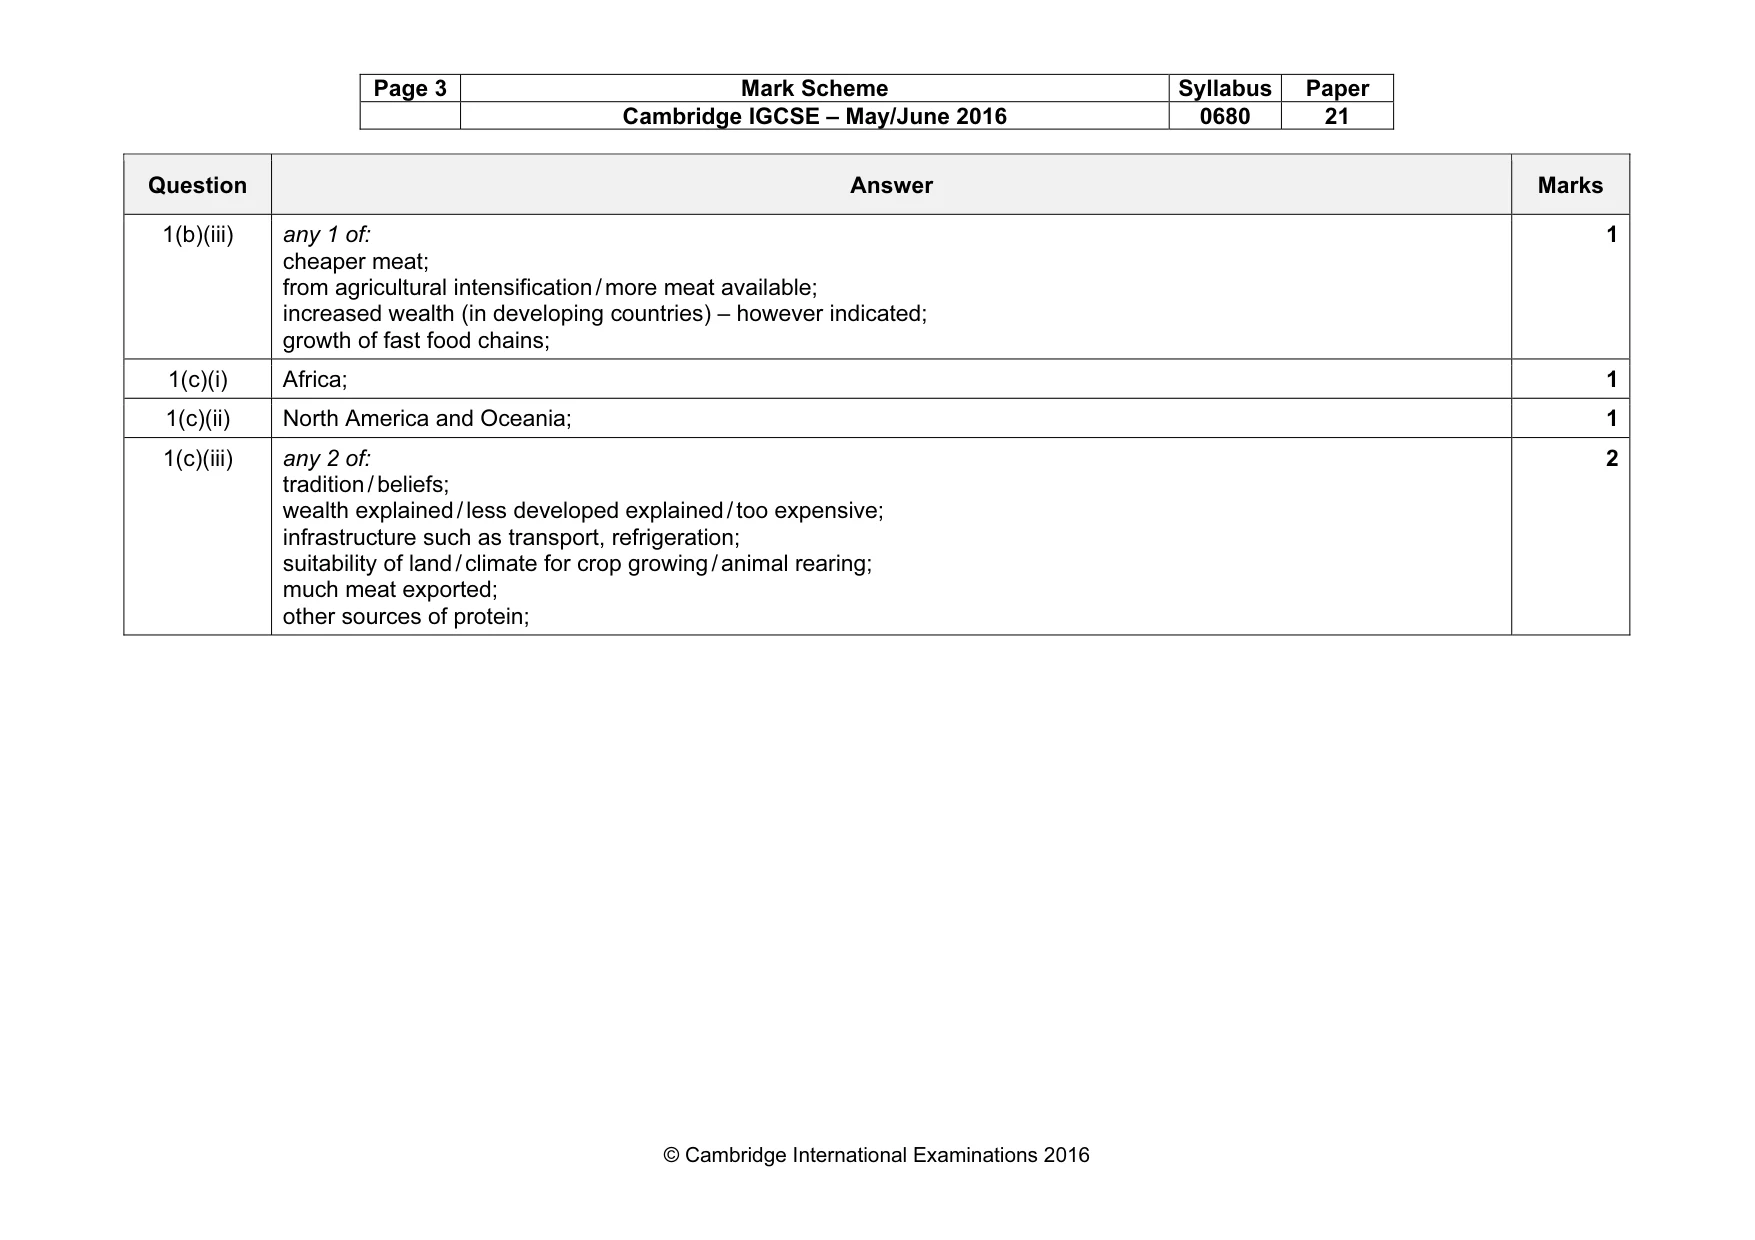
Page 3 Mark Scheme Syllabus Paper Cambridge IGCSE – May/June 2016 0680 21 © Cambridge International Examinations 2016 Question Answer Marks 1(b)(iii) any 1 of: cheaper meat; from agricultural intensification / more meat available; increased wealth (in developing countries) – however indicated; growth of fast food chains; 1 1(c)(i) Africa; 1 1(c)(ii) North America and Oceania; 1 1(c)(iii) any 2 of: tradition / beliefs; wealth explained / less developed explained / too expensive; infrastructure such as transport, refrigeration; suitability of land / climate for crop growing / animal rearing; much meat exported; other sources of protein; 2
Mark scheme, page 4
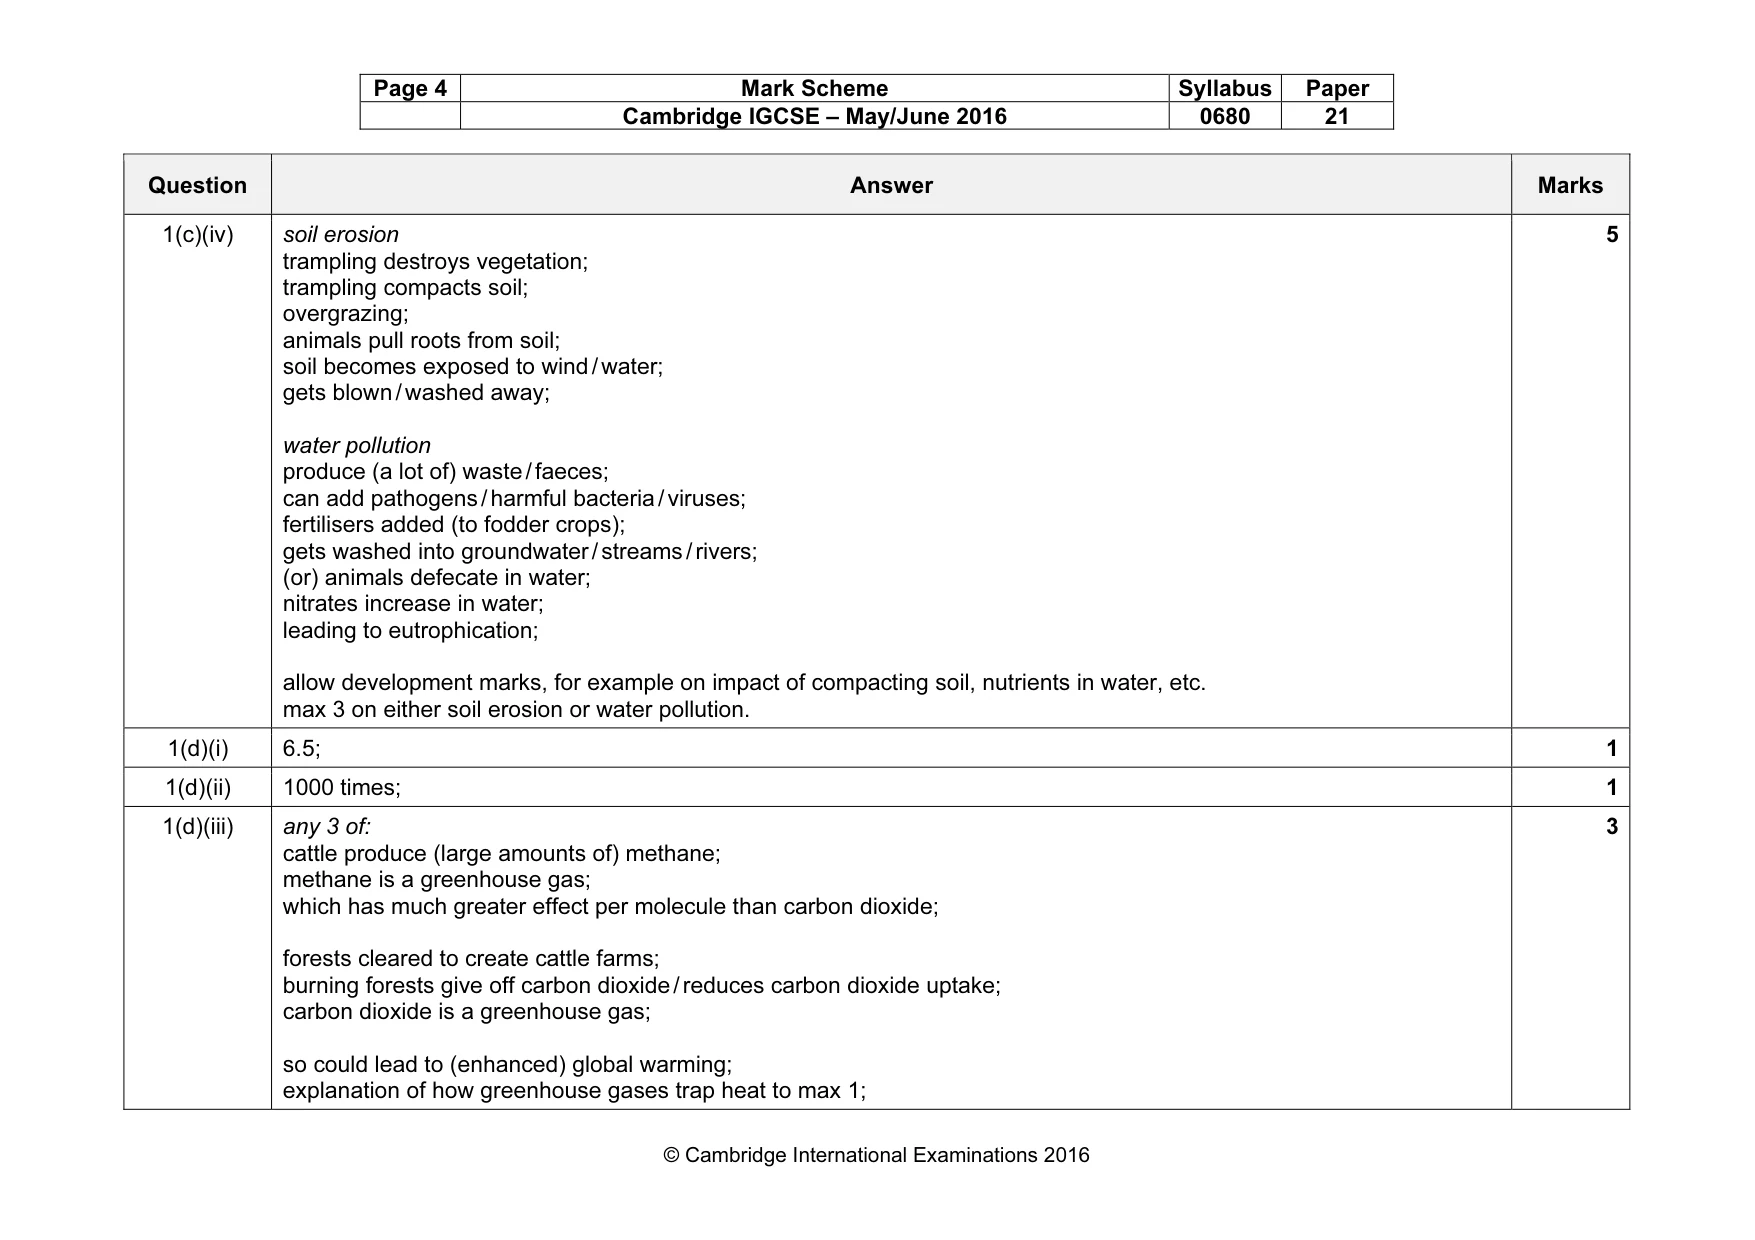
Page 4 Mark Scheme Syllabus Paper Cambridge IGCSE – May/June 2016 0680 21 © Cambridge International Examinations 2016 Question Answer Marks 1(c)(iv) soil erosion trampling destroys vegetation; trampling compacts soil; overgrazing; animals pull roots from soil; soil becomes exposed to wind / water; gets blown / washed away; water pollution produce (a lot of) waste / faeces; can add pathogens / harmful bacteria / viruses; fertilisers added (to fodder crops); gets washed into groundwater / streams / rivers; (or) animals defecate in water; nitrates increase in water; leading to eutrophication; allow development marks, for example on impact of compacting soil, nutrients in water, etc. max 3 on either soil erosion or water pollution. 5 1(d)(i) 6.5; 1 1(d)(ii) 1000 times; 1 1(d)(iii) any 3 of: cattle produce (large amounts of) methane; methane is a greenhouse gas; which has much greater effect per molecule than carbon dioxide; forests cleared to create cattle farms; burning forests give off carbon dioxide / reduces carbon dioxide uptake; carbon dioxide is a greenhouse gas; so could lead to (enhanced) global warming; explanation of how greenhouse gases trap heat to max 1; 3
Mark scheme, page 5
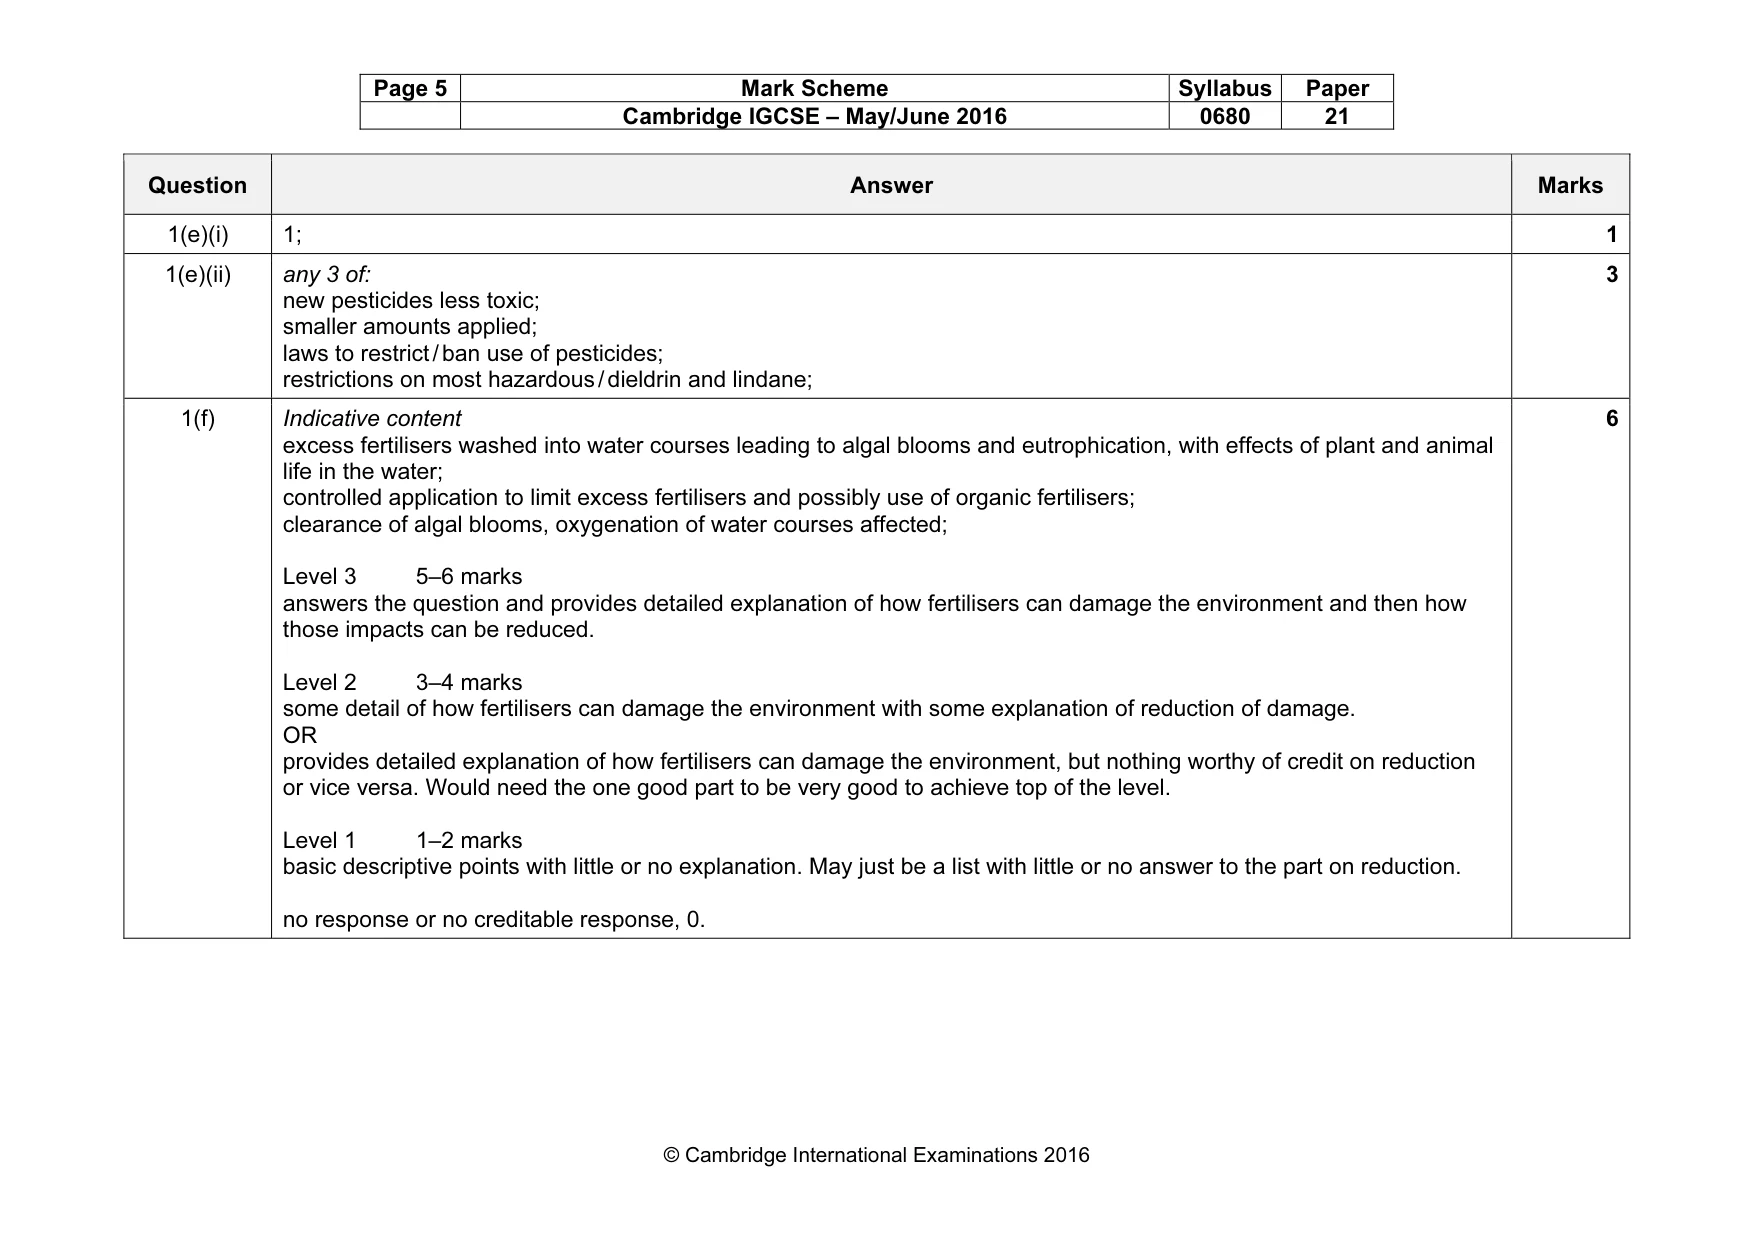
Page 5 Mark Scheme Syllabus Paper Cambridge IGCSE – May/June 2016 0680 21 © Cambridge International Examinations 2016 Question Answer Marks 1(e)(i) 1; 1 1(e)(ii) any 3 of: new pesticides less toxic; smaller amounts applied; laws to restrict / ban use of pesticides; restrictions on most hazardous / dieldrin and lindane; 3 1(f) Indicative content excess fertilisers washed into water courses leading to algal blooms and eutrophication, with effects of plant and animal life in the water; controlled application to limit excess fertilisers and possibly use of organic fertilisers; clearance of algal blooms, oxygenation of water courses affected; Level 3 5–6 marks answers the question and provides detailed explanation of how fertilisers can damage the environment and then how those impacts can be reduced. Level 2 3–4 marks some detail of how fertilisers can damage the environment with some explanation of reduction of damage. OR provides detailed explanation of how fertilisers can damage the environment, but nothing worthy of credit on reduction or vice versa. Would need the one good part to be very good to achieve top of the level. Level 1 1–2 marks basic descriptive points with little or no explanation. May just be a list with little or no answer to the part on reduction. no response or no creditable response, 0. 6
Mark scheme, page 6
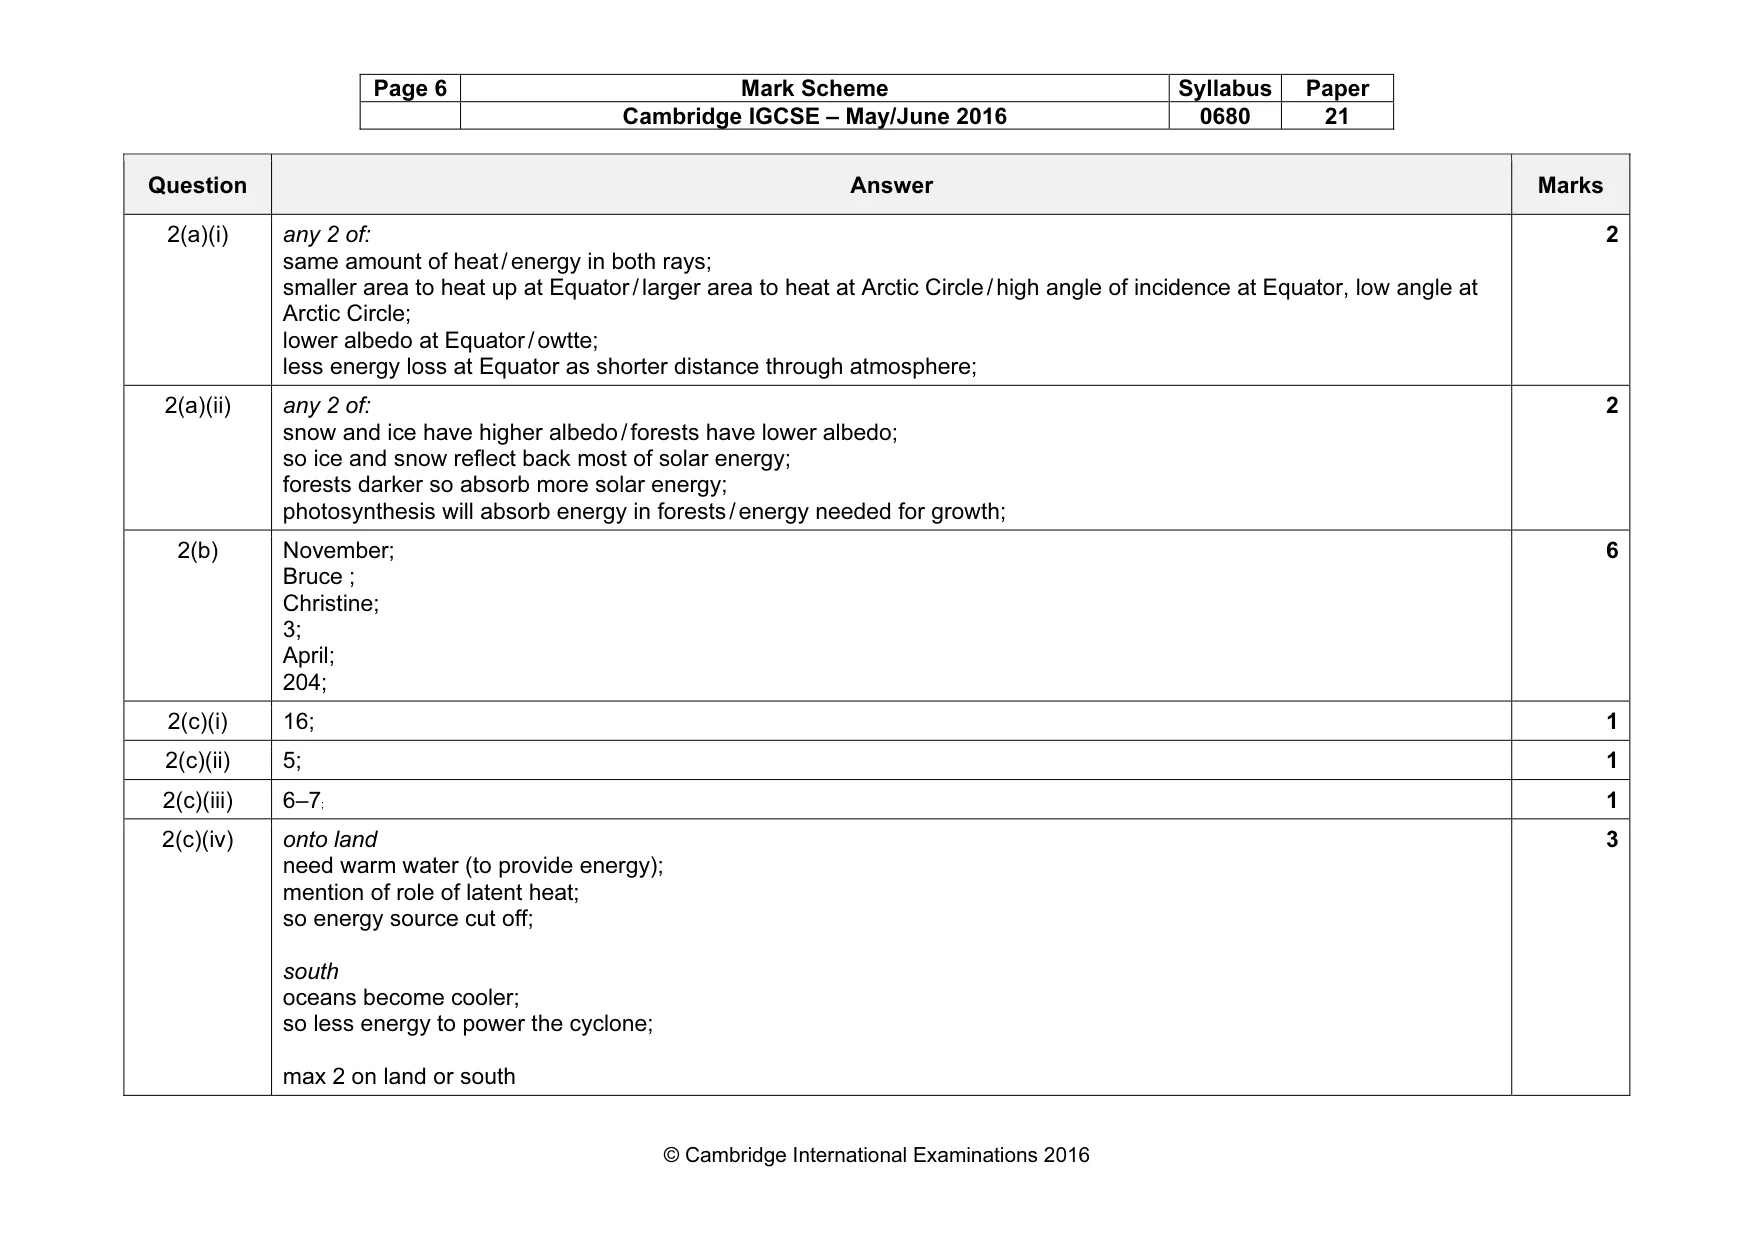
Page 6 Mark Scheme Syllabus Paper Cambridge IGCSE – May/June 2016 0680 21 © Cambridge International Examinations 2016 Question Answer Marks 2(a)(i) any 2 of: same amount of heat / energy in both rays; smaller area to heat up at Equator / larger area to heat at Arctic Circle / high angle of incidence at Equator, low angle at Arctic Circle; lower albedo at Equator / owtte; less energy loss at Equator as shorter distance through atmosphere; 2 2(a)(ii) any 2 of: snow and ice have higher albedo / forests have lower albedo; so ice and snow reflect back most of solar energy; forests darker so absorb more solar energy; photosynthesis will absorb energy in forests / energy needed for growth; 2 2(b) November; Bruce ; Christine; 3; April; 204; 6 2(c)(i) 16; 1 2(c)(ii) 5; 1 2(c)(iii) 6–7; 1 2(c)(iv) onto land need warm water (to provide energy); mention of role of latent heat; so energy source cut off; south oceans become cooler; so less energy to power the cyclone; max 2 on land or south 3
Mark scheme, page 7
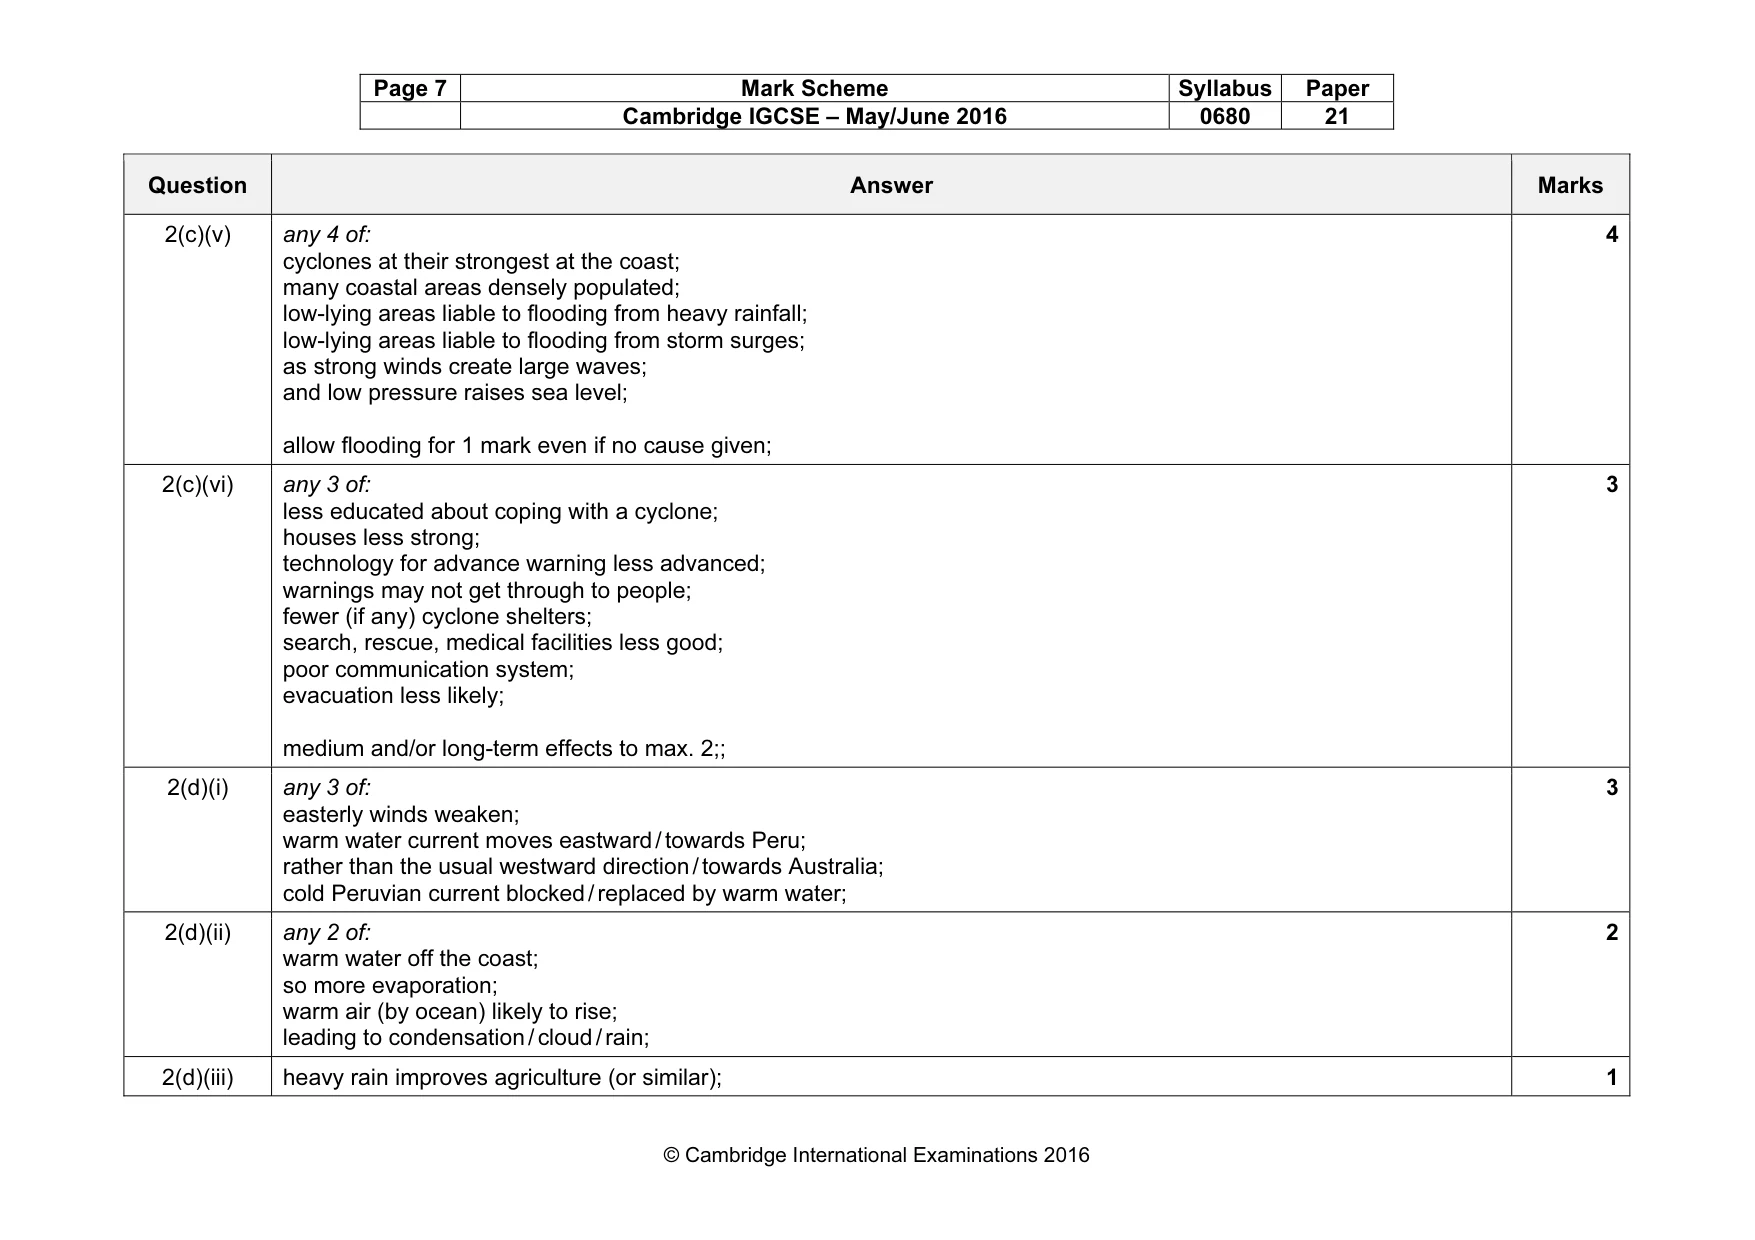
Page 7 Mark Scheme Syllabus Paper Cambridge IGCSE – May/June 2016 0680 21 © Cambridge International Examinations 2016 Question Answer Marks 2(c)(v) any 4 of: cyclones at their strongest at the coast; many coastal areas densely populated; low-lying areas liable to flooding from heavy rainfall; low-lying areas liable to flooding from storm surges; as strong winds create large waves; and low pressure raises sea level; allow flooding for 1 mark even if no cause given; 4 2(c)(vi) any 3 of: less educated about coping with a cyclone; houses less strong; technology for advance warning less advanced; warnings may not get through to people; fewer (if any) cyclone shelters; search, rescue, medical facilities less good; poor communication system; evacuation less likely; medium and/or long-term effects to max. 2;; 3 2(d)(i) any 3 of: easterly winds weaken; warm water current moves eastward / towards Peru; rather than the usual westward direction / towards Australia; cold Peruvian current blocked / replaced by warm water; 3 2(d)(ii) any 2 of: warm water off the coast; so more evaporation; warm air (by ocean) likely to rise; leading to condensation / cloud / rain; 2 2(d)(iii) heavy rain improves agriculture (or similar); 1
Mark scheme, page 8
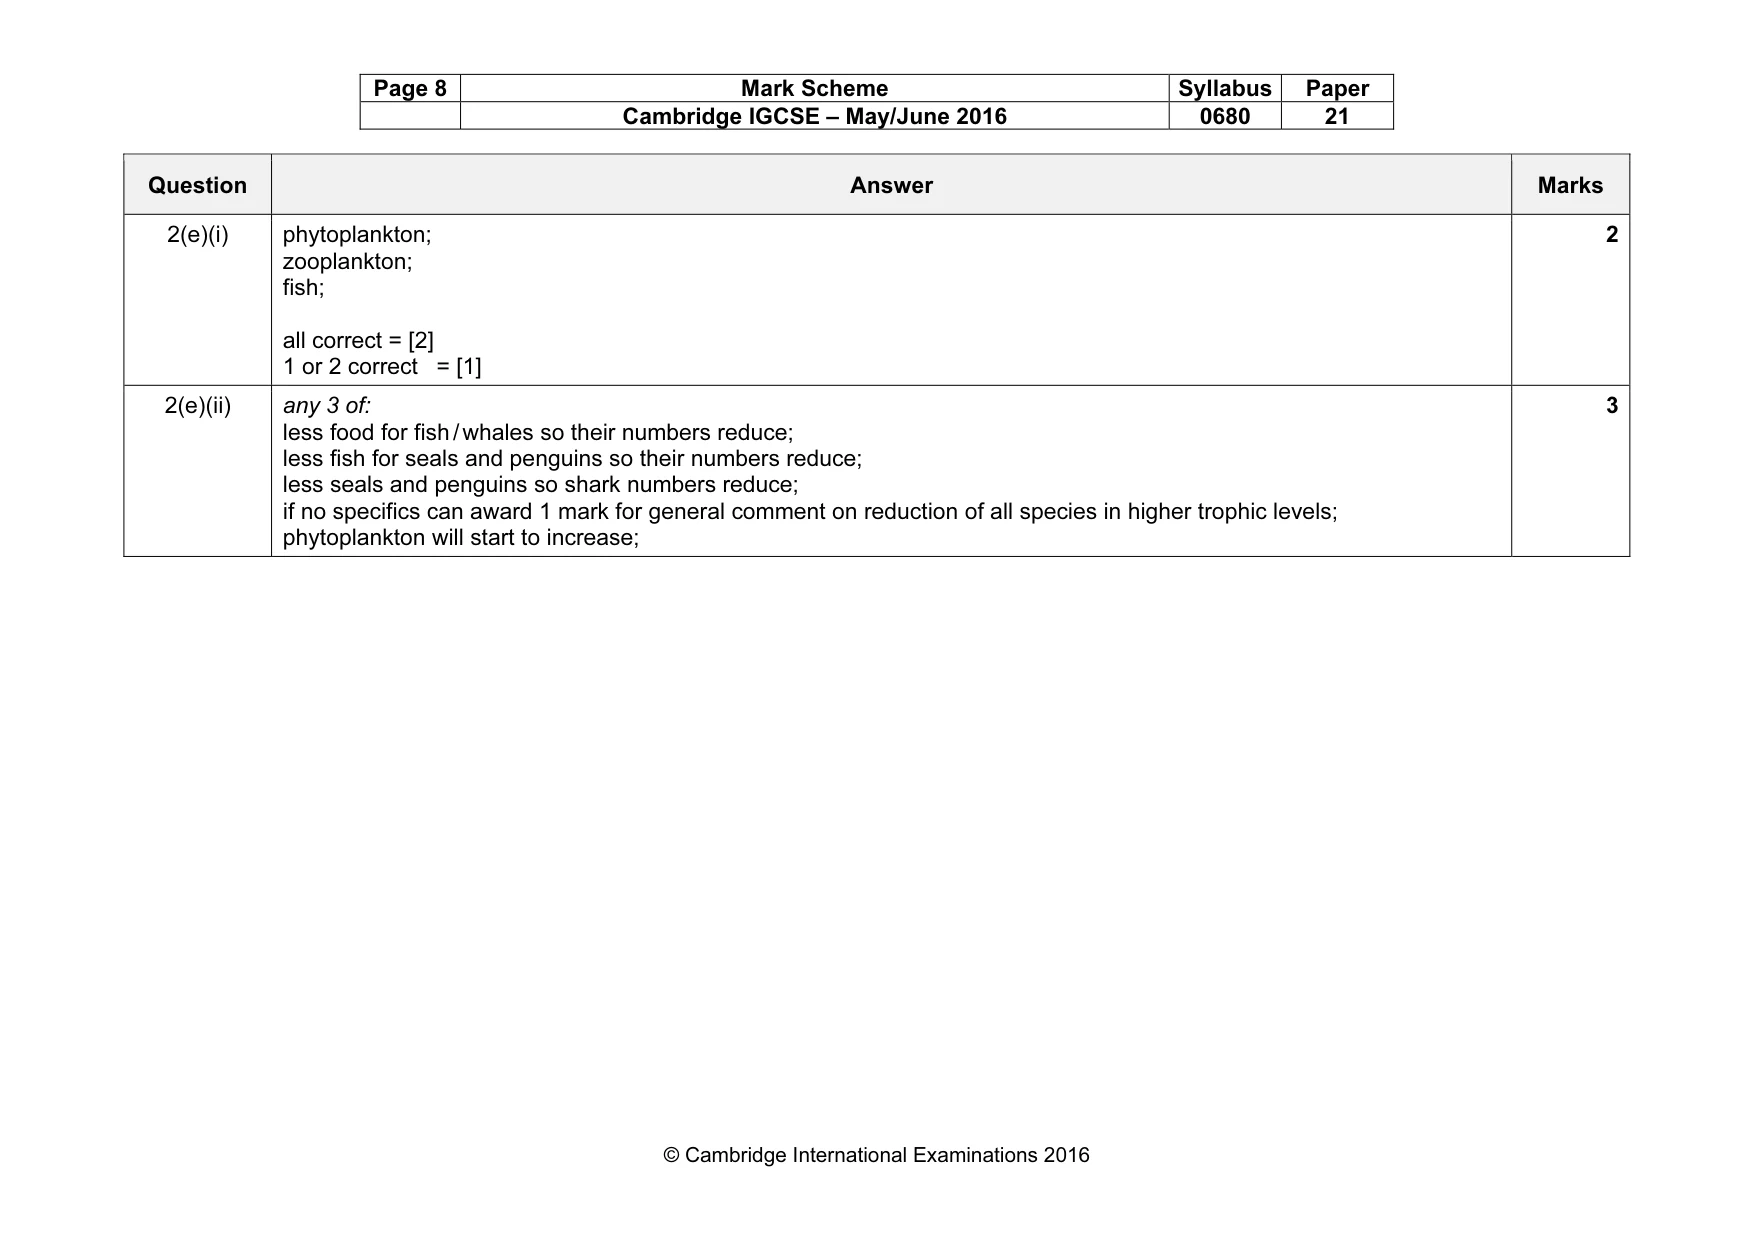
Page 8 Mark Scheme Syllabus Paper Cambridge IGCSE – May/June 2016 0680 21 © Cambridge International Examinations 2016 Question Answer Marks 2(e)(i) phytoplankton; zooplankton; fish; all correct = [2] 1 or 2 correct = [1] 2 2(e)(ii) any 3 of: less food for fish / whales so their numbers reduce; less fish for seals and penguins so their numbers reduce; less seals and penguins so shark numbers reduce; if no specifics can award 1 mark for general comment on reduction of all species in higher trophic levels; phytoplankton will start to increase; 3
Mark scheme, page 9
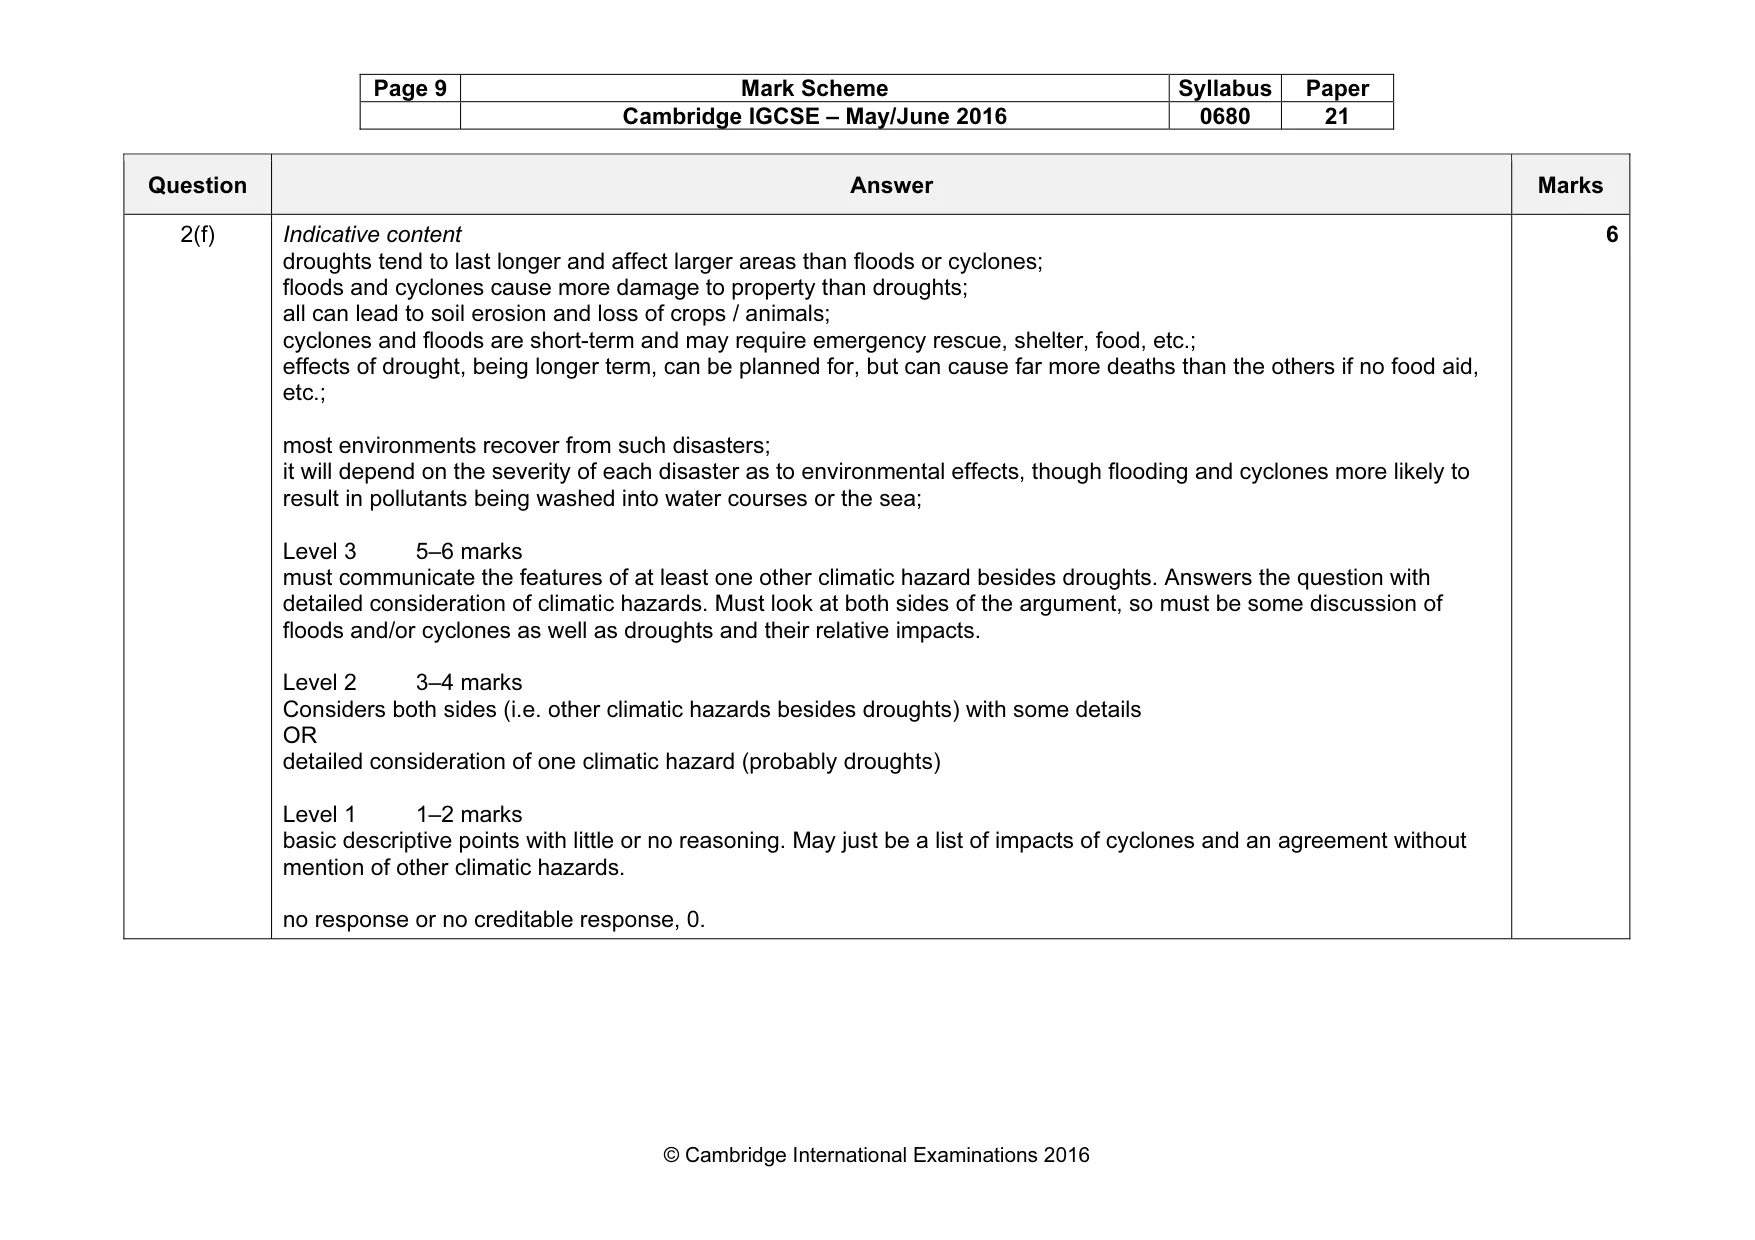
Page 9 Mark Scheme Syllabus Paper Cambridge IGCSE – May/June 2016 0680 21 © Cambridge International Examinations 2016 Question Answer Marks 2(f) Indicative content droughts tend to last longer and affect larger areas than floods or cyclones; floods and cyclones cause more damage to property than droughts; all can lead to soil erosion and loss of crops / animals; cyclones and floods are short-term and may require emergency rescue, shelter, food, etc.; effects of drought, being longer term, can be planned for, but can cause far more deaths than the others if no food aid, etc.; most environments recover from such disasters; it will depend on the severity of each disaster as to environmental effects, though flooding and cyclones more likely to result in pollutants being washed into water courses or the sea; Level 3 5–6 marks must communicate the features of at least one other climatic hazard besides droughts. Answers the question with detailed consideration of climatic hazards. Must look at both sides of the argument, so must be some discussion of floods and/or cyclones as well as droughts and their relative impacts. Level 2 3–4 marks Considers both sides (i.e. other climatic hazards besides droughts) with some details OR detailed consideration of one climatic hazard (probably droughts) Level 1 1–2 marks basic descriptive points with little or no reasoning. May just be a list of impacts of cyclones and an agreement without mention of other climatic hazards. no response or no creditable response, 0. 6
What you needed in this session
Cambridge’s own grade thresholds for 2016 May/June, Paper 2 · Variant 1. A higher threshold means an easier paper — the bar moves with how the cohort did.