Cambridge IGCSE Environmental Management 0680 — 2016 Feb/March Paper 2 · Variant 2
0680/22/F/M/16 · 80 marks · ≈90 min
The question paper and its mark scheme, free to read here and free to download. This is Cambridge’s own paper, exactly as it was sat.
Question paper12 pages
Mark scheme10 pages
Answers below. Sit the paper first if you are practising.
Paper as text
Question paper, page 1
This document consists of 12 printed pages. DC (LEG/SG) 106671/5 © UCLES 2016 [Turn over Cambridge International Examinations Cambridge International General Certificate of Secondary Education * 1 7 3 0 6 1 2 9 2 4 * ENVIRONMENTAL MANAGEMENT 0680/22 Paper 2 February/March 2016 1 hour 45 minutes Candidates answer on the Question Paper. No Additional Materials are required. READ THESE INSTRUCTIONS FIRST Write your Centre number, candidate number and name on all the work you hand in. Write in dark blue or black pen. You may use an HB pencil for any diagrams or graphs. Do not use staples, paper clips, glue or correction fluid. DO NOT WRITE IN ANY BARCODES. Answer both questions. Electronic calculators may be used. You may lose marks if you do not show your working or if you do not use appropriate units. At the end of the examination, fasten all your work securely together. The number of marks is given in brackets [ ] at the end of each question or part question.
Question paper, page 2
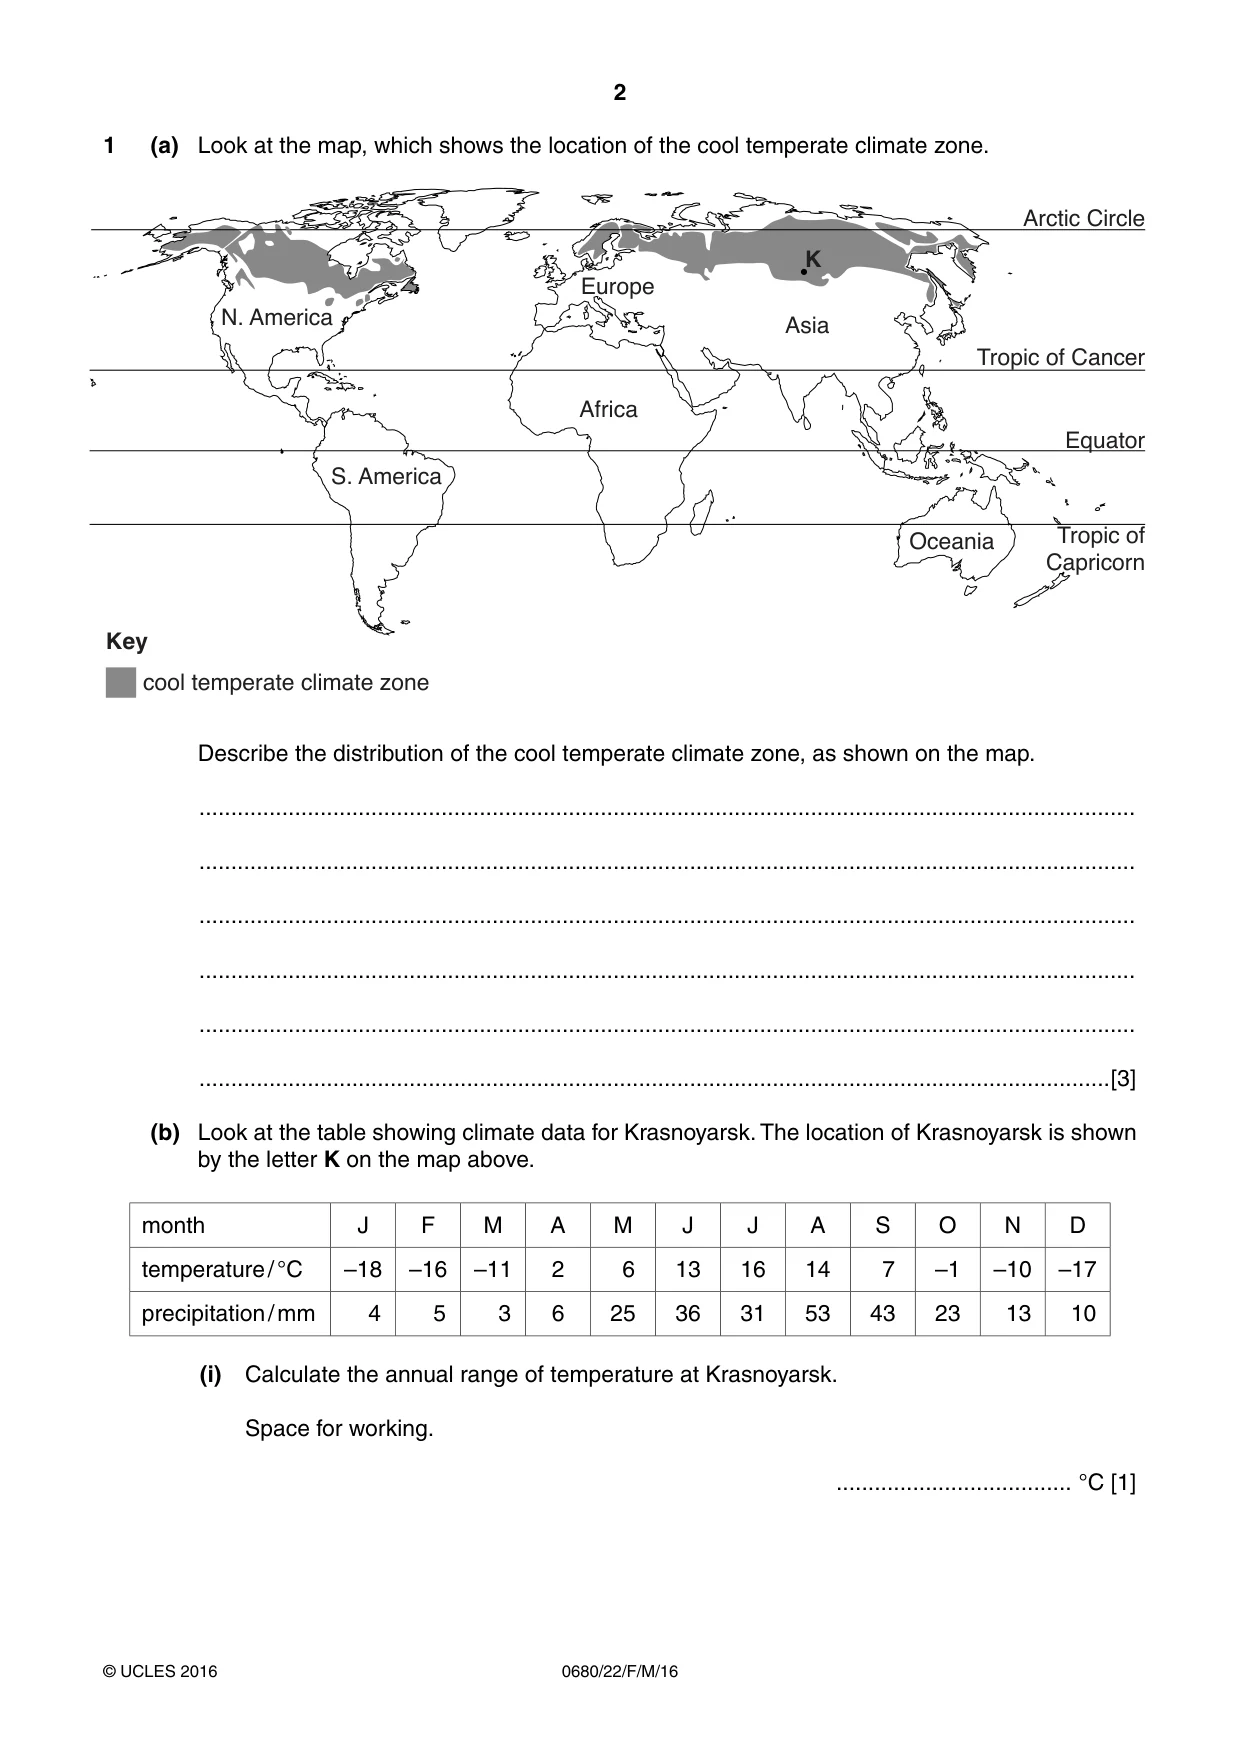
2 0680/22/F/M/16 © UCLES 2016 1 (a) Look at the map, which shows the location of the cool temperate climate zone. Arctic Circle Tropic of Cancer Tropic of Capricorn Equator N. America S. America Africa Europe Asia Oceania K Key cool temperate climate zone Describe the distribution of the cool temperate climate zone, as shown on the map. … … … … … …[3] (b) Look at the table showing climate data for Krasnoyarsk. The location of Krasnoyarsk is shown by the letter K on the map above. month J F M A M J J A S O N D temperature / °C –18 –16 –11 2 6 13 16 14 7 –1 –10 –17 precipitation / mm 4 5 3 6 25 36 31 53 43 23 13 10 (i) Calculate the annual range of temperature at Krasnoyarsk. Space for working. … °C [1]
Question paper, page 3
3 0680/22/F/M/16 © UCLES 2016 [Turn over (ii) Describe the climate of Krasnoyarsk. … … … … … … … …[4] (iii) Temperatures need to be at least 6 °C for plants to grow. State the length of the growing season in Krasnoyarsk. … months [1] (iv) Suggest why areas with a cool temperate climate have a low human population. … … … …[2]
Question paper, page 4
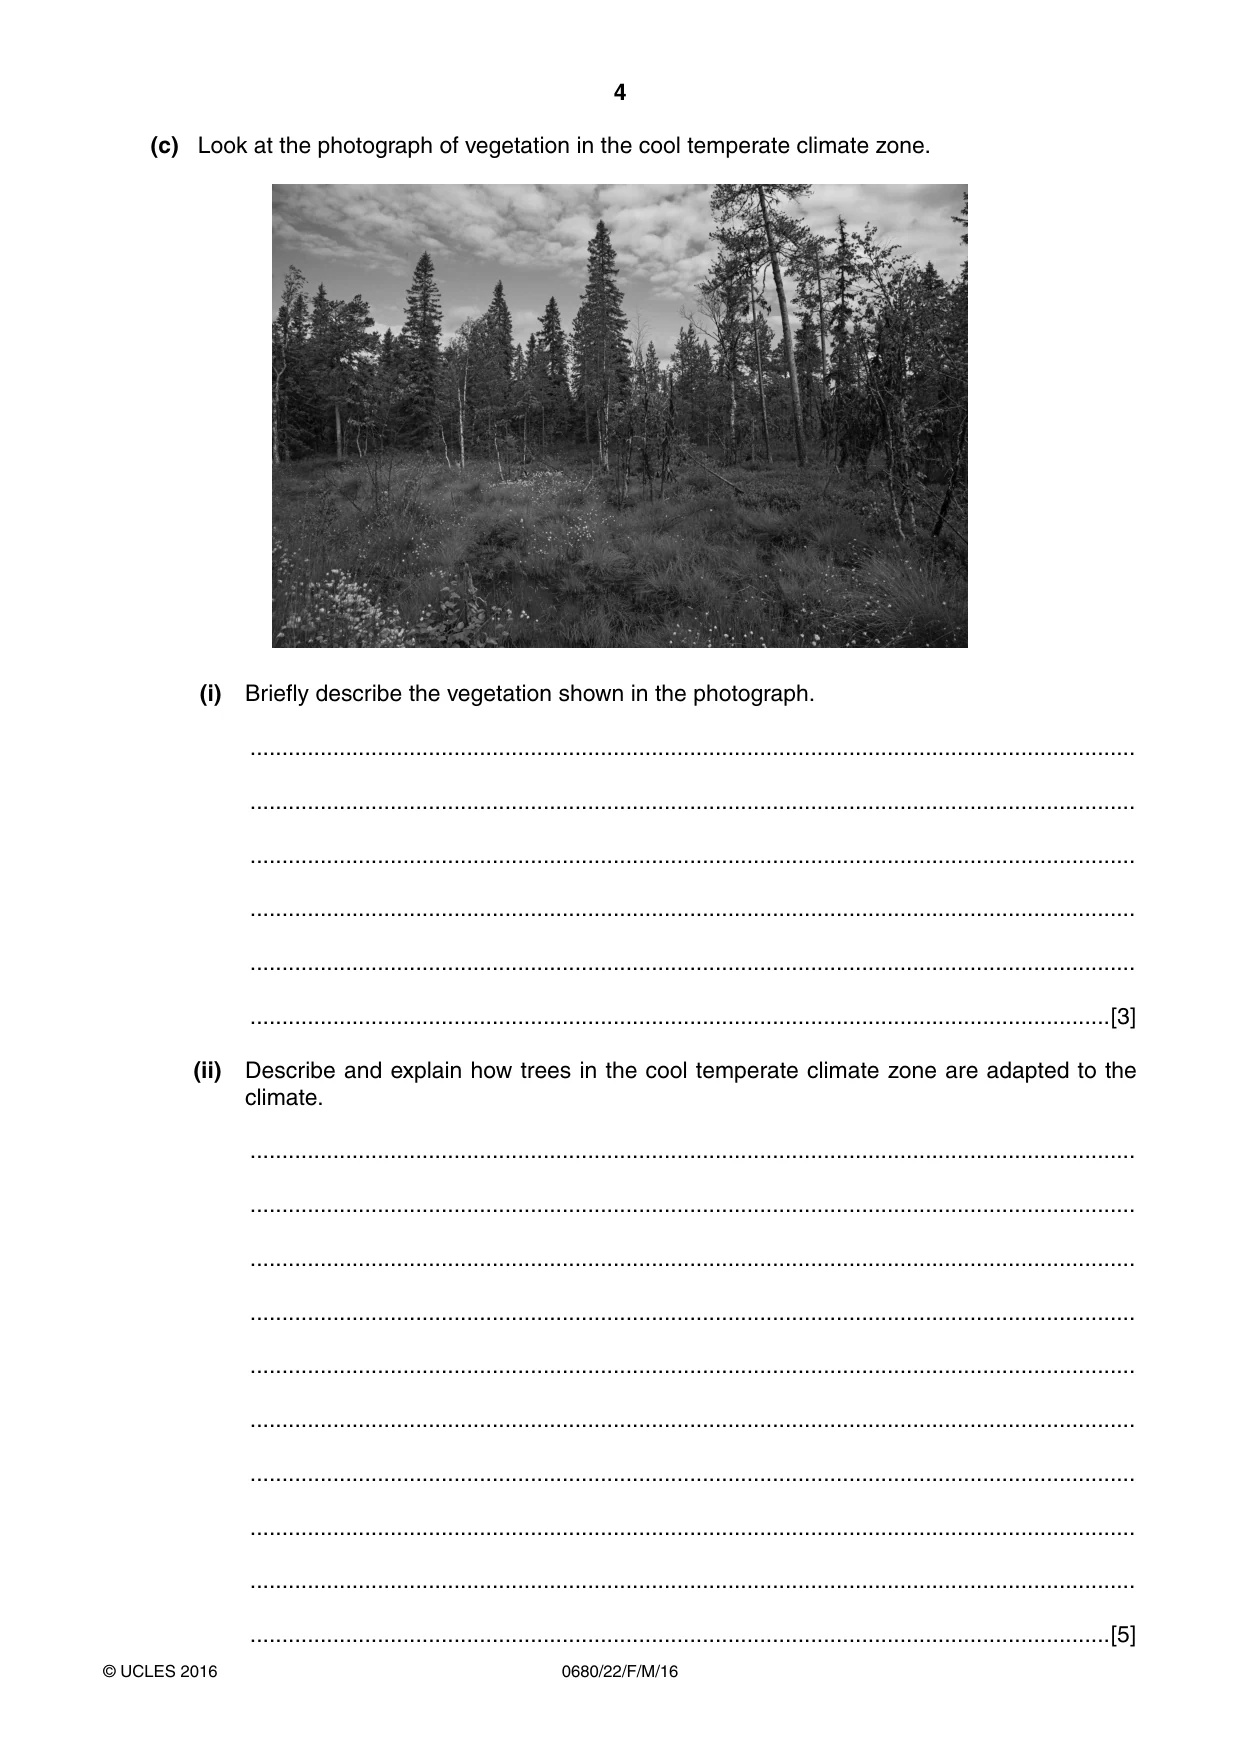
4 0680/22/F/M/16 © UCLES 2016 (c) Look at the photograph of vegetation in the cool temperate climate zone. (i) Briefly describe the vegetation shown in the photograph. … … … … … …[3] (ii) Describe and explain how trees in the cool temperate climate zone are adapted to the climate. … … … … … … … … … …[5]
Question paper, page 5
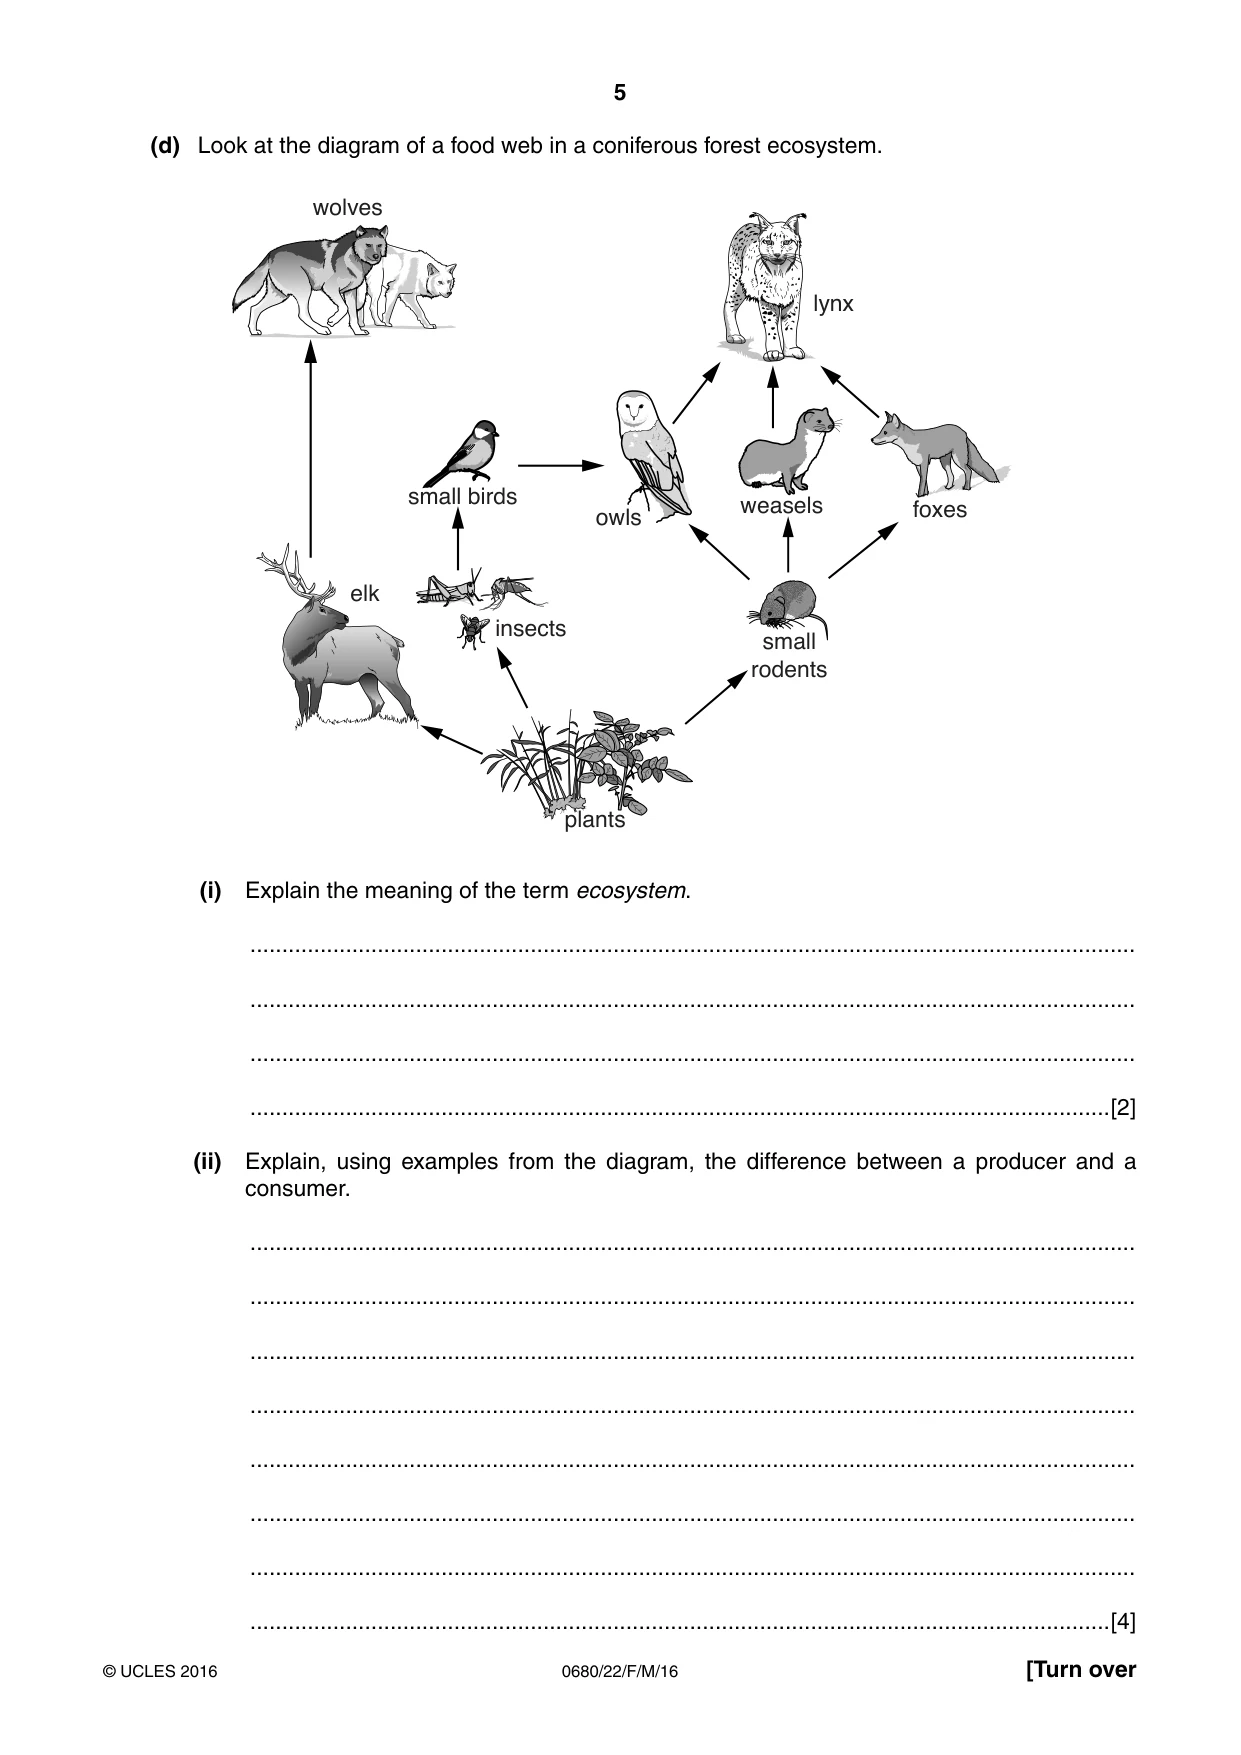
5 0680/22/F/M/16 © UCLES 2016 [Turn over (d) Look at the diagram of a food web in a coniferous forest ecosystem. wolves elk insects plants small rodents small birds owls weasels foxes lynx (i) Explain the meaning of the term ecosystem. … … … …[2] (ii) Explain, using examples from the diagram, the difference between a producer and a consumer. … … … … … … … …[4]
Question paper, page 6
6 0680/22/F/M/16 © UCLES 2016 (iii) Explain the roles of soil organisms, such as bacteria, worms and fungi, in the ecosystem. … … … … … …[3] (iv) Some parts of the coniferous forest are under threat from logging. State two uses of the wood. … …[2] (v) Describe the effects of logging on the coniferous forest ecosystem shown in the food web diagram. … … … … … … … …[4]
Question paper, page 7
7 0680/22/F/M/16 © UCLES 2016 [Turn over (e) ‘Coniferous forests can be logged and the ecosystem conserved.’ How far do you agree with this statement? Give reasons for your answer. … … … … … … … … … … … …[6]
Question paper, page 8
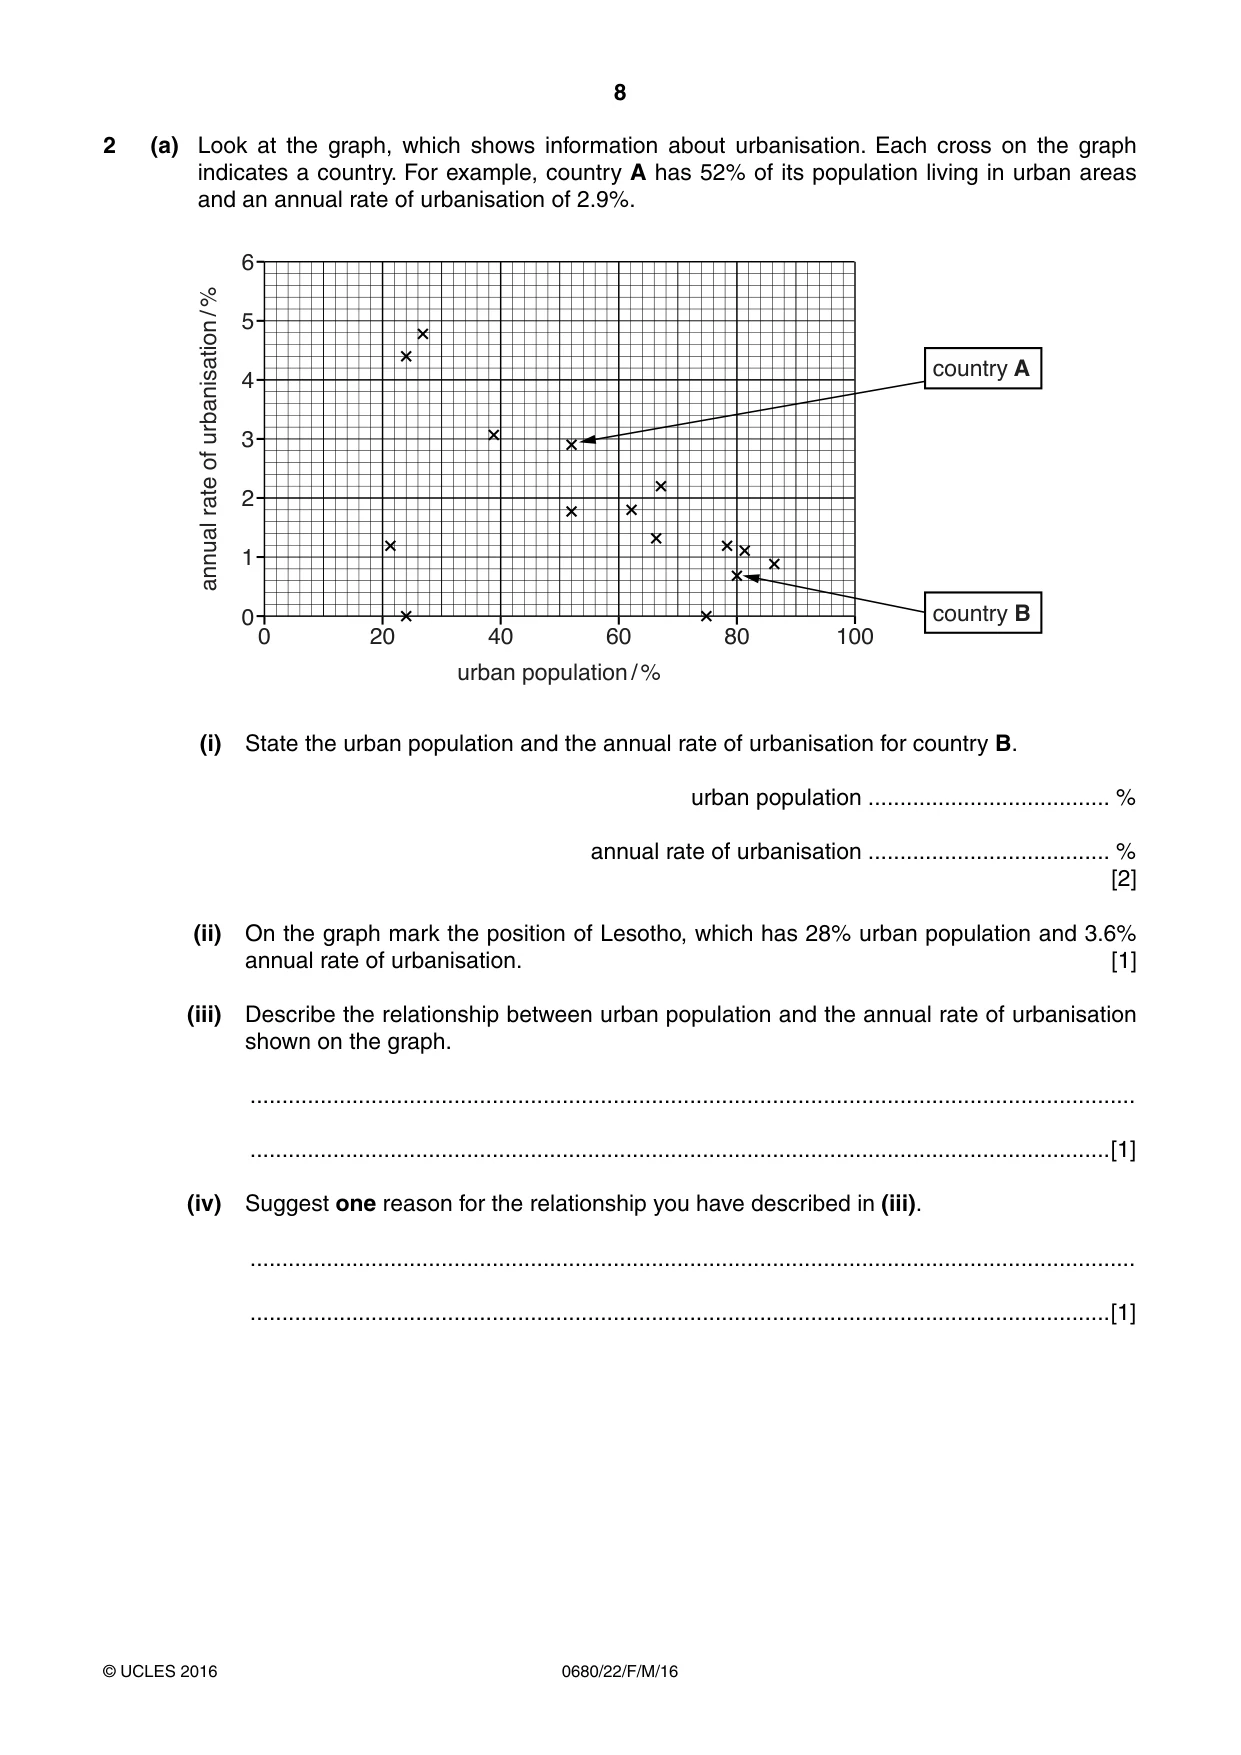
8 0680/22/F/M/16 © UCLES 2016 2 (a) Look at the graph, which shows information about urbanisation. Each cross on the graph indicates a country. For example, country A has 52% of its population living in urban areas and an annual rate of urbanisation of 2.9%. 6 5 4 3 2 1 0 0 20 40 60 80 100 annual rate of urbanisation / % urban population / % country A country B (i) State the urban population and the annual rate of urbanisation for country B. urban population … % annual rate of urbanisation … % [2] (ii) On the graph mark the position of Lesotho, which has 28% urban population and 3.6% annual rate of urbanisation. [1] (iii) Describe the relationship between urban population and the annual rate of urbanisation shown on the graph. … …[1] (iv) Suggest one reason for the relationship you have described in (iii). … …[1]
Question paper, page 9
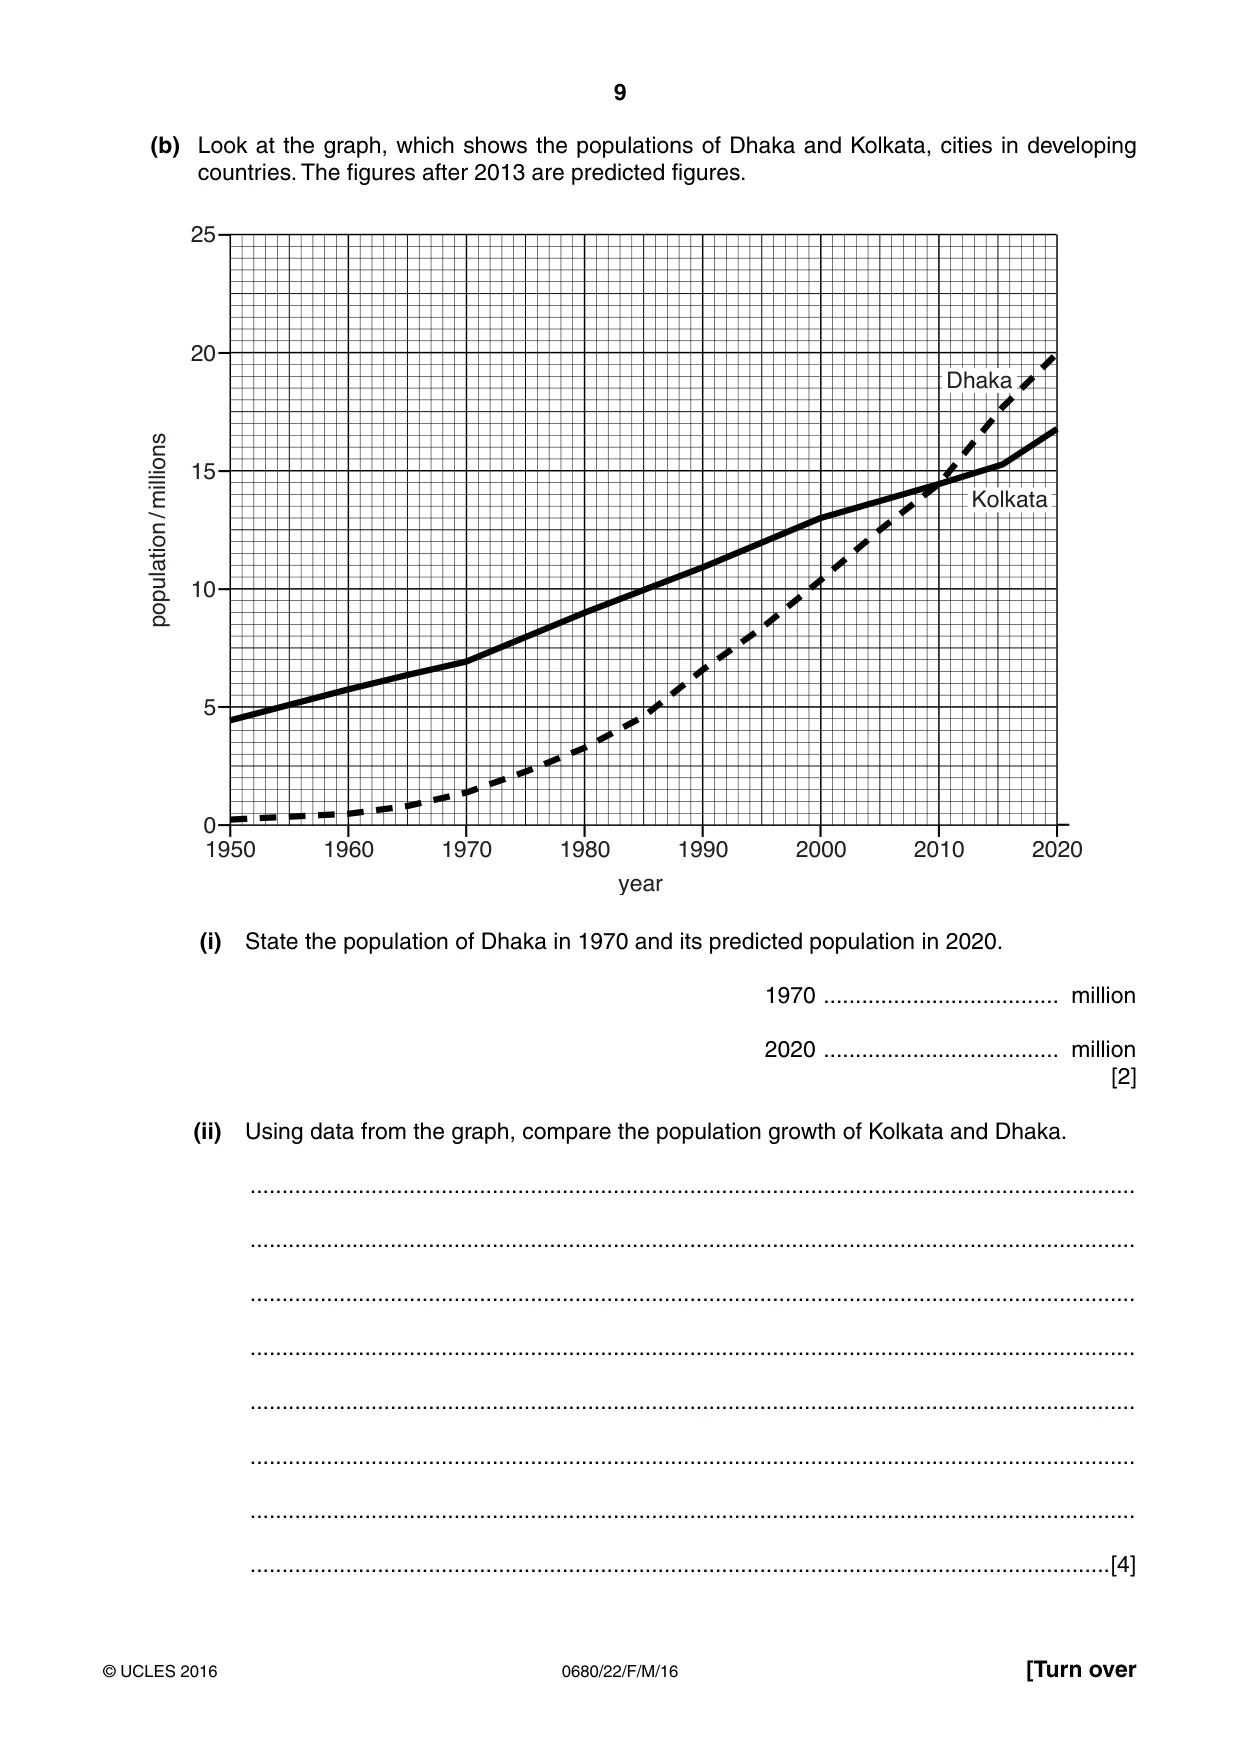
9 0680/22/F/M/16 © UCLES 2016 [Turn over (b) Look at the graph, which shows the populations of Dhaka and Kolkata, cities in developing countries. The figures after 2013 are predicted figures. 25 20 15 10 5 0 1950 1960 1970 1980 1990 2000 2010 2020 Dhaka Kolkata population / millions year (i) State the population of Dhaka in 1970 and its predicted population in 2020. 1970 … million 2020 … million [2] (ii) Using data from the graph, compare the population growth of Kolkata and Dhaka. … … … … … … … …[4]
Question paper, page 10
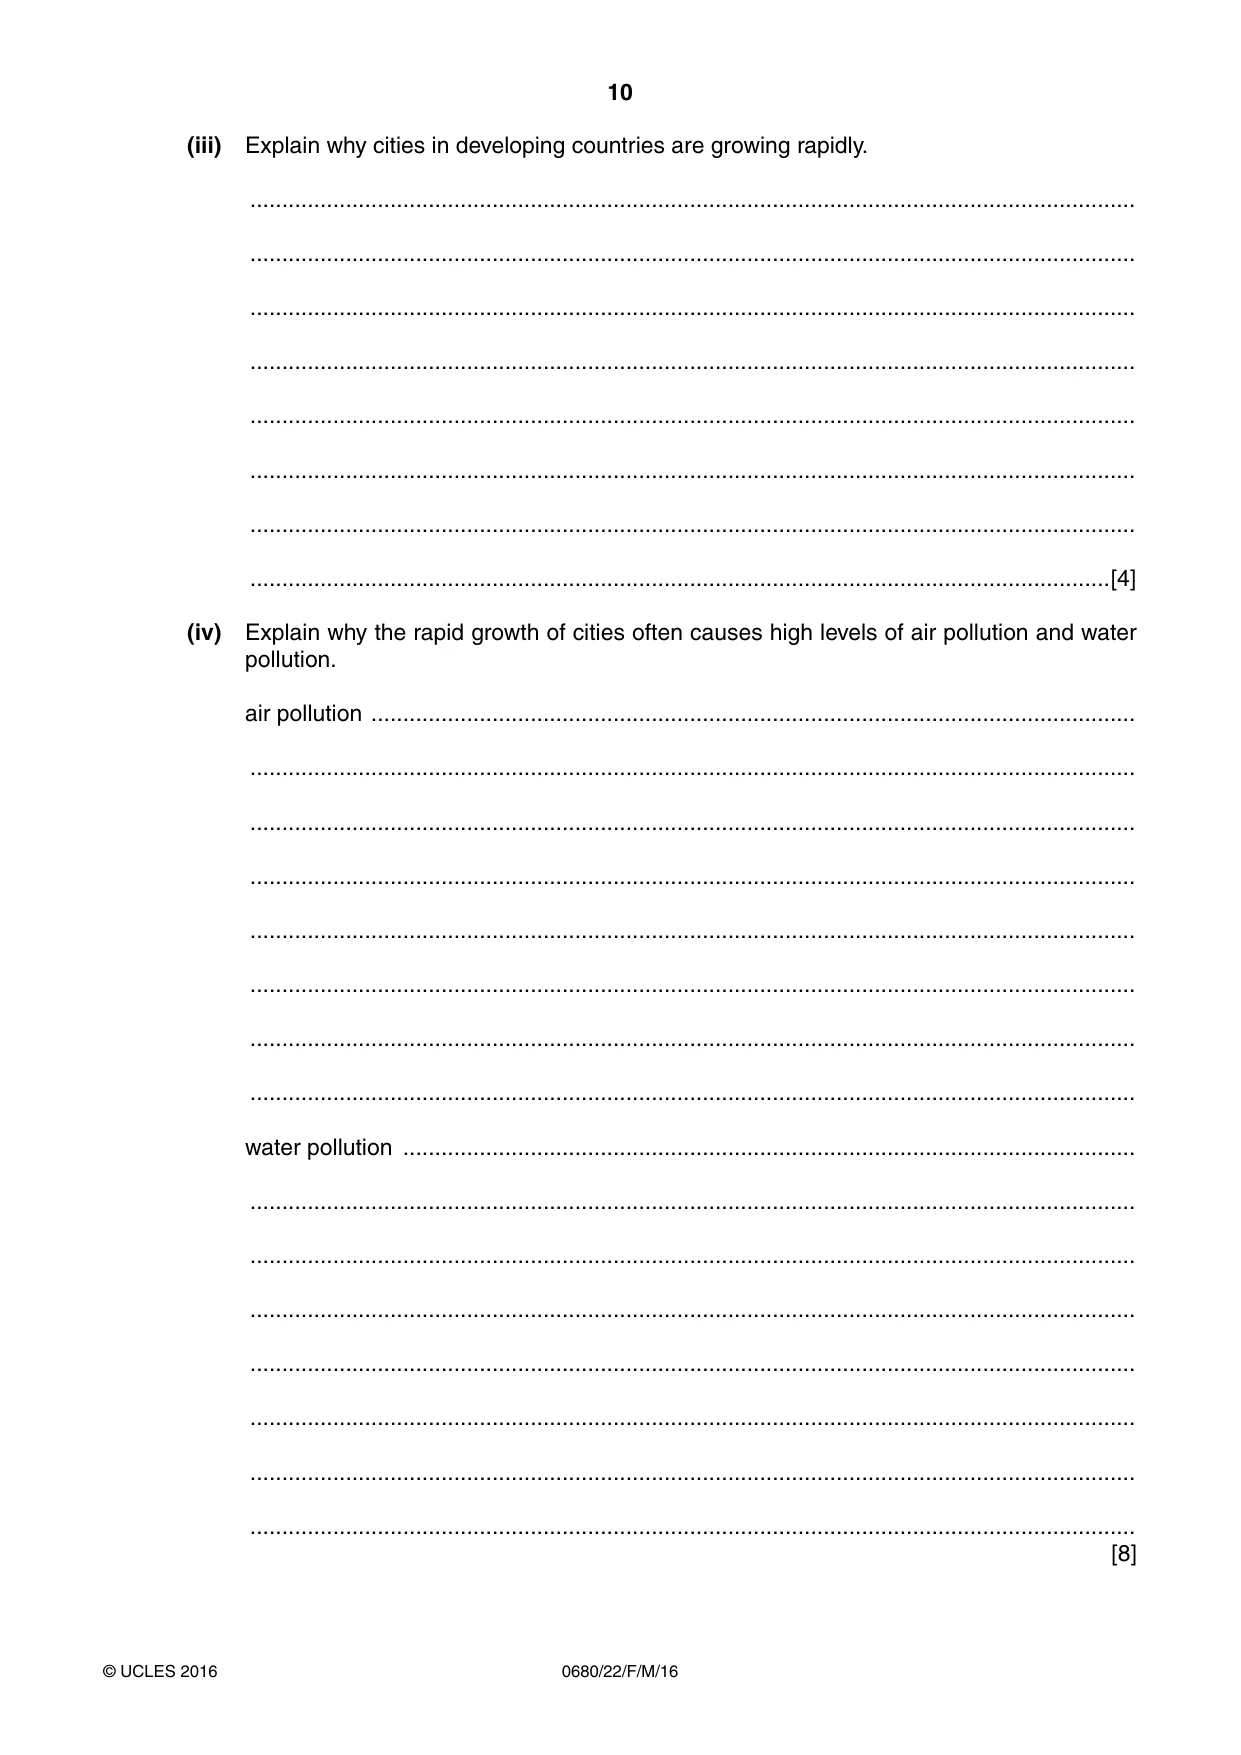
10 0680/22/F/M/16 © UCLES 2016 (iii) Explain why cities in developing countries are growing rapidly. … … … … … … … …[4] (iv) Explain why the rapid growth of cities often causes high levels of air pollution and water pollution. air pollution … … … … … … … … water pollution … … … … … … … … [8]
Question paper, page 11
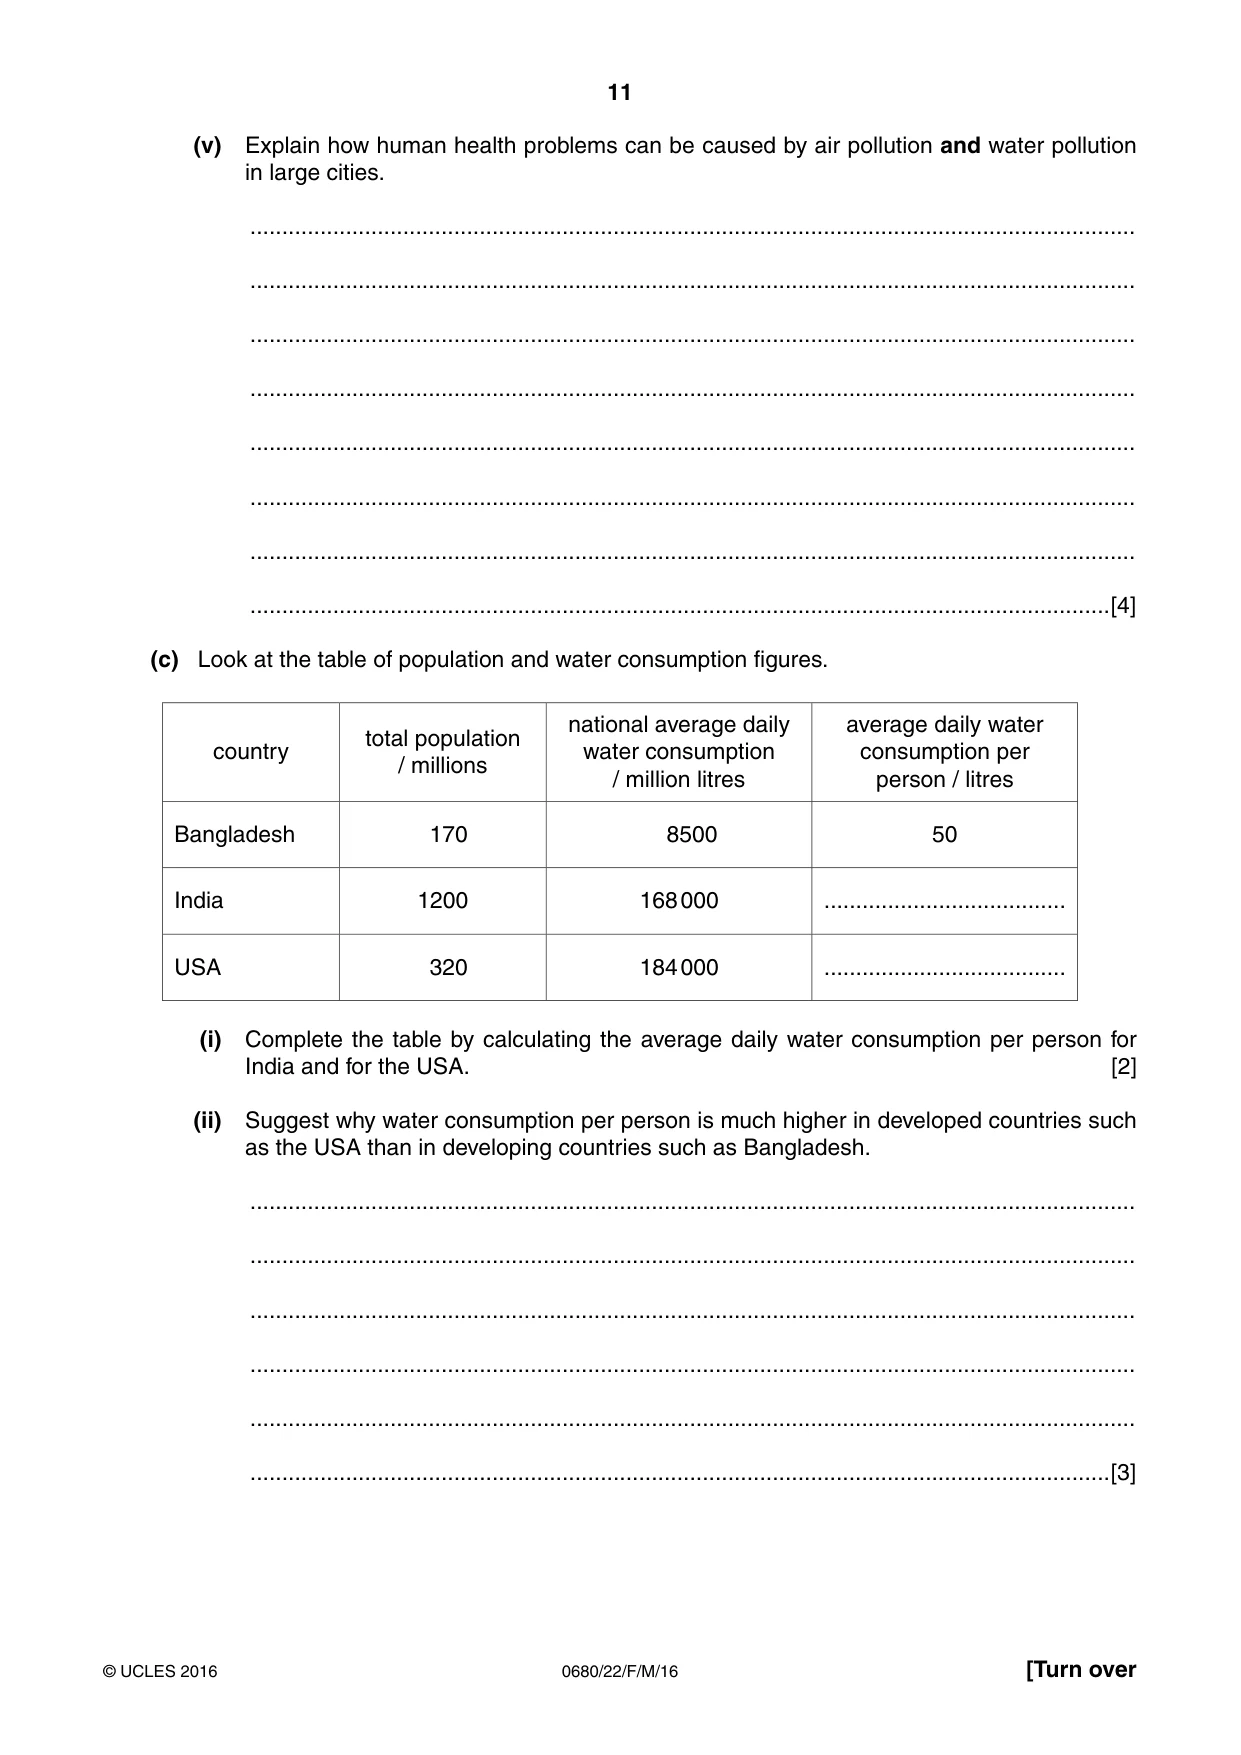
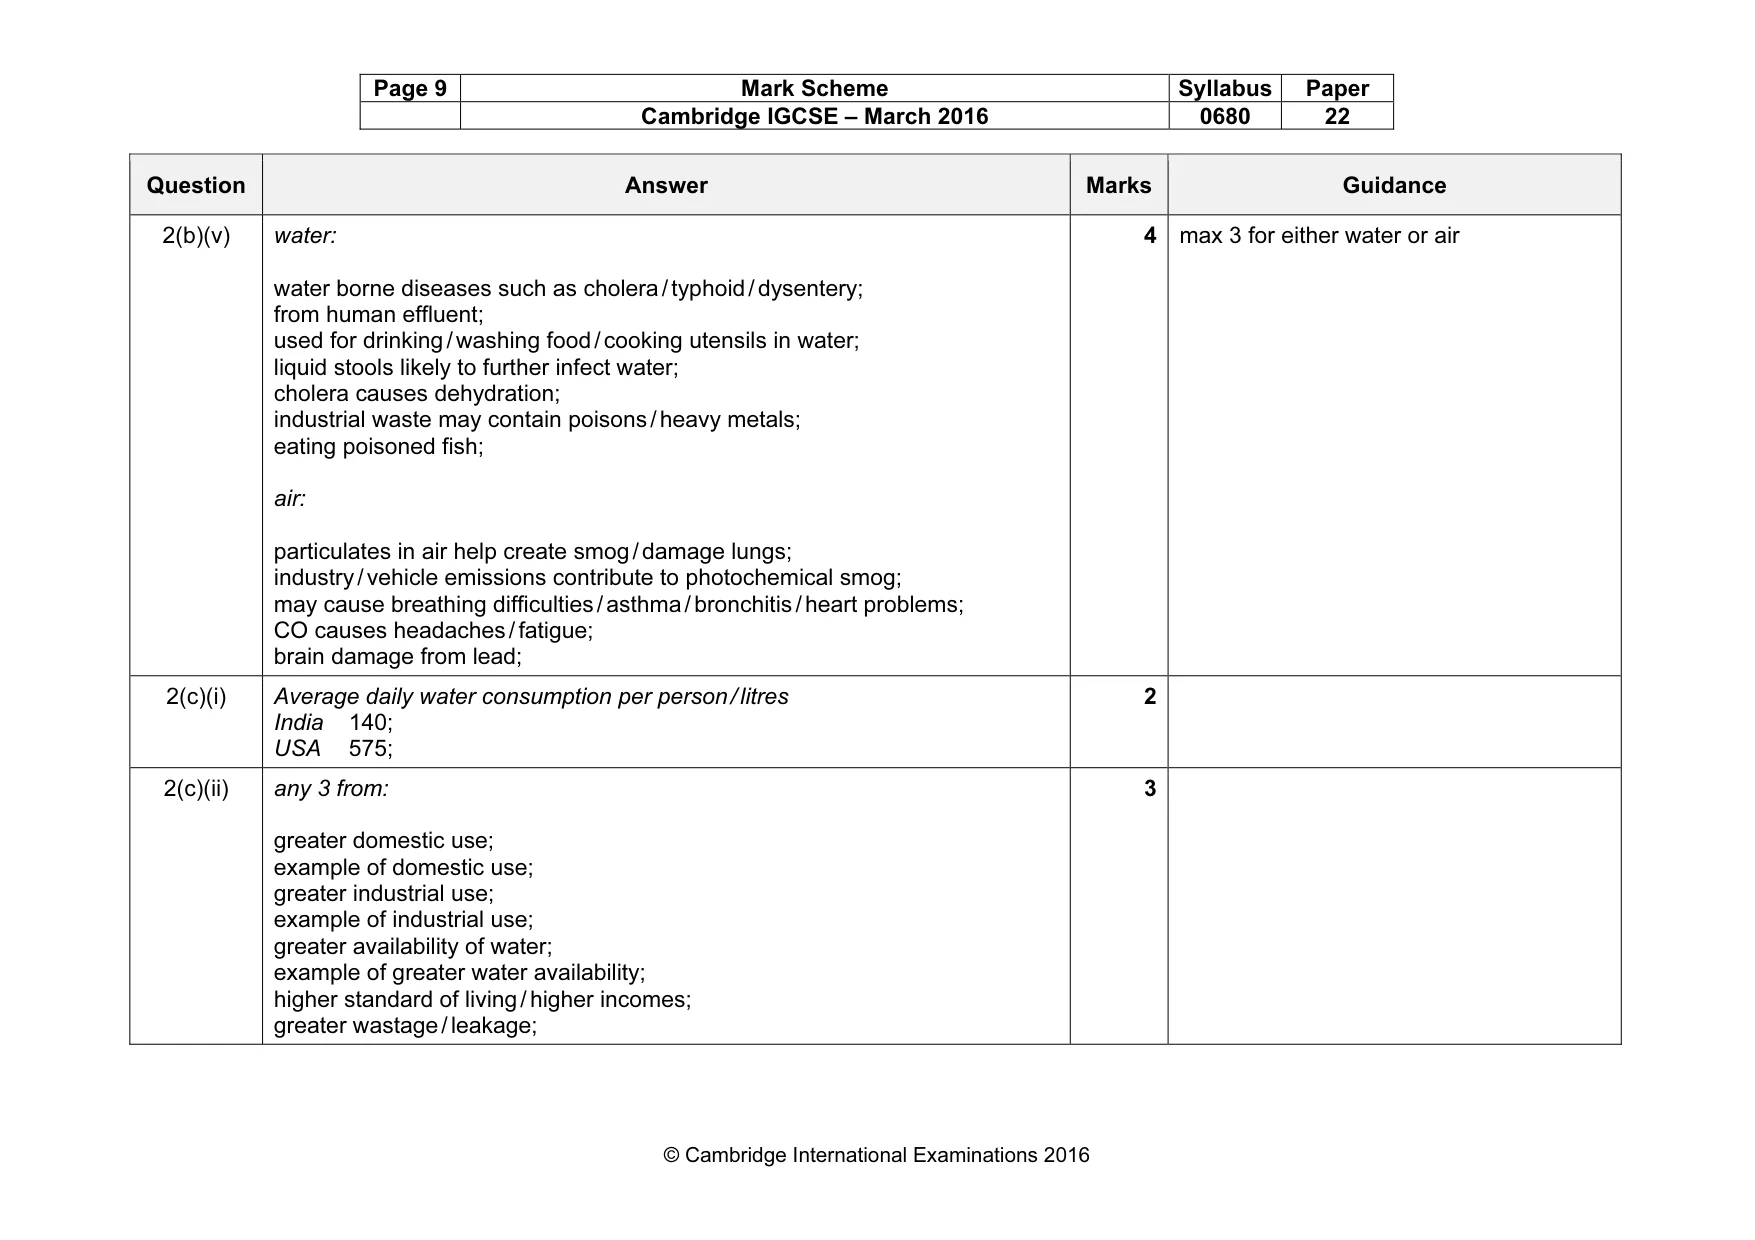
11 0680/22/F/M/16 © UCLES 2016 [Turn over (v) Explain how human health problems can be caused by air pollution and water pollution in large cities. … … … … … … … …[4] (c) Look at the table of population and water consumption figures. country total population / millions national average daily water consumption / million litres average daily water consumption per person / litres Bangladesh 170 8500 50 India 1200 168 000 … USA 320 184 000 … (i) Complete the table by calculating the average daily water consumption per person for India and for the USA. [2] (ii) Suggest why water consumption per person is much higher in developed countries such as the USA than in developing countries such as Bangladesh. … … … … … …[3]
Question paper, page 12
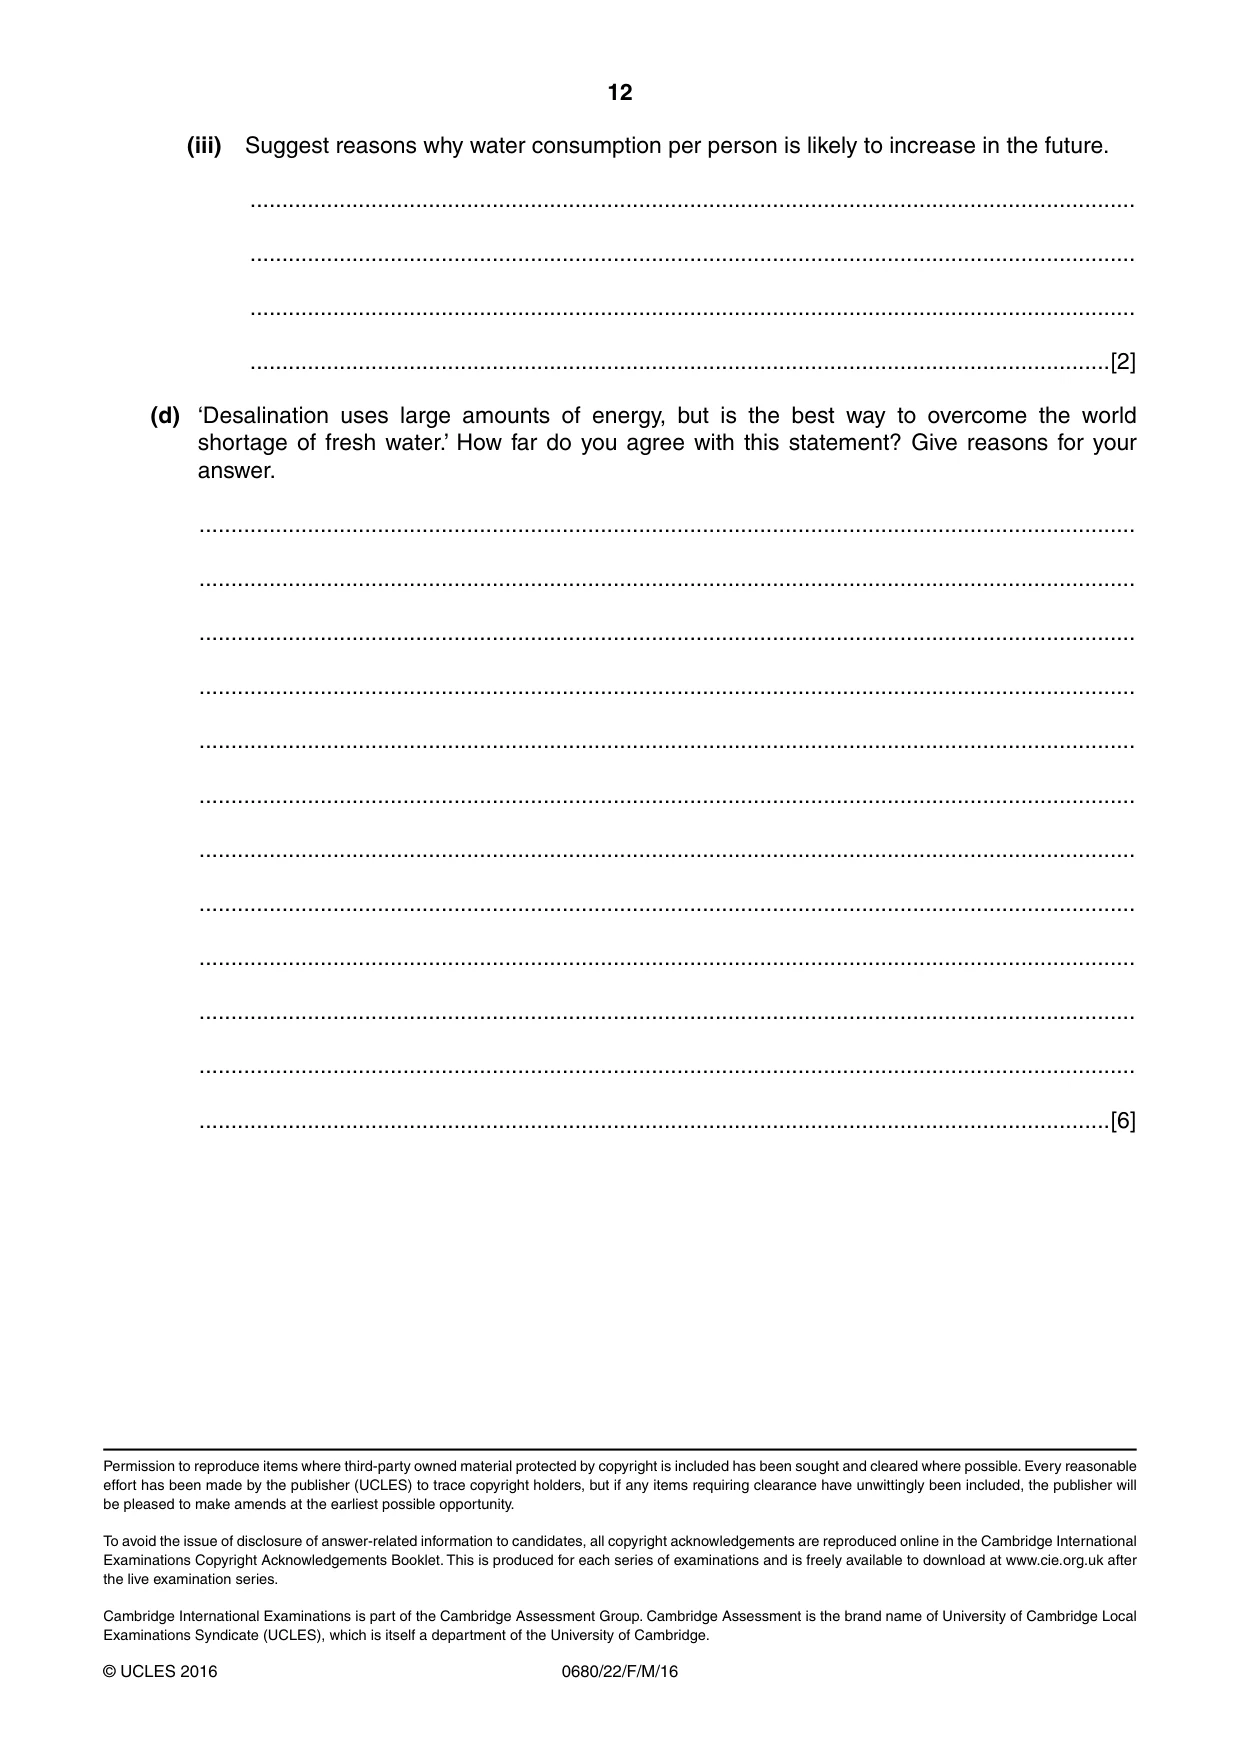
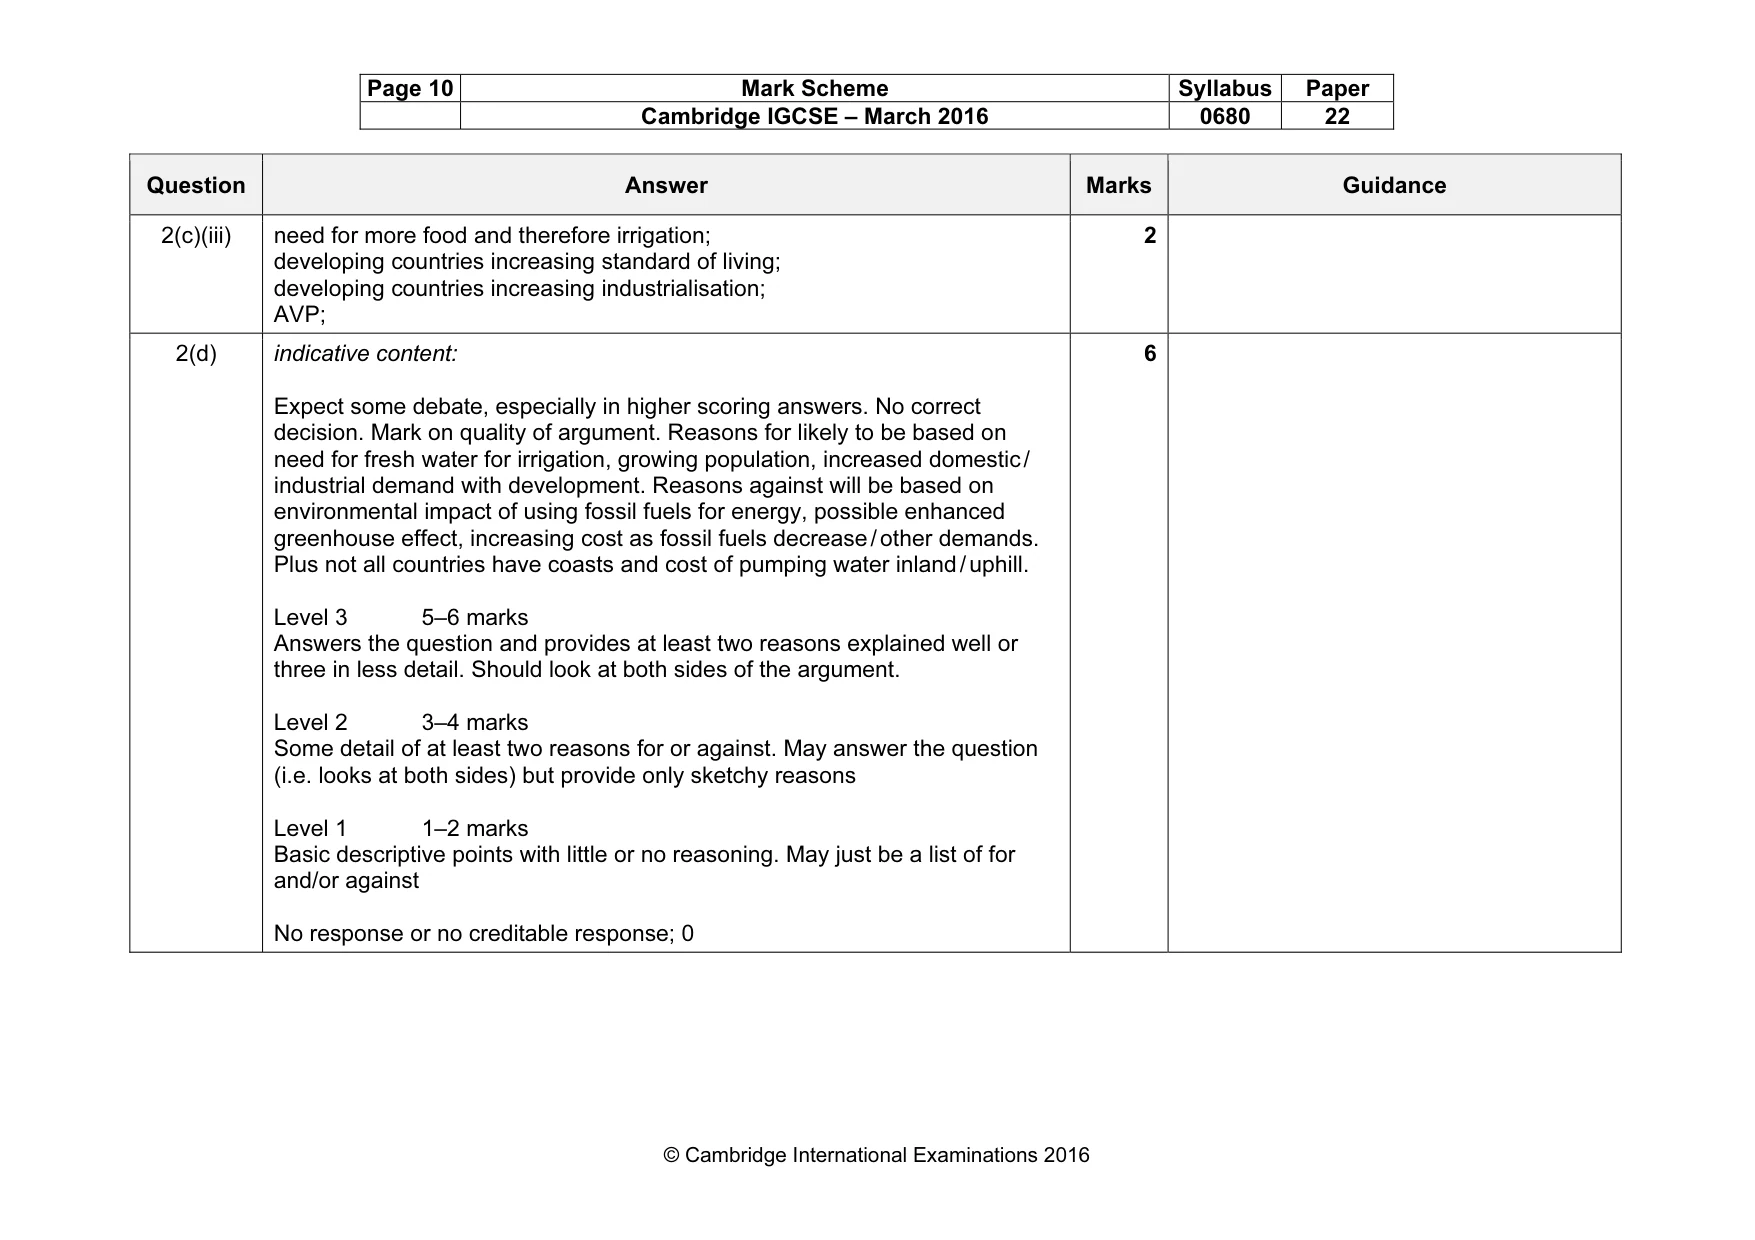
12 0680/22/F/M/16 © UCLES 2016 (iii) Suggest reasons why water consumption per person is likely to increase in the future. … … … …[2] (d) ‘Desalination uses large amounts of energy, but is the best way to overcome the world shortage of fresh water.’ How far do you agree with this statement? Give reasons for your answer. … … … … … … … … … … … …[6] Permission to reproduce items where third-party owned material protected by copyright is included has been sought and cleared where possible. Every reasonable effort has been made by the publisher (UCLES) to trace copyright holders, but if any items requiring clearance have unwittingly been included, the publisher will be pleased to make amends at the earliest possible opportunity. To avoid the issue of disclosure of answer-related information to candidates, all copyright acknowledgements are reproduced online in the Cambridge International Examinations Copyright Acknowledgements Booklet. This is produced for each series of examinations and is freely available to download at www.cie.org.uk after the live examination series. Cambridge International Examinations is part of the Cambridge Assessment Group. Cambridge Assessment is the brand name of University of Cambridge Local Examinations Syndicate (UCLES), which is itself a department of the University of Cambridge.
Mark scheme, page 1
® IGCSE is the registered trademark of Cambridge International Examinations. CAMBRIDGE INTERNATIONAL EXAMINATIONS Cambridge International General Certificate of Secondary Education MARK SCHEME for the March 2016 series 0680 ENVIRONMENTAL MANAGEMENT 0680/22 Paper 22, maximum raw mark 80 This mark scheme is published as an aid to teachers and candidates, to indicate the requirements of the examination. It shows the basis on which Examiners were instructed to award marks. It does not indicate the details of the discussions that took place at an Examiners’ meeting before marking began, which would have considered the acceptability of alternative answers. Mark schemes should be read in conjunction with the question paper and the Principal Examiner Report for Teachers. Cambridge will not enter into discussions about these mark schemes. Cambridge is publishing the mark schemes for the March 2016 series for most Cambridge IGCSE® and Cambridge International A and AS Level components.
Mark scheme, page 2
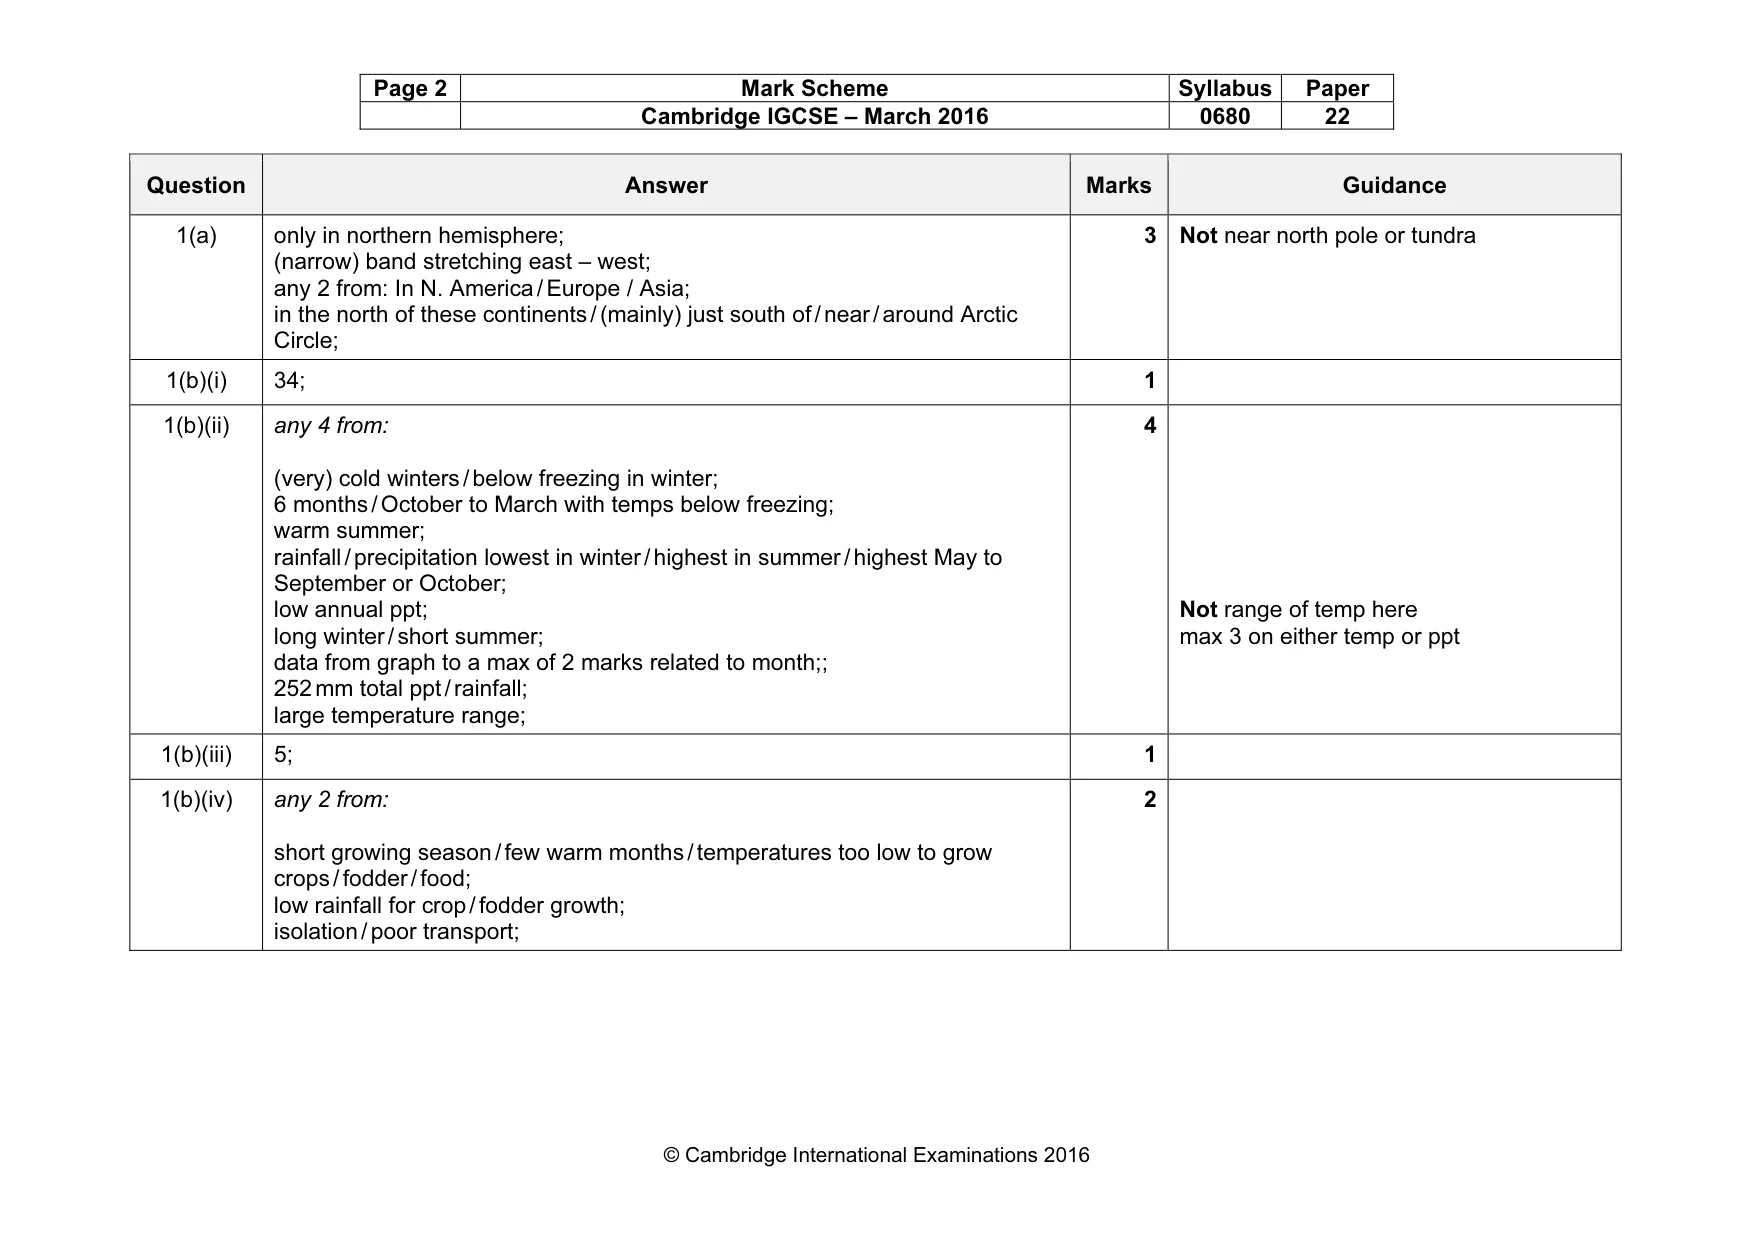
Page 2 Mark Scheme Syllabus Paper Cambridge IGCSE – March 2016 0680 22 © Cambridge International Examinations 2016 Question Answer Marks Guidance 1(a) only in northern hemisphere; (narrow) band stretching east – west; any 2 from: In N. America / Europe / Asia; in the north of these continents / (mainly) just south of / near / around Arctic Circle; 3 Not near north pole or tundra 1(b)(i) 34; 1 1(b)(ii) any 4 from: (very) cold winters / below freezing in winter; 6 months / October to March with temps below freezing; warm summer; rainfall / precipitation lowest in winter / highest in summer / highest May to September or October; low annual ppt; long winter / short summer; data from graph to a max of 2 marks related to month;; 252 mm total ppt / rainfall; large temperature range; 4 Not range of temp here max 3 on either temp or ppt 1(b)(iii) 5; 1 1(b)(iv) any 2 from: short growing season / few warm months / temperatures too low to grow crops / fodder / food; low rainfall for crop / fodder growth; isolation / poor transport; 2
Mark scheme, page 3
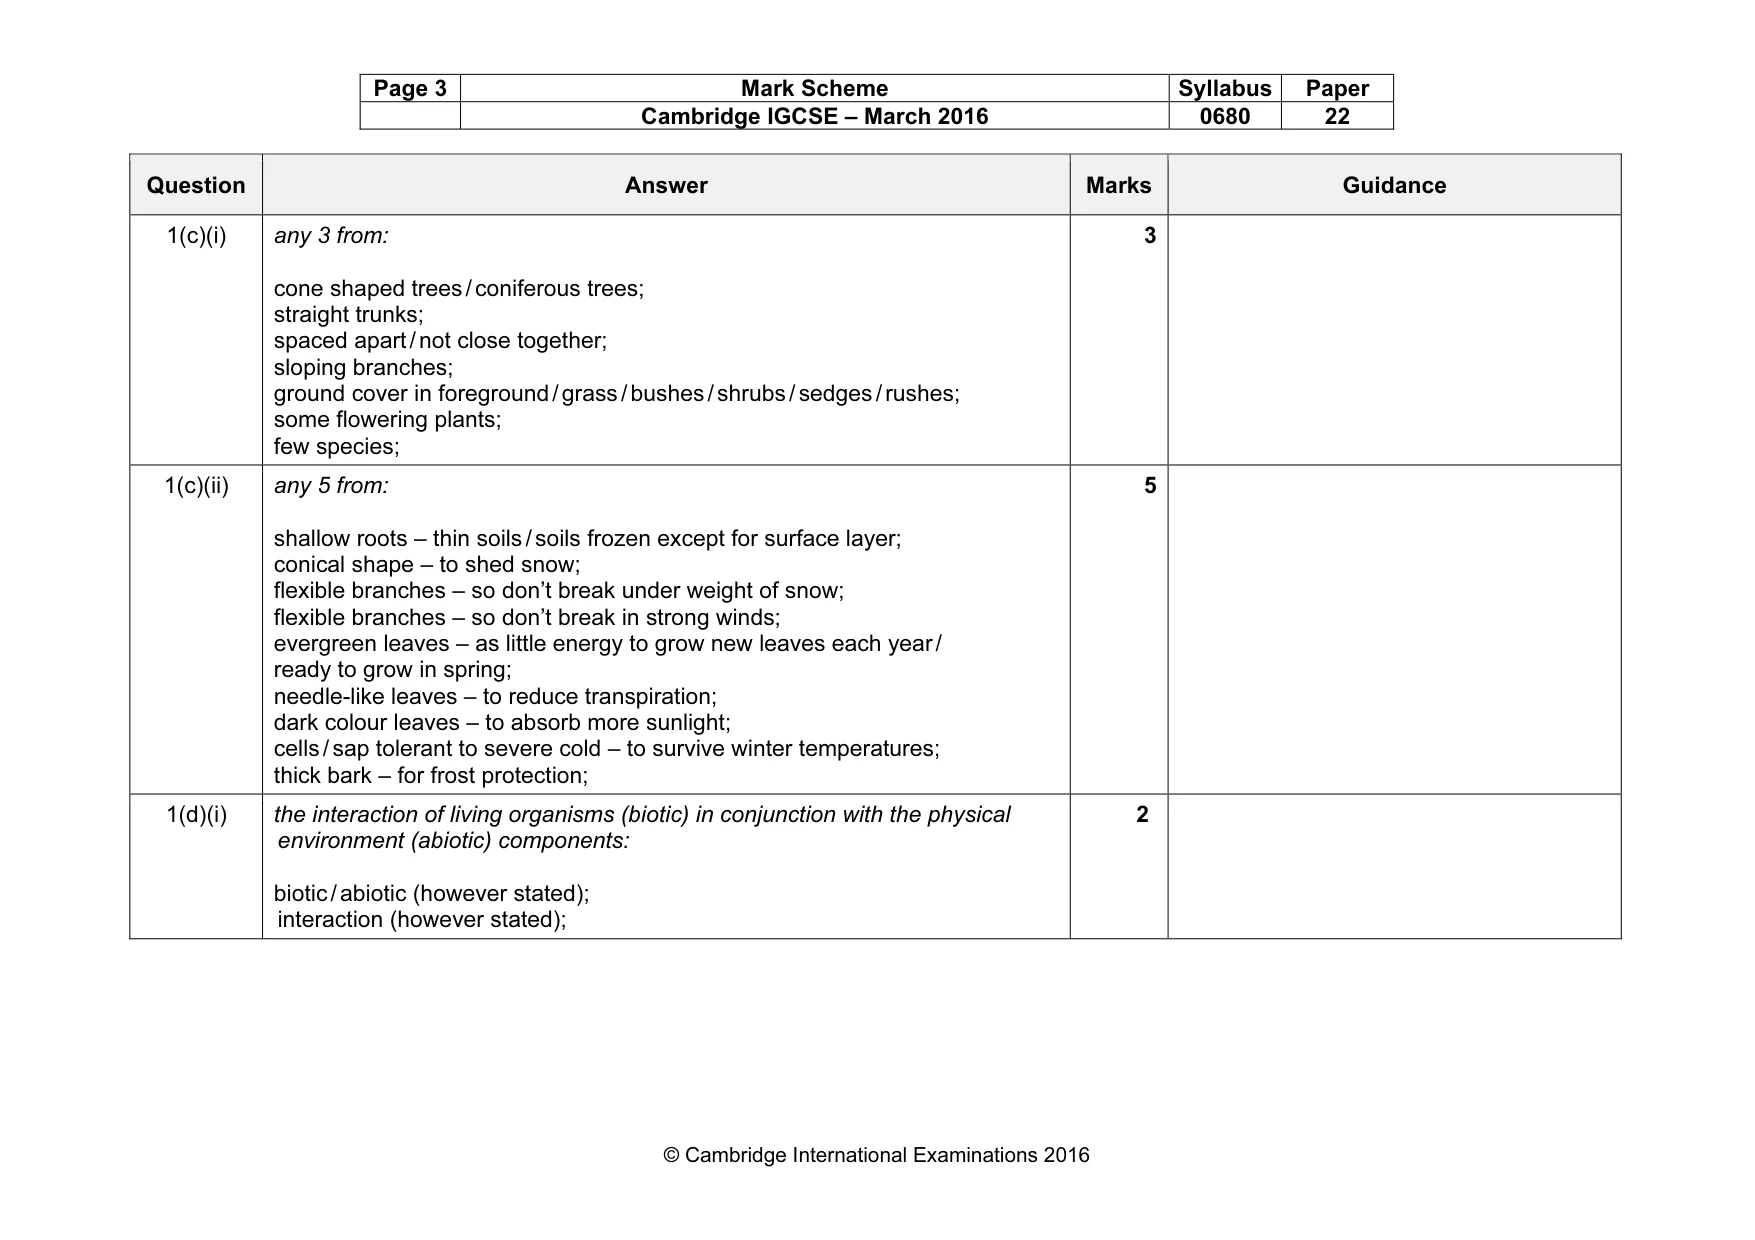
Page 3 Mark Scheme Syllabus Paper Cambridge IGCSE – March 2016 0680 22 © Cambridge International Examinations 2016 Question Answer Marks Guidance 1(c)(i) any 3 from: cone shaped trees / coniferous trees; straight trunks; spaced apart / not close together; sloping branches; ground cover in foreground / grass / bushes / shrubs / sedges / rushes; some flowering plants; few species; 3 1(c)(ii) any 5 from: shallow roots – thin soils / soils frozen except for surface layer; conical shape – to shed snow; flexible branches – so don’t break under weight of snow; flexible branches – so don’t break in strong winds; evergreen leaves – as little energy to grow new leaves each year / ready to grow in spring; needle-like leaves – to reduce transpiration; dark colour leaves – to absorb more sunlight; cells / sap tolerant to severe cold – to survive winter temperatures; thick bark – for frost protection; 5 1(d)(i) the interaction of living organisms (biotic) in conjunction with the physical environment (abiotic) components: biotic / abiotic (however stated); interaction (however stated); 2
Mark scheme, page 4
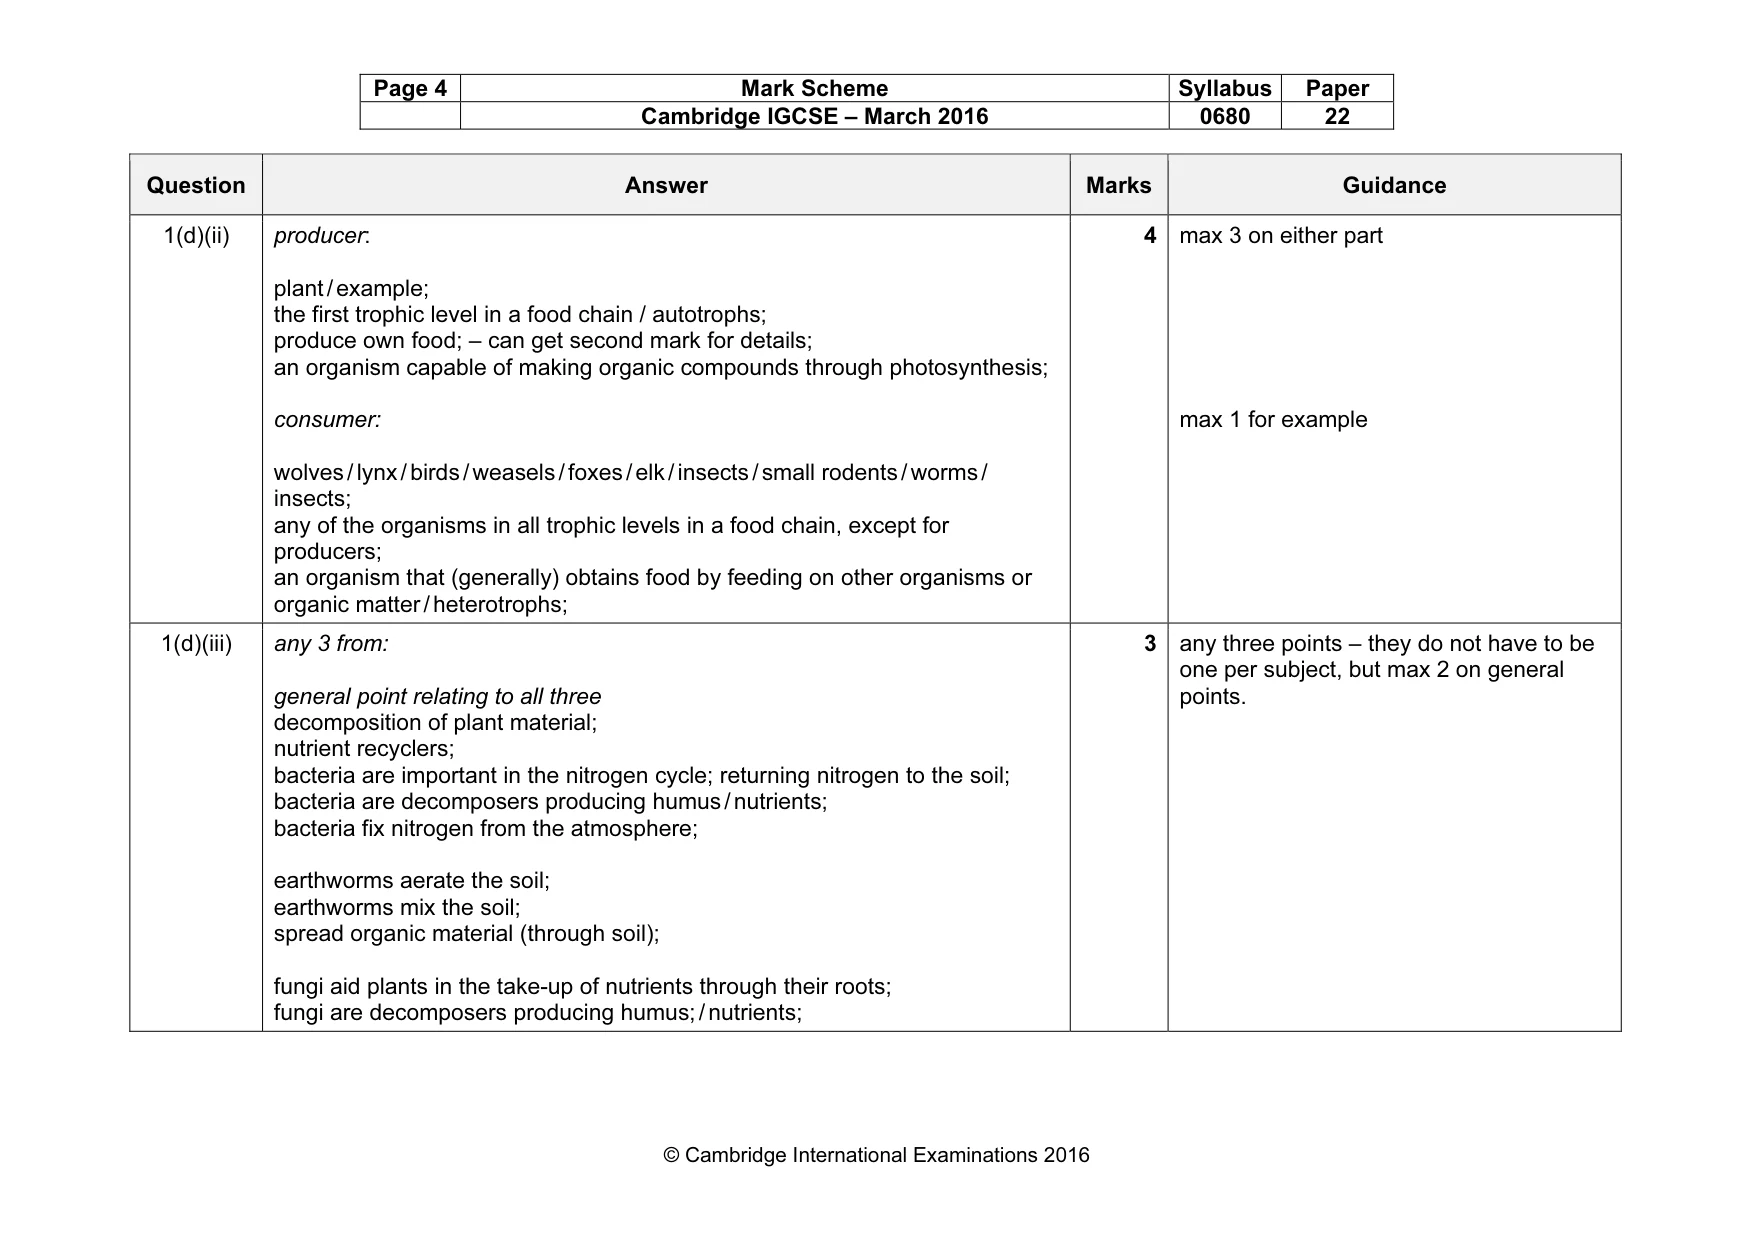
Page 4 Mark Scheme Syllabus Paper Cambridge IGCSE – March 2016 0680 22 © Cambridge International Examinations 2016 Question Answer Marks Guidance 1(d)(ii) producer: plant / example; the first trophic level in a food chain / autotrophs; produce own food; – can get second mark for details; an organism capable of making organic compounds through photosynthesis; consumer: wolves / lynx / birds / weasels / foxes / elk / insects / small rodents / worms / insects; any of the organisms in all trophic levels in a food chain, except for producers; an organism that (generally) obtains food by feeding on other organisms or organic matter / heterotrophs; 4 max 3 on either part max 1 for example 1(d)(iii) any 3 from: general point relating to all three decomposition of plant material; nutrient recyclers; bacteria are important in the nitrogen cycle; returning nitrogen to the soil; bacteria are decomposers producing humus / nutrients; bacteria fix nitrogen from the atmosphere; earthworms aerate the soil; earthworms mix the soil; spread organic material (through soil); fungi aid plants in the take-up of nutrients through their roots; fungi are decomposers producing humus; / nutrients; 3 any three points – they do not have to be one per subject, but max 2 on general points.
Mark scheme, page 5
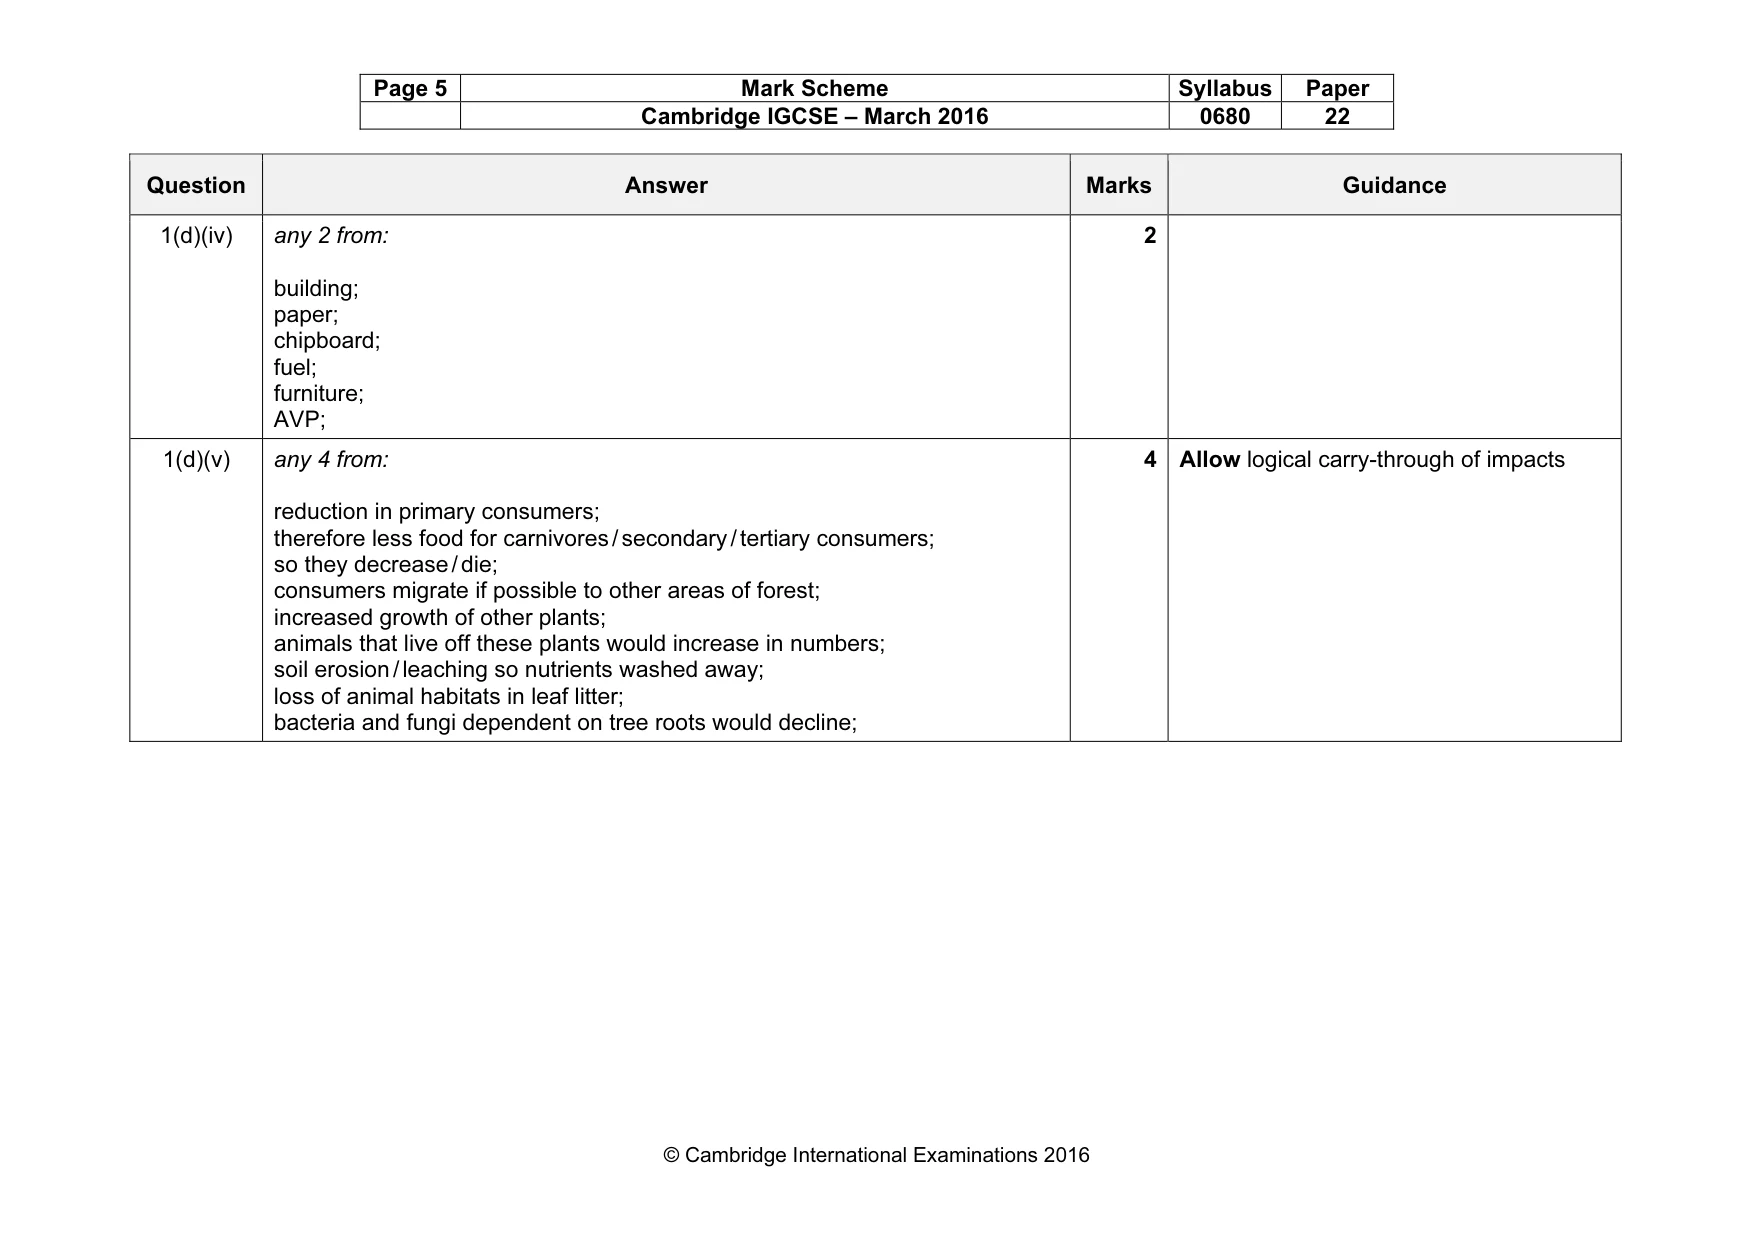
Page 5 Mark Scheme Syllabus Paper Cambridge IGCSE – March 2016 0680 22 © Cambridge International Examinations 2016 Question Answer Marks Guidance 1(d)(iv) any 2 from: building; paper; chipboard; fuel; furniture; AVP; 2 1(d)(v) any 4 from: reduction in primary consumers; therefore less food for carnivores / secondary / tertiary consumers; so they decrease / die; consumers migrate if possible to other areas of forest; increased growth of other plants; animals that live off these plants would increase in numbers; soil erosion / leaching so nutrients washed away; loss of animal habitats in leaf litter; bacteria and fungi dependent on tree roots would decline; 4 Allow logical carry-through of impacts
Mark scheme, page 6
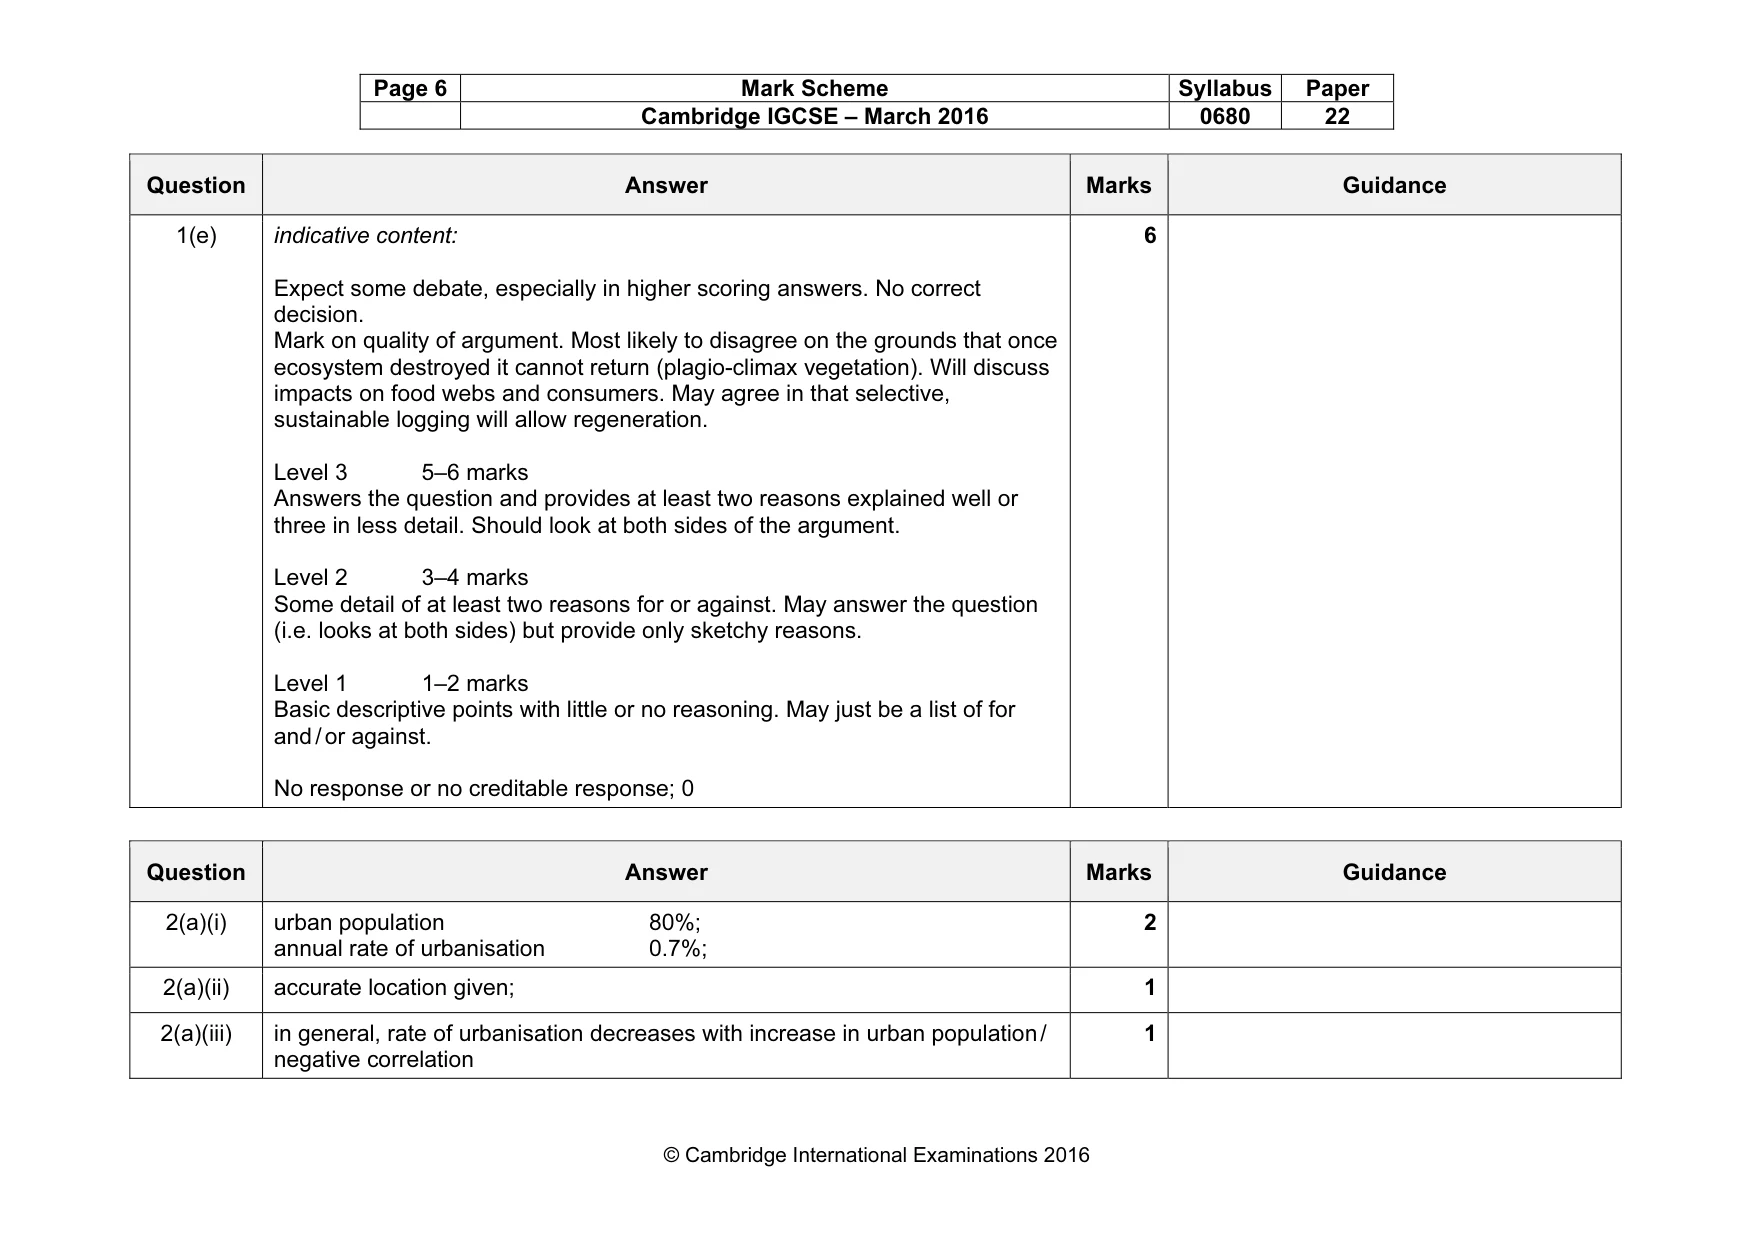
Page 6 Mark Scheme Syllabus Paper Cambridge IGCSE – March 2016 0680 22 © Cambridge International Examinations 2016 Question Answer Marks Guidance 1(e) indicative content: Expect some debate, especially in higher scoring answers. No correct decision. Mark on quality of argument. Most likely to disagree on the grounds that once ecosystem destroyed it cannot return (plagio-climax vegetation). Will discuss impacts on food webs and consumers. May agree in that selective, sustainable logging will allow regeneration. Level 3 5–6 marks Answers the question and provides at least two reasons explained well or three in less detail. Should look at both sides of the argument. Level 2 3–4 marks Some detail of at least two reasons for or against. May answer the question (i.e. looks at both sides) but provide only sketchy reasons. Level 1 1–2 marks Basic descriptive points with little or no reasoning. May just be a list of for and / or against. No response or no creditable response; 0 6 Question Answer Marks Guidance 2(a)(i) urban population 80%; annual rate of urbanisation 0.7%; 2 2(a)(ii) accurate location given; 1 2(a)(iii) in general, rate of urbanisation decreases with increase in urban population / negative correlation 1
Mark scheme, page 7
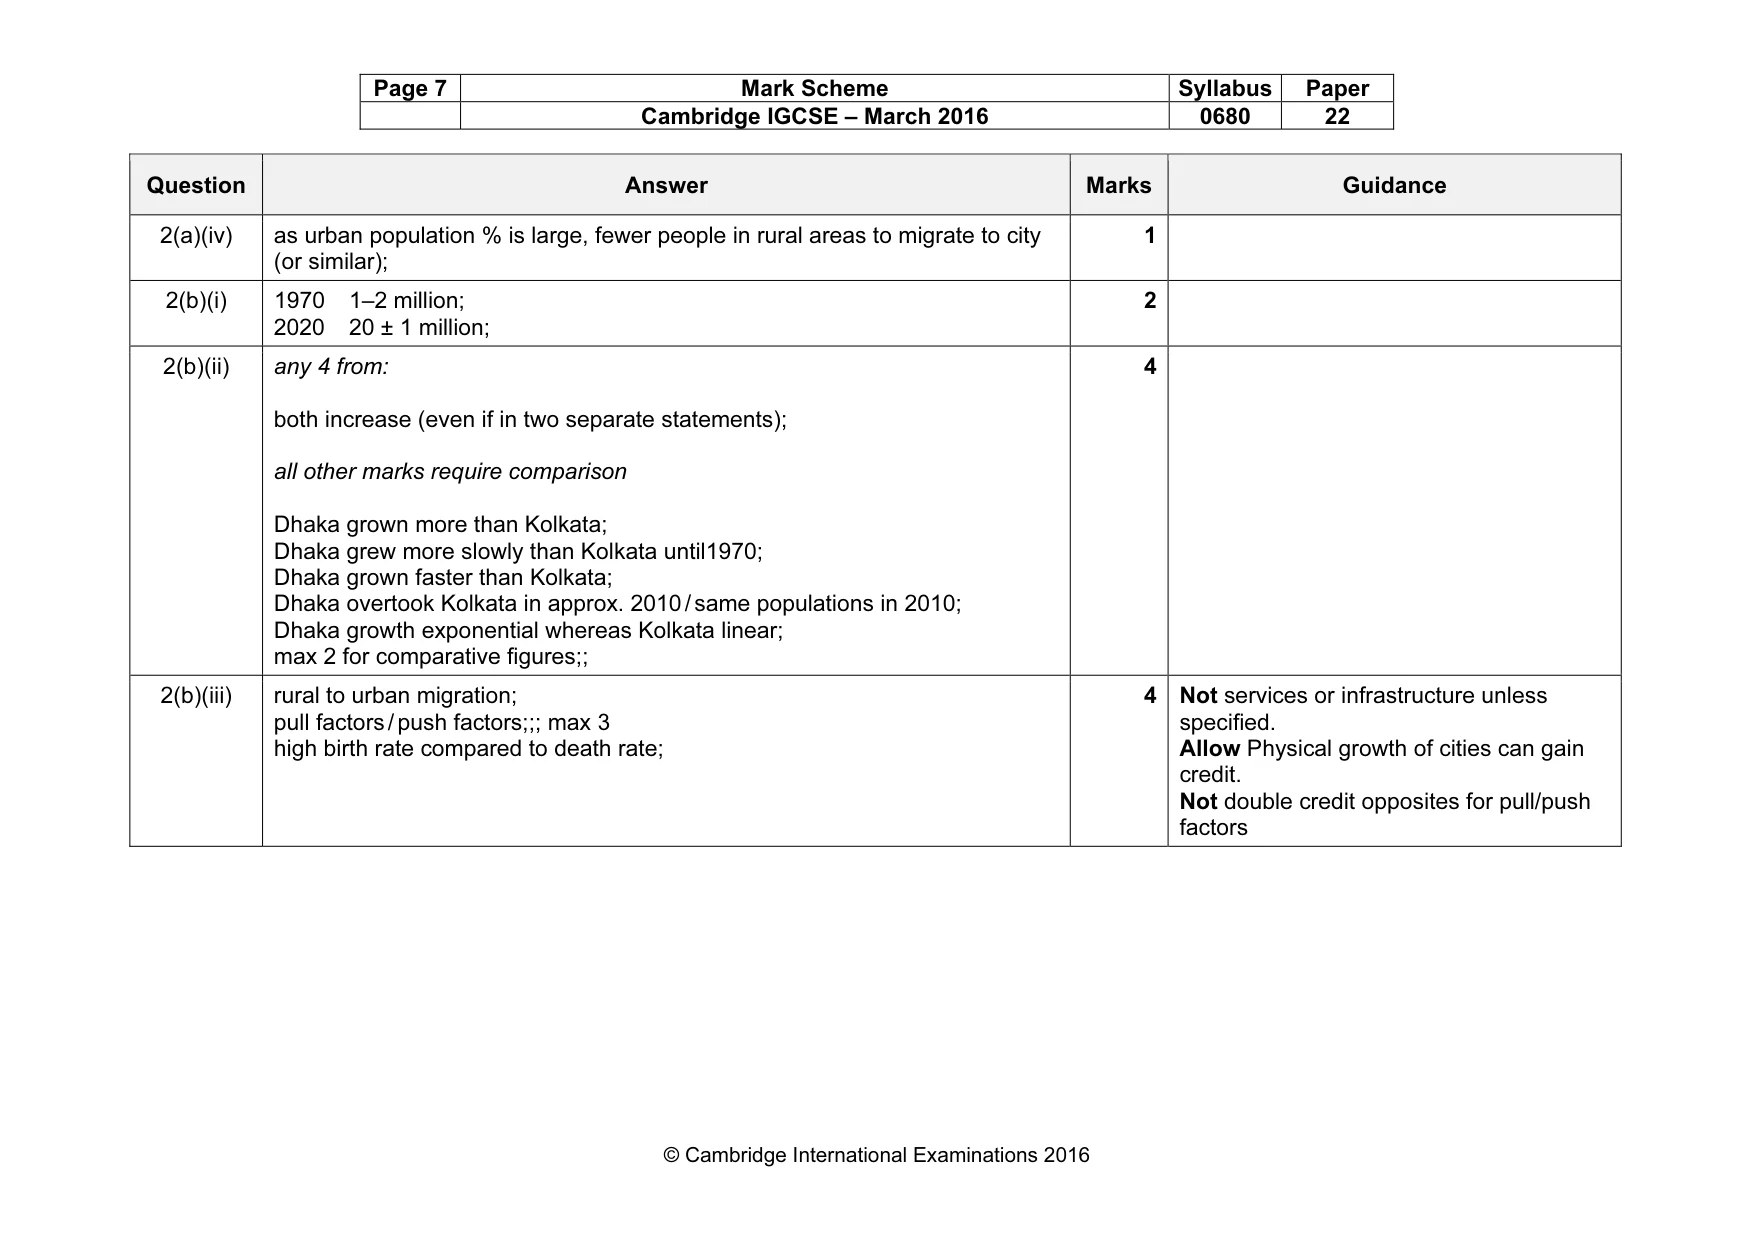
Page 7 Mark Scheme Syllabus Paper Cambridge IGCSE – March 2016 0680 22 © Cambridge International Examinations 2016 Question Answer Marks Guidance 2(a)(iv) as urban population % is large, fewer people in rural areas to migrate to city (or similar); 1 2(b)(i) 1970 1–2 million; 2020 20 ± 1 million; 2 2(b)(ii) any 4 from: both increase (even if in two separate statements); all other marks require comparison Dhaka grown more than Kolkata; Dhaka grew more slowly than Kolkata until1970; Dhaka grown faster than Kolkata; Dhaka overtook Kolkata in approx. 2010 / same populations in 2010; Dhaka growth exponential whereas Kolkata linear; max 2 for comparative figures;; 4 2(b)(iii) rural to urban migration; pull factors / push factors;;; max 3 high birth rate compared to death rate; 4 Not services or infrastructure unless specified. Allow Physical growth of cities can gain credit. Not double credit opposites for pull/push factors
Mark scheme, page 8
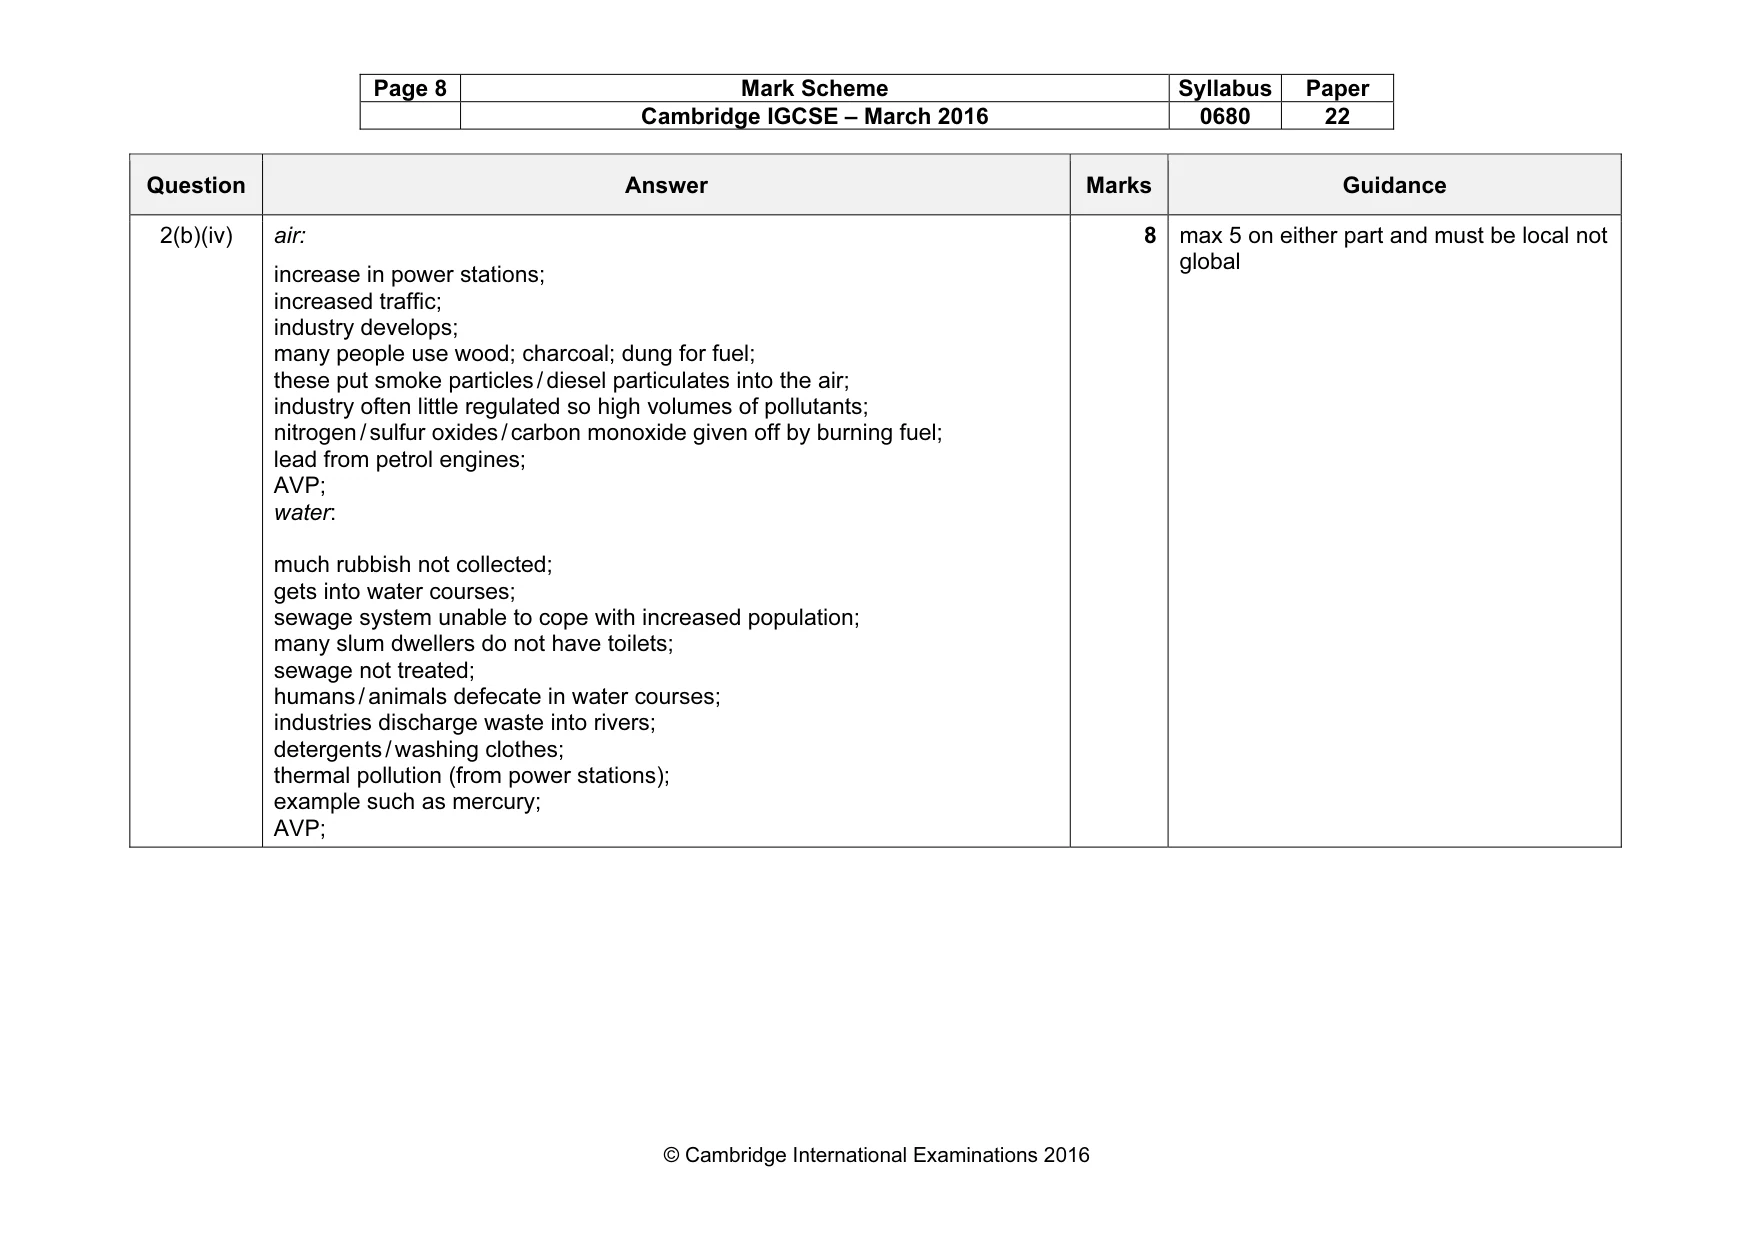
Page 8 Mark Scheme Syllabus Paper Cambridge IGCSE – March 2016 0680 22 © Cambridge International Examinations 2016 Question Answer Marks Guidance 2(b)(iv) air: increase in power stations; increased traffic; industry develops; many people use wood; charcoal; dung for fuel; these put smoke particles / diesel particulates into the air; industry often little regulated so high volumes of pollutants; nitrogen / sulfur oxides / carbon monoxide given off by burning fuel; lead from petrol engines; AVP; water: much rubbish not collected; gets into water courses; sewage system unable to cope with increased population; many slum dwellers do not have toilets; sewage not treated; humans / animals defecate in water courses; industries discharge waste into rivers; detergents / washing clothes; thermal pollution (from power stations); example such as mercury; AVP; 8 max 5 on either part and must be local not global
Mark scheme, page 9
Page 9 Mark Scheme Syllabus Paper Cambridge IGCSE – March 2016 0680 22 © Cambridge International Examinations 2016 Question Answer Marks Guidance 2(b)(v) water: water borne diseases such as cholera / typhoid / dysentery; from human effluent; used for drinking / washing food / cooking utensils in water; liquid stools likely to further infect water; cholera causes dehydration; industrial waste may contain poisons / heavy metals; eating poisoned fish; air: particulates in air help create smog / damage lungs; industry / vehicle emissions contribute to photochemical smog; may cause breathing difficulties / asthma / bronchitis / heart problems; CO causes headaches / fatigue; brain damage from lead; 4 max 3 for either water or air 2(c)(i) Average daily water consumption per person / litres India 140; USA 575; 2 2(c)(ii) any 3 from: greater domestic use; example of domestic use; greater industrial use; example of industrial use; greater availability of water; example of greater water availability; higher standard of living / higher incomes; greater wastage / leakage; 3
Mark scheme, page 10
Page 10 Mark Scheme Syllabus Paper Cambridge IGCSE – March 2016 0680 22 © Cambridge International Examinations 2016 Question Answer Marks Guidance 2(c)(iii) need for more food and therefore irrigation; developing countries increasing standard of living; developing countries increasing industrialisation; AVP; 2 2(d) indicative content: Expect some debate, especially in higher scoring answers. No correct decision. Mark on quality of argument. Reasons for likely to be based on need for fresh water for irrigation, growing population, increased domestic / industrial demand with development. Reasons against will be based on environmental impact of using fossil fuels for energy, possible enhanced greenhouse effect, increasing cost as fossil fuels decrease / other demands. Plus not all countries have coasts and cost of pumping water inland / uphill. Level 3 5–6 marks Answers the question and provides at least two reasons explained well or three in less detail. Should look at both sides of the argument. Level 2 3–4 marks Some detail of at least two reasons for or against. May answer the question (i.e. looks at both sides) but provide only sketchy reasons Level 1 1–2 marks Basic descriptive points with little or no reasoning. May just be a list of for and/or against No response or no creditable response; 0 6
What you needed in this session
Cambridge’s own grade thresholds for 2016 Feb/March, Paper 2 · Variant 2. A higher threshold means an easier paper — the bar moves with how the cohort did.