Cambridge IGCSE Environmental Management 0680 — 2015 Oct/Nov Paper 4 · Variant 1
0680/41/O/N/15 · 60 marks · ≈68 min
The question paper and its mark scheme, free to read here and free to download. This is Cambridge’s own paper, exactly as it was sat.
Question paper16 pages

Mark scheme3 pages
Answers below. Sit the paper first if you are practising.
Paper as text
Question paper, page 1
This document consists of 14 printed pages and 2 blank pages. DC (NF/CGW) 97062/3 © UCLES 2015 [Turn over Cambridge International Examinations Cambridge International General Certificate of Secondary Education * 2 3 4 5 0 3 6 6 6 5 * ENVIRONMENTAL MANAGEMENT 0680/41 Alternative to Coursework October/November 2015 1 hour 30 minutes Candidates answer on the Question Paper. No Additional Materials are required. READ THESE INSTRUCTIONS FIRST Write your Centre number, candidate number and name on all the work you hand in. Write in dark blue or black pen. You may use an HB pencil for any diagrams or graphs. Do not use staples, paper clips, glue or correction fluid. DO NOT WRITE IN ANY BARCODES. Answer all questions. Electronic calculators may be used. You may lose marks if you do not show your working or if you do not use appropriate units. Study the appropriate source materials before you start to write your answers. Credit will be given for appropriate selection and use of data in your answers and for relevant interpretation of these data. Suggestions for data sources are given in some questions. You may use the source data to draw diagrams and graphs or to do calculations to illustrate your answers. At the end of the examination, fasten all your work securely together. The number of marks is given in brackets [ ] at the end of each question or part question.
Question paper, page 2
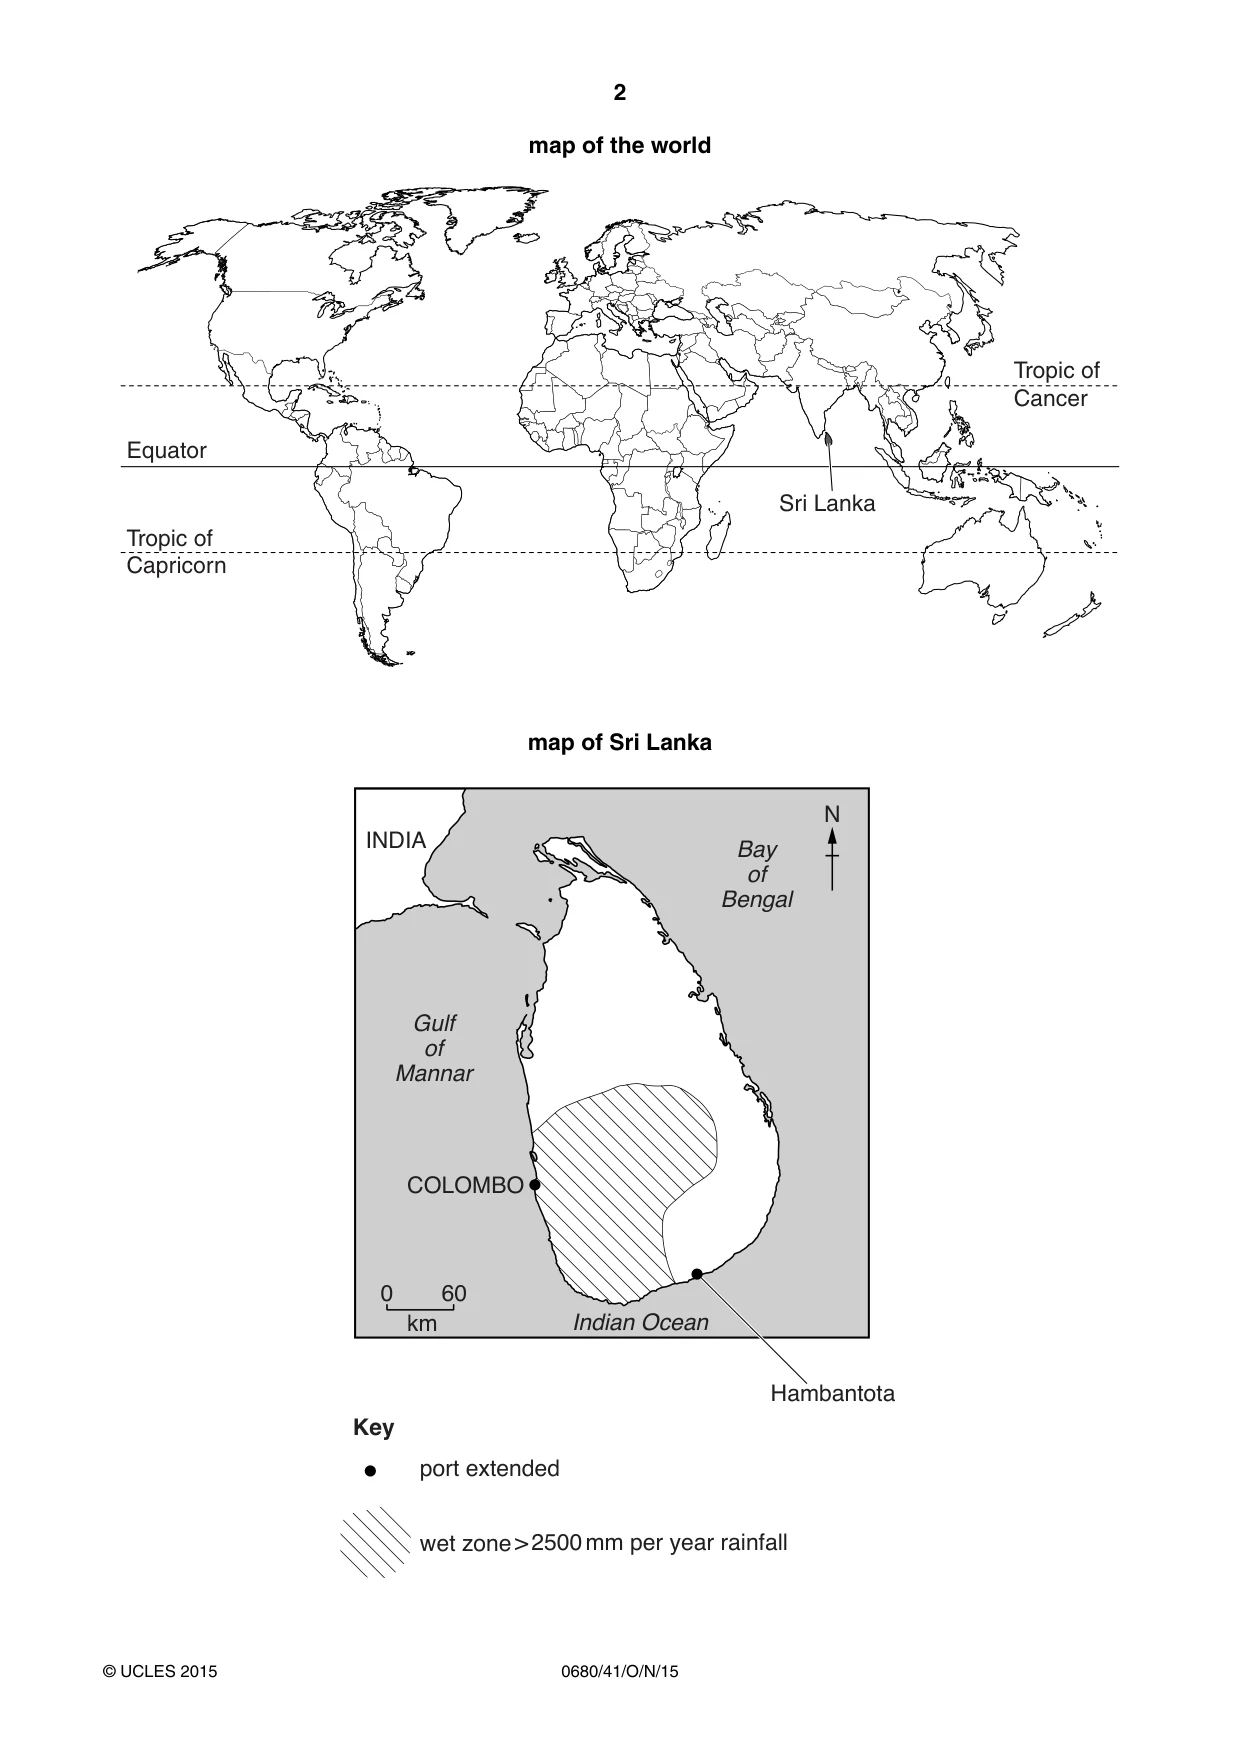
2 0680/41/O/N/15 © UCLES 2015 map of the world Equator Tropic of Capricorn Tropic of Cancer Sri Lanka map of Sri Lanka Gulf of Mannar 0 N 60 COLOMBO Hambantota Bay of Bengal Indian Ocean INDIA Key port extended wet zone > 2500 mm per year rainfall km
Question paper, page 3
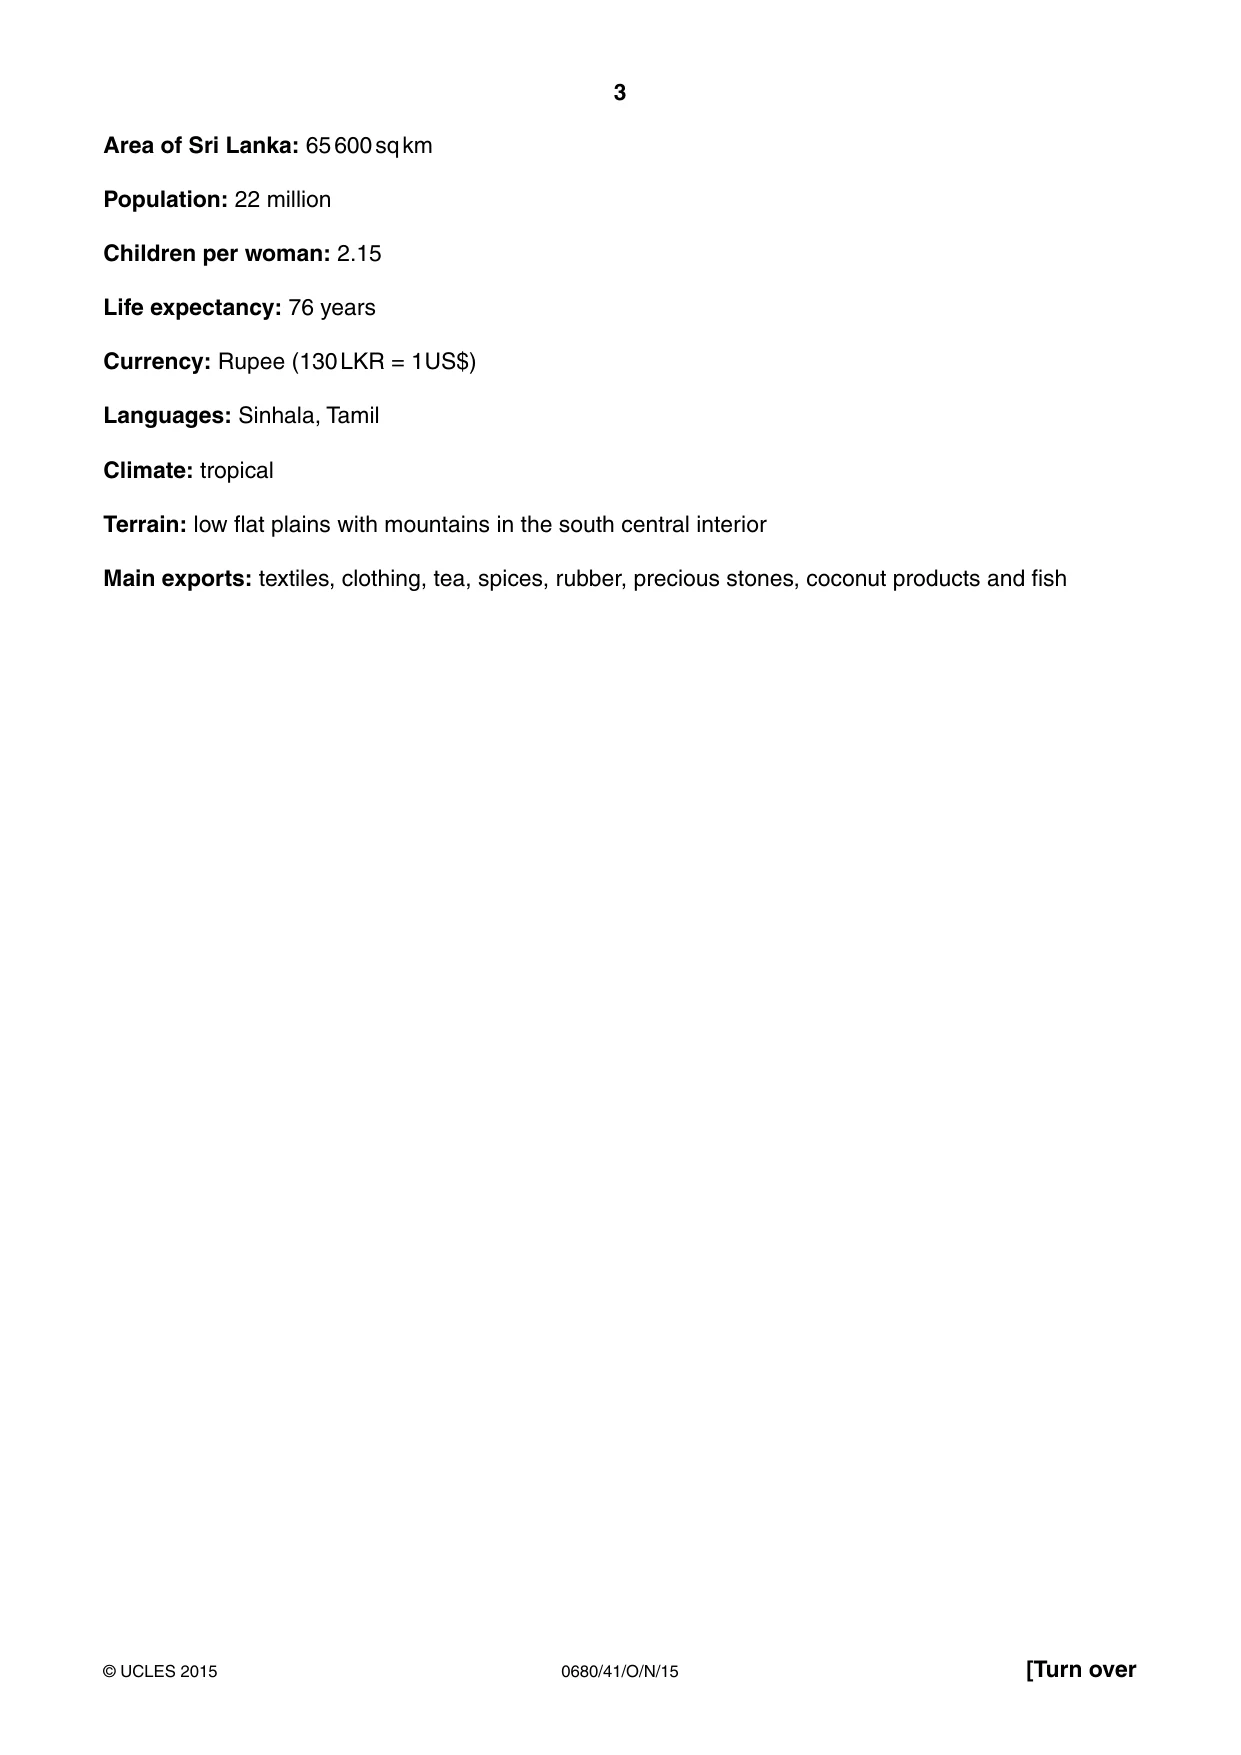
3 0680/41/O/N/15 © UCLES 2015 [Turn over Area of Sri Lanka: 65 600 sq km Population: 22 million Children per woman: 2.15 Life expectancy: 76 years Currency: Rupee (130 LKR = 1 US$) Languages: Sinhala, Tamil Climate: tropical Terrain: low flat plains with mountains in the south central interior Main exports: textiles, clothing, tea, spices, rubber, precious stones, coconut products and fish
Question paper, page 4
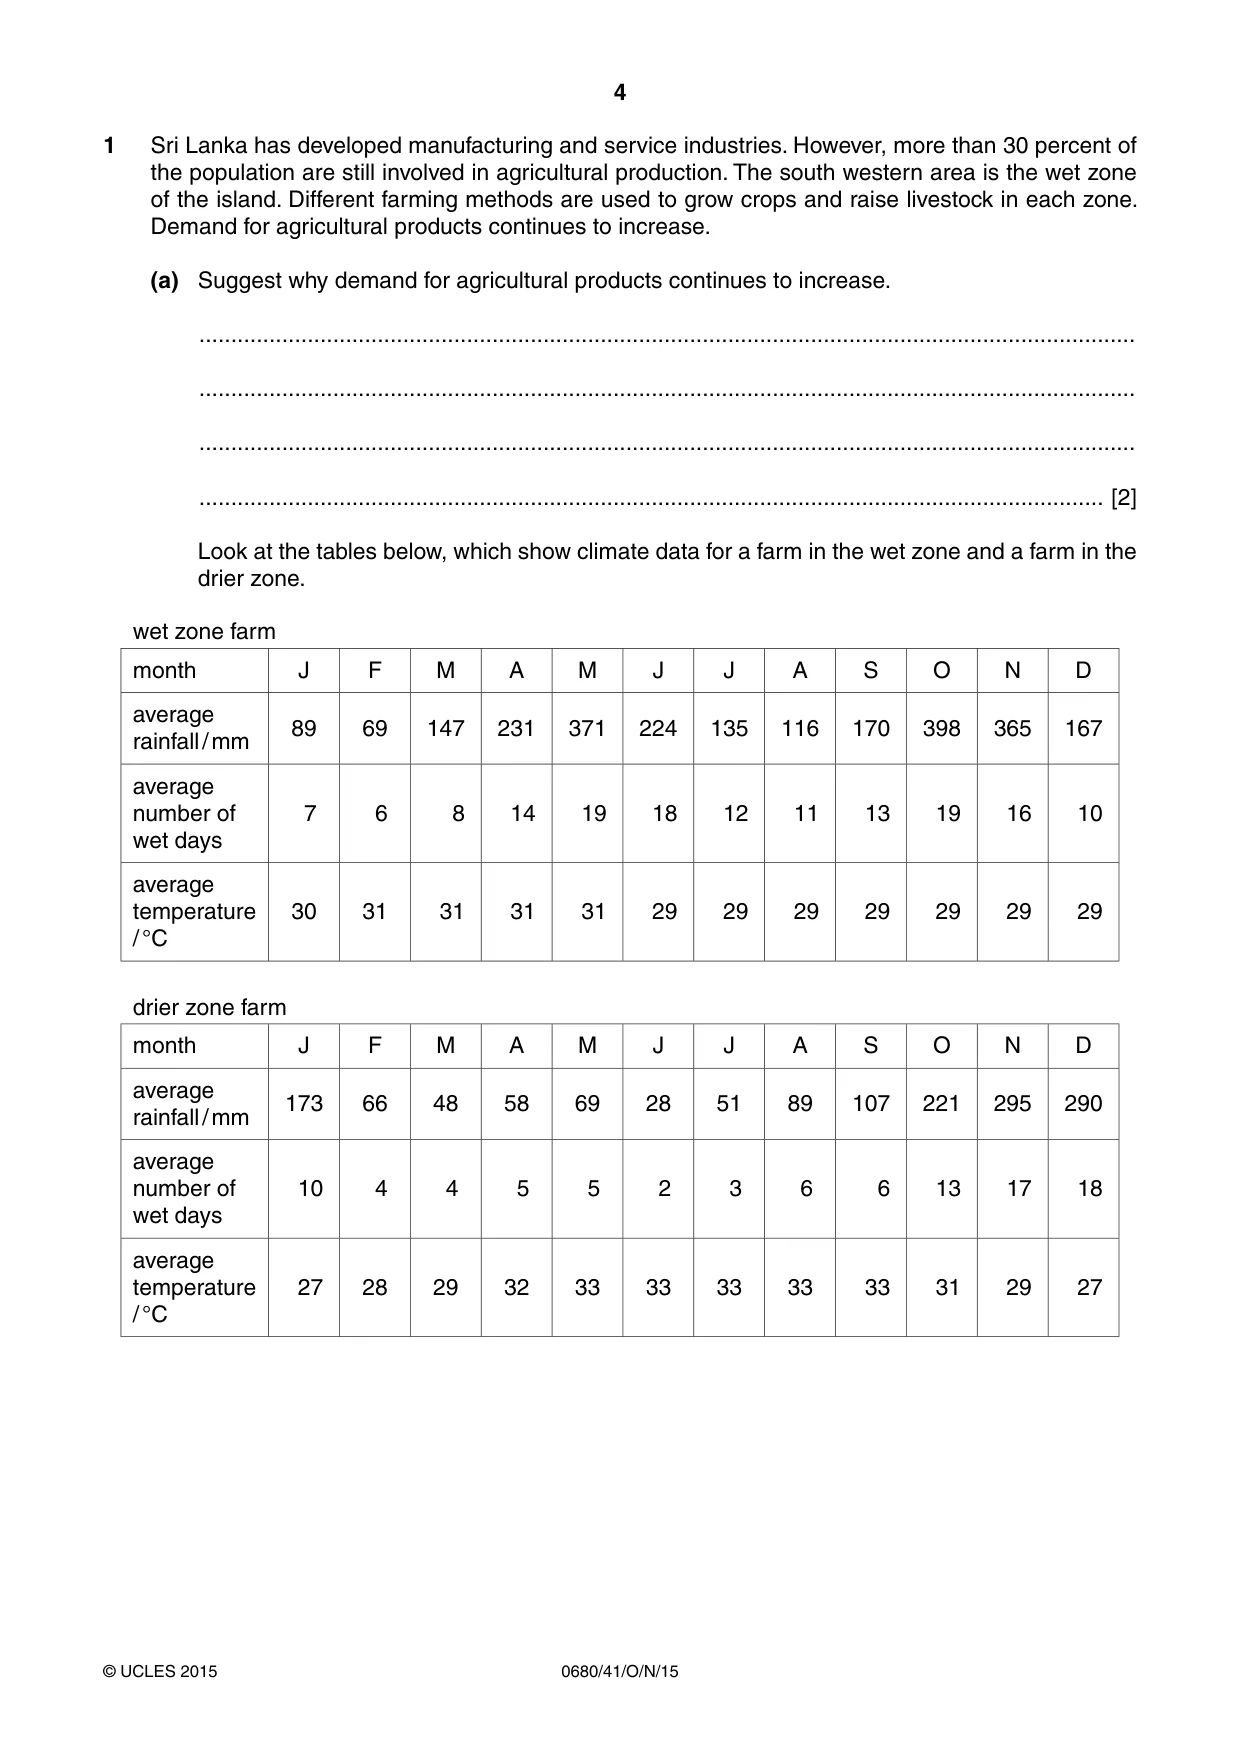
4 0680/41/O/N/15 © UCLES 2015 1 Sri Lanka has developed manufacturing and service industries. However, more than 30 percent of the population are still involved in agricultural production. The south western area is the wet zone of the island. Different farming methods are used to grow crops and raise livestock in each zone. Demand for agricultural products continues to increase. (a) Suggest why demand for agricultural products continues to increase. … … … … [2] Look at the tables below, which show climate data for a farm in the wet zone and a farm in the drier zone. wet zone farm month J F M A M J J A S O N D average rainfall / mm 89 69 147 231 371 224 135 116 170 398 365 167 average number of wet days 7 6 8 14 19 18 12 11 13 19 16 10 average temperature / °C 30 31 31 31 31 29 29 29 29 29 29 29 drier zone farm month J F M A M J J A S O N D average rainfall / mm 173 66 48 58 69 28 51 89 107 221 295 290 average number of wet days 10 4 4 5 5 2 3 6 6 13 17 18 average temperature / °C 27 28 29 32 33 33 33 33 33 31 29 27
Question paper, page 5
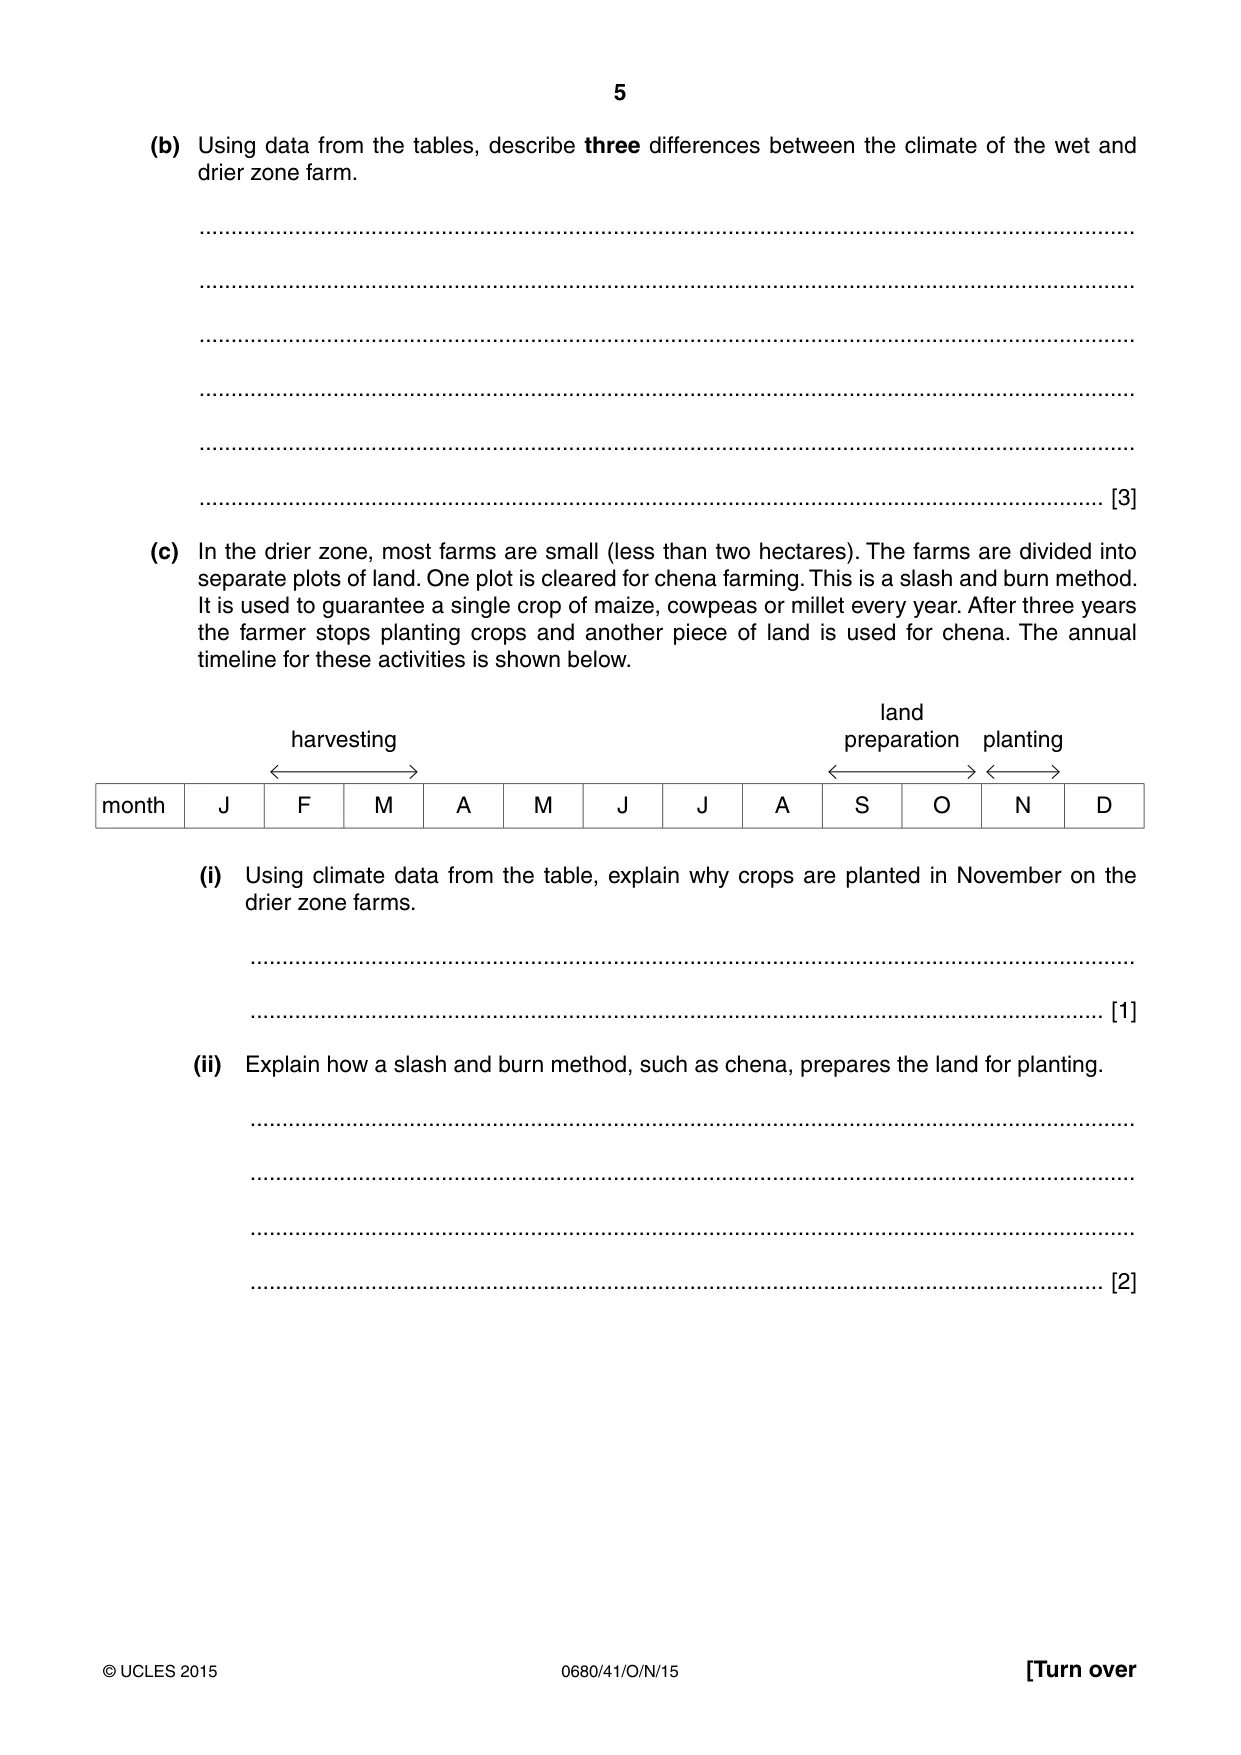
5 0680/41/O/N/15 © UCLES 2015 [Turn over (b) Using data from the tables, describe three differences between the climate of the wet and drier zone farm. … … … … … … [3] (c) In the drier zone, most farms are small (less than two hectares). The farms are divided into separate plots of land. One plot is cleared for chena farming. This is a slash and burn method. It is used to guarantee a single crop of maize, cowpeas or millet every year. After three years the farmer stops planting crops and another piece of land is used for chena. The annual timeline for these activities is shown below. harvesting land preparation planting month J F M A M J J A S O N D (i) Using climate data from the table, explain why crops are planted in November on the drier zone farms. … … [1] (ii) Explain how a slash and burn method, such as chena, prepares the land for planting. … … … … [2]
Question paper, page 6
6 0680/41/O/N/15 © UCLES 2015 (iii) Suggest why there is little soil erosion on land used for chena between April and August. … … … … … … [3] (iv) Explain why chena is a sustainable method of farming. … … … … [2]
Question paper, page 7
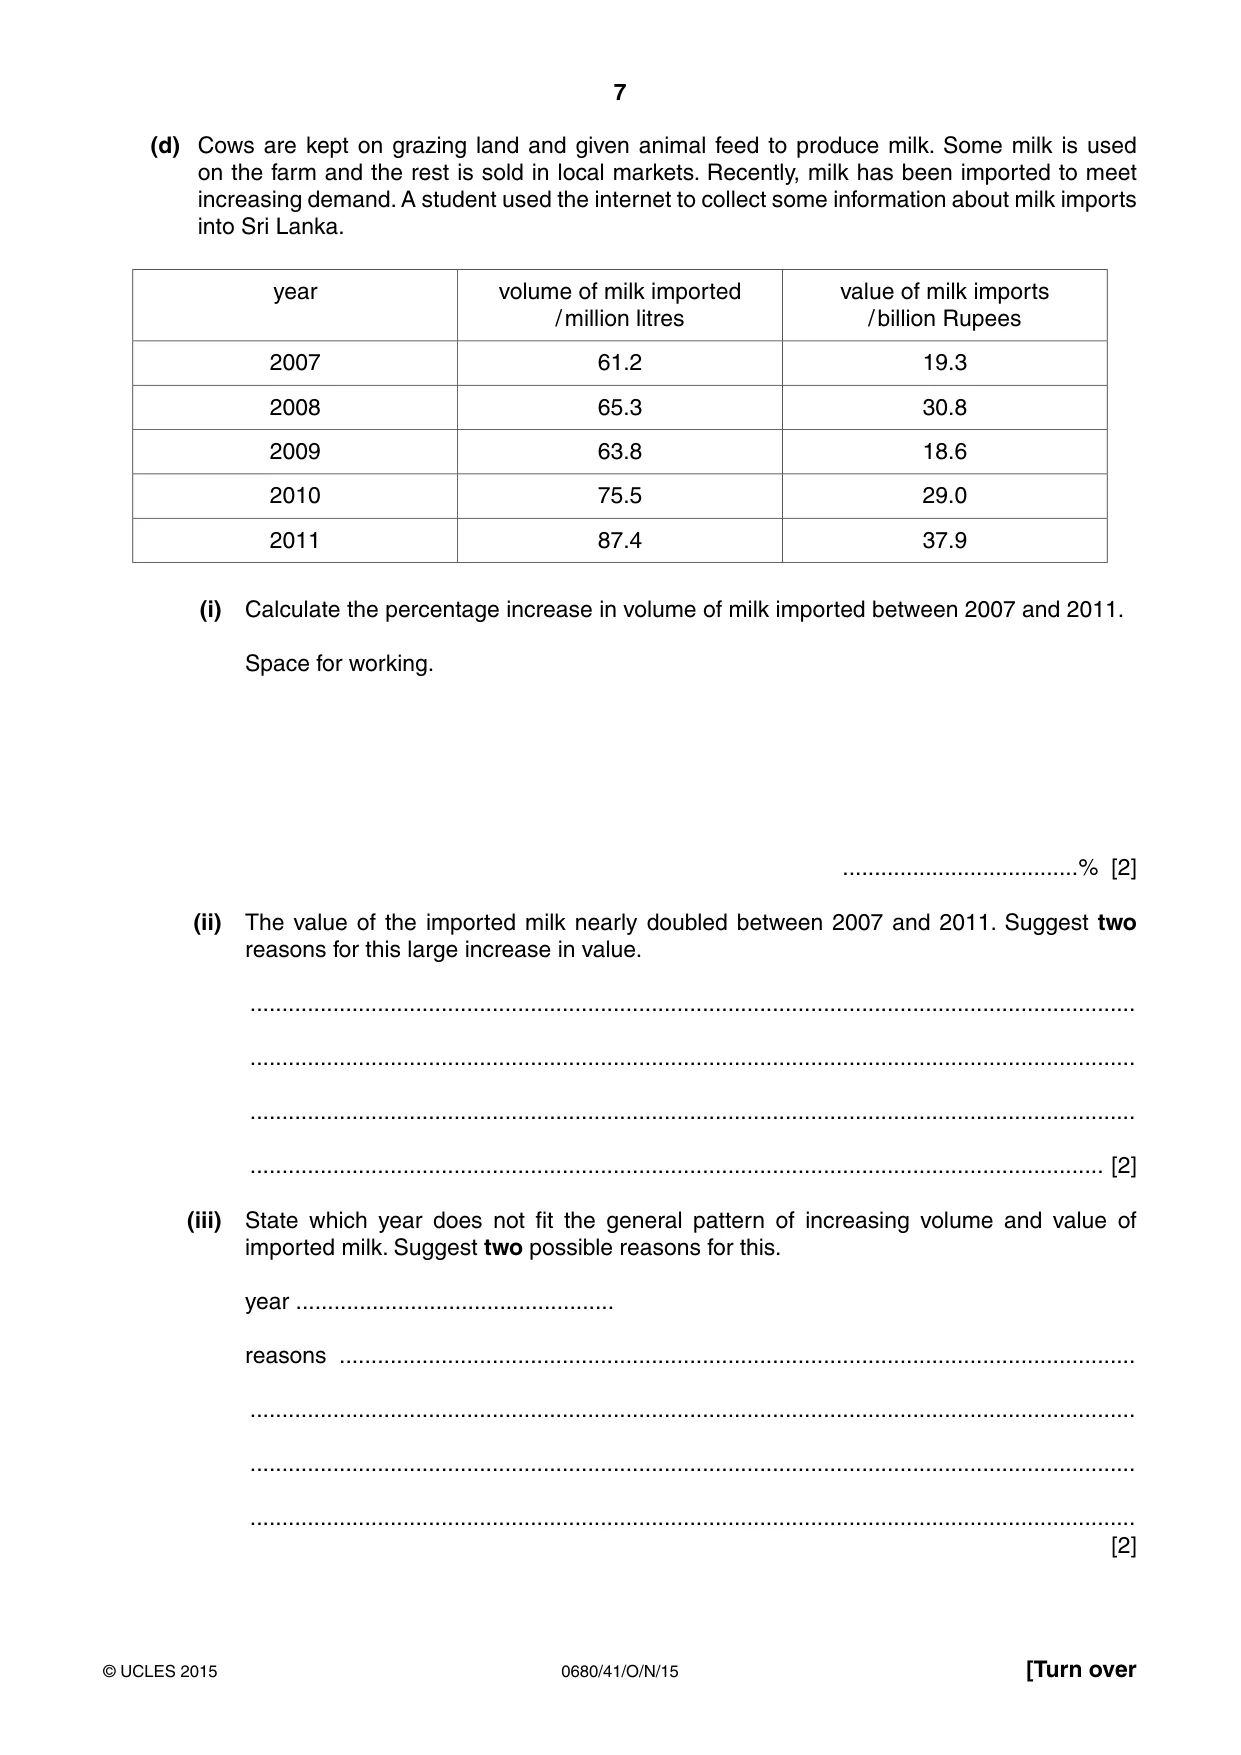
7 0680/41/O/N/15 © UCLES 2015 [Turn over (d) Cows are kept on grazing land and given animal feed to produce milk. Some milk is used on the farm and the rest is sold in local markets. Recently, milk has been imported to meet increasing demand. A student used the internet to collect some information about milk imports into Sri Lanka. year volume of milk imported / million litres value of milk imports / billion Rupees 2007 61.2 19.3 2008 65.3 30.8 2009 63.8 18.6 2010 75.5 29.0 2011 87.4 37.9 (i) Calculate the percentage increase in volume of milk imported between 2007 and 2011. Space for working. …% [2] (ii) The value of the imported milk nearly doubled between 2007 and 2011. Suggest two reasons for this large increase in value. … … … … [2] (iii) State which year does not fit the general pattern of increasing volume and value of imported milk. Suggest two possible reasons for this. year … reasons … … … … [2]
Question paper, page 8
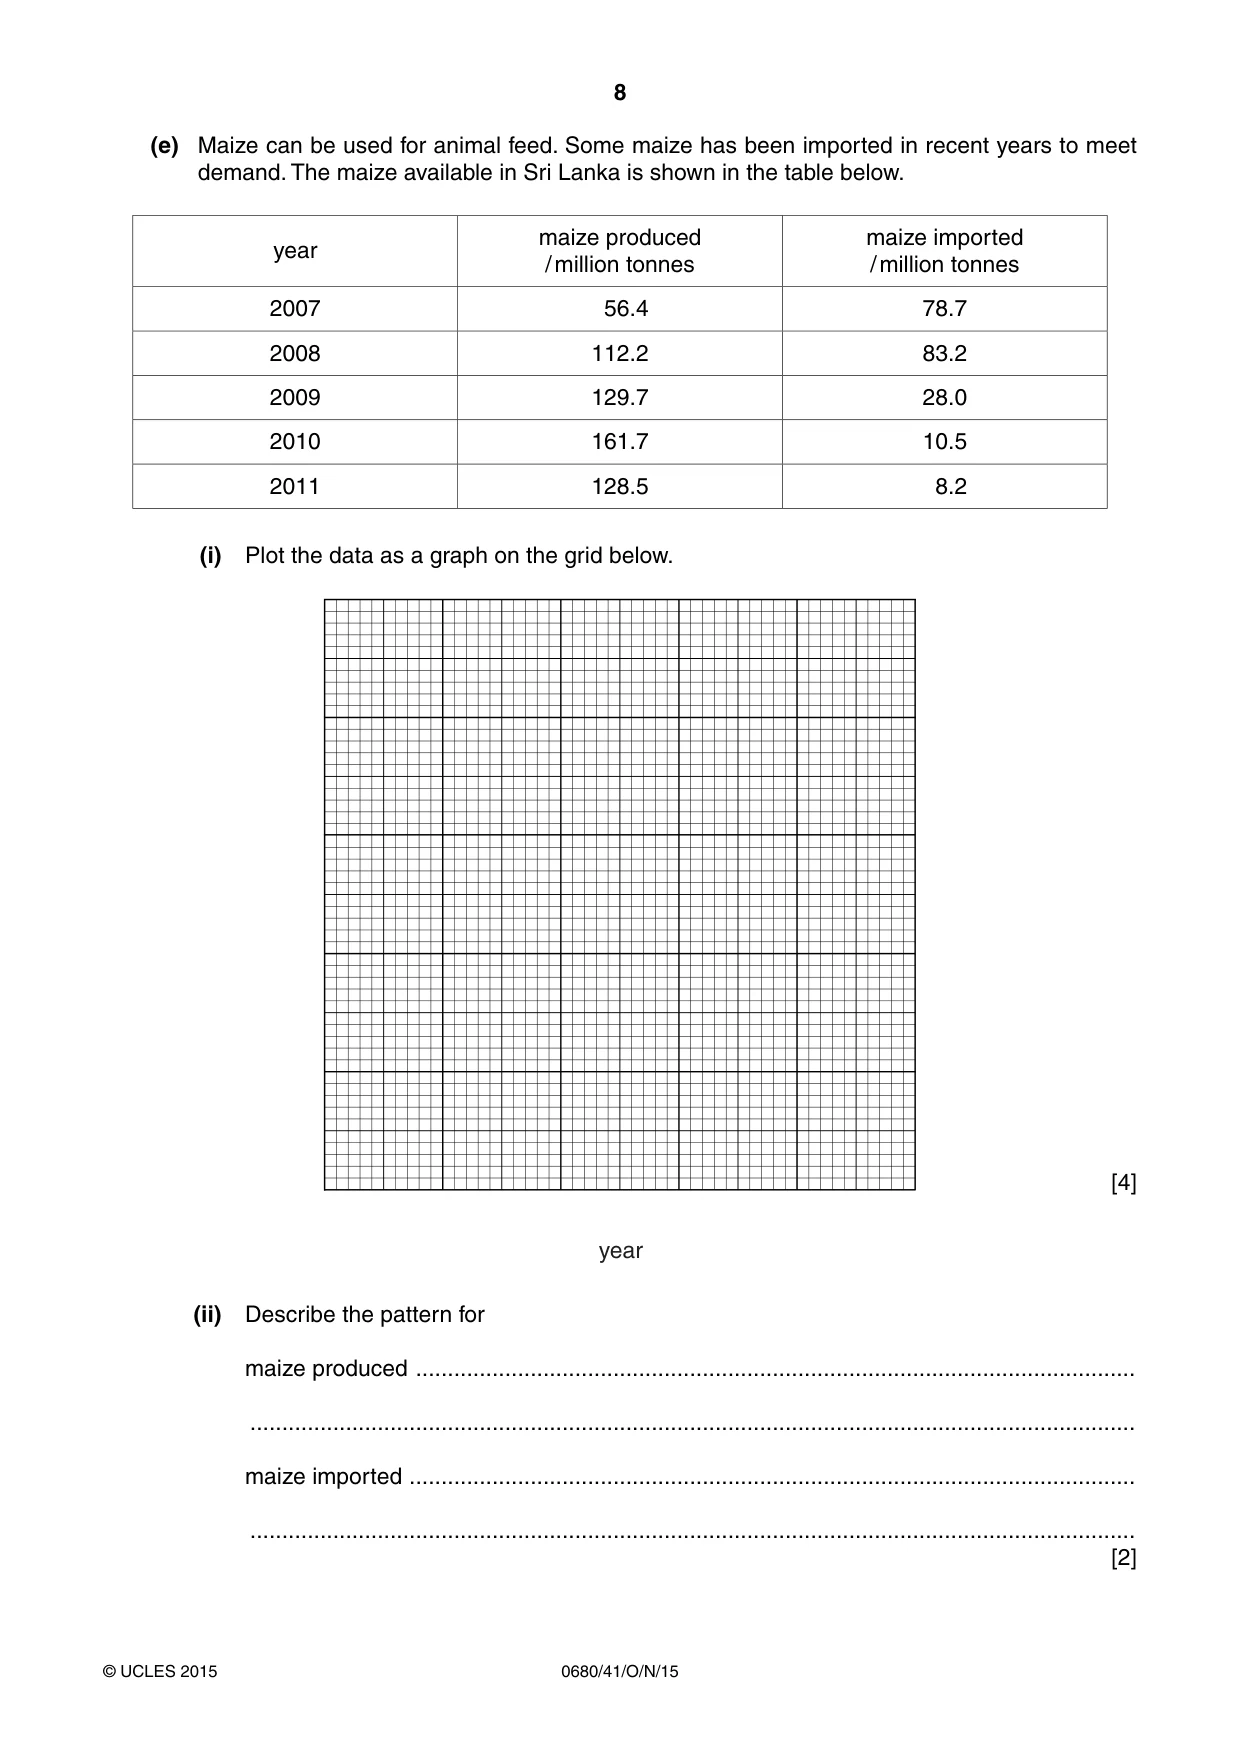
8 0680/41/O/N/15 © UCLES 2015 (e) Maize can be used for animal feed. Some maize has been imported in recent years to meet demand. The maize available in Sri Lanka is shown in the table below. year maize produced / million tonnes maize imported / million tonnes 2007 56.4 78.7 2008 112.2 83.2 2009 129.7 28.0 2010 161.7 10.5 2011 128.5 8.2 (i) Plot the data as a graph on the grid below. year [4] (ii) Describe the pattern for maize produced … … maize imported … … [2]
Question paper, page 9
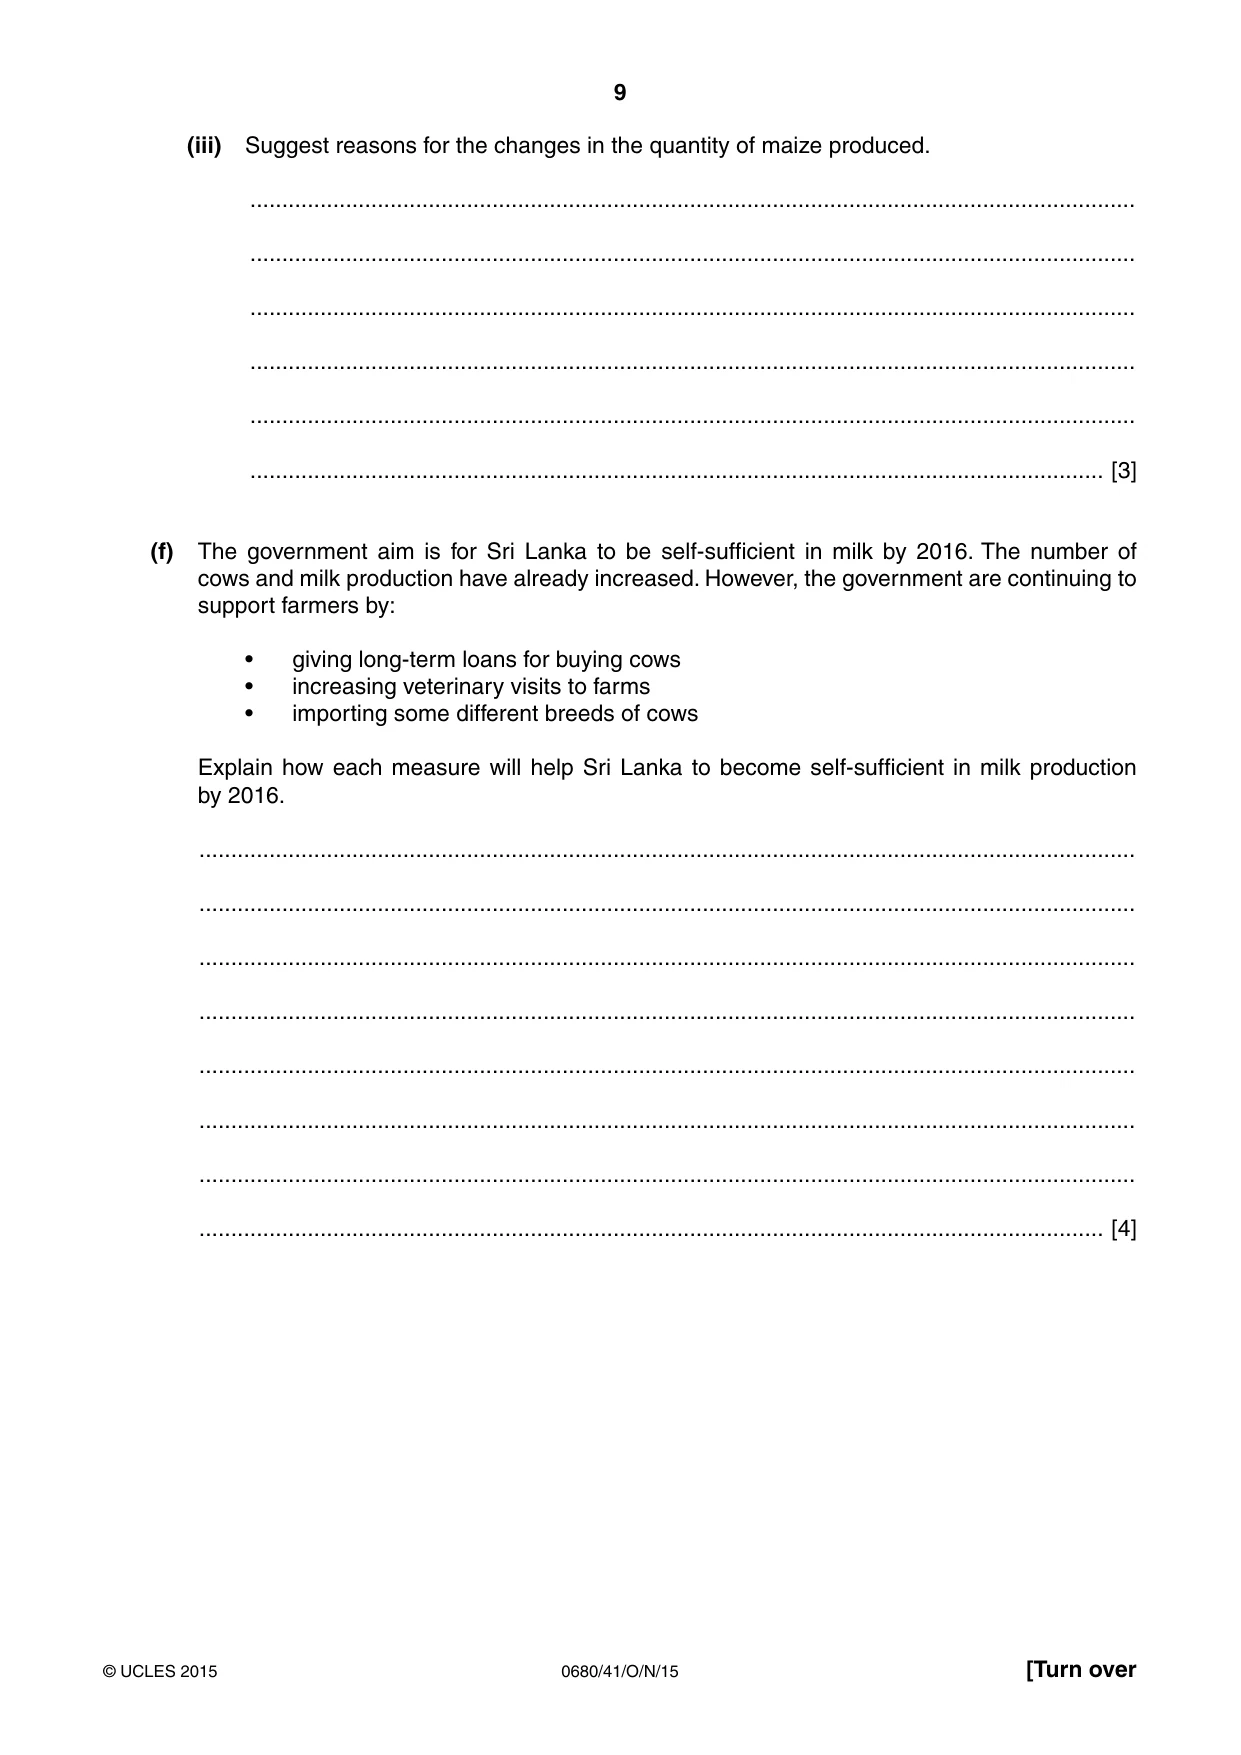
9 0680/41/O/N/15 © UCLES 2015 [Turn over (iii) Suggest reasons for the changes in the quantity of maize produced. … … … … … … [3] (f) The government aim is for Sri Lanka to be self-sufficient in milk by 2016. The number of cows and milk production have already increased. However, the government are continuing to support farmers by: • giving long-term loans for buying cows • increasing veterinary visits to farms • importing some different breeds of cows Explain how each measure will help Sri Lanka to become self-sufficient in milk production by 2016. … … … … … … … … [4]
Question paper, page 10
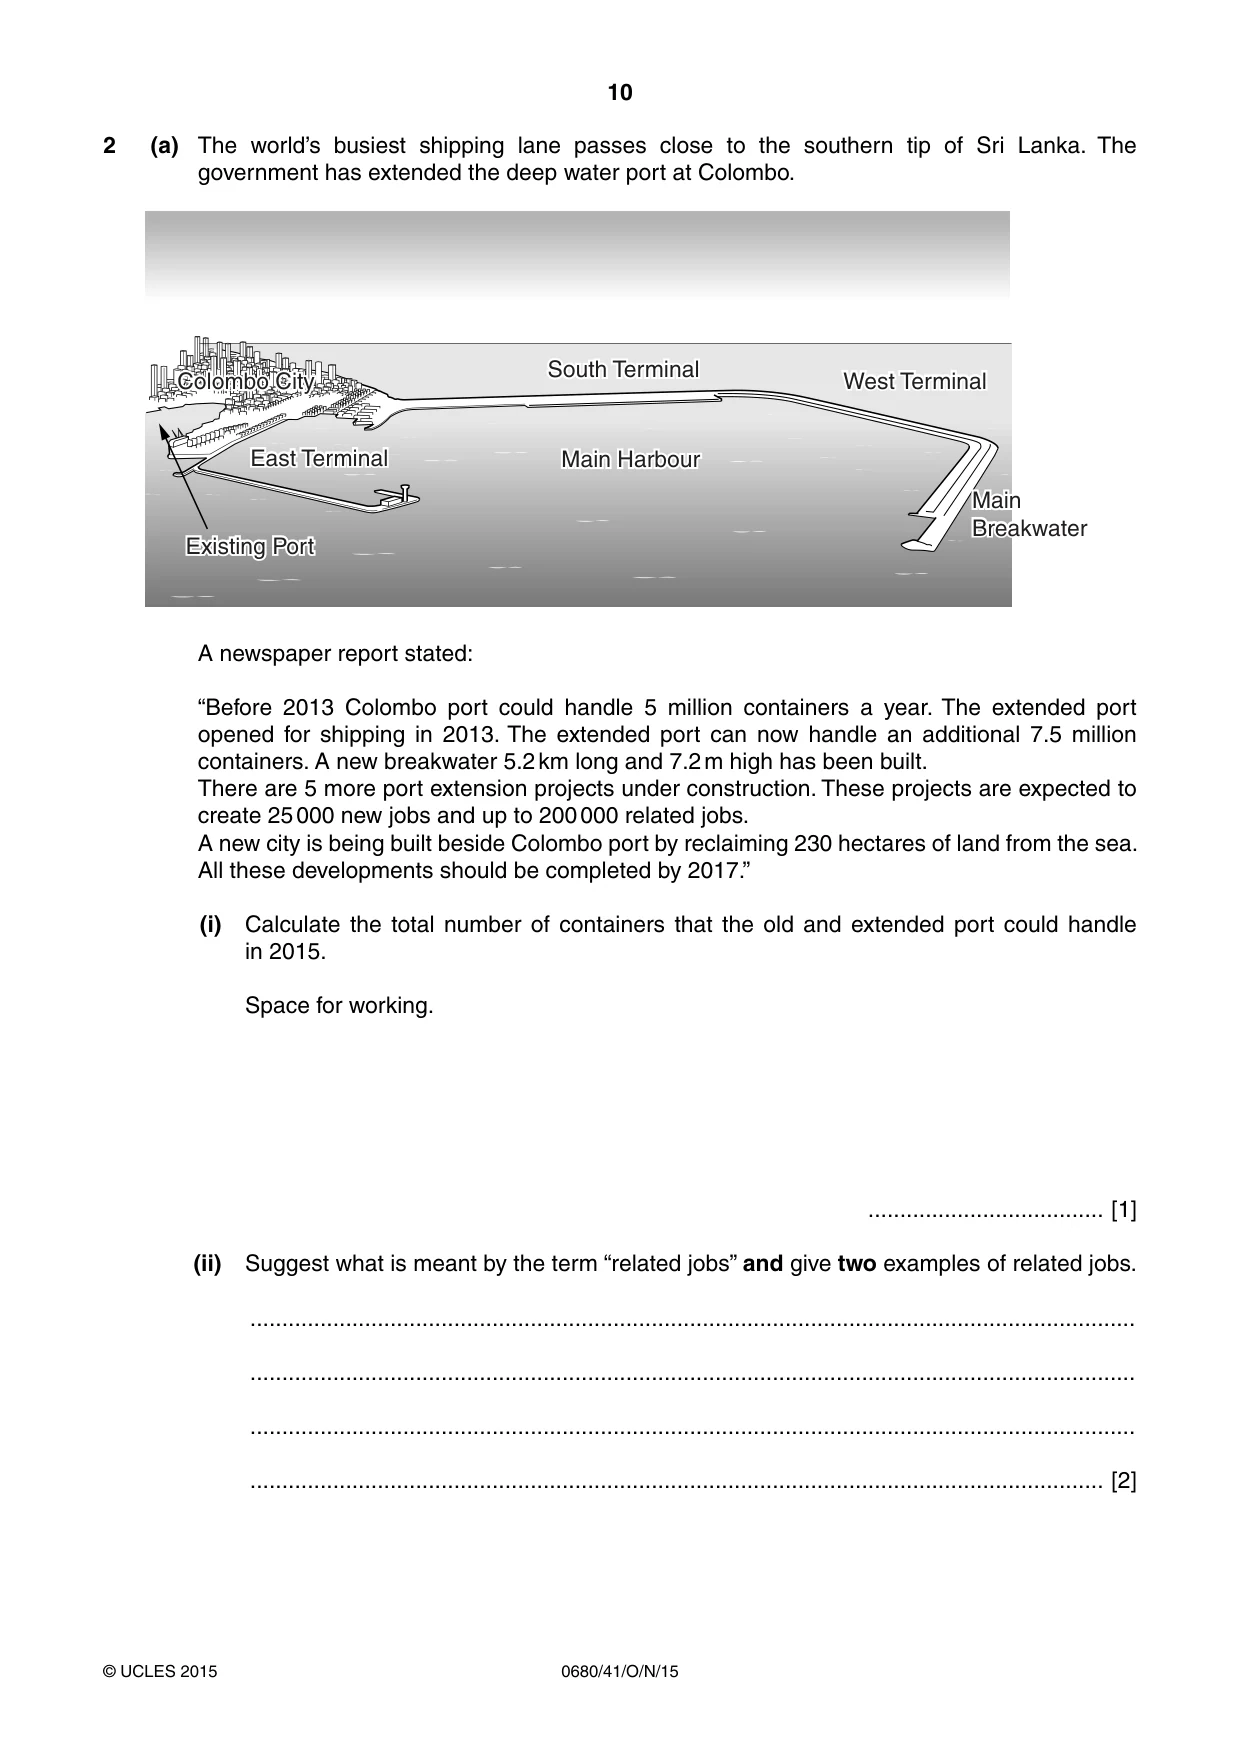
10 0680/41/O/N/15 © UCLES 2015 2 (a) The world’s busiest shipping lane passes close to the southern tip of Sri Lanka. The government has extended the deep water port at Colombo. Colombo City Colombo City Existing Port Existing Port Main Harbour Main Harbour Main Breakwater Main Breakwater East Terminal East Terminal West Terminal West Terminal South Terminal South Terminal A newspaper report stated: “Before 2013 Colombo port could handle 5 million containers a year. The extended port opened for shipping in 2013. The extended port can now handle an additional 7.5 million containers. A new breakwater 5.2 km long and 7.2 m high has been built. There are 5 more port extension projects under construction. These projects are expected to create 25 000 new jobs and up to 200 000 related jobs. A new city is being built beside Colombo port by reclaiming 230 hectares of land from the sea. All these developments should be completed by 2017.” (i) Calculate the total number of containers that the old and extended port could handle in 2015. Space for working. … [1] (ii) Suggest what is meant by the term “related jobs” and give two examples of related jobs. … … … … [2]
Question paper, page 11
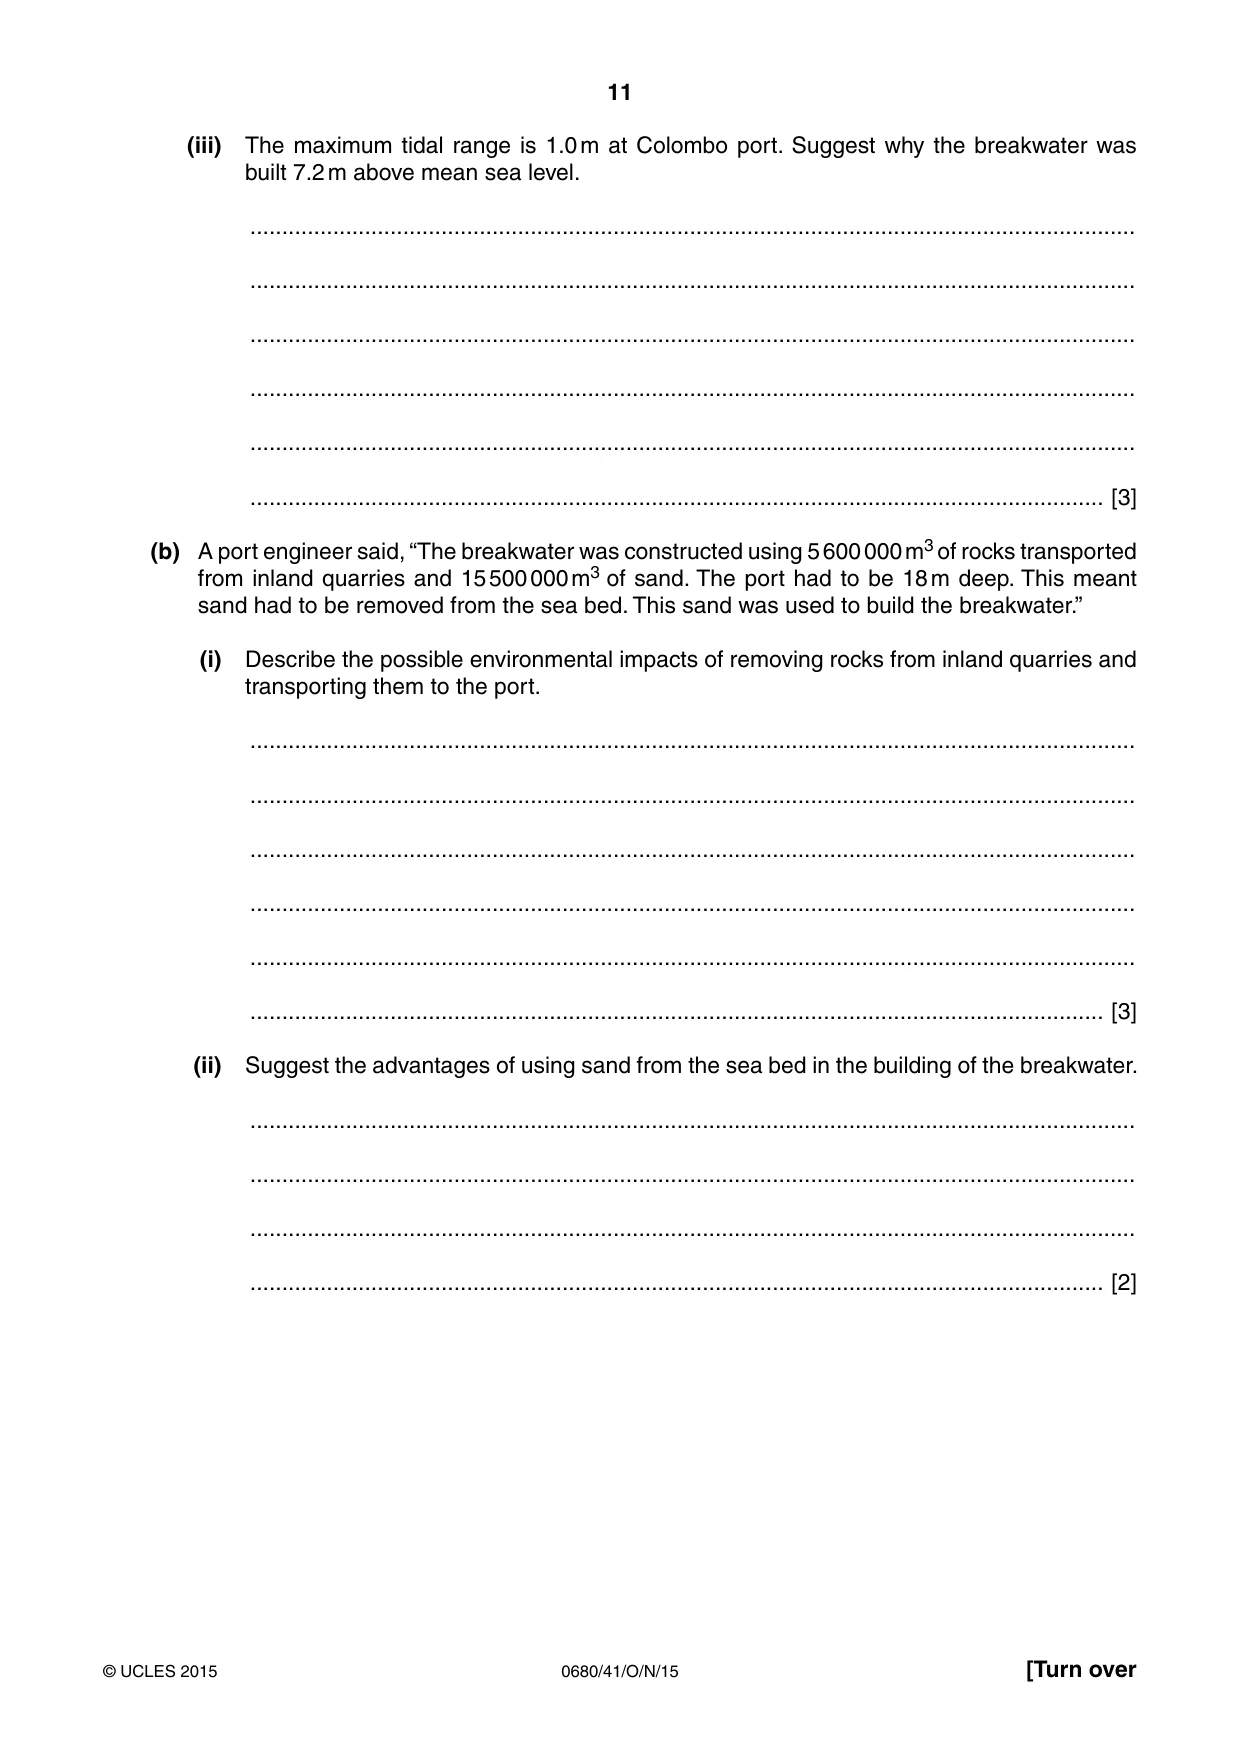
11 0680/41/O/N/15 © UCLES 2015 [Turn over (iii) The maximum tidal range is 1.0 m at Colombo port. Suggest why the breakwater was built 7.2 m above mean sea level. … … … … … … [3] (b) A port engineer said, “The breakwater was constructed using 5 600 000 m3 of rocks transported from inland quarries and 15 500 000 m3 of sand. The port had to be 18 m deep. This meant sand had to be removed from the sea bed. This sand was used to build the breakwater.” (i) Describe the possible environmental impacts of removing rocks from inland quarries and transporting them to the port. … … … … … … [3] (ii) Suggest the advantages of using sand from the sea bed in the building of the breakwater. … … … … [2]
Question paper, page 12
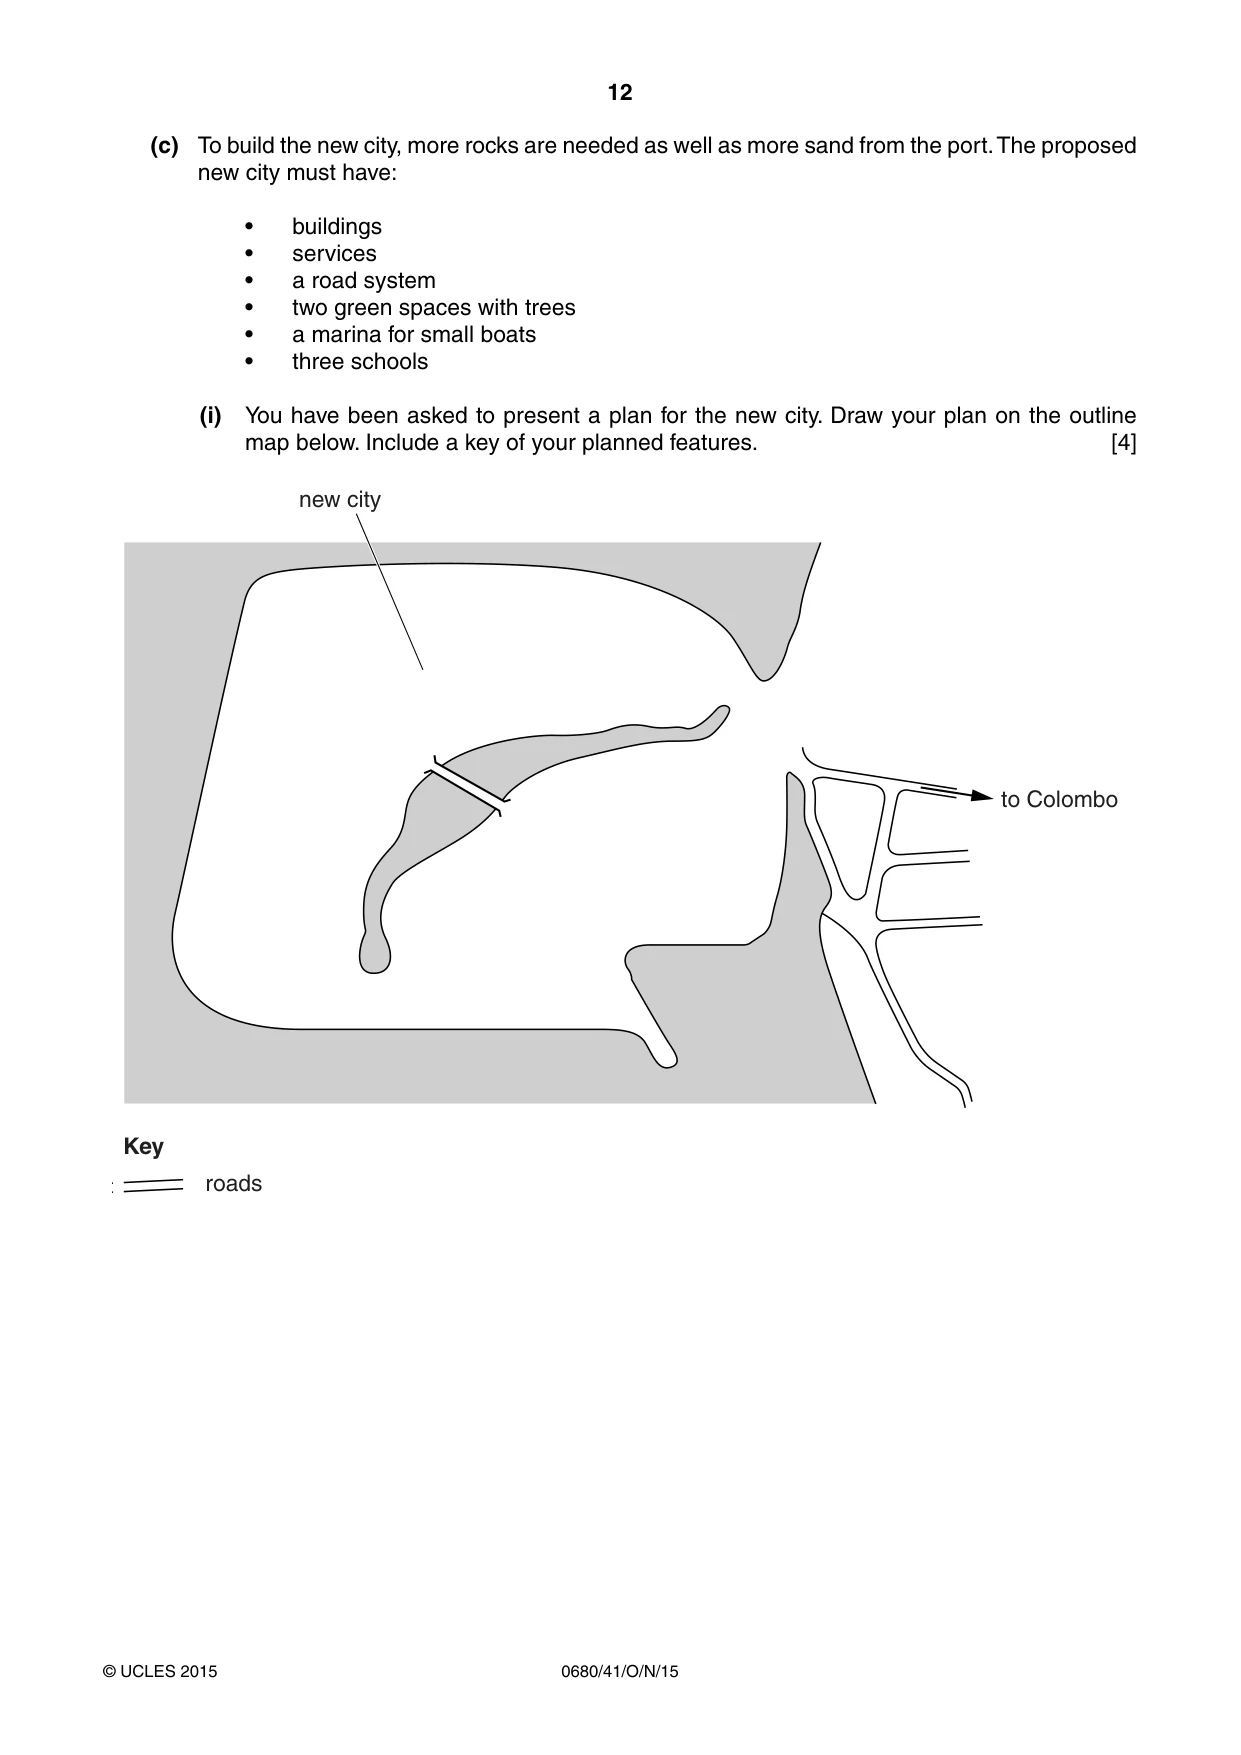
12 0680/41/O/N/15 © UCLES 2015 (c) To build the new city, more rocks are needed as well as more sand from the port. The proposed new city must have: • buildings • services • a road system • two green spaces with trees • a marina for small boats • three schools (i) You have been asked to present a plan for the new city. Draw your plan on the outline map below. Include a key of your planned features. [4] new city Key roads to Colombo
Question paper, page 13
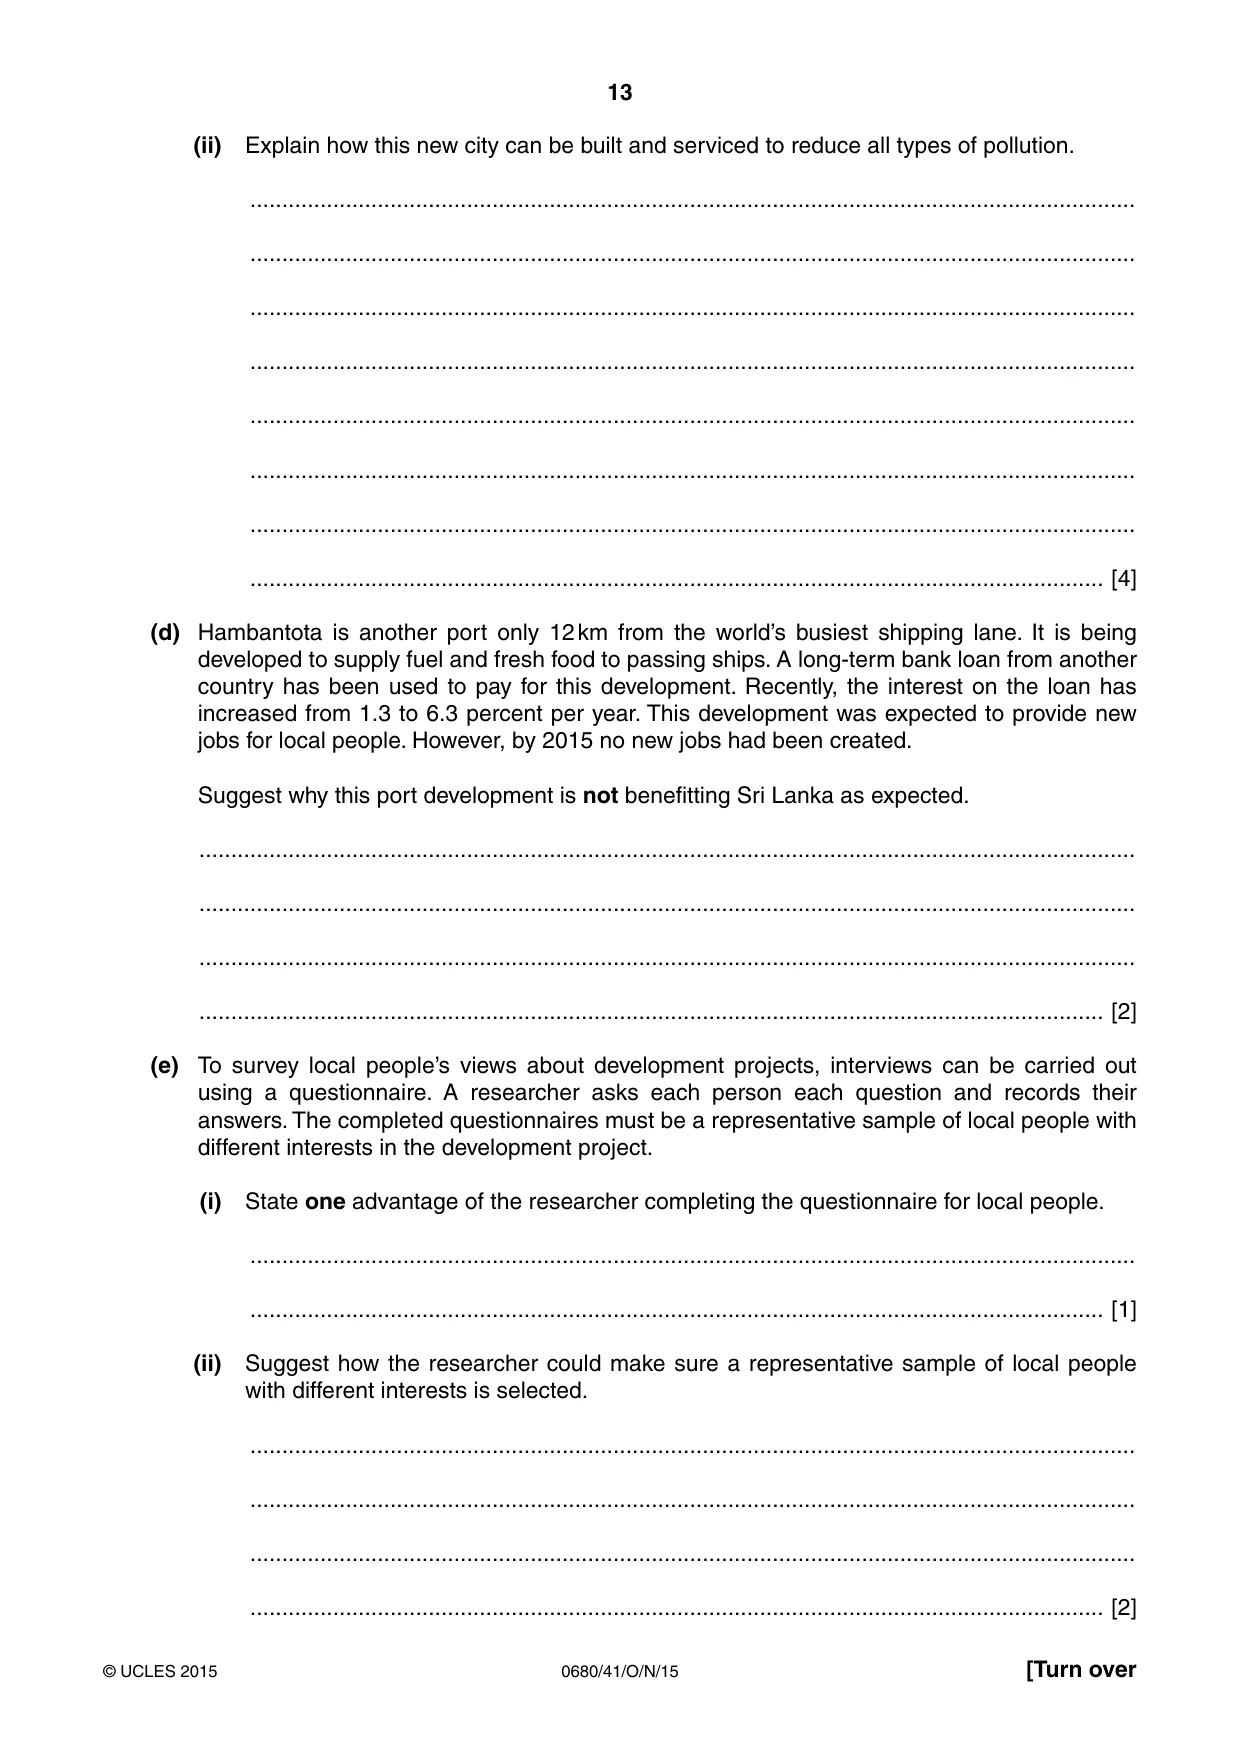
13 0680/41/O/N/15 © UCLES 2015 [Turn over (ii) Explain how this new city can be built and serviced to reduce all types of pollution. … … … … … … … … [4] (d) Hambantota is another port only 12 km from the world’s busiest shipping lane. It is being developed to supply fuel and fresh food to passing ships. A long-term bank loan from another country has been used to pay for this development. Recently, the interest on the loan has increased from 1.3 to 6.3 percent per year. This development was expected to provide new jobs for local people. However, by 2015 no new jobs had been created. Suggest why this port development is not benefitting Sri Lanka as expected. … … … … [2] (e) To survey local people’s views about development projects, interviews can be carried out using a questionnaire. A researcher asks each person each question and records their answers. The completed questionnaires must be a representative sample of local people with different interests in the development project. (i) State one advantage of the researcher completing the questionnaire for local people. … … [1] (ii) Suggest how the researcher could make sure a representative sample of local people with different interests is selected. … … … … [2]
Question paper, page 14
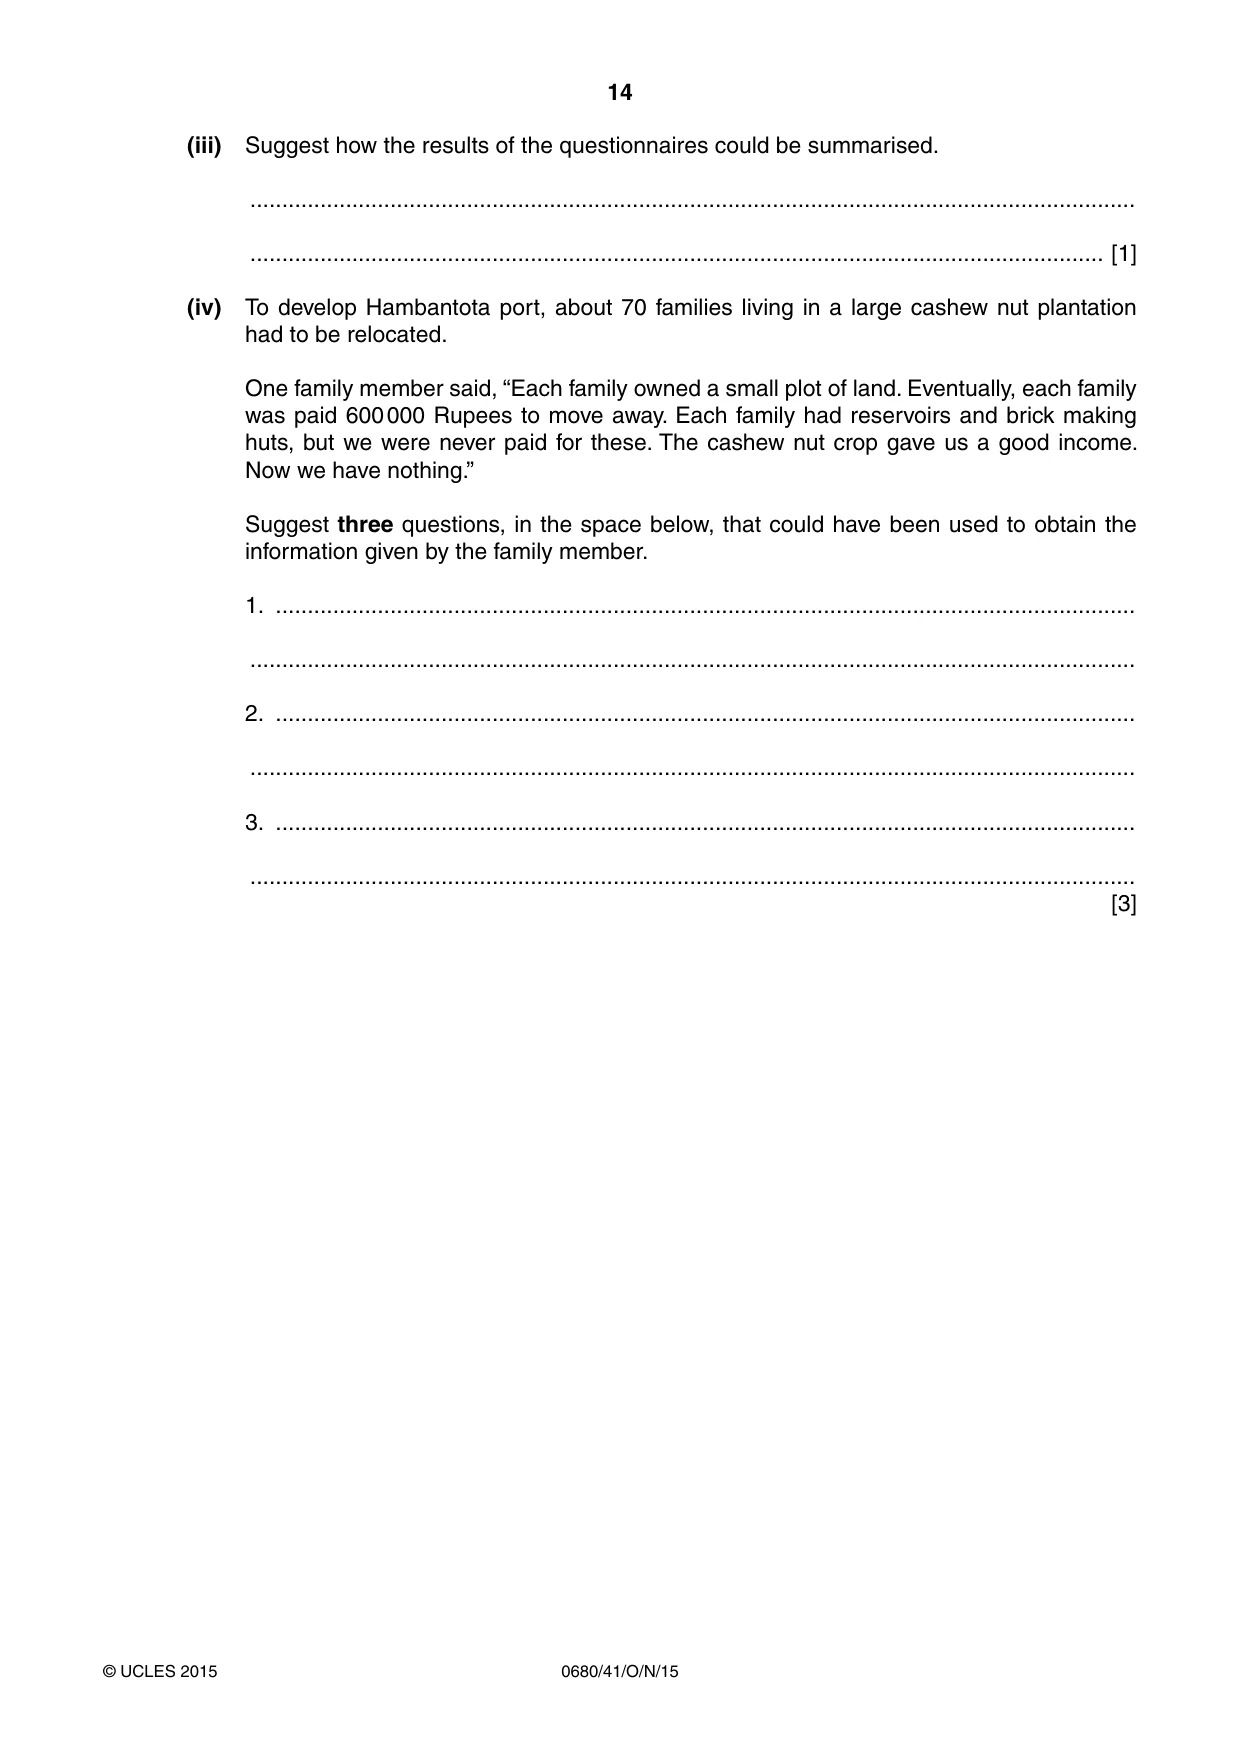
14 0680/41/O/N/15 © UCLES 2015 (iii) Suggest how the results of the questionnaires could be summarised. … … [1] (iv) To develop Hambantota port, about 70 families living in a large cashew nut plantation had to be relocated. One family member said, “Each family owned a small plot of land. Eventually, each family was paid 600 000 Rupees to move away. Each family had reservoirs and brick making huts, but we were never paid for these. The cashew nut crop gave us a good income. Now we have nothing.” Suggest three questions, in the space below, that could have been used to obtain the information given by the family member. 1. … … 2. … … 3. … … [3]
Question paper, page 15
15 0680/41/O/N/15 © UCLES 2015 BLANK PAGE
Question paper, page 16
16 0680/41/O/N/15 © UCLES 2015 Permission to reproduce items where third-party owned material protected by copyright is included has been sought and cleared where possible. Every reasonable effort has been made by the publisher (UCLES) to trace copyright holders, but if any items requiring clearance have unwittingly been included, the publisher will be pleased to make amends at the earliest possible opportunity. To avoid the issue of disclosure of answer-related information to candidates, all copyright acknowledgements are reproduced online in the Cambridge International Examinations Copyright Acknowledgements Booklet. This is produced for each series of examinations and is freely available to download at www.cie.org.uk after the live examination series. Cambridge International Examinations is part of the Cambridge Assessment Group. Cambridge Assessment is the brand name of University of Cambridge Local Examinations Syndicate (UCLES), which is itself a department of the University of Cambridge. BLANK PAGE
Mark scheme, page 1
® IGCSE is the registered trademark of Cambridge International Examinations. CAMBRIDGE INTERNATIONAL EXAMINATIONS Cambridge International General Certificate of Secondary Education MARK SCHEME for the October/November 2015 series 0680 ENVIRONMENTAL MANAGEMENT 0680/41 Paper 4 (Alternative to Coursework), maximum raw mark 60 This mark scheme is published as an aid to teachers and candidates, to indicate the requirements of the examination. It shows the basis on which Examiners were instructed to award marks. It does not indicate the details of the discussions that took place at an Examiners’ meeting before marking began, which would have considered the acceptability of alternative answers. Mark schemes should be read in conjunction with the question paper and the Principal Examiner Report for Teachers. Cambridge will not enter into discussions about these mark schemes. Cambridge is publishing the mark schemes for the October/November 2015 series for most Cambridge IGCSE®, Cambridge International A and AS Level components and some Cambridge O Level components.
Mark scheme, page 2
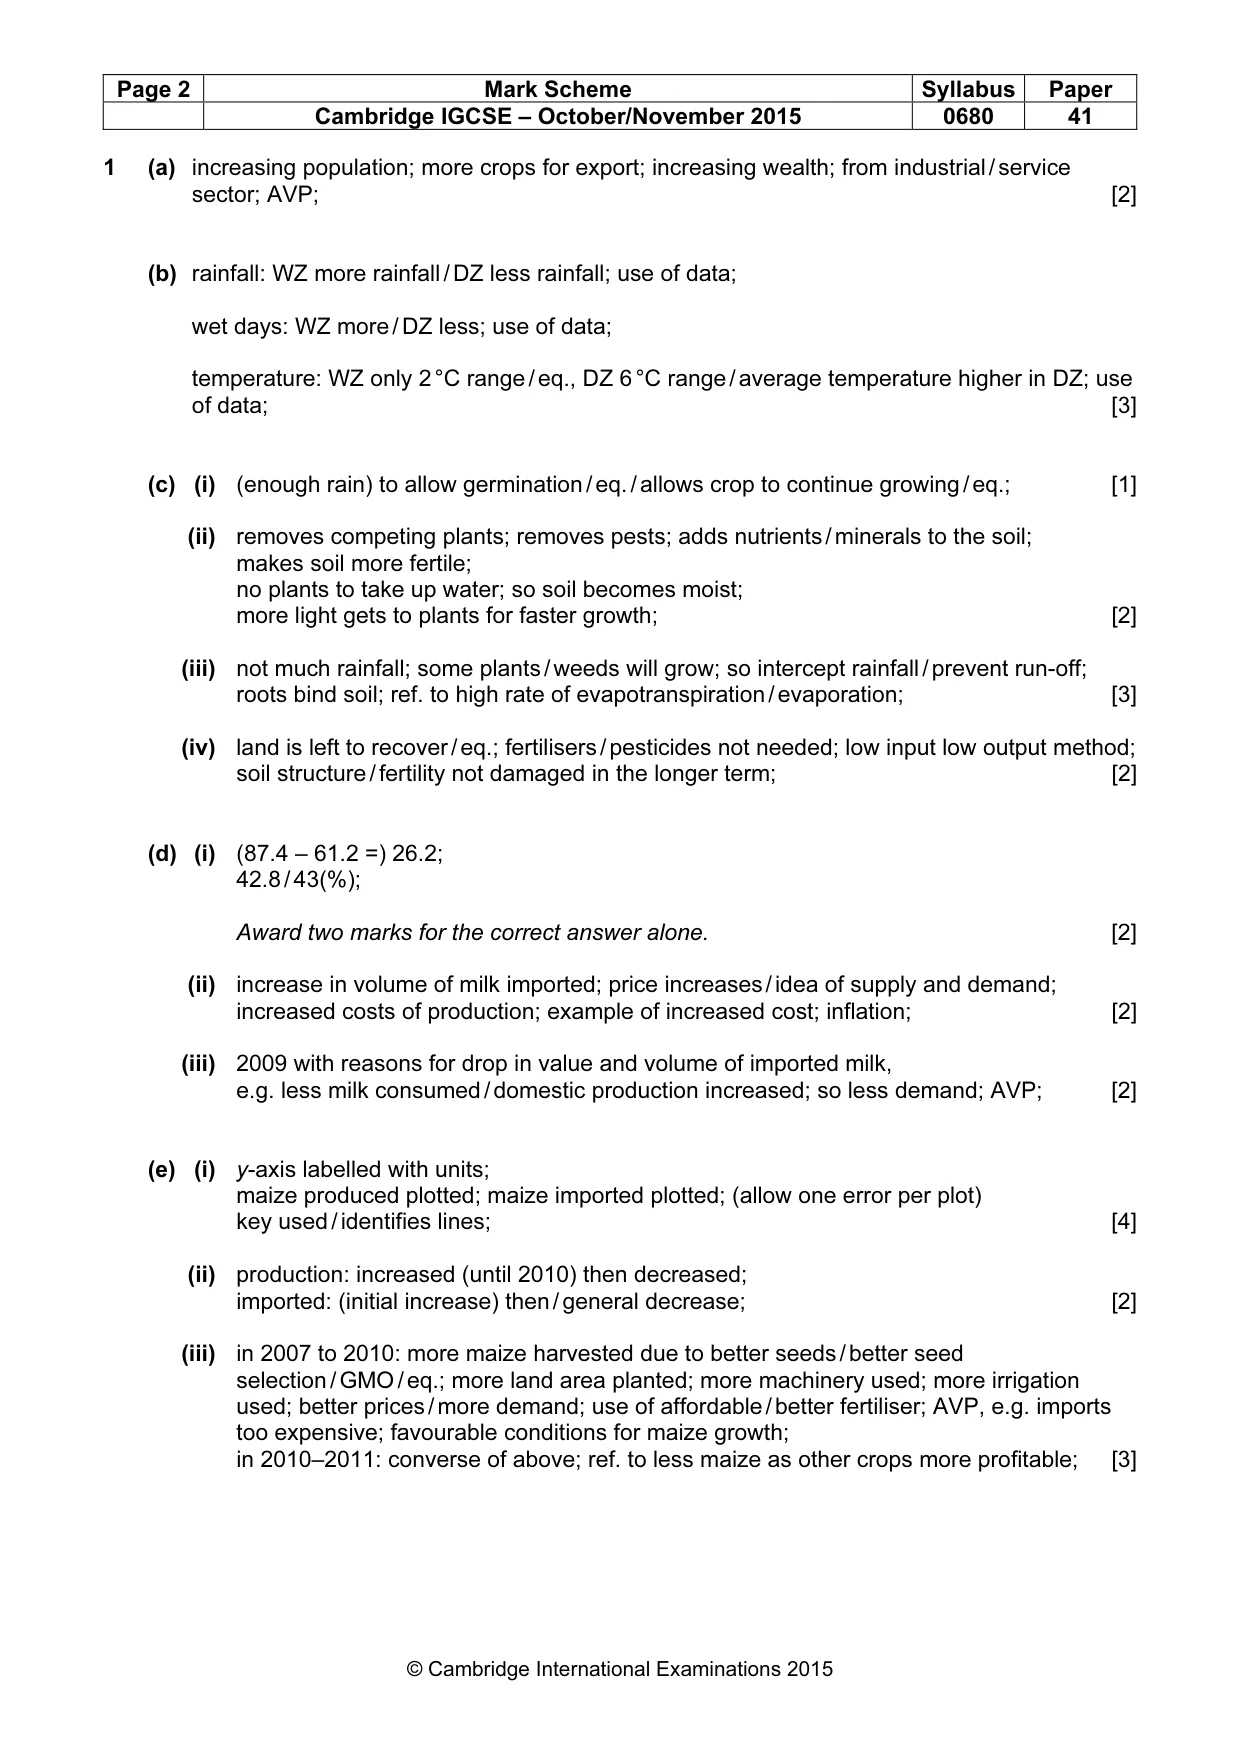
Page 2 Mark Scheme Syllabus Paper Cambridge IGCSE – October/November 2015 0680 41 © Cambridge International Examinations 2015 1 (a) increasing population; more crops for export; increasing wealth; from industrial / service sector; AVP; [2] (b) rainfall: WZ more rainfall / DZ less rainfall; use of data; wet days: WZ more / DZ less; use of data; temperature: WZ only 2 °C range / eq., DZ 6 °C range / average temperature higher in DZ; use of data; [3] (c) (i) (enough rain) to allow germination / eq. / allows crop to continue growing / eq.; [1] (ii) removes competing plants; removes pests; adds nutrients / minerals to the soil; makes soil more fertile; no plants to take up water; so soil becomes moist; more light gets to plants for faster growth; [2] (iii) not much rainfall; some plants / weeds will grow; so intercept rainfall / prevent run-off; roots bind soil; ref. to high rate of evapotranspiration / evaporation; [3] (iv) land is left to recover / eq.; fertilisers / pesticides not needed; low input low output method; soil structure / fertility not damaged in the longer term; [2] (d) (i) (87.4 – 61.2 =) 26.2; 42.8 / 43(%); Award two marks for the correct answer alone. [2] (ii) increase in volume of milk imported; price increases / idea of supply and demand; increased costs of production; example of increased cost; inflation; [2] (iii) 2009 with reasons for drop in value and volume of imported milk, e.g. less milk consumed / domestic production increased; so less demand; AVP; [2] (e) (i) y-axis labelled with units; maize produced plotted; maize imported plotted; (allow one error per plot) key used / identifies lines; [4] (ii) production: increased (until 2010) then decreased; imported: (initial increase) then / general decrease; [2] (iii) in 2007 to 2010: more maize harvested due to better seeds / better seed selection / GMO / eq.; more land area planted; more machinery used; more irrigation used; better prices / more demand; use of affordable / better fertiliser; AVP, e.g. imports too expensive; favourable conditions for maize growth; in 2010–2011: converse of above; ref. to less maize as other crops more profitable; [3]
Mark scheme, page 3
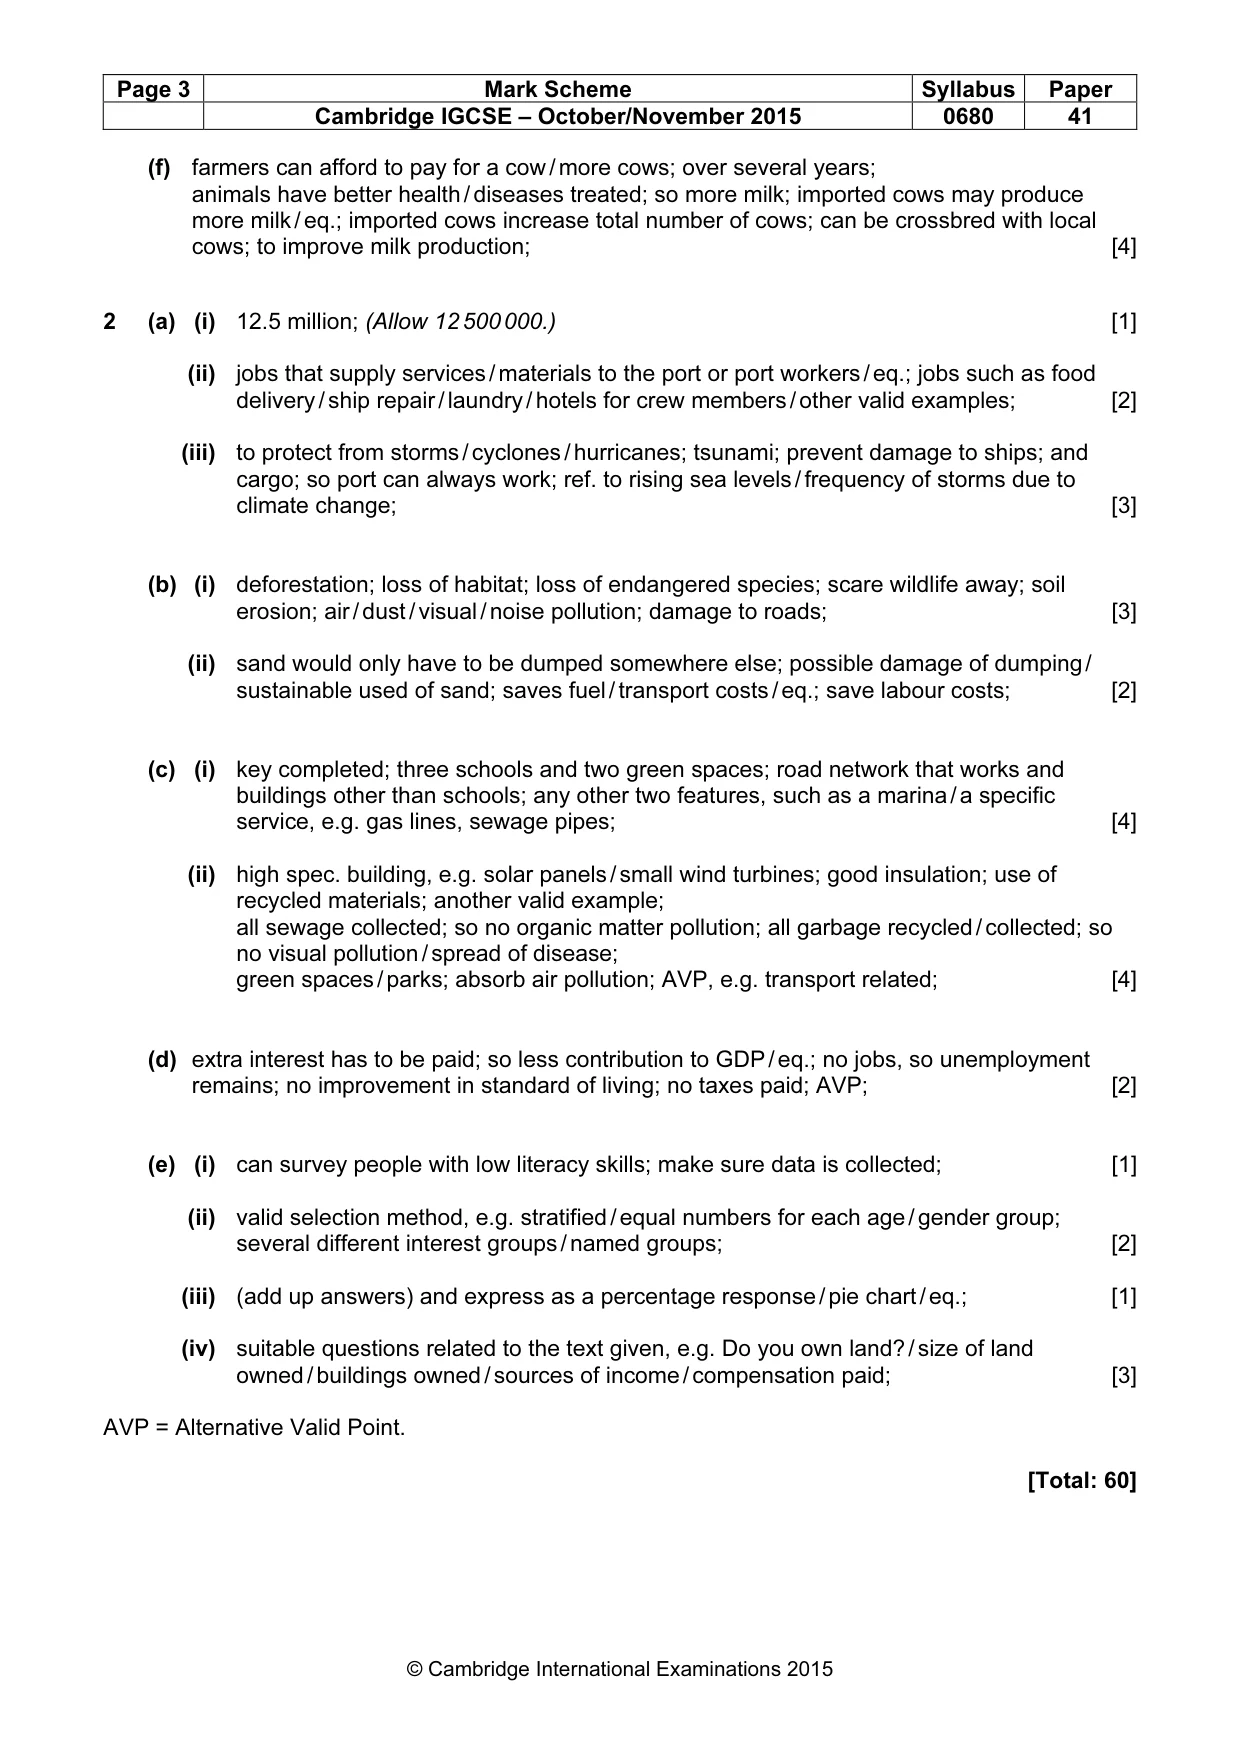
Page 3 Mark Scheme Syllabus Paper Cambridge IGCSE – October/November 2015 0680 41 © Cambridge International Examinations 2015 (f) farmers can afford to pay for a cow / more cows; over several years; animals have better health / diseases treated; so more milk; imported cows may produce more milk / eq.; imported cows increase total number of cows; can be crossbred with local cows; to improve milk production; [4] 2 (a) (i) 12.5 million; (Allow 12 500 000.) [1] (ii) jobs that supply services / materials to the port or port workers / eq.; jobs such as food delivery / ship repair / laundry / hotels for crew members / other valid examples; [2] (iii) to protect from storms / cyclones / hurricanes; tsunami; prevent damage to ships; and cargo; so port can always work; ref. to rising sea levels / frequency of storms due to climate change; [3] (b) (i) deforestation; loss of habitat; loss of endangered species; scare wildlife away; soil erosion; air / dust / visual / noise pollution; damage to roads; [3] (ii) sand would only have to be dumped somewhere else; possible damage of dumping / sustainable used of sand; saves fuel / transport costs / eq.; save labour costs; [2] (c) (i) key completed; three schools and two green spaces; road network that works and buildings other than schools; any other two features, such as a marina / a specific service, e.g. gas lines, sewage pipes; [4] (ii) high spec. building, e.g. solar panels / small wind turbines; good insulation; use of recycled materials; another valid example; all sewage collected; so no organic matter pollution; all garbage recycled / collected; so no visual pollution / spread of disease; green spaces / parks; absorb air pollution; AVP, e.g. transport related; [4] (d) extra interest has to be paid; so less contribution to GDP / eq.; no jobs, so unemployment remains; no improvement in standard of living; no taxes paid; AVP; [2] (e) (i) can survey people with low literacy skills; make sure data is collected; [1] (ii) valid selection method, e.g. stratified / equal numbers for each age / gender group; several different interest groups / named groups; [2] (iii) (add up answers) and express as a percentage response / pie chart / eq.; [1] (iv) suitable questions related to the text given, e.g. Do you own land? / size of land owned / buildings owned / sources of income / compensation paid; [3] AVP = Alternative Valid Point. [Total: 60]
What you needed in this session
Cambridge’s own grade thresholds for 2015 Oct/Nov, Paper 4 · Variant 1. A higher threshold means an easier paper — the bar moves with how the cohort did.