Cambridge IGCSE Environmental Management 0680 — 2015 May/June Paper 2 · Variant 3
0680/23/M/J/15 · 80 marks · ≈90 min
The question paper and its mark scheme, free to read here and free to download. This is Cambridge’s own paper, exactly as it was sat.
Question paper16 pages
Mark scheme6 pages
Answers below. Sit the paper first if you are practising.
Paper as text
Question paper, page 1
This document consists of 15 printed pages and 1 blank page. DC (LK/SG) 100158/3 © UCLES 2015 [Turn over Cambridge International Examinations Cambridge International General Certificate of Secondary Education * 4 8 8 8 6 1 4 6 0 5 * ENVIRONMENTAL MANAGEMENT 0680/23 Paper 2 May/June 2015 1 hour 45 minutes Candidates answer on the Question Paper. No Additional Materials are required. READ THESE INSTRUCTIONS FIRST Write your Centre number, candidate number and name on all the work you hand in. Write in dark blue or black pen. You may use an HB pencil for any diagrams or graphs. Do not use staples, paper clips, glue or correction fluid. DO NOT WRITE IN ANY BARCODES. Answer both questions. Electronic calculators may be used. You may lose marks if you do not show your working or if you do not use appropriate units. At the end of the examination, fasten all your work securely together. The number of marks is given in brackets [ ] at the end of each question or part question.
Question paper, page 2
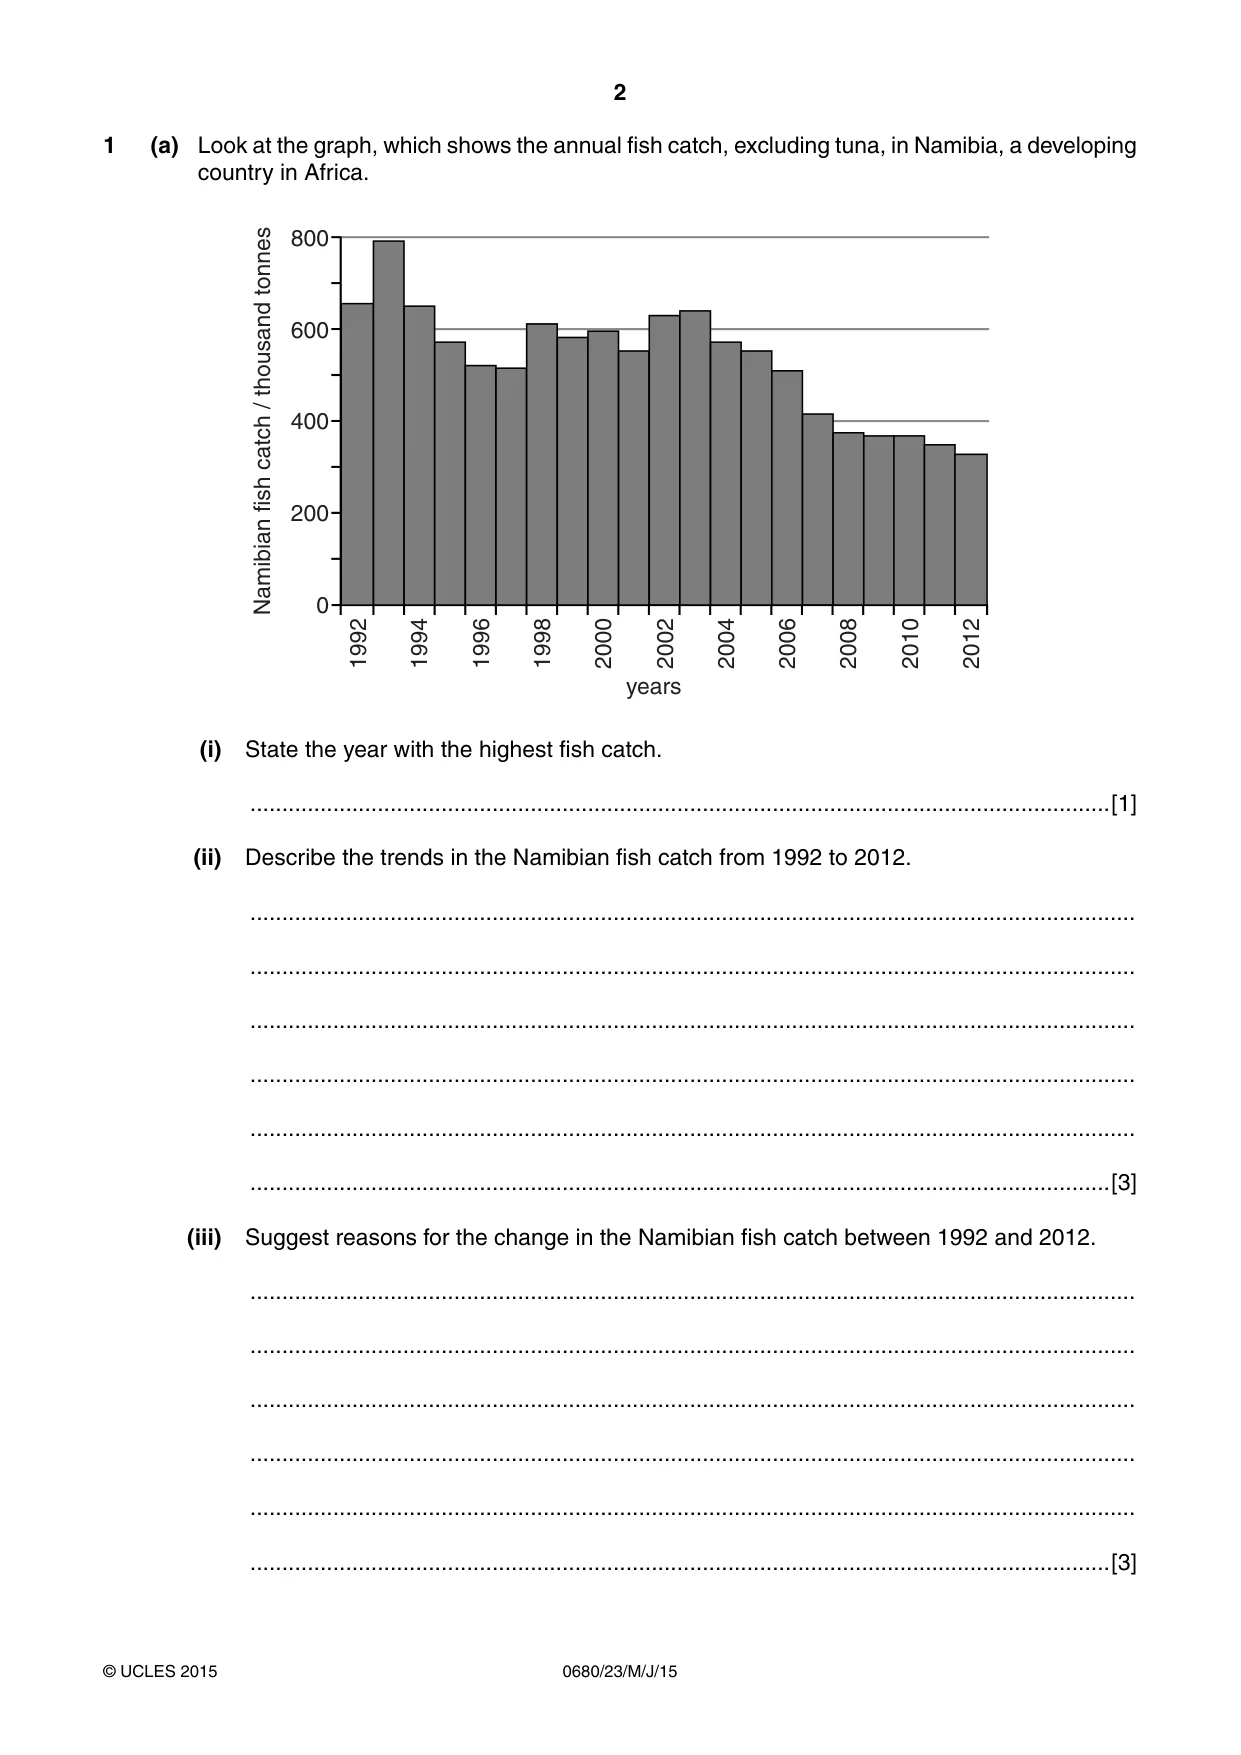
2 0680/23/M/J/15 © UCLES 2015 1 (a) Look at the graph, which shows the annual fish catch, excluding tuna, in Namibia, a developing country in Africa. 1992 1994 1996 1998 2000 2002 2004 2006 2008 2010 2012 years Namibian fish catch / thousand tonnes 800 600 400 200 0 (i) State the year with the highest fish catch. …[1] (ii) Describe the trends in the Namibian fish catch from 1992 to 2012. … … … … … …[3] (iii) Suggest reasons for the change in the Namibian fish catch between 1992 and 2012. … … … … … …[3]
Question paper, page 3
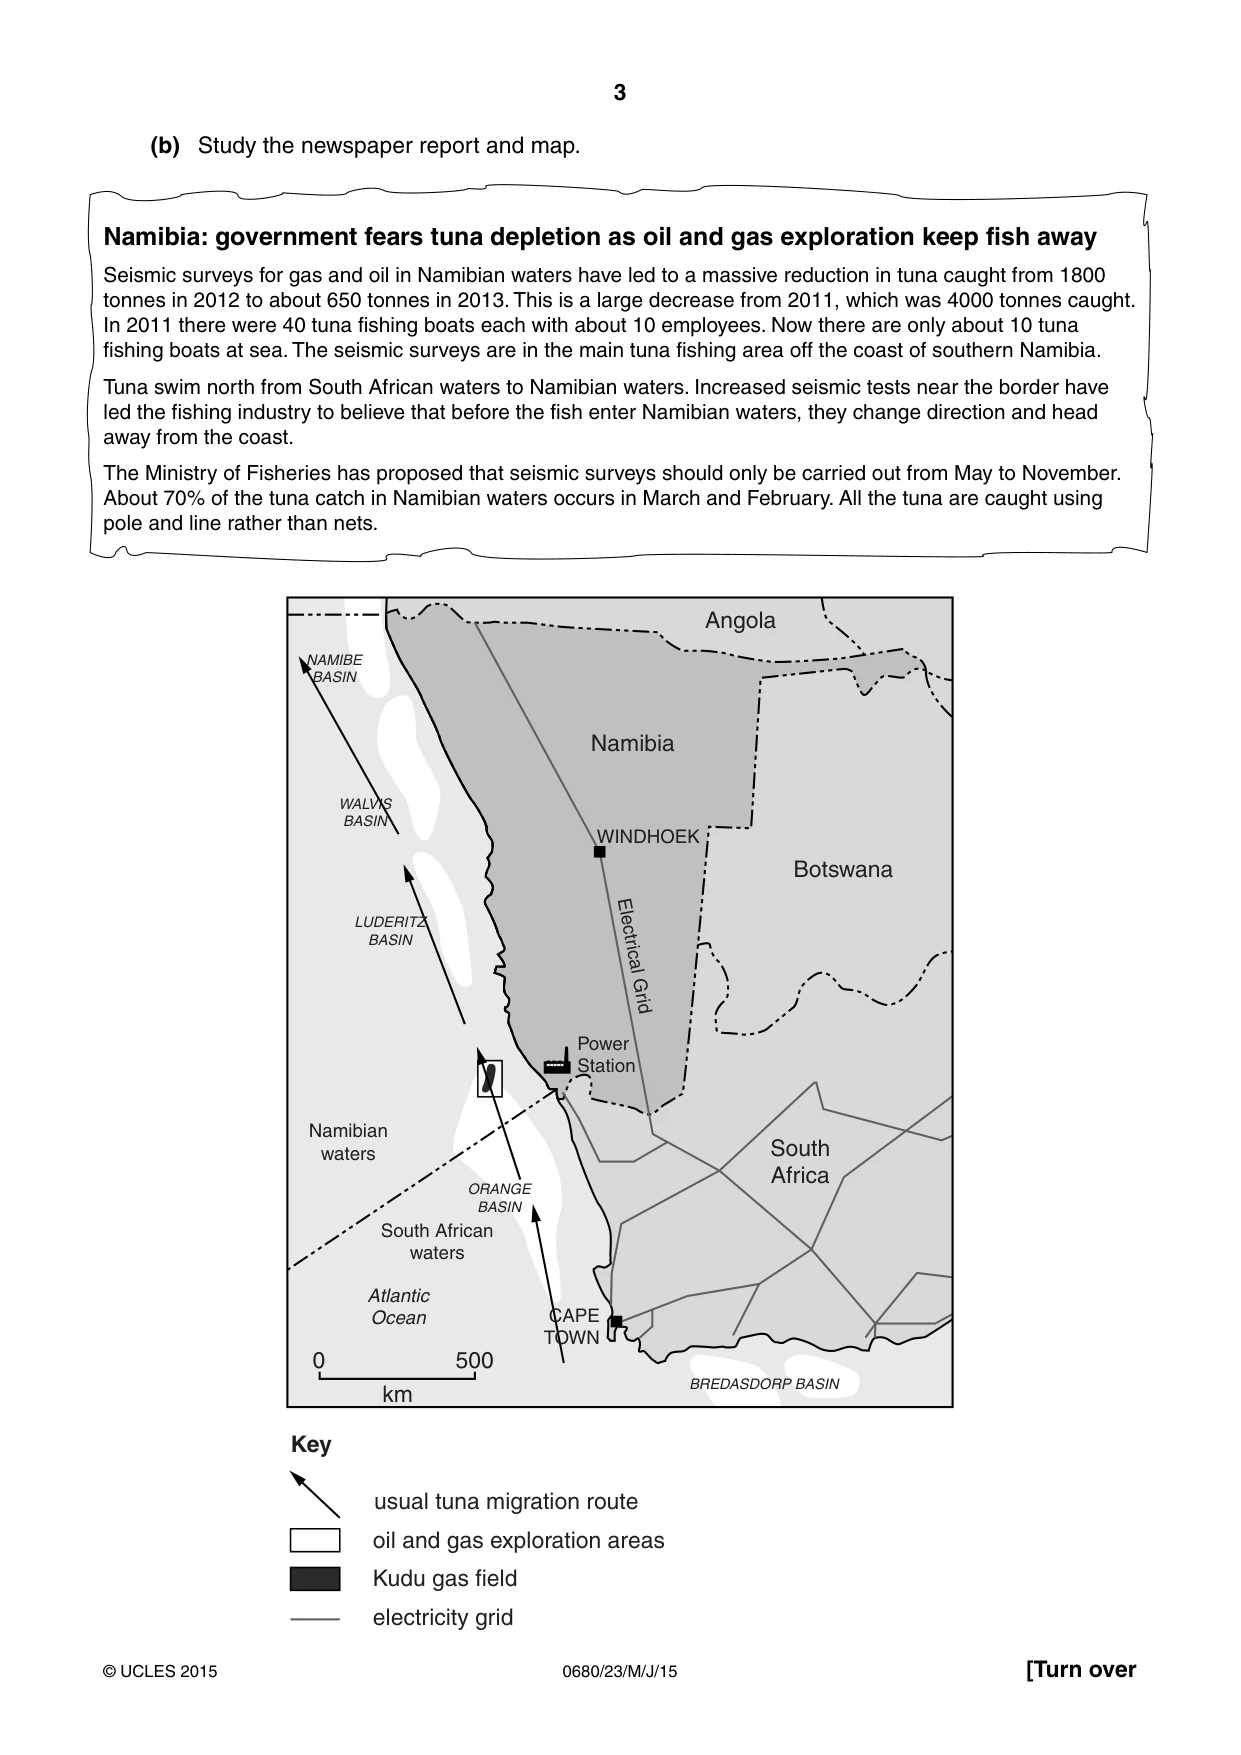
3 0680/23/M/J/15 © UCLES 2015 [Turn over (b) Study the newspaper report and map. usual tuna migration route oil and gas exploration areas Kudu gas field electricity grid Key Botswana Angola South Africa Namibia Electrical Grid WINDHOEK CAPE TOWN Power Station South African waters Namibian waters Atlantic Ocean BREDASDORP BASIN ORANGE BASIN LUDERITZ BASIN WALVIS BASIN NAMIBE BASIN 0 500 km Namibia: government fears tuna depletion as oil and gas exploration keep fish away Seismic surveys for gas and oil in Namibian waters have led to a massive reduction in tuna caught from 1800 tonnes in 2012 to about 650 tonnes in 2013. This is a large decrease from 2011, which was 4000 tonnes caught. In 2011 there were 40 tuna fishing boats each with about 10 employees. Now there are only about 10 tuna fishing boats at sea. The seismic surveys are in the main tuna fishing area off the coast of southern Namibia. Tuna swim north from South African waters to Namibian waters. Increased seismic tests near the border have led the fishing industry to believe that before the fish enter Namibian waters, they change direction and head away from the coast. The Ministry of Fisheries has proposed that seismic surveys should only be carried out from May to November. About 70% of the tuna catch in Namibian waters occurs in March and February. All the tuna are caught using pole and line rather than nets.
Question paper, page 4
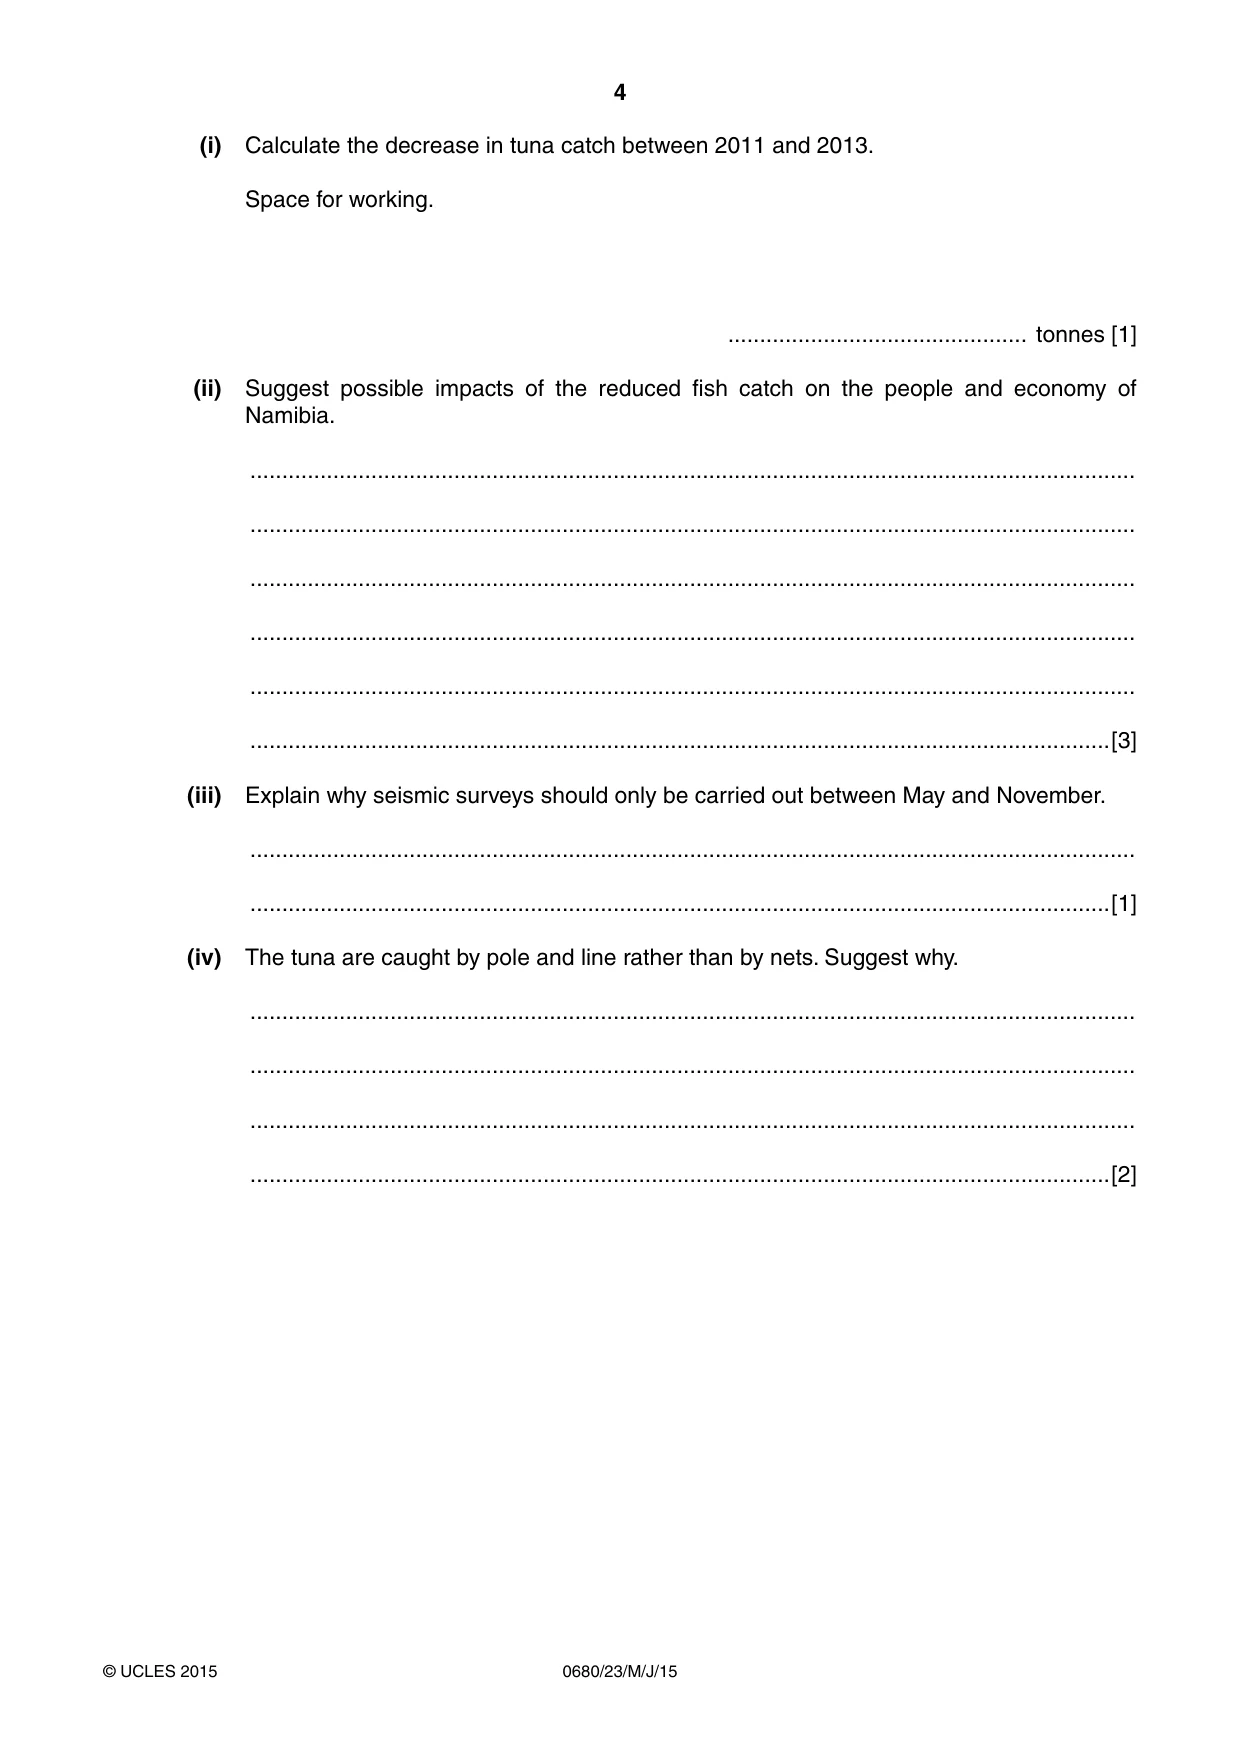
4 0680/23/M/J/15 © UCLES 2015 (i) Calculate the decrease in tuna catch between 2011 and 2013. Space for working. … tonnes [1] (ii) Suggest possible impacts of the reduced fish catch on the people and economy of Namibia. … … … … … …[3] (iii) Explain why seismic surveys should only be carried out between May and November. … …[1] (iv) The tuna are caught by pole and line rather than by nets. Suggest why. … … … …[2]
Question paper, page 5
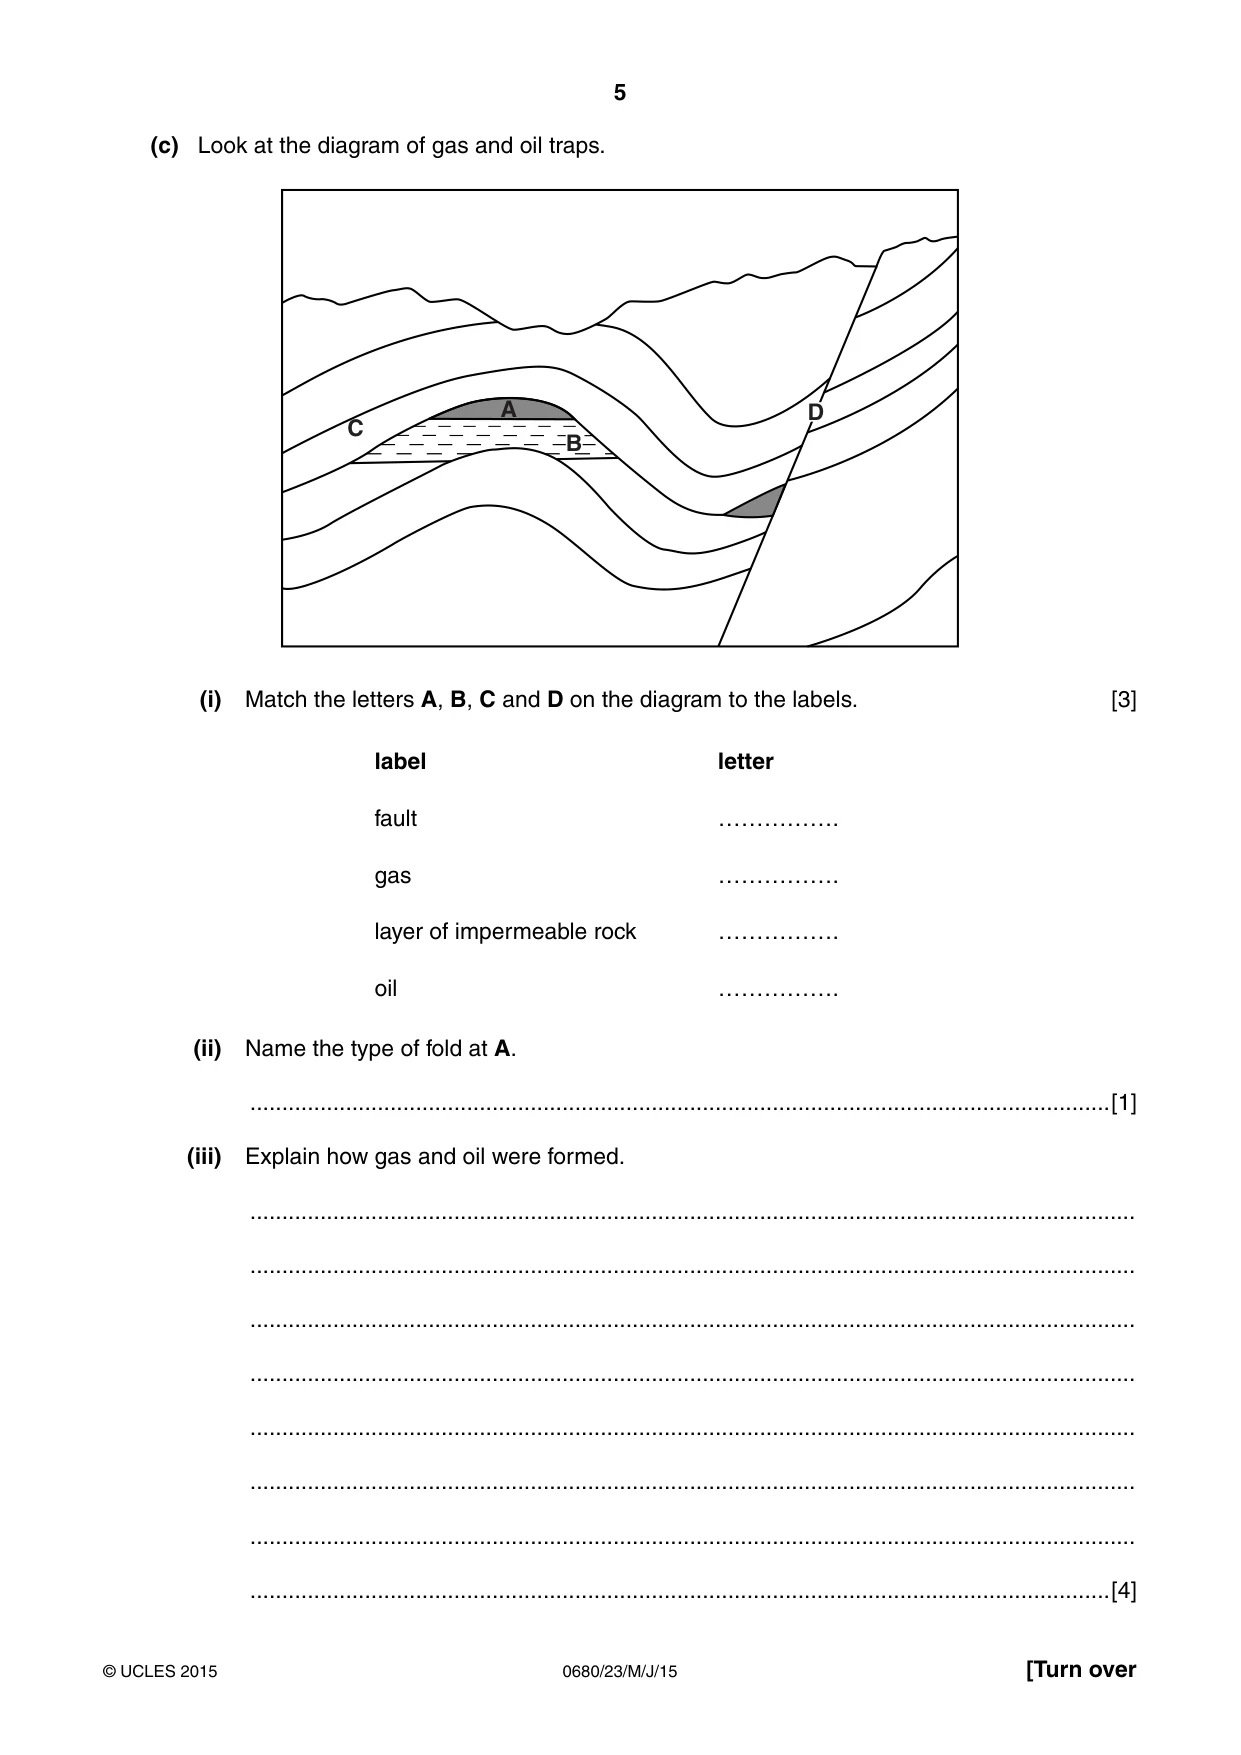
5 0680/23/M/J/15 © UCLES 2015 [Turn over (c) Look at the diagram of gas and oil traps. C A B D (i) Match the letters A, B, C and D on the diagram to the labels. [3] label letter fault ……………. gas ……………. layer of impermeable rock ……………. oil ……………. (ii) Name the type of fold at A. …[1] (iii) Explain how gas and oil were formed. … … … … … … … …[4]
Question paper, page 6
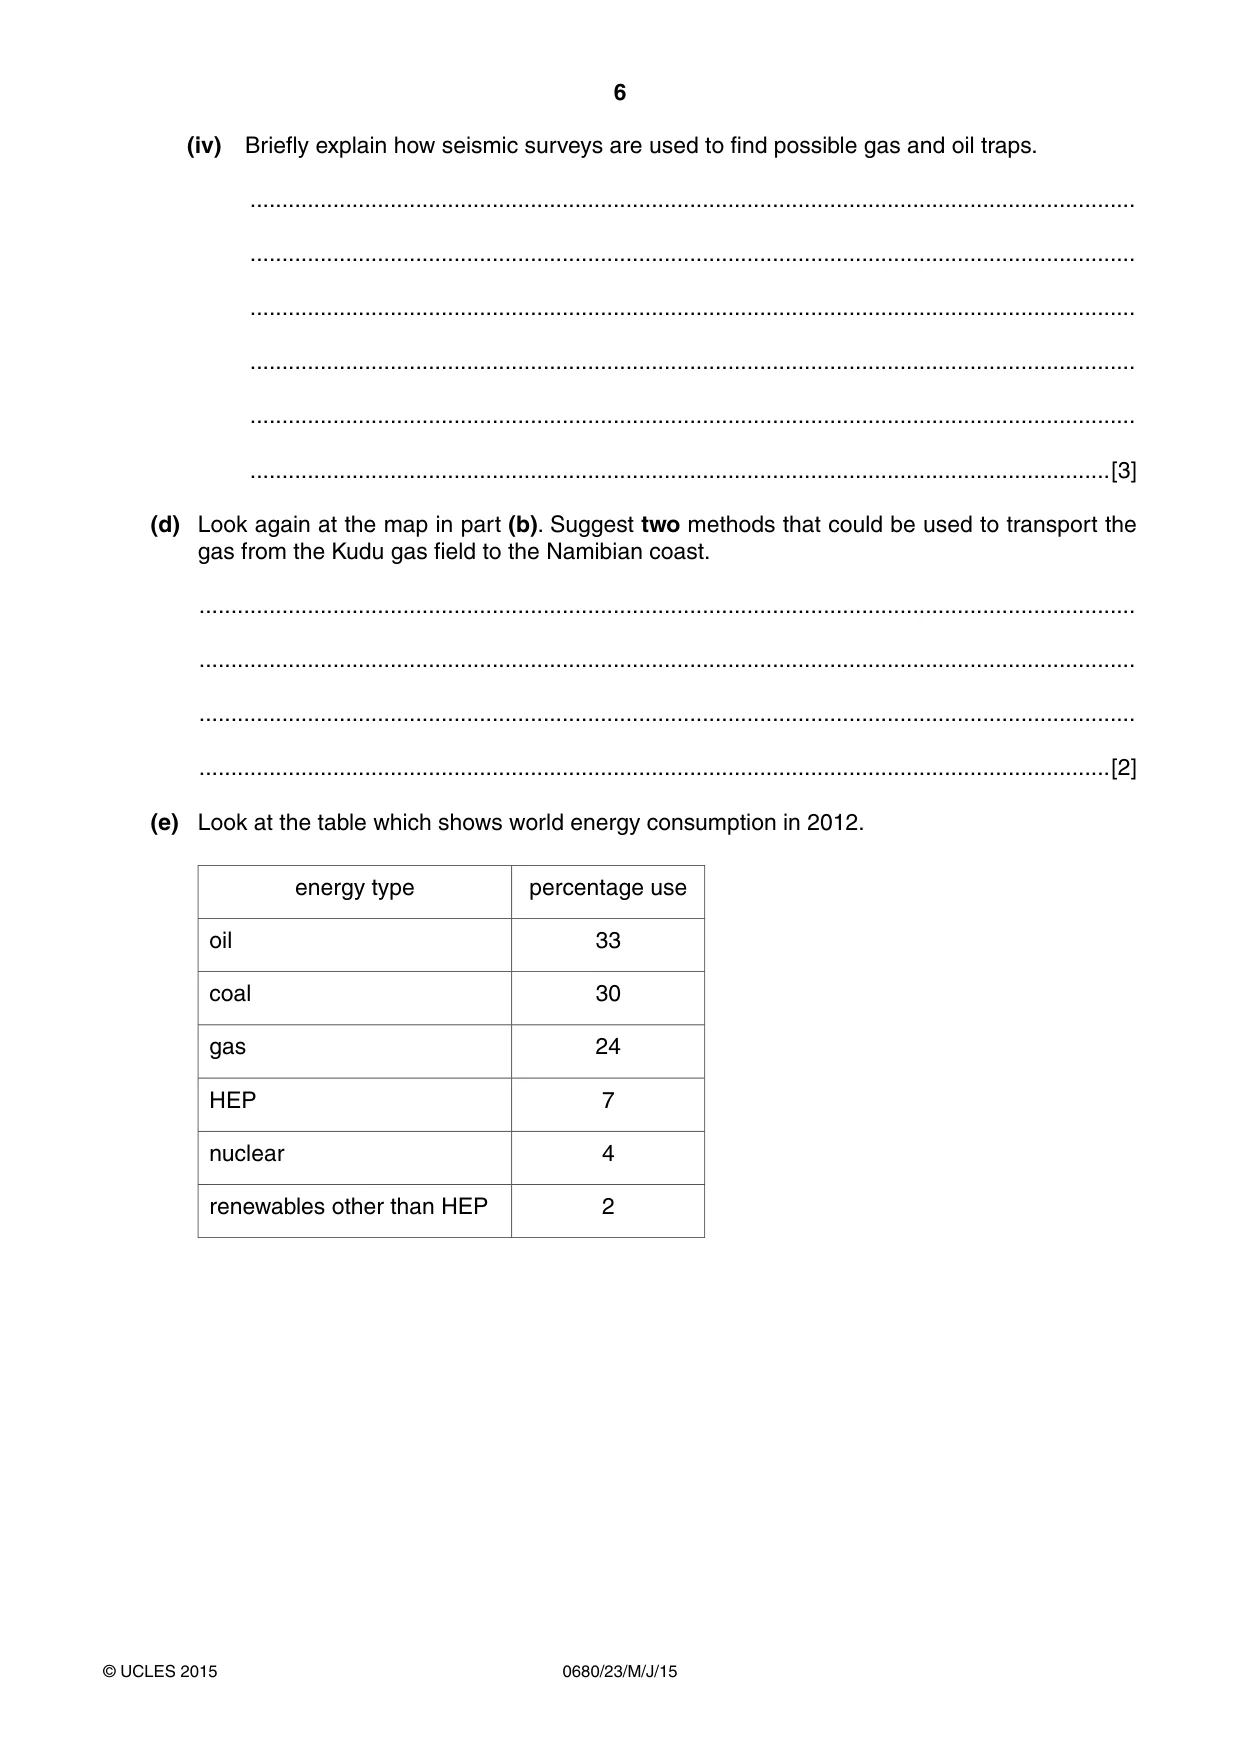
6 0680/23/M/J/15 © UCLES 2015 (iv) Briefly explain how seismic surveys are used to find possible gas and oil traps. … … … … … …[3] (d) Look again at the map in part (b). Suggest two methods that could be used to transport the gas from the Kudu gas field to the Namibian coast. … … … …[2] (e) Look at the table which shows world energy consumption in 2012. energy type percentage use oil 33 coal 30 gas 24 HEP 7 nuclear 4 renewables other than HEP 2
Question paper, page 7
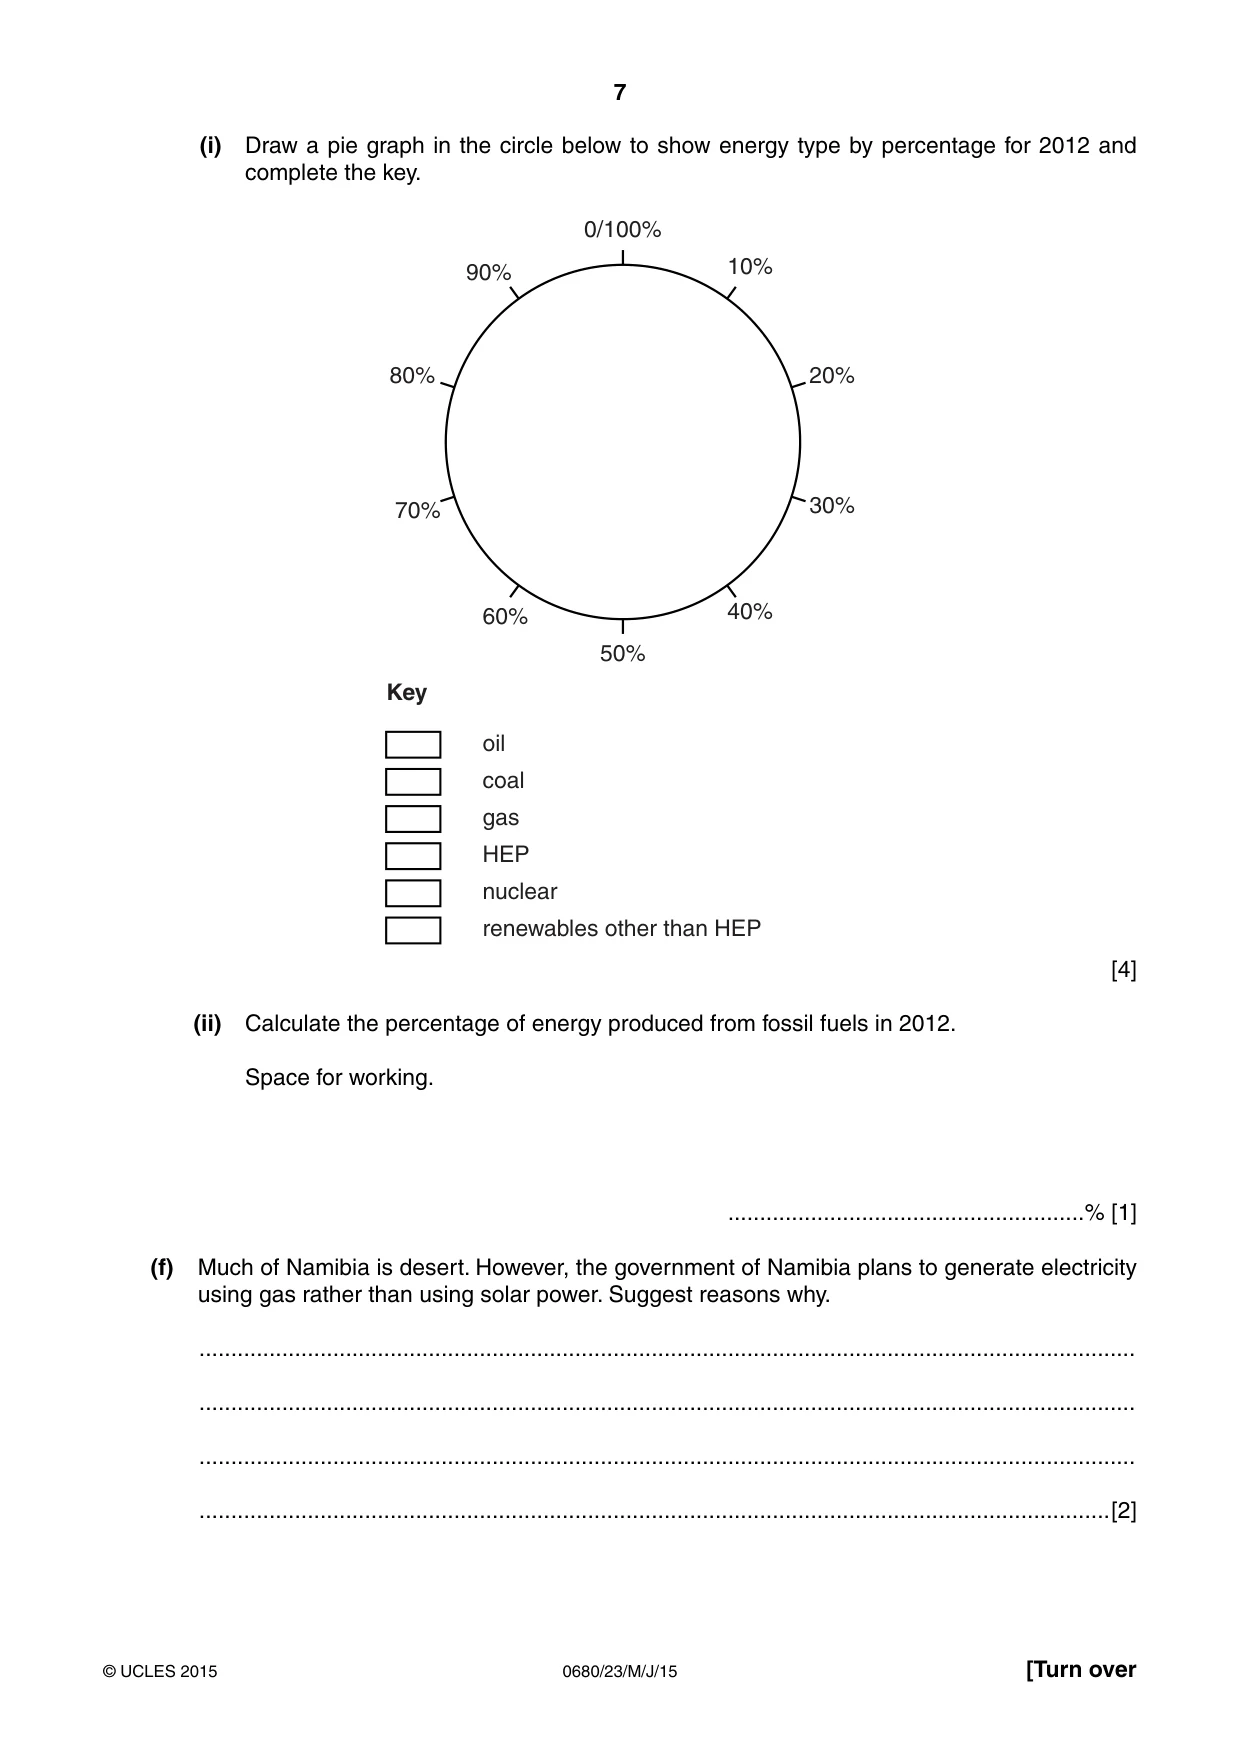
7 0680/23/M/J/15 © UCLES 2015 [Turn over (i) Draw a pie graph in the circle below to show energy type by percentage for 2012 and complete the key. 0/100% 10% 20% 30% 40% 50% 60% 70% 80% 90% Key oil coal gas HEP nuclear renewables other than HEP [4] (ii) Calculate the percentage of energy produced from fossil fuels in 2012. Space for working. …% [1] (f) Much of Namibia is desert. However, the government of Namibia plans to generate electricity using gas rather than using solar power. Suggest reasons why. … … … …[2]
Question paper, page 8
8 0680/23/M/J/15 © UCLES 2015 (g) ‘Biomass, biogas and fuel from organic waste should be used more to solve the world’s energy problems.’ How far do you agree with this statement? Give reasons for your answer. … … … … … … … … … … … …[6]
Question paper, page 9
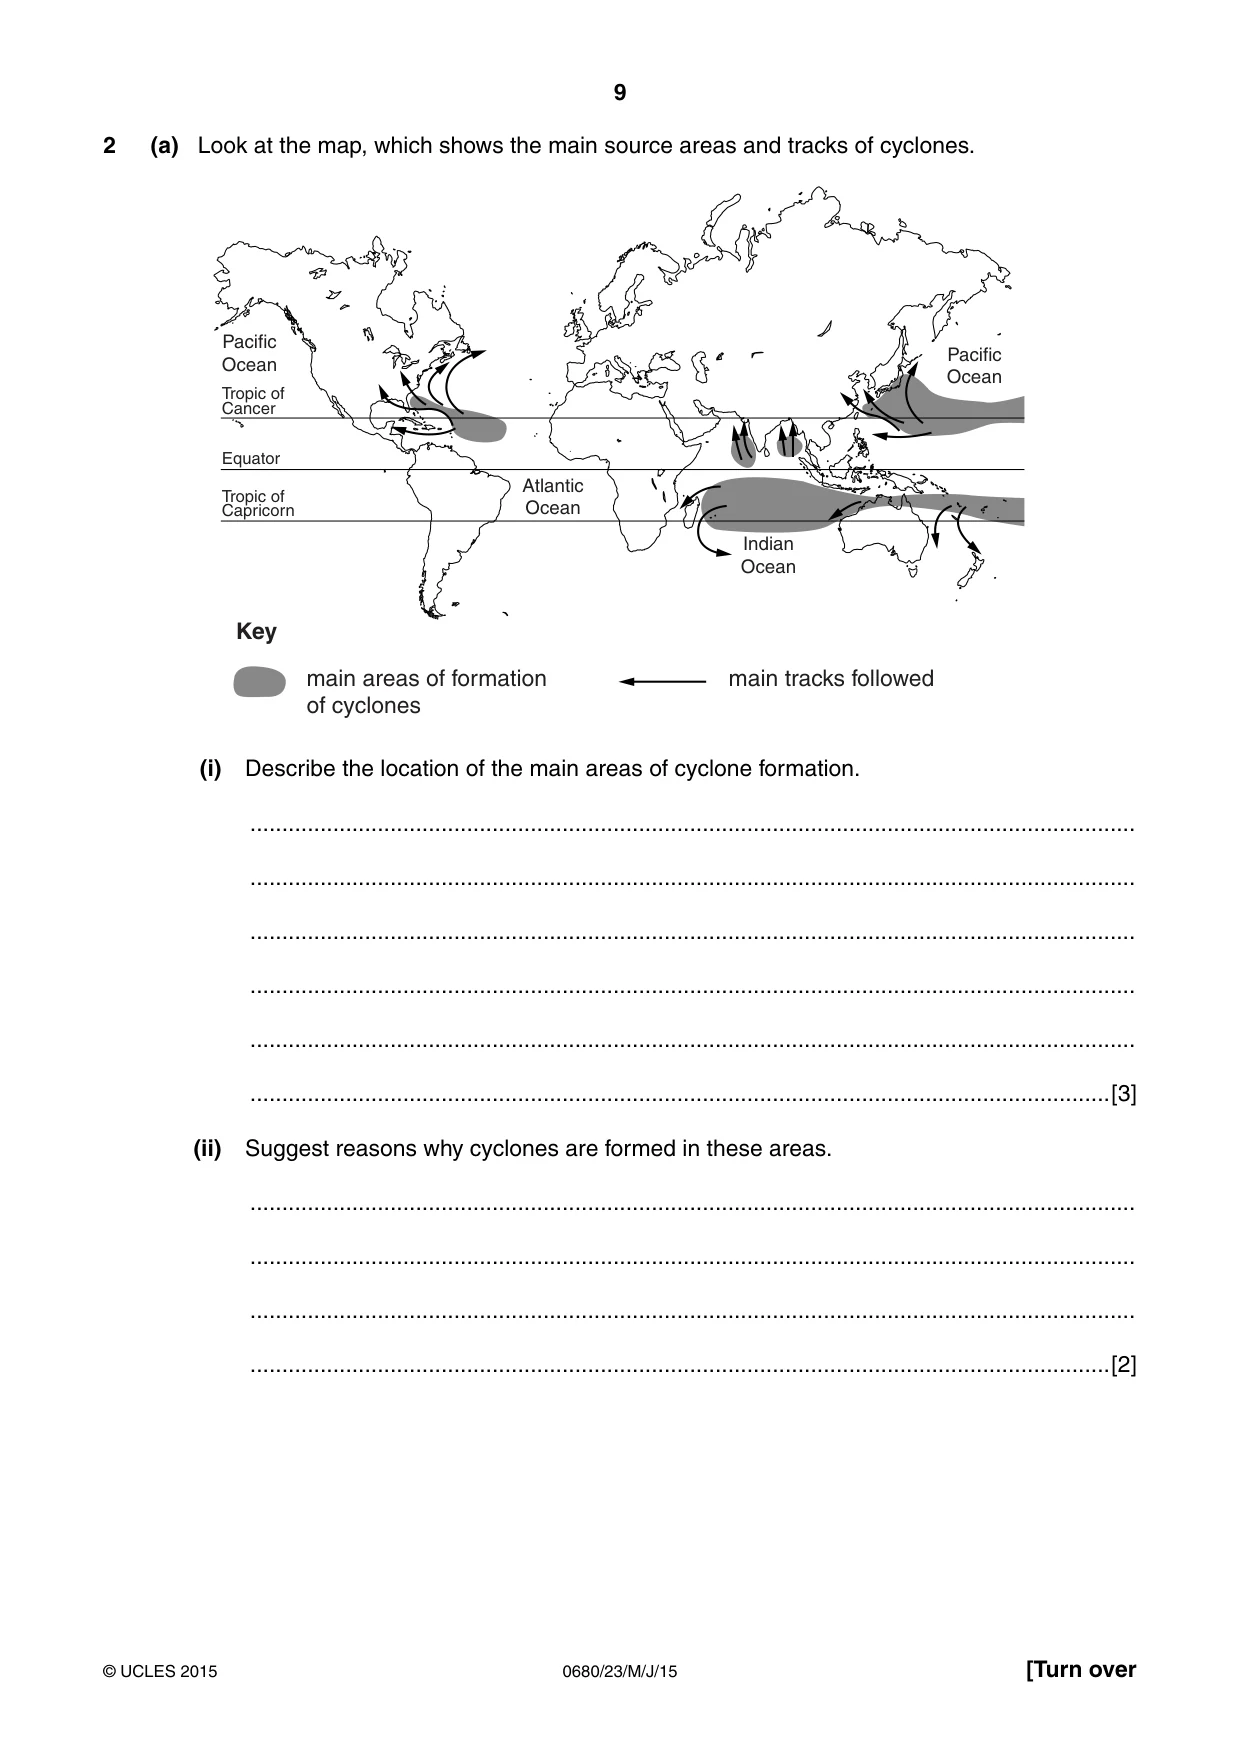
9 0680/23/M/J/15 © UCLES 2015 [Turn over 2 (a) Look at the map, which shows the main source areas and tracks of cyclones. Pacific Ocean Indian Ocean Atlantic Ocean Pacific Ocean Tropic of Cancer Tropic of Capricorn Equator main areas of formation of cyclones main tracks followed Key (i) Describe the location of the main areas of cyclone formation. … … … … … …[3] (ii) Suggest reasons why cyclones are formed in these areas. … … … …[2]
Question paper, page 10
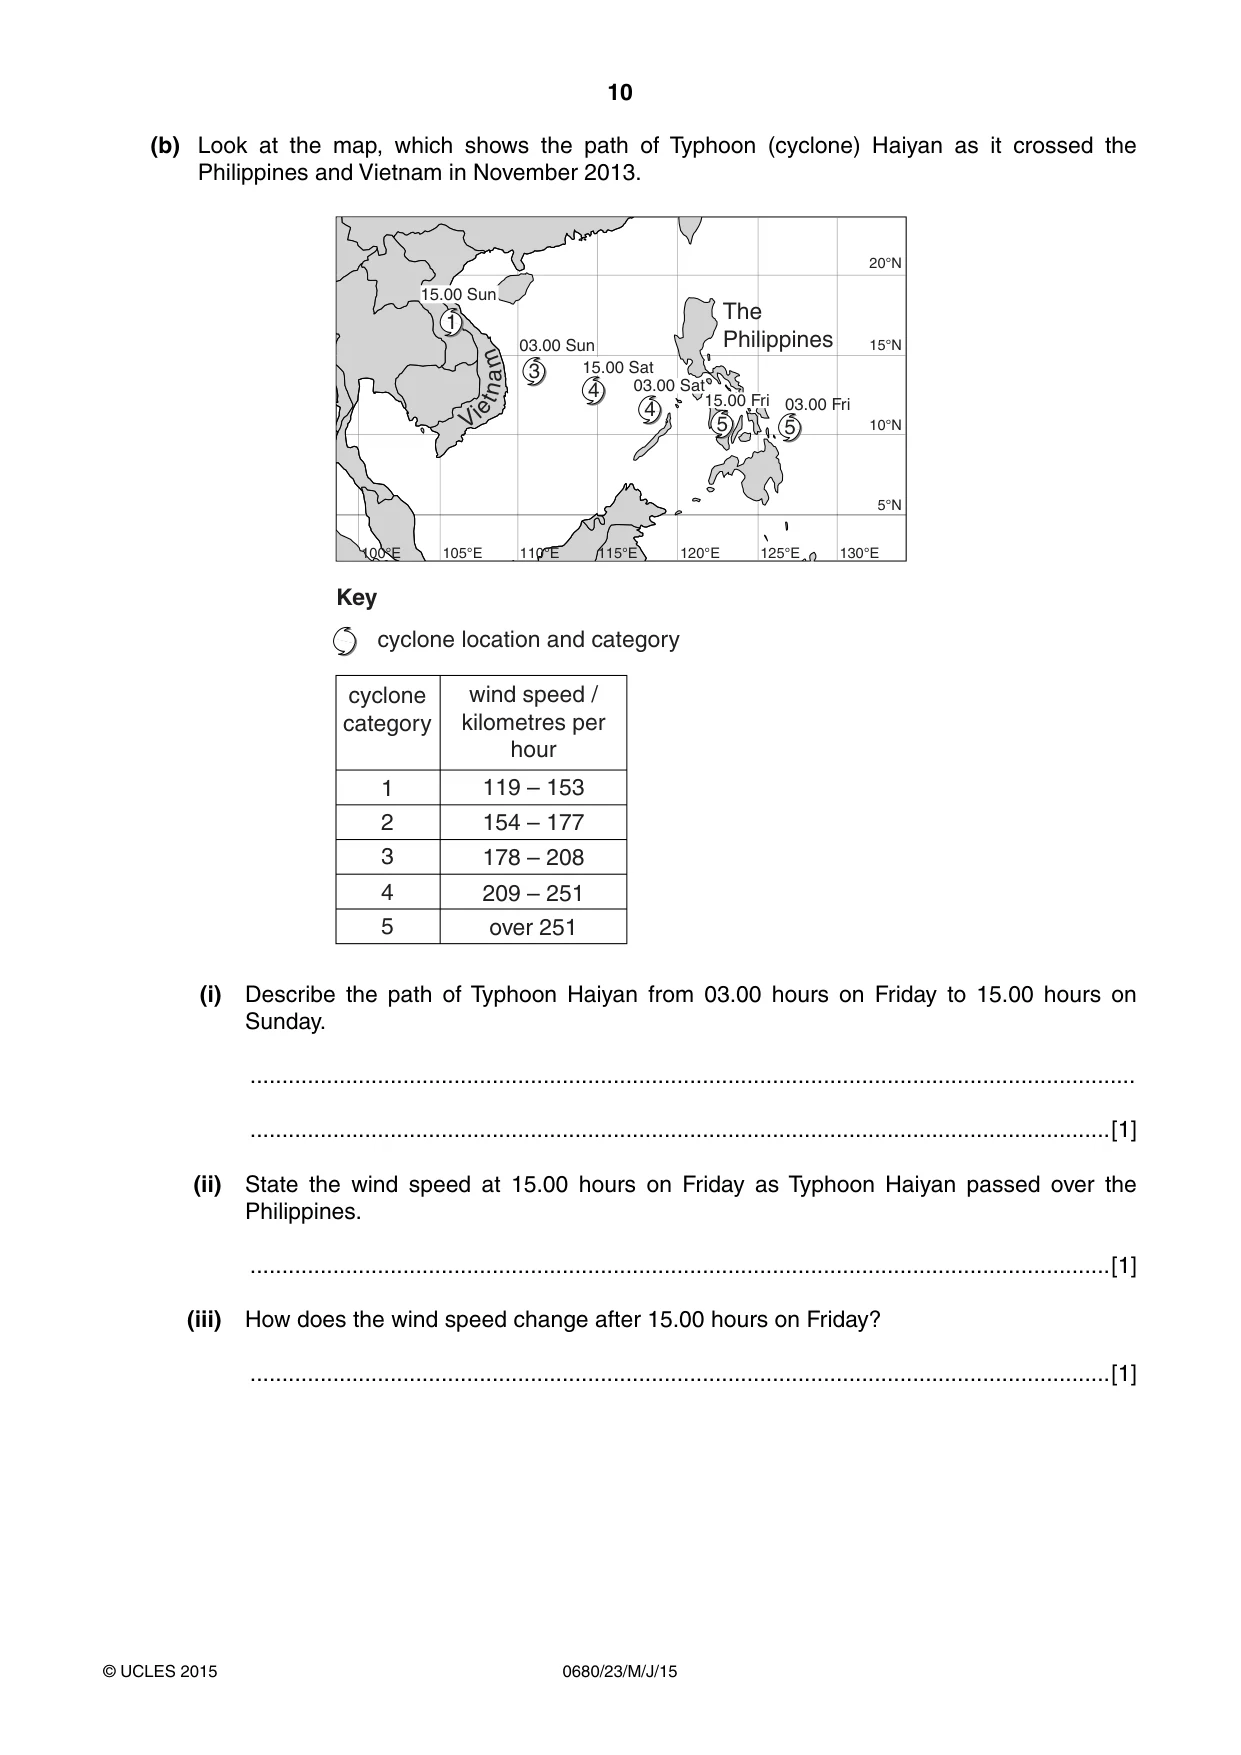
10 0680/23/M/J/15 © UCLES 2015 (b) Look at the map, which shows the path of Typhoon (cyclone) Haiyan as it crossed the Philippines and Vietnam in November 2013. 20°N 15°N 10°N 5°N 130°E 125°E 120°E 115°E 110°E 105°E 100°E The Philippines V i e t n a m 5 5 4 3 1 4 03.00 Fri 15.00 Fri 03.00 Sat 15.00 Sat 03.00 Sun 15.00 Sun Key cyclone location and category cyclone category wind speed / kilometres per hour 1 2 3 4 5 119 – 153 154 – 177 178 – 208 209 – 251 over 251 (i) Describe the path of Typhoon Haiyan from 03.00 hours on Friday to 15.00 hours on Sunday. … …[1] (ii) State the wind speed at 15.00 hours on Friday as Typhoon Haiyan passed over the Philippines. …[1] (iii) How does the wind speed change after 15.00 hours on Friday? …[1]
Question paper, page 11
11 0680/23/M/J/15 © UCLES 2015 [Turn over (iv) Describe the impacts of a cyclone on human communities. … … … … … … … …[4] (v) Suggest how the impacts of cyclones can be reduced. … … … … … … … …[4]
Question paper, page 12
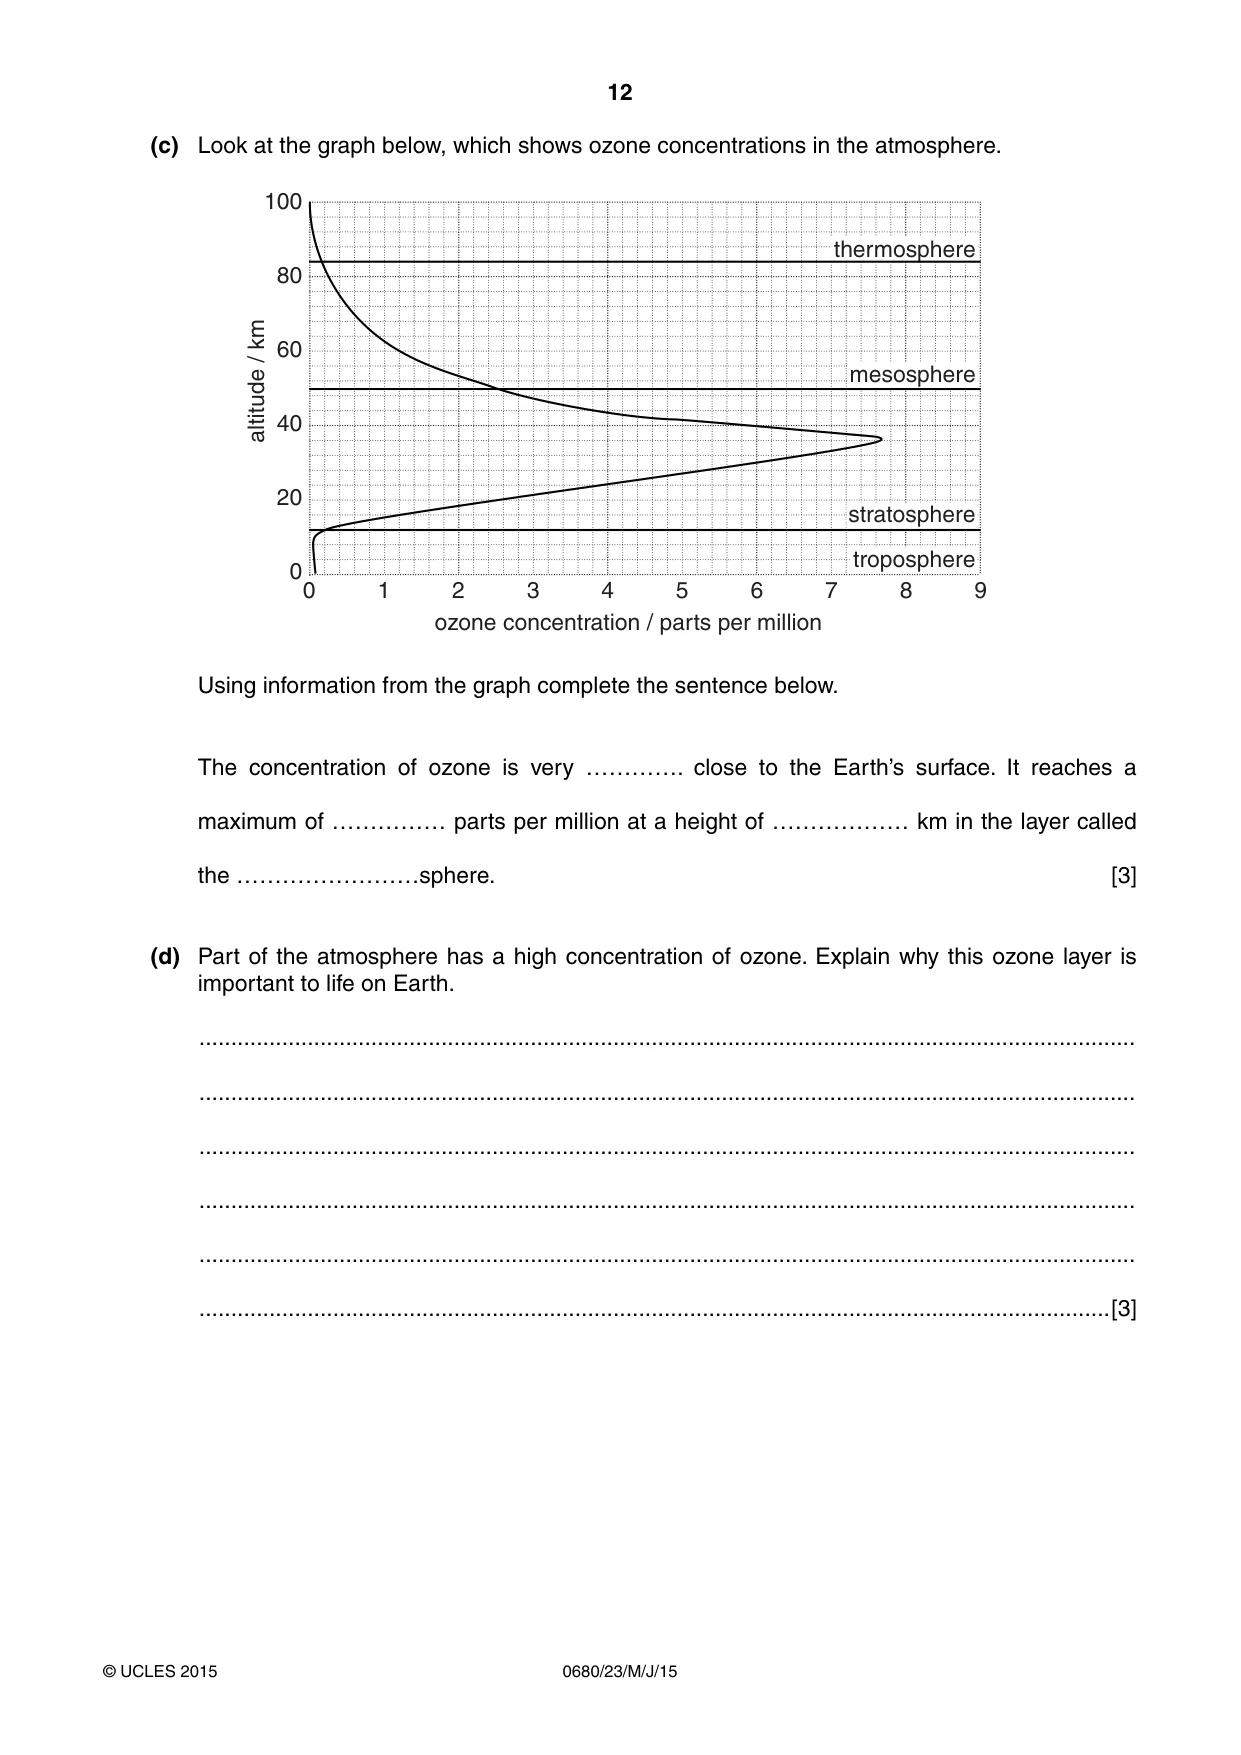
12 0680/23/M/J/15 © UCLES 2015 (c) Look at the graph below, which shows ozone concentrations in the atmosphere. 100 80 60 40 20 0 0 1 2 3 4 5 6 7 8 9 thermosphere mesosphere stratosphere troposphere altitude / km ozone concentration / parts per million Using information from the graph complete the sentence below. The concentration of ozone is very …………. close to the Earth’s surface. It reaches a maximum of …………… parts per million at a height of ……………… km in the layer called the ……………………sphere. [3] (d) Part of the atmosphere has a high concentration of ozone. Explain why this ozone layer is important to life on Earth. … … … … … …[3]
Question paper, page 13
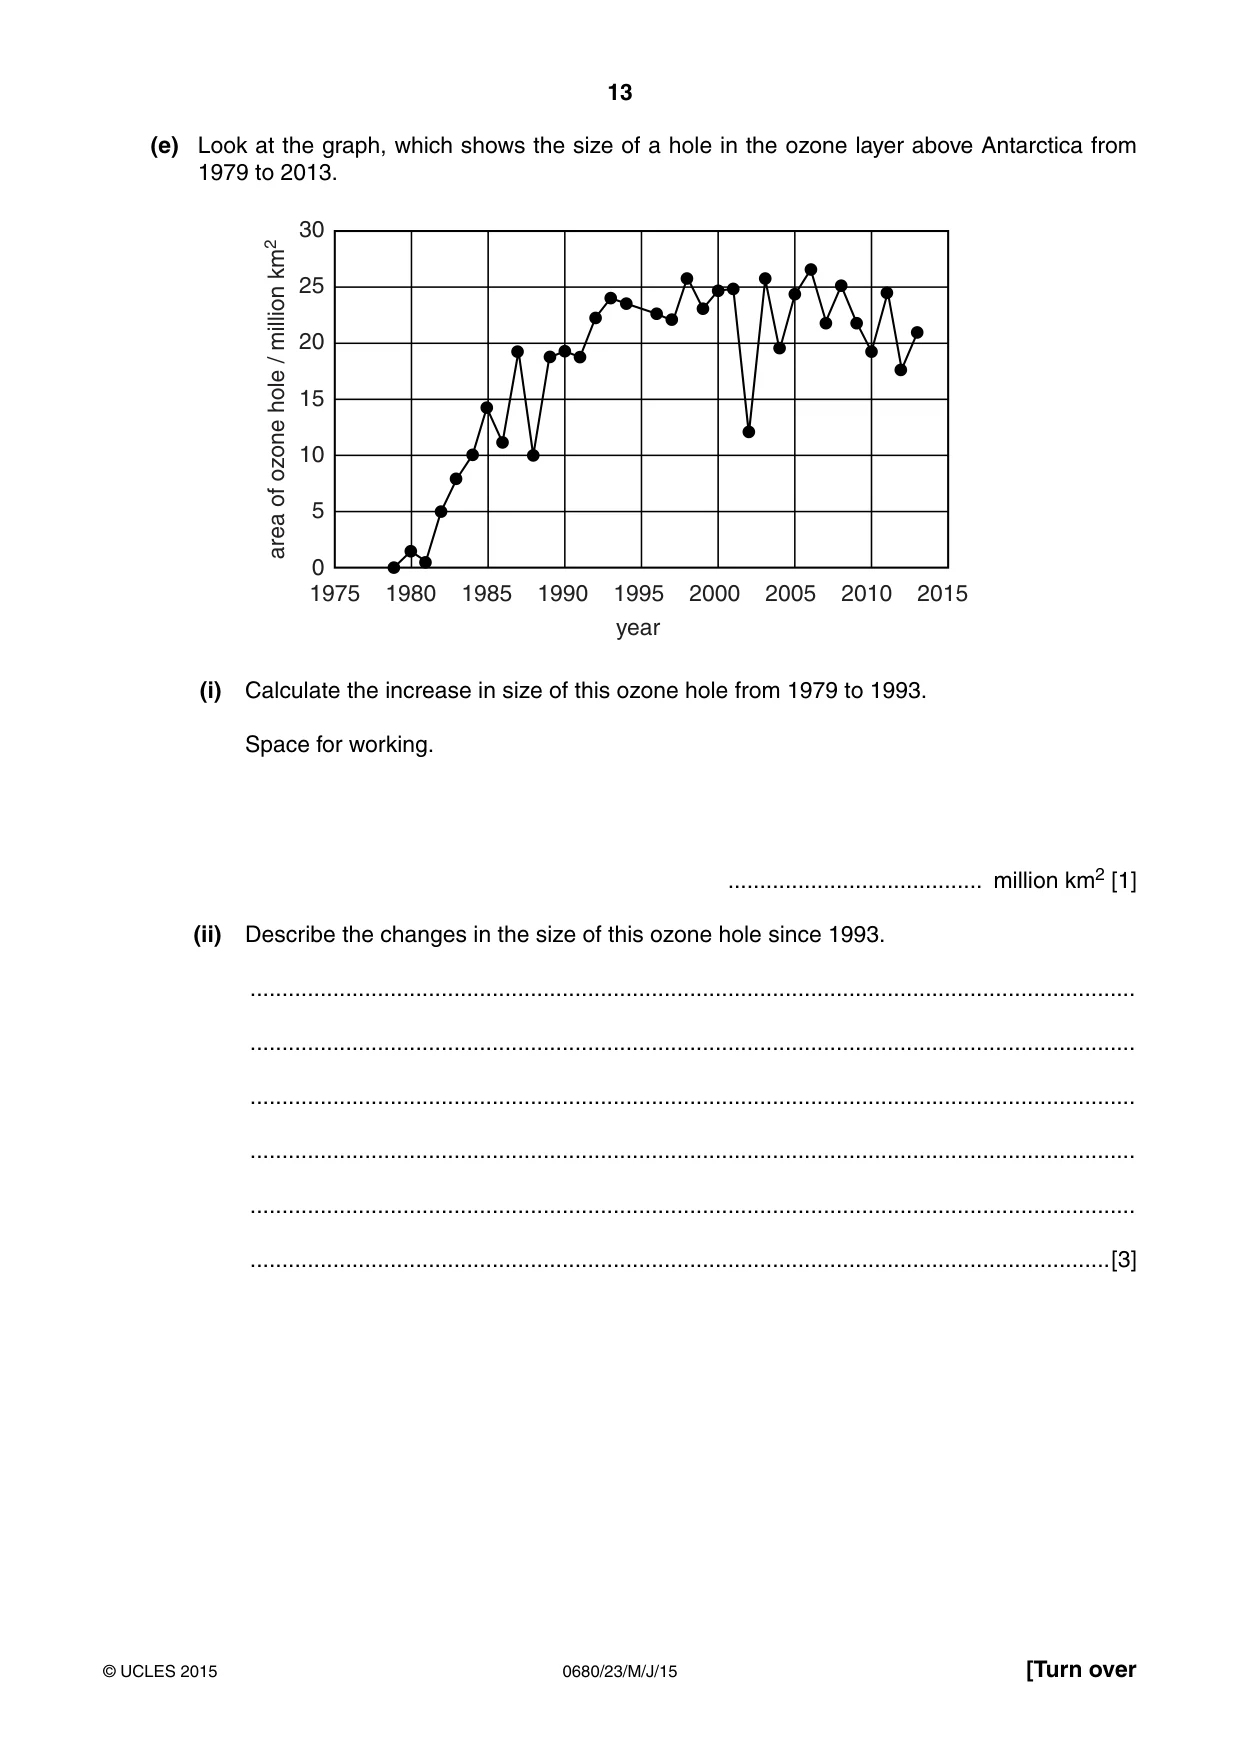
13 0680/23/M/J/15 © UCLES 2015 [Turn over (e) Look at the graph, which shows the size of a hole in the ozone layer above Antarctica from 1979 to 2013. 30 25 20 15 10 5 0 1975 1980 1985 1990 1995 2000 2005 2010 2015 year area of ozone hole / million km2 (i) Calculate the increase in size of this ozone hole from 1979 to 1993. Space for working. … million km2 [1] (ii) Describe the changes in the size of this ozone hole since 1993. … … … … … …[3]
Question paper, page 14
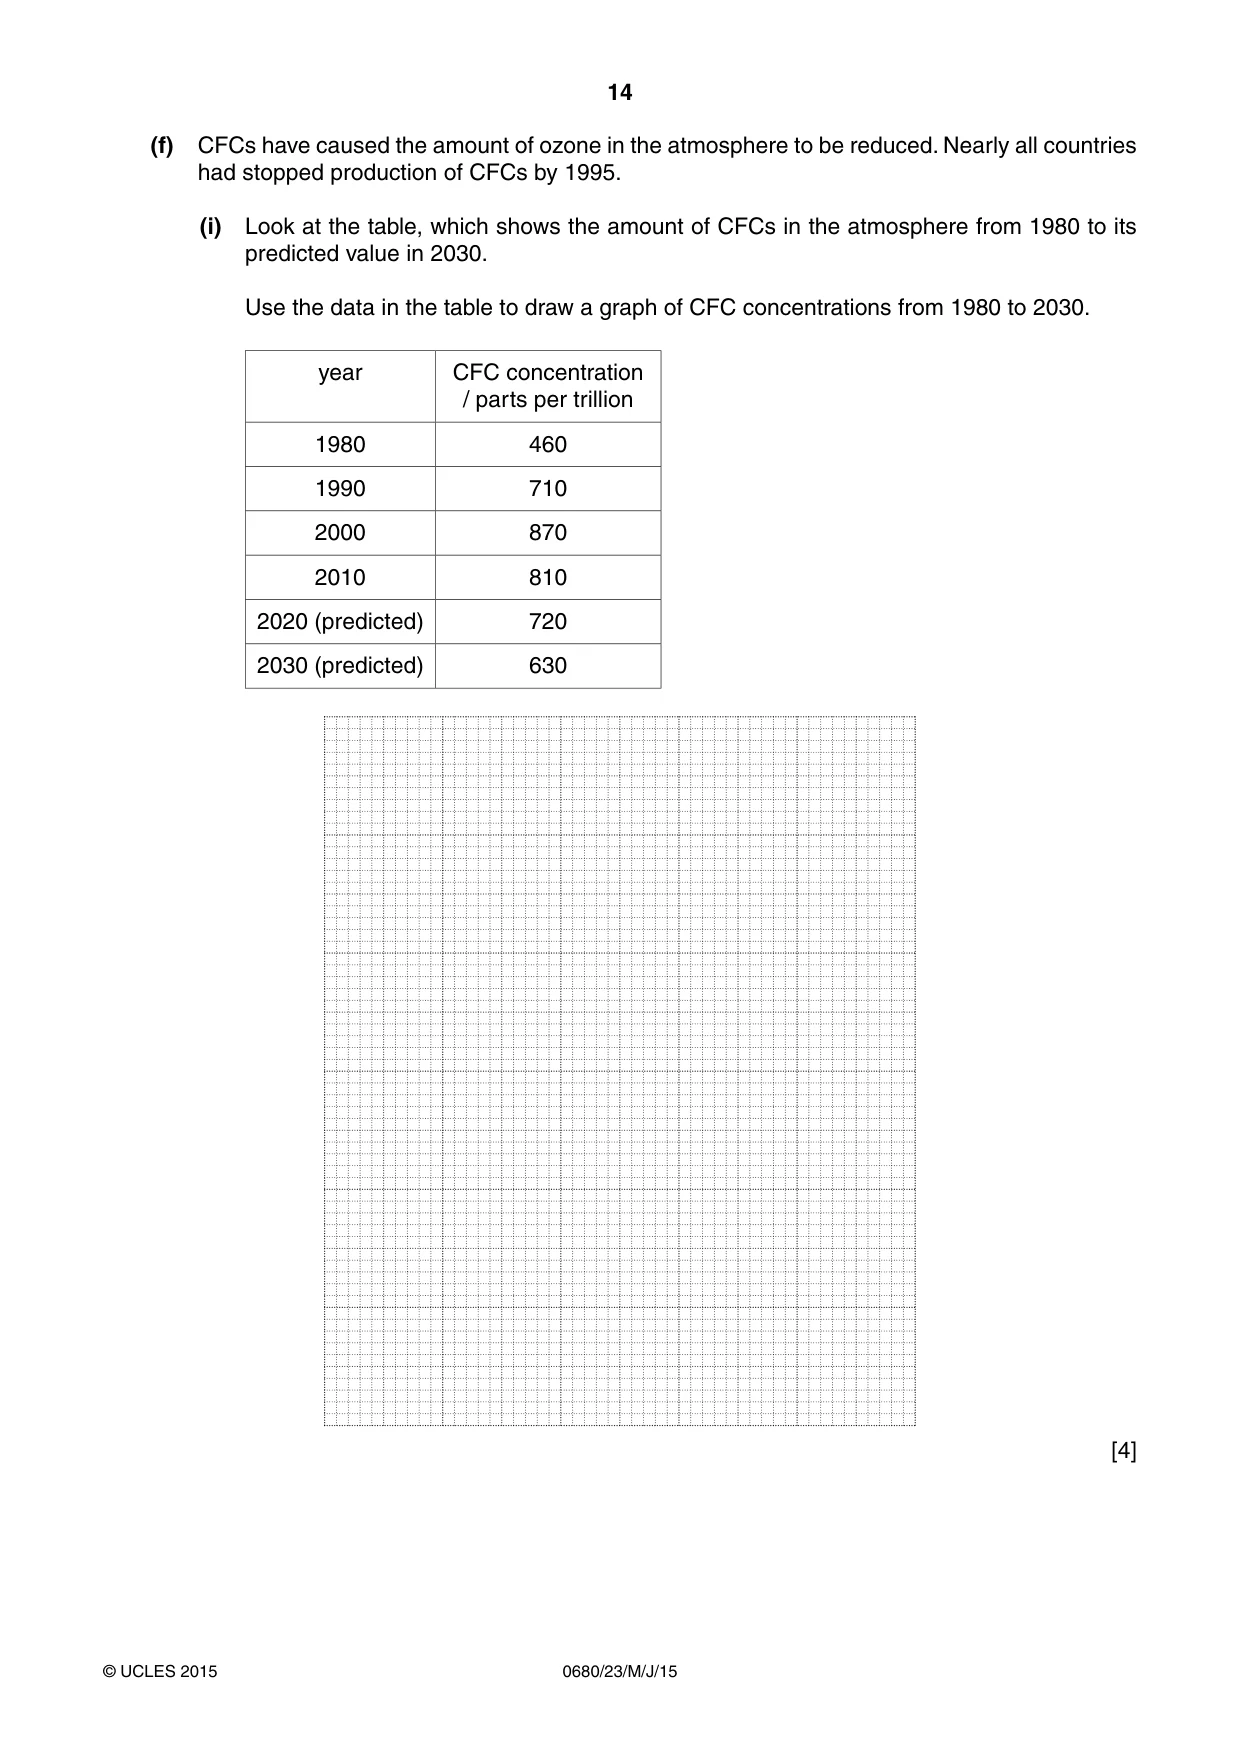
14 0680/23/M/J/15 © UCLES 2015 (f) CFCs have caused the amount of ozone in the atmosphere to be reduced. Nearly all countries had stopped production of CFCs by 1995. (i) Look at the table, which shows the amount of CFCs in the atmosphere from 1980 to its predicted value in 2030. Use the data in the table to draw a graph of CFC concentrations from 1980 to 2030. year CFC concentration / parts per trillion 1980 460 1990 710 2000 870 2010 810 2020 (predicted) 720 2030 (predicted) 630 [4]
Question paper, page 15
15 0680/23/M/J/15 © UCLES 2015 (ii) Suggest why CFCs are still present in the atmosphere. … … … … … …[3] (iii) State one environmental problem that CFCs cause, other than damaging the ozone layer. … …[1] (g) ‘Atmospheric pollution will always be a major problem.’ How far do you agree with this statement? Give reasons for your answer. … … … … … … … … … … … …[6]
Question paper, page 16
16 0680/23/M/J/15 © UCLES 2015 Permission to reproduce items where third-party owned material protected by copyright is included has been sought and cleared where possible. Every reasonable effort has been made by the publisher (UCLES) to trace copyright holders, but if any items requiring clearance have unwittingly been included, the publisher will be pleased to make amends at the earliest possible opportunity. To avoid the issue of disclosure of answer-related information to candidates, all copyright acknowledgements are reproduced online in the Cambridge International Examinations Copyright Acknowledgements Booklet. This is produced for each series of examinations and is freely available to download at www.cie.org.uk after the live examination series. Cambridge International Examinations is part of the Cambridge Assessment Group. Cambridge Assessment is the brand name of University of Cambridge Local Examinations Syndicate (UCLES), which is itself a department of the University of Cambridge. BLANK PAGE
Mark scheme, page 1
® IGCSE is the registered trademark of Cambridge International Examinations. CAMBRIDGE INTERNATIONAL EXAMINATIONS Cambridge International General Certificate of Secondary Education MARK SCHEME for the May/June 2015 series 0680 ENVIRONMENTAL MANAGEMENT 0680/23 Paper 2, maximum raw mark 80 This mark scheme is published as an aid to teachers and candidates, to indicate the requirements of the examination. It shows the basis on which Examiners were instructed to award marks. It does not indicate the details of the discussions that took place at an Examiners’ meeting before marking began, which would have considered the acceptability of alternative answers. Mark schemes should be read in conjunction with the question paper and the Principal Examiner Report for Teachers. Cambridge will not enter into discussions about these mark schemes. Cambridge is publishing the mark schemes for the May/June 2015 series for most Cambridge IGCSE®, Cambridge International A and AS Level components and some Cambridge O Level components.
Mark scheme, page 2
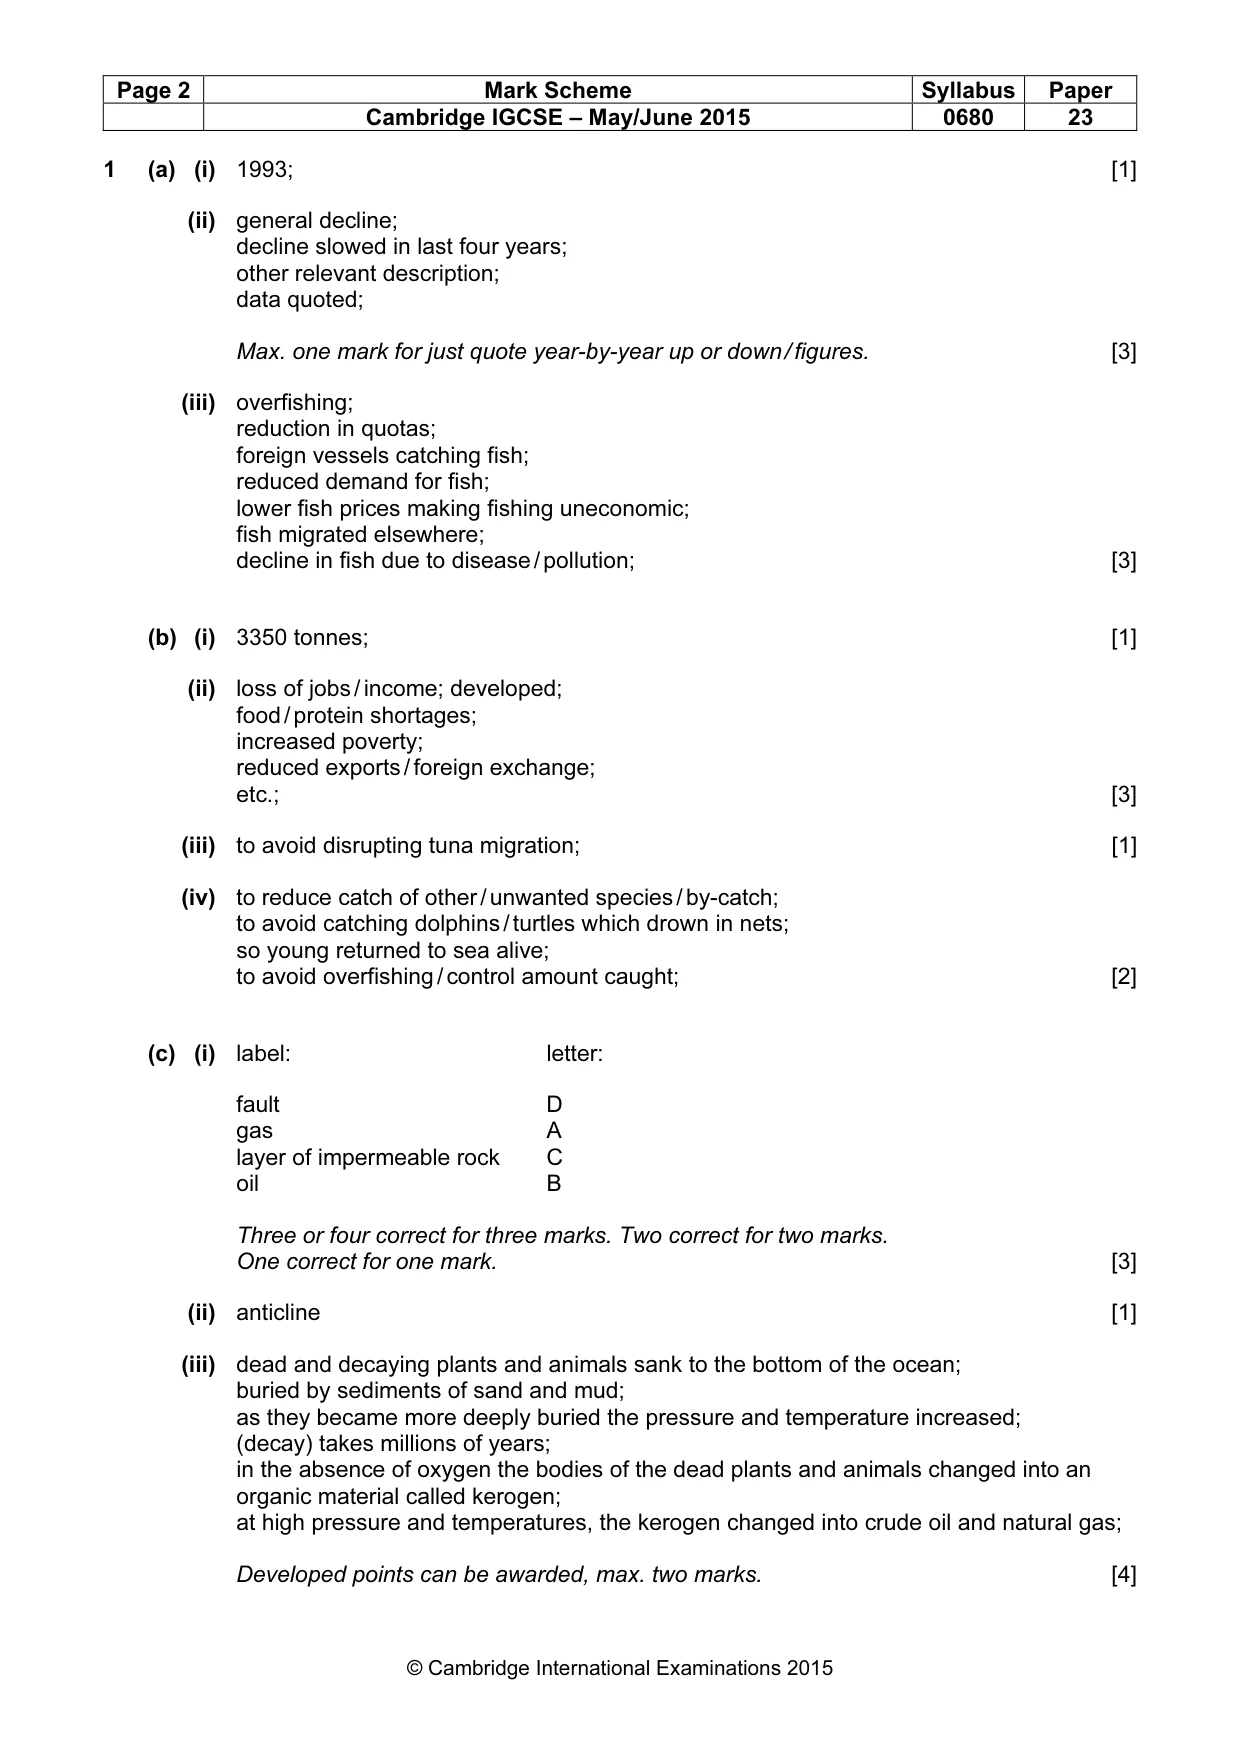
Page 2 Mark Scheme Syllabus Paper Cambridge IGCSE – May/June 2015 0680 23 © Cambridge International Examinations 2015 1 (a) (i) 1993; [1] (ii) general decline; decline slowed in last four years; other relevant description; data quoted; Max. one mark for just quote year-by-year up or down / figures. [3] (iii) overfishing; reduction in quotas; foreign vessels catching fish; reduced demand for fish; lower fish prices making fishing uneconomic; fish migrated elsewhere; decline in fish due to disease / pollution; [3] (b) (i) 3350 tonnes; [1] (ii) loss of jobs / income; developed; food / protein shortages; increased poverty; reduced exports / foreign exchange; etc.; [3] (iii) to avoid disrupting tuna migration; [1] (iv) to reduce catch of other / unwanted species / by-catch; to avoid catching dolphins / turtles which drown in nets; so young returned to sea alive; to avoid overfishing / control amount caught; [2] (c) (i) label: letter: fault D gas A layer of impermeable rock C oil B Three or four correct for three marks. Two correct for two marks. One correct for one mark. [3] (ii) anticline [1] (iii) dead and decaying plants and animals sank to the bottom of the ocean; buried by sediments of sand and mud; as they became more deeply buried the pressure and temperature increased; (decay) takes millions of years; in the absence of oxygen the bodies of the dead plants and animals changed into an organic material called kerogen; at high pressure and temperatures, the kerogen changed into crude oil and natural gas; Developed points can be awarded, max. two marks. [4]
Mark scheme, page 3
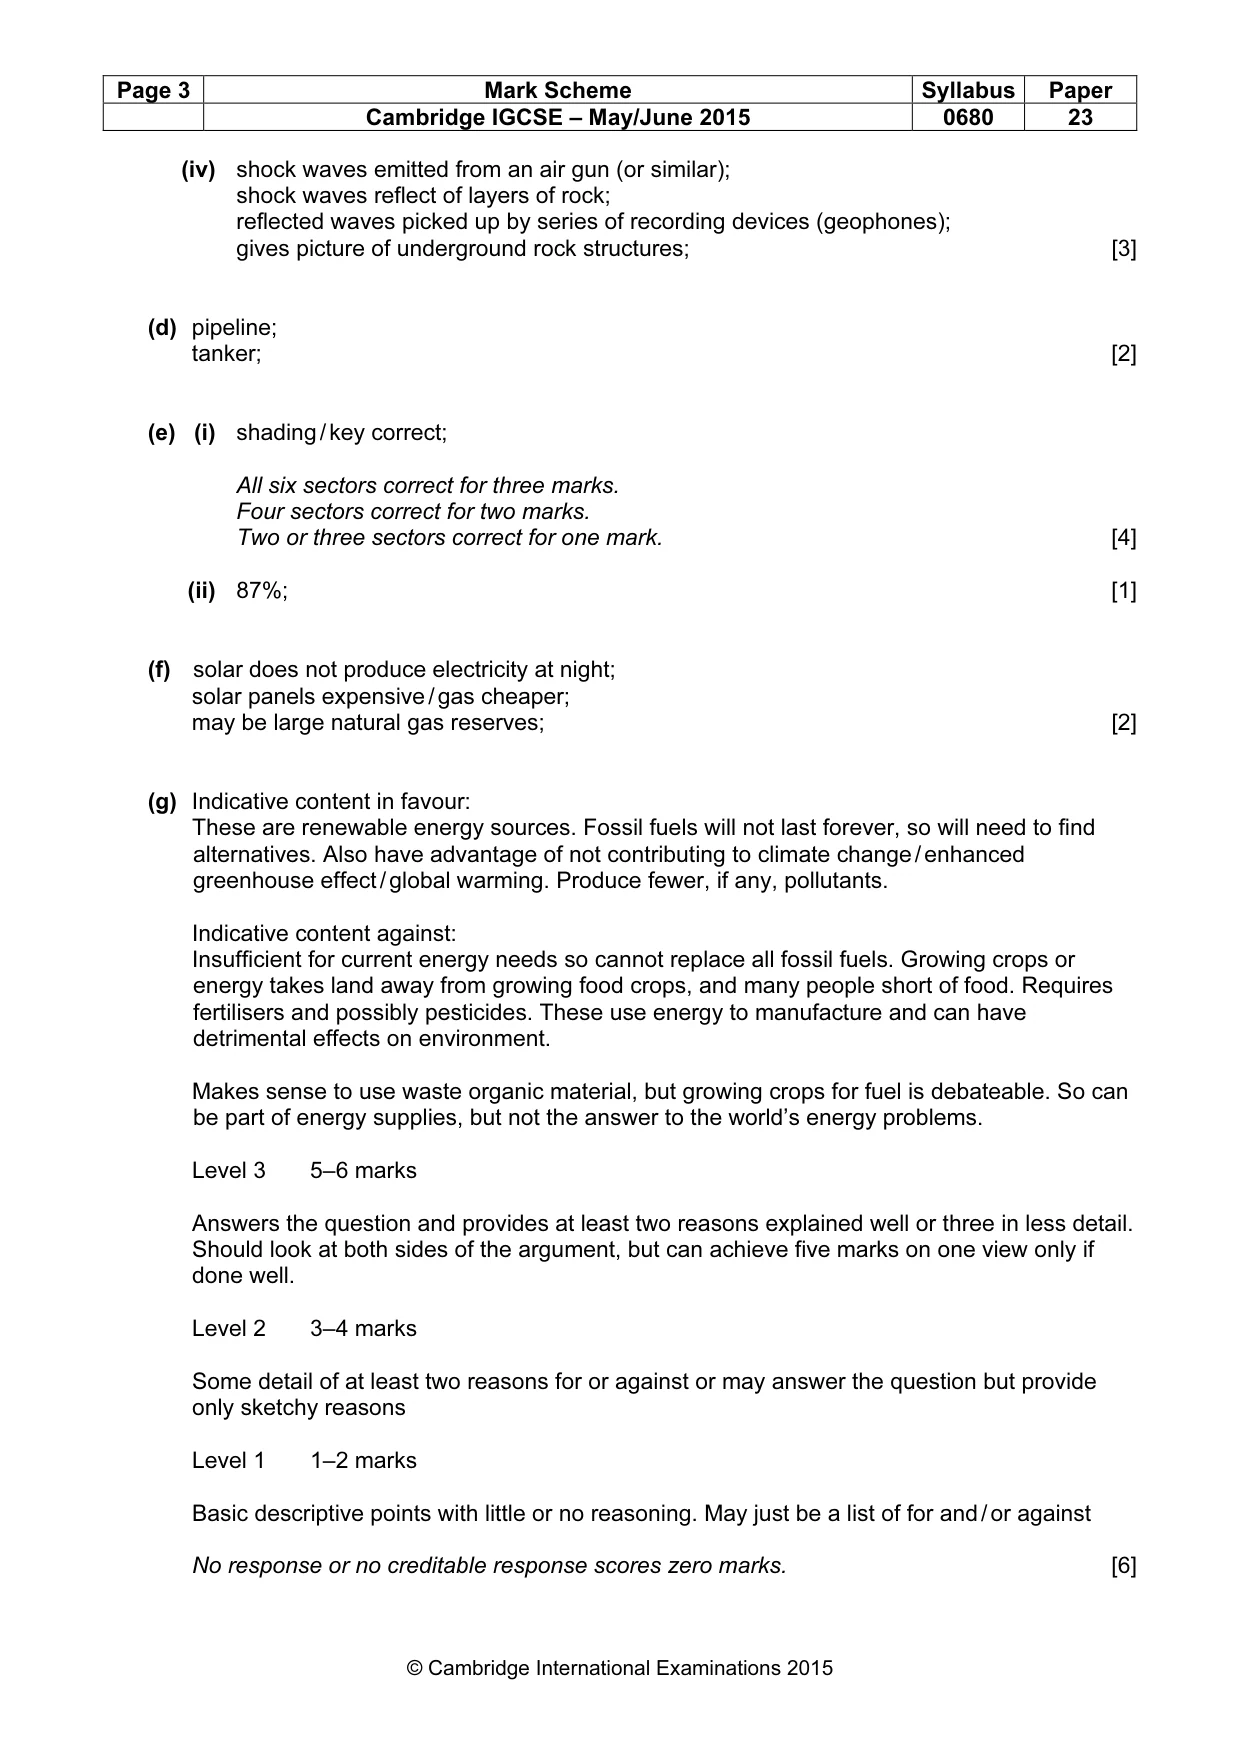
Page 3 Mark Scheme Syllabus Paper Cambridge IGCSE – May/June 2015 0680 23 © Cambridge International Examinations 2015 (iv) shock waves emitted from an air gun (or similar); shock waves reflect of layers of rock; reflected waves picked up by series of recording devices (geophones); gives picture of underground rock structures; [3] (d) pipeline; tanker; [2] (e) (i) shading / key correct; All six sectors correct for three marks. Four sectors correct for two marks. Two or three sectors correct for one mark. [4] (ii) 87%; [1] (f) solar does not produce electricity at night; solar panels expensive / gas cheaper; may be large natural gas reserves; [2] (g) Indicative content in favour: These are renewable energy sources. Fossil fuels will not last forever, so will need to find alternatives. Also have advantage of not contributing to climate change / enhanced greenhouse effect / global warming. Produce fewer, if any, pollutants. Indicative content against: Insufficient for current energy needs so cannot replace all fossil fuels. Growing crops or energy takes land away from growing food crops, and many people short of food. Requires fertilisers and possibly pesticides. These use energy to manufacture and can have detrimental effects on environment. Makes sense to use waste organic material, but growing crops for fuel is debateable. So can be part of energy supplies, but not the answer to the world’s energy problems. Level 3 5–6 marks Answers the question and provides at least two reasons explained well or three in less detail. Should look at both sides of the argument, but can achieve five marks on one view only if done well. Level 2 3–4 marks Some detail of at least two reasons for or against or may answer the question but provide only sketchy reasons Level 1 1–2 marks Basic descriptive points with little or no reasoning. May just be a list of for and / or against No response or no creditable response scores zero marks. [6]
Mark scheme, page 4
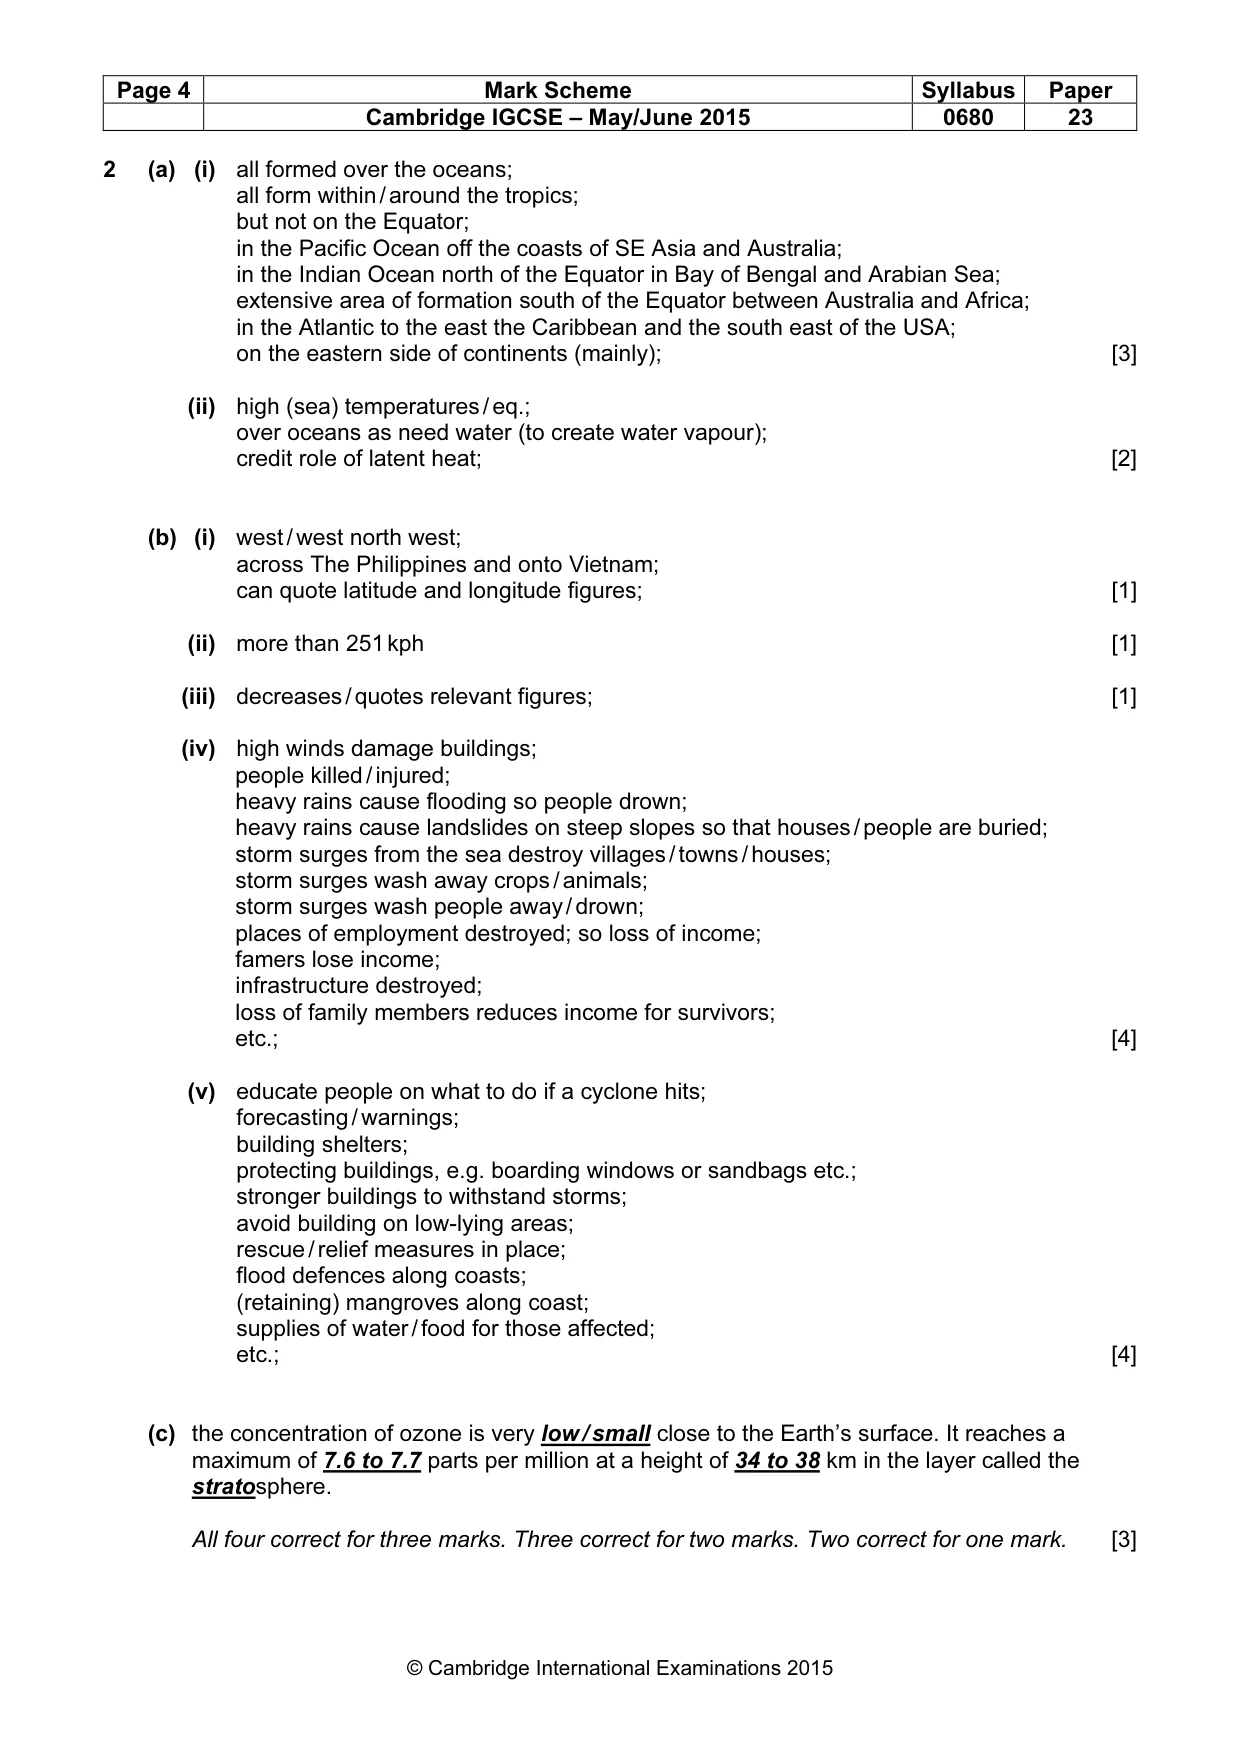
Page 4 Mark Scheme Syllabus Paper Cambridge IGCSE – May/June 2015 0680 23 © Cambridge International Examinations 2015 2 (a) (i) all formed over the oceans; all form within / around the tropics; but not on the Equator; in the Pacific Ocean off the coasts of SE Asia and Australia; in the Indian Ocean north of the Equator in Bay of Bengal and Arabian Sea; extensive area of formation south of the Equator between Australia and Africa; in the Atlantic to the east the Caribbean and the south east of the USA; on the eastern side of continents (mainly); [3] (ii) high (sea) temperatures / eq.; over oceans as need water (to create water vapour); credit role of latent heat; [2] (b) (i) west / west north west; across The Philippines and onto Vietnam; can quote latitude and longitude figures; [1] (ii) more than 251 kph [1] (iii) decreases / quotes relevant figures; [1] (iv) high winds damage buildings; people killed / injured; heavy rains cause flooding so people drown; heavy rains cause landslides on steep slopes so that houses / people are buried; storm surges from the sea destroy villages / towns / houses; storm surges wash away crops / animals; storm surges wash people away / drown; places of employment destroyed; so loss of income; famers lose income; infrastructure destroyed; loss of family members reduces income for survivors; etc.; [4] (v) educate people on what to do if a cyclone hits; forecasting / warnings; building shelters; protecting buildings, e.g. boarding windows or sandbags etc.; stronger buildings to withstand storms; avoid building on low-lying areas; rescue / relief measures in place; flood defences along coasts; (retaining) mangroves along coast; supplies of water / food for those affected; etc.; [4] (c) the concentration of ozone is very low / small close to the Earth’s surface. It reaches a maximum of 7.6 to 7.7 parts per million at a height of 34 to 38 km in the layer called the stratosphere. All four correct for three marks. Three correct for two marks. Two correct for one mark. [3]
Mark scheme, page 5
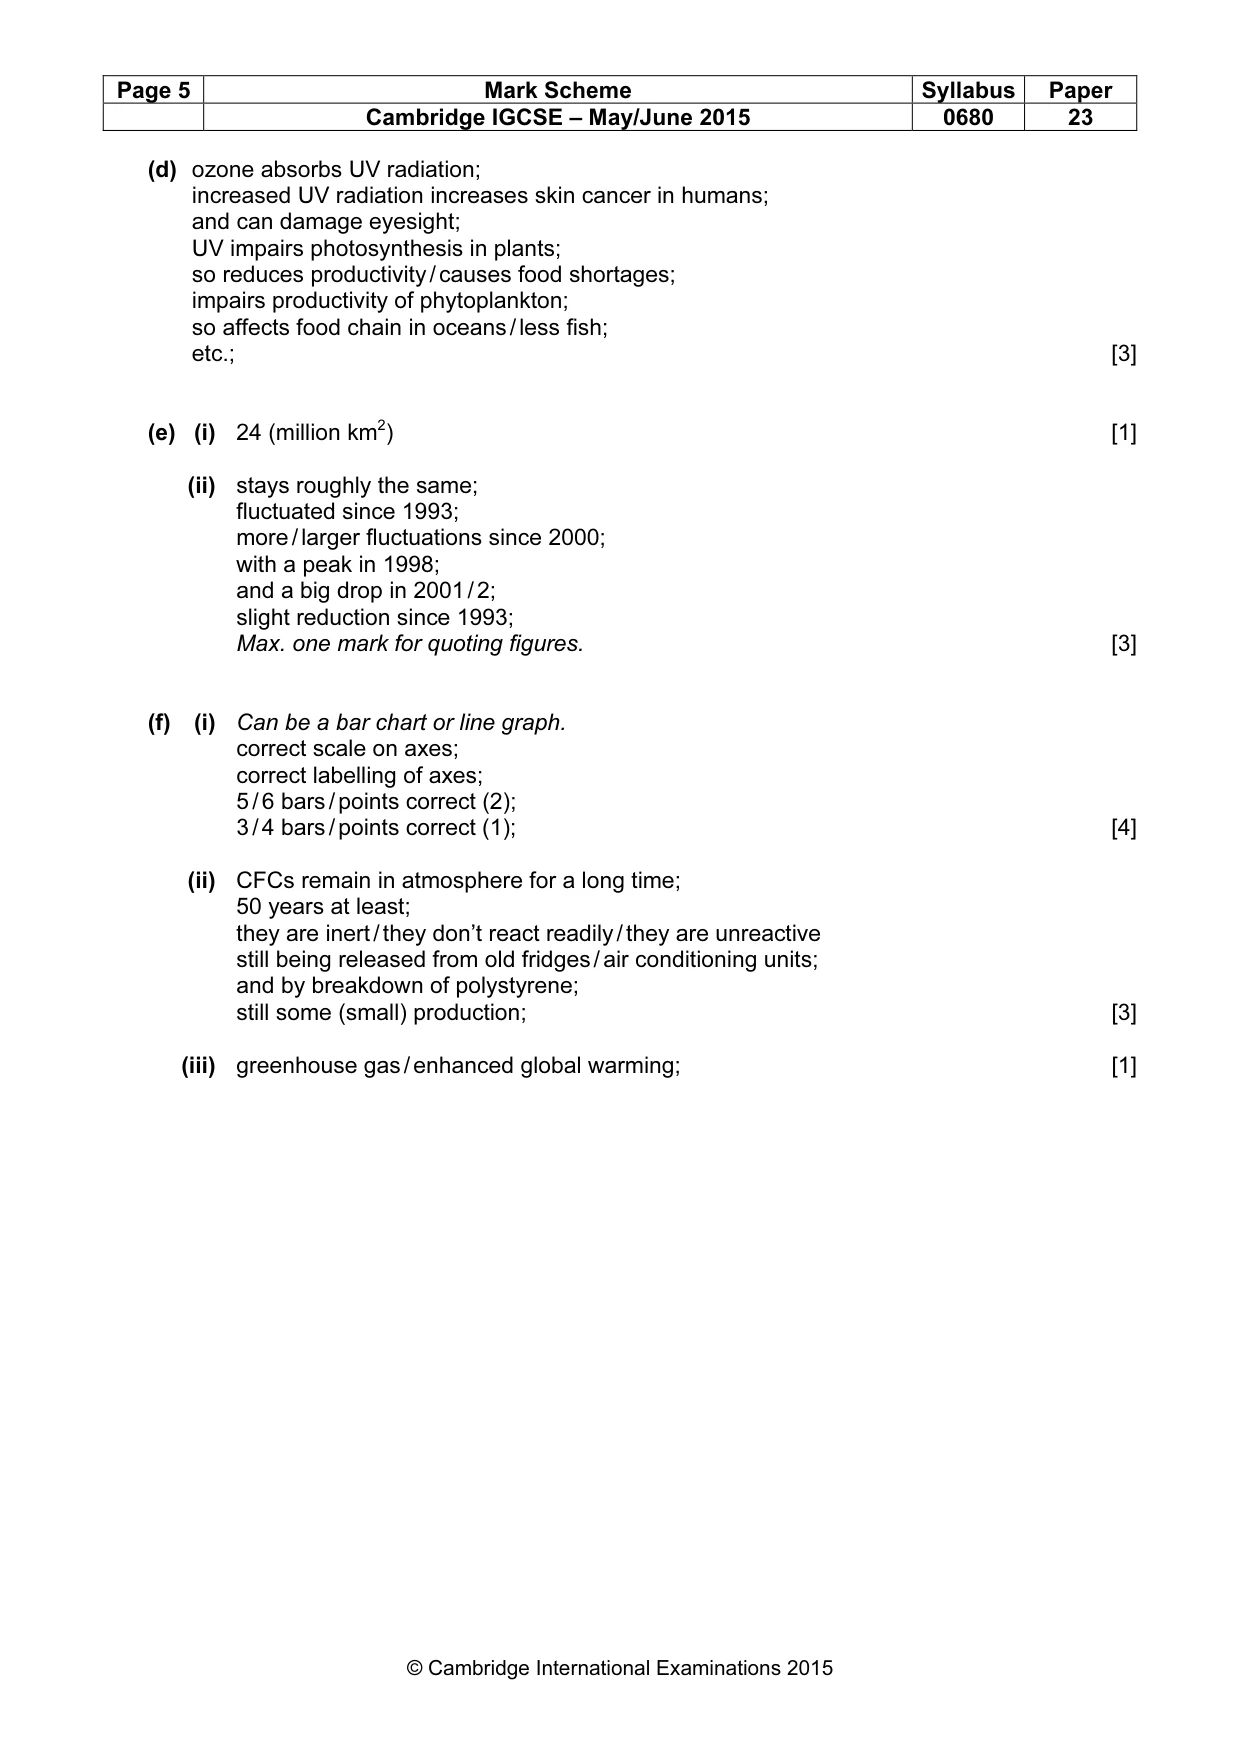
Page 5 Mark Scheme Syllabus Paper Cambridge IGCSE – May/June 2015 0680 23 © Cambridge International Examinations 2015 (d) ozone absorbs UV radiation; increased UV radiation increases skin cancer in humans; and can damage eyesight; UV impairs photosynthesis in plants; so reduces productivity / causes food shortages; impairs productivity of phytoplankton; so affects food chain in oceans / less fish; etc.; [3] (e) (i) 24 (million km2) [1] (ii) stays roughly the same; fluctuated since 1993; more / larger fluctuations since 2000; with a peak in 1998; and a big drop in 2001 / 2; slight reduction since 1993; Max. one mark for quoting figures. [3] (f) (i) Can be a bar chart or line graph. correct scale on axes; correct labelling of axes; 5 / 6 bars / points correct (2); 3 / 4 bars / points correct (1); [4] (ii) CFCs remain in atmosphere for a long time; 50 years at least; they are inert / they don’t react readily / they are unreactive still being released from old fridges / air conditioning units; and by breakdown of polystyrene; still some (small) production; [3] (iii) greenhouse gas / enhanced global warming; [1]
Mark scheme, page 6
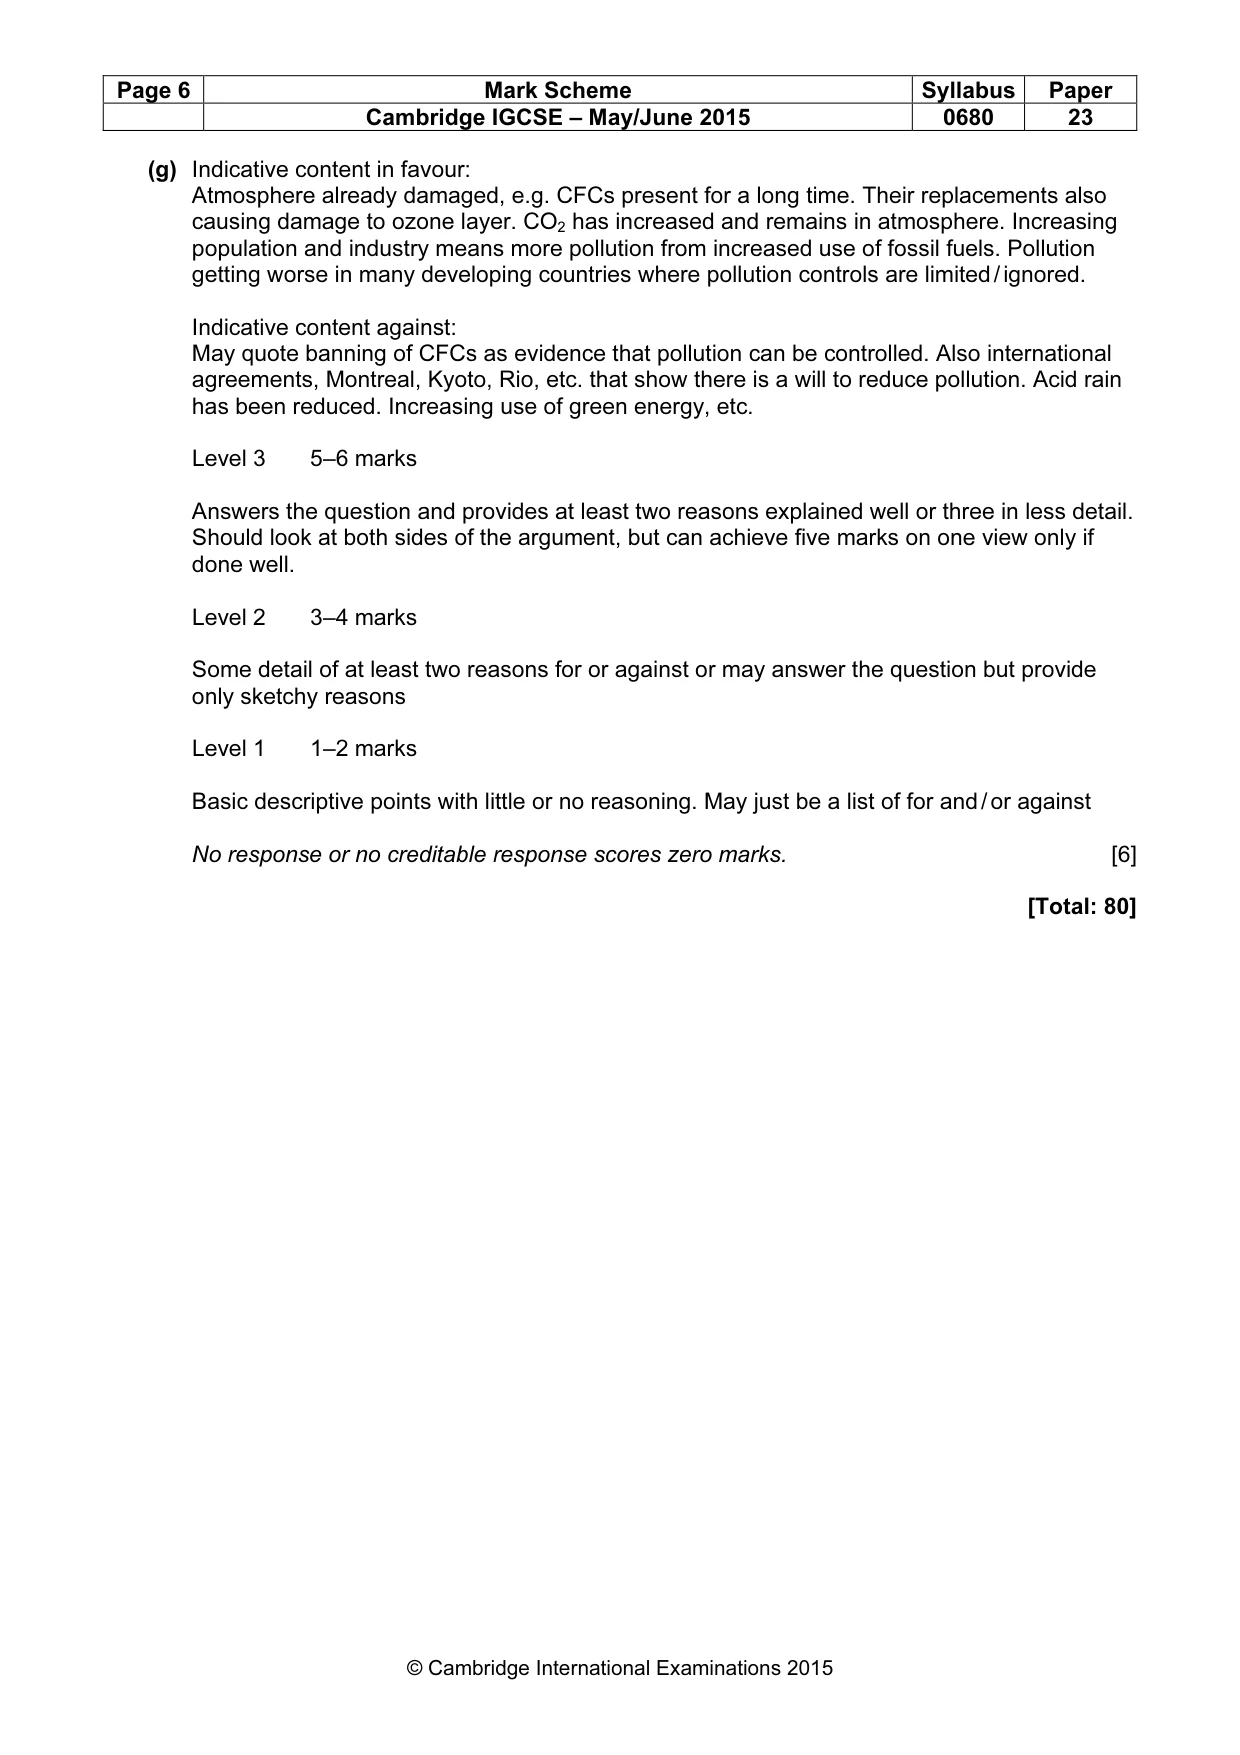
Page 6 Mark Scheme Syllabus Paper Cambridge IGCSE – May/June 2015 0680 23 © Cambridge International Examinations 2015 (g) Indicative content in favour: Atmosphere already damaged, e.g. CFCs present for a long time. Their replacements also causing damage to ozone layer. CO2 has increased and remains in atmosphere. Increasing population and industry means more pollution from increased use of fossil fuels. Pollution getting worse in many developing countries where pollution controls are limited / ignored. Indicative content against: May quote banning of CFCs as evidence that pollution can be controlled. Also international agreements, Montreal, Kyoto, Rio, etc. that show there is a will to reduce pollution. Acid rain has been reduced. Increasing use of green energy, etc. Level 3 5–6 marks Answers the question and provides at least two reasons explained well or three in less detail. Should look at both sides of the argument, but can achieve five marks on one view only if done well. Level 2 3–4 marks Some detail of at least two reasons for or against or may answer the question but provide only sketchy reasons Level 1 1–2 marks Basic descriptive points with little or no reasoning. May just be a list of for and / or against No response or no creditable response scores zero marks. [6] [Total: 80]
What you needed in this session
Cambridge’s own grade thresholds for 2015 May/June, Paper 2 · Variant 3. A higher threshold means an easier paper — the bar moves with how the cohort did.